20
Pumped Hydro Storage in Australia GE Renewable Energy
Pumped Hydro Storage in Australia
GE Renewable Energy

The Energy Transition in Australia...................................................................................................................................................................................................................................4
The Benefits of Pumped Hydro in Australia..............................................................................................................................................................................................................5
Enabling the Energy Transition with High-Capacity, Long-Duration Storage...........................................................................................................................................5
Grid Reliability and Security Services...........................................................................................................................................................................................................................6
Lower Electricity Prices........................................................................................................................................................................................................................................................7
Jobs and Investment in Regional Areas......................................................................................................................................................................................................................7
Reduced Transmission Costs........................................................................................................................................................................................................................................... 8
Lower Environmental Impact...........................................................................................................................................................................................................................................9
A Highly Cost-Effective Solution......................................................................................................................................................................................................................................9
Challenges and Opportunities.........................................................................................................................................................................................................................................10
Positioning Australia as a Clean Energy Superpower........................................................................................................................................................................................10
Challenges to Overcome..................................................................................................................................................................................................................................................10
Successful Pumped Storage Models around the Globe..................................................................................................................................................................................12
Overview of Pumped Hydro Development Worldwide....................................................................................................................................................................................12
China: Managing Pumped Storage as a Grid Asset.............................................................................................................................................................................................12
Israel: Private Investment Thanks to 20-Year PPA for Availability...............................................................................................................................................................13
India: Firming Renewables Through Combined Auctions................................................................................................................................................................................13
Austria: the Alpine Battery of Europe........................................................................................................................................................................................................................14
Middle East and North Africa: Securing a Cleaner Energy Mix......................................................................................................................................................................15
GE’s Pumped Storage Experience and Expertise.................................................................................................................................................................................................16
References.....................................................................................................................................................................................................................................................................................19
3 of 20 Pumped Hydro Storage in Australia
Contents

The Energy Transition in Australia
4 of 20 Pumped Hydro Storage in Australia
Australia is at the early stages of a major transition in how we
generate and manage electricity. Some of the key findings in
AEMO’s 2020 Integrated System Plan (ISP) include:
• Almost two thirds of Australia’s coal-fired generation capacity is
expected to retire by 2040 (potentially much more, much sooner,
depending on the forecast scenario)
• The installed capacity of distributed generation (primarily
rooftop solar PV) is expected to double or even triple by 2040
• Between 26-50GW of new utility-scale renewable generation
capacity (primarily wind and solar PV) will need to be built by 2040
• Between 6-19GW of new dispatchable capacity will need to be
built by 2040 to manage the incremental wind and solar PV
• Billions of dollars of transmission investment will be needed
to enable the connection of the new generation and storage
capacity
While the ISP provides an actionable pathway for transmission
investment, targets and programs at state and federal level are
key drivers of investment in utility-scale generation and storage.
These are summarized below.
Region Renewable target Emissions target Key Supporting Programs
Australia – Federal Government
~23% by 2020 under RET scheme
26-28% reduction by 2030 Technology Investment Roadmap, Grid Reliability Fund
New South Wales +12GW of wind + solar and 2GW of long-duration storage by 2030
35% reduction by 2030Net zero by 2050
Electricity Infrastructure Roadmap, Emerging Energy Program
Victoria 25% by 202040% by 2025 50% by 2030
Net zero by 2050 VRET program, Renewable Energy Action Plan
Queensland 50% by 2030 30% reduction by 2030Net zero by 2050
Renewables 400, CleanCo
South Australia 75% by 2025100% by 2030
50% reduction by 2030 Net zero by 2050
Western Australia No formal target Net zero by 2050
Tasmania 100% by 2022150% by 2030 200% by 2040
Net zero by 2050 TRET program, Tasmanian Renewable Energy Action Plan
Northern Territory 50% by 2030 Net zero by 2050 Roadmap to Renewables
Australian Capital Territory 100% by 2020 40% reduction by 202050-60% by 202565-75% by 203090-95% by 2040Net zero by 2045

5 of 20 Pumped Hydro Storage in Australia
The Benefits of Pumped Hydro in Australia Australia already boasts a pumped hydro fleet of about 1.6GW
across the Wivenhoe, Tumut 3 and Shoalhaven power stations,
with an additional 2GW on the way through Snowy 2.0. We
also boast some of the world’s most attractive wind and solar
resources, with renewable energy already delivering an average
21% of our electricity in 2019 (energy.gov.au) and significantly
more in certain states and at certain times.
As this proportion of electricity coming from intermittent sources
continues to increase sharply, the need to safeguard reliability and
security also will rise. In addition, we increasingly will find ourselves
at moments when generation output exceeds demand, leaving us
no choice but to either store or waste the surplus energy.
Against this backdrop of ever accelerating change, a proactive
approach by government is vital to ensure the lowest cost solution
is implemented across the electricity system. In countries as
diverse as Israel, Portugal, Switzerland and China, governments are
embracing pumped hydro technology to complement the growing
penetration of wind and solar PV.
The benefits an expanded pumped hydro fleet would bring to
Australia are elaborated below.
Enabling the Energy Transition with High-Capacity, Long-Duration StorageAs noted in AEMO’s 2020 Integrated System Plan, Solar PV and
onshore wind are already the cheapest forms of new generation
in Australia and their penetration into the National Electricity
Market (NEM) is expected to increase significantly in the years
ahead, as aging thermal capacity is progressively retired.
This change brings new challenges, including the need to:
• Inject power when output from wind and solar PV fails to
meet demand
• Store excess power when output from wind and solar
exceeds demand
• Obtain the grid reliability and security services previously
provided by thermal generation, e.g. inertia, system strength,
frequency control, black-start, reactive power, etc.
To explore this more deeply, we have modeled the ‘net
dispatchable load’ in the various NEM states, presenting below
a snapshot of our model output for QLD in 2030. In this model,
‘net dispatchable load’ is defined as the residual load available for
dispatchable generators after wind and solar output (both utility
and rooftop) have been subtracted from underlying operational
demand. For the purpose of this analysis we have assumed the
50% by 2030 target is met.
Absent investment in large-scale, long-duration storage to
help balance the impact of wind and solar PV, our analysis
indicates prolonged periods of low net dispatchable load are
likely to emerge by 2030.
QLD Summer Weekday – Net Dispatchable Load**
Note: *Defined as the period during the daylight hours for which net dispatchable load is below the overnight minimum; **Load includes Wivenhoe’s pumping load, but not its generation output.
Source: Aurecon 2019 Cost & Technical Parameters Review; AEMO Market Generation & Load Data; AEMO 2020 ISP; AEMO Dispatch Data; GE Analysis
QLD Winter Weekday – Net Dispatchable Load**
(GW)
Midnight0
5
10
-5
2019 Gross LoadAEMO 2020 ISP
Pipeline Proportions
Midday
(GW)
0
-5
Midnight
10
Midnight
5
2019 Gross LoadAEMO 2020 ISP
Pipeline Proportions
Midday
10.4 hours of low load*
6.1GW ramp to peak
8.7 hours of low load*
5.2GW ramp to peak
Midnight

6 of 20 Pumped Hydro Storage in Australia
This seems consistent with the Australian Energy Market
Operator’s (AEMO) 2020 Electricity Statement of Opportunities
(ESOO), which forecasts that minimum operational demand (i.e.
without deducting utility wind and solar) will fall significantly
across the NEM and could even become negative in Victoria and
South Australia by 2030.
During these periods of ‘excess supply’, operational
(or ‘dispatchable’) load gets pushed to very low levels,
leading to one of two outcomes:
• Synchronous generation is pushed out of the market, with
system strength and inertia falling to very low levels
• Synchronous generation is directed to dispatch out of merit
order, leading to curtailment of wind and solar
This creates a ‘lesser of two evils’ situation in which energy prices
(better in the first scenario) must be traded off against system
security (better in the second scenario).
Pumped hydro solves this dilemma by providing a cost-effective
way to store the output from wind and solar over these middle
hours of the day. Not only does this stabilize the net dispatchable
load, enabling more synchronous capacity to stay online, but as
fixed-speed pumped hydro is a synchronous technology, it also
contributes directly to inertia and system strength.
Apart from the issue of low load, our analysis shows that an
ever-increasing evening ramp is likely to emerge across the
various NEM regions in the coming decade. This is consistent
with AEMO’s findings in Stage 1 of the Renewable Integration
Study (RIS), which highlights a forecast increase in the size of the
evening ramp of 50% in the next five years alone.
Again, pumped hydro is well-placed to address this challenge.
Because the technology can change from 100% load to 100%
generation, the impact of pumped hydro is effectively double its
nameplate capacity. This means that a ramp that would have
required 2GW of peaking generation capacity could be met with
only 1GW of pumped hydro capacity (in other words, swapping
from – 1GW pumping to +1GW generating during the ramp period).
At this kind of duration and scale, pumped hydro is a highly
cost-effective, long-lasting solution for utility scale energy
storage. Furthermore, as a synchronous technology, fixed-speed
pumped hydro can bring additional system security services that
asynchronous storage technologies do not possess.
Grid Reliability and Security ServicesAustralia spent $258 million across the 2019 calendar year
on ancillary services such as Frequency Control (or FCAS), as
outlined in the chart to the right.
Pumped hydro technology can provide many of these services,
increasing competition in the various ancillary services markets
and reducing the price at which these services are provided.
The specific ancillary services capabilities of fixed vs variable
speed pumped hydro technology are summarized below for the
typical modes a pumped hydro plant could be operating at when
called to provide the given service.
Pumped hydro plants also are well placed to provide a
range of the additional services contemplated in the Energy
Security Board’s ‘Post 2025 Market Design’ program, including
system strength, operating reserve and synchronous inertia.
Such services would further support the greater roll-out of
intermittent technologies such as wind and solar PV.
Total Ancillary Services Payments (2019)
LOWER5MINLOWER60SECLOWERREGRAISE6SECRAISE60SECRAISE5MINRAISEREGRESTARTLOWER6SEC
60
40
20
0NSW QLD VIC SA TAS
61 59
30
68
39
Pump
VARIABLE SPEED
Turbine Condenser Standstill
Yes Yes No No
Yes Yes Yes No
Yes Yes Yes Yes
Yes Yes Yes Yes
Yes Yes Yes Yes
Pump
FIXED SPEED
Turbine Condenser Standstill
No Yes No No
No Yes Yes No
No Yes Yes Yes
Yes* Yes Yes Yes
No
Fast Raise / Lower (6 sec)
Slow Raise / Lower (60 sec)
Delayed Raise / Lower (5 min)
Black Start / Restart
Reg Raise / Lower Yes Yes Yes
* Plant must be designed with black start capability in mind and sufficient water must be reserved in the upper reservoir at all times to enable the plant totransition from pump to turbine mode and inject power into the grid.

7 of 20 Pumped Hydro Storage in Australia
Lower Electricity PricesAcross the NEM we observe a positive relationship between price
and load, but this relationship is not linear, with each increase in
load leading to ever larger increases in price. In economic terms,
the NEM is typically less price elastic at low load than at high load.
In practical terms, incremental generation when marketplace load
is high will have a bigger downward impact on price than an equal
increase in load when marketplace load is low.
As an example of this dynamic at play, observe the
relationship between dispatch load and dispatch price on
winter weekdays in 2019 for the three largest markets in the
NEM, noting the ever-sharper slope as load increases and the
ever-flatter slope as load decreases.
Jobs and Investment in Regional AreasLike many energy projects, pumped hydro projects tend to be
located away from urban centers bringing investment and jobs to
regional communities that need them most.
This dynamic means that the operation of pumped hydro plants
when generating will tend to reduce peak prices by a much larger
amount than the corresponding increase in off-peak prices when
they are pumping.
This effect is shown below for an average winter weekday in
2019, based on a hypothetical 4x150MW plant located in QLD
with 8 hours of storage. As shown by the grey line in the left-
hand chart, our modeling suggests such a plant could deliver a
reduction in total daily electricity spend of more than $600,000
across the state. Aggregated across weekdays and weekends
across the four seasons of 2019, the estimated reduction in total
electricity spend exceeds $140 million, as illustrated in the right-
hand chart below.
Uniquely among energy technologies however, pumped hydro
projects include a major civil component, often representing
upwards of 70% of the total project capital expenditures (CapEx).
This money flows directly into hiring workers and equipment
and procuring key materials such as cement, which itself often is
produced in regional centers and local communities.
Note: this model’s scope only looked at intra-day load shifting. Consideration of the benefits of inter-day load shifting would lead to an even greater market value impact.
New South Wales
Price vs. Load
250.00
200.00
300.00
150.00
100.00
50.00
0.000 2,000 4,000 6,000 8,000 10,000 12,000
Queensland
Price vs. Load
250.00
200.00
300.00
150.00
100.00
50.00
0.000 1,000 2,000 3,000 4,000 5,000 6,000 7,000 8,000
Victoria
Price vs. Load
250.00
200.00
300.00
350.00
400.00
150.00
100.00
50.00
0.000 1,000 2,000 3,000 4,000 5,000 6,000 7,000 8,000
Impact on Market Price ($/MWh)
0.00
12:0
0 A
M1:
00 A
M2:
00 A
M3:
00 A
M4:
00 A
M5:
00 A
M6:
00 A
M7:
00 A
M8:
00 A
M9:
00 A
M10
:00
AM
11:0
0 A
M12
:00
PM1:
00 P
M2:
00 P
M3:
00 P
M4:
00 P
M5:
00 P
M6:
00 P
M7:
00 P
M8:
00 P
M9:
00 P
M10
:00
PM11
:00
PM
50.00
100.00
Raw Price
150.00
200.00
250.00
300.00
NetPrice Cumulative Price
Market Value Impact ($M)
Market Value Impact
SUM-WEEKDAY
Mill
ions
of A
UD
SUM-WEEKEND AUT-WEEKDAY AUT-WEEKEND
WIN-WEEKDAY WIN-WEEKEND SPR-WEEKDAY SPR-WEEKEND
-200
20406080
100120
140160
8 of 20 Pumped Hydro Storage in Australia
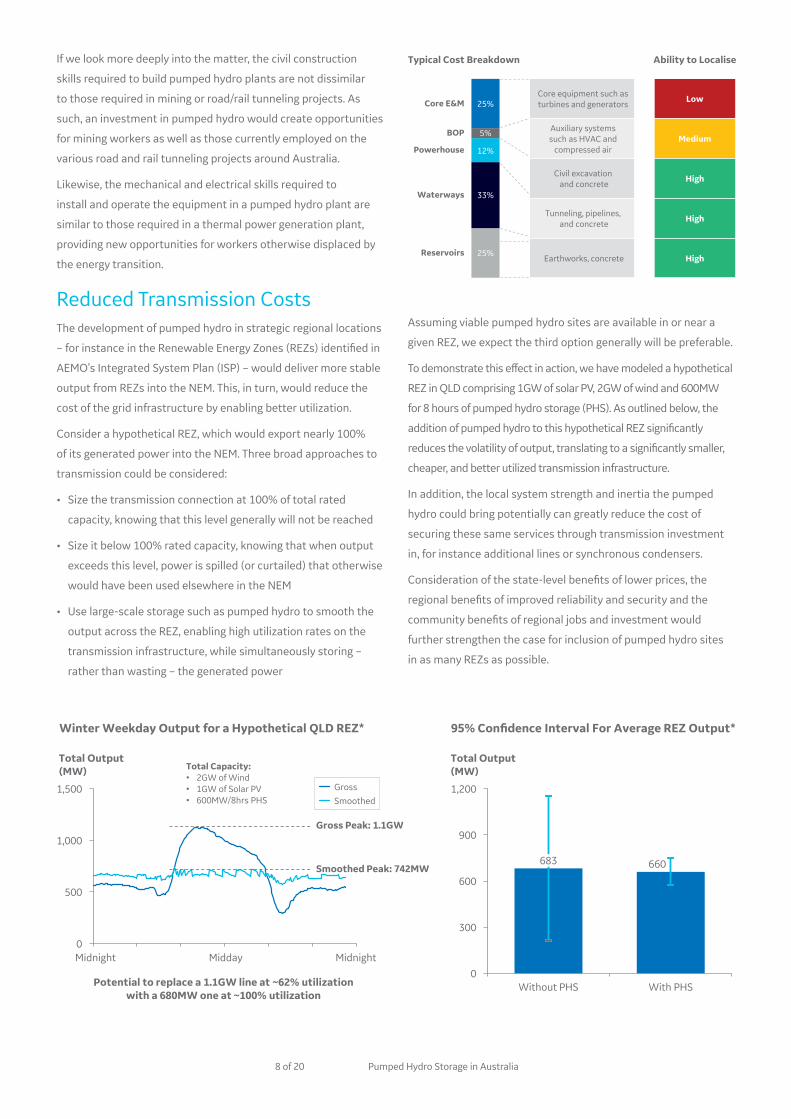
If we look more deeply into the matter, the civil construction
skills required to build pumped hydro plants are not dissimilar
to those required in mining or road/rail tunneling projects. As
such, an investment in pumped hydro would create opportunities
for mining workers as well as those currently employed on the
various road and rail tunneling projects around Australia.
Likewise, the mechanical and electrical skills required to
install and operate the equipment in a pumped hydro plant are
similar to those required in a thermal power generation plant,
providing new opportunities for workers otherwise displaced by
the energy transition.
Reduced Transmission CostsThe development of pumped hydro in strategic regional locations
– for instance in the Renewable Energy Zones (REZs) identified in
AEMO’s Integrated System Plan (ISP) – would deliver more stable
output from REZs into the NEM. This, in turn, would reduce the
cost of the grid infrastructure by enabling better utilization.
Consider a hypothetical REZ, which would export nearly 100%
of its generated power into the NEM. Three broad approaches to
transmission could be considered:
• Size the transmission connection at 100% of total rated
capacity, knowing that this level generally will not be reached
• Size it below 100% rated capacity, knowing that when output
exceeds this level, power is spilled (or curtailed) that otherwise
would have been used elsewhere in the NEM
• Use large-scale storage such as pumped hydro to smooth the
output across the REZ, enabling high utilization rates on the
transmission infrastructure, while simultaneously storing –
rather than wasting – the generated power
25%
33%
12%
5%
25%
Powerhouse
Core E&M
Reservoirs
Waterways
BOP
Core equipment such as turbines and generators
Low
Auxiliary systems such as HVAC and
compressed air Medium
Civil excavation and concrete
High
High
Earthworks, concrete High
Typical Cost Breakdown Ability to Localise
Tunneling, pipelines, and concrete
Assuming viable pumped hydro sites are available in or near a
given REZ, we expect the third option generally will be preferable.
To demonstrate this effect in action, we have modeled a hypothetical
REZ in QLD comprising 1GW of solar PV, 2GW of wind and 600MW
for 8 hours of pumped hydro storage (PHS). As outlined below, the
addition of pumped hydro to this hypothetical REZ significantly
reduces the volatility of output, translating to a significantly smaller,
cheaper, and better utilized transmission infrastructure.
In addition, the local system strength and inertia the pumped
hydro could bring potentially can greatly reduce the cost of
securing these same services through transmission investment
in, for instance additional lines or synchronous condensers.
Consideration of the state-level benefits of lower prices, the
regional benefits of improved reliability and security and the
community benefits of regional jobs and investment would
further strengthen the case for inclusion of pumped hydro sites
in as many REZs as possible.
Winter Weekday Output for a Hypothetical QLD REZ*
1,000
0
500
1,500
Midday
Total Output (MW) Total Capacity:
• 2GW of Wind• 1GW of Solar PV• 600MW/8hrs PHS
GrossSmoothed
MidnightMidnight
Gross Peak: 1.1GW
Smoothed Peak: 742MW
Potential to replace a 1.1GW line at ~62% utilization with a 680MW one at ~100% utilization
95% Confidence Interval For Average REZ Output*
Total Output (MW)
660
600
0
1,200
900
300
Without PHS
683
With PHS

9 of 20 Pumped Hydro Storage in Australia
Lower Environmental ImpactA recent study by Swiss Federal Institute of Technology (ETH)
analyzed the “Energy Returned on Energy Invested” of a broad
range of power generation and storage technologies.
This metric measures the energy stored or generated over the life
of power generation assets in terms of the energy embedded in
their manufacture and construction.
Pumped Hydro achieves the highest ratio of the technologies
assessed, returning 186 times the energy required for its
construction across its operating lifetime.
As such, pumped hydro offers a way to ‘firm’ the intermittency of
renewables, that is itself renewable.
Energy Returned on Energy Invested (EROI)
Source: study by ETH Swiss Federal Institute of Technology Zurich, for SATW (Swiss Academy of Engineering Sciences) on energy performance of power generation technologies in Switzerland
186x
23x7x 1x
Lead Acid Batteries
Pumped Hydro Power-to-H2-to-Power
Lithium Ion Batteries
Total stored energy returned over lifetime
Energy required for manufacturing & ConstructionEROI =
Furthermore, the long operating lives of pumped hydro plants
mean that the investments we make today will continue to provide
renewable power and grid stability services for generations to come.
A Highly Cost-Effective SolutionAs noted in the Technology Investment Roadmap discussion
paper, delivering the equivalent amount of storage that the
Snowy 2.0 station produces (at a cost of $5.1 billion) would
cost hundreds of billions of dollars using Li-Ion batteries. While
Snowy 2.0 boasts an unusually long storage duration of 175
hours, pumped hydro remains a highly cost-effective option at far
shorter durations than this.
This relates to the fundamental cost structure of pumped hydro:
while the MW power capacity drives the cost of the equipment,
waterway and powerhouse; incremental duration increases only
the size of the reservoirs. This ‘economy of duration’ is illustrated
below for a hypothetical 600 MW project.
Because of this phenomenon, pumped hydro is naturally very
competitive at longer durations compared with other storage
technologies, for which capex scales with duration in a more
linear manner.
Note that the above analysis considers a hypothetical site
with moderate head and waterway length. Higher head and/
or a shorter waterway would shift the entire curve downwards,
reducing cost per MWh across all durations.
Key Project Characteristics QLD Winter Weekday – Net Dispatchable Load**
A$’000
$/MWhBase Case
02 4 6 8 10
Storage Duration (Hours)
Significantly lower $/MWhwith longer duration
12 14 16 18 20
200
400
600
800
1,000
1,200Capacity
Duration
Head
Waterway
Upper Reservoir
Lower Reservoir
4 x 150 MW
8 hours (Base Case)
250 m
1,250 m
Turkey Nest
Existing Reservoir
10 of 20 Pumped Hydro Storage in Australia
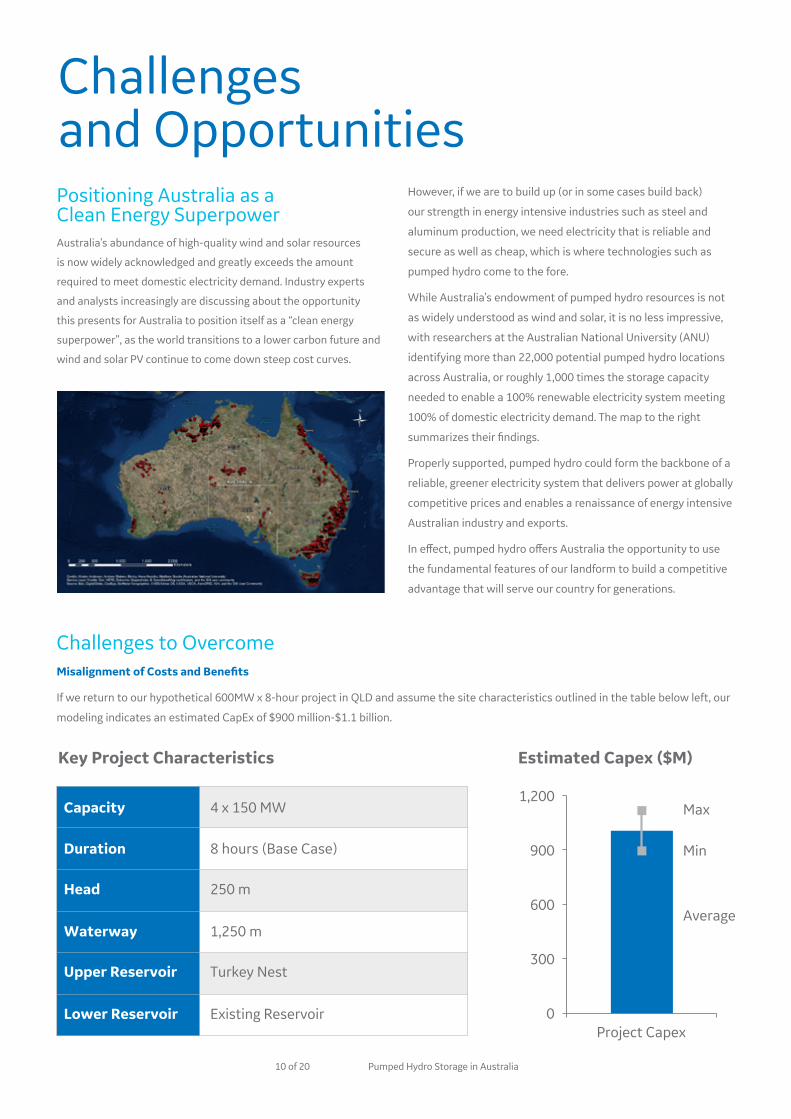
Challenges and OpportunitiesPositioning Australia as a Clean Energy SuperpowerAustralia’s abundance of high-quality wind and solar resources
is now widely acknowledged and greatly exceeds the amount
required to meet domestic electricity demand. Industry experts
and analysts increasingly are discussing about the opportunity
this presents for Australia to position itself as a “clean energy
superpower”, as the world transitions to a lower carbon future and
wind and solar PV continue to come down steep cost curves.
However, if we are to build up (or in some cases build back)
our strength in energy intensive industries such as steel and
aluminum production, we need electricity that is reliable and
secure as well as cheap, which is where technologies such as
pumped hydro come to the fore.
While Australia’s endowment of pumped hydro resources is not
as widely understood as wind and solar, it is no less impressive,
with researchers at the Australian National University (ANU)
identifying more than 22,000 potential pumped hydro locations
across Australia, or roughly 1,000 times the storage capacity
needed to enable a 100% renewable electricity system meeting
100% of domestic electricity demand. The map to the right
summarizes their findings.
Properly supported, pumped hydro could form the backbone of a
reliable, greener electricity system that delivers power at globally
competitive prices and enables a renaissance of energy intensive
Australian industry and exports.
In effect, pumped hydro offers Australia the opportunity to use
the fundamental features of our landform to build a competitive
advantage that will serve our country for generations.
Challenges to OvercomeMisalignment of Costs and Benefits
If we return to our hypothetical 600MW x 8-hour project in QLD and assume the site characteristics outlined in the table below left, our
modeling indicates an estimated CapEx of $900 million-$1.1 billion.
Estimated Capex ($M)
600
0
900
300
1,200
Project Capex
Max
Min
Average
Key Project Characteristics
Capacity
Duration
Head
Waterway
Upper Reservoir
Lower Reservoir
4 x 150 MW
8 hours (Base Case)
250 m
1,250 m
Turkey Nest
Existing Reservoir

11 of 20 Pumped Hydro Storage in Australia
Under a private investment model, this CapEx would be paid entirely
by the asset developer/owner over the course of the construction
period. In developing their business cases, our customers have
advised us they typically consider income from electricity arbitrage
and the sale of cap contracts. As such, we have modeled the trading
profit (electricity arbitrage + cap revenue) a plant such as this could
expect to have earned if it had operated throughout 2019. As shown
in the left-hand chart below, we estimate an annual trading profit
of $28 million. As shown in the right-hand chart, this is dwarfed by
the market value created through lower electricity prices across the
market due to the operation of the pumped hydro plant.
Note: We have excluded ancillary services from this analysis as
customers advised they are typically less than 10% of the revenue
stack and are not considered “bankable”.
Under private ownership, most of the value created by the project
would be a positive externality – benefiting electricity consumers
across the marketplace but providing no cashflow to the developer.
In this situation, only the $28 million trading profit would be
considered in the business case, leading to a simple payback period
in excess of 35 years.
While this is well below the typical design life of a pumped hydro
plant, it is far beyond the investment horizons of most private
sector investors.
Under public ownership, the full economic benefit of $173 million
per year would be considered against the CapEx of about $1 billion,
leading to a simple payback period of just below 6 years. In fact,
this analysis is conservative, as it considers only the trading profit
and the market value associated with lower electricity prices.
Quantification of the other benefits of pumped hydro (such as
reduced transmission investment) would further improve the
overall economic payback period.
Long Timeframes
Investment in pumped hydro is a long-term proposition, with
most of the sites under development in Australia expected to
take at least 3-4 years to build. However, the typical design life of
a pumped hydro plant is at least 50 years, with an operating life
that greatly exceeds this in practice. This is significantly greater
than the operating life of every other generation or storage
technology currently available.
Importantly, the operating life of a pumped hydro plant is relatively
unaffected by the number of daily cycles it completes. This is not
the case for chemical storage technologies, whose operating life
is measured in charge-discharge cycles. Hence these solutions
decline rapidly as the number of daily cycles increases (a likely
scenario as renewable penetration continues to rise).
Despite these advantages, the discounted cashflow methodology
used by private sector investors places far greater weight
on near-term cashflows than on long-term ones, amplifying
the costs incurred during the long construction cycle while
discounting the revenues and benefits created during the long
operating life.
This dynamic exacerbates the cost-benefit misalignment outlined
above and makes it harder still for pumped hydro development
to occur without meaningful government involvement to help
better align the benefits of pumped hydro with the costs. This
government involvement can take many forms, from direct
underwriting of revenue to capital grants to the creation of new
markets that allow developers to monetize more of the benefits
their projects create.
Annual Trading Profit by Season & Day Trading Profit vs. Market Value
0
SUM-WEEKDAY
SUM-WEEKEND
AUT-WEEKDAY
AUT-WEEKEND
WIN-WEEKDAY
WIN-WEEKEND
SPR-WEEKDAY
SPR-WEEKEND
TOTAL
5
10
15
20
25
30
Mill
ions
of A
UD
Total Value
173
14528
Trading Profit Market Value
Note: We have excluded ancillary services from this analysis as customers advised they are typically less than 10% of the revenue stack and are not considered “bankable”.

12 of 20 Pumped Hydro Storage in Australia
Successful Pumped Storage Models Around the GlobeOverview of pumped hydro Development WorldwideAccording to the International Hydropower Association (IHA), total installed pumped hydro capacity was
estimated at approximately 158 GW in 2019 and can store globally up to 9,000 GWh.
Several studies have identified vast potential for the development of pumped storage sites worldwide, and
there is also a strong potential for retrofitting disused mines, underground caverns, non-powered dams
and conventional hydro plants. With more than 100 projects in the pipeline, IHA estimates that pumped
hydropower storage capacity is expected to increase by almost 50% – to about 240 GW by 2030. In terms
of energy storage capacity, IRENA estimates that pumped hydro storage capacity will increase by 1 560-2
340 GWh above 2017 levels by 2030. On the longer term, IRENA forecasts that pumped hydro would need to
double, reaching 325 GW by 2050 to accompany the global energy transition.
Recent developments globally were mainly driven by China. Approximately 80% of new pumped hydro plants
currently under construction are located in China. Other projects have recently been commissioned or are still
under construction in Europe, Asia, Israel, Australia, Morocco, or United Arab Emirates.
Pumped hydro assets involve both generation and transmission, making the business models more complex.
Long term policies, regulatory simplification and increased visibility can help utilities and investors better
understand the benefits—and their value—that pumped hydro storage provides. A variety of market designs
and revenue schemes have been implemented successfully globally. Summarized below are some of the
different approaches we have seen.
158GW
Rest of the world: 36.1
South Korea: 4.7India: 4.8Austria: 5.6
France: 5.8
Spain: 6.1
Germany: 6.4
Italy: 7.7
United States: 22.9
Japan: 27.6
China: 30.3
Source: IHA 2020 Hydropower Status Report
Mechanism Description
Capacity Payments
Pumped Hydro as a Grid Asset
Government Ownership
Capital Grants
Underwriting Mechanism
New Revenue Markets
Owners get paid a fee per MW of available capacity
Plants are owned by the transmission companies
Plants are owned by government
Owners receive upfront grant covering part of the capex
Owners receive guarantees on min generation prices and/or max pumping costs
Markets are created for services not currently compensated
Examples
Israel, India
China
Snowy Hydro, Hydro Tas, CleanCo
ARENA large scale solar PV program
UNGI
Operating reserve markets run by IESO in Canada
China: Managing pumped storage as a Grid AssetTo address a growing need for energy while ensuring the “energy
revolution” towards more renewable sources, China has been
investing massively in clean power solutions.
To accommodate its increasing share of wind and solar sources,
as well as to support its significant coal and nuclear power fleet
, China has planned in the 13th Five Year Plan to add 17 GW of
pumped hydro storage capacity by 2020, bringing the overall
capacity to 40 GW (and even targeting 90 GW by 2025). This
will provide the grid with power for peak demand, supplemental
power for periods of reduced production, and energy storage for
emergency power standby and frequency regulation.
In China, storage assets are considered as grid assets and
therefore are largely managed by state-owned grid companies
that benefit from clear business model as those costs are
included in the grid operating expenses.

13 of 20 Pumped Hydro Storage in Australia
Several regimes have been adopted over time to allow asset
owners to cover project’s operating costs plus an agreed (with
the regulator) rate of return on the project’s capital costs. The
latest evolution is based on a two-part tariff scheme, which
consists of a capacity payment and energy tariff. On the one-
hand, the capacity fee is regulated and settled for each individual
project together with the local power grid company. The capacity
fee rewards the availability of the pumped hydro plant and the
support services that it provides to the grid (power system
reserve, frequency and voltage regulation, black start). On the
other hand, the energy tariff compensates the variable operating
costs such as pumping charges and generation losses. Compared
with previous mechanisms that were solely based on capacity
payment, this two-part tariff regime does not only provide fixed
guaranteed revenues but also additional payments depending
on utilization, thus contributing to the optimization of those
resources. Pumping electricity costs are based on local coal-fired
units, and account for 75% their electricity tariff. According to
IEA, capacity factors for the fleet were relatively low (6-8%) from
2010 to 2015, and this increased to 14% in 2016.
Source: Institutional and pricing reforms for pumped storage hydroelectricity in China (2015)
Generation-based tariff regime
Capacity-based tariff regime
Generation- and capacity-based two-part tariff regime
Payment basisEnergy generated
(i.e. per kWh)Installed capacity
(i.e. per kW)Energy generated
and installed capacity
Value reflected Generation value Capacity valueCapacity value
and generation value
Revenue CertaintyRevenues depend on the utilization of PSH
plant by the grid company
Revenues are guaranteed by the grid company
Revenues are ensured by the grid company
and additional payment depending on utilization
Assessment Simple, but not attractive to investors
Tariff sharing policy is crucial Attractive to investors
Israel: Private Investment Thanks to 20-Year PPA For AvailabilityIsrael is another example of how hydro storage can support a
nation’s energy plan. Operating on a stand-alone independent
grid that requires stability and high flexibility, Israel decided to
balance increasing solar and wind production by building pumped
hydro storage power plants. The Israeli Electricity Authority have
fixed a target of 800 MW of pumped hydro, accounting for 5%
of the 18 GW total installed capacity. One project has already
been commissioned (Gilboa 300 MW) and another one is under
construction (Kokhav Hayarden 344 MW).
The plants are under the control of the Israel Electric Corporation
(IEC) which is in charge of power generation assets, sub-stations,
as well as transmission and distribution networks in the country.
The plant performance has to comply with Public Utilities Authority
(PUA) regulation for pumped storage plants, and with all relevant
Israeli laws and IEC standards.
A 20-year Power Purchase Agreement (PPA) was signed with
Independent Power Producers that are building power plants to
cover the costs of investment, Operation & Maintenance, and
return on equity. Revenues comprise three kinds of payments: basic
availability payment, energy payment and performance payment.
Indeed, extra revenues can be awarded for additional benefits
provided to the IEC and are mainly based on the performance of the
plant in terms of flexibility such as start-up time and transition times.
For Gilboa and Kokhav Hayarden, GE Renewable Energy will
cover the full day-to-day operation and maintenance for 18 and
20 years respectively, keeping performance up and reducing
operational risks. This guarantees tariff-setting performance to
GE’s customers and is a concrete example of how GE can work
with its customers all along the value chain.
India: Firming Renewables through Combined Auctions India has set up very ambitious renewable energy targets, as the
country aims to reach 175GW of installed renewables by 2022,
meaning it has to connect 30 to 40 GW of renewable capacity
annually. It is also targeting to reach 450 GW of renewables
installed base by 2030, including Hydropower.
This additional capacity will have to be balanced with
flexible storage power assets. Pumped Storage can play
a critical role to enable a smooth energy transition through
the provision of flexible peak power capacity. India currently
has 2.6 GW of Pumped Storage that are already operational
and another 3.1 GW under construction. Additionally, about
90 GW of Pumped Storage potential has been identified
across 63 sites and recognized in national energy policies
for their valuable grid services.

14 of 20 Pumped Hydro Storage in Australia
Therefore, the government has taken a series of decisions to favor
the development of hydropower and Pumped Storage. In 2019,
hydropower has been reclassified as renewable power and new
policy rules have been adopted to incentivize electricity supply during
peak hours, better recognizing the value of flexible and dispatchable
power solutions such as hydropower and Pumped Storage.
In this context, GE will supply four 125 MW fixed speed pumped
storage turbines for the new Kundah Pumped Storage plant that will
be operated by the state government utility Tamil Nadu Generation
and Distribution Corporation Limited (TANGEDCO). This greenfield
project is part of the initiatives supported by the central government
of India to significantly increase storage capacity/hydropower
resources locally to support better renewables integration in the
overall Energy Mix. The policies are intended to ensure sustainable
and flexible energy production during peak demand periods and
consequently reinforcing grid stability in the country.
Besides, India also amended its ‘hybrid wind-solar with storage’
policy, allowing Pumped Storage to participate in auctions together
with Wind and Solar projects. Thus, the country launched in 2019
the World’s first gigawatt-scale renewables plus storage tender.
Solar Energy Corporation of India (SECI) issued a tender for 1.2 GW
of renewable projects, combined with 600 MW of storage capacity
during 6 peak hours. Auctions including Pumped Storage were
the most competitive and will benefit from a 25 year PPA (Power
Purchase Agreement) based on a two-part tariff (auctioned Peak
Tariff and settled Off-Peak Tariff). There are another 3-4 GW RTC
(Round The Clock) Green Power tenders expected to be floated by
SECI in the next 2-3 years time frame. Also the Ministry of Power
(Government of India, GOI) has been advocating building Integrated,
Schedulable Renewables, instead of standalone, wherever possible.
Austria: The Alpine Battery of Europe Hydropower accounts for more than 50% of total installed
power generating capacity of the country. With a target of a
100% power from renewable energy in 2030, further balancing
capacity and flexibility will be needed for grid stability. Austria’s
2017 Power Grid Development Plan identifies hydropower as a
key enabler of the energy transition and the related projected
increase of wind and solar. Further development of Hydropower
will also support the increasing electricity demand and energy
security objectives.
Most of the energy utilities are partially owned by the federal
and state governments (up to 51%) which can therefore support
the development of new projects. The Austrian government has
decided to expand hydropower generation with several new
greenfield plants and expansion and retrofitting projects. For
example, the 360 MW Obervermuntwerk II pumped storage
plant which has been designed in parallel to the existing
Obervermuntwerk plant, was commissioned in 2019. This is one of
the biggest horizontal units in the world and is equipped with GE’s
motor generator technology. Besides, GE is currently in charge of
retrofitting the two units of the motor generator for the pumped
storage power plant Malta Upper Stage. The works consist in the
upgrade of the motor-generator to a fully fed variable speed pump
storage motor-generator, providing more flexibility.
Additional projects under development/construction are listed
here below:
Source: CEA, IEEFA
Name of the Project State Installed Capacity (MW) Pumping Mode Operation
Kadamparai Tamil Nadu 400 Operational
Bhira Maharashtra 150 Operational
Srisailam Andhra Pradesh 900 Operational
Ghatgar Maharashtra 250 Operational
Purlia West Bengal 900 Operational
Poithan (Jayakwadi Dam) Maharashtra 12 Operational
Sardar Sarovar Gujarat 1,200 Partially Constructed
Tehri Uttarakhand 1,00 Partially Constructed
Kadana St. I & II Gujarat 240 Partially Constructed
Nagarjuna Sagar Telangana 705 Partially Constructed
Total Operational 2,612
Total Under Construction 3,145
Total Including Under Construction 5,757

15 of 20 Pumped Hydro Storage in Australia
On top of this domestic context, Austria is strategically located
at the center of Europe and its electricity network is highly
interconnected with neighboring countries, especially Germany,
Switzerland, the Czech Republic and Slovenia. Bottlenecks in the
European transmission network get more and more regular and
Austria is particularly affected by north-south electricity flows,
and has to balance volatility by absorbing and transporting huge
volumes of electricity generation from solar and wind power. This is
a key opportunity for Austria to position as the European electricity
hub and battery.
To support those challenges in Europe's energy system
infrastructure, the European Union has put in place public funding
mechanisms such as the Projects of Common Interests (PCI). The
Kaunertal pumped hydro storage project will benefit from this
mechanism. ENTSO-E (the European Network of Transmission
System Operators) highlighted in a report that this new PSH
project is one of the most effective means to solve deficits of the
region, as it is designed for integration of renewables generation,
ancillary service provision in all time frames as well as all
flexibility products, such as voltage stabilization, black start
capability and islanding operation on transmission system level.
Middle East and North Africa: Securing a Cleaner Energy Mix Several countries in the Middle East and North Africa have
started the decarbonization of their power fleet. They are
leveraging the solar resources which offer great potential in the
region as well as wind power in some cases. Besides, several
countries such as the United Arab Emirates, Egypt or Turkey
also plan to install their first nuclear power plants. Both the
integration of higher shares of renewable energy together with
the development of nuclear power capacity have led those
countries to develop pumped hydro plants. Thus, in UAE, the
Dubai Energy and Water Authority (DEWA) has launched the
construction of a 250 MW pumped hydro storage plant.
Source: based on Oesterreichs Energie – Association of Austrian Electricity Companies – List of projects (https://oesterreichsenergie.at/kraftwerksliste.html)
Project Power (MW) Energy (GWh) Grid synchronization Technology
Kaprun Oberstufe (refurbishment)
48 10 2021Conversion from ternary
to fully fed varspeed
Malta Oberstufe (refurbishment)
40 2 2021Conversion from ternary
to fully fed varspeed
Malta Hauptstufe (refurbishment)
150 2022Conversion from ternary
to fully fed varspeed
Reißeck II (extension) 42 2022New fully fed (extension
to existing power station)
Tauernmoos 170 16 2025 New fully fed
Limberg III (extension) 480 2025Double fed varspeed (as planned today)
Ebensee 170 2020
Kaunertal (extension) 900 557 2034
Kühtai 130 216 2026 New fully fed
Obervermuntwerk II (extension)
360 2019 Ternary
Riedl energy store 150 Completed

16 of 20 Pumped Hydro Storage in Australia
GE’s Pumped Storage Experience and ExpertiseGE is a major global player in both conventional and pumped hydro, with an installed base exceeding 320 GW in total and 45 GW in pumped
hydro specifically. Backed by more than 50 years of pumped hydro plant experience, our reference book covers everything from 4 MW to
400 MW units at head heights ranging from 25 meters to 1112 meters. Current and recent projects around the world are outlined below.
Across Australia, GE boasts a 3.9GW installed base of hydro turbines and generators that power almost half the hydro capacity in Australia.
We also maintain an in-country service team, based out of our office in Hobart, supporting customers across the NEM and helping to ensure
Australia’s more than 8GW fleet of hydro generation plants continues to operate smoothly.
GE Hydro Australian Installed Base
GE Turbines
GE Hydro Installed Base
GE Generators
GE Turbines + Generators
Ord RiverRamon Gorge
Guthega
Notes:* Tumut 1 (T1G) 328MW, Tumut 2 (G) 288MW* Murray 1 (G) 950MW, Murray 2 (G) 552MW
Tumut*Illawana
MurrayHume
Inumama
WamagambaHuminjuck
WyangalaBurrendong
DurrendongGlenhawn
Sydney
Shoehaven
Kaneeya
FRANCE
REVIN*• 4 x 200 MW• 240 m head, 300 rpm• Retrofit
USA
CABIN CREEK*• 2 x 10² MW• 363 m head, 360 rpm• Retrofit
SWITZERLAND
NANT DE DRANCE*• 6 x 150 MW• 311 m head, 429 rpm (+/-7%)• Variable Speed
LINTH-LIMMERN*• 4 x 250 MW• 623 m head, 500 rpm (+/-6%)• Variable Speed
AUSTRIA
MALTA*• 2 x 60 › 80 MW• Motor Generator, 240-550 rpm• Conversion to Fully Fed Variable Speed
PORTUGAL
ALQUEVA II• 2 x 130 MW• 72 m head, 428.6 rpm
SALAMONDE II• 1 x 209 MW• 115 m head, 166.7 rpm
ISRAEL
KOKHAV HAYARDEN*• 2 x 150 MW• 409 m head, 600 rpm• Equipment + O&M
GILBOA• 2 x 150 MW• 450 m head, 750 rpm• Equipment + O&M
INDIA
TEHRI*• 4 x 250 MW• 188 m head, 231 rpm (+/-6%)• Variable Speed
CHINA
QIONGZHONG• 5 x 200 MW• 308 m head, 375 rpm
HOHHOT• 4 x 306 MW• 521 m, 500 rpm
PUSHIHE• 4 x 306 MW• 308 m, 333.3 rpm
JINZHAI*• 4 x 300 MW• 330 m, 222 rpm
SOUTH KOREA
SAMRANG JIN*• 2 x 340 MW• 345 m head, 500 rpm• Retrofit
* Projects under construction

17 of 20 Pumped Hydro Storage in Australia
GE Renewable Energy offers integrated solutions for both fixed and variable speed pumped hydro plants. Together with our customers and
partners, we help minimize cost, maximize energy output and provide optimal grid support and responsiveness. Our offering across both
new equipment and service is summarized below.
• From standardized small and micro solutions
to customized large solutions
• Design and supply of all key equipment pump turbine,
motor-generator, control system, hydro mechanical
equipment, full Balance of Plant
• Supervision of installation, training,
testing, commissioning
• Selective early-stage project development support
• Planned and unplanned outage
• Plant support
• Retrofit
• Service agreement
• Asset management
• Full O&M capability – 65 units
under management globally
New Projects & Equipment O&M Service & Retrofit
Through constant investment in engineering and R&D, we are able to offer solutions delivering high levels of efficiency, rapid transition
times and wide operating ranges without ever compromising on hydraulic stability, noise or vibration levels.
Should you wish to explore our offering (or your project) further with us, then please contact Martin Kennedy ([email protected])
to arrange a meeting.
19 of 20 Pumped Hydro Storage in Australia
References• AEMO – Renewable Integration Study (Stage 1 Report):
https://aemo.com.au/en/energy-systems/major-publications/renewable-integration-study-ris
• AEMO – Electricity Statement of Opportunities (2020): https://aemo.com.au/en/energy-systems/electricity/national-electricity-market-
nem/nem-forecasting-and-planning/forecasting-and-reliability/nem-electricity-statement-of-opportunities-esoo
• AEMO – Integrated System Plan (2020):
https://aemo.com.au/en/energy-systems/major-publications/integrated-system-plan-isp/2020-integrated-system-plan-isp
• AEMO – generation fleet & development project pipeline
• AEMO – electricity dispatch price and load data (2019)
• Aurecon – 2019 Costs and Technical Parameter Review – https://aemo.com.au/-/media/files/electricity/nem/planning_and_forecasting/
inputs-assumptions-methodologies/2019/aurecon-2019-cost-and-technical-parameters-review-draft-report.pdf?la=en
• IHA – The World’s Water Battery: Pumped Hydropower Storage and the Clean Energy Transition: https://www.hydropower.org/
publications/the-world%E2%80%99s-water-battery-pumped-hydropower-storage-and-the-clean-energy-transition
• IHA – Pumped storage and the future of power systems:
https://www.hydropower.org/blog/let%E2%80%99s-get-flexible-%E2%80%93-pumped-storage-and-the-future-of-power-systems
• Development of Pumped Storage Power Station in China – QIAN Gangliang – China Renewable Energy Engineering Institute:
https://www.hydropower.org/sites/default/files/WHC2017-8A-QIAN.pdf
• IEEFA – Pumped Hydro Storage in India: Getting the right plans in place to achieve a lower cost, low-carbon electricity market:
https://ieefa.org/wp-content/uploads/2019/03/IEEFA-India_Pumped-Hydro-Storage_Mar-2019.pdf
• IEA Hydropower – Flexible – hydropower providing value to renewable energy integration:
https://www.ieahydro.org/media/51145259/IEAHydroTCP_AnnexIX_White%20Paper_Oct2019.pdf
• ETH – Current and future energy performance of power generation technologies in Switzerland
(Study commissioned by the Swiss Academy of Engineering Sciences (SATW):
https://www.smartenergyportal.ch/wp-content/uploads/2018/05/SATW-Energy-Performance-Switzerland-Report-EN.pdf
• HydroWires US DOE – Energy Storage Technology and Cost Characterization Report:
https://www.energy.gov/sites/prod/files/2019/07/f65/Storage%20Cost%20and%20Performance%20Characterization%20Report_Final.pdf
• Institutional and pricing reforms for pumped storage hydroelectricity in China : 1 supporting the energy transition – S. Zhang, P. Andrews-
Speed, P. Perera Published 2015: http://www.andrewsspeed.com/wp-content/uploads/2015/05/Pumped-storage-paper-2015.pdf
• Federal Ministry Republic of Austria – Integrated National Energy and Climate Plan for Austria:
https://ec.europa.eu/energy/sites/ener/files/documents/at_final_necp_main_en.pdf
• Economic Times article – How India is set to become a leader in Pumped Hydro Storage:
https://energy.economictimes.indiatimes.com/energy-speak/how-india-is-set-to-become-a-leader-in-pumped-hydro-storage/3484
• Hydropower and Dams article – Integrated Pumped Storage schemes for India:
https://www.hydropower-dams.com/news/integrated-pumped-storage-schemes-for-india/
• IHA – Pumped storage hydropower factsheet: https://www.hydropower.org/resources/factsheets/pumped-storage
• Ellomay – Report on Form 20-F of Ellomay Capital Ltd.: https://ellomay.com/wp-content/uploads/2020/04/20F-2019-7.4.pdf
• The Public Utilities Authority – Electricity – New Book of Standards:
https://pua.gov.il/English/Documents/BookOfStandards.pdf#search=pump%20storage
• ENTSO-E – Ten-Year Network Development Plan 2018: https://tyndp.entsoe.eu/tyndp2018/projects/storage_projects/1001
• Energy Commission – Study on energy storage – Contribution to the security of the electricity supply in Europe:
file:///C:/Users/212494730/Downloads/MJ0319322ENN.en%20(2).pdf

GE reserves the right to make changes to specifications of products described at any time without notice and without obligation to notify any person of such changes.
GE, the GE monogram and SmartSignal are trademarks of General Electric Company.
Copyright 2020, General Electric Company. All Rights Reserved.
For more information, visit www.ge.com/renewableenergy
GEA34801 I 11/2020


