Research Report DFE-RR051 Pupils’ perceptions shape educational achievement: evidence from a large- scale behavioural economics experiment Amine Ouazad, INSEAD and London School of Economics Lionel Page, University of Westminster
Transcript
Research Report DFE-RR051
Pupils’ perceptionsshape educational achievement: evidence from a large-scale behavioural economics experiment
Amine Ouazad, INSEAD and London School of Economics Lionel Page, University of Westminster
This research report was commissioned before the new UK Government took office on 11 May 2010. As a result the content may not reflect current
Government policy and may make reference to the Department for Children, Schools and Families (DCSF) which has now been replaced by the Department
for Education (DFE).
The views expressed in this report are the authors’ and do not necessarily reflect those of the Department for Education.
This research would not have been possible without the continuous support of Andrew Mellon and Oliver
Clifton-Moore, from Strategic Analysis, Department for Education. We thank the Department for
Education for their financial support. We would also like to thank members of the steering committee who
provided helpful feedback. Also, the Data Dissemination Unit was very responsive at the most important
times, in particular Dave Walton and Ian Peacock. We would also like to thank the excellent support
provided by the University of Westminster, and the excellent research assistance of Amal. We warmly
thank INSEAD, the Business School of the World, for substantial financial, administrative, and
computing support.
1
Executive Summary
What determines educational inequalities? In this research we look at whether pupils’ perceptions shape
their effort, motivation, and educational achievement. More specifically, we look at whether pupils
believe that their efforts will be more or less fairly rewarded when they are assessed by their teacher than
when they are assessed by an anonymous external examiner.
To investigate that effect, we designed one of the first behavioural economics experiments in English
classrooms. The experiment involved about 1,200 pupils across 29 schools in Liverpool, London, and
Manchester. The design of the experiment is very close to the latest developments in the economics of
education, e.g. the experiment of Fryer (2010) or of Bettinger (2008).
In the experiment, pupils received £2. They could use part of these £2 to “purchase” up to 10
questions. A question cost 20p. A correct answer doubled the initial amount of 20p, whereas a wrong
answer meant that the 20p was forfeited. Therefore, pupils who attempted 10 questions and got them all
correct could earn up to £4. The experiment took place at the same time in two classrooms in each school.
In one classroom, marking was external and anonymous (the anonymous condition) and in another group
marking was done by their teacher in the classroom and the pupils’ names were clearly displayed (the
nonanonymous condition). The questions were about defining words taken from Key Stage 3 reading
booklets. Word definitions are ideal for the experiment as grading practices may vary widely from one
teacher to another. Comparing the number of questions purchased in the anonymous and the
nonanonymous condition measures pupils’ perceptions of their teachers’ grading as well as pupils’
willingness to make effort in the classroom when assessed by the teacher.
The average effect of being nonanonymously assessed by the teacher was not significant, i.e. the
number of questions attempted by pupils in the nonanonymous condition was not significantly different
from the anonymous condition – but this masks considerable variation for some pupil groups and for some
2
teachers. Pupils bought significantly more questions when assessed by male teachers; pupils assessed by
male teachers showed greater confidence, more often declared that pupils from minority ethnic
backgrounds have equal opportunities and had more positive perceptions of their own ability. The effect
of male teachers was identical for male and female pupils.
Also, high ability pupils bought significantly more questions when they were assessed by the teacher
compared to being assessed by the anonymous external examiner. Low-ability pupils did not lower the
amount of questions chosen when assessed by the teacher. Overall, this suggests that teacher-student
interactions may be reinforcing differences in attainment rather than narrowing them.
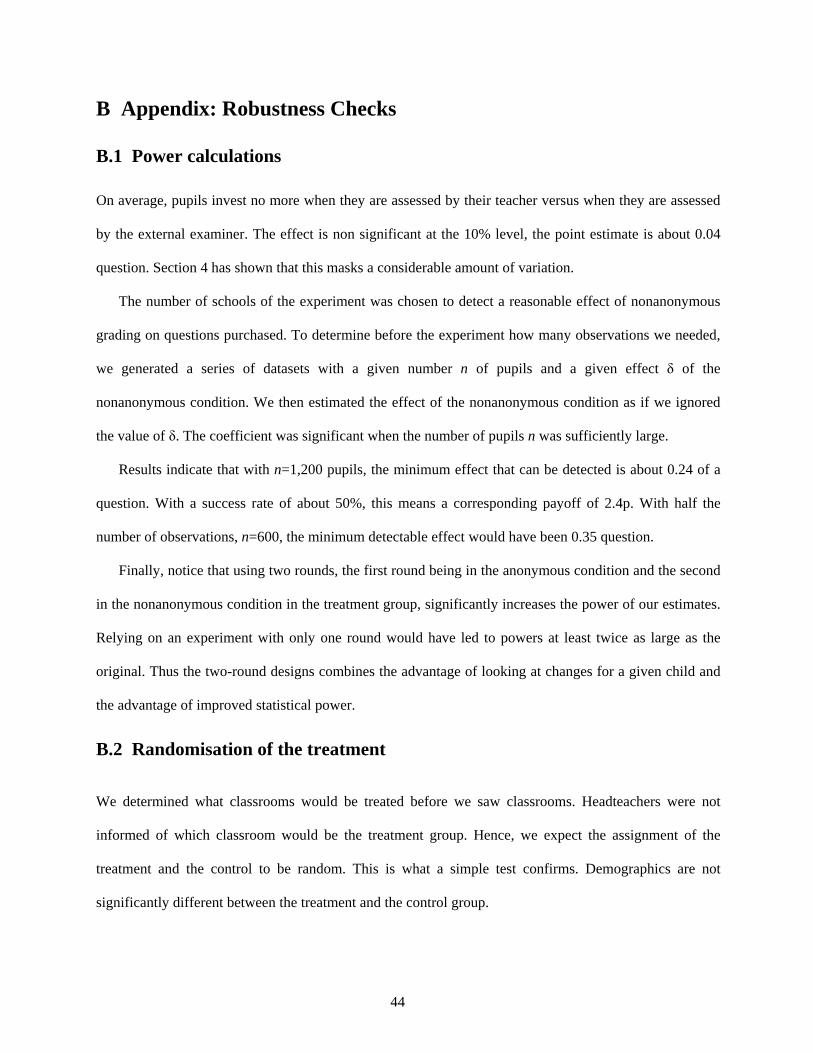
We did not find any effect of socioeconomic status as proxied by the Free School Meal status, even
after conditioning by pupil ability.
This experiment shows that male teachers may be beneficial for both male and female pupils –
increasing motivation and effort. But there are overall fewer male than female teachers in both primary
and secondary education in England. The lack of male teachers is especially salient in primary education.
Finally, the experiment shows that teachers do not raise achievement equally for all pupils – teacher
quality should also measure whether teachers are effective for all pupils.
3
Contents 1 Introduction 2 Related Literature 3 The Experiment 3.1 Fieldwork……………………………………………………………………….... 10 3.2 The Experiment within the National Strategy…………………………………….. 14 3.3 The Dataset…………………………………………………………………….... 16 4 Results 4.1 The risk-return trade-off…………………………………................................... 17 4.2 Intrinsic Motivation........................................................................................... 20 4.3 Effect of the nonanonymous condition………………………………………….... 21 5 Policy Implications 30 5.1 Male Teachers………………………………………………………………….... 30 5.2 Classroom Interactions Reinforce Inequalities…………………………………… 31 6 Conclusion A Appendix: Description of the Experiment 37 A.1 Detailed Timeline………………………………………………………………… 37 A.2 Material – Envelopes…………………………………………………………….. 38 B Appendix: Robustness Checks 40 B.1 Power calculations……………………………………………………………….. 40 B.2 Randomisation of the treatment………………………………………………….. 40 B.3 Experimenter effects…………………………………………………………….. 41 C Appendix: Econometrics 42 C.1 Regressions……………………………………………………………………… 42 D Appendix: The Risk-Return Trade-Off 44
5
8
10
17
32
4
1 Introduction Differences in educational achievement between boys and girls, ethnic groups, and free school meal and
non free school meal pupils are substantial. The fraction of boys getting 5 or more A-C GCSEs is about 6
percentage points lower than the fraction of girls getting 5 or more A-C GCSEs; Even though various
explanations such as teachers’ genders, a shift from exams to coursework assessment, and increases in
mothers’ education level have been put forward in the literature, none of them provides a complete
explanation for the gap. Also, free school meal pupils score about 40% of a standard deviation below
other pupils. Finally, there are wide gaps between pupils of different ethnic backgrounds. It is crucial for
good educational policymaking to understand the determinants of educational achievement, to target
pupils in need with the best and the most cost-effective policies.
What determines educational achievement and educational inequalities? This question has been
traditionally approached through the lens of educational inputs: the effectiveness of the four key inputs,
school quality, teacher quality, peer effects and family background, has been estimated in the educational
and in the economics of education literature for decades. Recent analysis concludes that most of
educational achievement is due to the pupil, the pupil’s early educational experiences or his family
background (Kramarz, Machin & Ouazad 2009, Kramarz, Machin & Ouazad 2010). School quality is the
second most important input, and peer effects come last. Hence, most of educational achievement is due to
factors that do not seem to be directly related to spending per pupil but may be due to the attitude of the
pupil towards school, education, or his teacher. Recent research has put the spotlight on the effect of
students’ effort on educational achievement (de Fraja, Oliveira & Zanchi 2010, Fryer 2010). Indeed,
pupils are an integral part of the educational process. Policies that improve the educational context –
whether it is school resources, teacher quality, or other important inputs – will have different effects
depending on how pupils see the return to their own effort. Extensive research shows that, for instance,
students’ perceptions of university have an important effect on their decision to start a degree(Dominitz &
5
Manski 1996). Pupils have an active role in the decision to drop out, the choice of GCSEs, the time spent
on homework, and many other day-to-day decisions.
In this research, we investigate whether pupils think their efforts will be rewarded differently when
assessed nonanonymously by the teacher and when assessed anonymously by an external examiner. The
perception of lower reward may undermine motivation and lead to lower effort and lower achievement.
The perception of higher rewards from the teacher may foster learning and trigger effort. Pupils may think
that rewards will not only depend on their answers but also their prior ability, their ethnicity, gender, and
social background, as well as their teachers’ gender.
To investigate that effect, we designed an experiment that involved 1,200 year 8 pupils across 29
schools in Manchester, Liverpool, and London. In the experiment pupils were allocated a small
endowment of £4. Pupils could either keep that endowment or purchase questions, costing 20p each. A
right answer would double the 20p to 40p. In the case of a wrong answer, students would lose the 20p.
How many questions pupils chose to buy will depend on what return they expect and also on nonmonetary
motives.1 A crucial element of the experiment is who corrects the questions: In a random half of the
classrooms, questions were anonymously corrected by the external examiner (the anonymous condition);
In the other random half of the classrooms, questions were corrected by the teacher, with the pupil’s name
made clear on the answer sheet (the nonanonymous condition). We compare the number of questions
attempted when the teacher is marking to the number of questions purchased when the external examiner
is marking. This difference tells us how pupils see teachers’ grading practices and whether pupils would
like to signal ability or effort to their teacher.
Our experiment is related to four different academic literatures: (i) the stereotype threat literature, (ii)
the literature on the Pygmalion effect (iii) the teacher-student trust literature (iv) the literature on teachers’
perceptions of their pupils. The stereotype threat literature (Steele & Aronson 1995) shows that the
framing of a test can determine the performance of pupils. For instance, the simple fact of mentioning that
“a test is diagnostic of intellectual ability” lowered the performance of minority college students on that
6
test. In India, mentioning which students are of low-caste status is detrimental to their performance (Hoff
& Pandey 2006). The second related literature starts with the Pygmalion experiment. Rosenthal &
Jacobson (1968) showed that better teachers’ perceptions lead to faster IQ growth. One reason for this
Pygmalion effect is that teachers tend to reward students based on their expectations of student
performance. The third strand of related literature is the trust literature. In India, Hoff & Pandey (2005)
shows that when grading is partly discretionary and up to their teachers, pupils tend to exert less effort and
spend less time on the proposed task. They suggest that this is due to mistrust; students may believe that
their efforts will be rewarded in a biased way, and therefore mistrust undermines motivation. The fourth
related strand of literature suggests that teachers indeed give better grades to particular pupils. In the
United States, teachers tend to give better grades to students of their own race, conditional on test scores
(Ouazad 2008). In England, analysis of Key Stage 3 data suggests that there is a discrepancy between
teacher assessments and student outcomes (Gibbons & Chevalier 2007).2
In our experiment, questions were word definitions – so there was potential discretion in how
questions were graded. Each question presented an excerpt from past Key Stage 3 reading booklets, with
one underlined word. Below the excerpt were four lines where the pupil wrote his/her answer. There was a
range of words spanning multiple subjects (gravity and earthquake as well as monologue and rhyme).
Indeed, English language skills matter for all subjects3, including Science and Maths. More importantly,
these questions involve four of the key skills prescribed in the Primary Framework of the National
work, and understanding the word within a context – and at least seven skills of the English National
Strategy for year 8 pupils. Section 3 will review these eleven specific skills.
1 We will discuss the various interpretations of our experiment in the discussion section. 2 Teacher assessments in the National Pupil Database are discrete and there are only a few levels,
whereas the Key Stage test scores are continuous. Thus, a more refined analysis may lead to substantially stronger effects. The interpretation of such results is not easy though, and we do not claim that they measure discrimination. Rather, teachers may capture skills that are not captured by test scores, and may reward behaviour or social skills.
3 Machin & McNally (2008) suggest that the very effective Literacy Hour freed up time for other subjects.
7
Economic experiments that provide small monetary rewards are not new, but they are now at the
frontier of research in education. One of the multiple advantages of monetary rewards is that they are
appealing regardless of the pupil’s background. We have made sure that the monetary rewards are of a
reasonable amount, were clearly explained to parents who signed a parental agreement, and were given in
agreement with headteachers, teachers, and Department for Education officials.
Monetary rewards are used here as a research instrument to analyse students’ responses. Cash
transfers can also be of interest as a potential educational policy. The analysis of conditional cash transfers
is at the forefront of current research in the economics of education. A recent experiment in 250 U.S.
schools led by Harvard University economist Roland G. Fryer analysed the effect of input-based versus
outcome-based monetary incentives (Fryer 2010). Other experiments on the efficiency of pupil incentives
were conducted earlier in the U.S. (Bettinger 2008). In the U.K, a study of conditional cash transfers
suggested that monetary incentives might have an important and significant impact on drop-out(Dearden,
Emmerson, Frayne & Meghir 2009). Our experiment is related to that strand of literature in that it shows
that students’ expectations may determine the effectiveness of conditional cash transfers.
The report is structured as follows. Section 2 provides a quick overview of the literature on stereotype
threats, pygmalion effects, and trust in the classroom. Section 3 presents the experimental protocol and the
dataset. Section 4 describes the main results of the experiments – on male teachers, high- and low-ability
pupils. Section 5 lists two important policy implications. Section 6 concludes. There are extensive
appendices that describe the material of the experiment, the econometric framework, and potential
economic models.
2 Related Literature
This paper looks at the effect of students’ perceptions of teachers’ behaviour through a specific lens. We
present here an overview of prior literature on this topic before delving into a thorough description of the
design of the experiment in section 3. There are at least three strands of the literature that are closely
8
related: (i) the Pygmalion literature (ii) the stereotype threat literature (iii) the literature on trust and
ambiguity (iv) the literature on teachers’ perceptions of their pupils.
The Pygmalion study (Rosenthal & Jacobson 1968) sparked a very abundant literature on the effect of
teacher expectations on student performance. In the original 1968 experiment, researchers selected a
random 20% subsample of pupils and told the teachers that the pupils have been diagnosed as potential
“bloomers”. Since the subsample was purely random, the difference in the IQ progress of the 20%
subsample and of the rest of the group is the effect of teacher expectations.
Pygmalion condition The experimenter presents evidence to teachers that some pupils will be
bloomers.
The experiment showed significant IQ progress compared to the treatment group (Rosenthal &
Jacobson 1968), in grades 1 and 2, but there was no effect for later grades. The results of this experiment
have been thorougly criticised but a consensus has emerged that Pygmalion effects are significant but
small and short-lived (Jussim & Harber 2005).
While the Pygmalion literature focuses on the effect of teacher expectations, the stereotype threat
literature focuses on students’ reactions to different environments – environments where their gender,
ethnicity or race may lead to anxiety, fear of failure, or a suspicion that rewards are biased in favor of
some pupils. There are many different experimental conditions that have been labelled as measuring
stereotype threats. Here are two of the most usual stereotype threat conditions.
experimenter presents evidence to students/pupils on ethnic or gender gaps in performance.
In both versions of the stereotype threat condition, test scores are lower for students who belong to a
stereotyped group. In Steele & Aronson (1995), African-American students had lower test scores at a
version of the Graduate Record Examination test (GRE). In Aronson, Lustina, Good & Keough (1998),
9
white students had lower test scores when confronted to evidence that Asian students outperform white
students.
There is no single determinant of stereotype threats. Anxiety is correlated to stereotype threats
(Blascovich, Spencer, Quinn & Steele 2001), and threats to the student’s ego have been mentioned
(Aronson et al. 1998), but more specific mechanisms are needed to explain why the stereotype threat
framing is causing lower achievement. One potential mechanism is the expectation that rewards will be
biased in favour of some students. This is what the literature on trust and ambiguity measures.
Trust and ambiguity (Hoff & Pandey 2005) The experimenter makes the rules of the test more
ambiguous, i.e. dependent on the teacher’s judgment, and observes the level of effort and performance on
the test.
Hoff & Pandey (2005) performed an experiment in which the criteria for success were either clear and
mechanical, or ambiguous and dependent on the experimenter’s judgment. The test was to complete
mazes. The experiment took place in India, with 156 children from 6 villages. Ambiguous rules led to
lower effort and outcomes for low-caste children compared to high-caste children in a setting where
classrooms were segregated by caste.
Our experiment is closest to this last strand of the literature (Hoff & Pandey 2005, Hoff & Pandey
2006). Specifically, our experiment makes two important contributions. First, monetary incentives allow
us to directly elicit pupils’ perceptions of teachers’ grading practices, which is an important channel for
the Pygmalion effect. We do not manipulate teacher expectations but rather we observe pupils’ effort with
different types of teachers and an anonymous external examiner. Second, the experiment brings external
validity to the trust literature. We indeed perform the experiment in classrooms with pupils’ actual
teachers, and pupils take a test that is directly made of excerpts of Key Stage 3 reading booklets. Thus, we
bring the insights of three literatures to the context of the English classroom, on a much larger scale (with
five times more pupils as in Hoff & Pandey (2005)). We observed different teachers rather than a single
experimenter which allows us to look at the effect of ambiguity for different teacher genders.
10
11
A fourth strand of literature shows that teachers’ perceptions of student ability depend on ethnicity and
gender. We mentioned work in the U.S. (Ouazad 2008) in the U.K.(Gibbons & Chevalier 2007). In the
U.S., teachers tend to give higher subjective assessments to students of their own race. A study on Israeli
high-school matriculation exams showed that teachers who correct exams nonanonymously tend to favour
girls (Lavy 2008). However, it is typically difficult to credibly estimate the causal effect of pupils’
characteristics on teachers’ subjective perceptions conditional on pupil ability: first, teachers may capture
skills that are not captured by test scores; second, teachers’ perceptions may be based on characteristics
correlated with pupils’ gender or ethnicity; third, there may tough and lenient teachers and they may be
nonrandomly assigned to pupils. In our experiment we measure students’ perceptions of teachers’ grading
practices, rather than actual teachers’ grading practices. Teacher biases partly determine pupils’
perceptions of rewards but pupils’ perceptions may be inconsistent with teachers’ actual practices.
Overall, the main focus of our experiment is children’s perceptions of their teachers’ grading practices
rather than on teachers’ actual grading practices.
3 The Experiment
3.1 Fieldwork
The objective of the experiment is to study the perceptions of rewards when a pupil’s answers are
corrected by an anonymous external examiner compared to when he/she is corrected by his/her teacher.
Pupils are rewarded based on answers to questions where there is discretion in teachers’ marking
practices.
We chose as subjects year 8 pupils from 29 schools in London, Manchester, and Liverpool. We
estimate that for every 3 schools contacted, one replies positively and makes the necessary arrangements.
Schools mostly took part out of an interest to contribute to educational policy. Pupils came from all parts
of the ability distribution – schools understood our need for a representative classroom.
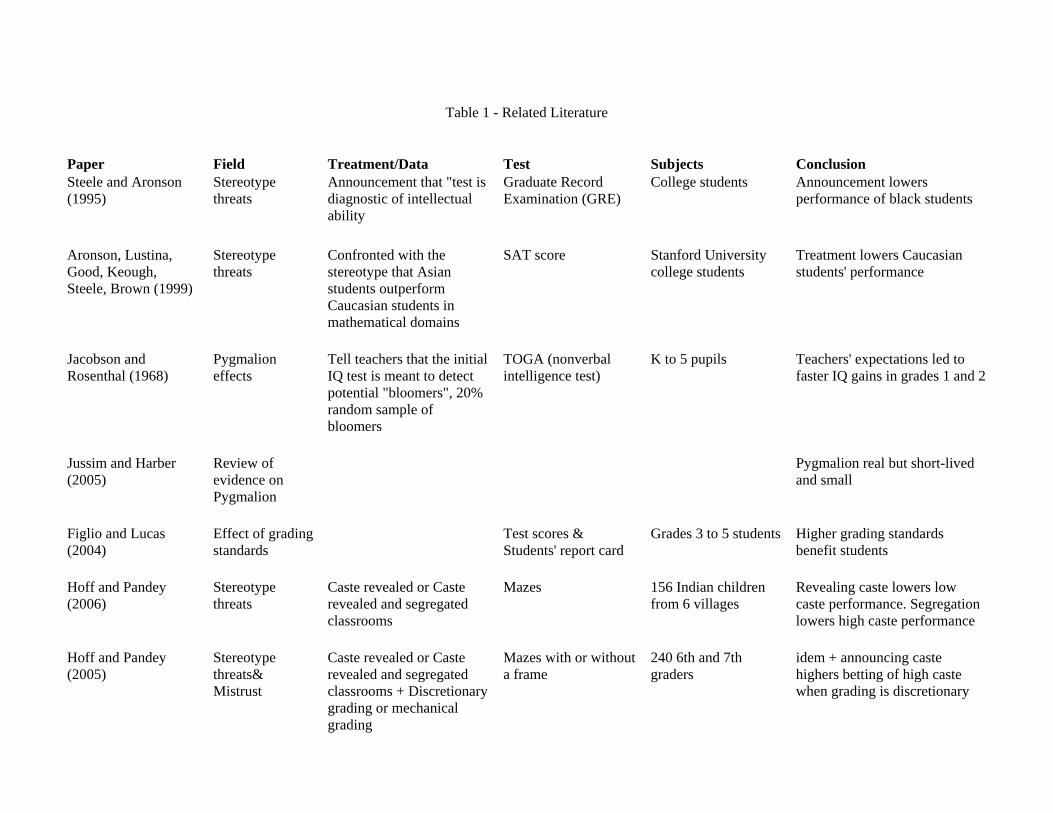
Table 1 - Related Literature
Paper Field Treatment/Data Test Subjects Conclusion Steele and Aronson (1995)
Stereotype threats
Announcement that "test is diagnostic of intellectual ability
Graduate Record Examination (GRE)
College students Announcement lowers performance of black students
Aronson, Lustina, Good, Keough, Steele, Brown (1999)
Stereotype threats
Confronted with the stereotype that Asian students outperform Caucasian students in mathematical domains
SAT score Stanford University college students
Treatment lowers Caucasian students' performance
Jacobson and Rosenthal (1968)
Pygmalion effects
Tell teachers that the initial IQ test is meant to detect potential "bloomers", 20% random sample of bloomers
TOGA (nonverbal intelligence test)
K to 5 pupils Teachers' expectations led to faster IQ gains in grades 1 and 2
Jussim and Harber (2005)
Review of evidence on Pygmalion
Pygmalion real but short-lived and small
Figlio and Lucas (2004)
Effect of grading standards
Test scores & Students' report card
Grades 3 to 5 students Higher grading standards benefit students
Hoff and Pandey (2006)
Stereotype threats
Caste revealed or Caste revealed and segregated classrooms
Mazes 156 Indian children from 6 villages
Revealing caste lowers low caste performance. Segregation lowers high caste performance
Hoff and Pandey (2005)
Stereotype threats& Mistrust
Caste revealed or Caste revealed and segregated classrooms + Discretionary grading or mechanical grading
Mazes with or without a frame
240 6th and 7th graders
idem + announcing caste highers betting of high caste when grading is discretionary
Interestingly, very different schools took part. Schools had a wide variety of achievement levels and a
wide variety of social backgrounds. The highest performing school was an all-girls voluntary aided school
which had 75% of pupils with five or more GCSEs grade C or above, 65% of pupils getting at least two
good GCSEs in science, and 38% of pupils with at least one GCSE in a modern language. The median
school was a mixed community school, with 54% of pupils having five or more good GCSEs, 40% of
pupils getting at least two good GCSEs in science, and 22% of pupils with at least one modern language
GCSE. Finally, the lowest performing school was a mixed community school, which had 38% of pupils
with five or more good GCSEs, 25% getting at least two GCSEs in science, and 34% with at least one
GCSE in a modern language.
We went to each school with four experts in education. Two experts were presenters, and the
remaining two staff were graders. The presenters were members of the Aimhigher network and are used to
discussions with pupils. Each school had assigned us two classes of approximately 20 students. Parents
had signed a parental agreement that clearly spelled out the conditions of the experiment, including the
use of monetary incentives.
The experiment took place in the pupils’ usual classrooms. Both groups of pupils took part in the
experiment at the same time. The teacher of the classroom was present from the beginning of each
experiment. Before entering the classroom, pupils got a number printed on a small piece of paper. They
then entered the classroom as silently as possible and sat at the table corresponding to their number.
Numbers were assigned randomly so that pupils were not able to choose where they wanted to sit. This
prevented potential cheating and peer effects.
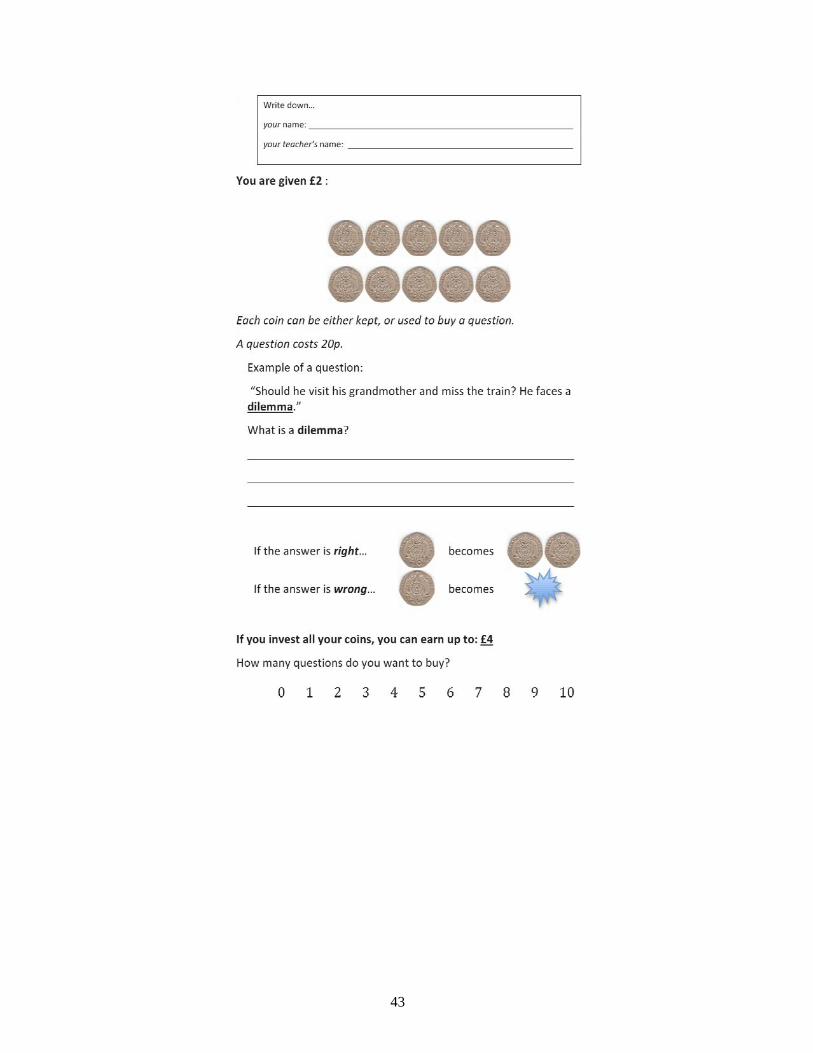
One person of our team – the ‘presenter’ – was leading the experiment in each classroom.4 Each
presenter then welcomed pupils and presented the experiment. Sealed envelopes were then put on each
table. The experiment was described as about “defining words”. An example question was then read to
4 Presenters were a former headteacher, a member of Aimhigher, a former school inspector, a former
teacher.
13
them. The example was “archaeologist.” The presenter read a few possible answers, without explicitely
saying which one was better than the others.
The presenter then told pupils that we will give them £2. They will be able to keep that money or they
could choose to buy questions at a cost of 20p each. Each question was a word definition, as in the
previous example. A right answer leads to 40p, whereas a wrong answer leads to no money. There are 10
questions, so that a pupil can get up to £4. The presenter describes a couple of scenarios, e.g. the pupil
chooses to purchase 4 questions, gets 3 questions right. The presenter asks pupils to calculate how much
they would get. The payoff is 2−4×0.20+3×0.40=2.40 pounds. Thus the presenter made sure that pupils
understood the game. Pupils then chose the number of questions to attempt by circling a number between
0 and 10 at the bottom of the envelope. Pupils were informed that they could not change the number of
questions purchased once a number has been circled.
They then had 20 minutes to write down in silence their definitions on the answer sheet contained in
the sealed envelope. In some cases of pupils with special educational needs, an adult would read the text
(but not the answer) quietly to the pupil.
The words were: species, monologue, ridge, gravity, paranoia, eroded, unemployment, recycling,
demonstrations and tax. These were questions from all subjects – gravity, recycling, and tax are not
primarily taught in English classes. Also, there were difficult and easy questions from the beginning to the
end. For instance, monologue was an especially difficult word (with a low success rate), gravity was a
particularly easy one (with a very high success rate), paranoia was difficult, unemployment and recycling
were easy, demonstrations was difficult (in the context of the excerpt), and tax was found to be moderatly
difficult.
Envelopes were then collected and given to the anonymous external marker. This completed the first
round.
Pupils were then told that there would be a second round, with the same guidelines, and a different set
of questions. Each pupil got a new envelope. In one randomly selected classroom, the “treatment”
classroom, pupils were told that answers would now be corrected by their teacher. In that classroom,
14
pupils were asked to write their name at the top of envelope, alongside the teacher’s name. The rest of the
session then procedeed as before: students chose a number of questions from 0 to 10, and then had 20
minutes to fill in the answer sheet. The words were customary, stone’s throw, wrestling, earthquake,
single, charisma, fictional character, legacy, rhyme and curfew. This completed the second round.
Therefore, to summarise:
Round 1 In both the treatment and the control classrooms, marking is performed by an external
examiner who does not see the pupil or his/her name (the anonymous condition).
Round 2 In the treatment classrooms, students write their name and their teacher’s name on the
envelope and answers are corrected by the teacher (the nonanonymous condition). In the control
classroom, students are corrected as in round 1 (the anonymous condition).
Thus we observe each pupil’s choice and outcome twice. In the treatment classroom, we observe
pupils’ choice and outcome once in the anonymous setting, and once in the nonanonymous setting. In the
control classroom, we observe pupils’ choice and outcome twice in the anonymous setting.
At the end of the second round, pupils fill a questionnaire on their perceptions of rewards, fairness,
importance of hard work, role of the advice of the teacher, self-perceptions of ability, and amount of
pocket money received.
Finally, the presenters led a discussion about pupils’ feelings about the experiment; whether they
enjoyed it, what they felt the purpose of the experiment was. Pupils said they enjoyed the game, the
presence of monetary rewards; our most significant finding is that the presence of monetary rewards made
most pupils interested in understanding and defining words, including pupils who would not otherwise be
easily motivated. 5 Pupils found that the word task was neither too easy nor too hard.
At the end of this discussion, payoffs were handed in numbered envelopes stuffed with the number of
awarded 20p coins. Envelopes did not bear the name of the student, only his/her number.
5 This observation was also made in the United States. It explains why schools quickly realise that
monetary rewards are not necessarily inconsistent with sound educational principles.
15
Casual observation suggests that pupils cared about their payoffs and the amount of coins they
received. Headteachers and teachers agreed with the format of the experiment and felt that it made sense
to award coins to the most hard-working and able pupils. Pupils were not allowed to open the envelope in
the classroom but only once they had left the room.
3.2 The Experiment within the National Strategy
As mentioned in the introduction, defining word presented in the context of a text involves at least four
skills of the literacy framework of the National Strategy for primary schools and at least seven skills of the
English National Strategy for year 8 pupils. The four skills of the literacy framework for Primary school
pupils are: independent reading, independent writing, focused word work, and understanding the word
within a context. These are part of the literacy hour (Stannard & Huxford 2007, Machin & McNally
2008). Overall three words illustrate the main skills involved in the experiment.
• Monologue. “My friend ate a hearty breakfast and kept a sort of a happy-go-lucky monologue
throughout its entire course.”
• Defining this word involved knowing the definition of the word in the theatrical, broadcast
or movie context; but the excerpt was also using the word in a way that is slighty different
from the Oxford dictionary’s definition “A long speech by one actor in a play or film, or as
part of a theatrical or broadcast.” Pupils could use the text to guess the meaning in this case,
and the success rate on this question was very low. Thus, defining this word involved skill
5.1 “Developing and adapting active reading skills and strategies”, skill 6.2 “Analysing how
writers’ use of linguistic and literary features shapes and influences meaning”, and skill 10.1
“Exploring language variation and development according to time, place, culture, society
and technology.”
• Demonstration. “Airline pilots who say long flying hours are "putting lives at risk" are holding
demonstrations across Europe.”
16
• Interestingly, the word demonstration has multiple meanings. The Oxford dictionary
mentions that it can either be 1. “an act of showing that something exists or is true by giving
proof or evidence,” 2. “a practical exhibition and explanation of how something works or is
performed,” or 3. “a public meeting or march protesting against something or expressing
views on a political issue.” The second meaning was the most well known and the one that
was used in most answers. The first meaning was never used. However, the text makes it
clear that the correct answer is close to definition 3. It proved difficult for pupils to make use
of the context to infer the right meaning of the word.
• Tax. “In southern Germany, dustbins are fitted with measuring devices to weigh the waste and the
consumer has to pay a tax according to the weight. “
• The Oxford definition is “a compulsory contribution to state revenue, levied by the
government on workers’ income and business profits, or added to the cost of some goods,
services , and transactions.” The difficulty here is the abstractness of the word. Indeed, most
pupils are used to hearing about the Council tax. Also, some pupils mentioned the bin tax
that may have been featured in newspapers at the time of experiment. What was difficult for
pupils was to provide a definition of the word “tax” that wasn’t specific to the Council tax,
but could also apply to the income tax or indirect taxes.
The variety of answers and skills shows that teachers and graders could use very different grading
strategies. For instance, graders could sanction the definition of a word that is correct outside the context
of the excerpt, e.g. demonstration. Also, they could approve an answer that is correct only if the word is
used in a specific context, e.g. the Council tax. Graders could also approve an answer that is only partially
right – that mentions a few keywords, the right keywords, keywords not structured in a proper sentence.
This is precisely what we are looking for in this experiment: to measure how pupils expect to be graded
by their teacher. And the format of the questions allows for such discretion in grading strategies.
17
3.3 The Dataset
We gathered results for 29 schools, 54 classrooms, and 1,157 pupils. In some cases, the experiment could
not be carried out in the two assigned classrooms. This happened in schools where behaviour made it
impossible to start describing the experiment without significant disruption. We believe that this
disruption was not linked to the particular experimental methodology that we used, but rather linked to the
school environment, as it happened in schools with low attainment scores.
As expected, we have slightly more than 20 pupils per classroom (21.4 pupils) on average. Most
children’s choices are observed twice, in the first round and in the second round. In less than 5 cases did a
child leave because of other commitments or because of disruptive behaviour.
Data on paper were collected and transferred to spreadsheets by our research assistants. The schools
provided us with the Unique Pupil Numbers which allowed a merge with the National Pupil Database
(NPD). The NPD contains Key Stage 1 and Key Stage 2 scores, ethnicity variables, gender, free school
meal status, and English as a second language status. Key Stage 1 tests were taken in year 2, and Key
Stage 2 tests were taken in year 6.
The dataset is fairly representative of the population of year 8 pupils in England. There are slightly
more free school meal pupils (20.6%), fewer white pupils (66.1%), and more male pupils (53.3%) than in
the overall school population. Also, there are fewer male teachers in the sample than in the population of
teachers (31% compared to 44%). There is also a fairly diverse range of ability levels: Key Stage 2 scores
from the NPD and the GCSE results of schools suggest the same distribution of abilities as the national
distribution.
18
4 Results
4.1 The risk-return trade-off
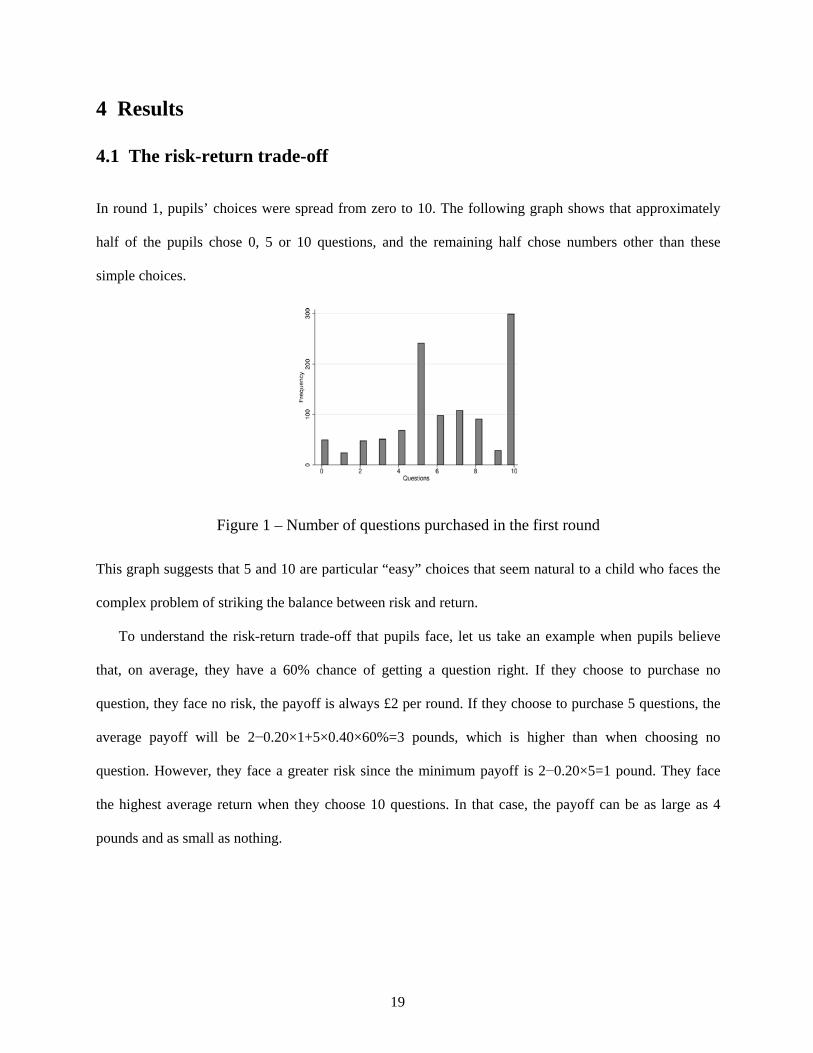
In round 1, pupils’ choices were spread from zero to 10. The following graph shows that approximately
half of the pupils chose 0, 5 or 10 questions, and the remaining half chose numbers other than these
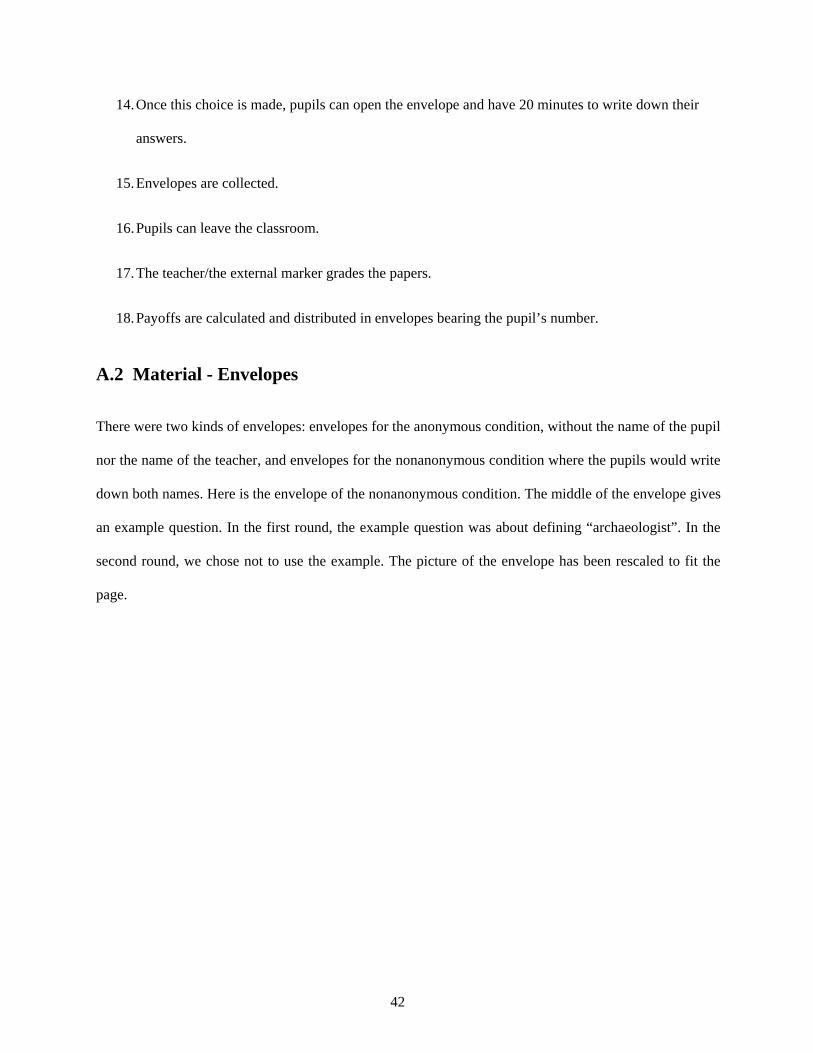
simple choices.
Figure 1 – Number of questions purchased in the first round
This graph suggests that 5 and 10 are particular “easy” choices that seem natural to a child who faces the
complex problem of striking the balance between risk and return.
To understand the risk-return trade-off that pupils face, let us take an example when pupils believe
that, on average, they have a 60% chance of getting a question right. If they choose to purchase no
question, they face no risk, the payoff is always £2 per round. If they choose to purchase 5 questions, the
average payoff will be 2−0.20×1+5×0.40×60%=3 pounds, which is higher than when choosing no
question. However, they face a greater risk since the minimum payoff is 2−0.20×5=1 pound. They face
the highest average return when they choose 10 questions. In that case, the payoff can be as large as 4
pounds and as small as nothing.
19
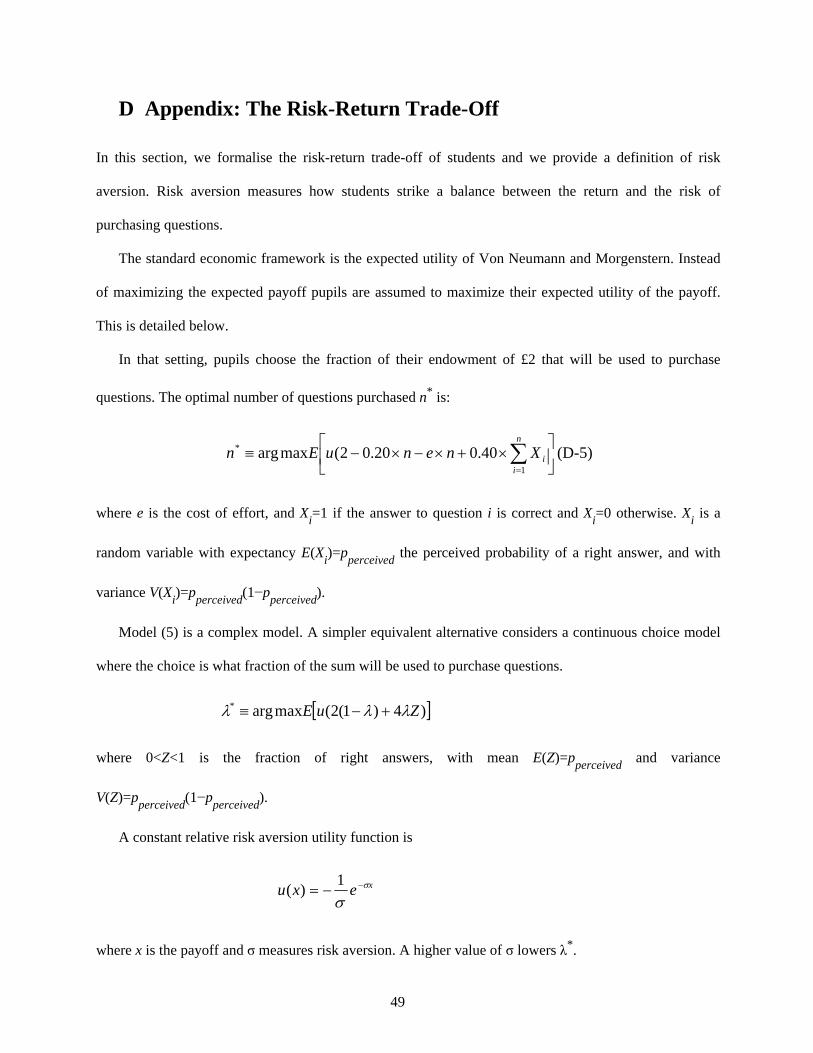
Risk aversion is a measure of how pupils strike a balance between the return and the risk.6 For a given
belief about the probability of success, a high degree of risk aversion will lead to few questions purchased,
whereas a small degree of risk aversion will lead to a large number of questions purchased.
There are some particular cases that need discussion. If pupils believe that the probability of getting
the answer right is lower than 50%, purchasing questions lowers the expected return and increases the
risk. Thus, pupils are not likely to purchase questions in that case.
If pupils are risk neutral – an extreme stylised case in which pupils focus only on the perceived return
– then any probability about 50% leads to a purchase of 10 questions, and any probability below 50%
leads to no purchase of questions.
The economic literature has shown that in some instances, this simple framework is not consistent
with empirical observations, but the departures are typically in situations far from our experiments. Since
all pupils start with the same endowment and get money only at the end of the second round, pupils start
the second round with no additional money, hence reference dependence is not likely to drive pupils’
choices. Also, since all pupils get their payoff at the same time regardless of whether they purchase 0 or
10 questions, impatience and lack of self-control are unlikely to play a role here.
What the pattern of figure 1 suggests is that pupils can be seen as boundedly rational; they simplify a
very complex problem by considering only simple focal choices: 0, 5, or 10 questions purchased. Instead
of choosing between 11 alternatives, some pupils then only choose between 3 alternatives.
An interesting set of explanations of pupils’ choices comes from regressing the number of questions
on the answers to the post-experiment questionnaire.
6 A proper definition is given in the appendix.
20
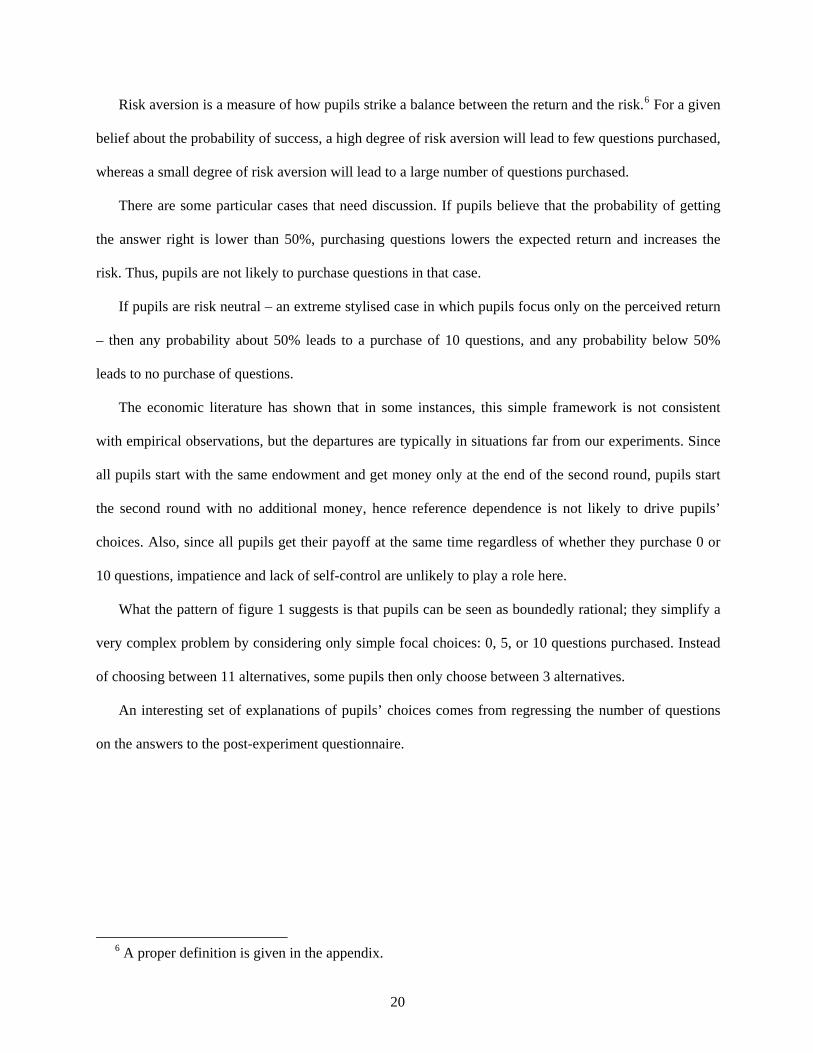
Dependent variable: Questions purchased Hard work determines success 0.768 (0.326)** Luck determines success -0.619 (0.143)*** Ethnicities have equal opportunities 0.570 (0.191)*** Good relationship with the teacher matters 0.357 (0.193)* Advice of the teacher helped 0.280 (0.230) Thinks teacher has high expectations -0.438 (0.256)* Self-perception of Ability 1.191 (0.415)***
Table 2 – Association between questions purchased and answers to post-experiment questionnaire
Each question of the post-experiment questionnaire was coded from -1 (Strongly disagree) to 1
(Strongly Agree). Responses confirm that pupils with a more favourable perception of their ability buy
more questions. Pupils who believe luck determines success chose less questions. The effect is not small:
a one standard deviation increase (0.64) in the perception that luck determines success leads to 0.4 less
question purchased (-0619*0.64). Perceptions of fairness also matter for investment in questions.
In round 2, pupils tend to make subtler trade-offs between risk and return, 51% choose other numbers
than 0, 5 or 10, where only 47% would do so in round 1. This comes mainly from the fact that pupils who
had chosen 5 questions adjust their beliefs and shift to other options.
21
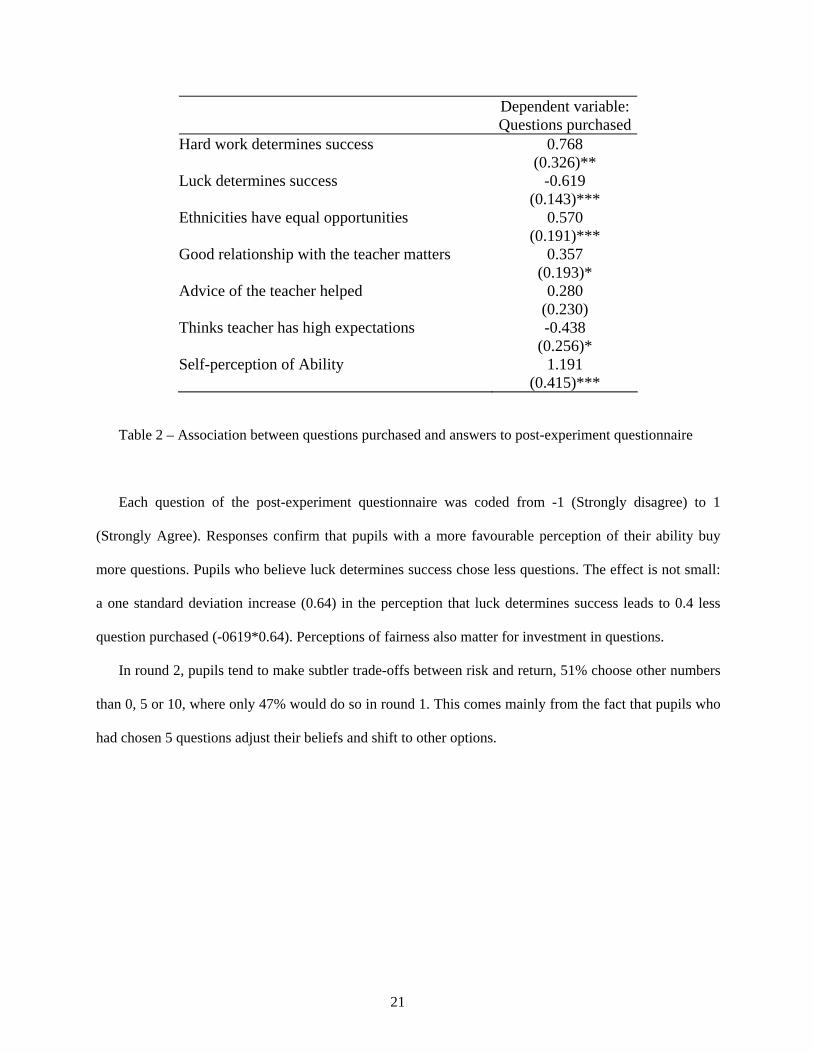
Figure 2 – Number of questions purchased in the second round
The majority of pupils (65%) increased the number of questions purchased in the second round. Since risk
aversion is not likely to change during the course of the experiment, pupils are either finding the questions
easier than they thought or have clarified some ambiguity about the format of the experiment.
About 30% of pupils chose 10 questions both in the first and second rounds. That suggests that either
these pupils have low risk aversion or believe that the questions are sufficiently easy to make a purchase
of 10 questions rational.
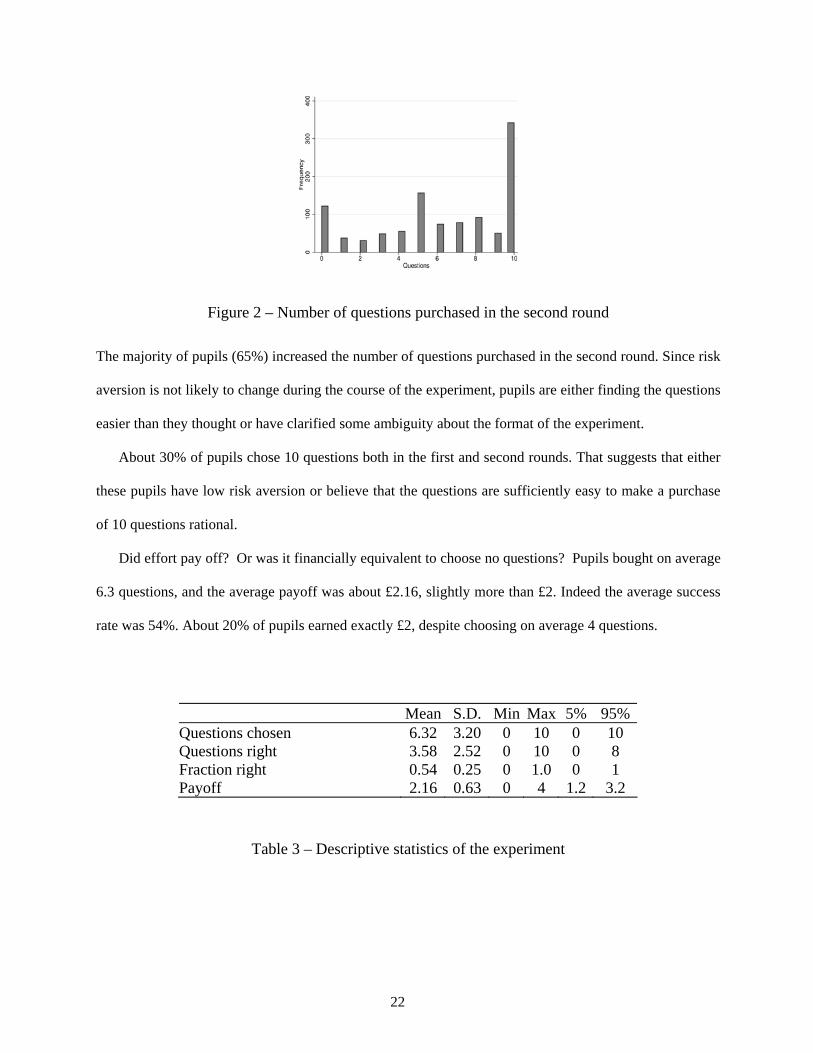
Did effort pay off? Or was it financially equivalent to choose no questions? Pupils bought on average
6.3 questions, and the average payoff was about £2.16, slightly more than £2. Indeed the average success
rate was 54%. About 20% of pupils earned exactly £2, despite choosing on average 4 questions.
Mean S.D. Min Max 5% 95% Questions chosen 6.32 3.20 0 10 0 10 Questions right 3.58 2.52 0 10 0 8 Fraction right 0.54 0.25 0 1.0 0 1 Payoff 2.16 0.63 0 4 1.2 3.2
Table 3 – Descriptive statistics of the experiment
22
4.2 Intrinsic Motivation
In economic experiments, monetary incentives are typically provided to align participants’ incentives with
a simple economic framework that illustrates a few stylised facts. Indeed, if monetary incentives are
sufficiently high-powered, monetary incentives will overshadow intrinsic incentives. The rules of the
game are clear and aligned with an underlying economic model that provides a simple narrative.
There are at least three types of intrinsic incentives at play here: (i) pupils may want to impress the
teacher by showing their ability, (ii) pupils may want to show to the teacher that they work hard, or (iii)
pupils may value the learning experience. The first kind of intrinsic incentive increases the return of
buying questions but also increases the risk of buying questions – so the effect is ambiguous. The second
and the third kind of intrinsic incentives increases the number of purchased questions.
A slightly more negative possibility is that providing monetary incentives may suggest the task is
unpleasant and that pupils may not be willing to do it without incentives, i.e. that monetary incentives
undermine motivation (Benabou & Tirole 2003, Deci, Koestner & Ryan 2001). This last concern is
present in nearly every economic experiment and cannot be dismissed outright; even though it challenges
the external validity of the findings, it means that economic incentives will matter even more and will
drive the results of the experiment. Also most of the undermining effect is in the long run.
Broadly speaking, are monetary incentives replacing the pleasure of answering questions and learning
new words? In many deprived schools, providing monetary incentives aligns academic success and
financial success (Fryer 2010). In lower-performing schools, monetary incentives tended to lead to better
behaviour and stronger motivation. Our casual observations in schools suggests that monetary incentives
mattered less in the best schools of the sample.
23
4.3 Effect of the nonanonymous condition
The primary interest of the experiment is the effect of being nonanonymously assessed by the teacher on
the number of questions attempted. The design of the experiment makes it especially easy to estimate such
an effect.
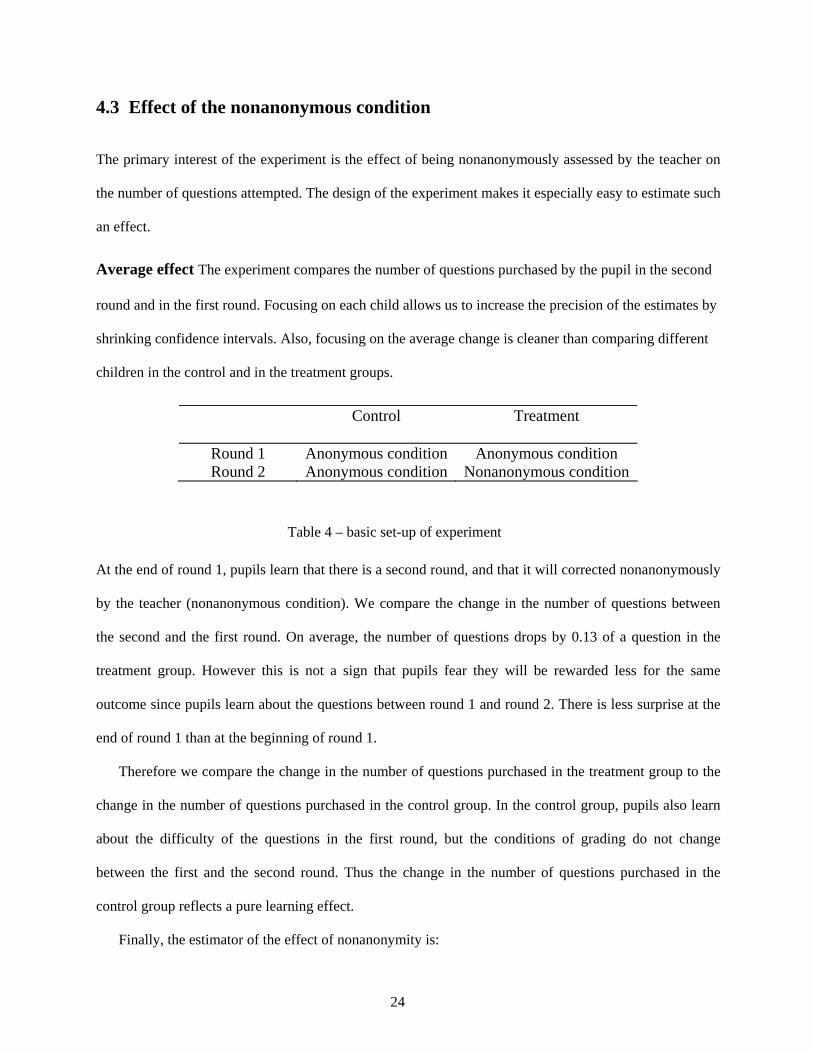
Average effect The experiment compares the number of questions purchased by the pupil in the second
round and in the first round. Focusing on each child allows us to increase the precision of the estimates by
shrinking confidence intervals. Also, focusing on the average change is cleaner than comparing different
children in the control and in the treatment groups.
At the end of round 1, pupils learn that there is a second round, and that it will corrected nonanonymously
by the teacher (nonanonymous condition). We compare the change in the number of questions between
the second and the first round. On average, the number of questions drops by 0.13 of a question in the
treatment group. However this is not a sign that pupils fear they will be rewarded less for the same
outcome since pupils learn about the questions between round 1 and round 2. There is less surprise at the
end of round 1 than at the beginning of round 1.
Therefore we compare the change in the number of questions purchased in the treatment group to the
change in the number of questions purchased in the control group. In the control group, pupils also learn
about the difficulty of the questions in the first round, but the conditions of grading do not change
between the first and the second round. Thus the change in the number of questions purchased in the
control group reflects a pure learning effect.
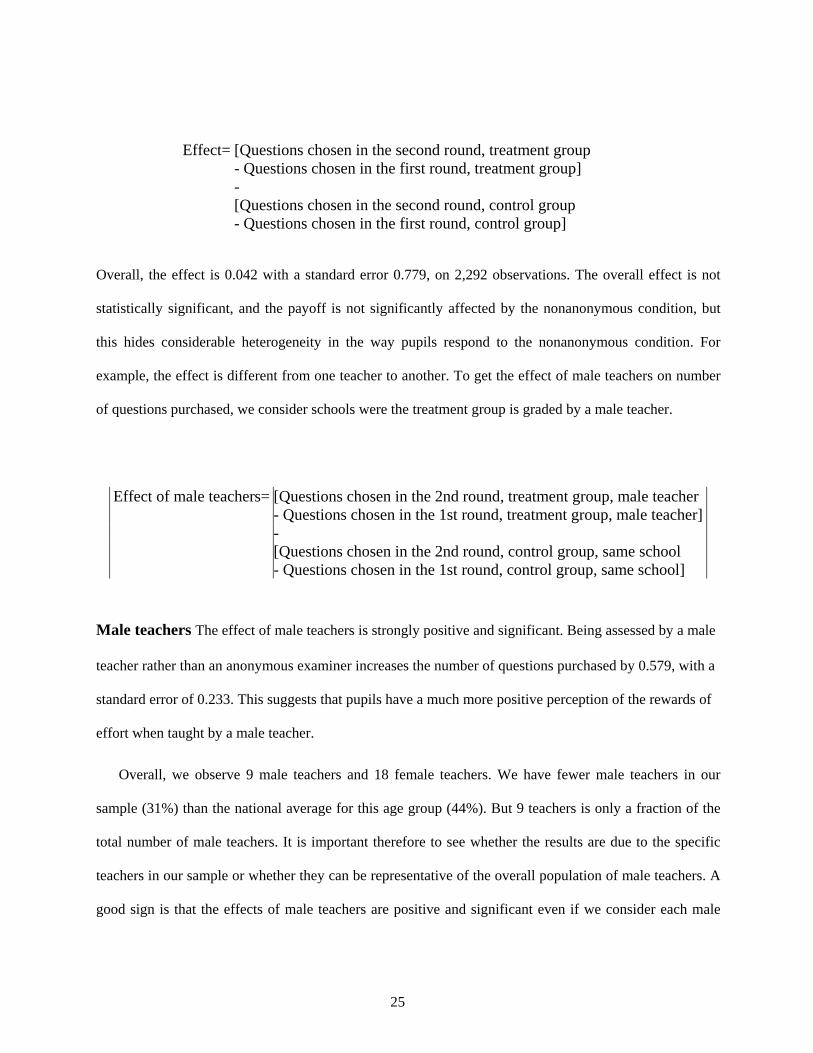
Finally, the estimator of the effect of nonanonymity is:
24
Effect= [Questions chosen in the second round, treatment group - Questions chosen in the first round, treatment group] - [Questions chosen in the second round, control group - Questions chosen in the first round, control group]
Overall, the effect is 0.042 with a standard error 0.779, on 2,292 observations. The overall effect is not
statistically significant, and the payoff is not significantly affected by the nonanonymous condition, but
this hides considerable heterogeneity in the way pupils respond to the nonanonymous condition. For
example, the effect is different from one teacher to another. To get the effect of male teachers on number
of questions purchased, we consider schools were the treatment group is graded by a male teacher.
Effect of male teachers= [Questions chosen in the 2nd round, treatment group, male teacher - Questions chosen in the 1st round, treatment group, male teacher] - [Questions chosen in the 2nd round, control group, same school - Questions chosen in the 1st round, control group, same school]
Male teachers The effect of male teachers is strongly positive and significant. Being assessed by a male
teacher rather than an anonymous examiner increases the number of questions purchased by 0.579, with a
standard error of 0.233. This suggests that pupils have a much more positive perception of the rewards of
effort when taught by a male teacher.
Overall, we observe 9 male teachers and 18 female teachers. We have fewer male teachers in our
sample (31%) than the national average for this age group (44%). But 9 teachers is only a fraction of the
total number of male teachers. It is important therefore to see whether the results are due to the specific
teachers in our sample or whether they can be representative of the overall population of male teachers. A
good sign is that the effects of male teachers are positive and significant even if we consider each male
25
teacher one by one. Although this does not completely rule out that our male teachers are a specific
sample7, it is an important confirmation of the results.
Analysis of the results reveals that male teachers in the experiment teach male pupils more often. Even
though the experiment overall has more female pupils than male pupils8, there are 51% of male pupils in
groups taught by a male teacher, and only 33% of male pupils in groups taught by a female teacher. To
understand whether it was the gender of the pupils or the gender of the teachers that drove the results, we
estimated the effect of male teachers separately for boys and for girls. There is no significant difference in
the effect of male teachers for male and female pupils.
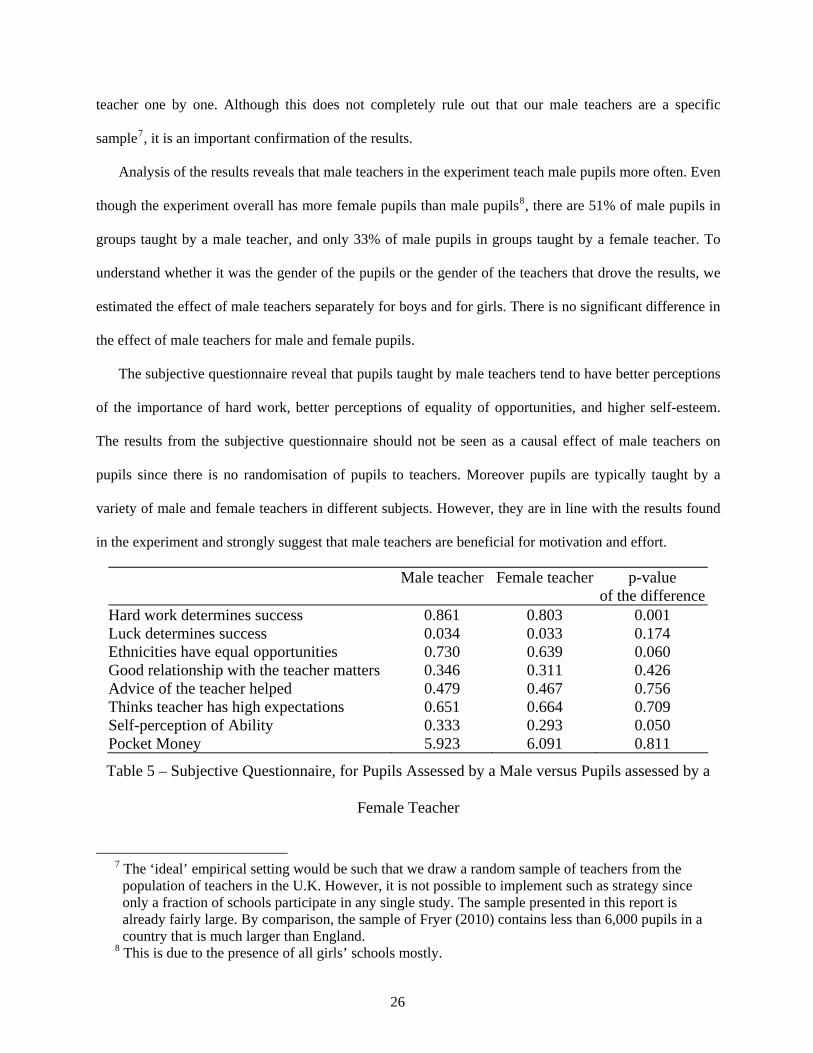
The subjective questionnaire reveal that pupils taught by male teachers tend to have better perceptions
of the importance of hard work, better perceptions of equality of opportunities, and higher self-esteem.
The results from the subjective questionnaire should not be seen as a causal effect of male teachers on
pupils since there is no randomisation of pupils to teachers. Moreover pupils are typically taught by a
variety of male and female teachers in different subjects. However, they are in line with the results found
in the experiment and strongly suggest that male teachers are beneficial for motivation and effort.
Male teacher Female teacher p-value of the differenceHard work determines success 0.861 0.803 0.001 Luck determines success 0.034 0.033 0.174 Ethnicities have equal opportunities 0.730 0.639 0.060 Good relationship with the teacher matters 0.346 0.311 0.426 Advice of the teacher helped 0.479 0.467 0.756 Thinks teacher has high expectations 0.651 0.664 0.709 Self-perception of Ability 0.333 0.293 0.050 Pocket Money 5.923 6.091 0.811
Table 5 – Subjective Questionnaire, for Pupils Assessed by a Male versus Pupils assessed by a
Female Teacher
7 The ‘ideal’ empirical setting would be such that we draw a random sample of teachers from the
population of teachers in the U.K. However, it is not possible to implement such as strategy since only a fraction of schools participate in any single study. The sample presented in this report is already fairly large. By comparison, the sample of Fryer (2010) contains less than 6,000 pupils in a country that is much larger than England.
8 This is due to the presence of all girls’ schools mostly.
26
These results from subjective questionnaires are not due to the larger proportion of male pupils in groups
taught by male teachers.9 10
Also, interestingly, pupils did not get higher payoffs when assessed by the male teacher in the
nonanonymous condition. To see that, we computed the estimate [Payoff in the 2nd round, treatment
group, male teacher-Payoff in the 1st round, treatment group, male teacher]-[Payoff in the 2nd round,
control group, same school-Payoff in the 1st round, treatment group, same school]. The effect is very
close to zero (-0.03 with a standard error of 0.643). Indeed, pupils chose a larger number of questions but
the fraction of questions right was slightly negative.
This last result brings a new light on the question of male teachers: male teachers foster self-esteem,
perceptions of fairness, but they are no more lenient than other teachers. We will discuss the potential
policy implications of the result on male teachers more extensively in section 5.
Ethnicity We now turn to the ethnicity of pupils. There is an abundant literature on the role of students’
ethnic background in shaping educational inequalities. For instance, most of the original literature on
stereotype threats is concerned about anxiety of being unfairly rewarded or about the anxiety of
confirming the stereotype that individuals from minority ethnic groups underperform. Also, Hoff &
Pandey (2006) suggests that equality of opportunity does not prevent pupils from believing that there is
discrimination and unfair rewards.
We estimated the effect of the nonanonymous condition as previously for each ethnic subgroup. We
compared the non-white pupils of each treatment group to the non-white pupils of the control classroom.
That adequatly compares non-white pupils in the same schools.
9 A p-value lower than 0.10 indicates a 10% significance level. A p-value lower than 0.05 indicates a
5% significance level. 10 Interestingly, the reported levels of self-perceptions of ability are not different between male and
female pupils.
27
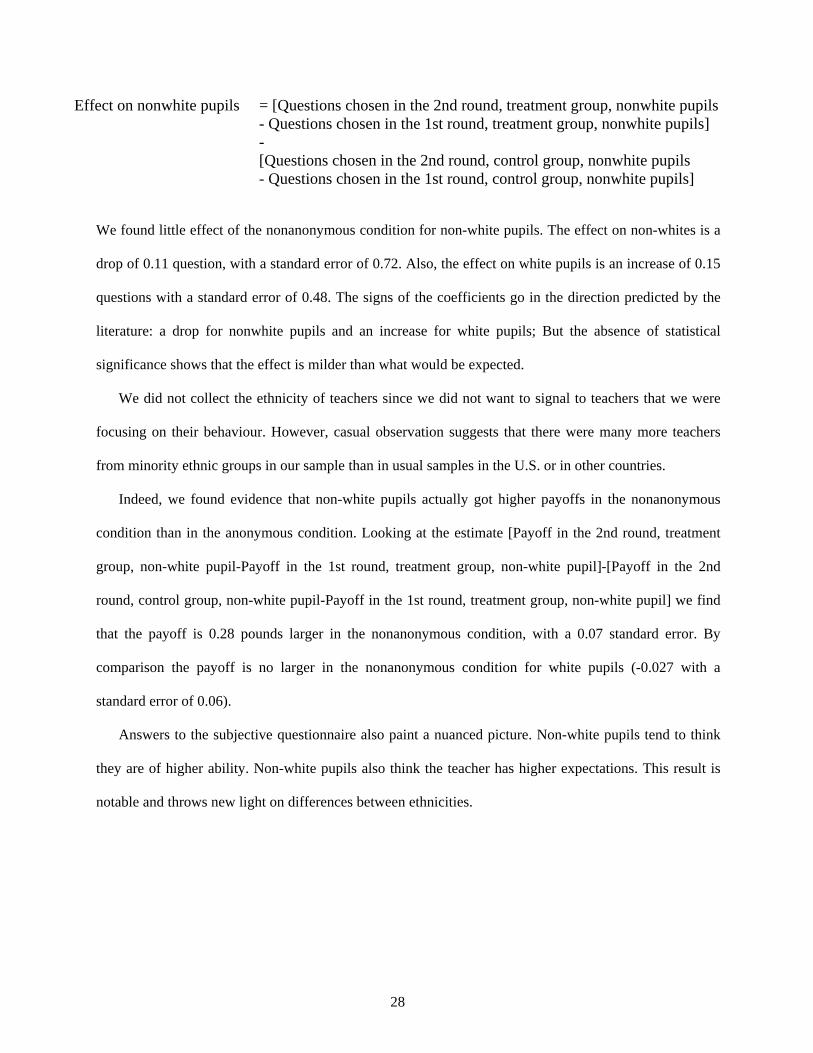
Effect on nonwhite pupils = [Questions chosen in the 2nd round, treatment group, nonwhite pupils - Questions chosen in the 1st round, treatment group, nonwhite pupils] - [Questions chosen in the 2nd round, control group, nonwhite pupils - Questions chosen in the 1st round, control group, nonwhite pupils]
We found little effect of the nonanonymous condition for non-white pupils. The effect on non-whites is a
drop of 0.11 question, with a standard error of 0.72. Also, the effect on white pupils is an increase of 0.15
questions with a standard error of 0.48. The signs of the coefficients go in the direction predicted by the
literature: a drop for nonwhite pupils and an increase for white pupils; But the absence of statistical
significance shows that the effect is milder than what would be expected.
We did not collect the ethnicity of teachers since we did not want to signal to teachers that we were
focusing on their behaviour. However, casual observation suggests that there were many more teachers
from minority ethnic groups in our sample than in usual samples in the U.S. or in other countries.
Indeed, we found evidence that non-white pupils actually got higher payoffs in the nonanonymous
condition than in the anonymous condition. Looking at the estimate [Payoff in the 2nd round, treatment
group, non-white pupil-Payoff in the 1st round, treatment group, non-white pupil]-[Payoff in the 2nd
round, control group, non-white pupil-Payoff in the 1st round, treatment group, non-white pupil] we find
that the payoff is 0.28 pounds larger in the nonanonymous condition, with a 0.07 standard error. By
comparison the payoff is no larger in the nonanonymous condition for white pupils (-0.027 with a
standard error of 0.06).
Answers to the subjective questionnaire also paint a nuanced picture. Non-white pupils tend to think
they are of higher ability. Non-white pupils also think the teacher has higher expectations. This result is
notable and throws new light on differences between ethnicities.
28
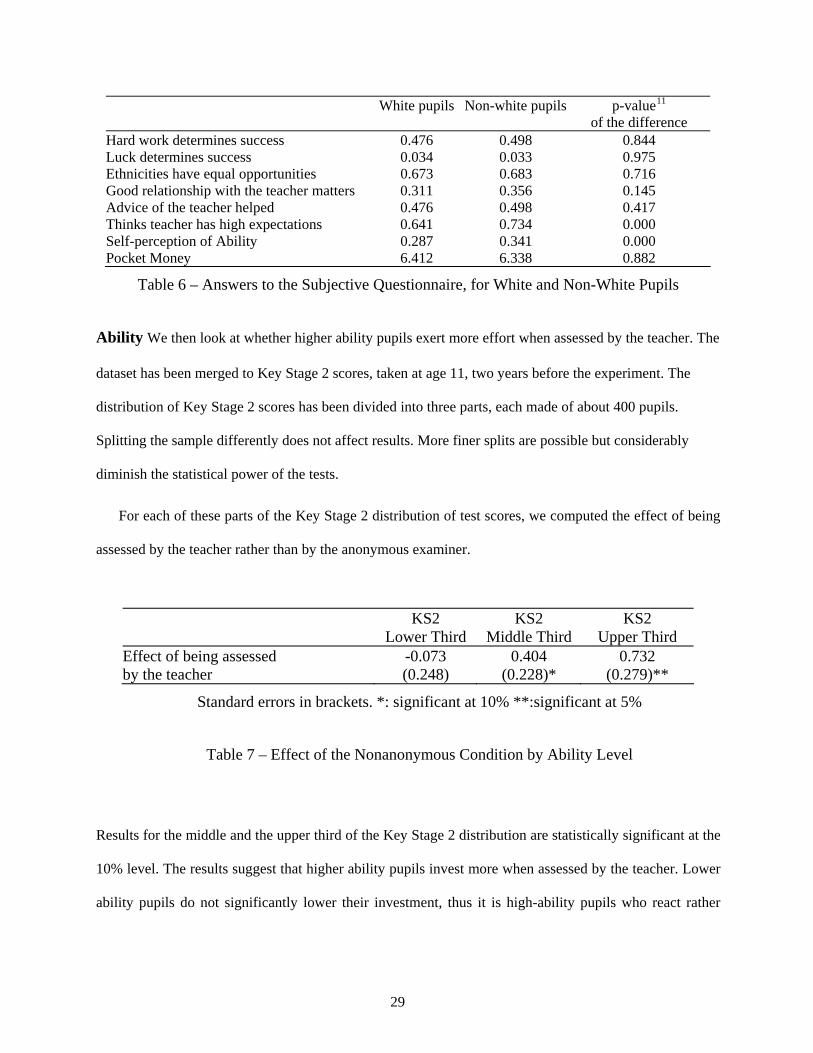
p-value11 White pupils Non-white pupils of the difference Hard work determines success 0.476 0.498 0.844 Luck determines success 0.034 0.033 0.975 Ethnicities have equal opportunities 0.673 0.683 0.716 Good relationship with the teacher matters 0.311 0.356 0.145 Advice of the teacher helped 0.476 0.498 0.417 Thinks teacher has high expectations 0.641 0.734 0.000 Self-perception of Ability 0.287 0.341 0.000 Pocket Money 6.412 6.338 0.882
Table 6 – Answers to the Subjective Questionnaire, for White and Non-White Pupils
Ability We then look at whether higher ability pupils exert more effort when assessed by the teacher. The
dataset has been merged to Key Stage 2 scores, taken at age 11, two years before the experiment. The
distribution of Key Stage 2 scores has been divided into three parts, each made of about 400 pupils.
Splitting the sample differently does not affect results. More finer splits are possible but considerably
diminish the statistical power of the tests.
For each of these parts of the Key Stage 2 distribution of test scores, we computed the effect of being
assessed by the teacher rather than by the anonymous examiner.
KS2 KS2 KS2 Lower Third Middle Third Upper Third Effect of being assessed -0.073 0.404 0.732 by the teacher (0.248) (0.228)* (0.279)**
Standard errors in brackets. *: significant at 10% **:significant at 5%
Table 7 – Effect of the Nonanonymous Condition by Ability Level
Results for the middle and the upper third of the Key Stage 2 distribution are statistically significant at the
10% level. The results suggest that higher ability pupils invest more when assessed by the teacher. Lower
ability pupils do not significantly lower their investment, thus it is high-ability pupils who react rather
29
than the lower-ability pupils who change their behaviour. The story here is one of increased motivation,
not a story of lower motivation for low-ability pupils.
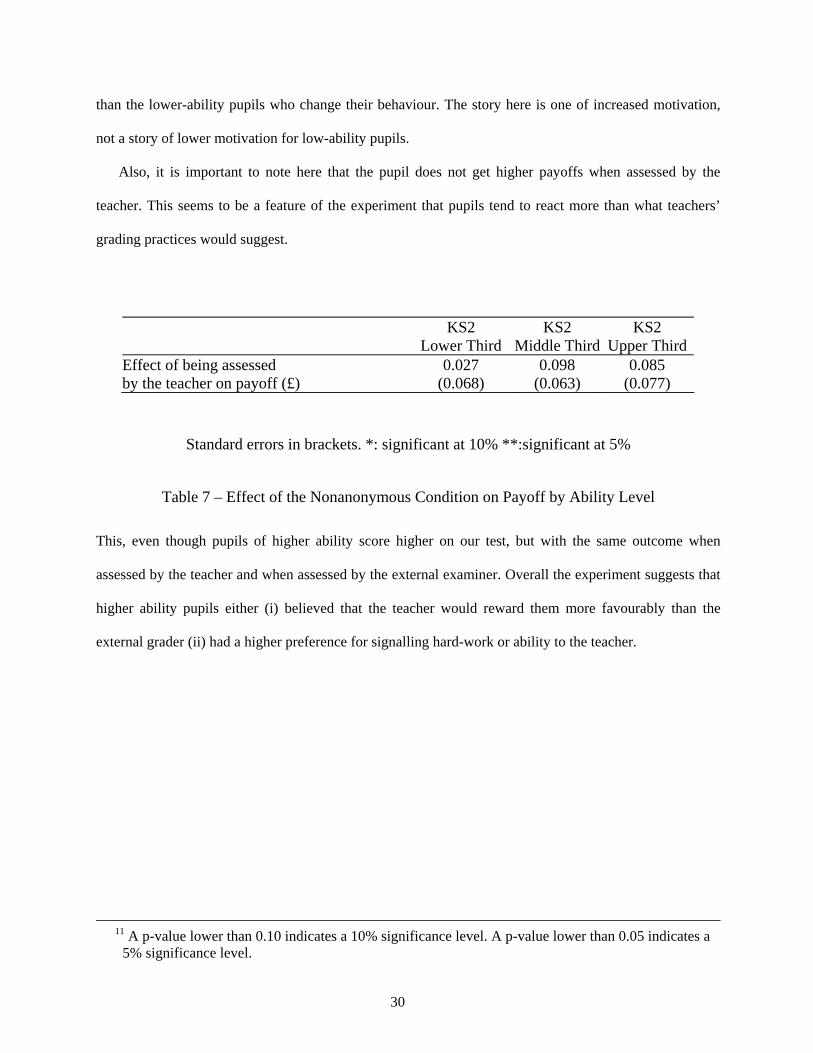
Also, it is important to note here that the pupil does not get higher payoffs when assessed by the
teacher. This seems to be a feature of the experiment that pupils tend to react more than what teachers’
grading practices would suggest.
KS2 KS2 KS2 Lower Third Middle Third Upper ThirdEffect of being assessed 0.027 0.098 0.085 by the teacher on payoff (£) (0.068) (0.063) (0.077)
Standard errors in brackets. *: significant at 10% **:significant at 5%
Table 7 – Effect of the Nonanonymous Condition on Payoff by Ability Level
This, even though pupils of higher ability score higher on our test, but with the same outcome when
assessed by the teacher and when assessed by the external examiner. Overall the experiment suggests that
higher ability pupils either (i) believed that the teacher would reward them more favourably than the
external grader (ii) had a higher preference for signalling hard-work or ability to the teacher.
11 A p-value lower than 0.10 indicates a 10% significance level. A p-value lower than 0.05 indicates a
5% significance level.
30
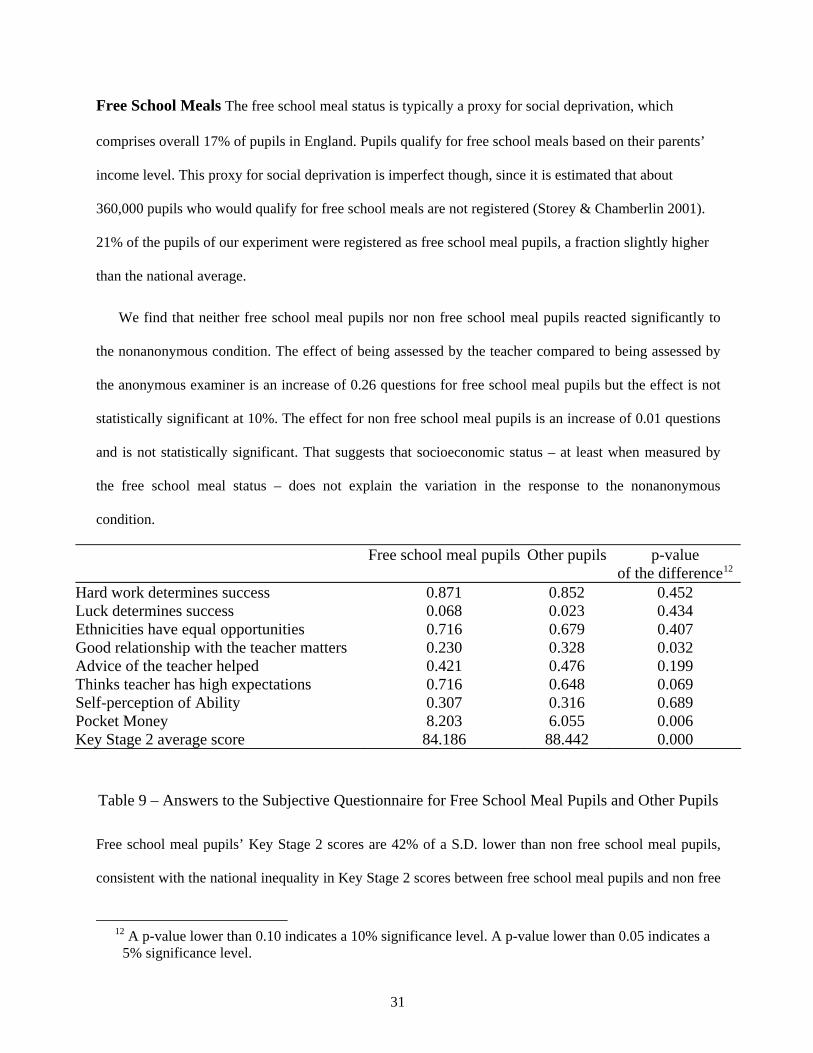
Free School Meals The free school meal status is typically a proxy for social deprivation, which
comprises overall 17% of pupils in England. Pupils qualify for free school meals based on their parents’
income level. This proxy for social deprivation is imperfect though, since it is estimated that about
360,000 pupils who would qualify for free school meals are not registered (Storey & Chamberlin 2001).
21% of the pupils of our experiment were registered as free school meal pupils, a fraction slightly higher
than the national average.
We find that neither free school meal pupils nor non free school meal pupils reacted significantly to
the nonanonymous condition. The effect of being assessed by the teacher compared to being assessed by
the anonymous examiner is an increase of 0.26 questions for free school meal pupils but the effect is not
statistically significant at 10%. The effect for non free school meal pupils is an increase of 0.01 questions
and is not statistically significant. That suggests that socioeconomic status – at least when measured by
the free school meal status – does not explain the variation in the response to the nonanonymous
condition.
Free school meal pupils Other pupils p-value of the difference12 Hard work determines success 0.871 0.852 0.452 Luck determines success 0.068 0.023 0.434 Ethnicities have equal opportunities 0.716 0.679 0.407 Good relationship with the teacher matters 0.230 0.328 0.032 Advice of the teacher helped 0.421 0.476 0.199 Thinks teacher has high expectations 0.716 0.648 0.069 Self-perception of Ability 0.307 0.316 0.689 Pocket Money 8.203 6.055 0.006 Key Stage 2 average score 84.186 88.442 0.000
Table 9 – Answers to the Subjective Questionnaire for Free School Meal Pupils and Other Pupils
Free school meal pupils’ Key Stage 2 scores are 42% of a S.D. lower than non free school meal pupils,
consistent with the national inequality in Key Stage 2 scores between free school meal pupils and non free
12 A p-value lower than 0.10 indicates a 10% significance level. A p-value lower than 0.05 indicates a
5% significance level.
31
school meal pupils (Kramarz et al. 2009, Kramarz et al. 2010). Free school meal pupils think less often
that the advice of the teacher helped and they believe that the teacher has higher expectations.
Interestingly, free school meal pupils get substantially more pocket money – nearly £2 more per week –
and therefore may be responding less to the incentives that we provide in the experiment. We can only
speculate that parents may be transferring more of the management of day-to-day finances to their child.
In the final subsection of this analysis, we look at the effects for free school meal pupils of different
ability levels.
We need to reconcile the finding on low ability pupils with the finding on free school meal pupils. We
did not find that free school meal pupils reacted differently in the nonanonymous condition. free school
meal pupils are more likely to have lower Key Stage 2 scores however, and we therefore look more finely
at the effect of the nonanonymous condition for free school meal pupils of different ability levels. For this
purpose, we estimated the effect of ability separately for free school meal pupils and for non free school
meal pupils. As before, partitioning the ability distribution into 3 parts or more did not make a difference
in the main finding. Overall, we find that ability matters independently of the free school meal status, and
that free school meal pupils do not have a different behaviour than other pupils, even after controlling for
ability.
Male teachers’ Effects and High-Ability Pupils’ Effects The design of the experiment did not
include the randomisation of the assignment of teachers to pupils, and this is a very difficult feature to
implement in practice.13 Thus we use tests here to show that our effect of male teachers does not come
from the fact that male teachers are more often in classrooms with higher-ability pupils and male pupils.
Male teachers teach in classrooms with higher-ability pupils. The average Key Stage 2 score of pupils
with male teachers is 87.8 in the experiment, and the average Key Stage 2 score of pupils with a female
teachers is 86.0 in the experiment. We therefore need to disentangle the male teacher effect from the high-
13 In the U.S. project STAR was initially intended as an experiment where the assigment of students to
classroom size and teachers was random, but Hanushek (2003) points out that randomisation was not
32
ability pupil effect. To do that, we split the sample into two subsamples: the subsample of schools with a
male teacher in the treatment group, and the subsample of schools with a female teacher in the treatment
group. We then estimated the effect interacting the treatment with the three thirds of the Key Stage 2 score
distribution (see Appendix B).
Key Stage 2 Key Stage 2 Key Stage 2 Lower Third Middle Third Upper Third Effect on subset with 0.819 0.588 0.652 a male teacher (0.322) (0.408) (0.394) Effect on on subset with -0.492 -0.043 0.826 a female teacher (0.306) (0.329) (0.392)
Standard errors in brackets. *: significant at 10% **:significant at 5%
Table 10 - Effects for ability × teacher gender subsets
Interestingly, the effect of being graded by the male teacher is around 0.6 of a question regardless of the
Key Stage 2 score. For the subset with a female teacher, we observed the expected effect: stronger effects
for higher ability pupils. 0.8 of a question is a treatment effect very close to the treatment effect we
estimated with the overall population. The effect of being graded by a female teacher when in the middle
third of the Key Stage 2 distribution is -0.043, smaller, as expected, than the treatment effect when
considering the sample with all teacher genders (0.404, Table 7).
5 Policy Implications
5.1 Male Teachers
There have been continued calls in the general media for an increase in the representation of male teachers
in elementary and secondary education14. There are more female teachers in primary and secondary
achieved. Indeed, randomisation faces a number of practical obstacles and was not feasible at this scale.
14 The media frequently report on the lower fraction of male teachers in education, e.g. The Independent, “Male Teachers are in the Minority in the Classroom”, March 26, 2009, The Daily
33
education, only 15% of male teachers in primary education and around 44% of male teachers in secondary
schools.
The common narrative for the need for male teachers is that male teachers provide role models for
boys, who have lower test scores and are more likely to drop out. In the state of Texas in the United
States, an experiment – the project STAR – has showed that having a same-gender teacher benefits
students through higher test scores in elementary education (Dee 2007). In England, educational research
on teachers’ gender effects is mixed; while Hutchings, Carrington, Francis, Skelton, Read & Hall (2008)
suggests that there is no “role model” effect in England, Skelton, Carrington, Francis, Hutchings, Read &
Hall (2009) states that teachers’ gender matters for year 3 pupils. Moreover, the gender of teachers was
not described as a determinant of the gender gap in a recent report of the Department of Education
(Gender and Education: The Evidence on Pupils in England 2007).
One of the most significant results featured in this experiment is the positive effect of male teachers on
effort. Pupils taught by a male teacher chose nearly half a question more than pupils taught by a female
teacher. Given that the standard deviation of the number of questions purchased is about 3.2 questions,
this is a 15% of a standard deviation increase in questions purchased. We showed that male teachers foster
self-esteem, perceptions of fairness, but that they are no more lenient than other teachers. This positive
effect seems to be affecting the average student regardless of his/her gender. We have argued that this
effect is consistent and appears for every male teacher of our experiment. These findings with such a level
of detail are new and significant. The gender of the teacher is correlated with education, experience, and
the subject area, so our effect is for the average male teacher.
One very interesting study that merged a subset of the National Pupil Database to teacher
characteristics did not find a significant effect of the teacher’s gender on achievement controlling for pupil
fixed effects and school fixed effects (Slater, Davies & Burgess 2009). This is the first study to look at
teacher quality using a large number of value-added data. However, the study’s authors acknowledge that
Telegraph, “More than a quarter of England’s primary schools have no male teachers”, March 22, 2009, The Guardian, “Under-fives have almost no male teachers”, August 7, 2008, BBC News,
34
using value-added data is difficult (Rothstein 2010): test scores are noisy, and only two coefficients are
significant among all teacher characteristics15. A field experiment is likely to be necessary to uncover the
mechanisms of classroom dynamics. Furthermore, analysis of pupils’ behaviour at a large scale has not
been carried out in Slater et al. (2009), and it may be important as we find effects of male teachers on
motivation and trust.
There are multiple explanations for the relative scarcity of male teachers in primary and secondary
education. Teaching is traditionally seen as a female occupation16. The most significant determinant of the
gender composition of new hires is relative wages. Small changes in relative wages may increase the
fraction of male candidates (Chevalier, Dolton & McIntosh 2007). A change in the wage differential
between teaching and other occupations increases the probability of becoming a teacher by 3.7 percentage
points for males and by 1.7 percentage points for females. Also, increases in relative wages increase the
quality of candidates as measured by their degree attainment and their A-level attainment.
5.2 Classroom Interactions Reinforce Inequalities
Another important finding is that high ability pupils tend to exert more effort, invest more in the
classroom than in a standardised examination setting. The teacher-pupil relationship is key to the progress
of high-ability pupils. On the other hand we find that lower-ability pupils do not exert more or less effort
when confronted to the teacher in the classroom. It maybe the case that the teacher is able to increase the
motivation of high-ability pupils – as measured by prior Key Stage 2 scores – or that high-ability pupils
are motivated by a different set of reasons than short-run monetary incentives; they matter less than their
willingness to signal ability or hard work.
This classroom dynamic is reinforcing inequalities. High ability pupils buy 0.75 question more in the
nonanonymous condition, whereas low-ability pupils do not change their behaviour significantly between
“Male teachers ’help boys behave”, July 30, 2007).
the first and the second round. Our experiment lasts only 90 minutes, but over time, these small
differences could lead to substantial inequalities between high- and low-ability pupils.
Interestingly, whereas most of the literature on pupils’ inequalities looks at the distribution of
educational inputs across classrooms and schools, the results of the experiment show that inequalities can
also grow within classrooms. In each of the classrooms of our experiment had low- and high-ability
pupils. Hence teachers are not necessarily equally effective for all pupils regardless of their prior
ability.This challenges the idea that it is possible to rank teachers by their estimated quality. This is a
finding that should inspire more research on estimating not only which teachers are good at raising value-
added on average but also which teachers are good at raising the achievement of all their pupils.
6 Conclusion
What induces trust, risk-taking, and confidence in the classroom? We designed an innovative behavioural
economics experiment that involved 1,200 pupils across 29 schools in Manchester, London, and
Liverpool. The experiment asked pupils to purchase questions using a small endowment of £2. Each
question cost 20p, a right answer doubled the 20p to 40p, and a wrong answer led to 0p. We looked at
pupils’ choices in two different conditions: when they are assessed anonymously by an external examiner
and when they are assessed nonanonymously by their usual teacher. Comparing their choices in these two
conditions tells us how pupils perceive their teachers.
The experiment shed new light on classroom dynamics. Although, on average, teachers do not induce
more confidence, trust or risk-taking behaviour than an external examiner, the experiment showed that
male teachers are beneficial. In our experiment, male teachers were more effective in raising effort for
both male and female pupils; pupils had higher self-esteem and better perceptions of their teachers’
16 There is an extensive literature on gender dynamics in schools, arguing that male teachers do indeed
need to adapt to a feminised professional environment. See Decorse & Vogtle (1997) and Roulston & Mills (2000).
36
fairness in grading. In turn, perceptions of fairness and the effectiveness of hard work induced investment
in the table.
We also show that high ability pupils are more likely to exert effort when assessed by the teacher than
when assessed by the external examiner. Low ability pupils did not significantly change their behaviour
when assessed by the teacher. Thus, overall, teacher-student interactions lead to a reinforcement of
inequalities between low-achieving and high-achieving pupils throughout the school year. High-ability
pupils were not treated more favorably however: their payoff is identical when assessed by the teacher and
when assessed by the anonymous examiner.
Surprisingly, contrary to some theoretical literature that links ethnicity, gender, and socioeconomic
status to self-fulfilling beliefs about performance, we do not find that any of these characteristics matter.
Ethnicity, gender, and socioeconomic status explain very little of pupils’ investment and effort. free
school meal pupils and minority pupils did not significantly react to the nonanonymous condition, even
after controlling for pupil ability.
37
References
Aronson, J., Lustina, M. J., Good, C. & Keough, K. (1998), ‘When white men can’t do math, necessary
and sufficient factors in stereotype threat’, Journal of Experimental Social Psychology pp. 1–18.
Benabou, R. & Tirole, J. (2003), ‘Intrinsic and extrinsic motivation’, Review of Economic Studies70, 489–
520.
Bettinger, E. (2008), ‘Paying to learn: The effect of financial incentives on elementary school test scores’,
CESifo/PEPG Conference pp. 1–40.
Blascovich, J., Spencer, S. J., Quinn, D. & Steele, C. (2001), ‘African americans and high blood pressure:
The role of stereotype threat’, Psychological Science12(3), 225–229.
Chevalier, A., Dolton, P. & McIntosh, S. (2007), ‘Recruiting and retaining teachers in the uk: An analysis
of graduate occupation choice from the 1960s to the 1990s’, Economica74(69-96), 1–28.
de Fraja, G., Oliveira, T. & Zanchi, L. (2010), ‘Must try harder: Evaluating the role of effort in
educational attainment’, The Review of Economics and Statistics92(3), 577–597.
Dearden, L., Emmerson, C., Frayne, C. & Meghir, C. (2009), ‘Conditional cash transfers and school
dropout’, The Journal of Human Resources44(4).
Deci, E. L., Koestner, R. & Ryan, R. M. (2001), ‘Extrinsic rewards and intrinsic motivation in education:
Reconsidered once again’, Review of Educational Research71(1), 1–27.
Decorse, C. J. B. & Vogtle, S. P. (1997), ‘In a complex voice: The contradictions of male elementary
teachers’ career choice and professional identity’, Journal of Teacher Education48.
Dee, T. (2007), ‘Teachers and the gender gaps in student achievement’, Journal of Human Resources .
Dominitz, J. & Manski, C. F. (1996), ‘Eliciting student expectations of the returns to schooling’, The
Journal of Human Resources .
Fryer, R. (2010), ‘Financial incentives and student achievement: Evidence from randomized trials’, NBER
Working Paper Series .
38
Gender and Education: The Evidence on Pupils in England (2007), Department for Education and Skills
pp. 1–134.
Gibbons, S. & Chevalier, A. (2007), ‘Teacher assessments and pupil outcomes’, Centre for the Economics
of Education Working PaperDecember.
Hanushek, E. (2003), ‘The failure of input-based schooling policies’, Economic Journal113(485), F64–
F98.
Hoff, K. & Pandey, P. (2005), ‘Opportunity is not everything: How belief systems and mistrust shape
responses to economic incentives’, Economics of Transition13(3), 445–472.
Hoff, K. & Pandey, P. (2006), ‘Discrimination, social identity, and durable inequalities’, American
Economic Review96(2), 206–211.
Hutchings, M., Carrington, B., Francis, B., Skelton, C., Read, B. & Hall, I. (2008), ‘Nice and kind, smart
and funny: What children like and want to emulate in their teachers’, Oxford Review of
Education34(2), 135–157.
Jussim, L. & Harber, K. D. (2005), ‘Teacher expectations and self-fulfilling prophecies: Knowns and
unknowns, resolved and unresolved controversies’, Personality and Social Psychology
Review9(2), 131–155.
Kramarz, F., Machin, S. & Ouazad, A. (2009), ‘What makes a test score? the respective contributions of
pupils, schools and peers in achievement in english primary education’, Center for the Economics of
Education Working PaperJanuary.
Kramarz, F., Machin, S. & Ouazad, A. (2010), ‘Using compulsory mobility to identify the relative
contribution of pupils and schools to test scores’, pp. 1–58.
Lavy, V. (2008), ‘Do gender stereotypes reduce girls’ or boys’ human capital outcomes? evidence from a
natural experiment’, Journal of Public Economics pp. 1–23.
Machin, S. & McNally, S. (2008), ‘The literacy hour’, Journal of Public Economics92, 1441–1462.
Ouazad, A. (2008), ‘Assessed by a teacher like me: Race, gender, and subjective evaluations’, Centre for
the Economics of Education Working PaperDecember.
39
Rosenthal & Jacobson (1968), ‘Pygmalion in the classroom’, The Urban Review .
Rothstein, J. (2010), ‘Teacher quality in educational production: Tracking, decay, and student
achievement’, Quarterly Journal of Economics .
Roulston, K. & Mills, M. (2000), ‘Male teachers in feminised teaching areas: Marching to the beat of the
men’s movement drums? ’, Oxford Review of Education26(2), 221–237.
Skelton, C., Carrington, B., Francis, B., Hutchings, M., Read, B. & Hall, I. (2009), ‘Gender ’matters’ in
the primary classroom: pupils’ and teachers’ perspectives’, British Educational Research
Journal35(2), 187–204.
Slater, H., Davies, N. & Burgess, S. (2009), ‘Do teachers matter? measuring the variation in teacher
effectiveness in england’, CMPO Working Paper09(212).
Stannard, J. & Huxford, L. (2007), ‘The literacy game: The story of the national literacy strategy’,
Routledge, London .
Steele, C. M. & Aronson, J. (1995), ‘Stereotype threat and the intellectual test performance of african
americans’, Journal of Personality and Social Psychology69(5), 797–811.
Storey, P. & Chamberlin, R. (2001), ‘Improving the take up of free school meals’, DfEE Research Report
RR270 pp. 1–40.
40
A Appendix: Description of the Experiment
A.1 Detailed Timeline
1. We determine randomly which experimenters are assigned to which classroom.
2. Pupils are assigned a random number.
3. Pupils sit at the table corresponding to the number.
4. The presenter introduces the experiment to pupils. (See instructions below).
5. Pupils answer the example definition.
6. The presenter gives one among many possible answers for the example definition.
First round
7. Pupils choose how many questions they would like to purchase, from no question to 10 questions.
8. Once this choice is made, pupils can open the envelope and have 20 minutes to provide answers.
9. Envelopes are collected.
Second round
10. Pupils get a second envelope.
11. In the nonanonymous group, the presenter states that questions will be corrected by their teacher.
Pupils confirm that they know the teacher and are asked to confirm the subject that he/she teaches.
12. In the nonanonymous group, pupils write down their name and their teacher’s name on the
envelope.
13. Pupils choose how many questions they would like to purchase, from no question to 10 questions.
41
14. Once this choice is made, pupils can open the envelope and have 20 minutes to write down their
answers.
15. Envelopes are collected.
16. Pupils can leave the classroom.
17. The teacher/the external marker grades the papers.
18. Payoffs are calculated and distributed in envelopes bearing the pupil’s number.
A.2 Material - Envelopes
There were two kinds of envelopes: envelopes for the anonymous condition, without the name of the pupil
nor the name of the teacher, and envelopes for the nonanonymous condition where the pupils would write
down both names. Here is the envelope of the nonanonymous condition. The middle of the envelope gives
an example question. In the first round, the example question was about defining “archaeologist”. In the
second round, we chose not to use the example. The picture of the envelope has been rescaled to fit the
page.
42
43
B Appendix: Robustness Checks
B.1 Power calculations
On average, pupils invest no more when they are assessed by their teacher versus when they are assessed
by the external examiner. The effect is non significant at the 10% level, the point estimate is about 0.04
question. Section 4 has shown that this masks a considerable amount of variation.
The number of schools of the experiment was chosen to detect a reasonable effect of nonanonymous
grading on questions purchased. To determine before the experiment how many observations we needed,
we generated a series of datasets with a given number n of pupils and a given effect δ of the
nonanonymous condition. We then estimated the effect of the nonanonymous condition as if we ignored
the value of δ. The coefficient was significant when the number of pupils n was sufficiently large.
Results indicate that with n=1,200 pupils, the minimum effect that can be detected is about 0.24 of a
question. With a success rate of about 50%, this means a corresponding payoff of 2.4p. With half the
number of observations, n=600, the minimum detectable effect would have been 0.35 question.
Finally, notice that using two rounds, the first round being in the anonymous condition and the second
in the nonanonymous condition in the treatment group, significantly increases the power of our estimates.
Relying on an experiment with only one round would have led to powers at least twice as large as the
original. Thus the two-round designs combines the advantage of looking at changes for a given child and
the advantage of improved statistical power.
B.2 Randomisation of the treatment
We determined what classrooms would be treated before we saw classrooms. Headteachers were not
informed of which classroom would be the treatment group. Hence, we expect the assignment of the
treatment and the control to be random. This is what a simple test confirms. Demographics are not
significantly different between the treatment and the control group.
44
Treatment group Control group p-value of the difference Free school meal 51.2% 54.7% 0.618 Key Stage 2 score 87.27 86.46 0.361 White 68.2% 65.9% 0.524 Male 51.3% 54.7% 0.352
Table B1 - Randomisation of the Treatment
B.3 Experimenter effects
If the assignment of pupils to the presenters is truly random, there should be no difference in the number
of questions chosen in the first round, where both groups are in the anonymous condition. Failure of the
randomisation of the assignment of presenters to groups may lead to spurious results if specific presenters
introduce the experiment in classrooms with male teachers for instance. Charisma, the tone of the voice,
could affect pupils’ engagement and the number of questions they buy.
To check that, we estimated the effect of the treatment group considering only the first round. A
significant effect would invalidate our methodology. The effect is not significant when considering the
overall sample, when considering the sample of schools with male teachers, or when considering the
sample of pupils of the lower Key Stage 2 third, and the middle Key Stage 2 third.
Overall School with School with KS2 KS2 KS2 Sample Male Teacher Female Teacher Lower Third Middle Third Upper ThirdEffect of the 0.130 -0.167 0.302 0.481 -0.004 -0.884 treatment group (0.173) (0.289) (0.215) (0.365) (0.328) (0.412)
Table B2 – Placebo Test: Effect of the treatment Considering Round 1 only
Surprisingly, we find that the effect of the treatment group is significant for the upper third of Key Stage 2
test scores. To check whether this could explain the effect we obtain on higher ability pupils, we estimated
the treatment effect on the second round only. The effect is not likely to explain the result as there is no
significant difference between round 1 and round 2 effects of the treatment group.
45
C Appendix: Econometrics
C.1 Regressions
To get our effect of our interest, we performed a regression instead of the estimator described in the body
of the text. The regression framework allows us to get more precise estimates and gives confidence
intervals for the estimates.
We regress the number of questions chosen in each round t=1,2 for each pupil i on the effect of the
2nd round, the effect of being in the treatment group, and the effect of nonanonymity (i.e. second round of
the treatment group).
ti
iti
titi
uTreatmentRoundRoundQuestions
,
,
,,
22
εδ
α
++×+
=
where i is the pupil, t=1,2 is the round, is a dummy variable for the 2nd round, is
a dummy variable for the treatment group,
tiRound ,2
Round
tiTreatment ,
tiTreatment ,2× is a dummy for the treatment group in
the 2nd round. ui is a fixed effect, ti ,ε is the residual of this OLS regression. The coefficient of interest is
δ, i.e. the effect of being nonanonymously assessed on the number of questions chosen. α measures
pupils’ learning in-between the first and the second round, i.e. how pupils react after having seen the first
round of 10 questions. The fixed effect ui increases the power of the estimations. Since the treatment is
randomly allocated, omitting the fixed effect ui does not significantly affect the point estimate of δ.
Without the fixed effect ui, the estimator of δ is exactly the one that is presented in the body of the report.
46
When estimating the effect of the treatment for different types of teachers, we also used a regression
framework with interactions and fixed effects to increase the power of the estimates. For instance, the
following regression estimates the effect of the treatment for male teachers and for female teachers
tii
tifemale
timale
titi
uTeacherFemaleTreatmentRound
TeacherMaleTreatmentRoundRoundQuestions
,
,
,
,,
22
2
εδδ
α
++××+××+
=
estimates the effect of nonanonymity δmale when assessed by a male teacher and the effect of
nonanonymity δfemale when assessed by a female teacher. This regression identifies δmale and δfemale as
long as learning between round 1 and round 2 is identical in groups assessed by a male teacher and in
groups assessed by a female teacher. This is a reasonable assumption since teachers play a role in the
experiment in the second round only.
However, the assumption may not hold when considering differential effects for pupils of different
ability levels. Indeed, low-ability pupils are likely to react differently after the first round. They are likely
to increase the number of questions purchased by a lower amount than higher ability pupils. To account
for that effect, we estimated the effect using matching on Key Stage 2 scores. This allows pupils of
different ability levels to react differently to the first round and identifies the effect of interest.
To understand that point, write TE(y) the treatment effect of an individual with test score y. And notice
that the following observable quantity identifies the treatement for an individual with test score y: