28
Purchasing Update September 17, 2012

Purchasing Update September 17, 2012
Topics for Discussion
FY 2012 Accomplishments
FY 2013 Plans

DOAS Strategic Goals
Build customer relationships
Demonstrate our value
Take care of our employees

Customer Relationships
Annual survey of Agency Purchasing Officers and College/University Purchasing Officers
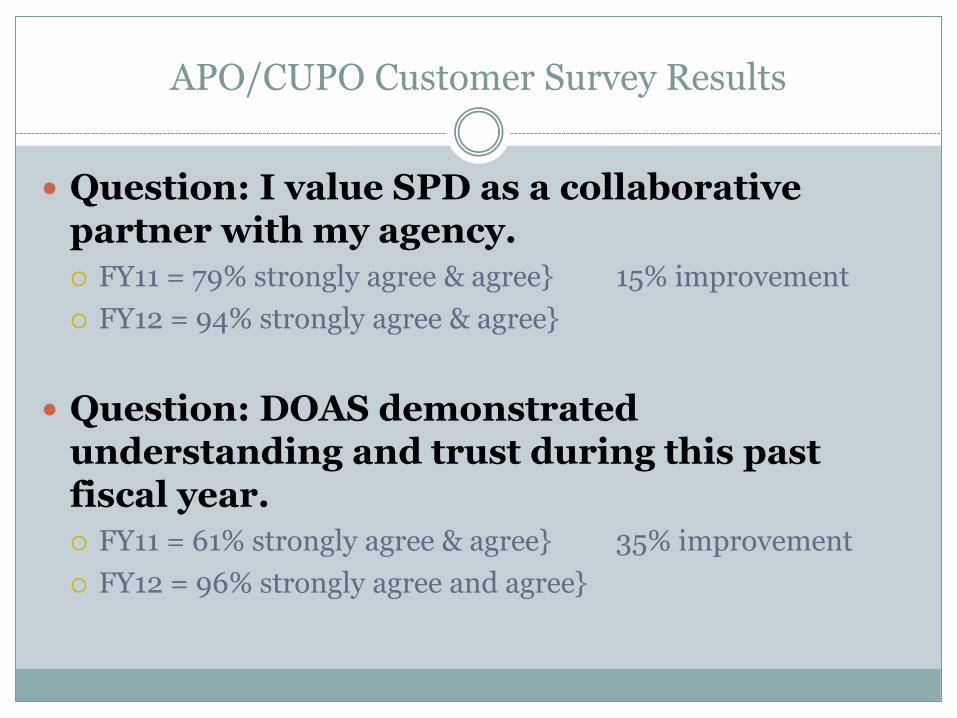
APO/CUPO Customer Survey Results
Question: I value SPD as a collaborative partner with my agency.
FY11 = 79% strongly agree & agree} 15% improvement
FY12 = 94% strongly agree & agree}
Question: DOAS demonstrated understanding and trust during this past fiscal year.
FY11 = 61% strongly agree & agree} 35% improvement
FY12 = 96% strongly agree and agree}
Update on Legislation
HB 86
$25,000 non-competitive purchases (3 years only)
New definition of Georgia small business
($30M or 300 employees)
Demonstrate our Value
FY 2012 Re-bid of Statewide Contracts
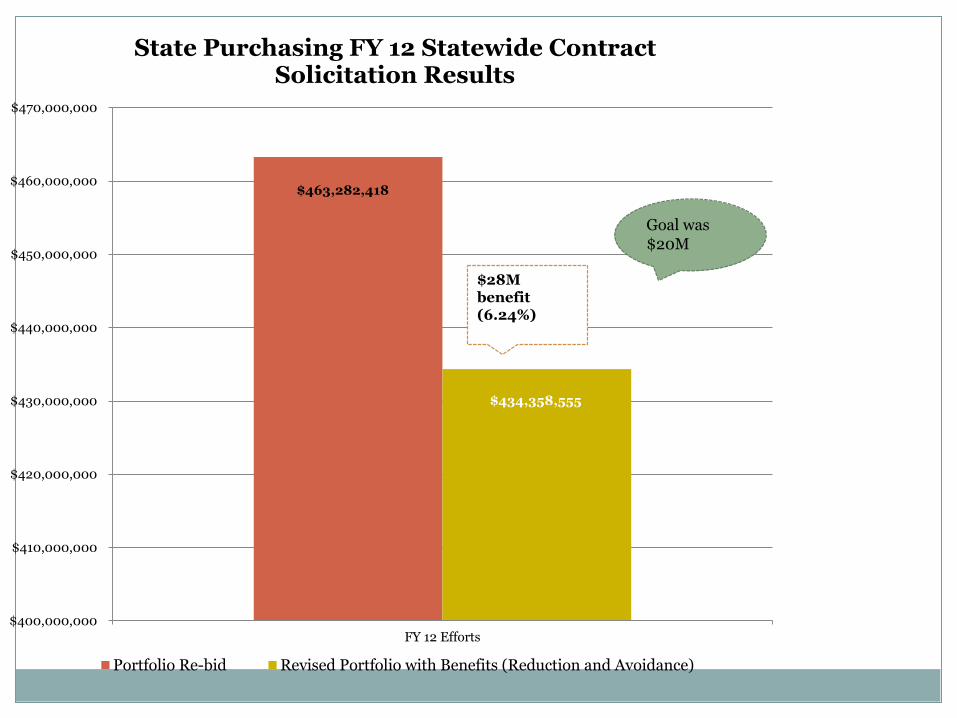
$463,282,418
$434,358,555
$400,000,000
$410,000,000
$420,000,000
$430,000,000
$440,000,000
$450,000,000
$460,000,000
$470,000,000
FY 12 Efforts
State Purchasing FY 12 Statewide Contract Solicitation Results
Portfolio Re-bid Revised Portfolio with Benefits (Reduction and Avoidance)
$28M benefit (6.24%)
Goal was $20M Goal was $20M

$163,792,677 , 35%
$244,004,404 , 53%
$55,485,336 , 12%
FY 12 Original Pipeline Categories
Consortia Non-Consortia New
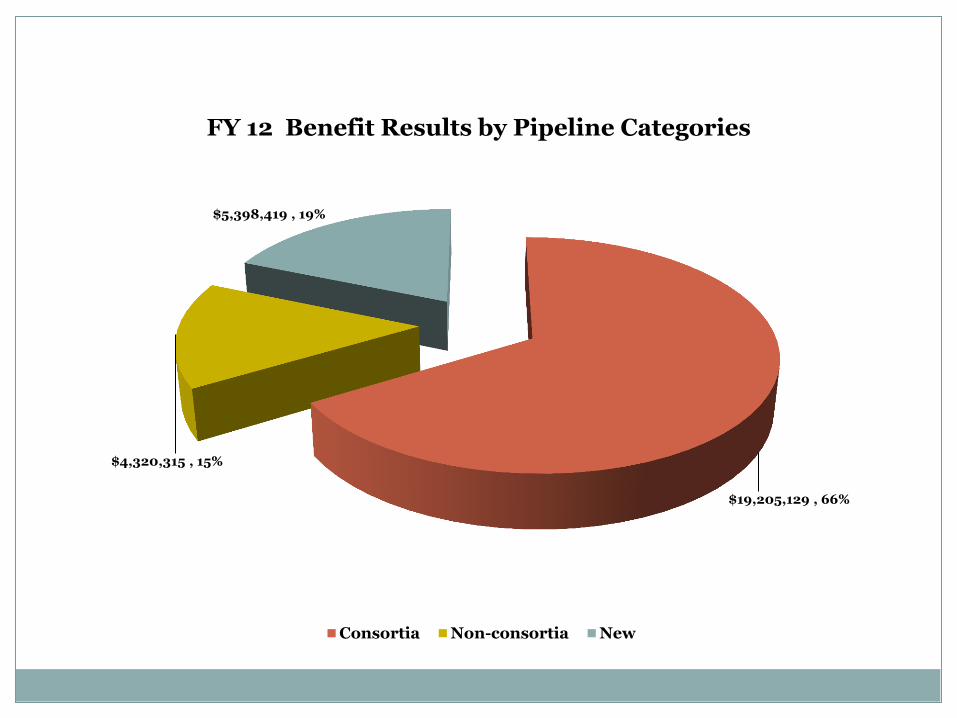
$19,205,129 , 66%
$4,320,315 , 15%
$5,398,419 , 19%
FY 12 Benefit Results by Pipeline Categories
Consortia Non-consortia New
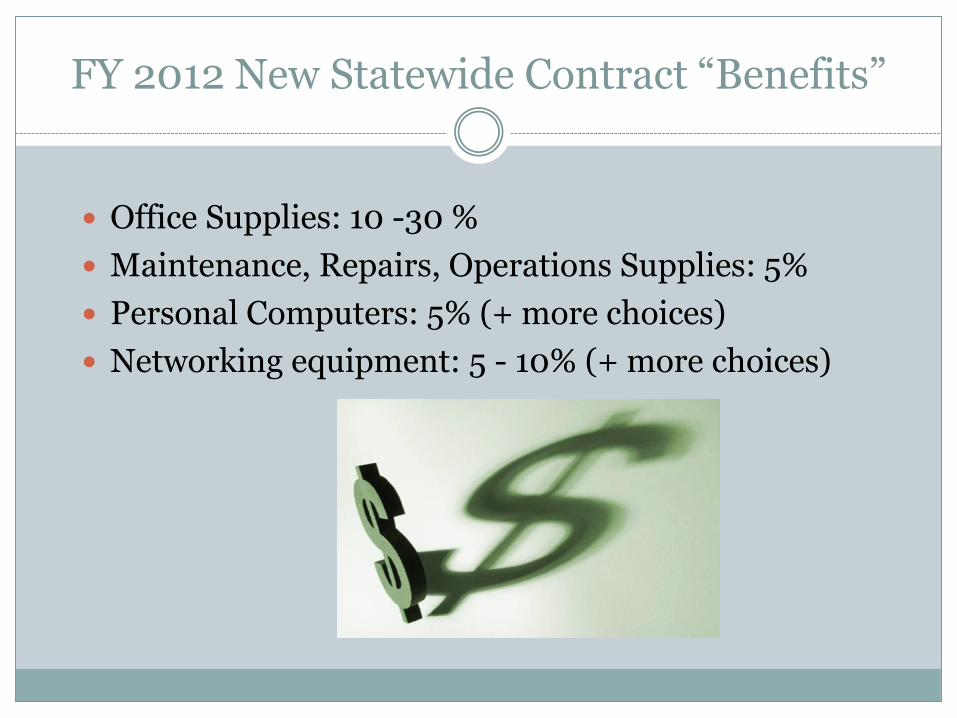
FY 2012 New Statewide Contract “Benefits”
Office Supplies: 10 -30 %
Maintenance, Repairs, Operations Supplies: 5%
Personal Computers: 5% (+ more choices)
Networking equipment: 5 - 10% (+ more choices)
Value: Purchase Order Reviews
Reviews are completed every two years
Most Common Issues:
Failure to use Statewide Contracts (mandatory)
Incorrect Purchasing Type Codes
Incorrect NIGP codes

Value: P Card Review Results
Reviews are completed every year
Most Common Issue:
Failure to use Statewide Contracts (mandatory)
Failure to get a waiver from SPD
[No evidence of fraud or abuse]
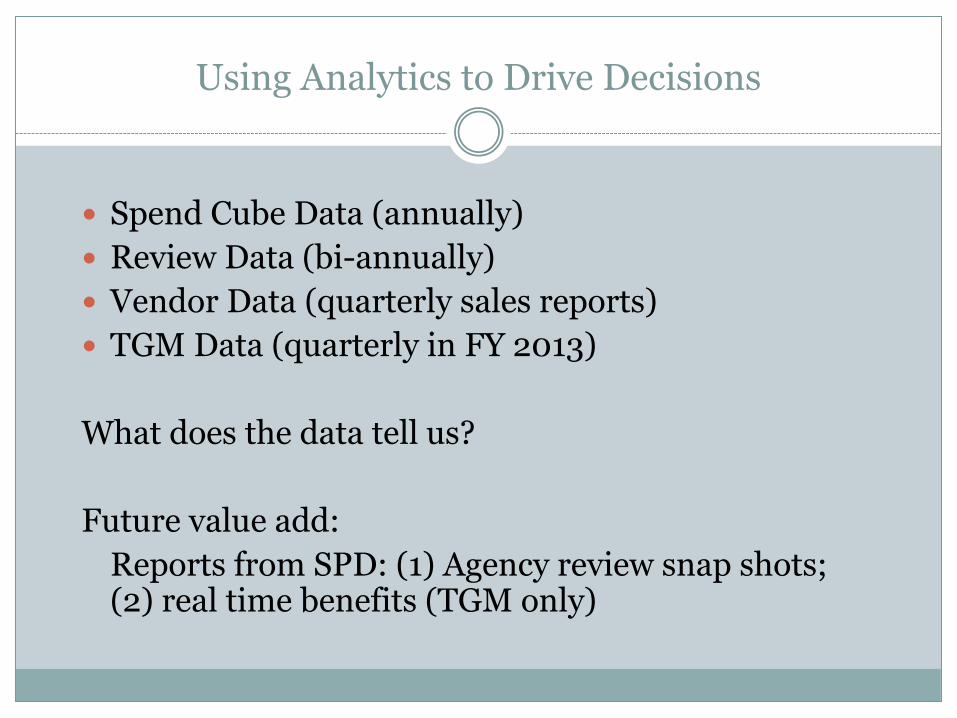
Using Analytics to Drive Decisions
Spend Cube Data (annually)
Review Data (bi-annually)
Vendor Data (quarterly sales reports)
TGM Data (quarterly in FY 2013)
What does the data tell us?
Future value add:
Reports from SPD: (1) Agency review snap shots; (2) real time benefits (TGM only)

Spend Cube Data Sources
SAO PeopleSoft Data
BOR PeopleSoft Data
DOL Data
BOA P Card Data

Multi-dimensional Spend Cube
Rpt • Spend by SWC vs.
off SWC
Rpt • Spend by Vendor
Rpt • Spend by NIGP
Code
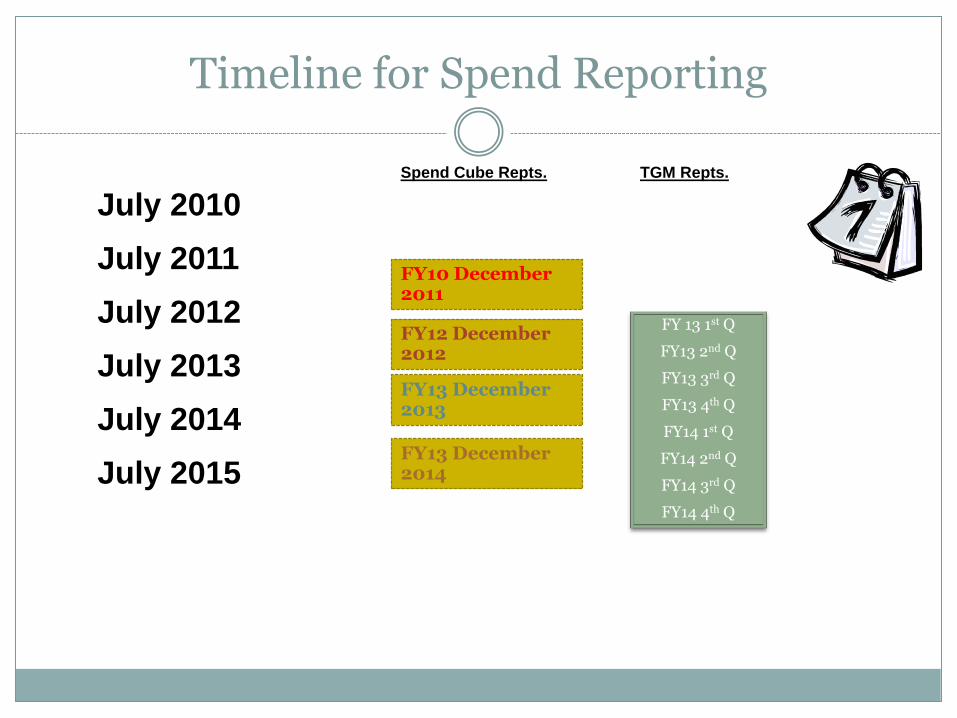
Timeline for Spend Reporting
July 2010
July 2011
July 2012
July 2013
July 2014
July 2015
FY10 December 2011
FY12 December 2012
FY13 December 2013
Spend Cube Repts. TGM Repts.
FY 13 1st Q
FY13 2nd Q
FY13 3rd Q
FY13 4th Q
FY14 1st Q
FY14 2nd Q
FY14 3rd Q
FY14 4th Q
FY13 December 2014

Next Steps
Validating FY 2011 spend amounts
Revised letters will be sent to agency heads on potential “benefits”
Build the FY 2012 spend data
Report on actual FY 2013 “real time” from Team Georgia Marketplace agencies
FY 2013 Projects
Fast track RFP for $25,001 - $250,000
FY13 Pipeline for Solicitations ($14M benefits)
Report on <$25K behavior
Pilot E Payables
Address TGM archiving and attachments with a new solution
TGM roll out with Technical College System

FY12 Initiatives Deferred
REBIDS
Software (Sept 12)
Expedited Mail Delivery (Sept 12)
ATV’s (Sept 12)
Bread & Cakes (Dec 12)
Guns & Ammunition (Dec 12)
Natural Gas, Firm Service (June 13)
Natural Gas, Interruptible Service (June 13)
Administrative Vehicles (Dec 12)
Furniture (May 13)
Herbicides (June 13)
Biological Supplies (Dec 12)
NEW
Printing Services (TBD)
Project Based Audio Visual (June 13)
Represents $173M in Spend / $6.3M Benefits
FY13 Pipeline & Benefits
FY13 Initiatives
REBIDS
Auto Rental (Nov 12)
Equipment Maintenance Mgmt Service (Dec 12)
Temp Staffing , Clerical & Lite Indus (Apr 13)
Temporary Staffing, IT (June 13)
Document Solutions, Capitol Hill (June 13)
Document Solutions, Statewide (June 13)
Pursuit Vehicles (June 13)
Influenza Vaccine
Generic Drugs
NEW
Network Equipment ,Specialized Products (Feb 13)
Uninterrupted Power Supply (May 13)
Security Services, Armed & Unarmed (May 13)
Electronic Monitoring Devices (May 13)
Network Equipment ,Refurbished (June 13)
Represents $200M in Spend / $7.7M Benefits
27 Initiatives: 20 Rebids & 7 New
9/24/2012
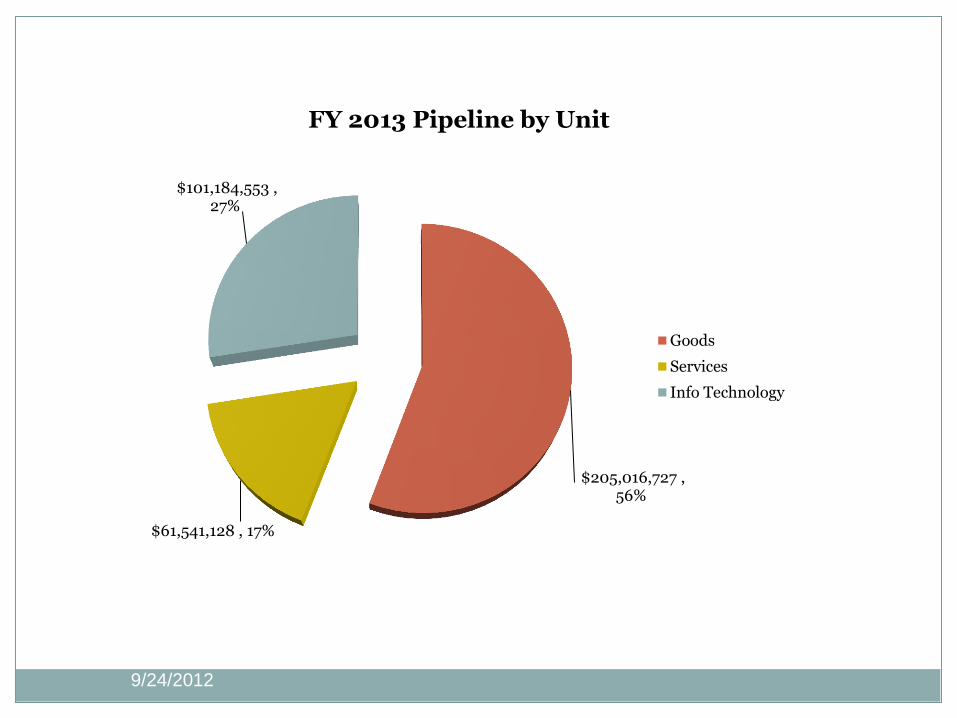
$205,016,727 , 56%
$61,541,128 , 17%
$101,184,553 , 27%
FY 2013 Pipeline by Unit
Goods
Services
Info Technology
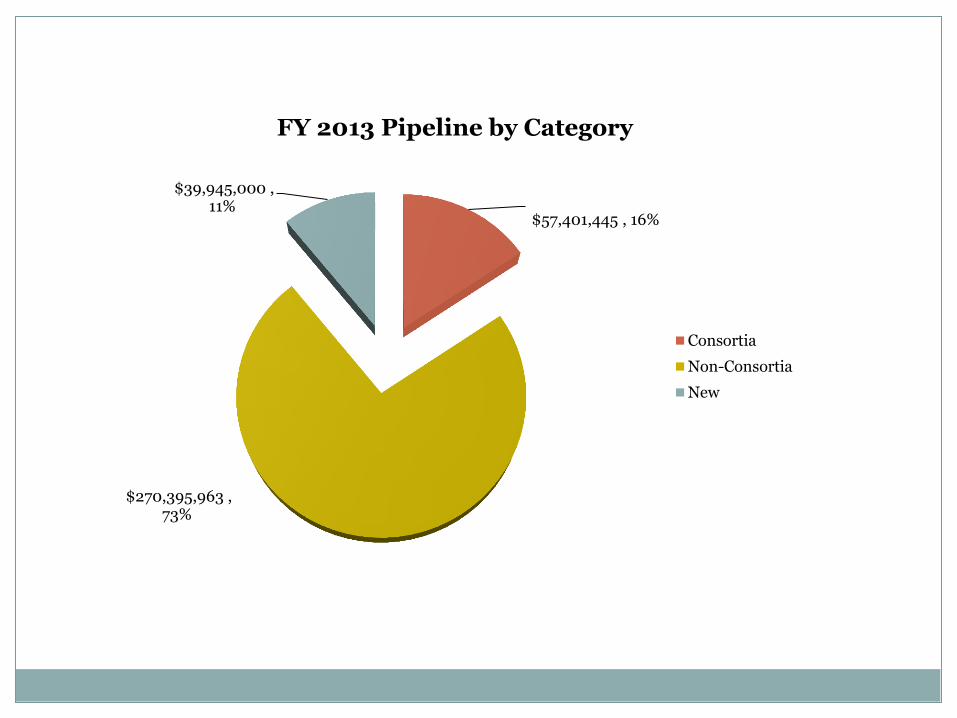
$57,401,445 , 16%
$270,395,963 , 73%
$39,945,000 , 11%
FY 2013 Pipeline by Category
Consortia
Non-Consortia
New
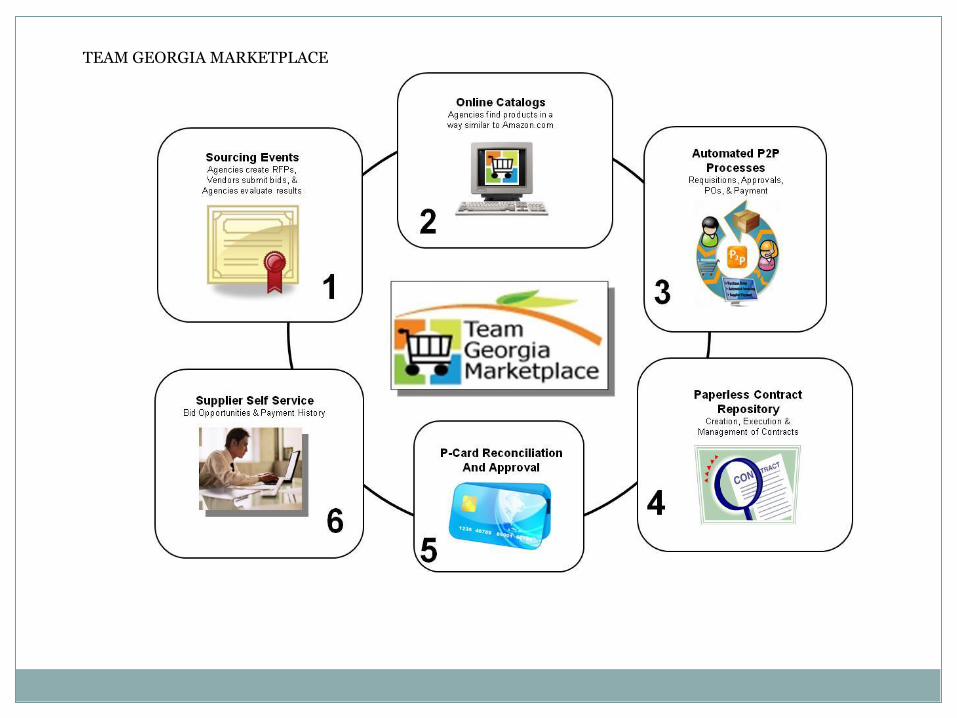
TEAM GEORGIA MARKETPLACE

Aug 31, 2011
Since Jan ‘09
FY2012
Oct 1 2011 to Jun 30, 2012
FY2013/2014
TCSG Roll Out
Agencies 24 agencies total 36 agencies total
(Add 12 agencies) 62 entities in total
(Add 25 tech
colleges
and 1 central
office) Users 4735 Approx 5200
(Estimate 500 added) Approx 8000 to 9000
(Estimate 4000
added)
Suppliers 25,000 30,000
(Estimate 5000 added)
35,000
(Estimate 5000 added)
Transactions
-Req. to PO
- RFx Posted
-RFx Responses
-Contracts
-Help desk Support
FY2011 Transactions
42,500
627
2,250
7,000
23,000 service requests
FY2012 Transactions
81,098
712
3,107
11,766
37,295
FY2013 Transactions
TEAM GEORGIA MARKETPLACE
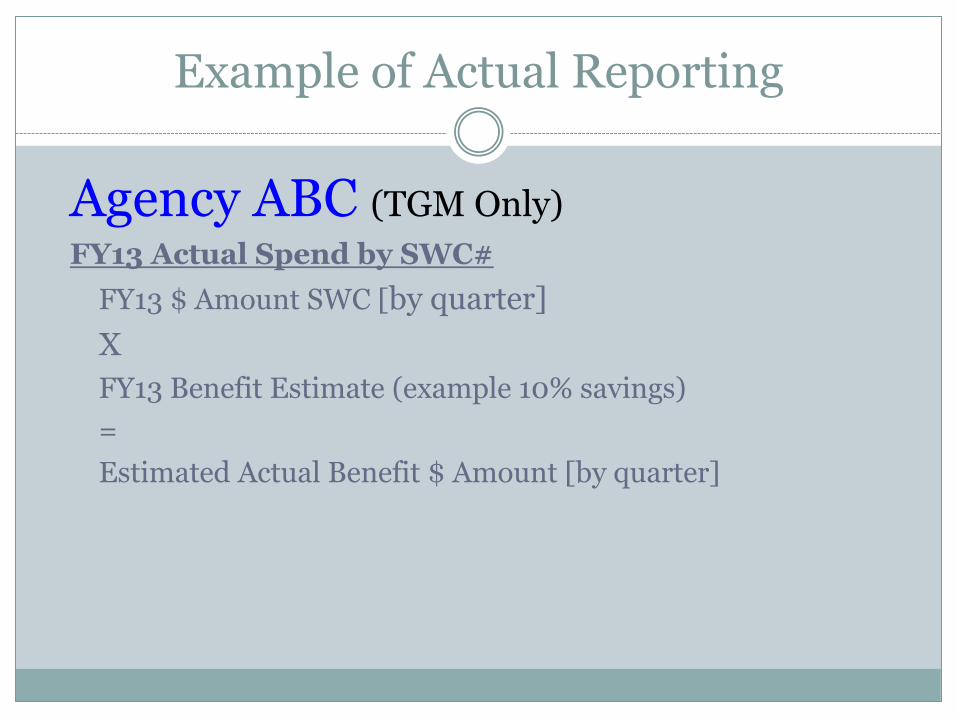
Example of Actual Reporting
Agency ABC (TGM Only)
FY13 Actual Spend by SWC#
FY13 $ Amount SWC [by quarter]
X
FY13 Benefit Estimate (example 10% savings)
=
Estimated Actual Benefit $ Amount [by quarter]
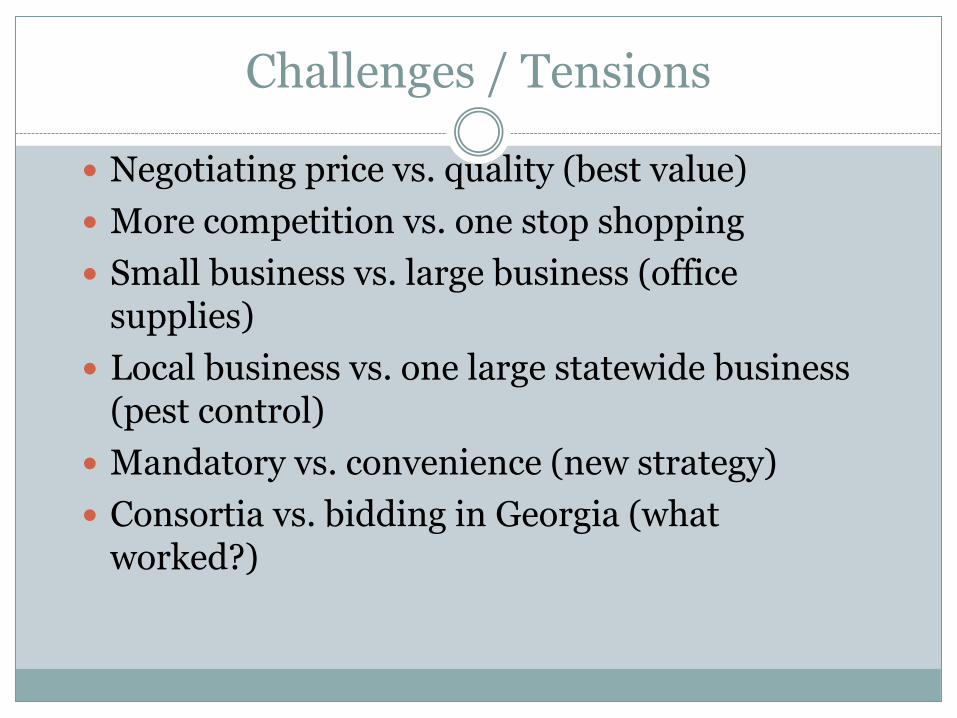
Challenges / Tensions
Negotiating price vs. quality (best value)
More competition vs. one stop shopping
Small business vs. large business (office supplies)
Local business vs. one large statewide business (pest control)
Mandatory vs. convenience (new strategy)
Consortia vs. bidding in Georgia (what worked?)
What I learned in one year
We under estimated the internal level of effort.
We still made the dollar amount “benefit” goal.
It is our job to provide the data to stakeholders.
Benefits do not equal budget cuts.
We are not perfect.
We need support for analytics resources and tools.

Questions


