Page 1
PUSHOVER ANALYSIS OF STEEL FRAMES
Thesis submitted in partial fulfilment of the requirements for the degree of
MASTER OF TECHNOLOGY
in
STRUCTURAL ENGINEERING
by
PADMAKAR MADDALA
DEPARTMENT OF CIVIL ENGINEERING
NATIONAL INSTITUTE OF TECHNOLOGY
ROURKELA, ORISSA-769008
May,2013
Page 2
PUSHOVER ANALYSIS OF STEEL FRAMES
Thesis submitted in partial fulfilment of the requirements for the degree of
MASTER OF TECHNOLOGY
in
STRUCTURAL ENGINEERING
by
PADMAKAR MADDALA
Roll No. 211CE2236
Under the guidance of
Prof.U.K.Mishra
DEPARTMENT OF CIVIL ENGINEERING
NATIONAL INSTITUTE OF TECHNOLOGY
ROURKELA, ORISSA-769008
May,2013
Page 3
NATIONAL INSTITUTE OF TECHNOLOGY
ROURKELA – 769 008, ORISSA
INDIA
CERTIFICATE
This is to certify that the thesis entitled “PUSHOVER ANALYSIS OF STEEL
FRAMES” submitted by Mr. PADMAKAR MADDALA in partial fulfilment of the
requirements for the award of Master of Technology Degree in Civil Engineering with
specialization in Structural Engineering at the National Institute of Technology Rourkela is
an authentic work carried out by him under my supervision.
To the best of my knowledge, the matter embodied in the thesis has not been submitted to
any Other University/Institute for the award of any degree or diploma.
Place: NIT Rourkela
Date: May 30, 2013
U.K.MISHRA
Associate Professor
Department of Civil Engineering
NIT Rourkela, 769008
Page 4
i
ACKNOWLEDGEMENT
I am grateful to the Dept. of Civil Engineering, NIT ROURKELA, for giving me the
opportunity to execute this project, which is an integral part of the curriculum in M. Tech
program at the National Institute of Technology, Rourkela.
I express my deepest gratitude to my project guide Prof. U.K MISHRA, whose
encouragement, guidance and support from the initial to the final level enabled me to
develop an understanding of the subject.
My special thanks to Prof. N. Roy, Head of the Civil Engineering Department, for all the
facilities provided to successfully complete this work. I am also very thankful to all the
faculty members of the department, especially Structural Engineering specialization for their
constant encouragement, invaluable advice, encouragement, inspiration and blessings during
the project.
I thank. Dr. Robin Davis P, Assistant Professor, Dept. of Civil Engineering, for all the
advice and help he provided for my project.
I would like to thank Dr. Pradip Sarkar, Associate Professor, Dept. of Civil Engineering,
for all his support and encouragement throughout my project work.
I also thank Mr. Haran Pragalaath, research scholar in our department, for all the help he
offered me throughout my stay here.
Finally, I take this opportunity to extend my deep appreciation to my family and friends, for
all that they meant to me during the crucial times of the completion of my project.
PADMAKAR MADDALA
Page 5
ii
ABSTRACT
Keywords: Pushover analysis, Steel frames,Bracings, Behaviour factor
In last decades Steel structure has played an important role in construction Industry. It is
necessary to design a structure to perform well under seismic loads. The seismic
performance of a multi-story steel frame building is designed according to the provisions of
the current Indian code (IS 800 -2007). The shear capacity of the structure can be increased
by introducing Steel bracings in the structural system. Bracings can be used as retrofit as
well. There are „n‟ numbers of possibilities to arrange Steel bracings such as D, K, and V
type eccentric bracings. A typical six-story steel frame building is designed for various types
of eccentric bracings as per the IS 800- 2007. D, K, and V are the different types of
eccentric bracings considered for the present study. Performance of each frame is studied
through nonlinear static analysis.
Page 6
iii
CONTENTS
TABLE OF CONTENTS
Title Page No.
Acknowledgements ......................................................................................................... i
Abstract ........................................................................................................................... ii
Tables of Contents .......................................................................................................... iii
List of Figures ................................................................................................................. v
List of Tables……………………………………………………………………………… v
Notations ......................................................................................................................... vi
CHAPTER1. INTRODUCTION TO PUSHOVER ANALYSIS 2-8
1.1 Introduction 2
1.2 Historical Development or Background of Steel 4
1.3 Types of Structural Steel 5
1.4 Objectives 6
1.5Methodology 7
1.6Scope of the Present Study 7
1.7 Organization of the thesis 7
CHAPTER2. LITERATURE REVIEW 10-19
2.1 General 10
2.2 Literature Review on Pushover Analysis 10
2.3Limitations of Existing Studies 18
2.4 Closure 19
CHAPTER3. PUSHOVER ANALYSIS AND BEHAVIOUR FACTORS 21-26
3.1 Pushover Analysis- An Overview 21
3.2 Pushover Analysis Procedure 22
Page 7
iv
3.3 Lateral load profile 25
3.4. Use of Pushover Results 28
3.5. Limitations of Pushover Analysis 29
3.6 Behavior factor (R) 30
CHAPTER4. STRUCTURAL MODELLING 34-37
4.1 Introduction 34
4.2 Frame Geometry 34
4.3. Frame Designs 36
4.4. Modeling For Nonlinear Analysis 37
CHAPTER5. SEISMIC BEHAVIOUR OF STEEL FRAMES WITH VARIOUS
ECCENTRIC BRACING ARRANGEMENTS 39-45
5.1 Introduction 39
5.2 Pushover Analysis 39
5.3 Fundamental Period 40
5.4 Mode Shapes 41
5.5 Pushover Curve 42
5.6 Performance Parameters 45
CHAPTER6.SUMMARY AND CONCLUSION 48-49
6.1 SUMMARY 48
6.2 CONCLUSIONS 49
REFERENCES 51-53
Page 8
v
LIST OF FIGURES
3.1 Global Capacity (Pushover) Curve of Structure 25 3.2 Typical Pushover response curve for evaluation of behavior factor, R 31
4.1Braced Frame Layout D-frames 35
4.2 Braced Frame Layout K-frames 35
4.3 Braced Frame Layout V-frames 36
4.4 Cross sectional details of the frames 37
5.1 1 St Mode shape and Lateral Load Profle 40
5.2 Mode shapes for V frames 42
5.3 Comparison of Push over analysis of V Type Frames 43
5.4 Comparison of Push over analysis of D Type Frames 44
5.5 Comparison of Push over analysis of K Type Frames 44
5.6 Comparison of Push over analysis of all types of Frames selected 45
LIST OF TABLES
5.1 Fundamental period of vibration 41
5.2 R factors parameters of the frames 46
Page 9
vi
NOTATIONS
- Lateral force at i-th story
- Mass of i-th story
- Amplitude of the elastic first mode at i-th story
- Base shear
h - Height of i-th story above the base
N - Total number of stories
Δ - Additional earthquake load added to the N-th story when >25m
- Design lateral force at floor i,
- Seismic weight of floor i,
- Height of floor i measured from base
n - Number of stories in the building is the number of levels at which the
masses are located
- Modal participation factor for the n-th mode
- Amplitude of n-th mode at i-th story
- Pseudo-acceleration of the n-th mode SDOF elastic system
Page 10
1
CHAPTER -1
Introduction
Steel
Historical development of steel
Types of structural steel
Objectives
Methodology
Scope of the present study
Organization of the thesis
Page 11
2
1. INTRODUCTION
In last decades Steel structure plays an important role in the construction industry. It is
necessary to design a structure to perform well under seismic loads. Shear capacity of the
structure can be increased by introducing Steel bracings in the structural system. Bracings can be
used as retrofit as well. There are „n‟ numbers of possibilities are there to arrange Steel bracings.
Such as D, K, and V type eccentric bracings. Design of such structure should have good
ductility property to perform well under seismic loads. To estimate ductility and other properties
for each eccentric bracing Push over analysis is performed.
A simple computer-based push-over analysis is a technique for performance-based design of
building frameworks subject to earthquake loading. Push over analysis attains much importance
in the past decades due to its simplicity and the effectiveness of the results. The present study
develops a push-over analysis for different eccentric steel frames designed according to IS-800
(2007) and ductility behaviour of each frame.
1.1 STEEL
Steel is by far most useful material for building construction in the world. Today steel
industry is the basic or key industry in any country. It strength of approximately ten times that of
concrete, steel is the ideal material of modern construction. It‟s mainly advantages are strength,
speed of erection, prefabrication, and demountability. Structural steel is used in load-bearing
frames in buildings, and as members in trusses, bridges, and space frames. Steel, however,
requires fire and corrosion protection. In steel buildings, claddings and dividing walls are made
Page 12
3
up of masonry or other materials, and often a concrete foundation is provided. Steel is also used
in conjunction frame and shear wall construction. Due to its large strength to weight ratio, steel
structures tend to be more economical than concrete structures for tall buildings and large span
buildings and bridges. Steel structures can be constructed very fast and this enables the structure
to be used early thereby leading to overall economy steel offers much better compressive and
tensile strength than concrete and enables lighter constructions.
To get the most benefit out of steel, steel structures should be designed and protected to
resist corrosion and fire. They should be designed and detailed for easy fabrication and erection.
Good quality control is essential to ensure proper fitting of the various structural elements. The
effects of temperature should be considered in design. Steel structures are ductile and robust and
can withstand severe loadings such as earthquakes. Steel structures can be easily repaired and
retrofitted to carry higher loads. Steel is one of the friendliest environmental building materials –
steel is 100% recyclable.
To get the most benefit out of steel, steel structures should be designed and protected to
resist corrosion and fire. They should be designed and detailed for easy fabrication and erection.
Good quality control is essential to ensure proper fitting of the various structural elements. The
effects of temperature should be considered in design. To prevent development of cracks under
fatigue and earthquake loads the connections and in particular the welds should be designed and
detailed properly. Special steels and protective measures for corrosion and fire are available and
the designer should be familiar with the options available. Since steel is produced in the factory
under better quality control, steel structures have higher reliability and safety.
Page 13
4
1.2 HISTORICAL DEVELOPMENT OF STEEL
Steel has been known from 3000 BC steel was used during 500-400 BC in china and then
in Europe. In India the Ashoakan pillar made with steel and the iron joints used in Puri temples
are more than 1500 years old. The modern blast-furnace technology which was developed in
AD1350 (Guptha 1998).
The large-scale use of iron for structural purposes started in Europe in the latter part of
the eighteen century.The first major application of cast iron was in the 30.4 –m-span
Coalbroakadale Arch Bridge by Darby in England, constructed in 1779 over the river Severn.The
use of cast iron was continued up to about 1840. In 1740, Abraham Darby found a way of
converting coal into coke, which revolutionized the iron –making process. In 1784 Henory Cort
found way of wrought iron, which is stronger, flexible, and had a higher tensile strength than cast
iron. During 1829 wrought iron chains were used in Menai Straits suspension bridge designed by
Thomas Telford and Robert Stephenson‟s Britannia Bridge was the first box girder wrought iron
bridge. Steel was first introduced in 1740,but was not available in large quantities until Sir Henry
Bessemer of England invented and patented the process of making steel in 1855 .In
1865,Siemens and Martin invented the open –hearth process and this was used extensively for
the production of structural steel. Companies such as Dorman Long started rolling steel I-section
by 1880.Riveting was used as a fastening method until around 1950when it was superseded by
welding.Bessemers steel production in Britain ended in 1974 and last open –hearth furnace
closed in 1980.The basic oxygen steel making (BOS) process using the CD converter was
invented in Austria in 1953.Today we have several varieties of steel.
Page 14
5
1.3 TYPES OF STRUCTURAL STEEL
The structural designer is now in a position to select structural steel for a particular
application from the following general categories.
a) Carbon steel (IS 2062)
Carbon and manganese are the main strengthening elements. The specified minimum
ultimate tensile strength for these varies about 380 to 450 MPa and their specified minimum
yield strength from about 230 to 300MPa(IS 800:2007)
b) High –strength carbon steel
This steel specified for structures such as transmission lines and microwaves towers. The
specified ultimate tensile strength, ranging from about 480-550 MPa, and a minimum yield
strength of about 350-400 MPa.
c) Medium-and-high strength micro alloyed steel(IS 85000)
This steel has low carbon content but achieves high strength due to the addition of alloys
such as niobium, vanadium, titanium, or boron. The specified ultimate tensile strength, ranging
from about 440-590 MPa,and a minimum yield strength of about 300-450 MPa.
d) High –strength quenched and temperature steels(IS 2003)
This steel is heat treated to develop high strength. The specified ultimate tensile strength,
ranging from about 700-950 MPa,and a minimum yield strength of about 550-700 MPa.
Page 15
6
e) Weathering steels
This steel low-alloy atmospheric corrosion –resistant .They have an ultimate tensile
strength of about 480 MPa and a yielded strength of about 350 MPa.
f) Stainless steels
This steel is essential low-carbon steel to which a minimum of 10.5% (max 20%)
chromium and 0.5% nickel is added.
g) Fire-resistant steels
Also called thermo-mechanically treated steels, they perform better than ordinary steel
under fire.
1.4 OBJECTIVES
Following are the main objectives of the present study:
a) To investigate the seismic performance of a multi-story steel frame building with different
bracing arrangements such as D, K and V, using Nonlinear Static Pushover analysis method.
b) To evaluate the performance factors for steel frames with various bracing arrangements
designed according to Indian Code.
1.5 METHODOLOGY
a) A thorough literature review to understand the seismic evaluation of building structures and
application of pushover analysis.
Page 16
7
b) Seismic behavior of steel frames with various eccentric bracings geometrical and structural
details
c) Model the selected in seismic behavior of steel frames with various eccentric bracings
computer software Seismostruct (2007).
d) Carry out pushover analysis of seismic behavior of steel frames with various eccentric
bracings and arrive at a conclusion.
1.6 SCOPE OF THE PRESENT STUDY
In the present study, modeling of the steel frame under the push over analysis using
Seismostruct (2007) software and the results so obtained have been compared. Conclusions are
drawn based on the ductility and energy dissipation of pushover curves obtained.
1.7 ORGANIZATION OF THE THESIS
The thesis is organized as per detail given below:
Chapter 1: Introduces to the topic of thesis in brief.
Chapter 2: Discusses the literature review i.e. the work done by various researchers in the
Field of modeling of structural members by pushover analysis.
Chapter 3: In this chapter pushover analysis has been discussed in detail. The theory related
To pushover analysis also discussed in brief.
Page 17
8
Chapter 4: Deals with the details of seismic behavior of steel frames with various eccentric
bracing using Seismostruct (2007)
Chapter 5: The results from push over analysis, comparison between the steel frames with
various eccentric bracing, all are discussed in this chapter.
Chapter 6: Finally, salient conclusions and recommendations of the present study are given in
this chapter followed by the references.
Page 18
9
CHAPTER -2
LITERATURE REVIEW
General
Literature Review on Pushover analysis
Limitations of existing studies
Closure
Page 19
10
LITERATURE REVIEW
2.1 GENERAL
To provide a detailed review of the literature related to modeling of structures in its
entirety would be difficult to address in this chapter. A brief review of previous studies on the
application of the pushover analysis of steel frames is presented is this section. This literature
review focuses on recent contributions related to pushover analysis of steel frames and past
efforts most closely related to the needs of the present work.
2.2 LITERATURE REVIEW ON PUSHOVER ANALYSIS
Humar and Wright (1977) studied the dynamic behaviour of multi-storeyed steel frame
buildings with setbacks. The observations made based on a detailed parametric study are
as follows. The fundamental period decreased by 35% for a setback of 90% (i.e., tower
occupying 10% of the base area). The higher mode vibration of setback buildings made
substantial contribution to their seismic response; these contributions increased with the
slenderness of the tower. The contribution of the higher modes increased to 40% for a
setback of 90%. For very slender towers the transition region between the tower and the
base was, in some cases, subjected to very large storey shears. This increase in shear
force was found to be as high as 300% to 400% for a setback of 90%. Storey drift ratios
and storey shears for tower portions of setback buildings were substantially larger than
for building without setbacks. For the tower portion, the increase in inter-storey drift was
found to be four times compared to that of a regular structure. This increase was
influenced by the extent of the setback. It was also observed that beam ductility demand
Page 20
11
in the tower portion showed a large increase with increase in the slenderness of the tower.
The column ductility demands in the tower portion also showed a similar trend.
Shahrooz and Moehle (1990) studied the effects of setbacks on the earthquake response
of multi-storeyed buildings. In an effort to improve design methods for setback
structures, an experimental and analytical study was undertaken. A six-storey moment-
resisting reinforced concrete space frame with 50% setback in one direction at mid-height
was selected. The analytical study focused on the test structure. The displacement profiles
were relatively smooth over the height. Relatively large inter-storey drifts at the tower-
base junction were accompanied by a moderate increase in damage at that level. Overall,
the predominance of the fundamental mode on the global translational response in the
direction parallel to the setback was clear from the displacement and inertia force
profiles. The distribution of lateral forces was almost always similar to the distribution
specified by the UBC code; no significant peculiarities in dynamic response were
detected. To investigate further, an analytical study was also carried out on six generic
reinforced concrete setback frames.
Wood (1992) investigated the seismic behaviour of reinforced concrete frames with steps
and setbacks. Two small-scale reinforced concrete 9-storeyed test framed structures (one
-with steps and the other with setbacks) were constructed and subjected to simulated
ground motion. The displacement, acceleration and the shear force responses of these
frames were compared with those of seven previously tested regular frames. The setback
structure comprises two-storey base with seven additional storeys in the tower portions.
The stepped structure includes a three storey tower, a three storey middle section and a
Page 21
12
three storey base. The displacement and shear force responses of these two frames were
governed primarily by the first mode. Acceleration response at all levels exhibited the
contribution of higher modes. The mode shapes for both the frames indicated kinks at the
step locations. However, distributions of maximum storey shear were well represented by
the equivalent lateral force distributions for all frames as given in UBC for regular
frames. The differences between the linear dynamic analyses of regular, stepped and
setback frames were not significant.
Ghobarah A. et al., (1997) the control of inter story drift can also be considered as a
means to provide uniform ductility over the stories of the building. A story drift may
result in the occurrence of a weak story that may cause catastrophic building collapse in a
seismic event. Uniform story ductility over all stories for a building is usually desired in
seismic design.
Foley CM. (2002) a review of current state-of-the-art seismic performance-based design
procedures and presented the vision for the development of PBD optimization. It is
recognized that there is a pressing need for developing optimized PBD procedures for
seismic engineering of structures.
R. Hasan and L. Xu, D.E. Grierson (2002) conducted a simple computer-based push-
over analysis technique for performance-based design of building frameworks subject to
earthquake loading. And found that rigidity-factor for elastic analysis of semi-rigid
frames, and the stiffness properties for semi-rigid analysis are directly adopted for push-
over analysis.
Page 22
13
B. AKBAS.et.al.(2003) conducted a push over analysis on steel frames to estimate the
seismic demands at different performance levels, which requires the consideration of
inelastic behaviour of the structure.
X.-K. Zou et al., (2005) presented an effective technique that incorporates Pushover
Analysis together with numerical optimisation procedures to automate the Pushover drift
performance design of reinforced concrete buildings. PBD using nonlinear pushover
analysis, which generally involves tedious computational effort, is highly iterative
process needed to meet code requirements.
Oğuz, Sermin (2005) Ascertained the effects and the accuracy of invariant lateral load
patterns Utilized in pushover analysis to predict the behaviour imposed on the structure
due to randomly Selected individual ground motions causing elastic deformation by
studying various levels of Nonlinear response. For this purpose, pushover analyses using
various invariant lateral load Patterns and Modal Pushover Analysis were performed on
reinforced concrete and steel moment resisting frames covering a broad range of
fundamental periods. The accuracy of approximate Procedures utilized to estimate target
displacement was also studied on frame structures. Pushover analyses were performed by
both DRAIN-2DX and SAP2000. The primary observations from the study showed that
the accuracy of the pushover results depended strongly On the load path, the
characteristics of the ground motion and the properties of the structure.
Mehmet et al., (2006), explained that due to its simplicity of Push over analysis, the
structural engineering profession has been using the nonlinear static procedure or
pushover analysis. Pushover analysis is carried out for different nonlinear hinge
Page 23
14
properties available in some programs based on the FEMA-356 and ATC-40 guidelines
and he pointed out that Plastic hinge length (Lp) has considerable effects on the
displacement capacity of the frames. The orientation and the axial load level of the
columns cannot be taken into account properly by the default-hinge properties
(Programme Default).
Shuraim et al., (2007) summarized the nonlinear static analytical procedure (Pushover)
as introduced by ATC-40 has been utilized for the evaluation of existing design of a
building, in order to examine its applicability. He conducted nonlinear pushover analysis
shows that the frame is capable of withstanding the pre-assumed seismic force with some
significant yielding at all beams and columns.
Girgin. et.,(2007),Pushover analysis has been the preferred method for seismic
performance evaluation of structures by the major rehabilitation guidelines and codes
because it is computationally and conceptually simple. Pushover analysis allows tracing
the sequence of yielding and failure on member and structural level as well as the
progress of overall capacity curve of the structure.
A. Shuraim et al., (2007) the nonlinear static analytical procedure (Pushover) as
introduced by ATC-40 has been utilized for the evaluation of existing design of a new
reinforced concrete frame. Potential structural deficiencies in reinforced concrete frame,
when subjected to a moderate seismic loading, were estimated by the pushover
approaches. In this method the design was evaluated by redesigning under selected
seismic combination in order to show which members would require additional
reinforcement. Most columns required significant additional reinforcement, indicating
Page 24
15
their vulnerability when subjected to seismic forces. The nonlinear pushover procedure
shows that the frame is capable of withstanding the presumed seismic force with some
significant yielding at all beams and one column.
Athanassiadou (2008) analysed two ten-storeyed two-dimensional plane stepped frames
and one ten-storeyed regular frame designed, as per Euro code 8 (2004) for the high and
medium ductility classes. This research validates the design methodology requiring linear
dynamic analysis recommended in Euro code 8 for irregular buildings. The stepped
buildings, designed to Euro code 8 (2004) were found to behave satisfactorily under the
design basis earthquake and also under the maximum considered earthquake (involving
ground motion twice as strong as the design basis earthquake). Inter-storey drift ratios of
irregular frames were found to remain quite low even in the case of the „collapse
prevention‟ earthquake. This fact, combined with the limited plastic hinge formation in
columns, exclude the possibility of formation of a collapse mechanism at the
neighbourhood of the irregularities. Plastic hinge formation in columns is seen to be very
limited during the design basis earthquake, taking place only at locations not prohibited
by the code, i.e. at the building base and top. It has been concluded that the capacity
design procedure provided by Euro code 8 is completely successful and can be
characterized by conservatism, mainly in the case of the design of high-ductility columns.
The over-strength of the irregular frames is found to be similar to that of the regular ones,
with the over-strength ratio values being 1.50 to 2.00 for medium – high ductility levels.
The author presented the results of pushover analysis using „uniform‟ load pattern as well
as a „modal‟ load pattern that account the results of multimodal elastic analysis.
Page 25
16
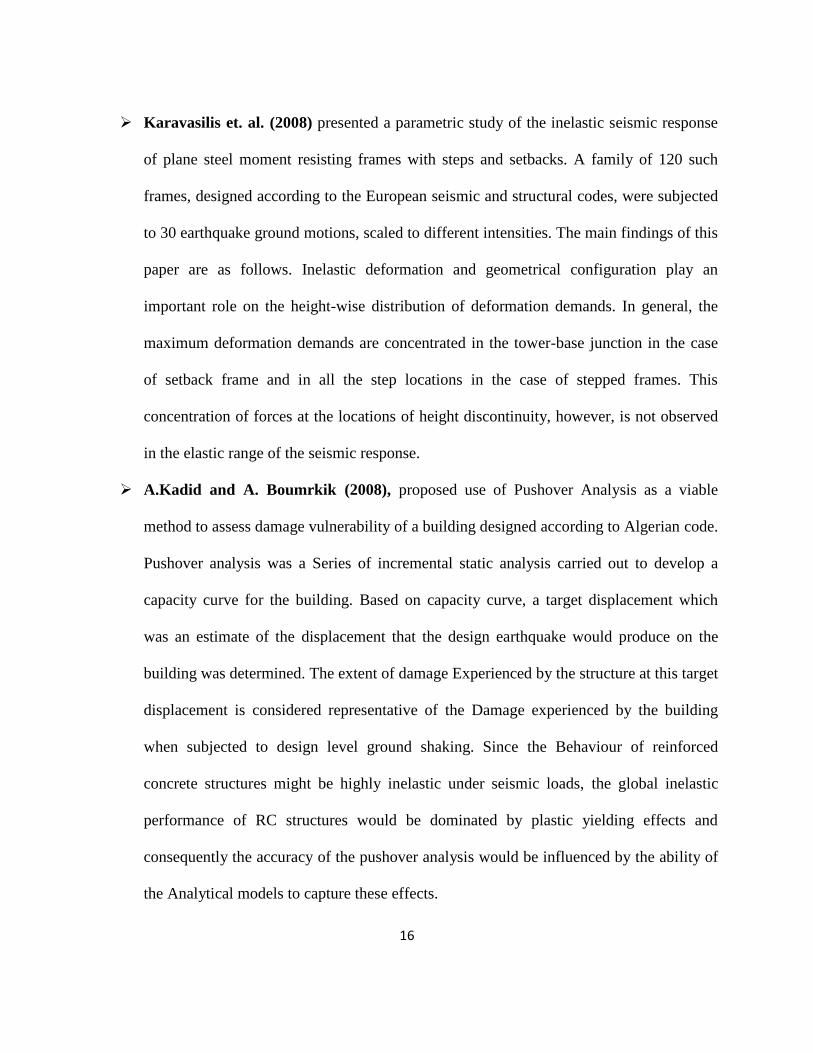
Karavasilis et. al. (2008) presented a parametric study of the inelastic seismic response
of plane steel moment resisting frames with steps and setbacks. A family of 120 such
frames, designed according to the European seismic and structural codes, were subjected
to 30 earthquake ground motions, scaled to different intensities. The main findings of this
paper are as follows. Inelastic deformation and geometrical configuration play an
important role on the height-wise distribution of deformation demands. In general, the
maximum deformation demands are concentrated in the tower-base junction in the case
of setback frame and in all the step locations in the case of stepped frames. This
concentration of forces at the locations of height discontinuity, however, is not observed
in the elastic range of the seismic response.
A.Kadid and A. Boumrkik (2008), proposed use of Pushover Analysis as a viable
method to assess damage vulnerability of a building designed according to Algerian code.
Pushover analysis was a Series of incremental static analysis carried out to develop a
capacity curve for the building. Based on capacity curve, a target displacement which
was an estimate of the displacement that the design earthquake would produce on the
building was determined. The extent of damage Experienced by the structure at this target
displacement is considered representative of the Damage experienced by the building
when subjected to design level ground shaking. Since the Behaviour of reinforced
concrete structures might be highly inelastic under seismic loads, the global inelastic
performance of RC structures would be dominated by plastic yielding effects and
consequently the accuracy of the pushover analysis would be influenced by the ability of
the Analytical models to capture these effects.
Page 26
17
Kala.Pet. al. (2010), conducted study on steel water tanks designed as per recent and past
I. S codes and they found Compression members are more critical than tension members.
And he pointed out that, in Limit state method the partial safety factors on load and
material have been derived using the probability concept which is more rational and
realistic
P.Poluraju and P.V.S.N.Rao (2011), has studied the behaviour of framed building by
conducting Push over Analysis, most of buildings collapsed were found deficient to meet
out the requirements of the present day codes. Then G+3 building was modelled and
analysed, results obtained from the study shows that properly designed frame will
perform well under seismic loads.
Haroon Rasheed Tamboli & Umesh N. Karadi (2012), performed seismic analysis
using Equivalent Lateral Force Method for different reinforced concrete (RC) frame
building models that included bare frame, in filled frame and open first story frame. In
modelling of the masonry Infill panels the Equivalent diagonal Strut method was used
and the software ETABS was used for the analysis of all the frame models. In filled
frames should be preferred in seismic regions than the open first story frame, because the
story drift of first story of open first story frame is Very large than the upper stories,
which might probably cause the collapse of structure. The infill Wall increases the
strength and stiffness of the structure. The seismic analysis of RC (Bare frame) structure
lead to under estimation of base shear. Therefore other response quantities such as time
period, natural frequency, and story drift were not significant. The underestimation of
base shear might lead to the collapse of structure during earthquake shaking.
Page 27
18
Narender Bodige, Pradeep Kumar Ramancharla (2012), modelled a 1 x 1 bay 2D four
storied building using AEM (applied element method). AEM is a discrete method in
which the elements are connected by pair of normal and shear springs which are
distributed around the elements edges and each pair of springs totally represents stresses
and deformation and plastic hinges location are formed automatically. Gravity loads and
laterals loads as per IS 1893-2002 were applied on the structure and designed using IS
456 and IS 13920. Displacement control pushover analysis was carried out in both cases
and the pushover curves were compared. As an observation it was found that AEM gave
good representation capacity curve. From the case studies it was found that capacity of
the building significantly increased when ductile detailing was adopted. Also, it was
found that effect on concrete grade and steel were not highly significant.
2.3 LIMITATIONS OF EXISTING STUDIES
Many experimental and analytical works has been done by many researchers in the area
of the pushover analysis of the steel frames. The concept of pushover analysis is rapidly growing
nowadays.
This research is concerned with the pushover analysis of the steel frames. The uses of
pushover analysis of the steel frames have been studied extensively in previous studies.
However, many researchers performed experimentally and analytically on the pushover analysis
but limited work is done on the study of pushover analysis. Push over analysis is carried out
using Seismostruct (2012) software.
Page 28
19
2.4 CLOSURE
The literature review has suggested that use of a pushover analysis of the steel frame is
feasible. So it has been decided to use Seismostruct for the modeling and analysis. With the help
of this software study of steel frame has been done.
Page 29
20
CHAPTER -3
PUSH OVER ANALYSIS AND BEHAVIOUR
FACTORS
Pushover Analysis– An Over View
Pushover Analysis Procedure
Lateral Load Profile
Use of Pushover Results
Limitations of Pushover Analysis
Behaviour factor
Page 30
21
PUSH OVER ANALYSIS AND BEHAVIOUR FACTORS
3.1 PUSHOVER ANALYSIS – AN OVERVIEW
The use of the nonlinear static analysis (pushover analysis) came in to practice in 1970‟s
but the potential of the pushover analysis has been recognized for last two decades years. This
procedure is mainly used to estimate the strength and drift capacity of existing structure and the
seismic demand for this structure subjected to selected earthquake. This procedure can be used
for checking the adequacy of new structural design as well. The effectiveness of pushover
analysis and its computational simplicity brought this procedure in to several seismic guidelines
(ATC 40 and FEMA 356) and design codes (Euro code 8 and PCM 3274) in last few years.
Pushover analysis is defined as an analysis wherein a mathematical model directly
incorporating the nonlinear load-deformation characteristics of individual components and
elements of the building shall be subjected to monotonically increasing lateral loads
representing inertia forces in an earthquake until a „target displacement‟ is exceeded. Target
displacement is the maximum displacement (elastic plus inelastic) of the building at roof
expected under selected earthquake ground motion. The structural Pushover analysis assesses
performance by estimating the force and deformation capacity and seismic demand using a
nonlinear static analysis algorithm. The seismic demand parameters are storey drifts,global
displacement(at roof or any other reference point), storey forces, and component deformation
and component forces. The analysis accounts for material inelasticity, geometrical nonlinearity
and the redistribution of internal forces. Response characteristics that can be obtained from the
pushover analysis are summarized as follows:
Page 31
22
a) Estimates of force and displacement capacities of the structure. Sequence of the member
yielding and the progress of the overall capacity curve.
b) Estimates of force (axial, shear and moment) demands on potentially brittle elements and
deformation demands on ductile elements.
c) Estimates of global displacement demand, corresponding inter-storey drifts and damages on
structural and non-structural elements expected under the 20 earthquake ground motion
considered.
d) Sequences of the failure of elements and the consequent effect on the overall structural
stability.
e) Identification of the critical regions, when the inelastic deformations are expected to be high
and identification of strength irregularities (in plan or in elevation) of the building. Pushover
analysis delivers all these benefits for an additional computational effort (modeling nonlinearity
and change in analysis algorithm) over the linear static analysis. Step by step procedure of
pushover analysis is discussed next.
3.2 PUSHOVER ANALYSIS PROCEDURE
Pushover analysis can be performed as either force-controlled or displacement controlled
depending on the physical nature of the load and the behavior expected from the structure. Force-
controlled option is useful when the load is known (such as gravity loading) and the structure is
expected to be able to support the load. Displacement controlled procedure should be used when
specified drifts are sought (such as in seismic 2 1 loading), where the magnitude of the applied
Page 32
23
load is not known in advance, or where the structure can be expected to lose strength or become
unstable.
Some computer programs (e.g. Seismostruct , DRAIN-2DX [44], Nonlinear version of
SAP2000 [14], ANSYS [2]) can model nonlinear behavior and perform pushover analysis
directly to obtain capacity curve for two and/or three dimensional models of the structure. When
such programs are not available or the available computer programs could not perform pushover
analysis directly (e.g. ETABS [13], RISA [45], SAP90 [12]), a series of sequential elastic
analyses are performed and superimposed to determine a force displacement curve of the overall
structure. A displacement-controlled pushover analysis is basically composed of the following
steps:
1. A two or three dimensional model that represents the overall structural behavior is created.
2. Bilinear or tri-linear load-deformation diagrams of all important members that affect lateral
response are defined.
3. Gravity loads composed of dead loads and a specified portion of live loads are applied to the
structural model initially.
4. A pre -defined lateral load pattern which is distributed along the building height is then
applied.
5. Lateral loads are increased until some member(s) yield under the combined effects of gravity
and lateral loads.
Page 33
24
6. Base shear and roof displacement are recorded at first yielding.
7. The structural model is modified to account for the reduced stiffness of yielded member(s).
8. Gravity loads are removed and a new lateral load increment is applied to the modified
structural model such that additional member(s) yield. Note that a separate analysis with zero
initial conditions is performed on modified structural model under each incremental lateral load.
Thus, member forces at the end of an incremental lateral load analysis are obtained by adding the
forces from the current analysis to the sum of those from the previous increments. In other
words, the results of each incremental lateral load analysis are superimposed.
9. Similarly, the lateral load increment and the roof displacement increment are added to the
corresponding previous total values to obtain the accumulated values of the base shear and the
roof displacement.
10. Steps 7, 8 and 9 are repeated until the roof displacement reaches a certain level of
deformation or the structure becomes unstable.
11. The roof displacement is plotted with the base shear to get the global capacity(pushover)
curve of the structure (Figure 3.1).
Page 34
25
Figure 3.1: Global Capacity (Pushover) Curve of Structure
3.3 Lateral Load Profile
The analysis results are sensitive to the selection of the control node and selection of lateral load
pattern. In general case, the centre of mass location at the roof of the building is considered as
control node. In pushover analysis selecting lateral load pattern, a set of guidelines as per FEMA
356 is explained in Section 2.5.2. The lateral load generally applied in both positive and negative
directions in combination with gravity load (dead load and a portion of live load) to study the
actual behavior. Different types of lateral load used in past decades are as follows.
„Uniform‟ Lateral Load Pattern
The lateral fore at any story is proportional to the mass at that story.
∑
Where lateral force at i-th story
Page 35
26
: mass of i-th story
„First Elastic Mode‟ Lateral Load Pattern
The lateral force at any story is proportional to the product of the amplitude of the elastic
first mode and mass at that story,
= /∑
Where : amplitude of the elastic first mode at i-th story
„Code‟ Lateral Load Pattern
The lateral load pattern is defined in Turkish Earthquake Code (1998) [53] and the lateral
force at any storey is calculated from the following formula:
= ( -Δ )
∑
Where : base shear
h : height of i-th story above the base
N : total number of stories
Δ : additional earthquake load added to the N-th story when >25m
(For ≤25m. Δ =0 otherwise; Δ = 0.07 ≤0.2 where is the fundamental
period of the structure)
=
∑
Page 36
27
Where = Design lateral force at floor i,
= Seismic weight of floor i,
= Height of floor i measured from base, and
n = Number of stories in the building is the number of levels at which the
masses are located.
3.3.1 ‘FEMA-273’ Lateral Load Pattern
The lateral load pattern defined in FEMA_273 [18] is given by the following formula that is used
to calculate the internal force at any story:
Where h: height of the i-th story above the base
K: a factor to account for the higher mode effects (k=1 for ≤0.5 sec and k=2 for >2.5
sec and varies linearly in between)
3.3.2 ‘Multi-Modal (or SRSS)’ Lateral Load Pattern
The lateral load pattern considers the effects of elastic higher modes of vibration for long period and
irregular structures and the lateral force at any story is calculated Square Root of Sum of Squares (SRSS)
combinations of the load distributions obtained from the modal analysis of the structures as follows:
1. Calculate the lateral force at i-th storey for n-th mode from equations
=
Where : modal participation factor for the n-th mode
Page 37
28
: Amplitude of n-th mode at i-th story
: Pseudo-acceleration of the n-th mode SDOF elastic system
2. Calculate the storey shears, = ∑ where N is the total number of storeys
3. Combine the modal storey shears using SRSS rule, = √∑ .
4. Back calculate the lateral storey forces, , at storey levels from the combined storey shears,
starting from the top storey.
5. Normalize the lateral storey forces by base shear for convenience such that
/∑ .
The first three elastic modes of vibration of contribution was considered to calculate the „Multi-
Modal (or SRSS)‟ lateral load pattern in this study.
3.4 Use of Pushover Results
Pushover analysis has been the preferred method for seismic performance evaluation of
structures by the major rehabilitation guidelines and codes because it is computationally and
conceptually. Pushover analysis allows tracing the sequence of yielding and failure on member
and structural level as well as the progress of overall capacity curve of the structure.
The expectation from pushover analysis is to estimate critical response parameters
imposed on structural system and its components as close as possible to those predicted by
nonlinear dynamic analysis. Pushover analysis provides information on many response
characteristics that can‟t be obtained from an elastic static or elastic dynamic analysis.
Page 38
29
These are
• Interstory drifts are estimates and its distribution along the height
• Determination of force demands on brittle members, are axial force demands on columns,
beam-column connections are moment demands
• Deformation demands of determination for ductile members
• In location of weak points identification in the structure (or potential failure modes)
• Effort of an action strength deterioration of individual members on the behavior of structural
system
• In plan or elevation identification of strength discontinuities that will lead to changes in
dynamic characteristics in the inelastic range
• Verification of the completeness and adequacy of load path. Pushover analysis also exposes
design weaknesses that may remain hidden in an elastic analysis. They are story mechanisms,
excessive deformation demands, irregularities strength and overloads on potentially brittle
members.
3.5 Limitations of Pushover Analysis
Although pushover analysis has advantages over elastic analysis procedures, underlying
assumptions, pushover predictions are accuracy and limitations of current pushover procedures
must be identified. Selection of lateral load patterns and identification of failure mechanisms for
estimate of target displacement due to higher modes of vibration are important issues that affect
Page 39
30
the accuracy of pushover results. In a design earthquake target displacement are global
displacement are expected. The mass center of roof displacement structure is used as target
displacement. The estimation of target displacement accurate associated with specific
performance objective affect the accuracy of seismic demand predictions of pushover analysis.
Target displacement is the global displacement expected in a design earthquake. The estimate of
target displacement, identification of failure mechanisms due to higher modes of vibration are
important issues that affect, selection of lateral load patterns the accuracy of pushover results.
3.6 Behavior factor (R)
The behavior factor (R) is the ratio of the strength required to maintain the structure elastic to the
inelastic design strength of the structure, Reza Akbari and Mahmoud R.Maheri (2001). In other
words, it is a force reduction factor used to reduce the linear elastic response spectra to the
inelastic response spectra. It is found through Push over analysis. The behavior factor, R,
accounts for the inherent ductility, over strength of a structure and difference in the level of
stresses considered in its design. FEMA (1997), UBC (1997) suggests the R factor in force-based
seismic design procedures. It is generally expressed in the following form taking into account
the above three components,
YRRR s
Where, Rμ is the ductility dependent component also known as the ductility reduction factor, RS
is the over-strength factor and Y is termed the allowable stress factor. With reference to figure 3,
Page 40
31
in which the actual force–displacement response curve is idealized by a bilinear elastic–perfectly
plastic response curve, the behavior factor parameters may be defined as
(
) (
) (
)
Where, Ve, Vy, Vs and Vw correspond to the structure‟s elastic response strength, the idealized
yield strength, the first significant yield strength and the allowable stress design strength,
respectively as shown in the Fig. 3.2.
Figure 3.2: Typical Pushover response curve for evaluation of behavior factor, R
Page 41
32
The structure ductility, μ, is defined in as maximum structural drift (Δmax) and the displacement
corresponding to the idealized yield strength (Δy) as:
µ =
Page 42
33
CHAPTER -4
STRUCTURAL MODELLING
Introduction
Frame geometry
Frame designs
Modeling For Nonlinear Analysis
Page 43
34
STRUCTURAL MODELLING
4.1 INTRODUCTION
The study in this thesis is based on nonlinear analysis of steel frames with eccentric
bracings models. Different configurations of frames are selected such as D, K and V frames by
keeping total weight of building is same. This chapter presents a summary of various parameters
defining the computational models, the basic assumptions and the steel frame geometry
considered for this study .Accurate modelling of the nonlinear properties of various structural
elements is very important in nonlinear analysis. In the present study, beams and columns were
modelled with inelastic flexural deformations using fibre based element using the software
Seismostruct.
4.2 FRAME GEOMETRY
The details of frames are obtained from literature (AdilEmreÖzel, Esra Mete
Güneyisi,2010).The buildings are assumed to be symmetric in plan, and hence a single plane
frame may be considered to be representative of the building along one direction. Typical bay
width and column height in this study are selected as 6m and 3m respectively. A configuration of
6 stories and 6 bays (G+5) is considered in this study. Different arrangements of steel frames
such as K, D and V frames are considered as shown in fig. 4.1
Page 44
35
Fig 4.1(a): D-frames
Fig 4.1(b): K-frames
Page 45
36
Fig 4.1(c): V-frames
Fig 4.1.Braced frame Layout (a) D-frames, (b) K-frames and (c) V-frames
4.3 FRAME DESIGNS
The building frame considered in this study is assumed to be located in Indian seismic
zone V with medium soil conditions. The design peak ground acceleration (PGA) of this zone is
specified as 0.36g. The frame is designed as per prevailing practice in India. Seismic loads are
estimated as per IS 1893 (2002) and the design of the steel elements are carried out as per IS 800
(2007) standards. The characteristic strength of steel is considered 415MPa. The dead load of the
slab (6 m x 6 m panel), including floor finishes, is taken as 2.5 kN/m2and live load as 3 kN/m
2.
The design base shear (VB) is calculated as per IS 1893 (2002).
Wg
S
R
I
2
ZV a
Where, seismic zone factor, Z = 0.36, Importance factor I = 1.0, Response reduction factor
R = 4.0. Estimated Base shear from above formula is found to be 357 kN. Figure 4.2, Shows the
designed cross section details of steel columns, beams and bracings.
Page 46
37
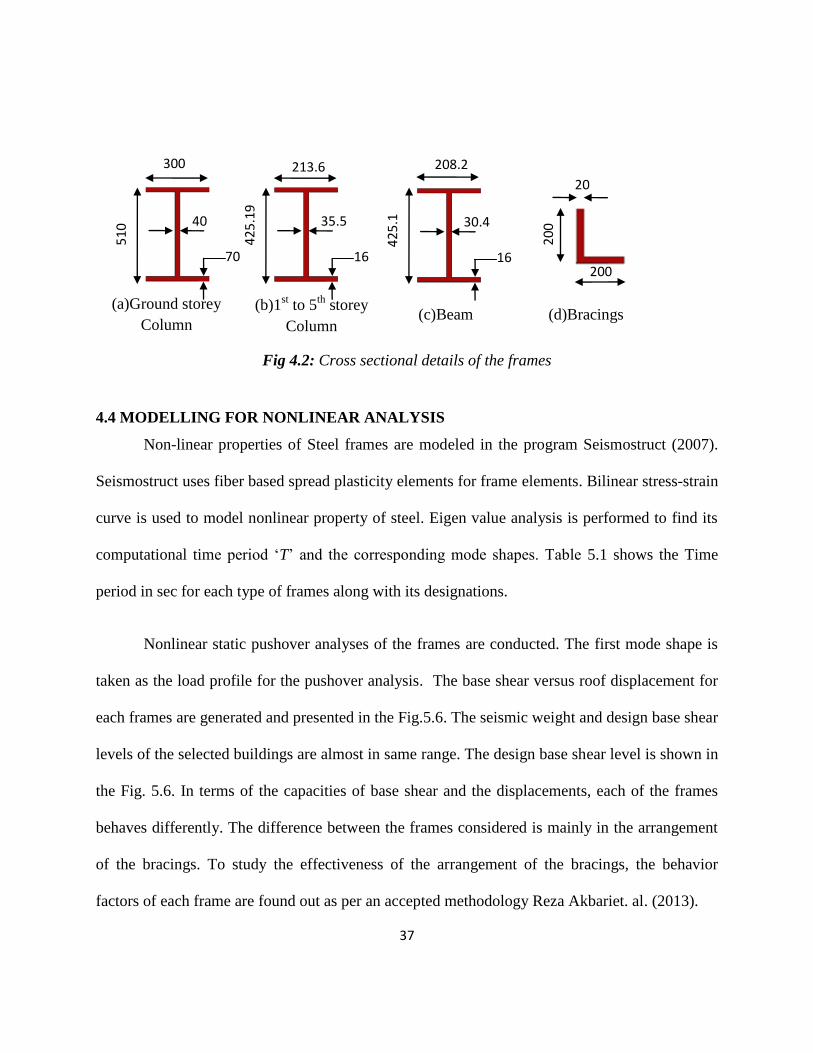
Fig 4.2: Cross sectional details of the frames
4.4 MODELLING FOR NONLINEAR ANALYSIS
Non-linear properties of Steel frames are modeled in the program Seismostruct (2007).
Seismostruct uses fiber based spread plasticity elements for frame elements. Bilinear stress-strain
curve is used to model nonlinear property of steel. Eigen value analysis is performed to find its
computational time period „T‟ and the corresponding mode shapes. Table 5.1 shows the Time
period in sec for each type of frames along with its designations.
Nonlinear static pushover analyses of the frames are conducted. The first mode shape is
taken as the load profile for the pushover analysis. The base shear versus roof displacement for
each frames are generated and presented in the Fig.5.6. The seismic weight and design base shear
levels of the selected buildings are almost in same range. The design base shear level is shown in
the Fig. 5.6. In terms of the capacities of base shear and the displacements, each of the frames
behaves differently. The difference between the frames considered is mainly in the arrangement
of the bracings. To study the effectiveness of the arrangement of the bracings, the behavior
factors of each frame are found out as per an accepted methodology Reza Akbariet. al. (2013).
(a)Ground storey
Column (c)Beam (d)Bracings
300
51
0 40
70
42
5.1
9
30.4
8 16
20
0
200
20
(b)1st to 5
th storey
Column
42
5.1
9
35.5
66 16
208.2
8 213.6
36
Page 47
38
CHAPTER -5
SEISMIC BEHAVIOUR OF STEEL FRAMES
WITH VARIOUS ECCENTRIC BRACING
ARRANGEMENTS
Introduction
Pushover analysis
Fundamental Period
Mode Shapes
Pushover Curve
Performance Parameters
Page 48
39
SEISMIC BEHAVIOUR OF STEEL FRAMES WITH VARIOUS
ECCENTRIC BRACING ARRANGEMENTS
5.1 INTRODUCTION
The selected frame model is analyzed using pushover analysis. This chapter presents
behavior factors for the different eccentric steel frames using pushover curves obtained from
push over analysis. First natural time period Building and corresponding mode shape is
calculated. Load for push over analysis is selected according to first mode shape. The results
obtained from these analyses are compared in terms of behavior factors.
5.2 PUSHOVER ANALYSIS
Pushover analyses carried out using FEMA 356 displacement coefficient method.
Building first natural time period and corresponding mode shape is found for all the building
frames. A First mode shape load pattern was used for standard pushover analysis. Fig. 5.1 shows
the load pattern used for standard pushover analysis and the typical 1st mode shape of the steel
frames.
Page 49
40
Fig 5.1 Ist
mode shape and Lateral Load profile
5.3 FUNDAMENTAL PERIOD
The fundamental time period of the frames are calculated by both IS code and model analysis
methods. The values are presented in the Table 5.1. The fundamental time period of the frames,
V, K and D are equal to 0.742s as per IS code. The time period from the model analysis is less
than that suggested by the code in each case. This implies that the base shear attracted by the
steel frames modelling the stiffness of braces will be more than that suggested by the code. The
base shear increases approximately by 33% of design base shear.
Typical Ist mode shape Lateral Load profile
Page 50
41
Table 5.1: Fundamental period of vibration
Frame IS Code Time Period
(T) sec
Computational Time Period
(T) sec
V1 0.742 0.367
V2 0.742 0.355
V3 0.742 0.368
V4 0.742 0.362
D1 0.742 0.328
D2 0.742 0.339
D3 0.742 0.359
D4 0.742 0.346
K1 0.742 0.484
K2 0.742 0.485
K3 0.742 0.487
K4 0.742 0.489
5.4 MODE SHAPES
The mode shapes obtained for the frame V is shown in the Figure 5.1. The same types of mode
shapes are obtained for other types of frames.
Page 51
42
Fig 5.2 Mode shapes for V frames
5.5 PUSHOVER CURVE
The pushover curves for all the steel frames with V type of bracing are shown in Fig 5.3..
The type of curve is more close to an elastic plastic type. The initial slopes of the pushover
curves are marginally same. The base shear capacity of steel frame V1 is marginally more than
that of other frames. It is observed that over strength is high for V1 frames and ductility is more
for V4 frames among the V family type.
The pushover curves for all the steel frames with D type of bracings are shown in Fig 5.4.
The initial slopes of the pushover curves are marginally different. The base shear capacity of
steel frame D3 is marginally more than that of other frames. It is observed that over strength is
high for D1 frames and ductility is more for D1 frame among the D family type.
(a) 1 st mode shape 2 nd mode shape
3 rd mode shape
Page 52
43
The pushover curves for all the steel frames with K type of bracing are shown in Fig 5.5.
The initial slopes of the pushover curves are marginally same. The base shear capacity of steel
frame K3 is marginally more than that of other frames. It is observed that over strength is high
for K1 frames and ductility is more for K4 frame among the K family type.
Figure 5.3: Comparison of Push over analysis of V Type Frames
0
500
1000
1500
2000
2500
0 100 200 300 400 500 600
Bas
e s
hea
r,kN
Roof displacement,mm
V1
V2
V3
Page 53
44
Fig 5.4: Comparison of Push over analysis of D Type Frames
Fig 5.5: Comparison of Push over analysis of K Frames
0
500
1000
1500
2000
2500
3000
3500
0 100 200 300 400 500
Bas
e s
he
ar,k
N
Roof displacement,mm
D1
D2
D3
D4
0
500
1000
1500
2000
2500
0 100 200 300 400 500 600
Bas
e s
hea
r,kN
Roof displacement,mm
K1
K2
K3
K4
Design Baseshear
Page 54
45
Fig. 5.6: Comparison of Push over analysis of all types of Frames selected
5.6 PERFORMANCE PARAMETERS
Table 5. 2 illustrates various frames considered for the study, time periods and response
reduction factors considered for the design. The parameters, displacement ductility (Reza
Akbariet. al.(2013)),Rμ, Rs, and Y are calculated and depicted in the Table 5.2 for all the frames.
From table 5.2. In order to find the effectiveness of each bracing arrangement, the frames with
same weights are considered. It is seen that V4 and D4 have more ductility when compare with
other frames. Ductility reduction factor is more for D1 type of frame marginally. V4 and D1 give
more over-strength factor. K3 gives more allowable stress factor. It can be seen that with regard
to the frames V1, V2, V3 and V4 the total weight is same, and the behavior factor, R are
different. For the frame V4, the R factor is marginally more than that of others. Hence the
bracing arrangement of the frame V4 can be treated as relatively efficient. But overall D1 frame
shows more reduction factor as shown in table1. Similarly it is found that the bracing
0
500
1000
1500
2000
2500
3000
3500
0 100 200 300 400 500 600
Bas
e s
hea
r,kN
Roof displacement, mm
V1 V2
V3 v4
D1 D2
D3 D4
K1 K2
K3 K4
Page 55
46
arrangement in D and K family, D1 & K4 respectively are found to be performing better
compared to that of others.
Table 5.2: R factors parameters of the frames.
Frame Design
R
value
Ductility
μ
Rμ Rs Y Over
strength
R Total
weight
ton-
force
V1 4 1.94 1.73 1.59 3.57 5.67 9.83 884
V2 4 2.20 1.80 2.58 2.06 5.31 9.56 884
V3 4 2.33 1.88 1.65 3.30 5.44 10.29 884
V4 4 2.43 1.92 2.67 2.04 5.44 10.50 884
D1 4 2.42 2.02 2.84 2.85 8.09 16.41 884
D2 4 1.90 1.69 2.35 2.68 6.29 10.69 884
D3 4 1.92 1.75 1.60 4.00 6.40 11.31 884
D4 4 2 1.78 2.09 3.07 6.41 11.47 884
K1 4 2.03 1.72 1.34 4.38 5.86 10.14 884
K2 4 2.11 1.81 1.40 3.68 5.15 9.38 884
K3 4 2.42 1.91 1.14 4.65 5.30 10.21 884
K4 4 2.43 1.95 1.34 3.96 5.30 10.36 884
Page 56
47
CHAPTER -6
SUMMARY AND CONCLUSIONS
Summary
Conclusions
Page 57
48
SUMMARY AND CONCLUSIONS
6.1 SUMMARY
The selected frame models are analyzed using pushover analysis. The seismic
performance of a multi-story steel frame building is designed according to the provisions of the
current Indian code (IS 800 -2007). Shear capacity of the structure can be increased by
introducing Steel bracings in the structural system. Bracings can be used as retrofit as well.
There are „n‟ numbers of possibilities to arrange Steel bracings such as D, K, and V type
eccentric bracings. A typical six-story steel frame building is designed for various types of
eccentric bracings as per the IS 800- 2007. D, K, and V are the different types of eccentric
bracings considered for the present study. Performance of each frame is studied through
nonlinear static analysis. Fundamental period of the Building frames and corresponding mode
shapes are calculated. Pushover curves and behavior factors for the different eccentric steel
frames are compared to find the relative performances of various frames considered.
Page 58
49
6.2 CONCLUSIONS
Following are the major conclusions obtained from the present study.
Modal analysis of a 2D steel frame models reveals that, there is huge difference between
Computational Time periods and IS code Time period.
Ductility of a moment-resisting steel frame is to some extent affected by its height. When
bracing systems are included, the height dependency of ductility is greatly magnified.
Shorter
Steel-braced dual systems exhibit higher ductility and therefore higher R factors.
Considering the range of ductility capacities shown by different systems discussed, it is
found that the bracing arrangement in D and K family, D1 & K4 respectively are found to
be performing better compared to that of others.
Page 60
51
Bibliography
1. Akbas, B., Kara, F.I., and Tugsal, U.M. (2007), “Comparison of Pushover Analysis and
Nonlinear Dynamic Time History Analysis on Low-, Medium-, and High-Rise Steel
Frames”, Project No. 02-A-02-01-03, Scientific Research ProjectFund, Gebze Institute of
Technology
2. Applied Technology Council, ATC-40. Seismic evaluation and retrofit of concrete
Buildings, California, 1996; Vols. 1 and 2.
3. American Institute of Steel Construction Inc.– Steel Construction Manual (13th Edition)
4. AS 4100 ; 1998 – Australian Code for Design of Steel Structures
5. Bandyopadhyay T K and GuhaArijit, “Steel Structures” – Seminar on Revision of
National Building Code(NBC) organized by Indian Institute of Engineers, Delhi Centre,
2002.
6. Bandyopadhyay T K and GuhaArijit, “Code Stipulations – Indian & International Codes
and Revision of IS800” – Course at S V University College of Engineering, Tirupati,
2003
7. Bandyopadhyay T K and GuhaArijit, (2004), “Structural Member Design Based on Draft
IS: 800 (Limit States Method)” - published in INSDAG journal, Steel In Construction
8. Bandyopadhyay T K and GuhaArijit, ( 2005), "Structural Member Design Based on
Draft IS: 800 (Limit StatesMethod), Members subjected to Combined Bending and Axial
Forces” - published in INSDAG journal, Steel In Construction
Page 61
52
9. Chopra AK, Goel RK (2001), “A modal pushover analysis procedure to estimate seismic
Demands for buildings: Theory and preliminary evaluation”, Pacific Earthquake
Engineering Research Centre, University of California, Berkeley.
10. Duggal.S.K. „Limit State Design of Steel Structrues,Tata McGraw Hill Education
11. Federal Emergency Management Agency (FEMA),( 1997).NEHRP provisions for the
seismic rehabilitation of buildings. Rep FEMA 273 and 274. Washington, DC: FEMA.
12. IS 1893 Part 1 (2002),”Indian Standard Criteria for Earthquake Resistant Design of
Structures”, Bureau of Indian Standards, New Delhi
13. IS: 800 (1984), General Construction in Steel – Code of Practice, Bureau of Indian
Standards, New Delhi, 2007.
14. IS: 800 (2007), General Construction in Steel – Code of Practice, Bureau of Indian
Standards, New Delhi, 2007
15. Ohtori, Y., Christenson, R.E., Spencer, Jr, Dyke, S.J. (2000). Benchmark Control
Problems for Seismically Excited Nonlinear Buildings, http:/www.nd.edu/~quake/, Notre
Dame University, Indiana.
16. Prakash, V., Powell, G.H., and Campbell, S. (1993). DRAIN-2DX User Guide V.1.10,
Department of Civil Engineering, University of California at Berkeley.
Page 62
53
17. Reza Akbari and Mahmoud R. Maheri (2013), “Analytical investigation of response
modification (behavior) factor, R, for reinforced concrete frames rehabilitated by steel
chevron bracing” , Structure and Infrastructure Engineering, Vol. 9, No. 6, 507–515.
18. Seismostruct (2012), “SeismoStruct - A computer program for static and dynamic
nonlinear analysis of framed structures”, [online]. < http://www.seismosoft.com/ > (July
20,2012)
19. Structural steel design course material, NITTTR, Taramani, Chennai, Sep2010, pp2097.
20. Uniform Building Code (UBC), (1997). International conference of building officials.
Whittier, CA: International Conference of Building Officials (ICBO).
21. Zou XK, Chan CM. (2001) ,”Optimal drift performance design for nonlinear pushover
response of concrete structures”. In: WCSMO - 4: Proceedings of the fourth world
congress of structural and multidisciplinary optimization
.


![Commercial Steel Doors and/or Steel Frames UL 9005...Steelcraft . Steel Door Institute [3] Commercial Steel Doors and/or Steel Frames UL 9005 ... 2.1.9.1 Data Collection ... constitute](https://static.documents.pub/doc/80x56/5f1345cd207fec6b8b5e3eb2/commercial-steel-doors-andor-steel-frames-ul-9005-steelcraft-steel-door-institute.jpg)


![Commercial Steel Doors and/or Steel Frames UL 9005 Hardware Manufacturers Association . Steelcraft . Steel Door Institute [3] ... cycle of the COMMERCIAL STEEL DOORS AND/OR STEEL FRAMES](https://static.documents.pub/doc/80x56/5b0267fd7f8b9a65618f2619/commercial-steel-doors-andor-steel-frames-ul-9005-hardware-manufacturers-association.jpg)


