AUTHORS: Dr Muriel Watt, University of NSW Dr Rob Passey, IT Power (Australia) PV IN AUSTRALIA 2012 Prepared for the International Energy Agency PV Power Systems Programme BY Australian PV Association May 2013 Supported by
Transcript
AUTHORS:
Dr Muriel Watt, University of NSW Dr Rob Passey, IT Power (Australia)
PV IN AUSTRALIA 2012
Prepared for the International Energy Agency
PV Power Systems Programme
BY
Australian PV Association May 2013
Supported by
June, 2013 Australian National Photovoltaics Status Report 2012
i
INTERNATIONAL ENERGY AGENCY
CO-OPERATIVE PROGRAMME ON PHOTOVOLTAIC POWER SYSTEMS
Task 1
Exchange and dissemination of information on PV power systems
National Survey Report of PV Power Applications in Australia, 2012
The Australian PV Association
The objective of the APVA is to encourage participation of Australian organisations in PV
industry development, policy analysis, standards and accreditation, advocacy and collaborative research and development projects concerning solar photovoltaic electricity.
APVA provides:
Up to date information and analysis of PV developments in Australia and around the world, as well as issues arising.
A network of PV industry, government and researchers who undertake local and international PV projects, with associated shared knowledge and understanding.
Australian input to PV guidelines and standards development. Management of Australian participation in IEA SHC and PVPS Programmes,
including:
o PV Information Exchange and Dissemination o PV System Performance o High Penetration PV in Electricity Grids.
The Association receives funding from the Australian Renewable Energy Agency (ARENA: www.arena.gov.au ) to assist with the costs of IEA PVPS Programme membership, Task
activities and preparation of this report.
ACKNOWLEGEMENTS
This report is prepared on behalf of and with considerable input from members of the Australian PV Association and the wider Australian PV sector, especially:
Warwick Johnson, SunWiz Pty Ltd
Ric Brazzale, Green Energy Trading Pty Ltd
Ted Spooner, University of NSW
Nigel Morris, Solar Business Services
COPYRIGHT This report is copyright of the Australian PV Association. The information contained therein may freely be used but all such use should cite the source as “Australian PV Survey Report 2012, APVA, June, 2013”.
2.5 Public budgets for market stimulation, demonstration / field test programmes and R&D .................................................................................... 23
3 Industry and growth....................................................................................... 25
3.1 Production of photovoltaic cells and modules .......................................... 25
3.2 Prices and Trends ................................................................................ 25
3.3 Manufacturers and suppliers of balance of system components ................ 26
3.4 Labour places ...................................................................................... 28
3.5 Business value .................................................................................... 29
June, 2013 Australian National Photovoltaics Status Report 2012
iii
4 Framework for deployment (Non-technical factors) ............................................ 30
4.1 Solar Leasing ...................................................................................... 30
4.3 Interest from electricity utility businesses ............................................... 31
4.4 Interest from municipalities and local governments ................................. 31
4.5 Standards and codes ............................................................................ 31
5 Highlights and prospects ................................................................................. 33
Annex A: Background information – Australia 2012 ...................................................... 34
June, 2013 Australian National Photovoltaics Status Report 2012
iv
Definitions, Symbols and Abbreviations
For the purposes of this and all IEA PVPS National Survey Reports, the following definitions apply:
PV power system market: The market for all nationally installed (terrestrial) PV applications with a PV power capacity of 40 W or more.
Installed PV power: Power delivered by a PV module or a PV array under standard test
conditions (STC) – irradiance of 1 000 W/m2, cell junction temperature of 25oC, AM 1,5 solar spectrum – (also see ‘Rated power’).
Rated power: Amount of power produced by a PV module or array under STC, written as W.
PV system: Set of interconnected elements such as PV modules, inverters that convert d.c. current of the modules into a.c. current, storage batteries and all installation and control
components with a PV power capacity of 40 W or more.
CPV: Concentrating PV
Hybrid system: A system combining PV generation with another generation source, such as diesel, hydro, wind.
Module manufacturer: An organisation carrying out the encapsulation in the process of the
production of PV modules.
Off-grid domestic PV power system: System installed to provide power mainly to a household or village not connected to the (main) utility grid(s). Often a means to store electricity is used
(most commonly lead-acid batteries). Also referred to as ‘stand-alone PV power system’. Can also provide power to domestic and community users (plus some other applications) via a ‘mini-
grid’, often as a hybrid with another source of power.
Off-grid non-domestic PV power system: System used for a variety of industrial and agricultural applications such as water pumping, remote communications, telecommunication relays, safety
and protection devices, etc. that are not connected to the utility grid. Usually a means to store electricity is used. Also referred to as ‘stand-alone PV power system’.
Grid-connected distributed PV power system: System installed to provide power to a grid-connected customer or directly to the electricity grid (specifically where that part of the electricity grid is configured to supply power to a number of customers rather than to provide a
bulk transport function). Such systems may be on or integrated into the customer’s premises often on the demand side of the electricity meter, on public and commercial buildings, or simply
in the built environment on motorway sound barriers etc. They may be specifically designed for support of the utility distribution grid. Size is not a determining feature – while a 1 MW PV system on a rooftop may be large by PV standards, this is not the case for other forms of
distributed generation.
Grid-connected centralized PV power system: Power production system performing the function of a centralized power station. The power supplied by such a system is not associated with a
particular electricity customer, and the system is not located to specifically perform functions on the electricity grid other than the supply of bulk power. Typically ground mounted and
functioning independently of any nearby development.
Turnkey price: Price of an installed PV system excluding VAT/TVA/sales taxes, operation and maintenance costs but including installation costs. For an off-grid PV system, the prices
June, 2013 Australian National Photovoltaics Status Report 2012
v
associated with storage battery maintenance/replacement are excluded. If additional costs are
incurred for reasons not directly related to the PV system, these should be excluded. (E.g. If extra costs are incurred fitting PV modules to a factory roof because special precautions are
required to avoid disrupting production, these extra costs should not be included. Equally the additional transport costs of installing a telecommunication system in a remote area are excluded).
Field Test Programme: A programme to test the performance of PV systems/components in real conditions.
Demonstration Programme: A programme to demonstrate the operation of PV systems and their application to potential users/owners.
Market deployment initiative: Initiatives to encourage the market deployment of PV through the
use of market instruments such as green pricing, rate based incentives etc. These may be implemented by government, the finance industry, electricity utility businesses etc.
Final annual yield: Total PV energy delivered to the load during the year per kW of power installed.
Performance ratio: Ratio of the final annual (monthly, daily) yield to the reference annual (monthly, daily) yield, where the reference annual (monthly, daily) yield is the theoretical annual (monthly,
daily) available energy per kW of installed PV power.
Currency: The currency unit used throughout this report is Australian Dollars (AUD).
PV support measures:
Feed-in tariff an explicit monetary reward is provided for
producing PV electricity; paid (usually by the electricity utility business) at a rate per kWh that may be higher or lower than the retail
electricity rates being paid by the customer
Capital subsidies direct financial subsidies aimed at tackling the up-front cost barrier, either for specific equipment or total installed PV system cost
Green electricity schemes allows customers to purchase green
electricity based on renewable energy from the electricity utility business, usually at a premium price
PV-specific green electricity schemes allows customers to purchase green electricity based on PV electricity from the
electricity utility business, usually at a premium price
Renewable portfolio standards (RPS) a mandated requirement that the electricity utility business (often the electricity retailer)
source a portion of their electricity supplies from renewable energies
PV requirement in RPS a mandated requirement that a portion of the RPS be met by PV electricity supplies
(often called a set-aside)
Investment funds for PV share offerings in private PV investment
funds plus other schemes that focus on wealth creation and business success using PV as a vehicle to achieve these ends
June, 2013 Australian National Photovoltaics Status Report 2012
vi
Income tax credits allows some or all expenses associated with PV installation to be deducted from taxable
income streams
Net metering allows PV customers to incur a zero charge when their electricity consumption is exactly balanced by their PV generation, while being
charged the applicable retail tariff when their consumption exceeds generation and receiving some remuneration for excess
electricity exported to the grid
Net billing the electricity taken from the grid and the electricity fed into the grid are tracked separately, and the electricity account is
reconciled over a billing cycle
Commercial bank activities includes activities such as preferential home
mortgage terms for houses including PV systems and preferential green loans for the installation of PV systems
Activities of electricity utility businesses includes ‘green power’ schemes allowing
customers to purchase green electricity, operation of large-scale (utility-scale) PV plants, various PV ownership and financing
options with select customers and PV electricity power purchase models
Sustainable building requirements includes requirements on new building developments (residential and commercial)
and also in some cases on properties for sale, where the PV may be included as one option for reducing the building’s energy foot print or
may be specifically mandated as an inclusion in the building development
June, 2013 Australian National Photovoltaics Status Report 2012
vii
Foreword
The International Energy Agency (IEA), founded in November 1974, is an autonomous body within the framework of the Organisation for Economic Co-operation and Development (OECD)
which carries out a comprehensive programme of energy co-operation among its 23 member countries. The European Commission also participates in the work of the Agency.
The IEA Photovoltaic Power Systems Programme (IEA-PVPS) is one of the collaborative R & D
agreements established within the IEA and, since 1993, its participants have been conducting a variety of joint projects in the applications of photovoltaic conversion of solar energy into
electricity.
The 23 participating countries are Australia (AUS), Austria (AUT), Belgium (BEL), Canada (CAN), China (CHN), Denmark (DNK), France (FRA), Germany (DEU), Israel (ISR), Italy (ITA), Japan
(JPN), Korea (KOR), Malaysia (MYS), Mexico (MEX), the Netherlands (NLD), Norway (NOR), Portugal (PRT), Spain (ESP), Sweden (SWE), Switzerland (CHE), Turkey (TUR), the United
Kingdom (GBR) and the United States of America (USA). The European Commission, the European Photovoltaic Industry Association, the US Solar Electric Power Association, the US Solar Energy Industries Association and the International Copper Association are also members.
Thailand is a pending member.
The overall programme is headed by an Executive Committee composed of one representative from each participating country or organization, while the management of individual Tasks
(research projects / activity areas) is the responsibility of Operating Agents. Information about the active and completed tasks can be found on the IEA-PVPS website www.iea-pvps.org
Australia’s participation in the PVPS is undertaken by the Australian PV Association and is supported by ARENA. The Australian Executive Committee representative is Dr Muriel Watt, IT Power (Australia). In 2012 Australia participated in:
June, 2013 Australian National Photovoltaics Status Report 2012
viii
EXECUTIVE SUMMARY
Installed PV power
A total of 1038 MW of PV were installed in Australia in 2012. Of this 98% was grid-connected,
taking the cumulative grid-connected portion to 95%, up from 88% last year. Total installed capacity in Australia is now over 2.4 GW. PV power has now reached grid parity in many areas and government support programs are winding down.
Figure 1: Annual PV installations, Australia 2003-2012
Costs & prices
Typical module and system prices continued to fall in 2012, with balance of system prices now
equivalent to module prices. Module prices averaged AUD 1,8/Wp, but were as low as AUD 0,9/Wp, due partly to the high AUD exchange rate. Grid system prices averaged AUD 3,0/Wp,
down from AUD 3,9/Wp last year.
Figure 2: Typical module, system and balance of system costs Australia 2008-2012
0
200
400
600
800
1000
1200
2003 2004 2005 2006 2007 2008 2009 2010 2011 2012
MW
0
2
4
6
8
10
12
14
2008 2009 2010 2011 2012
A
ud
/Wp
Typical module price Typical small grid system price BOS price
June, 2013 Australian National Photovoltaics Status Report 2012
ix
PV production
A new module manufacturer, Tindo Solar, started operation in Adelaide, South Australia. Dyesol Ltd continues to produce dyes for the international dye solar cell market from its factory in
Queanbeyan, New South Wales and Solar Systems has installed a demonstration CPV plant in Victoria. A range of array frames, switch-gear and inverters are also manufactured in Australia.
Budgets for PV R&D
A total of AUD 104,6 million was spent in 2012 by the Australian and State & Territory Governments on PV R&D, demonstration and market stimulation. State and Territory funding
accounted for 46% of total expenditure.
Figure 3: The 10 MW Greenough River PV Power Station,
Western Australia (Photo: First Solar)
THE GREENOUGH RIVER SOLAR FARM
The 10 MW Solar power station is powered by more than 150,000 First Solar advanced thin film PV modules and will generate 22 GWh of electricity a year. This will displace over 20 000 tons of CO2 equivalent emissions per year, the equivalent of taking over 4000 cars off the road. The Western Australian Water Corporation, which is the State’s primary supplier of water, wastewater and drainage services, is purchasing 100% of the power generated by the solar farm for their Southern Seawater Desalination Plant. Verve Energy, the leading generator of electricity in WA, and GE Energy Financial Services each own 50% of the solar farm. The project is funded with 100% equity, with the WA Government providing AUD 20 million, including AUD 10 million from the WA Royalties for Regions program. In addition to supplying the solar modules for the project, First Solar provided engineering, procurement, and construction services, and is providing operations and maintenance support now that the solar farm is operational. Local contractor, WBHO Civil, provided site preparation services, underground electrical services and civil works, generating millions of dollars for the City of Greater Geraldton. The company’s local expertise and extensive network across WA ensured that the Greenough River Solar Farm was built to the highest possible standards. Up to 100 people were onsite at any one time throughout the construction phase, with jobs lasting for up to nine months.
June, 2013 Australian National Photovoltaics Status Report 2012
1
1 INTRODUCTION
The objective of Task 1 of the IEA Photovoltaic Power Systems Programme is to facilitate the exchange and dissemination of information on the technical, economic, environmental
and social aspects of photovoltaic power systems. An important deliverable of Task 1 is the annual Trends in photovoltaic applications report. In parallel, National Survey Reports are produced annually by each Task 1 participant. This document is the Australian National
Survey Report for the year 2012. Information from this document will be used as input to the annual Trends in Photovoltaic Applications report.
The PVPS website www.iea-pvps.org and the APVA website www.apva.org.au also play important roles in disseminating information arising from the programme, including national information.
Figure 4: The Hervey Bay Hospital, QLD, with a 265 kW Silex Solar PV array.
(Photo: Nearmap)
HERVEY BAY HOSPITAL
The Hervey Bay Hospital was allocated AUD 1,3 million from the Queensland Government to install 265 kW of PV, which are expected to provide approximately 385 MWh of energy annually or enough to power 50 homes for a year. The clean energy produced will reduce greenhouse gas emissions by around 400 tonnes per year.
In completing this project, 984 Silex solar mono-crystalline panels (270 W) were installed on 16 separate roofs spread over eight clusters. 38 ABB-PVS300 string inverters were used for a parallel generation system which will feed into the existing load.
The installation also includes an interactive web-kiosk and large screen television displaying energy
data, installed in the hospital's foyer as an education tool for visitors.
June, 2013 Australian National Photovoltaics Status Report 2012
2
2 THE IMPLEMENTATION OF PV SYSTEMS IN AUSTRALIA
The PV power system market is defined as the market of all nationally installed (terrestrial) PV applications with a PV capacity of 40 W or more. A PV system consists of modules,
inverters, batteries and all installation and control components for modules, inverters and batteries.
For the purposes of this report, PV installations are included in the 2012 statistics if the PV
modules were installed and commissioned between 1 January and 31 December 2012.
2.1 Applications for photovoltaics
The market for PV installations connected to central grids in Australia continues to increase and has represented the largest market for PV since 2009. In 2012, the majority of installations took advantage of incentives under the Australian Government’s Renewable
Energy Target (RET) mechanisms, with further drivers provided by State and Territory Feed-in Tariffs. The main applications are rooftop systems for private residences. There is also a separate program for installations on school buildings. With PV having reached grid parity
against retail electricity tariffs in many parts of Australia and government support reducing, the market is stabilising but remaining buoyant. The commercial and light industry sector
has grown more slowly than the residential sector to date, with support available to selected projects in certain areas through the Solar Cities and State government programs. Commercial sector interest in using PV to displace purchased power is increasing more
generally as electricity tariffs increase. The utility scale sector has started to grow with the commissioning of the first utility scale plant of 10MW (AC) capacity in Western Australia,
owned jointly by state government and private investment, and subsidised by state government funding. Larger scale plants have been announced in other states via the Flagships and ACT Feed-In Tariff programs.
The second largest installed capacity of PV in Australia is for off-grid residential systems where PV displaces diesel in hybrid power systems or provides power directly for lighting. Off-grid industrial and agricultural applications are also an important market. These include
power systems for telecommunications, signalling, cathodic protection, water pumping and lighting. Significant markets also exist for fuel saving and peak load reduction on diesel grid
systems. There is also a reasonably significant market for recreational PV applications for caravans, boats and off-road vehicles.
2.2 Total photovoltaic power installed
The PV power installed in 4 sub-markets during 2012 is in Table 1 and its contribution to the total electricity sector is shown in Table 2.
Table 1: PV power installed during calendar year 2012 in 4 sub-markets.
Sub-market/
application
off-grid
domestic
off-grid non-
domestic
grid-
connected distributed
grid-
connected centralized
Total
PV power installed in
2012 (MW)
10 6 1008 14 1038
Amount of PV in hybrid systems (MW)
15
June, 2013 Australian National Photovoltaics Status Report 2012
3
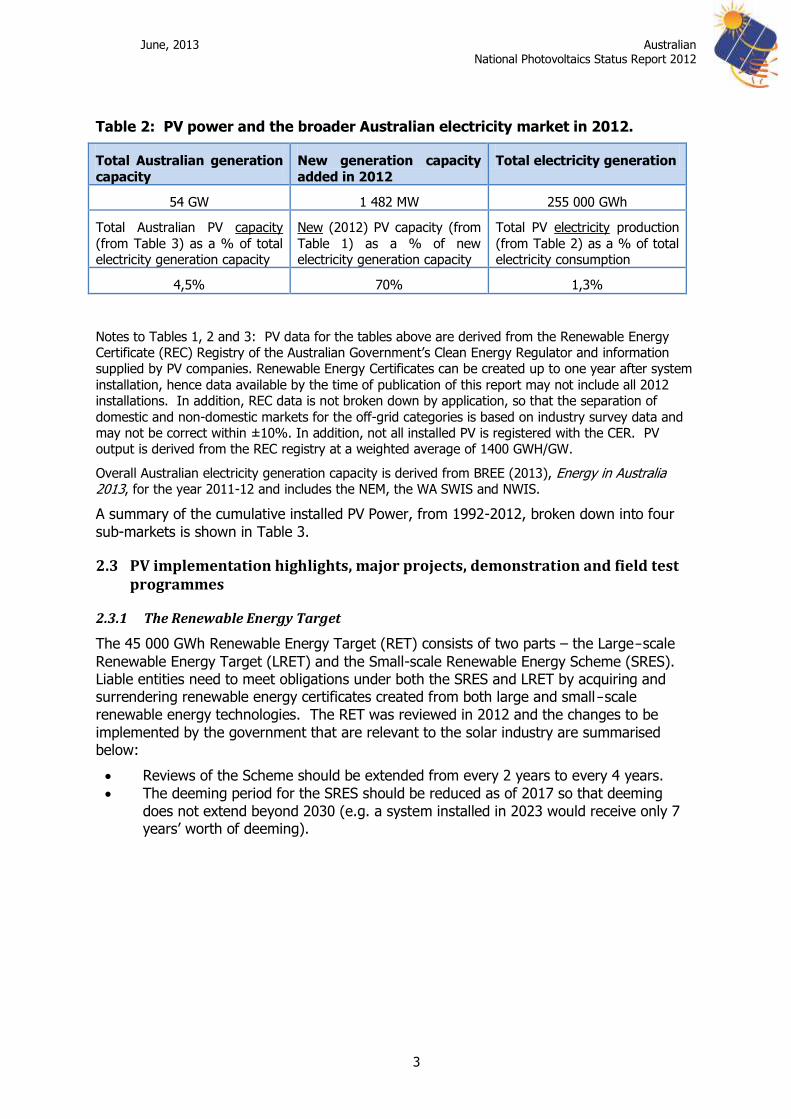
Table 2: PV power and the broader Australian electricity market in 2012.
Total Australian generation
capacity
New generation capacity
added in 2012
Total electricity generation
54 GW 1 482 MW 255 000 GWh
Total Australian PV capacity
(from Table 3) as a % of total electricity generation capacity
New (2012) PV capacity (from
Table 1) as a % of new electricity generation capacity
Total PV electricity production
(from Table 2) as a % of total electricity consumption
4,5% 70% 1,3%
Notes to Tables 1, 2 and 3: PV data for the tables above are derived from the Renewable Energy Certificate (REC) Registry of the Australian Government’s Clean Energy Regulator and information supplied by PV companies. Renewable Energy Certificates can be created up to one year after system
installation, hence data available by the time of publication of this report may not include all 2012 installations. In addition, REC data is not broken down by application, so that the separation of
domestic and non-domestic markets for the off-grid categories is based on industry survey data and may not be correct within ±10%. In addition, not all installed PV is registered with the CER. PV output is derived from the REC registry at a weighted average of 1400 GWH/GW.
Overall Australian electricity generation capacity is derived from BREE (2013), Energy in Australia 2013, for the year 2011-12 and includes the NEM, the WA SWIS and NWIS.
A summary of the cumulative installed PV Power, from 1992-2012, broken down into four
sub-markets is shown in Table 3.
2.3 PV implementation highlights, major projects, demonstration and field test programmes
2.3.1 The Renewable Energy Target
The 45 000 GWh Renewable Energy Target (RET) consists of two parts – the Large-scale
Renewable Energy Target (LRET) and the Small-scale Renewable Energy Scheme (SRES). Liable entities need to meet obligations under both the SRES and LRET by acquiring and surrendering renewable energy certificates created from both large and small-scale
renewable energy technologies. The RET was reviewed in 2012 and the changes to be
implemented by the government that are relevant to the solar industry are summarised below:
Reviews of the Scheme should be extended from every 2 years to every 4 years.
The deeming period for the SRES should be reduced as of 2017 so that deeming
does not extend beyond 2030 (e.g. a system installed in 2023 would receive only 7 years’ worth of deeming).
June, 2013 Australian National Photovoltaics Status Report 2012
4
Table 3: The cumulative installed PV power in 4 sub-markets.
off-grid domestic off-grid non-domestic grid-connected distributed grid-connected power stations
June, 2013 Australian National Photovoltaics Status Report 2012
6
2.3.1.1 Large-scale Renewable Energy Target (LRET)
The LRET, covering large-scale renewable energy projects like wind farms, commercial-scale solar and geothermal, will deliver the majority of the 2020 target.
The LRET includes legislated annual targets, as shown in Table 4.
Figure 6: The 401 kW Hervey Bay Community
Solar Farm, Wide Bay, Qld.
Table 4: Annual Generation Targets under the Large-scale Renewable Energy Target
Year Target
(GWh)
2011 10 400
2012 16 763
2013 19 088
2014 16 950
2015 18 850
2016 21 431
2017 26 031
2018 30 631
2019 35 231
2020 41 850
2021-2030 41 000
HERVEY BAY SOLAR COMMUNITY
FARM
The Hervey Bay Solar Community Farm is built on four hectares of
land just outside of Hervey Bay in Queensland and is the state’s
largest ground-mounted solar installation.
The 401 kW facility is expected to
generate approximately 630 MWh of energy per year, which is enough electricity to power about
100 homes. This renewable energy initiative saves 554 tonnes of
carbon emissions each year.
The Farm is comprised of 1 630 ground-mounted monocrystalline
Suntech solar panels. Other key pieces of infrastructure for the site
include two 330 kW PowerOne central inverters and unique pile-driven foundations the panels are
mounted on. The DC power produced by the PV array is reticulated to an inverter room
where two central inverters convert the electricity to AC power at 415 V
(3phase). The power is then run through a step-up transformer for connection to the grid at 22 000 V.
The solar farm also includes an innovative solar panel
demonstration site that consists of five 1 kW systems utilising different panel technologies for comparison
purposes. The demonstration site is linked into Ingenero’s online
monitoring software, ECoWatt, allowing online monitoring of performance.
The Queensland Government fully funded the installation, which will offset power usage for the local
Wide Bay Water Cooperation. The total cost of the project was AUD
2,7 million.
June, 2013 Australian National Photovoltaics Status Report 2012
7
2.3.1.2 Small-scale Renewable Energy Scheme (SRES)
The SRES covers small generation units (small-scale solar photovoltaic, small wind turbines and micro hydroelectric systems) and solar water heaters, which can create small-scale
technology certificates (STCs). Deeming arrangements mean that PV systems up to 100 kWp can claim 15 years’ worth of STCs up front up to 2016, but each year from then on will receive one year less deeming. The Clean Energy Regulator has established a voluntary
'clearing house' as a central point for the transfer of STCs at AUD 40, and liable entities are required to surrender STCs four times a year. There is no cap on the number of STCs that
can be created.
2.3.1.3 Solar Credits
Solar Credits work by multiplying the number of renewable energy certificates that these
systems would generally be eligible to create under the standard deeming arrangements. They apply to the first 1,5 kW of capacity for systems connected to a main electricity grid
and up to the first 20 kW of capacity for off-grid systems. Output from capacity above 1,5 kWp is eligible for only 1 STC per MWh. The unexpected high uptake of PV resulted in the Solar Credits multiplier being reduced to 1 (ie. no multiplier) as of the 1 Jan 2013, rather
than 1 July 2013 as planned. The annual caps for off-grid STCs and LGCs are shown in Table 6.
Table 5: Past and Anticipated Reduction in Solar Credit Multipliers
Date
installed
9 June 2009 –
30 June 2011
1 July 2011 -
30 June 2012
1 July 2012 -
31 Dec 2012
From 1 Jan 2013
onwards
Multiplier 5 3 2 No multiplier (1)
Table 6: Annual Caps for Off-grid STCs
Period of small generation unit
installation
Number
1 July 2010 to 30 June 2011 250 000
1 July 2011 to 30 June 2012 250 000
1 July 2012 to 30 June 2013 250 000
1 July 2013 to 30 June 2014 150 000
1 July 2014 to 30 June 2015 100 000
2.3.2 The ACT Large-scale Solar Auction
The ACT Large-scale Solar Auction commenced on 27 January 2012 and provided opportunity for proponents to bid, in a competitive reverse auction process, for up to 40 MW
of solar generation capacity in the ACT. The Stage 1 prequalification round saw 49 proposals lodged, with 22 of these invited to submit a Stage 2 final proposal in either a fast-track stream or regular stream. Up to 20 MW was made available in the fast-track stream,
with the remaining portion of the total 40 MW on offer available in the regular stream.
June, 2013 Australian National Photovoltaics Status Report 2012
8
The fast-track stream received 10 proposals in June 2012. On 5 September 2012 FRV Royalla Solar Farm Pty Limited was announced as the sole successful proponent with AUD 186/MWh (over 20 years, not indexed to inflation) for their 20 MW solar generator, to
be located on a rural property at Royalla in the south of the ACT. Unsuccessful fast-track stream proponents are eligible to resubmit a final proposal in the regular stream, due to close on 16 April 2013. The successful proponent (or proponents) is expected to be
announced in mid-2013.
The Solar Auction represents the first capacity release under the Electricity Feed-in (Large-
scale Renewable Energy Generation) Act 2011, which presently provides for up to 210 MW of renewable energy generation capacity in the Australian Capital Region. Future capacity releases will be informed by a review of the Solar Auction, due to be completed in late
2013/early 2014.
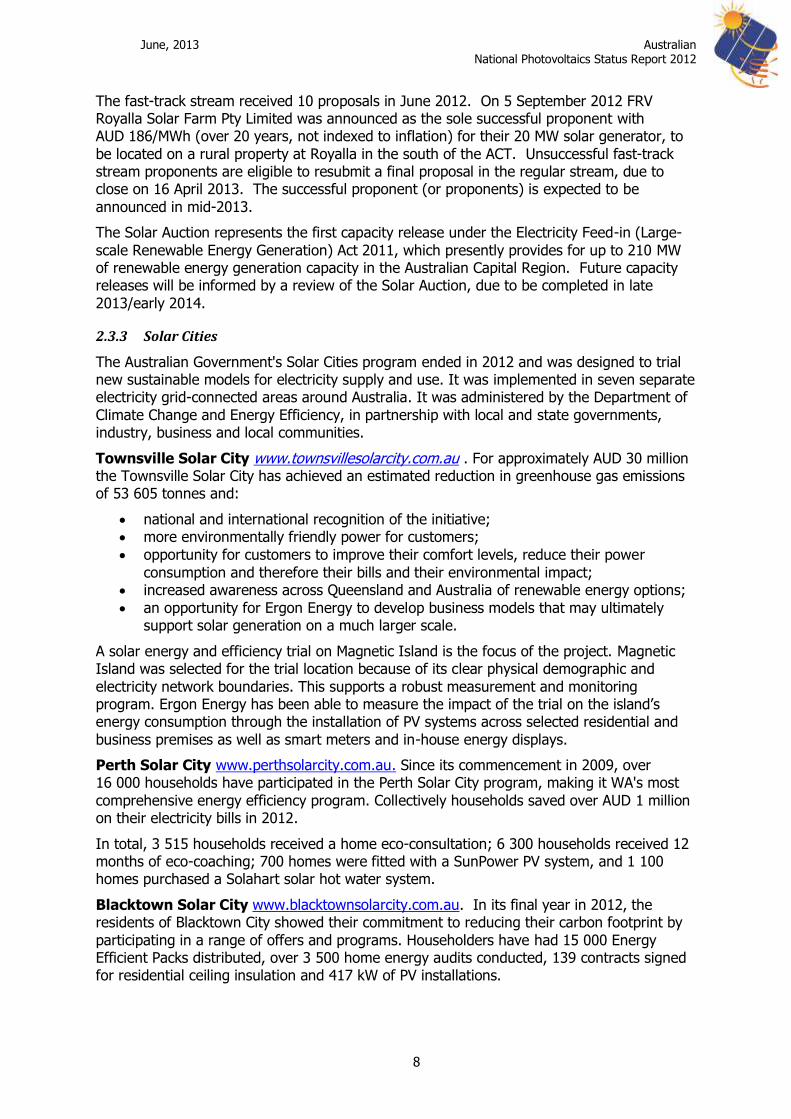
2.3.3 Solar Cities
The Australian Government's Solar Cities program ended in 2012 and was designed to trial new sustainable models for electricity supply and use. It was implemented in seven separate electricity grid-connected areas around Australia. It was administered by the Department of
Climate Change and Energy Efficiency, in partnership with local and state governments, industry, business and local communities.
Townsville Solar City www.townsvillesolarcity.com.au . For approximately AUD 30 million the Townsville Solar City has achieved an estimated reduction in greenhouse gas emissions of 53 605 tonnes and:
national and international recognition of the initiative; more environmentally friendly power for customers;
opportunity for customers to improve their comfort levels, reduce their power
consumption and therefore their bills and their environmental impact; increased awareness across Queensland and Australia of renewable energy options;
an opportunity for Ergon Energy to develop business models that may ultimately support solar generation on a much larger scale.
A solar energy and efficiency trial on Magnetic Island is the focus of the project. Magnetic Island was selected for the trial location because of its clear physical demographic and
electricity network boundaries. This supports a robust measurement and monitoring program. Ergon Energy has been able to measure the impact of the trial on the island’s energy consumption through the installation of PV systems across selected residential and
business premises as well as smart meters and in-house energy displays.
Perth Solar City www.perthsolarcity.com.au. Since its commencement in 2009, over 16 000 households have participated in the Perth Solar City program, making it WA's most
comprehensive energy efficiency program. Collectively households saved over AUD 1 million on their electricity bills in 2012.
In total, 3 515 households received a home eco-consultation; 6 300 households received 12 months of eco-coaching; 700 homes were fitted with a SunPower PV system, and 1 100 homes purchased a Solahart solar hot water system.
Blacktown Solar City www.blacktownsolarcity.com.au. In its final year in 2012, the residents of Blacktown City showed their commitment to reducing their carbon footprint by
participating in a range of offers and programs. Householders have had 15 000 Energy Efficient Packs distributed, over 3 500 home energy audits conducted, 139 contracts signed for residential ceiling insulation and 417 kW of PV installations.
June, 2013 Australian National Photovoltaics Status Report 2012
9
In local business, a 100 kW PV system was installed at Cadbury Schweppes, 110 kW at Coca Cola Amatil, 28,8 kW at Mount Druit Community Hub and 50 kW at Veolia Environmental Services. The Business Efficiency Program has also seen 23 sign-ups.
Central Victoria Solar City (CVSC) www.centralvictoriasolarcity.com.au. The CVSC aims to help the Central Victorian community rethink the way it uses energy. The project has developed a number of products and services that can help householders, businesses,
community centres, schools and hospitals in the region to reduce their energy use and/or transition towards more renewable energy sources. All of these products and services are
monitored through research.
All household project participants are asked to take part in vital research on energy use. The research data collected will be used to help form future Australian energy policy and assist
householders in better managing their energy use.
Alice Springs Solar City www.alicesolarcity.com.au. Alice Solar City has been embraced
by the local community, with the following achievements to date:
2 948 Households registered
2 757 Home energy surveys have been carried out 226 Businesses registered
AUD 7,49 million In incentive vouchers issued
AUD 6,31 million For residential and commercial solar and energy efficiency measures
316 PV systems installed on homes and businesses, funded by Alice Solar City 100 Additional PV systems installed in homes and businesses.
908 Residential Solar hot water systems installed
608 Smart meters installed on homes.
Adelaide Solar City www.adelaidesolarcity.com.au. A key feature of Adelaide Solar City is
its highly visible and innovative iconic buildings which use signage and interactive electronic public displays to demonstrate the energy and cost savings potential of solar technologies.
The Adelaide Central Bus Terminal has been fitted with a 50 kilowatt solar photovoltaic (PV)
system, which generates enough electricity to power 'Tindo', the world's first electric solar powered bus.
Another important feature is a smart metering and communication platform. It gives participating customers online access to data on their energy consumption and carbon emissions. An in-home display of energy-related content (including weather reports) has
also been developed to help customers manage their electricity use better.
Moreland Solar City http://www.morelandsolarcity.org.au/. More than 4 000 participants have signed up to receive free support to reduce electricity, travel and waste pollution.
Moreland Solar City offers to:
measure current pollution impact and carbon footprint
develop a personal plan for action
access incentives, support, new products provide monthly social nights to meet others taking action
seasonal offers to help sustainable living, such as draught proofing
community bulk buys to help purchase green technology, like solar panels sustainability advice and home renovator service
June, 2013 Australian National Photovoltaics Status Report 2012
10
2.3.4 National Solar Schools Program
The Australian Government’s National Solar Schools Program (NSSP) offers eligible primary and secondary schools the opportunity to apply for grants of up to AUD 50 000 to install
solar and other renewable power systems, solar hot water systems, rainwater tanks and a range of energy efficiency measures. Funding is capped in each financial year and annual
funding rounds are held. Applications are assessed against three criteria – value for money, environmental benefit and educational benefit. Additionally, to allow funding to be directed to schools in most need, applications from schools located in remote or low socio-economic
areas receive additional weighting.
Schools across Australia have responded with great enthusiasm to the NSSP. In the 2012-13 funding round, which was the final under this program, 1 600 applications were received
and 804 schools shared in over AUD 24 million. Since the program commenced on 1 July 2008, over 8 300 schools registered their interest to participate (88% of all eligible schools).
Over the life of the program more than AUD 217 million in funding has been awarded to over 5 300 schools for PV and other measures. Around 90% of approved schools have chosen to install a PV system with their NSSP funding. Several State Governments provide
additional funding.
2.3.5 Solar Flagships
In May 2009 the Australian Government announced a call for 1 GW of solar generation via four solar power stations (solar thermal and PV). The Solar Flagships program was split over two funding rounds with the first round to target 400 MW of electricity generation.
From the 52 proposals for funding in Round 1 of the program, two were selected in June 2011: the 150 MW Moree Solar Farm (PV) and the 250 MW Solar Dawn (solar thermal)
projects.
The projects were given until 15 December to meet financial close but were unable to do so. Solar Dawn’s financial close deadline was extended until 30 June 2012 but after losing state
government support it lost Federal government support and has been cancelled. The four shortlisted Round 1 PV applicants (AGL/First Solar, BP Solar, Infigen-Suntech and
TRUenergy) were asked to submit updated applications by 7 February 2012, and all did so. The AGL/First Solar project was selected and aims to deliver projects with a total nominal capacity of 150 MWac at Nyngan (100 MW) and Broken Hill (50 MW) in New South Wales.
The Australian Government will provide AUD 129,7 million in funding to support project implementation, and the NSW Government will provide AUD 64,9 million. Total capital expenditure for the two solar projects is expected to be approximately AUD 450 million. An
additional AUD 40,7 million has been made available to the Universities of Queensland and NSW for education infrastructure research funding associated with the Flagship.
2.3.6 Bushlight
Bushlight (www.bushlight.org.au) is a part of the Centre for Appropriate Technology, a national Indigenous science and technology organisation. Bushlight’s objective is to help
Indigenous communities to access energy services, manage them sustainably, and use them to contribute to their long-term livelihood. Bushlight designs, installs and maintains
renewable energy systems for remote Indigenous communities located throughout central and northern Australia. A central element of the Bushlight model is comprehensive community engagement, education and training.
Bushlight capital works and maintenance programs are primarily funded by the Australian Government. However, funding is also received from regional agencies, jurisdictional
departments and other sources for fee-for-service work on discrete projects.
June, 2013 Australian National Photovoltaics Status Report 2012
11
In 2012, Bushlight:
installed 5x new renewable energy systems using 75 kWp PV and 880kWh of
battery storage. Undertook upgrades of 7x older systems for a range of criteria which typically
included increased energy capacity. 75kWp PV and 1000kWh of battery storage was installed.
Repairs and maintenance to over 240 systems in 206 communities located in WA,
NT and Qld.
Figure 7: Bawaka Level 2 system training (Photo: Bushlight)
2.3.7 Remote Indigenous Energy Program (RIEP)
The Remote Indigenous Energy Program was established on 01 July 2011, with service
delivery commencing 01 July 2012. Similar to the Bushlight program, RIEP will install fit-for-purpose renewable energy systems in up to 50 smaller remote Indigenous communities, provide energy efficiency education, training in basic system maintenance and repair and
maintenance of selected existing systems. To date initial community engagement and field and concept design work is being undertaken, with the first systems expected to be installed towards the end of 2013.
2.3.8 State and Territory Support
State Governments support a range of research, development and demonstration projects,
as summarised in Section 2.5 and highlighted through various case studies cited in this report. Also, using funds from the WA government’s “Royalties for Regions” program,
Australia’s first Utility Scale Plant in Geraldton was installed by Verve Energy / GE.
A range of State based feed-in tariffs applied across Australia in 2012, as shown in Table 7. Note that these show the status of feed-in tariffs in 2012 and that some States have
announced changes for 2013.
June, 2013 Australian National Photovoltaics Status Report 2012
12
The changes that occurred in 2012 were:
The Victorian Transitional Feed-in Tariff replaced the Premium Feed-in Tariff as of 1
Jan 2012, and pays a minimum of AUD 0,25/kWh for systems up to 5 kW until 31 Dec 2016, but closed to new entrants on 30 Sept 2012. Net metering (called the Standard Feed-in Tariff) was available up to 31 Dec 2012 for systems up to 100 kW,
but only if all paperwork was submitted by 30 Sept 2012, and regardless converted to AUD 0,08/kWh as of 1 Jan 2013. The only tariff available as of 1 Jan 2013 is a net FiT of AUD 0,08/kWh for systems up to 100 kW, which is updated each year.
The South Australian Feed-in Tariff is very complicated and the amount received
depends on both when permission to connect was received and when the system was installed. The original feed-in tariff was reduced from AUD 0,44/kWh to AUD 0,16/kWh as of 1 Oct 2011 (which is less than the retail tariffs), and eligible systems
receive the payment only until 30 Sept 2016. As of 27 Jan 2012, systems are also eligible to receive what has been called a minimum retailer payment, which is compulsory and is meant to represent the value of the exported electricity to the
retailer. This is set at AUD 0,071/kWh for 2011-12, 0,098/kWh for 2012-13, and 0,112/kWh for 2013-14, when it will be reviewed. As of the 30 Sept 2013, new
systems will not receive a feed-in tariff, only the minimum retailer payment. In the Australian Capital Territory, systems up to 30 kW were eligible for an AUD
0,457/kWh feed-in tariff until 31 May 2011. Systems from 30 kW up to 200 kW were eligible for a feed-in tariff of AUD 0,3427/kWh from 1 April 2011. It was capped at 15 MW. From 12 July 2011, both size categories became eligible for the AUD
0,3427/kWh feed-in tariff, and so the 15 MW cap was reached by 13 July 2011 and the scheme was closed for all systems. For systems up to 30 kW that are not
receiving any feed-in tariff, the electricity retailer ActewAGL provides net metering. The Queensland AUD 0,44/kWh net feed-in tariff for systems up to 5 kW closed to
new entrants on the 10 July 2012, with PV systems receiving around AUD 0,08/kWh after this date.
The New South Wales AUD 0,20/kWh gross feed-in tariff was closed to new
applications as of midnight 28 April 2011. After that date new installations may receive payments from retailers that are meant to reflect the value of the exported
electricity to the retailer. This is currently around AUD 0,08/kWh. The Western Australian AUD 0,40/kWh net feed-in tariff was reduced to AUD
0,20/kWh from 30 June 2011, then closed to new applications from 1 Aug 2011. System owners are paid between AUD 0,084/kWh and AUD 0,50/kWh (depending on
location, retailer and whether residential or commercial) by retailers under the Renewable Energy Buyback Scheme.
June, 2013 Australian National Photovoltaics Status Report 2012
13
Table 7: Australian State and Territory Feed-in Tariffs in 2012
State Start Date
Size Limits
Rate AUDc/
kWh
Duration Years
Type Scheme end
Eligibility
Victoria (closed 1 Jan 2012)
1 Nov 2009
5 kW 60 15 Net - Residential, community, small business
Victoria (closed 30 Sept 2012)
1 Jan 2012 5 kW 44 Until 31 Dec 2016
Net - Residential, community, small business
Victoria (closed 30 Sept 2012)
1 Jan 2012 100 kW 25 Until 31 Dec 2012
Net metering
- Residential, community, small business
Victoria 1 Jan 2013 100 kW 8 (updated each year)
Open ended
Net - Residential, community, small business
South Australia (closed 1 Oct 2011)
1 July 2008
10 kVA 1Ø
30 kVA 3Ø
44 20 years from scheme
start
Net - A facility that consumes less than
160MWh/yr
South Australia
1 Oct 2011 10 kVA 1Ø
30 kVA 3Ø
16 Until 30 Sept 2016
Net Ends 30 Sept 2013
A facility that consumes less
than 160MWh/yr
South Australia 27 Jan 2012
10 kVA 1Ø
30 kVA 3Ø
9,8 (updated
each year)
Open ended
Net - A facility that consumes less
than 160MWh/yr
ACT
(no longer available)
1 March
2009
≤ 200 kW 34,27 to
45,7 depending on size
and date
20 Gross - Residential,
business
ACT - 30 kW Retail tariff Open ended
Net metering
- Residential, business
Northern Territory
- 30 kVA Retail tariff - Net metering
- NT wide
Queensland (closed 10 July 2012)
1 July 2008
10 kVA 1Ø
30 kVA 3Ø
44 20 years from start of scheme
Net - Consumers with less than
100MWh/yr
Queensland 11 July 2012
10 kVA 1Ø
30 kVA 3Ø
around 8-10
(updated each year)
Open ended
Net - Consumers with
less than 100MWh/yr
New South
Wales (closed 27 Oct 2010)
1 Jan 2010 10 kW 60 Until 31
Dec 2016
Gross - Residential
New South Wales (closed 28 April 2011)
28 Oct 2010
10 kW 20 Until 31 Dec 2016
Gross - Residential
New South Wales 28 April 10 kW around 8- Open Net - Residential
June, 2013 Australian National Photovoltaics Status Report 2012
14
2011 10 (updated each year)
ended
Western
Australia
(no longer available)
1 Aug
2010
5 kW (city)
10 kW 1Ø
30 kW 3Ø
(country)
40 to 30
June 2011
20 from 1 July 2011
10 Net Finished 1
Aug 2011
Residential
Western Australia
2005 5 kW to 1 MW
8,4 to 50 Open ended
Net - Residential, Commercial (Horizon
Power)
2.4 Highlights of R&D
PV research, development and demonstration are supported at the national, as well as the State and Territory level. In 2012, research grants were available through the Australian Research Council (ARC) and the Australian Solar Institute (ASI). The latter invested AUD 46
million in 2012 on PV research ranging from new manufacturing techniques to hybrid system technologies and building integrated PV. The funding included AUD 15 million towards a new USA-Australia Institute for Advanced Photovoltaics and other collaborative projects with
the USA and Germany. The ASI will be absorbed into a new Australian Renewable Energy Agency (ARENA) from 2013. A new Clean Energy Finance Corporation has also been
established, with AUD 10 billion to finance renewable energy, energy efficiency and low emission technologies.
Industry funding for technology development and demonstration was also available through
the Australian Centre for Renewable Energy, which provided AUD 2,2 million to Bluescope Steel for development of BIPV products, and through the Solar Flagships programme. AGL
and First Solar were the successful bidder for the Round 1 PV Flagship grant and will construct 106 MWp in Nyngan and 53 MWp in Broken Hill, NSW. The project cost is AUD 450 million, of which AUD 130 million was received from the Federal Government and AUD
65 million from the NSW Government. The systems are expected to be operational from 2014. An associated 3,275 MWp pilot research and storage facility worth AUD 40,7 million
will be established as an Education Investment Fund Research Infrastructure Project, to undertake power systems research.
2.4.1 CSIRO
CSIRO activities in photovoltaics include both commercially funded and strategic R&D, conducted under two of its Flagship programs, Energy Transformed and Future
Manufacturing. In 2012 CSIRO’s PV research involved approximately 30 FTE staff across two locations, the Energy Centre in Newcastle and the Clayton Laboratories in Melbourne. In this year construction commenced on two important new facilities at the Newcastle
Energy Centre. The first is a world-class laboratory for the standardised measurement of PV cell efficiency – this will become one of the few labs in the world accredited to ISO17025 for this measurement. The second is a large outdoor testing facility for commercial scale PV
modules. In Melbourne, the major advance this year was the establishment of a suite of fabrication equipment that, when combined, represents the largest and most diverse
capability for printing solar cells in Australia.
CSIRO’s PV research continues to include the development of new printable PV technologies based on organic materials or nanoparticle solutions.
June, 2013 Australian National Photovoltaics Status Report 2012
15
Newcastle PV Outdoor Research Facility
This 2500m2 facility will have a capacity of 110 PV modules for automated I-V testing, with temperature monitoring and Secondary Standard measurement of the solar irradiance
parameters and the solar spectrum. It will be used to support our new product development and our PV energy yield research, and will operate commercially as a product testing facility.
Figure 8: CSIRO’s PV module outdoor test facility under construction at the Newcastle Energy Centre
Victorian Organic Solar Cell Consortium
CSIRO is a partner in the Victorian Organic Solar Cells Consortium (VICOSC). VICOSC brings
together researchers from partners at the University of Melbourne, Monash University, BlueScope Steel, Securency, Innovia Films and Robert Bosch SEA. The aim of the consortium is to develop materials and processes to facilitate the industrial uptake of OPV
manufacturing. In 2011 the VICOSC consortium was supported by funding from the Victorian Government Department of Business and Innovation through the Victoria’s Science
Agenda (VSA) program. The VICOSC VSA project aims to develop the manufacturing processes required for roll-to-roll fabrication of organic photovoltaic devices. In 2011 the consortium successfully demonstrated large-scale, continuous printing of OPV devices for
the first time in Australia. In parallel with this project, funding from the Victorian Government Department of Primary Industries and the ASI supported research into new
materials and device architectures for high efficiency devices. Outcomes from this project will be fed into the VSA to enhance the value proposition of OPVs as a manufacturing technology for Australia.
In 2012 CSIRO commissioned two new pilot scale printers on behalf of the VICOSC consortium. The first is capable of reverse gravure and slot die coating on substrates up to 30cm in width. The second is a dual station screen printer with interchangeable thermal and
IR heaters. This printer will be used to deposit the electrode layers. The consortium has already demonstrated all steps in the process to produce fully printed, A4-sized solar cells in
batch mode. In 2013 this process will be made continuous using the new equipment.
June, 2013 Australian National Photovoltaics Status Report 2012
16
CSIRO and it’s VICOSC research partners were also part of the successful funding bid to form the Australian Centre for Advanced Photovoltaics (ACAP). In total, ACAP is planned to be an eight year, AUD 80+ million project that enables collaborative research between
Australian and US-based research providers across all forms of photovoltaics. The combination of research into thin film solar cells with established Si-based research in the one centre is a first for Australia and significantly raises the profile of thin film solar research
here and overseas.
Figure 9: VICOSC printers for OPV: Reverse Gravure & Slot Die (left); screen printer (right)
Newcastle Joint Research Centre for Organic Photovoltaics
This is a collaboration between CSIRO and the University of Newcastle with the aim of
developing new and improved architectures for organic solar cells. The research is built around studies of the fundamental processes occurring when light is absorbed in OPV devices, including the influence of material morphology on charge separation and transport
as well as lateral and axial device design and understanding the degradation mechanisms in these devices.
A hot topic is the new Dynamic Monte Carlo modelling capability, which for the first time allows modelling of every aspect of an OPV cell’s performance based on the fundamental properties of its materials. This technique is providing completely new information on the
critical energy loss processes that occur at the donor-acceptor interface.
Figure 10: Two different layer morphologies generated as input to the Dynamic Monte Carlo calculations: a bulk heterojunction (left) and a nanoparticle (right)
June, 2013 Australian National Photovoltaics Status Report 2012
17
Outdoor testing of research-scale cells and sub-modules
Through 2012 CSIRO continued a program of outdoor testing for cell and sub-module scale PV devices made from new materials. The work included participation in an international
round robin measurement of OPV devices involving 27 sites around the world.
2.4.2 Australian National University
PV research at the Australian National University (ANU) involves a group of 60 researchers, research students and support staff who undertake work in
the areas of photovoltaic solar cells, solar thermal and combined heat and power systems. The Centre for Sustainable Energy Systems
(http://sun.anu.edu.au) at ANU was founded in 1991, and is one of the largest and longest
established solar energy research groups in Australia. In 2012 work continued on the following projects funded by the Government and commercial partners:
Next Generation Sliver Solar Cells Roof-top solar micro concentrators
Plasmon solar cells
Flexible portable micro modules Back contact solar cells
Improving conventional silicon solar cells
Defect detection and quenching Advanced laser processes
Activities in CSES span the range from basic R&D through to technology commercialisation.
Commercialisation of several technologies is in progress. Research activities include defect
detection and surface passivation in silicon wafers; high performance silicon solar cells, including SLIVER solar cells; modelling; plasmons and nano PV
technology; PV modules, hybrid PV/thermal parabolic trough concentrator systems; and solar cooling. The
research is supported by an extensive PV testing and characterisation facility.
Figure 11: Micro concentrator
Current grants and contracts total AUD 30 million. Funding support comes from the Australian Research Council, the Australian Solar Institute, the Defence Department, industrial companies and several other sources.
Additionally, ANU offers a popular Renewable Energy Major as part of its undergraduate Engineering degree.
June, 2013 Australian National Photovoltaics Status Report 2012
18
Figure 12: Flexible micro module
Figure 13: laser micro machining
2.4.3 Swinburne University of Technology
As one of Swinburne’s key research priorities, the solar cell research program, hosted at the Centre for Micro-Photonics, has been receiving major support from government, industry and the university. This solar-cell R&D program is based on the ground-breaking concept of
Swinburne’s Nanoplas ™, a technology that incorporates broadband nanoplasmonic structures that dramatically increase the absorption efficiency of silicon solar cells.
Since the program’s inception, a world-class dedicated solar PV research facility has been
established at Swinburne with generous support from industry and the Victorian government’s Victoria Science Agenda.
During 2013 Swinburne will continue to strengthen its collaboration with industry, government and institutions across the globe in working to close the gap between research and commercial scale production of affordable novel PV technologies.
The solar research conducted at Swinburne’s Centre for Micro-Photonics has produced the world leading efficiency enhancement on thin film/wafer solar cells through the integration
of plasmonic nanoparticles. The creation of the broadband nucleated nanoparticle lays the foundation for a quantum leap in future solar cell efficiency gains. The centre will continue to lead plasmonic solar cell research on wafer and thin film solar cells as well as plasmonic
enabled solar storage technologies.
June, 2013 Australian National Photovoltaics Status Report 2012
19
2.4.4 University of NSW
PV related activities at UNSW are coordinated through the School of Photovoltaic and Renewable Energy Engineering (SPREE), which also hosts the PV Research Centre. The
Centre depends on industry-related funding for research with near-term outcomes and on ARC and international schemes for its long-term research. In recent years, project funding
provided by the ASI has been particularly important.
Applications during 2012 to the ASI (now ARENA) has led to the award to UNSW of new major support in the form of the US-Australia Institute for Advanced Photovoltaics and the
Australian Centre for Advanced Photovoltaics (ACAP). ACAP will also support activities at Australian National University, University of Queensland, Melbourne University, Monash University and CSIRO.
The Photovoltaics Research Centre
The Centre‘s mission is to advance silicon photovoltaic research on three separate fronts, as
well as to apply these advances to the related field of silicon photonics.
The Centre maintains its world-leadership in “first generation” devices, with international records for the highest-performing silicon cells in most major categories (including the
outright highest-performing cells and modules). First-generation Centre research addresses the dual challenges of reducing cost and further improving efficiency. The rapid growth of
the industry is generating widespread interest in on-going innovations of the Centre’s first generation technology.
Centre researchers have pioneered an approach where very thin silicon layers are deposited
directly onto a sheet of glass, with the glass providing the required mechanical strength. This “second-generation” approach gives enormous potential cost savings in wafer processing and silicon material. Cells also can be made more quickly over the entire area of
large glass sheets. A commercial product from spin-off, CSG Solar, is powering several megawatt fields in Europe. The Centre is now investigating electron-beam evaporation of
silicon onto the glass substrates and diode laser processing of the deposited films.
“Second generation” activities have been broadened from silicon to both silicon and carbon, with organic solar cell work, and copper-zinc-tin-sulphide solar cell research. By combining
these four relatively benign and abundant elements in appropriate proportions, a tetrahedrally co-ordinated “synthetic silicon” compound can be produced with some
advantages over silicon, such as stronger light absorption and more potential for bandgap control by alloying with similar compounds.
The Centre is also researching advanced “third-generation” thin-film solar cells targeting
significant increases in energy-conversion efficiency using “all-silicon” tandem solar cells, where high energy-bandgap cells are stacked on top of lower-bandgap devices. The silicon
bandgap is controlled by quantum-confinement of carriers in small silicon quantum-dots dispersed in an amorphous matrix of silicon oxide, nitride or carbide. Cells based on “hot” carriers are also of great interest since they offer the potential for very high efficiency from
simple device structures.
The final Centre research strand involves silicon photonics where the emphasis is on using the experience with solar cells, using light to produce electricity, to the reverse problem of
engineering silicon devices that use electricity to produce light. The Centre holds the international record for the light emission performance from bulk silicon, in both
electroluminescent and photoluminescent devices. Emphasis is now on developing new techniques for silicon wafer and cell characterisation. A Centre “spin-off” company, BT Imaging, remains the premium equipment supplier internationally using this approach.
June, 2013 Australian National Photovoltaics Status Report 2012
20
Photovoltaics Education
The ninth year of students from the Bachelor of Engineering (Photovoltaics and Renewable Energy) program graduated during 2012. This program has been enormously successful,
attracting some of the best and brightest students entering the University and providing the human resources to fuel the recent growth of the industry. The seventh year of students have now graduated from the Centre’s second undergraduate program, leading to a
Bachelor of Engineering (Renewable Energy).
The Cooperative Research Centre for Low Carbon Living
The Cooperative Research Centre for Low Carbon Living (www.lowcarbonlivingcrc.com.au) was launched on 12 December 2012. The aim of the CRC is “to provide government and industry with social, technological and policy tools to overcome identified market barriers
preventing adoption of cost effective low carbon products and services, while maintaining industry competitiveness and improving quality of life. The CRC assembles, for the first time,
the necessary critical mass and diversity of built environment stakeholders to address this complex multidisciplinary task, and provides government and industry with a vehicle for trialling alternative infrastructure and community engagement solutions.” Its “Integrated
Building Systems” research strand includes “building-integrated multipurpose solar products”.
Figure 14: The new Tyree Energy Technology Building, University of NSW.
June, 2013 Australian National Photovoltaics Status Report 2012
21
2.4.5 University of Queensland
The key areas of PV research at UQ include:
Centre for Organic Photonics and Electronics
This Centre focuses on developing new materials and architectures to push single and multiple junction organic solar cells to the Shockley-Queisser limit. This involves the creation
of novel light absorbing and charge transporting materials and geometries with a specific focus on developing a clear understanding of the underlying physics and chemistry of excitonic solar cells and on translating these learning to manufacturing scale. The Centre
recently became a partner in the new ARENA funded Strategic Research Initiative: Australia-US Institute for Advanced Photovoltaics. Within the SRI, the Centre will focus on applying its core expertise in charge transport physics in organic semiconductors and the creation of
new molecules for advanced photon harvesting concepts.
Power & Energy Systems Group
Renewable energy research focuses on the integration of variable energy sources, in particular wind and solar energy, and other base load (geothermal) renewable energy sources into electricity transmission and distribution networks. The research includes voltage
stability and reactive power (VAR) management of electricity networks, such as the placement of switched capacitor banks (SVC) and static compensator devices (STATCOMS);
increasing penetration of variable energy sources in distribution grids; design of new coordinated control schemes with energy storage systems and electric vehicles; and transmission of energy from renewable energy sources over long distances.
Energy Economics and Management Group
This Group is a national centre for economic research in the field of renewable energy and related environmental questions. To this end, the EEMG has developed two sophisticated
models of the national electricity market and other models for policy evaluation and to date has been focusing on solar and wind generation and the impacts of different kinds of carbon
mitigation policies on their adoption. The Group is affiliated with the Global Change Institute (GCI) at UQ and played a key role in the development of the very successful UQ Solar Array.
Global Change Institute
This Institute is a multi-disciplinary, cross-university organisation which seeks to address and answer some of the major questions facing the globe in an era of rapidly changing
climate. One area of key focus is Clean Energy in which it focuses upon opportunities and challenges in the evolving Australian Power System, Utility-scale PV and CST and concepts around distributed and off-grid power. In particular, the GCI manages the research program
of the UQ MW Array Project which is concerned with understanding the economics and integration issues associated with commercial-industrial scale PV (storage, power quality,
yield, and systems optimisation). The GCI will also be the management hub for the proposed Education Investment Fund (EIF) Research Program associated with the AGL Solar Flagships Project. UQ is the Lead Research Organisation and will partner the University of
New South Wales to deliver AUD 40,7 million of PV research infrastructure, the centrepiece of which is a proposed 3,25MW research pilot array and storage system at the university’s Gatton campus west of Brisbane.
Australian Institute of Bioengineering and Nanotechnology and Chemical Engineering
This Institute focuses on the development of new semiconducting nanomaterials as
photoanodes for 3rd generation dye-sensitised solar cells and quantum dot sensitised solar cells application. This involves the design, synthesis, electronic and structural modification of metal oxides to facilitate the dye/quantum dot absorption capability, light harvesting and
electron transfer efficiency. The research also includes the development of a new class of
June, 2013 Australian National Photovoltaics Status Report 2012
22
electrode materials that can have higher specific capacity, quicker charging-discharge rates and longer cycling life for new generations of batteries.
2.4.6 Dyesol Limited
Australia’s Dyesol Limited is a global leader in the field of third generation photovoltaics known as Dye Solar Cells (DSC) and a global supplier of DSC materials, technology and know-how. DSC is a photovoltaic technology which enables metal, glass and plastic
products in the building, transport and electronics sectors to generate energy and improve energy efficiency. Dyesol partners with leading multinational companies who possess significant market share and established routes-to-market. Dyesol's manufacturing partners
seek to value-add clean, green Dye Solar Cell technology onto their product range to meet growing consumer demands for sustainability and differentiation from the competition.
Dyesol made good progress in 2012, further advancing and validating our Dye Solar Cell technology, streamlining operations, and being recognised with a number of industry innovation awards (2012 Clean Energy Council Innovation Award, 2012 Manufacturers'
Monthly Endeavour Awards). The Company has pressed forward and continued steady progress on our core R&D activities which directly support our major and collaborative
projects. This R&D activity is mainly focussed on improving the materials and techniques that underpin the incorporation of our Dye Solar Cell photovoltaic enabling technology into products for the burgeoning Building Integrated Photovoltaic market.
DSC Technology, Research and Development
A key task is the scaling-up of production of suitable and optimum materials to the
volumes required for commercial manufacture. Large scale deployment in
the built environment requires DSC durability to match the life of the building product, with a levelised cost of energy
which must be grid competitive or better.
During the year, Dyesol established the
framework for a new 2-year collaboration with Singapore’s Nanyang Technological University (NTU). The focus of the joint
R&D effort centres around ‘solid-state DSC’ providing an alternative to liquid based
electrolytes, which may offer advantages in certain product applications.
Figure 15: DSC Research Laboratories
(Photo: Dyesol)
Also during the year, Dyesol achieved a 15% increase in DSC efficiency performance, up from 6% to 8% for long term stable, industrial-sized strip cells, and passed the stringent
1000 hour 85°C stress test, as required by IEC PV test standards.
June, 2013 Australian National Photovoltaics Status Report 2012
23
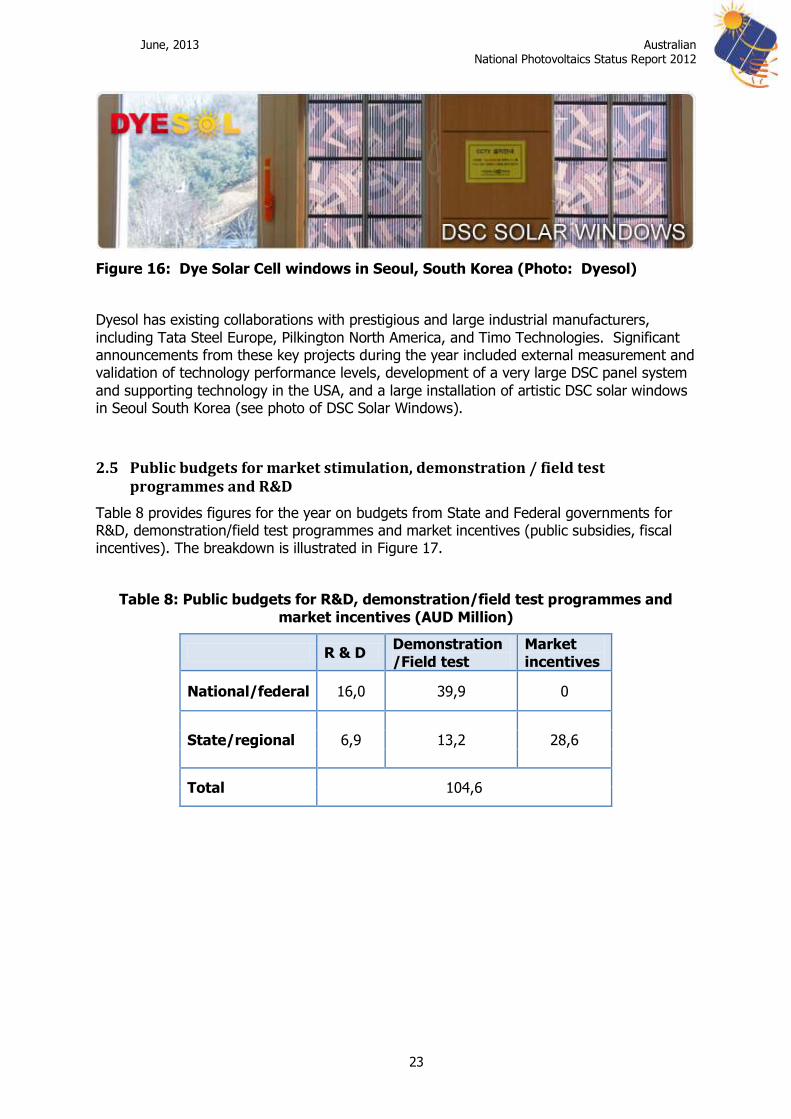
Figure 16: Dye Solar Cell windows in Seoul, South Korea (Photo: Dyesol)
Dyesol has existing collaborations with prestigious and large industrial manufacturers,
including Tata Steel Europe, Pilkington North America, and Timo Technologies. Significant announcements from these key projects during the year included external measurement and validation of technology performance levels, development of a very large DSC panel system
and supporting technology in the USA, and a large installation of artistic DSC solar windows in Seoul South Korea (see photo of DSC Solar Windows).
2.5 Public budgets for market stimulation, demonstration / field test programmes and R&D
Table 8 provides figures for the year on budgets from State and Federal governments for R&D, demonstration/field test programmes and market incentives (public subsidies, fiscal incentives). The breakdown is illustrated in Figure 17.
Table 8: Public budgets for R&D, demonstration/field test programmes and
market incentives (AUD Million)
R & D Demonstration
/Field test
Market
incentives
National/federal 16,0 39,9 0
State/regional 6,9 13,2 28,6
Total 104,6
June, 2013 Australian National Photovoltaics Status Report 2012
24
Figure 17: Distribution of 2012 Australian R, D & D Funding
Research 22%
Demonstration 51%
Markets 27%
June, 2013 Australian National Photovoltaics Status Report 2012
25
3 INDUSTRY AND GROWTH
3.1 Production of photovoltaic cells and modules
Tindo Solar began manufacturing in Adelaide, South Australia during 2012. It uses imported
Q.Cells UMG cells and Enecsys micro inverters to produce 250 W ac modules.
Dyesol manufactures DSSC pastes, dyes and electrolytes for use by Dye Solar Cell manufacturers overseas and has a number of joint ventures around the world.
Solar Systems Pty Ltd is developing concentrating PV systems in Victoria and has several trial systems in operation.
Total PV cell and module manufacture together with production capacity information is summarised in Table 5 below.
Table 9: Production and production capacity information for 2012
Cell/Module manufacturer
(or total national production)
Technology (sc-Si, mc-Si,
a-Si, CdTe)
Total Production (MW) Maximum production capacity (MW/yr)
Cell Module Cell Module
Wafer-based PV manufactures
1 Tindo 1.3 60
Figure 18: Tindo manufacturing line, Adelaide
3.2 Prices and Trends
A summary of typical system prices is provided in Table 10. Note that prices can vary widely
across the country and by application.
June, 2013 Australian National Photovoltaics Status Report 2012
26
Table 10: Turnkey Prices of Typical Applications
Category/Size Typical applications and brief details AUD per W
OFF-GRID Up to 1 kW Remote homes, water pumps, lights 6-15
OFF-GRID >1 kW Telecommunications, pastoral/mining power systems
7-20
ON-GRID Specific case 1-5 kW residential roof-mounted systems 2,5-3,5
ON-GRID up to 10 kW Larger roof mounted systems on homes, public buildings
3-4
ON-GRID >10 kW Larger roof mounted systems on public and commercial buildings
5-7
GRID – CONNECTED (utility-scale)
Large ground mounted systems in solar farms or at diesel power stations.
1,5 -2
Trends in typical and best prices for PV modules in Australia in 2012 are shown in Table 11, small-scale off-grid system prices Table 12 and residential grid-connected system prices in Table 13.
3.3 Manufacturers and suppliers of balance of system components
Balance of system component manufacture and supply is an important part of the PV system value chain.
A range of mounting and tracking systems is made in Australia to suit local conditions.
Specialised fuses, switches and off-grid inverters are also made locally.
June, 2013 Australian National Photovoltaics Status Report 2012
27
Table 11: Trends in module prices in Australia 1993-2012 (Current AUD excluding GST)
June, 2013 Australian National Photovoltaics Status Report 2012
28
3.4 Labour places
Table 14 shows estimated full-time equivalent labour places in 2012. Significant research
and educational activity continues. However, with the residential market stabilising, many installation companies have reduced staffing. Development of larger systems is increasing, with associated increases in consulting, engineering, legal and related activities. In addition,
as PV grid penetration levels rise, more utility staff are engaged in PV related work.
Table 14: Estimated PV-related labour places in 2012
Employment category Full-time equivalent labour places
Public research and education 300
Manufacturing, including company R&D
200
Sales, design, engineering and consulting
1000
Installation and maintenance 9000
Electricity utilities and government 500
Legal, finance, REC trading and industry support
200
Other 400
TOTAL 11600
June, 2013 Australian National Photovoltaics Status Report 2012
29
3.5 Business value
The value of PV business in Australia in 2012 is estimated in Table 15.
Table 15: Value of Australian PV business in 2012
Sub-market Capacity
installed MW
AUD per
MW
Value AUD
million
Totals
AUD millions
Off-grid domestic
10 10000 100
Off-grid non-domestic
6 14000 86
Grid-
connected distributed
1008 3000 3024
Grid-connected centralized
14 1800 25
3235
Export of PV products
Change in stocks held
Import of PV products -1557
Value of PV business 1678
For the dominant residential market, much of the system componentry is imported. As the market moves to larger systems, this may change, with the likelihood of more individually designed and engineered systems. The high Australian dollar exchange rate has
encouraged imports, but there remains interest in local component manufacture and this may increase if the value of the Australian dollar falls.
June, 2013 Australian National Photovoltaics Status Report 2012
30
4 FRAMEWORK FOR DEPLOYMENT (NON-TECHNICAL FACTORS)
Table 16 lists the main support measures for PV during 2012. No new measures were introduced in 2012, while some of those listed were reduced or closed to new participants.
Table 16: PV support measures
On-going measures Jurisdiction
Feed-in tariffs (gross / net?) State
Capital subsidies for equipment or total cost
Green electricity schemes National / utility
PV-specific green electricity schemes
Renewable portfolio standards (RPS) National
PV requirement in RPS
Investment funds for PV National / State
Income tax credits
Net metering State
Net billing State
Commercial bank activities e.g. green mortgages promoting PV
Local
Activities of electricity utility businesses Regional
Sustainable building requirements State / Local Government
4.1 Solar Leasing
A number of companies now offer solar leasing in Australia, where the customer pays zero up-front costs, and can either pay a fixed monthly amount or can pay only for the electricity
that the PV system produces. One variation is that if the customer is paying on a per kWh basis, the payment may either be indexed to inflation or it may be fixed but start at a higher rate. The lease generally includes a ‘performance guarantee’ that guarantees the system will
produce a minimum amount of electricity each year. The installer is also responsible for maintaining the system and replacing any faulty components.
4.2 Indirect policy issues
An emissions trading scheme was introduced to Australian electricity in 2012. Carbon is priced at a set level of AUD 23 / tonne for 3 years and will then revert to the international
market price. The scheme does not have bi-partisan political support and the current opposition has indicated that it will be removed should they win office at the September 2013 election.
Significant compensation packages for end users, coal fired generators and trade exposed industries accompanied the introduction of carbon pricing. Nevertheless, interest in energy efficiency and renewable energy options is growing.
June, 2013 Australian National Photovoltaics Status Report 2012
31
4.3 Interest from electricity utility businesses
As PV penetration levels have risen rapidly across the country, electricity utilities have had to deal very quickly with both the technical and the business implications. While some network
service providers have reported voltage rise and inverter drop-outs due to both frequency and voltage, most of the concern has been about potential impacts, not real problems. The key issues concern integration of PV into old grids with little automated electronic control
strategies or equipment. No use is currently made of the potential for PV inverters to assist with grid management.
The main impact for established utilities has been on their business models. Established generators are losing market share to PV, especially during the high value daytime load periods. In addition, both the networks and retailers earn most of their revenue from kWh
sold and hence have been impacted by demand reduction due to distributed PV systems. The implications of increased distributed energy, not just PV but also energy efficiency, demand management, storage, solar water heaters and other new technologies, are
significant for current electricity regulatory and business models. Discussion is starting on new regulatory arrangements; however the current focus is more on introducing short-term
measures to protect established businesses, while in the longer term a new regulatory framework will be required.
While the Australian electricity market is disaggregated, retailers are allowed to operate
generation businesses. The two largest Australian electricity retailers have both established PV businesses and have now captured significant market share.
At the central generation level, utility involvement via power purchase agreements or otherwise is necessary for project success. AGL is the lead partner in Australia’s largest PV power station project, the Solar Flagship installations at Nyngan and Broken Hill. Similarly,
Verve Energy was a partner in the 10 MW power plant constructed in WA in 2012 and ACTEW AGL will purchase power from the Royalla 20 MW plant in the ACT.
4.4 Interest from municipalities and local governments
Many Local Governments are actively involved in greenhouse gas reduction programs and have supported PV installations on public buildings. As PV penetration levels rise, their
interest in associated issues of solar access, strata title requirements, building and fire regulations and so on is also increasing.
Local Governments have been actively involved in the seven Solar City programs and are
showing increasing interest in supporting community solar projects. This is a potentially important new market area for PV, particularly in urban areas where individual access to
suitable sites for PV may be restricted.
4.5 Standards and codes
PV system safety is currently a top priority after a number of potential safety issues were
found during auditing of PV installations in Australia. In 2012 a revision of AS/NZS5033 “Installation of PV arrays” was published. It covers installations up to 1500V d.c. but only allows 600V installations on domestic dwellings. The revision included a major upgrade to
installation safety, requiring compliance to IEC 62109 for inverters and reinforced cable protection provisions.
A major revision of AS/NZS 4777 – Grid connection of energy systems via inverters is still
being undertaken and will be published late in 2013 or early 2014. The revision is aimed at addressing many issues raised by electricity utilities and will help more uniform acceptance of PV systems connected to the utility grid. This standard looks to the future where local
power and VAr control will assist with voltage regulation and where communication options
June, 2013 Australian National Photovoltaics Status Report 2012
32
are explored for utility control. Currently the Australian committee is working to enable better definitions of requirements for microinverters and a.c. modules. The committee is also working with the IEC TC82 Photovoltaics committee to improve safety of inverters and
create installation guidelines within the IEC range of documents that will allow more worldwide adoption of common requirements.
June, 2013 Australian National Photovoltaics Status Report 2012
33
5 HIGHLIGHTS AND PROSPECTS
Despite the withdrawal or reduction of several key PV support policies in 2012, the Australian residential PV market is one of the first in the world to reach grid parity.
Consequently the market remained strong and grew by a further 75%, after two years of growth of over 100% per year. Nevertheless, as for international markets, some consolidation is beginning to occur, as well as some differentiation of business offerings.
Growth rates are expected to fall again in 2013, although the market is beginning to be driven less by subsidies and more by desires for longer term electricity price surety.
As the residential market stabilises, growth is expected in the commercial and medium scale market. This requires different skill sets with more emphasis on engineering and individual system design and will therefore see a shift in the type of PV business operations. For this
market to develop, however, more standardised procedures and utility requirements will be needed. Working with the electricity sector to establish these will be a key focus for industry representative bodies over the next few years.
The utility scale market is also expected to grow, although at a slower rate due to competition with bulk supply rather than retail electricity tariffs. It faces its own set of
challenges, including the need for individual engineering and system design, as well as developer and utility familiarity with PV, via development and ownership of these plants.
A more stable market will allow the industry to establish more robust infrastructure for on-
going development, including better mechanisms to check the quality of products and installations. Customer support for PV is high at present and it will be up to the industry as
a whole to ensure this regard is maintained. In addition to training and quality control, Australia will need to establish facilities for PV module and system component maintenance and recycling. As the interest in storage increases, even more emphasis will be needed on
the quality of installations and on battery management for safety and environmental reasons.
Australia has a large PV research effort, with a correspondingly high level of interest in new products and technologies. A new module manufacturing plant began operation in South Australia during 2012. Others are potentially interested in manufacturing, but policy
uncertainty and a high AUD exchange rate are preventing investment at present.
The PV sector in Australia is moving to the next phase of its development. It is already a key component of the energy mix and is likely to become a significant portion over coming
decades. In addition, the Asia-Pacific PV market is growing strongly, and the demand for Australian PV expertise is likely to grow.
June, 2013 Australian National Photovoltaics Status Report 2012
34
ANNEX A: BACKGROUND INFORMATION – AUSTRALIA 2012
This information is simply to give the reader some background about the national environment in which PV is being deployed. It is not guaranteed to be 100 % accurate nor
intended for analysis, and the reader should do their own research if they require more detailed data.
1) Typical regulated retail electricity prices – household and commercial: 26c/kWh (Australian Energy Regulator)
3) typical metering arrangements and tariff structures for electricity customers – most residential customers are on flat, regulated tariffs. Some PV customers have moved to TOU
metering.
4) average annual household income: AUD 52 520 (Australian Bureau of Statistics)
7) electricity industry structure and ownership - separate generation, transmission,
distribution and retailer businesses. Some remain in state ownership, others are privatised. It is regulated by an independent statutory authority, the Australian Energy Regulator.
8) price of diesel fuel – AUD 150/litre
9) typical values of kWh / kW for PV systems in Australia – range from 1300 to 1700 kWh/kW across the capital cities from south to north.