PVA Fiber Reinforced Shotcrete for Rehabilitation and Preventative Maintenance of Aging Culverts A final report submitted to the Alabama Department of Transportation Project 930-657 December 2008 Investigators: James S. Davidson, Associate Professor Junsuk Kang, Research Assistant Department of Civil Engineering Auburn University Thomas C. Grimes, Chief Engineer Shelby County Highway Department Jim Farrell, President Blastcrete Equipment Company Uday K. Vaidya, Professor Brian Pillay, Assistant Professor Balaji Thattaiparthasarat, Research Assistant Department of Materials Science and Engineering The University of Alabama at Birmingham
Transcript
PVA Fiber Reinforced Shotcrete for Rehabilitation and Preventative Maintenance of Aging Culverts
A final report submitted to the Alabama Department of Transportation
Project 930-657
December 2008 Investigators: James S. Davidson, Associate Professor Junsuk Kang, Research Assistant Department of Civil Engineering Auburn University Thomas C. Grimes, Chief Engineer Shelby County Highway Department Jim Farrell, President Blastcrete Equipment Company
Uday K. Vaidya, Professor Brian Pillay, Assistant Professor Balaji Thattaiparthasarat, Research Assistant Department of Materials Science and Engineering The University of Alabama at Birmingham
2
ABSTRACT The goal of this project was to investigate the potential for using PVA (polyvinyl alcohol) fiber reinforced mortar for the rehabilitation and preventative maintenance of aging metal highway drainage culverts using a spray-on liner application approach. The interest and impetus for the investigation resulted from prior work of the investigators with county engineers that pointed towards the need for new cost-saving technologies for rehabilitating deteriorated metal highway drainage culverts that preclude the need to close the roadway and excavate the existing structure. The investigation was conducted by a team comprised of the polymer materials expertise of the UAB Department of Materials Sciences and Engineering, the civil/structural engineering expertise of the Auburn University Department of Civil Engineering, and the concrete application solutions expertise of Blastcrete Equipment Company, Inc. The investigation focused on the strength and toughness advantages provided by reinforcing spray-on concrete (shotcrete) with high performance PVA fibers. Tasks included developing and optimizing the material concept, laboratory strength testing, and developing engineering design methodology. Full scale demonstrations of the concept were accomplished by Blastcrete Equipment Company, Inc., at their facility in Anniston Alabama. The laboratory-scale component of the investigation verified the significant tensile strength, ductility, and strain-hardening characteristics that have been presented by others for PVA-ECC (engineered cementitous composite). However, achieving the performance demonstrated by others proved to be challenging, even in a controlled laboratory environment. Ductility and strength performance depends upon using very precise and specific constituents, including fine silica sand with average particle diameter of 110 µm or less, and proprietary admixtures required to prevent clumping of the fibers. Also, since PVA fibers are hydrophilic, achieving proper water content proved challenging. These challenges were amplified when developing a methodology for pumping and spraying the PVA reinforced mortar on the inside of a corrugated steel pipe. Many iterations were required to balance the challenges of pumpability and sprayability with the requirement that the liner material must readily adhere to the obvert of the metal pipe. After successfully lining a 48 inch pipe, a three-point bending test was conducted to illustrate the strength and stiffness enhancement provided by the liner. Finally, an analytical approach was derived for designing the required liner thickness, and practical field implementation challenges were outlined. Overall, it was concluded that the approach offers great potential as a solution to the metal culvert deterioration problem. PVA-ECC offers intriguing and unique characteristics that would minimize the required liner thickness while providing the tension strength, rigidity and ductility required. It was recommended that the next step be to demonstrate that that a uniform structurally sound liner can be applied under field conditions. Additional recommendations included to (1) develop field construction guidelines, (2) investigate long-term stability issues to ensure stable strength over the service life of the culvert, and (3) refine and validate engineering and design methodology through controlled laboratory testing.
3
ACKNOWLEDGEMENTS The research represented herein was sponsored through Alabama Department of Transportation (ALDOT) Project 930-657. The proposal was developed by Dr. Jim Davidson while an Associate Professor in the Department of Civil and Environmental Engineering at The University of Alabama at Birmingham (UAB) and Mr. Tim Hartness while a research engineer at the Southern Research Institute; Mr. Hartness subsequently moved to the Department of Materials Sciences and Engineering (MSE) at UAB. Shortly after the project began, Mr. Hartness retired and Dr. Davidson moved to Auburn University. Drs. Uday Vaidya, Brian Pillay, and Balaji Thattaiparthasarat of UAB MSE joined the team in place of Mr. Hartness to execute the material testing and analysis tasks. Patrick Paolone supported the mixing and manufacture of test samples at the UAB structures laboratory. Dr. Junsuk Kang of Auburn University conducted the analytical and design methodology tasks. Materials were donated by Sherman Ready Mix, Lehigh Cement Company, Nykon, Kuraray America, and GST International. Hanson Pipe and Precast in Birmingham Alabama allowed us to use their test frame for the full-scale load test. Blastcrete Equipment Company, Inc., provided enormous resources and support to all aspects of the effort at their own expense. The project team is extremely grateful for the contributions provided by our industry partners, and in particular, the technical assistance and patience provided by our friends at Blastcrete Equipment Company.
4
TABLE OF CONTENTS SECTION 1: INTRODUCTION AND PROJECT DESCRIPTION .................................8 1.1 Introduction ..........................................................................................................................8 1.2 Objectives ............................................................................................................................8 1.3 Scope and Methodology ......................................................................................................9 SECTION 2: REVIEW OF RELEVANT LITERATURE ...............................................10 2.1 Introduction ........................................................................................................................10 2.1.1 Factors Affecting Fiber and Matrix Selection 2.2 Mechanism of Tensile Strain-Hardening ...........................................................................11
2.2.1 Micromechanical Model 2.2.2 Interface Tailoring for Strain-Hardening Behavior 2.2.3 Mechanical Performance of PVA-ECC with High Volume Fly Ash
2.3 Rheological Control of Fresh Mix by Addition of Admixtures .........................................15 2.4 High Early Strength of PVA-ECC .....................................................................................15 2.5 Design of PVA-ECC for Shotcreting .................................................................................16 SECTION 3: MATERIAL CHARACTERIZATION AND DEVELOPMENT OF MIX DESIGN ..................................................................................................................................18 3.1 Laboratory Specimen Preparation ......................................................................................18 3.2 Mechanical Properties Characterization ............................................................................23
4.3.1 Hydraulic Capacity Reduction 4.3.2 Pre-existing Conditions 4.3.3 Liner Material Properties 4.3.4 Weather and Ambient Temperature Effects 4.3.5 Site Accessibility
SECTION 5: ENGINEERING METHODOLOGY ..........................................................36 5.1 Introduction .......................................................................................................................36 5.2 Design of Manufactured Mortar Lined Pipe [Rinker 2006] .............................................36 5.3 Soil Model and Parameters ...............................................................................................37 5.4 Finite Element Modeling Methodology ............................................................................38
5.4.1 Soil-CLCSP interaction 5.4.2 Stress distribution of concrete lining and CSP 5.4.3 Maximum tensile and compressive stresses versus backfill height 5.4.4 Tensile stress of concrete lining 5.4.5 Deflection of CLCSP
5.5.1 Tensile stress of concrete lining 5.5.2 Deflection of CLCSP 5.5.3 Design Example
5.6 Engineering Methodology Summary ................................................................................51 SECTION 6: CONCLUSIONS AND RECOMMENDATIONS ......................................52 REFERENCES .......................................................................................................................54 APPENDIX A: TECHNICAL DATA SHEETS ................................................................57 APPENDIX B: DATA PLOTS ............................................................................................64
6
LIST OF FIGURES
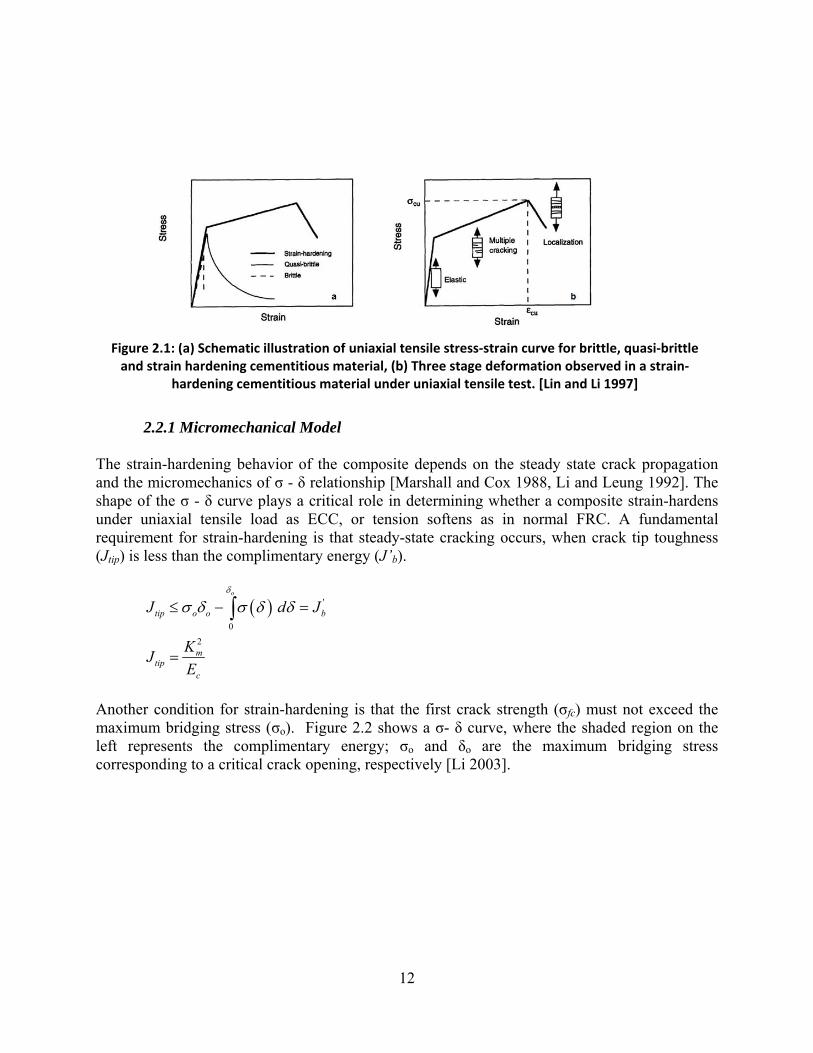
Figure 2.1: (a) Schematic illustration of uniaxial tensile stress-strain curve for brittle, quasi-brittle and strain hardening cementitious material, (b) Three stage deformation observed in a strain-hardening cementitious material under uniaxial tensile test. [Lin and Li 1997] .....12
Figure 3.1: Dry components mixed using a spiral hand mixer ................................................20
Figure 3.2: a) Water added to the dry mix mixed to a slurry b) Presoaked fibers added and mixed until fiber bundles are broken up and well dispersed. ......................................................21
Figure 3.3: a) The fully mixed ECC is poured into sample molds b) Prodding bars used to minimize voids and obtain uniform samples. ...................................................................21
Figure 3.4: Comparative tensile data of the different mix designs ..........................................22
Figure 3.5: Typical failure modes of tensile samples without (left) and with (center and right) fibers. ................................................................................................................................23
Figure 3.6: Compressive data of the samples with different mix designs. .............................24
Figure 3.7: Failed sample under compression; fiber bridging is clearly evident. ...................24
Figure 3.8: Four point bend data of samples of different mix designs. ..................................25
Figure 3.9: Samples under 4 point bend tests. ........................................................................26
Figure 4.1: Pump with auger mixer being loaded with 1000 lbs of premixed material. ........29
Figure 4.2: ECC being sprayed through rotating nozzle onto culvert. ...................................30
Figure 4.3: The culvert lined over most of its length. .............................................................30
Figure 4.4: 48 inch diameter specimen prepared for 3-point bend test. .................................31
Figure 4.5: Strength comparison of PVA concrete lined and control (not-lined) pipes. ........32
Figure 4.7: Illustration of pre-existing conditions. .................................................................34
Figure 5.1: Schematic finite element model for soil-CLCSP structure (D = pipe diameter). .40
Figure 5.2: Section geometry and definition of CLCSP. .......................................................42
Figure 5.3: Maximum all stress distributions of CLCSP. (a) CSP with a concrete shell (b) Concrete .............................................................................................................................43
Figure 5.4: Stresses acting on the concrete lining versus H/D. (a) Tensile stress(b) Compressive Stress ..................................................................................................................................44
Figure 5.5: Predictor equations for axial forces and bending moments induced at crown of buried lined CSP. (a) Axial forces; (b) Bending moments ...........................................................45
Figure 5.6: Pipe on a flat surface. ..........................................................................................47
Figure 5.7: Deflections at the crown of CLCSP. (a) D= 48 inch, D/r= 137; (b) D= 96 inch, D/R= 274......................................................................................................................................48
7
LIST OF TABLES
Table 3.1. Constituent quantities used to fabricate test specimens .........................................19
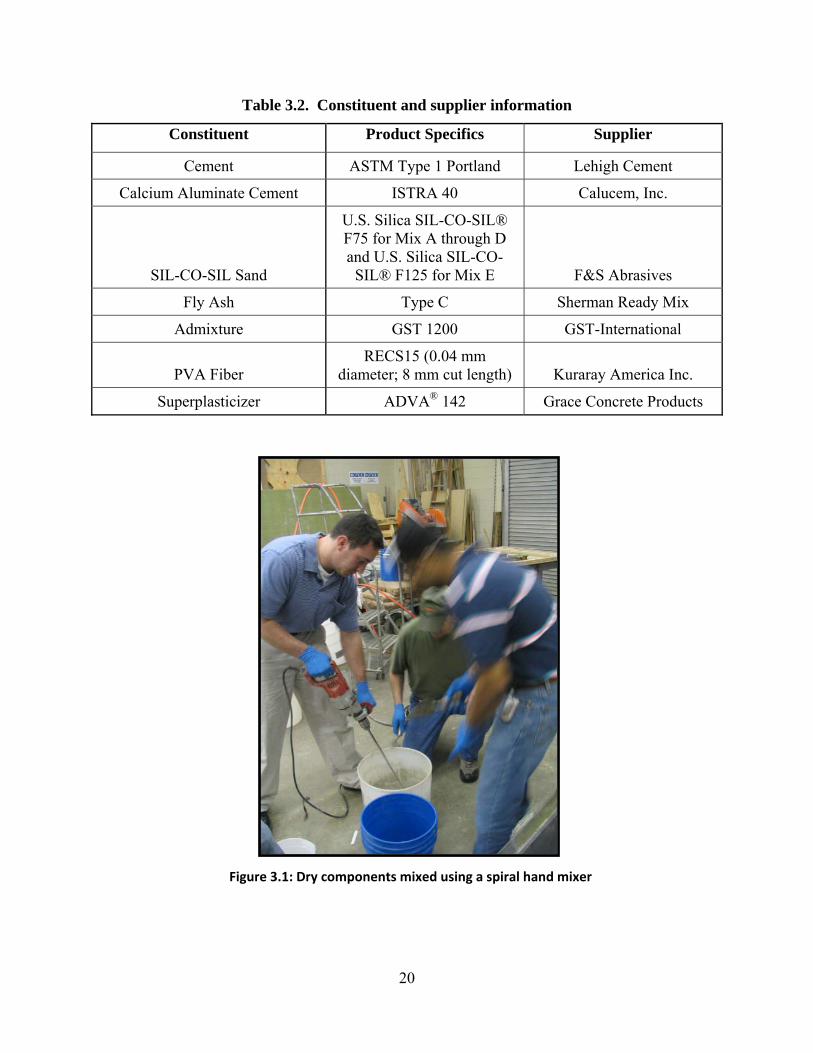
Table 3.2. Constituent and supplier information ....................................................................20
Table 4.1. Large scale studies scaled up from lab scale experiments ......................................28
Table 5.1. Material properties used in FEA and design example ...........................................41
8
SECTION 1: INTRODUCTION AND PROJECT DESCRIPTION
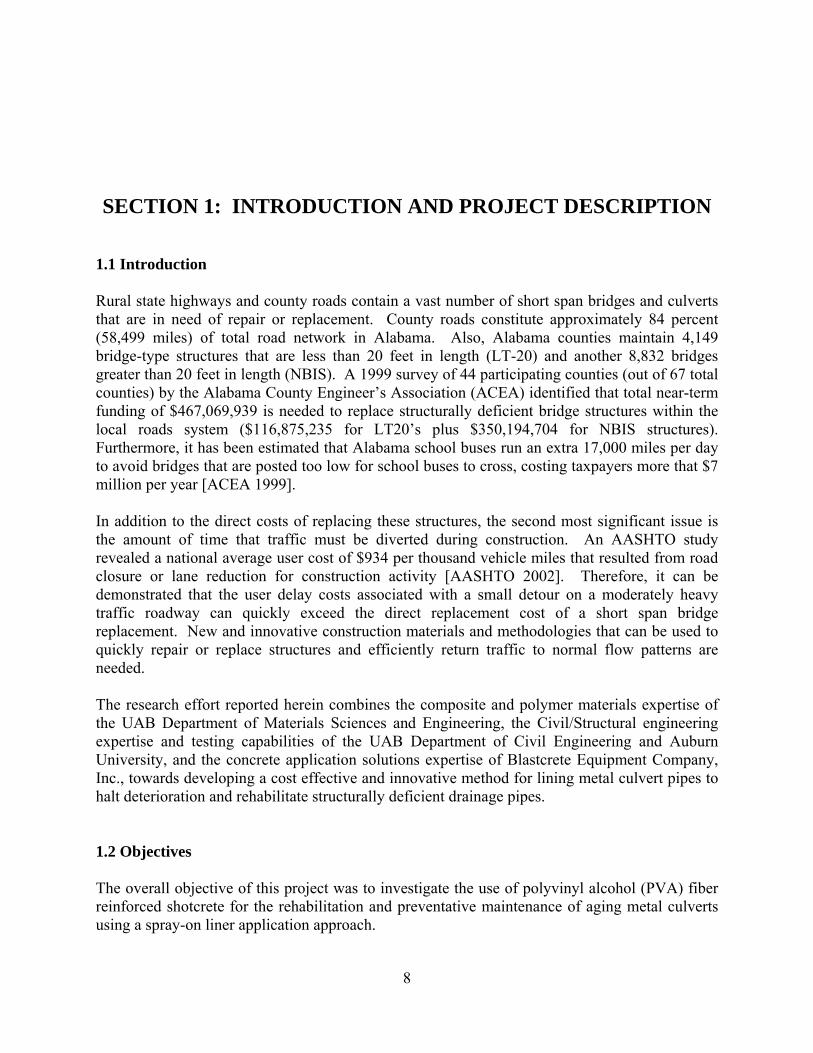
1.1 Introduction Rural state highways and county roads contain a vast number of short span bridges and culverts that are in need of repair or replacement. County roads constitute approximately 84 percent (58,499 miles) of total road network in Alabama. Also, Alabama counties maintain 4,149 bridge-type structures that are less than 20 feet in length (LT-20) and another 8,832 bridges greater than 20 feet in length (NBIS). A 1999 survey of 44 participating counties (out of 67 total counties) by the Alabama County Engineer’s Association (ACEA) identified that total near-term funding of $467,069,939 is needed to replace structurally deficient bridge structures within the local roads system ($116,875,235 for LT20’s plus $350,194,704 for NBIS structures). Furthermore, it has been estimated that Alabama school buses run an extra 17,000 miles per day to avoid bridges that are posted too low for school buses to cross, costing taxpayers more that $7 million per year [ACEA 1999]. In addition to the direct costs of replacing these structures, the second most significant issue is the amount of time that traffic must be diverted during construction. An AASHTO study revealed a national average user cost of $934 per thousand vehicle miles that resulted from road closure or lane reduction for construction activity [AASHTO 2002]. Therefore, it can be demonstrated that the user delay costs associated with a small detour on a moderately heavy traffic roadway can quickly exceed the direct replacement cost of a short span bridge replacement. New and innovative construction materials and methodologies that can be used to quickly repair or replace structures and efficiently return traffic to normal flow patterns are needed. The research effort reported herein combines the composite and polymer materials expertise of the UAB Department of Materials Sciences and Engineering, the Civil/Structural engineering expertise and testing capabilities of the UAB Department of Civil Engineering and Auburn University, and the concrete application solutions expertise of Blastcrete Equipment Company, Inc., towards developing a cost effective and innovative method for lining metal culvert pipes to halt deterioration and rehabilitate structurally deficient drainage pipes. 1.2 Objectives The overall objective of this project was to investigate the use of polyvinyl alcohol (PVA) fiber reinforced shotcrete for the rehabilitation and preventative maintenance of aging metal culverts using a spray-on liner application approach.
9
1.3 Scope and Methodology The workplan consisted of (1) background review, (2) designing, optimizing, and testing the material formulation, (3) outlining design methodology, (4) demonstrating the application approach and strength, and (5) documenting the technology and results of the project. The material and mechanical testing tasks were conducted at the University of Alabama at Birmingham laboratory facilities. The analytical approach and finite element analyses were conducted at Auburn University. The full-scale shotcrete demonstrations were conducted by Blastcrete Equipment Company, Inc., in Anniston Alabama.
10
SECTION 2: REVIEW OF RELEVANT LITERATURE 2.1. Introduction Fiber reinforced cementitious composites (FRC) can be classified into three groups depending on the volume fraction of fibers [Balaguru 1992]. By employing low fiber volume fractions (<1%), FRC utilize fibers for reducing shrinkage cracking. FRC with moderate fiber volume fractions (between 1% and 2%) exhibit improved mechanical properties including modulus of rupture, fracture toughness and impact resistance. The third class of FRC, labeled as high performance FRC (HPFRC), exhibits apparent strain hardening behavior by employing high fiber content. An engineered cementitious composite (ECC) is a micromechanically designed cementitious composite that exhibits extreme tensile strain capacity while using moderate amount of fibers [Kim et al. 2003]. In terms of material constituents, ECC utilizes similar ingredients as fiber reinforced concrete (FRC). It contains water, cement, sand, fiber and chemical additives. Coarse aggregates are not used as they tend to adversely affect the unique ductile behavior of the composite. Unlike some high-performance FRC, ECC does not use large amounts of fiber. The most fundamental mechanical property difference between ECC and FRC is that ECC strain-hardens rather than tension-softens after first cracking. In general, 2% or less by volume of discontinuous fiber is adequate, even though the composite is designed for structural application. Various types of fibers (steel, asbestos, glass, natural fibers, synthetic fibers, etc.) have been used to reinforce concretes and cement mortars. Synthetic fibers have become more attractive in recent years as reinforcements for cementitious materials. They can provide effective, relatively inexpensive reinforcement for concrete and are alternatives to asbestos, steel and glass fibers. Non-metallic fibers that have been incorporated into cement matrices include polyethylene (PE), polypropylene (PP), acrylics (PAN), polyvinyl alcohol (PVA), polyamides (PA), aramid, polyester (PES) and carbon [Zheng and Feldman 1995]. Fiber reinforced ECC has been successfully applied to dam repair, bridge deck overlays, coupling beams in high rise buildings, and other structural elements and systems [Li and Mishra 1996].
2.1.1 Factors affecting fiber and matrix selection The criterion for selecting the type of synthetic fiber is governed by the cost, mechanical properties, and the chemical interaction between the fiber and the cementitious matrix [Li et al. 2002]. PVA fibers typically have a tensile strength between 1600 and 2500 MPa, and is considered a promising alternative to other fibers used in ECC. The cost of PVA fiber is about 1/8 that of high-modulus PE fiber and is even lower than that of steel fiber on an equal volume basis [Li et al. 2001]. Other low cost fibers, such as nylon, low-density polyethylene and polypropylene fibers are less suitable due to low tensile strength and low modulus of elasticity [Li et al. 2002]. PVA is highly hydrophilic in nature and thus has a tendency to form strong
11
chemical bonding between the fiber and the hydrated cementitious matrix. This causes the fiber to rupture rather than pullout during a matrix crack. Despite these obstacles, PVA fiber still holds great potential since the interfacial characteristics can be modified. PVA fibers are generally randomly dispersed in the cementitious matrix of a bulk structure. Physical and mechanical properties of commercially available PVA used as reinforcements in ECC are:
The final properties of ECC depend upon three groups of constituents, namely, the fiber, cementitious matrix and the interface properties [Li 2002]. The fiber is characterized in terms of volume fraction (Vf), fiber length (lf), fiber diameter (df), elastic modulus (Ef), and tensile strength (σfu). The matrix is characterized in terms of its fracture toughness (Km), elastic modulus (Em) and initial flaw size distribution (a0). Hence tailoring of the above properties modifies the micromechanical parameters, giving rise to the unique properties of ECC. Micromechanics relate the macroscopic properties to the microstructures of a composite, and thus form the backbone of materials design theory [Li 2003]. Microstructure tailoring can lead to extreme composite ductility of several percent in tension; a material property not seen in discontinuous FRC’s. Materials optimization also leads to compositions that make it possible for very flexible materials processing. ECC casting processes include self-compacting casting [Kong et al. 2003a], extruded [Takashima et al. 2003], and sprayed [Kim et al. 2003, 2004]. 2.2 Mechanism of Tensile Strain-Hardening Fibers in FRC increase the failure strain and fracture toughness of the composite by orders of magnitude. The underlying mechanism is that fibers undergo debonding and sliding against matrix and stabilize matrix cracks by exerting closure traction on the crack surfaces. Figure 2.1 illustrates general features of the uniaxial tensile stress-strain relation of such a strain-hardening cementitious material compared to brittle and quasi-brittle materials [Lin and Li 1997]. The difference in failure mechanisms governing strain-hardening ECC behavior versus tension-softening FRC behavior is the load bearing and energy absorption roles of fiber bridging. Extensive research has shown that the most fundamental property of a fiber reinforced cementitious material is the fiber bridging property across a matrix crack [Lin and Li 1997, Kanda and Li 1999]. The plot of average tensile stress (σ) transmitted across a crack with uniform crack opening (δ), is used to describe the behavior of a fiber bridging the opposite surfaces of a crack, when the composite is loaded in tension.
12
2.2.1 Micromechanical Model
The strain-hardening behavior of the composite depends on the steady state crack propagation and the micromechanics of σ - δ relationship [Marshall and Cox 1988, Li and Leung 1992]. The shape of the σ - δ curve plays a critical role in determining whether a composite strain-hardens under uniaxial tensile load as ECC, or tension softens as in normal FRC. A fundamental requirement for strain-hardening is that steady-state cracking occurs, when crack tip toughness (Jtip) is less than the complimentary energy (J’b).
( ) '
02
o
tip o o b
mtip
c
J d J
KJE
δ
σ δ σ δ δ≤ − =
=
∫
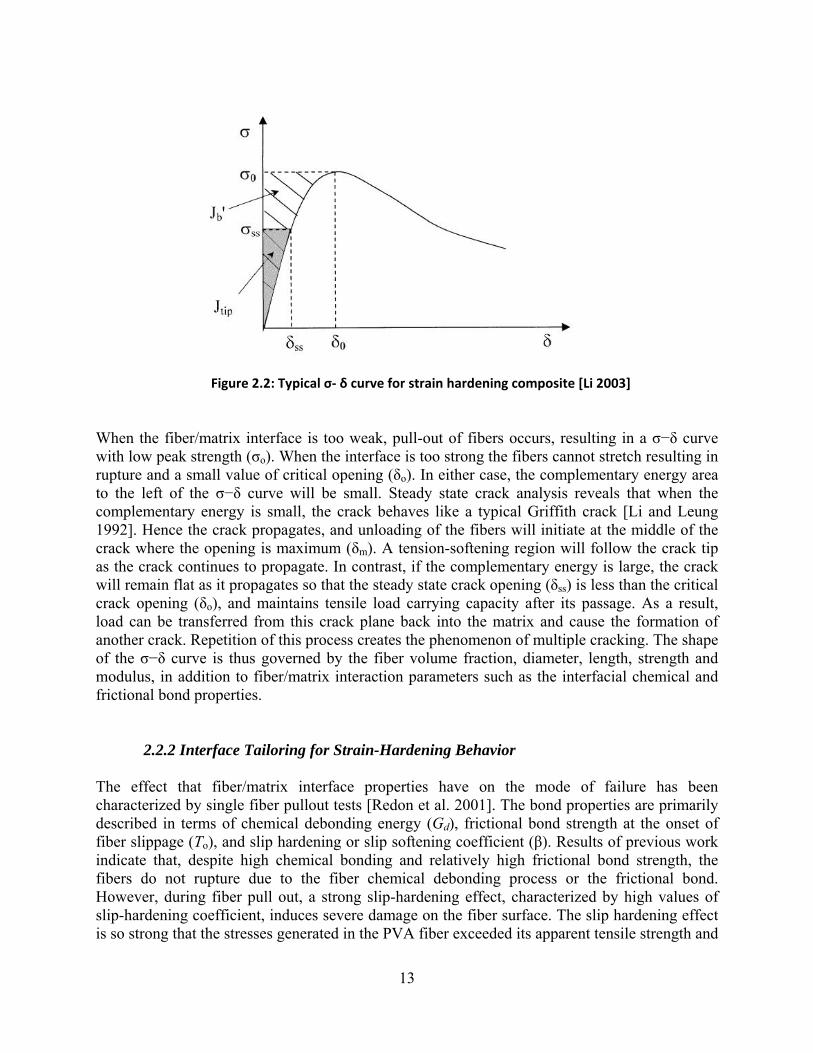
Another condition for strain-hardening is that the first crack strength (σfc) must not exceed the maximum bridging stress (σo). Figure 2.2 shows a σ- δ curve, where the shaded region on the left represents the complimentary energy; σo and δo are the maximum bridging stress corresponding to a critical crack opening, respectively [Li 2003].
Figure 2.1: (a) Schematic illustration of uniaxial tensile stress‐strain curve for brittle, quasi‐brittle and strain hardening cementitious material, (b) Three stage deformation observed in a strain‐
hardening cementitious material under uniaxial tensile test. [Lin and Li 1997]
13
When the fiber/matrix interface is too weak, pull-out of fibers occurs, resulting in a σ−δ curve with low peak strength (σo). When the interface is too strong the fibers cannot stretch resulting in rupture and a small value of critical opening (δo). In either case, the complementary energy area to the left of the σ−δ curve will be small. Steady state crack analysis reveals that when the complementary energy is small, the crack behaves like a typical Griffith crack [Li and Leung 1992]. Hence the crack propagates, and unloading of the fibers will initiate at the middle of the crack where the opening is maximum (δm). A tension-softening region will follow the crack tip as the crack continues to propagate. In contrast, if the complementary energy is large, the crack will remain flat as it propagates so that the steady state crack opening (δss) is less than the critical crack opening (δo), and maintains tensile load carrying capacity after its passage. As a result, load can be transferred from this crack plane back into the matrix and cause the formation of another crack. Repetition of this process creates the phenomenon of multiple cracking. The shape of the σ−δ curve is thus governed by the fiber volume fraction, diameter, length, strength and modulus, in addition to fiber/matrix interaction parameters such as the interfacial chemical and frictional bond properties.
2.2.2 Interface Tailoring for Strain-Hardening Behavior The effect that fiber/matrix interface properties have on the mode of failure has been characterized by single fiber pullout tests [Redon et al. 2001]. The bond properties are primarily described in terms of chemical debonding energy (Gd), frictional bond strength at the onset of fiber slippage (Тo), and slip hardening or slip softening coefficient (β). Results of previous work indicate that, despite high chemical bonding and relatively high frictional bond strength, the fibers do not rupture due to the fiber chemical debonding process or the frictional bond. However, during fiber pull out, a strong slip-hardening effect, characterized by high values of slip-hardening coefficient, induces severe damage on the fiber surface. The slip hardening effect is so strong that the stresses generated in the PVA fiber exceeded its apparent tensile strength and
thereby prevent the fiber from fully debonding and causing the fiber to rupture. This effect was partially minimized by applying a coating of oil on the fiber surface, thereby making the fiber less hydrophilic and allowing it to slip-out more easily. The effect of fiber surface oiling treatments on the final mechanical properties of ECC has been studied [Li et al. 2001]. Previous research work focused on obtaining the optimal and practical mixture proportion of PVA-ECC. Based on the micromechanics model, the fiber strength must exceed 1000 MPa, with a minimum fiber elongation of 5% to obtain a strain-hardening behavior, while the preferred fiber diameter was 30 to 50 µm. For effective load transfer from the matrix to the fiber, the fiber length was set to 12 mm. Results of studies by Li et al. [2002] indicate that PVA concrete with 0.5 and 0.8% oiled fibers had better overall composite performances than those of 0.3% oiled fiber. The highest average strains of 4.18% were reported with 0.5% oiled fiber and with a sand/cement (s/c) ratio of 0.8. However, samples with 0.8% oiled fiber with s/c ratio of 1.0 exhibited the maximum strength of 4.58±0.38 MPa. Results have shown that any further increase in s/c ratio deteriorates the mechanical properties. For the 0.8% oiled fiber, the measured chemical debonding energy (Gd) and frictional bond strength at the onset of fiber slippage (Тo), approached optimal values suggested by the micromechanics model. The interface between PVA fiber (untreated/non-oiled and treated/oiled) and matrix have been studied in depth to tailor the interface properties to achieve maximum strain-hardening effect. The untreated (non-oiled) PVA fibers tend to delaminate upon pull out, forcing the fibers to rupture and propagate a single crack tip. For the case of treated (oiled) fibers, chemical debonding energy (Gd), frictional bond strength (Тo) and slip-hardening coefficient (β) reduced with increase in percentage of oiling. Finally the delaminating effect completely disappeared, allowing the full embedment length to slide out with little damage. Tensile tests on ECC fabricated by untreated and treated fibers show that the untreated samples barely exhibit multiple cracking behaviors with an average strain capacity below 1%. The multiple cracking phenomenon increases with oiling percentage. The minimum and maximum oiling percentage was 0.3 and 1.2% and the strain capacity was 1.6% and 4.88%, respectively.
2.2.3 Mechanical Performance of PVA-ECC with High Volume Fly Ash Compared to conventional concrete, ECC materials contain considerably higher cement content, typically two to three times higher. High cement content is also found in HPFRC materials, and fiber reinforced reactive powder concrete composite. High cement usage results in undesired high hydration heat as well as higher material costs. To lower the consumption of cement, industrial byproducts such as fly ash can be substituted. Fly ash is abundantly available as a byproduct of coal combustion and is recycled only in small quantities. Substitution of cement with fly ash also alters the interface properties between the fiber and matrix. The chemical bond between the PVA fiber and the cementitious matrix is a function of the concentration of reactive cement present in the matrix. Therefore substituting the cementitious matrix with a low reactive material such as fly ash significantly alters the chemical bonding characteristics. Researchers have focused on the influence of fly ash content on the micromechanics parameters, matrix toughness and tensile strain-hardening behavior of different types of fly ash [Peled et al. 2000, Wang and Li 2007, Yang et al. 2007]. Results indicate general descending trends with an
15
increase of fly ash content for both frictional stress and chemical debonding. The slip hardening coefficient exhibits little dependence in fly ash content. Matrix fracture energy, determined by the wedge splitting test, decreases significantly with increase in fly ash content. This is a desirable phenomenon as lower matrix fracture energy improves strain-hardening effect of the composite. Also, the type of fly ash plays a significant role in the interface property, as the amount of carbon content varies in each type significantly. Class F fly ash has higher carbon content compared to class C fly ash. Surface and elemental analysis on PVA fibers washed out from fresh mix indicate that the inert carbon particles tend to concentrate on the surface of the PVA fiber, thereby lowering the interface chemical bonding and providing extra lubricant for fiber pullout in addition to the oil coating. Results show that the tensile strain capacity and tensile strength were comparable in samples fabricated with type F fly ash (1% residual carbon content) and without fly ash. 2.3 Rheological Control of Fresh Mix by Admixtures To obtain highly deformable fresh concrete mix that can self-consolidate, the rheological properties of the fresh mix are very important. Additives are incorporated to control the fluidity of the fresh mix. Polymeric additives are utilized to achieve the desirable fresh properties at a given solids concentration, represented by an optimal viscosity and yield stress, with good cohesiveness between the ingredients. These additives are comprised of a strong polyelectrolyte known as a superplasticizer, and a non-ionic water-soluble polymer. The influence of these additives on the fluidity (fresh mix) and final mechanical properties of ECC have been investigated [Kong et al. 2003a, 2003b]. Melamine formaldehyde sulfonate (MFS, supplied by W.R. Grace Chemical Co.) as the polyelectrolyte and hydroxypropylmethylcellulose (HPMC, supplied by DOW Chemical Co.) as the non-ionic water-soluble were used to maximize fluidity without segregating the solid particles. Studies [Kong et al. 2003b] reveal that incorporating admixtures helps in dispersing the fibers evenly and thereby preventing them from agglomeration. The viscosity of the fresh mix decreases with an increase in concentration of MFS (0.33% to 1.00% weight concentration, w/w) at constant HPMC concentration (0.13% w/w). In contrast, increasing the HPMC concentration (0.13% to 0.15% w/w) at high MFS concentration (1.00% w/w) increases the viscosity. The optimal concentrations of MFS and HPMC to obtain maximum fluidity without solids segregation were 1.00% and 0.15% w/w respectively. PVA-ECC samples fabricated with suggested concentrations exhibited a tensile strain capacity in excess of 3% without external consolidation. 2.4 High Early Strength of PVA-ECC ECC is expected to be an effective repair and retrofit material due to the tensile strength and ductility enhancements that is provides. Hence there is an increasing demand for durable high-early strength or rapid hardening concrete materials. Experimental investigations suggest various early strength gain rates formulation of concrete mixtures. Typically ECC mixtures use Type I portland cement, which shows relatively slow strength. Addition of proprietary rapid hardening cements or a binder system increases the cost and other factors such as workability and durability. Hence researchers have focused on examining early strength gain rate at various
16
combinations of binder system and accelerating admixture. Type I portland cement and Type III high early strength portland cement, calcium aluminate cement, gypsum cement, and blended calcium sulfo-aluminate have all been evaluated. Commercially available accelerators with active ingredients such as calcium chloride, calcium nitride, and ammonium calcium nitrate, were used with high-range water reducing agents (MFS) for effective fiber dispersions in research by Wang and Li [2006]. Mechanical testing was performed at various time periods after casting to monitor the strength development. Results indicate that rapid strength gain after the first 5 hours for mixtures with rapid-hardening cement and Type III portland cement. The compressive strength of 21 MPa was achieved for both the mixtures. For the case of Type I portland cement, equivalent compressive strengths were achieved only after 24 hours of curing time. The percentage tensile strain reduced significantly over a 72 hour time period for mixtures that used rapid-hardening cement and Type III portland cement. In contrast, the percentage tensile strain increased for the Type I portland cement. Although high early strength could be achieved by using lower water to binder ratio, this reduces the strain-hardening behavior of the material. 2.5 Design of PVA-ECC for Shotcreting Shotcrete is a commonly used term for substances applied via pressure hoses. Shotcreting is used to convey mortar or concrete through a hose and pneumatically projecting it at high velocity on a surface. Shotcrete can be applied in either the dry mix process or the wet mix process. The dry-mix shotcrete method involves placing the dry ingredients into a hopper and then conveying them pneumatically through a hose to the nozzle. The water and dry mixture are not completely mixed until the mixture impinges on the receiving surface. The wet–mix shotcrete method involves pumping of a previously prepared concrete, typically ready-mixed concrete, to the nozzle. Compressed air is introduced at the nozzle to propel the mixture onto the receiving surface. The wet-mix procedure produces less rebound, waste and dusts compared to the dry process procedure. The rheological properties of the fresh mix are very important because the fresh mix must be moderately deformable and pumpable under the pumping/conveying pressure of the equipment. The fresh mix must be viscous enough to adhere to substrate and overcome the influence of gravity. Thus the viscosity of the fresh mix changes from being highly flowable to a very viscous material. This two stage phenomenon is achieved by adjusting the flocculation and the aggregation rate of cement particles by adding a proper concentration of chemical admixture to the cement particles. Kim et al. [2003] focused on determining the appropriate concentration of the reactive particles (admixtures) to shotcrete PVA-ECC by controlling the viscosity of the fresh mix over a short period of time without altering the final mechanical properties. The major constituents used were Type I portland cement (average particle diameter = 11.7 ± 6.8 µm), fine silica sand (average particle diameter = 110 ± 14.8 µm), fly ash (average particle diameter = 26.9 ± 7.0 µm) and calcium aluminate cement (average particle diameter = 5.5 ± 1.5 µm). Chemical admixtures comprising of high-range water reducing admixture (HRWRA–electrostatic dispersant) and hydroxypropylmethylcellulose (HPMC-steric stabilize) were used to modify and control the fluid properties of the fresh mix. The initial deformability of ECC mixtures is strongly dependent upon the concentration of HRWRA. Commercially available prepackage mortars were mixed
17
with PVA fibers to compare the mechanical properties exhibited by these to typical ECC materials. To obtain suitable properties in the fresh mix and in the hardened state the suitable mix proportion was determine. For the case of regular ECC materials, the water-cement ratio (w/c) ranged from 0.45 to 0.47, sand to cement ratio was 0.8, and fly ash to cement ratio was 0.3. The fiber volume fraction was determined to be 2% to obtain maximum properties without compromising on workability, pumpability and sprayability. The fiber length is also limited by the pumpability of the machine; hence the optimum fiber length to obtain desired mechanical properties was determined to be 8 mm. The addition sequence of chemical admixtures to the fresh mix plays a vital role on the fluidity of the fresh mix. Results indicate that the sequence of addition as HRWRA followed by HPMC, thereby HPMC could act only as a viscosity agent to prevent the segregation between the particles. To enhance the cohesiveness of the fresh mix and adhesiveness of the fresh mix to substrates calcium aluminate (CA) particles were incorporated in the mix design. Introduction of CA results in a slower increase in the viscosity compared with plain cement pastes for the first 10 minutes, which is attributed to the size effect of CA particles. The size effect of CA frees the water between the cement particles resulting in lowering the viscosity. The reactivity of CA particles increases with time and thereby aggregation becomes dominant over the particle size effect. Thus the initial deformability was a function of HRWRA while deformability loss over time was a function of CA. The optimal concentration of CA suitable for the shotcreting process was determined to be 5%. The optimal concentration of HRWRA and HPMC for 5% concentration of CA was determined to be 0.75% and 0.05% (w/w) respectively. With regards to the prepackaged mortars, the pumping pressure was considerably higher than the regular ECC materials forcing to abort the fabrication, hence there was no reported mechanical performance of prepackaged mortars. The reason for this was attributed to the difference in size of the sand particles in the prepackaged mortars. For prepackaged mortars that were briefly pumped, the sand particles rebounded from the substrate. Hence it is evident that prepackaged mortars may not be suitable for ECC shotcrete applications.
18
SECTION 3: MATERIAL CHARACTERIZATION AND DEVELOPMENT OF MIX DESIGN
3.1 Laboratory Specimen Preparation Previous studies by others demonstrate that PVA reinforced mortar has desirable properties with regard to strain to failure, and may be applicable for rehabilitating aging culverts. However, the processing methods described in published works may not be suitable for in-field application to existing culverts. Blastcrete Equipment Company, Inc., of Anniston Alabama has developed equipment that uses a low velocity nozzle for shotcreting. This equipment requires that all materials be dry mixed and fed into a hopper, and that the water be added at the final stage of an inline mixer. The mix designs described in Section 2 require that the fibers be added at the last stage of the mixing process for optimum performance of the material. The material is pumped through a hose to a nozzle and onto the surface being coated. The mixture viscosity is a major challenge for this system to be effective; it must be low enough to be pumped through the hoses and nozzle, yet high enough for it to stick to the side walls and obvert of the culvert. Based upon the constraints described in Section 2, a commercially available PVA fiber manufactured by Kuraray was selected. The fine sand (mean size of 110 µm) used in this study is also commercially available (US Silica). The effects of fiber surface treatment and sand content on final tensile strength were analyzed. The water/cement ratio (w/c = 0.45) and fiber volume fraction (Vf = 2%) were kept constant in the first phase of the study. It was evident from the literature study that increasing the oiling agent leads to an increase in tensile strain capacity accompanied by larger crack width and reduced crack spacing. Prior studies also suggest that the percentage of oiling content would vary with the processing methodology adopted and that treating of fibers is one way of tailoring the interface properties. The interface properties could also be modified by adding fly ash to the matrix, thereby reducing the amount of cement required. Five mix designs (A-E) were employed as a first stage trial -- three of these ‘with fiber’ and two ‘without fiber’ to establish baseline properties.
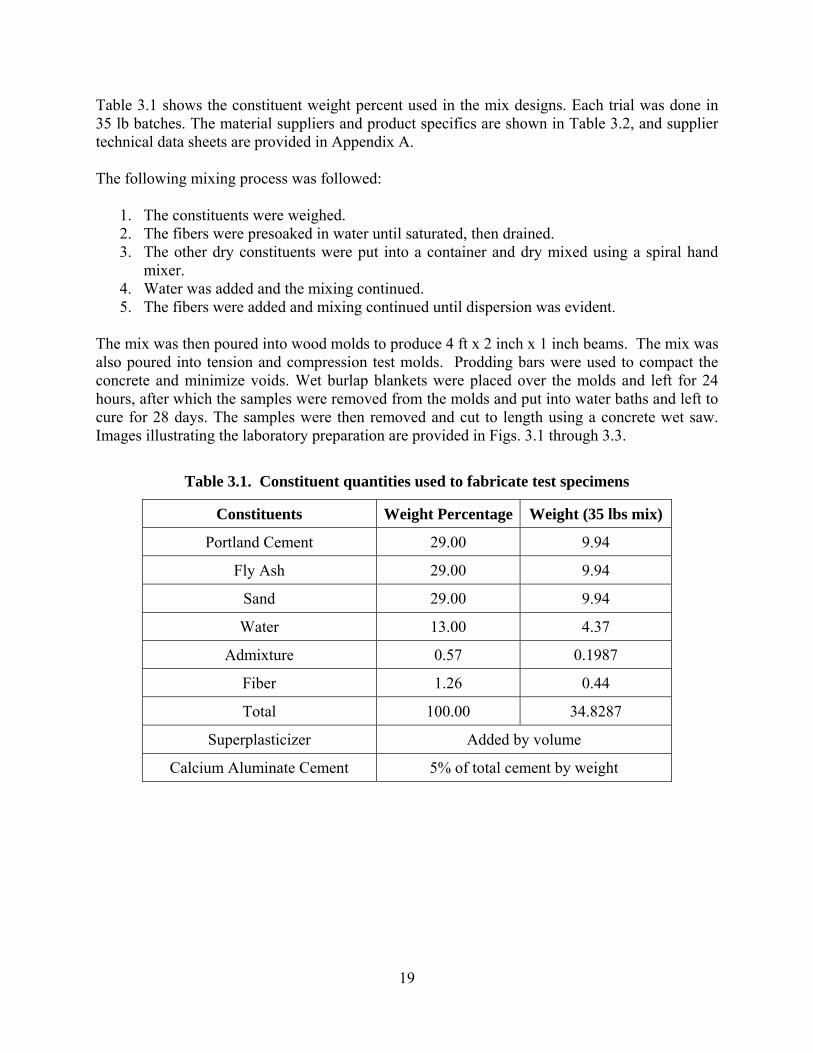
Table 3.1 shows the constituent weight percent used in the mix designs. Each trial was done in 35 lb batches. The material suppliers and product specifics are shown in Table 3.2, and supplier technical data sheets are provided in Appendix A. The following mixing process was followed:
1. The constituents were weighed. 2. The fibers were presoaked in water until saturated, then drained. 3. The other dry constituents were put into a container and dry mixed using a spiral hand
mixer. 4. Water was added and the mixing continued. 5. The fibers were added and mixing continued until dispersion was evident.
The mix was then poured into wood molds to produce 4 ft x 2 inch x 1 inch beams. The mix was also poured into tension and compression test molds. Prodding bars were used to compact the concrete and minimize voids. Wet burlap blankets were placed over the molds and left for 24 hours, after which the samples were removed from the molds and put into water baths and left to cure for 28 days. The samples were then removed and cut to length using a concrete wet saw. Images illustrating the laboratory preparation are provided in Figs. 3.1 through 3.3.
Table 3.1. Constituent quantities used to fabricate test specimens
Figure 3.1: Dry components mixed using a spiral hand mixer
21
Figure 3.2: a) Water added to the dry mix mixed to a slurry b) Presoaked fibers added and mixed until fiber bundles are broken up and well dispersed.
Figure 3.3: a) The fully mixed ECC is poured into sample molds b) Prodding bars used to minimize voids and obtain uniform samples.
22
3.2 Mechanical Properties Characterization
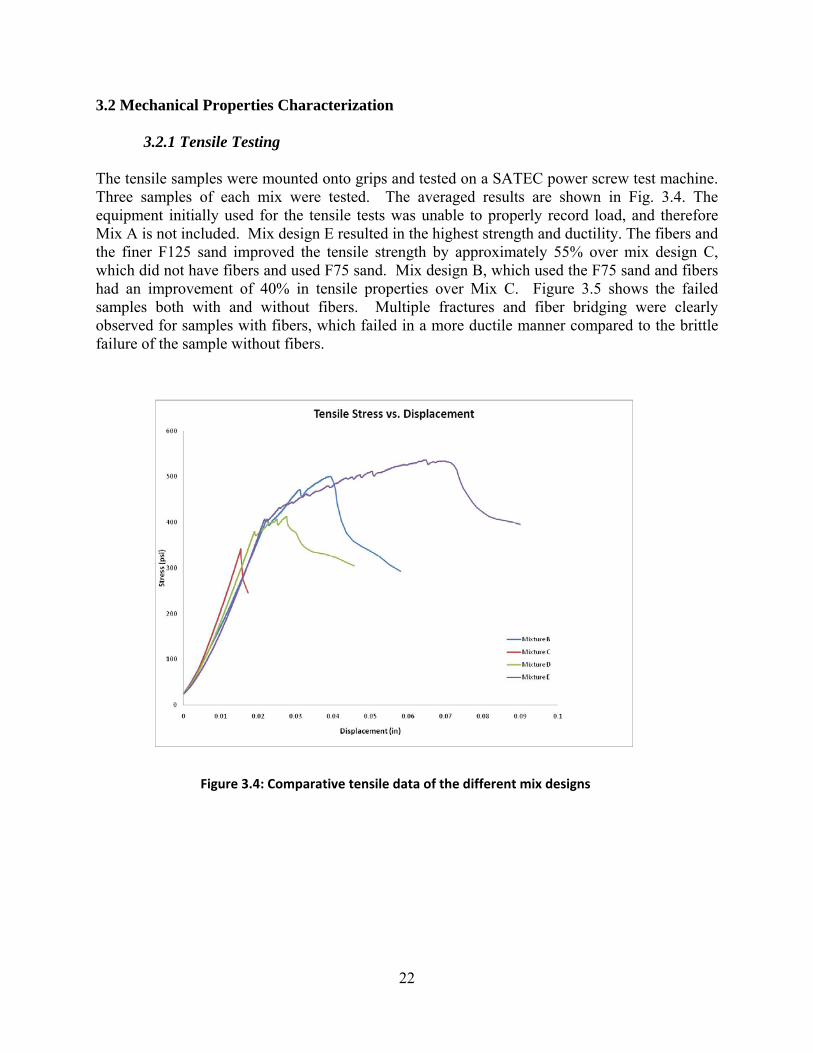
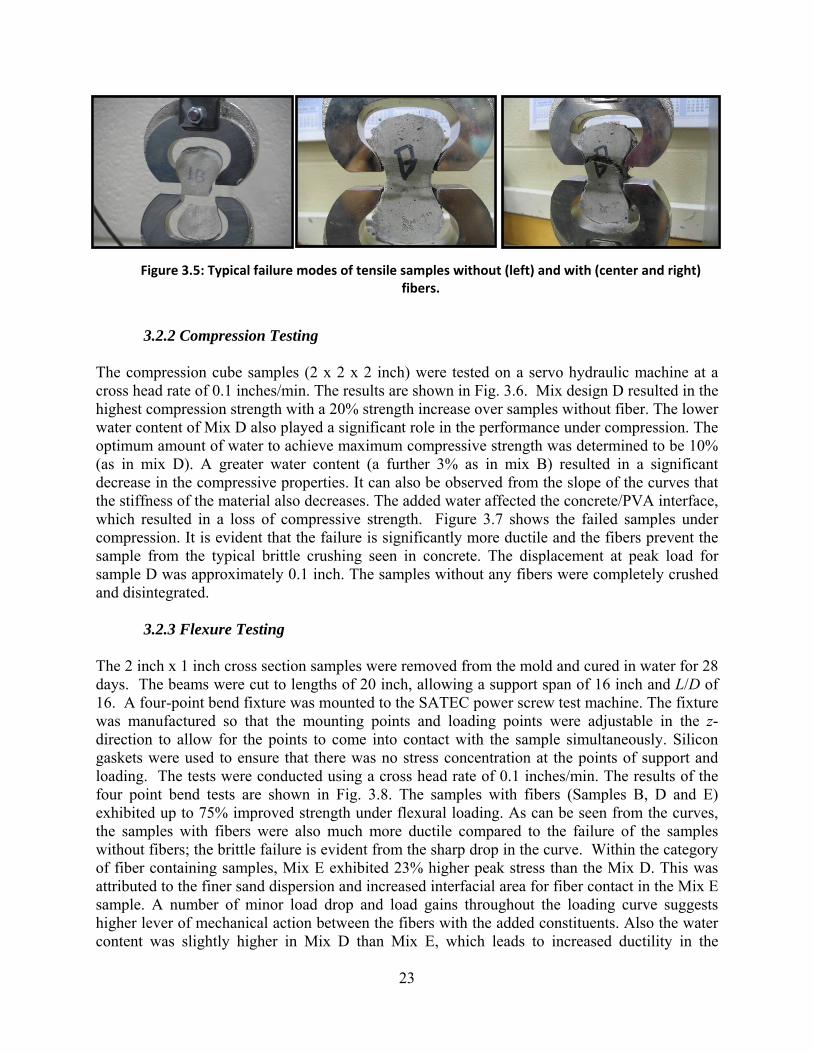
3.2.1 Tensile Testing The tensile samples were mounted onto grips and tested on a SATEC power screw test machine. Three samples of each mix were tested. The averaged results are shown in Fig. 3.4. The equipment initially used for the tensile tests was unable to properly record load, and therefore Mix A is not included. Mix design E resulted in the highest strength and ductility. The fibers and the finer F125 sand improved the tensile strength by approximately 55% over mix design C, which did not have fibers and used F75 sand. Mix design B, which used the F75 sand and fibers had an improvement of 40% in tensile properties over Mix C. Figure 3.5 shows the failed samples both with and without fibers. Multiple fractures and fiber bridging were clearly observed for samples with fibers, which failed in a more ductile manner compared to the brittle failure of the sample without fibers.
Figure 3.4: Comparative tensile data of the different mix designs
23
3.2.2 Compression Testing
The compression cube samples (2 x 2 x 2 inch) were tested on a servo hydraulic machine at a cross head rate of 0.1 inches/min. The results are shown in Fig. 3.6. Mix design D resulted in the highest compression strength with a 20% strength increase over samples without fiber. The lower water content of Mix D also played a significant role in the performance under compression. The optimum amount of water to achieve maximum compressive strength was determined to be 10% (as in mix D). A greater water content (a further 3% as in mix B) resulted in a significant decrease in the compressive properties. It can also be observed from the slope of the curves that the stiffness of the material also decreases. The added water affected the concrete/PVA interface, which resulted in a loss of compressive strength. Figure 3.7 shows the failed samples under compression. It is evident that the failure is significantly more ductile and the fibers prevent the sample from the typical brittle crushing seen in concrete. The displacement at peak load for sample D was approximately 0.1 inch. The samples without any fibers were completely crushed and disintegrated.
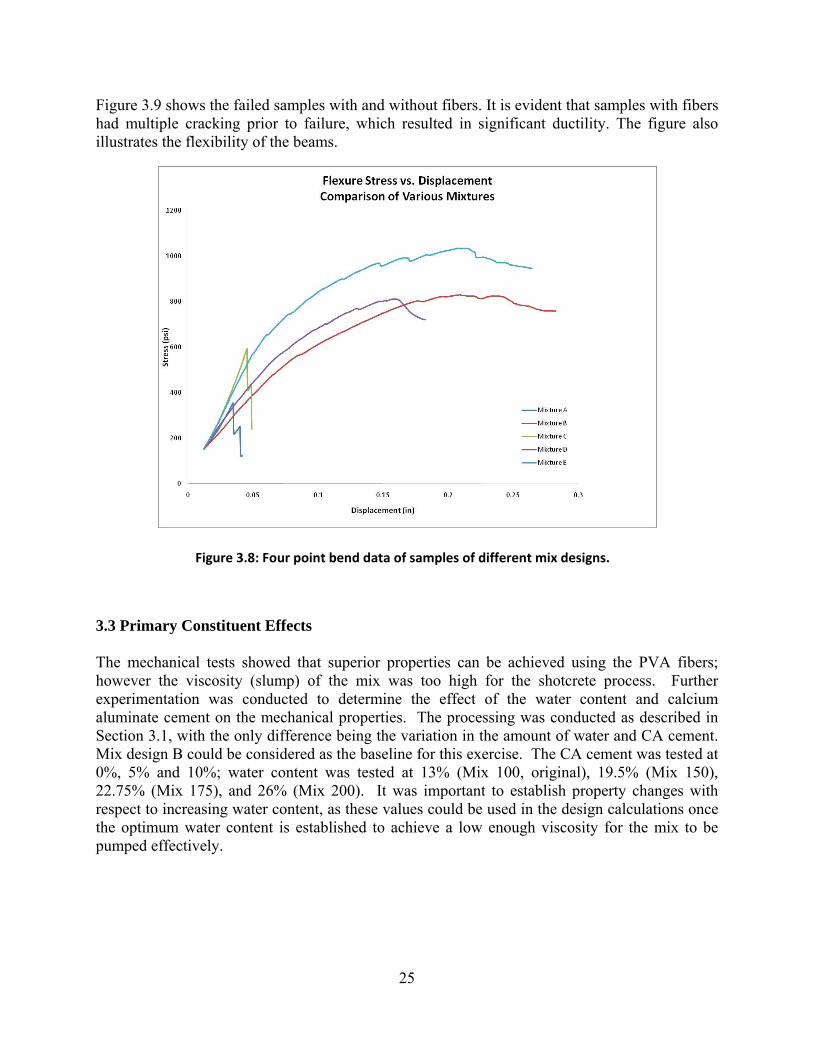
3.2.3 Flexure Testing The 2 inch x 1 inch cross section samples were removed from the mold and cured in water for 28 days. The beams were cut to lengths of 20 inch, allowing a support span of 16 inch and L/D of 16. A four-point bend fixture was mounted to the SATEC power screw test machine. The fixture was manufactured so that the mounting points and loading points were adjustable in the z-direction to allow for the points to come into contact with the sample simultaneously. Silicon gaskets were used to ensure that there was no stress concentration at the points of support and loading. The tests were conducted using a cross head rate of 0.1 inches/min. The results of the four point bend tests are shown in Fig. 3.8. The samples with fibers (Samples B, D and E) exhibited up to 75% improved strength under flexural loading. As can be seen from the curves, the samples with fibers were also much more ductile compared to the failure of the samples without fibers; the brittle failure is evident from the sharp drop in the curve. Within the category of fiber containing samples, Mix E exhibited 23% higher peak stress than the Mix D. This was attributed to the finer sand dispersion and increased interfacial area for fiber contact in the Mix E sample. A number of minor load drop and load gains throughout the loading curve suggests higher lever of mechanical action between the fibers with the added constituents. Also the water content was slightly higher in Mix D than Mix E, which leads to increased ductility in the
Figure 3.5: Typical failure modes of tensile samples without (left) and with (center and right) fibers.
24
specimen. In comparing these results to the tensile tests, the behavior of Mix E in its secondary modulus region has similar serrations in the stress-displacement curve indicating fiber interaction.
Figure 3.6: Compressive data of the samples with different mix designs.
Figure 3.7: Failed sample under compression; fiber bridging is clearly evident.
25
Figure 3.9 shows the failed samples with and without fibers. It is evident that samples with fibers had multiple cracking prior to failure, which resulted in significant ductility. The figure also illustrates the flexibility of the beams.
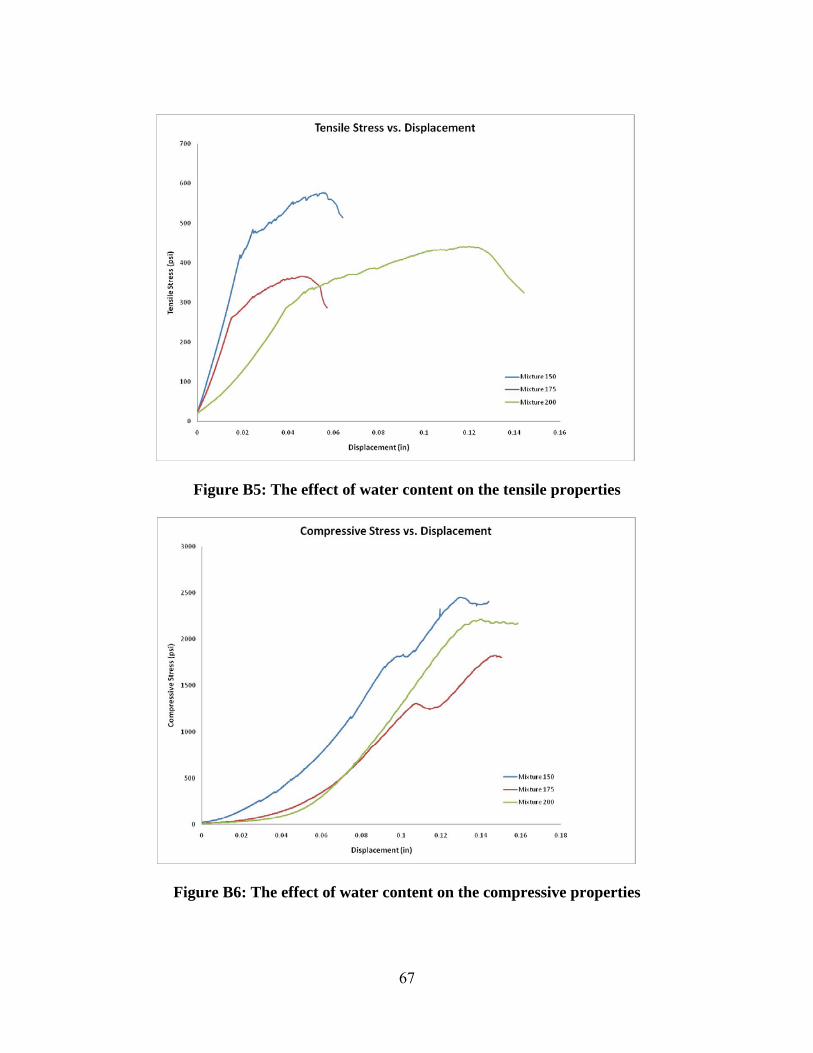
3.3 Primary Constituent Effects The mechanical tests showed that superior properties can be achieved using the PVA fibers; however the viscosity (slump) of the mix was too high for the shotcrete process. Further experimentation was conducted to determine the effect of the water content and calcium aluminate cement on the mechanical properties. The processing was conducted as described in Section 3.1, with the only difference being the variation in the amount of water and CA cement. Mix design B could be considered as the baseline for this exercise. The CA cement was tested at 0%, 5% and 10%; water content was tested at 13% (Mix 100, original), 19.5% (Mix 150), 22.75% (Mix 175), and 26% (Mix 200). It was important to establish property changes with respect to increasing water content, as these values could be used in the design calculations once the optimum water content is established to achieve a low enough viscosity for the mix to be pumped effectively.
Figure 3.8: Four point bend data of samples of different mix designs.
26
3.3.1 Effect of CA Cement The samples with 0% CA cement broke easily and were not successfully removed from the molds. Increasing the CA content from 5% to 10% yielded an 18% increase in flexural strength, 30% increase in compressive strength, and 42% reduction in tensile strength. The CA cement acts as filler that creates stress concentration and crack nucleation sites; hence the tensile strength is adversely influenced. While compression and flexural properties are less notch sensitive, the bulk properties (higher compression properties) of the CA cement enhance the properties of the mix. The results of the flexure, tensile and compressive tests are provided in Appendix B.
3.3.2 Effect of Water Content The increase in water content decreased the mechanical performance. However, the post-yield deflection of the material increased with addition of water. From flexural response studies, the
Figure 3.9: Samples under 4 point bend tests.
27
Mix 150 exhibited 0.1 inch total displacement and more than 100% increase (1200 psi versus 500 psi) in peak stress compared to Mix 200, which exhibited 0.5 inch displacement. Tensile behavior became nonlinear with increased water content. Mix 150 and Mix 175 exhibited a linear behavior until the yield point, while the Mix 200 exhibited nonlinear behavior from onset of loading. The displacement of the Mix 150 and Mix 175 was 0.06, while the Mix 200 was 0.16, indicating a significant increase in ductility. The compression response for all mixes was nonlinear from onset of loading. The compression strength was inversely proportional to the water content -- higher strength for lower water content. Compression yielding (first load drop) occurred at 1200 psi for Mix 200, and at 1800 psi for Mix 150; while Mix 175 exhibited gradual nonlinear response to failure. The compression yielding is attributed to collective material softening, including effects of fiber microbuckling. It is possible that for the Mix 175, the conditions for microbuckling were delayed due to fiber dispersion. The results of the flexure, tensile and compressive tests are provided in Appendix B. 3.4 Summary of Material Characterization Study • The addition of fibers had benefits in terms of fiber bridging, pull-out and increased ductility,
which was evident from the flexural, tensile and compressive properties. • The F75 sand provided good bulk properties and improved compression, while use of finer
F125 sand resulted in improved tensile and flexural properties. This was attributed to increased mechanical action of the finer sand with the fibers.
• The admixture helps disperse the fibers, which improved the mechanical properties. • The CA cement was needed as the material could not be removed from the mold without it.
Increasing the CA cement to 10% added rigidity and improved compressive and flexural strength, but resulted in stress concentrations and hence reduction in tensile strength.
• Increasing the water content reduced the strength properties but increased ductility.
Increasing water content is a practical necessity to lower the viscosity of PVA reinforced concrete, allowing pumpability and sprayability.
• An optimized mixing condition can be achieved. This condition would be based on the
combined consideration of the mechanical tests, mix ratios and equipment used to dispense the concrete.
28
SECTION 4: FULL-SCALE EXPERIMENTS AND PRACTICAL IMPLEMENTATION CONSIDERATIONS
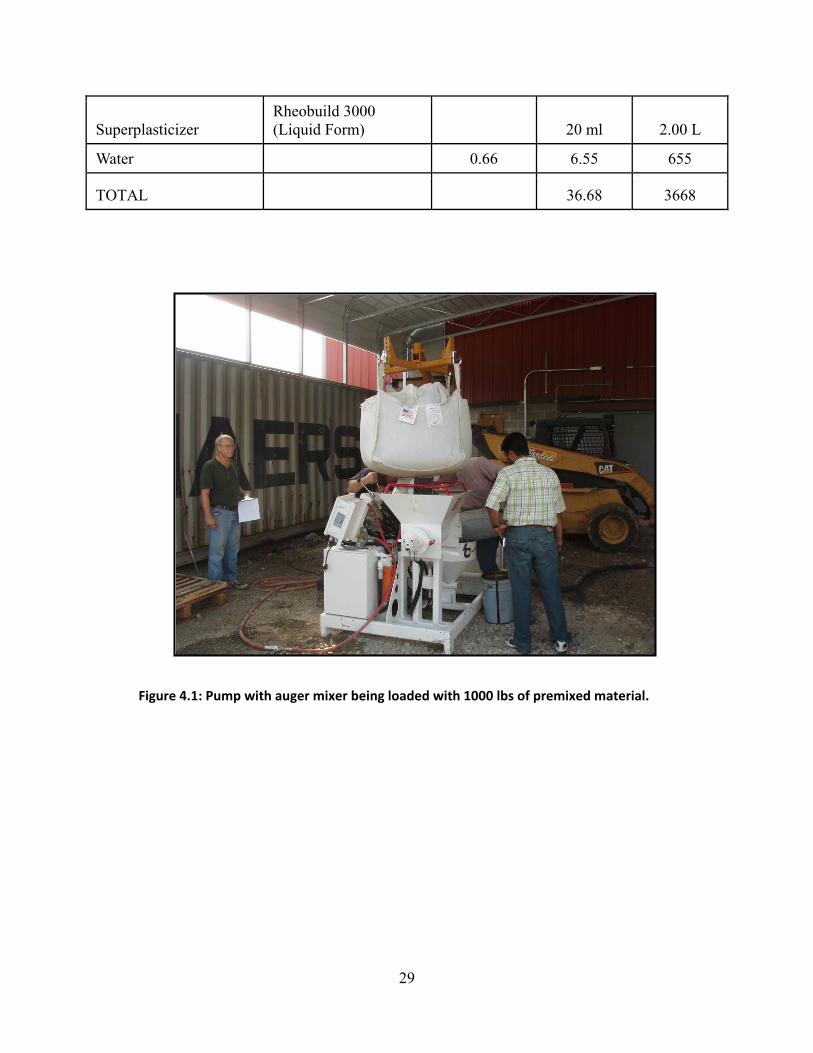
4.1 Spray-Up Mix Design and Application The materials used for the initial full-scales trials are described in Table 4.1, and are compared to the laboratory strength test mixes presented in Section 3. The dry components were premixed so that only water was required to be added during the processing. The 1000 lbs of premixed material is shown being loaded onto the hopper in Figure 4.1. Material was first pumped using high water content to prime the system. The water intake was lowered until an appropriate pumping viscosity was reached while maintaining the ability to stick to the walls of the culvert pipe. The material was then fed through the nozzle, and the rotation of the nozzle was started to spray the material onto the culvert (Figures 4.2 and 4.3). The material adhered to the bottom and sides of the culvert; however, in the initial trials, the material did not stick to the obvert. The thickness was approximately 1 inch over the corrugation crests. Many trials were required before succeeding in the material bonding to all surfaces of the culvert walls with a relatively smooth surface and uniform thickness.
Table 4.1. Large scale studies scaled up from lab scale experiments
Constituents Details Weight to Cement
ratio
Lab Mix (lb)
Shotcrete Mix (lb)
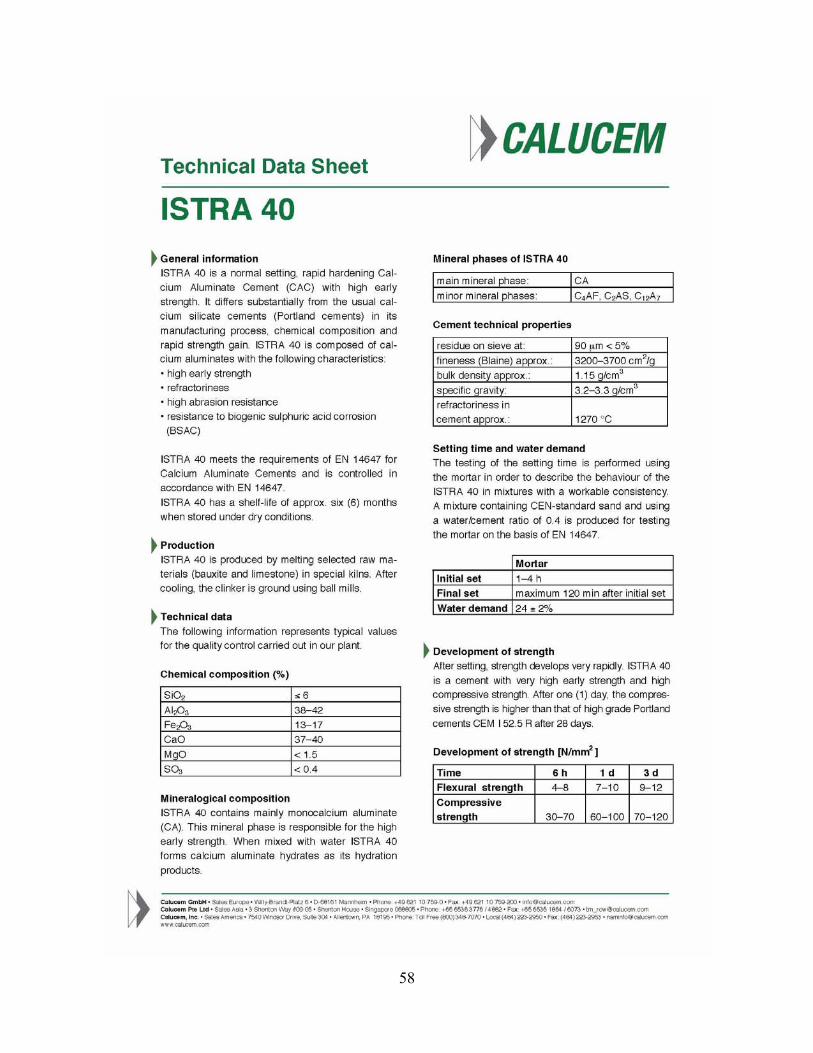
Cement (ASTM Type 1) Particle Diameter of 10-15 microns 0.95 9.44 944
Calcium Aluminate Cement
Calucem / Luminite Particle Diameter less than 50 microns
0.05 0.45 45
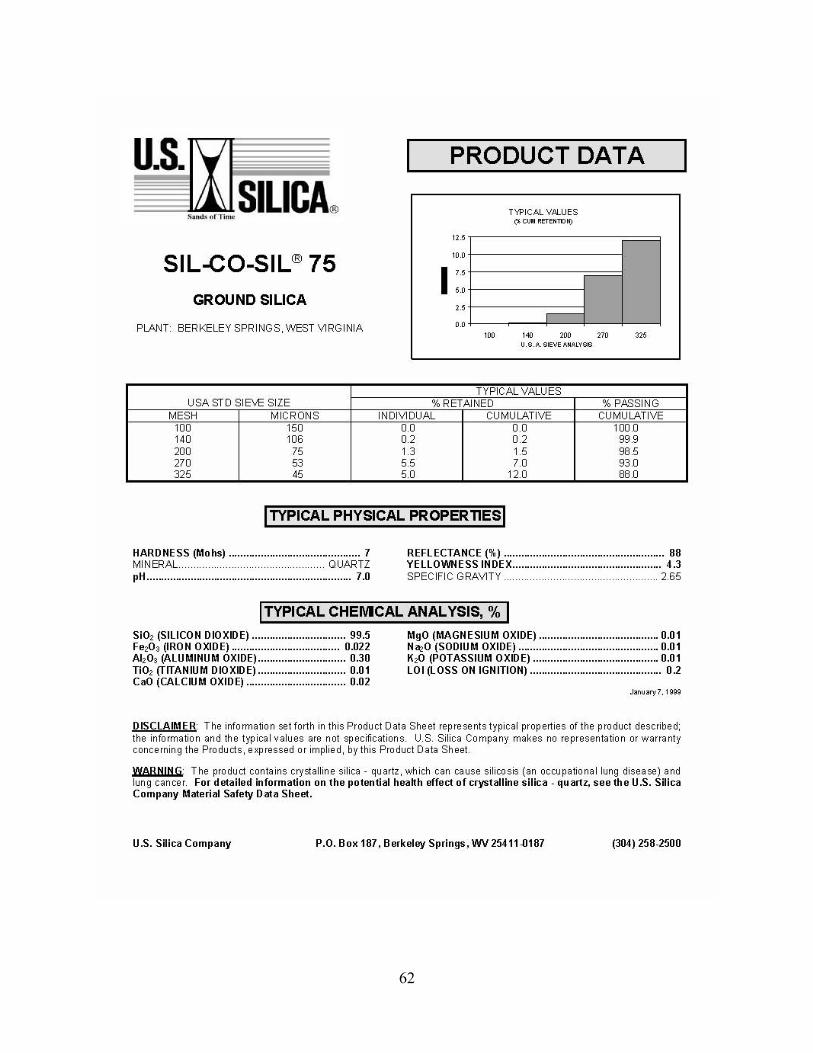
Sand US Silica F75; Particle Diameter of 100 - 120 microns
1.00 9.90 990
Fly Ash Type C 1.00 9.90 990
Fiber Kuraray REC15X 0.44 0.44 44
Admixture GST 1200 0.20 0.20 20
29
Superplasticizer Rheobuild 3000 (Liquid Form) 20 ml 2.00 L
Water 0.66 6.55 655
TOTAL 36.68 3668
Figure 4.1: Pump with auger mixer being loaded with 1000 lbs of premixed material.
30
Figure 4.2: ECC being sprayed through rotating nozzle onto culvert.
Figure 4.3: The culvert lined over most of its length.
31
4.2 Load Testing Once a successful lining approach was accomplished, a 48 inch length of a 48 inch diameter corrugated steel pipe segment was load tested using the 3-point test apparatus at the Hanson Pipe and Precast plant in Birmingham Alabama. Two sections were tested: one with no lining (control) and one with approximately 1.5 inch PVA reinforced concrete lining (Fig. 4.4). The results of the test are shown in Fig. 4.5, where the increased strength and stiffness is apparent. The failure mode was characterized by longitudinal cracks at the crown of the obvert and the base of the invert (Fig. 4.6). Although some microcracking was apparent, the extended ductility plateau observed in the laboratory flexural tests was not obvious. The liner remained in place without any significant spalling.
Figure 4.4: 48 inch diameter specimen prepared for 3‐point bend test.
32
0
10,000
20,000
0.0 2.5 5.0
Vertical deflection (in.)
Load
(lb)
Test (CSP)
Test (Reinforced concrete pipe)
Figure 4.5: Strength comparison of PVA concrete lined and control (not‐lined) pipes.
Figure 4.6: Crack configuration.
33
4.3 Constructability Challenges The material advantages of PVA concrete and ability to line corrugated metal pipes in a controlled setting has been demonstrated. However, there are practical constructability challenges that must be overcome prior to the technology becoming a viable and cost effective solution. This section briefly outlines some of those implementation challenges and outstanding questions.
4.3.1 Hydraulic Capacity Reduction The potential decrease in hydraulic section efficiency must be considered for using the lining rehabilitation approach since it would result in a decrease in hydraulic radius. However, since the approach involves a thin liner application of approximately 1-inch thickness, the impact on hydraulic capacity is expected to be small. Furthermore, the reduction in hydraulic radius may be offset by an improvement in pipe smoothness since corrugation depths would be reduced or eliminated with the application of a smooth liner surface. If needed, the roughness and variability of section thickness resulting from the spray technique can be minimized by using a floating screed behind the rotating spray mechanism and/or a post-application treatment. Also, a small decrease in hydraulic section capacity (up to 15%) will likely be acceptable as long as the decrease does not result in a flooding frequency or volume that threatens to overtop at greater than a 25 year return period or that might result in an increased probability of damage to adjacent structures or property loss. The decision for the necessity of a full hydraulic impact review for a given project site will be left to engineering judgment. Factors such as changes in upstream development, basin retention characteristics, traffic characteristics, route importance, and channel characteristics must be evaluated prior to using the pipe lining approach.
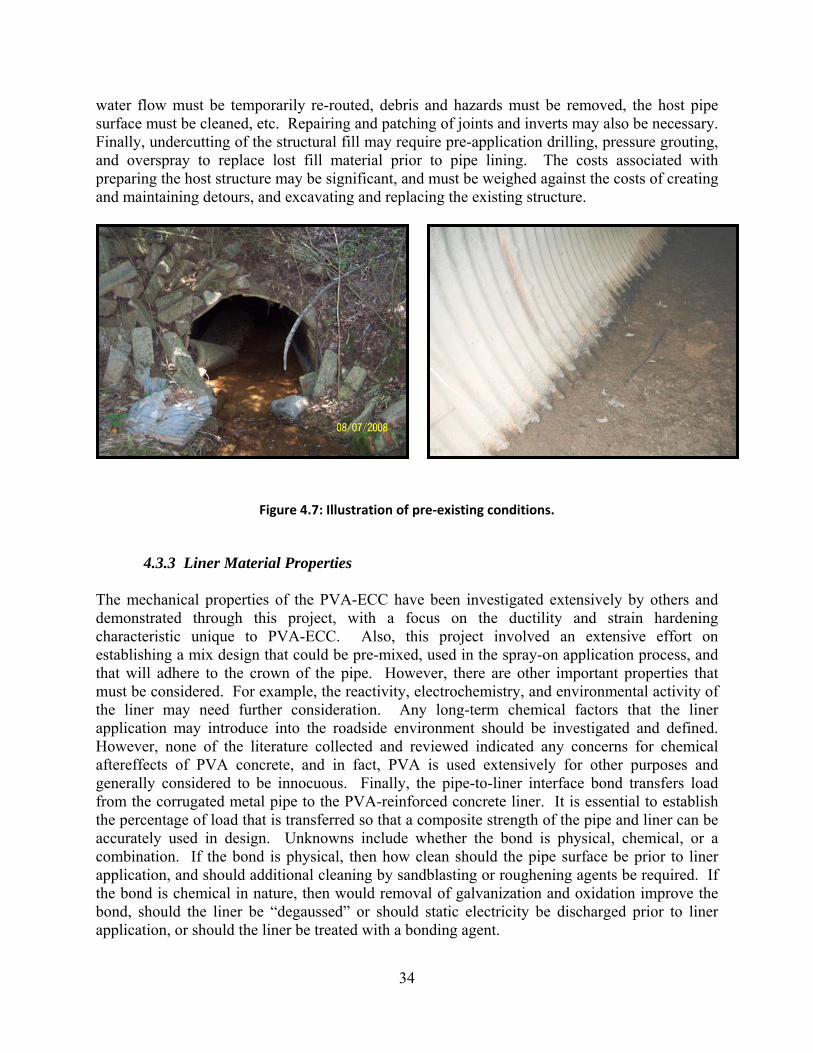
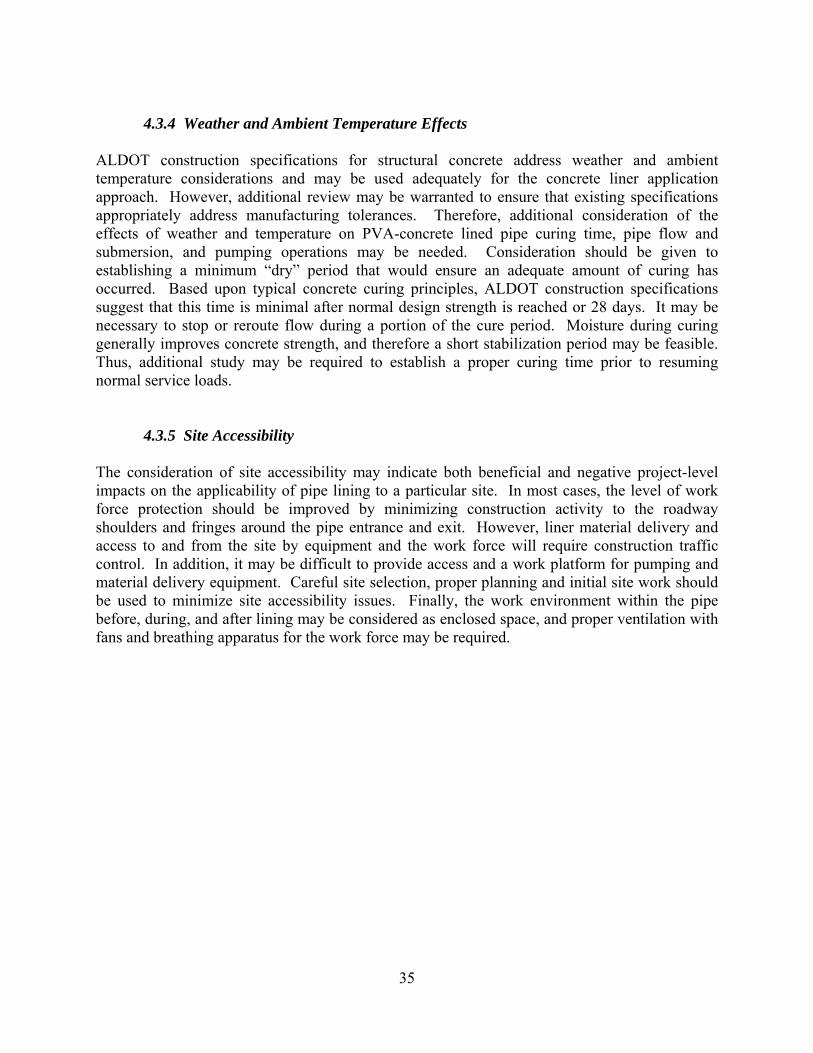
4.3.2 Pre-existing Conditions The many challenges associated with the condition of the existing pipe and surroundings can be divided into two categories: (1) design considerations and (2) construction challenges. There may be many situations where lining an existing pipe prior to significant damage may be warranted to prevent deterioration from initiating or progressing. In such cases, the design methodology presented in Section 5 would apply without additional complexity. However, the spray-on liner approach is considered to be applicable for situations where damage has occurred, and therefore a section loss approximation may be necessary. Furthermore, the design resistance reflected in Section 5 is based on the assumption that the host structure is round. Local buckling at pipe joints or along weak sections could adversely affect spray patterns or passage of equipment through the pipe. Additional work is needed to develop field guidance that relates existing conditions to the assumptions involved in the design methodology. Construction challenges include the need to prepare the host pipe for the spray-on liner process; Figure 4.7 illustrates challenging existing conditions. Most of these challenges are obvious:
34
water flow must be temporarily re-routed, debris and hazards must be removed, the host pipe surface must be cleaned, etc. Repairing and patching of joints and inverts may also be necessary. Finally, undercutting of the structural fill may require pre-application drilling, pressure grouting, and overspray to replace lost fill material prior to pipe lining. The costs associated with preparing the host structure may be significant, and must be weighed against the costs of creating and maintaining detours, and excavating and replacing the existing structure.
4.3.3 Liner Material Properties
The mechanical properties of the PVA-ECC have been investigated extensively by others and demonstrated through this project, with a focus on the ductility and strain hardening characteristic unique to PVA-ECC. Also, this project involved an extensive effort on establishing a mix design that could be pre-mixed, used in the spray-on application process, and that will adhere to the crown of the pipe. However, there are other important properties that must be considered. For example, the reactivity, electrochemistry, and environmental activity of the liner may need further consideration. Any long-term chemical factors that the liner application may introduce into the roadside environment should be investigated and defined. However, none of the literature collected and reviewed indicated any concerns for chemical aftereffects of PVA concrete, and in fact, PVA is used extensively for other purposes and generally considered to be innocuous. Finally, the pipe-to-liner interface bond transfers load from the corrugated metal pipe to the PVA-reinforced concrete liner. It is essential to establish the percentage of load that is transferred so that a composite strength of the pipe and liner can be accurately used in design. Unknowns include whether the bond is physical, chemical, or a combination. If the bond is physical, then how clean should the pipe surface be prior to liner application, and should additional cleaning by sandblasting or roughening agents be required. If the bond is chemical in nature, then would removal of galvanization and oxidation improve the bond, should the liner be “degaussed” or should static electricity be discharged prior to liner application, or should the liner be treated with a bonding agent.
Figure 4.7: Illustration of pre‐existing conditions.
35
4.3.4 Weather and Ambient Temperature Effects
ALDOT construction specifications for structural concrete address weather and ambient temperature considerations and may be used adequately for the concrete liner application approach. However, additional review may be warranted to ensure that existing specifications appropriately address manufacturing tolerances. Therefore, additional consideration of the effects of weather and temperature on PVA-concrete lined pipe curing time, pipe flow and submersion, and pumping operations may be needed. Consideration should be given to establishing a minimum “dry” period that would ensure an adequate amount of curing has occurred. Based upon typical concrete curing principles, ALDOT construction specifications suggest that this time is minimal after normal design strength is reached or 28 days. It may be necessary to stop or reroute flow during a portion of the cure period. Moisture during curing generally improves concrete strength, and therefore a short stabilization period may be feasible. Thus, additional study may be required to establish a proper curing time prior to resuming normal service loads.
4.3.5 Site Accessibility The consideration of site accessibility may indicate both beneficial and negative project-level impacts on the applicability of pipe lining to a particular site. In most cases, the level of work force protection should be improved by minimizing construction activity to the roadway shoulders and fringes around the pipe entrance and exit. However, liner material delivery and access to and from the site by equipment and the work force will require construction traffic control. In addition, it may be difficult to provide access and a work platform for pumping and material delivery equipment. Careful site selection, proper planning and initial site work should be used to minimize site accessibility issues. Finally, the work environment within the pipe before, during, and after lining may be considered as enclosed space, and proper ventilation with fans and breathing apparatus for the work force may be required.
36
SECTION 5: ENGINEERING METHODOLOGY 5.1 Introduction Manufactured concrete-lined corrugated steel pipe (CLCSP) provides the hydraulic characteristics of concrete pipe as well as an extended service life compared to unlined corrugated steel pipe (CSP) [Contech 2000]. Specific structural design guides for lining metal culverts with concrete, however, do not exist. Therefore current design methods for concrete lining have allowed wide variations in acceptable quality levels. These are due to the fact that the primary goals of manufactured concrete lined pipes are the prevention of the abrasion and corrosion, and improvement of a hydraulic efficiency. Therefore, a manufactured concrete liner has been considered to be simply a liner with no structural significance. CLCSP maximum fill heights are the same as those for unlined corrugated steel pipe found in the AISI Handbook of Steel Drainage and Highway Construction [AISI 1994]. The primary objective of this task was to evaluate soil-structure interaction of CLCSP and to develop a preliminary design methodology. The structural behaviors of CLCSP and CSP will be compared and finally the optimum lining thickness and design method will be presented. 5.2 Design of Manufactured Mortar Lined Pipe [Rinker 2006] Manufacturing Method Concrete lining is applied to CSP in a manufacturing process by applying a concrete to conventional corrugated steel pipe in diameters from 24 inches to 120 inches and thicknesses from 0.064 inches to 0.168 inches. Standard corrugations are 2-2/3 by ½ inch, 3 by 1 inch and 5 by 1 inch. Typical metal pipes are galvanized corrugated steel pipe in accordance with ASTM M 218 and AASHTO M 36 (ASTM A 760); aluminized (Type 2) corrugated steel pipe in accordance with AASHTO M 274 and AASHTO M 36; or type A bituminous coated, galvanized corrugated steel pipe in accordance with AASHTO M 190. The interior of the pipe is lined with a machine-applied, dense high-strength mortar lining to a minimum of 1/8-inch thickness above the crest of the corrugation in accordance with ASTM A 849. The concrete lining is plant applied, typically by a revolving spray head moving inside a stationary metal pipe followed immediately by mechanical trowels. Lining thicknesses are usually specified to be 3/8 inch above the crest of the corrugations with a tolerance of ± 1/4 inch. For galvanized or aluminized metal pipes, a bituminous bonding coat is normally applied to the inside surface of the pipe prior to applying the concrete. The concrete lining is composed of cement, fine aggregate and water. The mixture typically contains 564 lbs (6 sack equivalent) of Portland cement per cubic yard of concrete.
37
Structural Aspects CLCSP is designed and installed the same as conventional metal pipes without a concrete liner. The concrete liner is considered by most manufacturers to be simply a liner with no structural significance. No structural value, therefore, has been assigned to the concrete lining. For example, HEL-COR CL maximum fill heights are the same as those for unlined corrugated steel pipe found in the AISI Handbook of Steel Drainage and Highway Construction. Like conventional metal pipes and other flexible conduits, CLCSP has comparatively little inherent strength. It must rely significantly on lateral support to structurally perform. As load is applied, the CLCSP must deflect until side fill forces increase to a point that equilibrium is developed. It tends to crack due to the rigid nature of the liner. In order to minimize cracking, separation, and spalling, design deflection must be limited. The AWWA Manual M11 entitled “Steel Pipe - A Guide for Design and Installation,” states that an often accepted deflection limit for steel pipe with a mortar lining is 3% of the pipe diameter. Some producers of cement mortar lined steel pipe products limit the design deflection to 1% for 24 inch diameter pipes, varying to 3% for 72 inch diameter pipes. It has been noted that cracking increases as the diameter increases and gage decreases. Durability, Abrasion and Corrosion The lining is only a hydraulic improvement, and durability comes from the base metal pipe and its coatings. There is evidence that bare metal is typically exposed at the location of cracks in bituminous coated and concrete-lined galvanized steel pipe. At locations of concrete spalling, it has been shown that the bituminous coating pulls off of the base metal. Therefore, CLCSP should be designed for the required project life, assuming that neither the bituminous lining nor the concrete lining offers any corrosion protection. 5.3 Soil Model and Parameters Soil stiffness properties are required to analyze soil-structure interaction. Several soil models were investigated to select the one that provided soil stiffness parameters that were appropriate for FEA. This study incorporated the following Duncan and Selig’s soil parameters. NCHRP [2008] recently modernized and upgraded CANDE-89 [Musser 1989], resulting in CANDE-2007, which also incorporated Duncan and Selig soil models. Kondner [1963] proposed that nonlinear stress-strain curves for both clay and sand could be approximated by a hyperbola with a high degree of accuracy. The hyperbolic stress-strain relationship suggested by Kondner was modified by Duncan and Chang [1970] to derive the tangent modulus of elasticity as given in Eq. (5.1).
( )( ) 2 n
f 1 3 3t a
3 a
R 1 sinE 1 KP
2c cos 2 sin Pφ σ σ σ
φ σ φ− −⎡ ⎤ ⎛ ⎞
= −⎢ ⎥ ⎜ ⎟+ ⎝ ⎠⎣ ⎦ (5.1)
38
where 1σ = major principal stress; 3σ = minor principal stress (confining pressure); Et = tangent elastic modulus; φ = angle of internal friction; c = cohesion; Rf = failure ratio; K = elastic modulus constant; Pa = atmospheric pressure; and n = elastic modulus exponent. In order to account for the nonlinear volume change of the backfill earth layer, information on Poisson’s ratio (ν) is also needed. Duncan introduced the power bulk modulus given by Eq. (5.2) as a means to bypass the need for a Poisson’s ratio.
m
b aa
B K PPσ⎛ ⎞⎟⎜ ⎟= ⎜ ⎟⎜ ⎟⎜⎝ ⎠3 (5.2)
where B = bulk modulus; Kb = bulk modulus constant; and m = bulk modulus exponent. Selig [1988] used an alternative for obtaining bulk modulus from a hydrostatic compression test. Selig’s hyperbolic bulk modulus is given in Eq. (5.3).
( )
2
1 mi
i u
B BBσε
⎡ ⎤= +⎢ ⎥
⎣ ⎦ (5.3)
Where Bi = initial bulk modulus; mσ = mean stress; and uε = ultimate volumetric strain. Lin [1987] showed that the hyperbolic formulation for bulk modulus, given by Eq. (5.3), better represents soil behavior in a hydrostatic compression test than Duncan’s power formulation presented in Eq. (5.2). From elementary theory of elasticity, Eq. (5.4) can be derived to give Poisson's ratio.
12 6
tEv
B= − (5.4)
5.4 Finite Element Modeling Methodology A finite element analysis (FEA) of a soil-structure system is different from a FEA of a linearly elastic, continuum mechanics problem in several ways. Soil has a nonlinear stress-strain relationship. Therefore, large load increments can lead to significant errors in evaluating stress and strain within a soil. In the approximate nonlinear incremental analysis procedures adopted for this study, nonlinear soil properties are simulated by the hyperbolic stress-strain relationship. ABAQUS (2003) was used for the analysis of CLCSP. The schematic finite element soil-CLCSP models are shown in Fig. 5.1. Taking advantage of symmetry, only one-half of the soil-CLCSP system is modeled. The results from a series of exploratory trial FEA runs showed that lateral and top boundaries need not to extend beyond three times the pipe diameter horizontally from the center of the pipe and three times the pipe
39
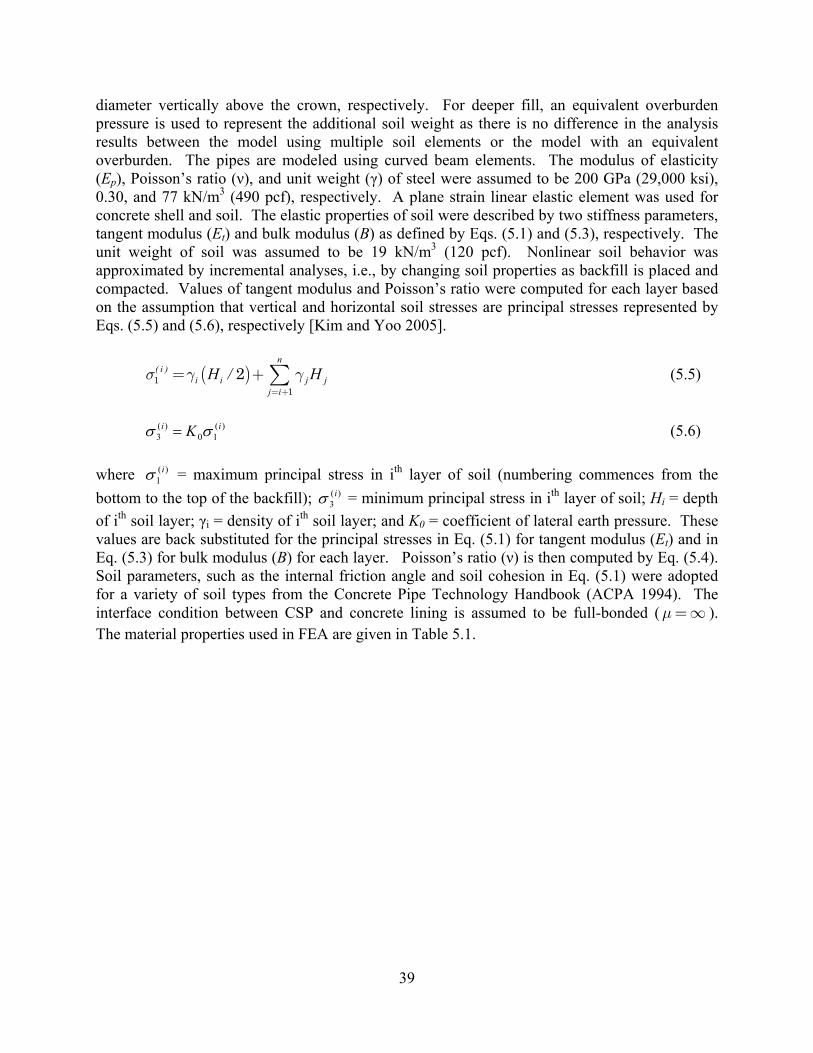
diameter vertically above the crown, respectively. For deeper fill, an equivalent overburden pressure is used to represent the additional soil weight as there is no difference in the analysis results between the model using multiple soil elements or the model with an equivalent overburden. The pipes are modeled using curved beam elements. The modulus of elasticity (Ep), Poisson’s ratio (ν), and unit weight (γ) of steel were assumed to be 200 GPa (29,000 ksi), 0.30, and 77 kN/m3 (490 pcf), respectively. A plane strain linear elastic element was used for concrete shell and soil. The elastic properties of soil were described by two stiffness parameters, tangent modulus (Et) and bulk modulus (B) as defined by Eqs. (5.1) and (5.3), respectively. The unit weight of soil was assumed to be 19 kN/m3 (120 pcf). Nonlinear soil behavior was approximated by incremental analyses, i.e., by changing soil properties as backfill is placed and compacted. Values of tangent modulus and Poisson’s ratio were computed for each layer based on the assumption that vertical and horizontal soil stresses are principal stresses represented by Eqs. (5.5) and (5.6), respectively [Kim and Yoo 2005].
( )n
( i )i i j j
j i
H / Hσ γ γ= +
= + ∑11
2 (5.5)
)(
10)(
3ii K σσ = (5.6)
where )(
1iσ = maximum principal stress in ith layer of soil (numbering commences from the
bottom to the top of the backfill); )(3
iσ = minimum principal stress in ith layer of soil; Hi = depth of ith soil layer; γi = density of ith soil layer; and K0 = coefficient of lateral earth pressure. These values are back substituted for the principal stresses in Eq. (5.1) for tangent modulus (Et) and in Eq. (5.3) for bulk modulus (B) for each layer. Poisson’s ratio (ν) is then computed by Eq. (5.4). Soil parameters, such as the internal friction angle and soil cohesion in Eq. (5.1) were adopted for a variety of soil types from the Concrete Pipe Technology Handbook (ACPA 1994). The interface condition between CSP and concrete lining is assumed to be full-bonded (μ=∞ ). The material properties used in FEA are given in Table 5.1.
40
Figure 5.1: Schematic finite element model for soil‐CLCSP structure (D = pipe diameter).
41
Table 5.1. Material properties used in FEA and design example
Density Young's
modulus
Poison's
ratio
Compressive
strength
Tensile
strength
Yield
strength
(pcf) (psi) (psi) (psi) (psi)
Steel 490 29,000,000 0.30 - 45,000 33,000
Concrete 150 3,600,000 0.18 6,000 775* -
Soil 120 ** *** - - -
* '10 cf (assumed) ** From Duncan soil model *** From Selig Soil Parameters
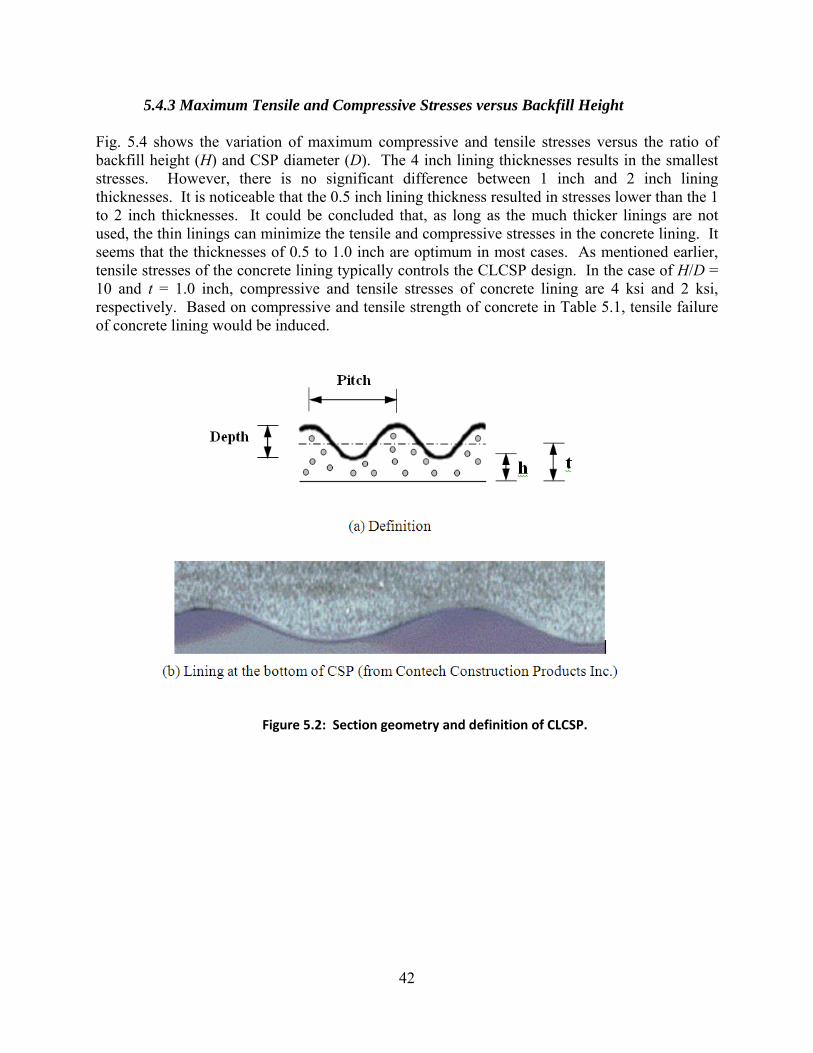
5.4.1 Soil-CLCSP Interaction The section of lined corrugated steel pipe is shown in Fig. 5.2(a). The corrugated section of concrete lining is assumed to be rectangular as this study is based on 2-D analyses. This assumption provides conservative results since the moment of inertia of rectangular section is larger than the real corrugated section. Dense, homogeneous and non-segregated lining, as shown in Fig. 5.2(b), results in a good wearing surface throughout the pipe. The lining thickness ranged from 0.5 inch to 4 inch in this study. The pitch and depth of CSP are taken to be 3 inch and 1 inch, respectively. Diameters of 48 inch and 96 inch were used in this study.
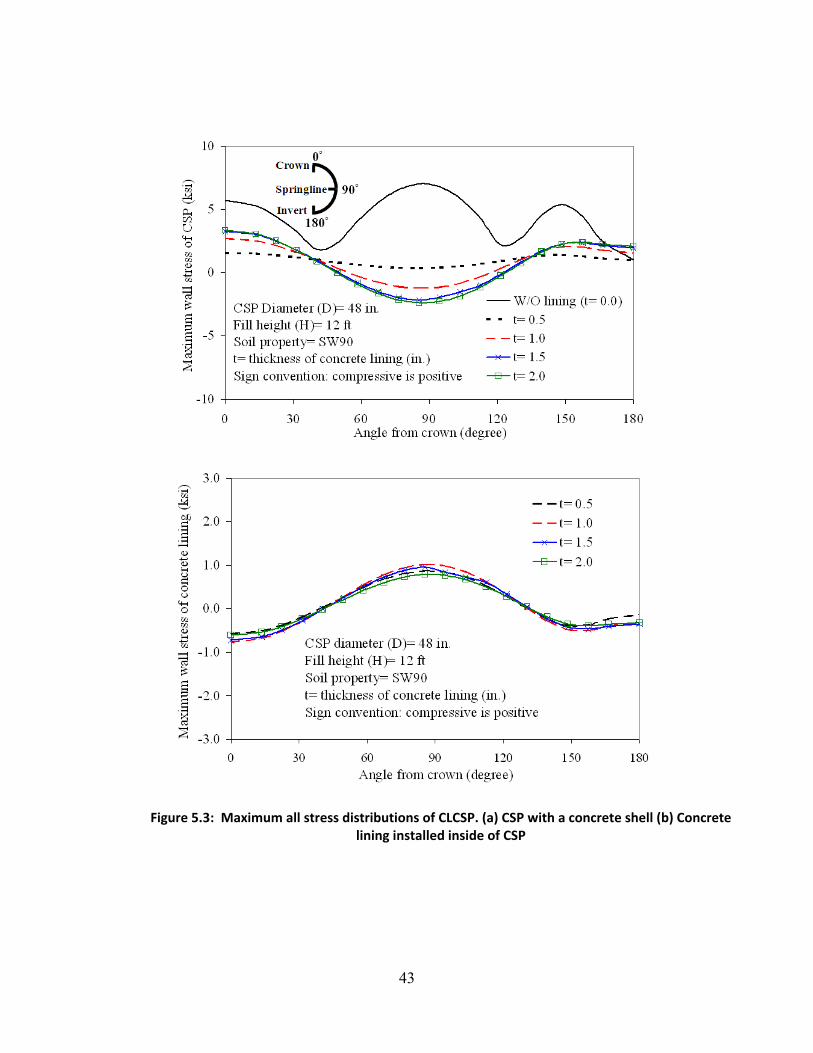
5.4.2 Stress Distribution of Concrete Lining and CSP As shown in Fig. 5.3(a), maximum wall stresses of CSP can be reduced by 50% in CLCSP, which indicates that the loads transferred from the CSP with a concrete shell are transferred to the concrete lining. The tensile stresses in CSP are induced at the springline. The compressive stresses, however, are still larger than the tensile stresses. This load transfer is not desirable as the tensile stresses of concrete lining are inevitable in CLCSP systems. Therefore, the concrete lining should be strong enough to endure the loads transferred from the CSP. Fig. 5.4 shows the typical maximum wall stress distribution in the concrete lining. It demonstrates that the stress distribution in the lining is not highly affected by the variation in lining thickness, and that the maximum compressive and tensile stresses are induced at the springline and crown, respectively. It should be noted that the tensile stress of concrete lining at the crown reached the specified tensile strength of concrete under only 12 ft backfill. This means that the governing design factor of buried CLCSP will be the tensile strength of concrete.
42
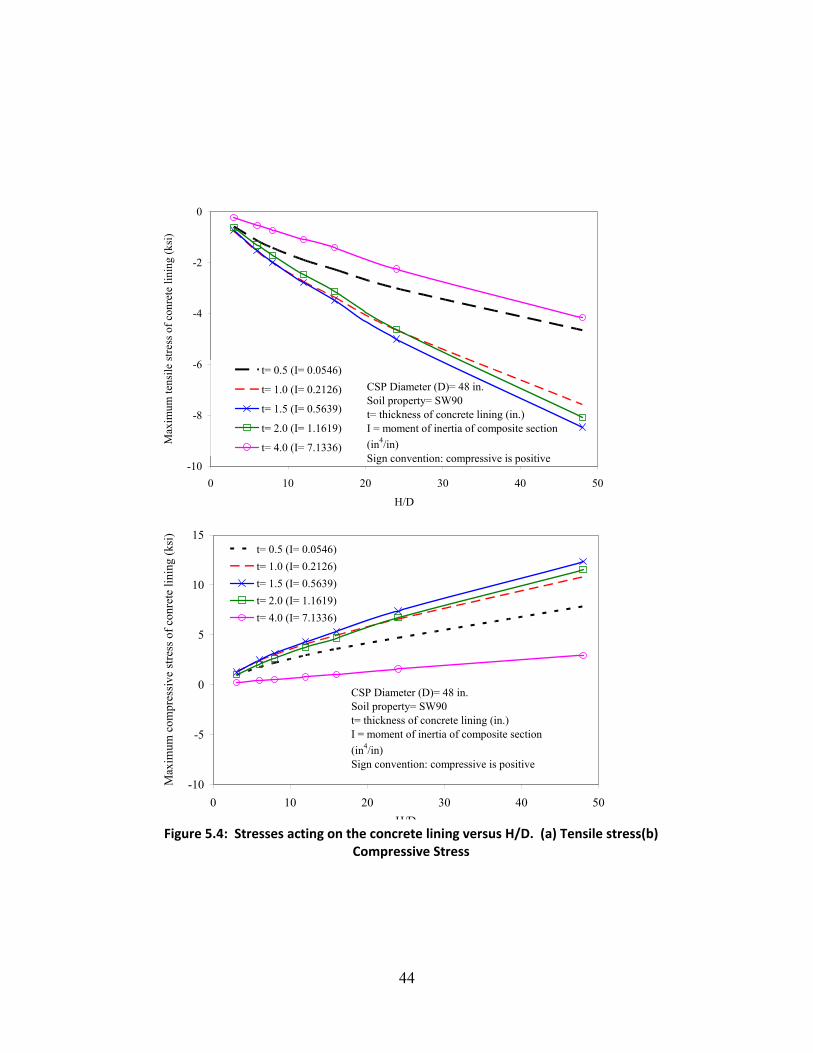
5.4.3 Maximum Tensile and Compressive Stresses versus Backfill Height Fig. 5.4 shows the variation of maximum compressive and tensile stresses versus the ratio of backfill height (H) and CSP diameter (D). The 4 inch lining thicknesses results in the smallest stresses. However, there is no significant difference between 1 inch and 2 inch lining thicknesses. It is noticeable that the 0.5 inch lining thickness resulted in stresses lower than the 1 to 2 inch thicknesses. It could be concluded that, as long as the much thicker linings are not used, the thin linings can minimize the tensile and compressive stresses in the concrete lining. It seems that the thicknesses of 0.5 to 1.0 inch are optimum in most cases. As mentioned earlier, tensile stresses of the concrete lining typically controls the CLCSP design. In the case of H/D = 10 and t = 1.0 inch, compressive and tensile stresses of concrete lining are 4 ksi and 2 ksi, respectively. Based on compressive and tensile strength of concrete in Table 5.1, tensile failure of concrete lining would be induced.
Figure 5.2: Section geometry and definition of CLCSP.
43
Figure 5.3: Maximum all stress distributions of CLCSP. (a) CSP with a concrete shell (b) Concrete lining installed inside of CSP
44
-10
-8
-6
-4
-2
0
0 10 20 30 40 50
H/D
Max
imum
tens
ile st
ress
of c
onre
te li
ning
(ksi
)
t= 0.5 (I= 0.0546)
t= 1.0 (I= 0.2126)
t= 1.5 (I= 0.5639)
t= 2.0 (I= 1.1619)
t= 4.0 (I= 7.1336)
CSP Diameter (D)= 48 in.Soil property= SW90t= thickness of concrete lining (in.)I = moment of inertia of composite section(in4/in)Sign convention: compressive is positive
CSP Diameter (D)= 48 in.Soil property= SW90t= thickness of concrete lining (in.)I = moment of inertia of composite section (in4/in)Sign convention: compressive is positive
Figure 5.4: Stresses acting on the concrete lining versus H/D. (a) Tensile stress(b) Compressive Stress
45
0
2
4
6
8
10
12
0 25 50 75 100 125 150 175 200
D/t
T/T t
at c
row
n of
lini
ng (l
b/in
)D=48, D/r=137
D=96, D/r=274
0.0
0.1
0.2
0.3
0.4
0 25 50 75 100 125 150 175 200
D/t
M/M
t at c
row
n of
lini
ng (l
b/in
)
D=48, D/r=137
D=96, D/r=274
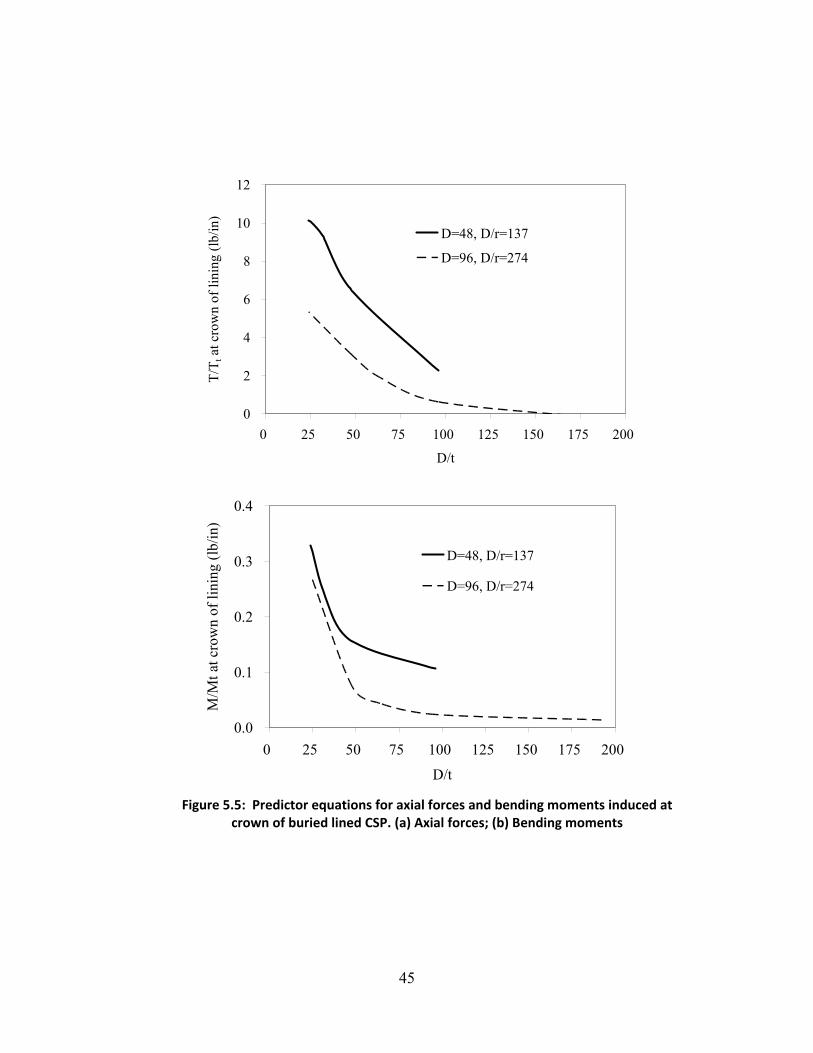
Figure 5.5: Predictor equations for axial forces and bending moments induced at crown of buried lined CSP. (a) Axial forces; (b) Bending moments
46
5.5 Design Method
5.5.1 Tensile stress of concrete lining It will be useful to establish optimum concrete lining thickness based upon common conditions. The design method incorporated with the numerical and analytical results, also, would present the basic guideline for soil-lined CSP interaction to someone that would like to design CSP lined with other materials such as plastics or fiber reinforced concretes in the future. This section recommends design equations for maximum tensile stresses and deflections of concrete linings. The maximum tensile stresses are induced at the inside of the crown. Therefore, the maximum tensile stresses formula for concrete lining installed inside of CSP is as follows:
sct
s s c c c
M h E TE I E I A
σ ⋅ ⋅= ± ±
⋅ + ⋅ (5.7)
where ctσ = maximum tensile stress of concrete lining induced at the inside of crown; M = bending moment at the crown; h = distance from the inside surface of crown to the neutral axis of the CLCSP composite section. More than 500 hypothetical finite element models were run in order to generate data to develop equations for the bending moment (M) and axial force (T) acting on the concrete lining at the springline. The resulting equations are plotted in Fig. 5.5, where r is the radius of gyration and t is thickness of concrete lining. The following Mt and Tt equations are formulated from Castigliano’s theorem [Watkins 1999] based on the load and boundary condition shown in Fig. 5.6.
( / 2) 0.053053t
P DT P Dπ
= − = − ⋅ (5.8)
2
2( / 2) 0.0749(4 / 3 / 8)t
P DM P Dπ
= = ⋅−
(5.9)
The prism load (P) is calculated as follows:
(4 )8
DP w H π−⎡ ⎤= +⎢ ⎥⎣ ⎦ (5.10)
where the units of P, H, and D are psf, ft, and ft, respectively. The corrugated shape of the concrete lining is assumed to be rectangular in order to simplify the design procedure, which provides conservative results due to the reduced moment of inertia of
47
concrete lining. The following equation can be used to locate the neutral axis for a composite section of two materials. 0s c
s c
E h dA E h dA⋅ + ⋅ =∫ ∫ (5.11)
It should be noted that the bending moments and axial forces from Fig. 5.5 were based on a concrete lining. This study evaluated the differences between using other materials such as PVA reinforced concrete used in the lining. As a result, the maximum tensile stresses from PVA reinforced concrete lining are just 6% less than those of concrete lining. Therefore, these equations would provide conservative results and could be used for other fiber reinforced concrete linings by using appropriate correction factors. The application of these equations and graphs will be demonstrated in the next sections.
5.5.2 Deflection of CLCSP Fig. 5.7 shows the deflection. Deflection is less than 3% in most cases. Therefore, the design of CLCSP is governed by the tensile strength of concrete, and not the deflection.
P
Figure 5.6: Pipe on a flat surface.
48
0%
1%
2%
3%
0 10 20 30 40 50 60
H/D
Def
lect
ion
(%)
t= 0.5
t= 1.0
t= 1.5
t= 2.0
t= 4.0
0%
1%
2%
3%
0 5 10 15 20 25 30
H/D
Def
lect
ion
(%)
t= 0.5
t= 1.0
t= 1.5
t= 2.0
t= 4.0
Figure 5.7: Deflections at the crown of CLCSP. (a) D= 48 inch, D/r= 137; (b) D= 96 inch, D/R= 274
49
5.5.2 Design Example A corrugated steel pipe with corrugations of 3 inch pitch and 1 inch depth and thickness of 0.168 inch is to be lined (measured from the neutral axis of the CSP) and buried under 20 ft of SW90 backfill. The pipe diameter is 48 inch. The material properties of the soil, steel and concrete are given in Table 5.1. Check if the thickness of concrete lining is adequate. STEP 1: Assume the lining thickness In this example, the initial lining thickness was assumed with 2 inch STEP 2: Calculate the properties of composite section From Eq. (5.11),
2 21 10 ( ) [ ( ) ]2 2s c s s c
s c
E h dA E h dA E A t h t h h E⋅ + ⋅ = = − + − −∫ ∫
2 21 10 29000000 0.1775(2 ) [ (2 ) ]36000002 2
h h h= ⋅ − + − −
1.41in.h∴ = where t is the lining thickness and As is 0.1778 in2 from AASHTO LRFD [2004] or AISI [1994]. Es and Ec were taken from Table 5.1. Moments of inertia of CSP and concrete in the composite section can be calculated by the following equations. 2 2( ) 0.005725 0.17775(2 1.417) 0.066 . / .s csp sI I A t h in in= + − = + − =
2 2
3 3 41 1 1 1(2) 2 1.417 2 1.015 . / .12 2 12 2cI t t h t in in⎛ ⎞ ⎛ ⎞= + − = + − ⋅ =⎜ ⎟ ⎜ ⎟
⎝ ⎠ ⎝ ⎠
where Icsp was taken from AASHTO LRFD [2004] or AISI [1994]. STEP 3: Calculate the earth pressure (prism load).
No good. Retry STEP 1: Assume the lining thickness Try 1 inch STEP 2: Calculate the properties of composite section
2 21 10 ( ) [ ( ) ]2 2s c s s c
s c
E h dA E h dA E A t h t h h E⋅ + ⋅ = = − + − −∫ ∫
2 21 10 29000000 0.1775(1 ) [ (1 ) ]36000002 2
h h h= ⋅ − + − −
0.79in.h∴ = Moments of inertia of CSP and concrete in the composite section can be calculated by the following equations. 2 2( ) 0.005725 0.17775(2 0.79) 0.013 . / .s csp sI I A t h in in= + − = + − =
2 2
3 3 41 1 1 1(1) 1 0.79 1 0.17 . / .12 2 12 2cI t t h t in in⎛ ⎞ ⎛ ⎞= + − = + − ⋅ =⎜ ⎟ ⎜ ⎟
⎝ ⎠ ⎝ ⎠
STEP 3: Calculate the earth pressure (prism load).
Good. Therefore, the 1 inch lining thickness is satisfactory. This example illustrates the internal indeterminate nature of the problem. Thicker linings are not necessarily more efficient; thinner linings can effectively minimize the tensile or compressive stresses in the lining. From the liner stress standpoint, the optimum thicknesses tend to be between 0.5 and 1.0 inch. 5.6 Engineering Methodology Summary This study evaluated soil-structure interaction of concrete-lined corrugated steel pipes (CLCSP) and compared them with unlined CSP. The findings in this study can be summarized as follows:
• The design method, which uses numerical and analytical results to overcome the indeterminate and nonlinear challenges of the problem, presents a basic approach for lined CSP interaction.
• Concrete lining reduced the maximum stresses in the CSP by approximately 50%.
• The governing factor of CLCSP design is the tensile strength of concrete lining, with
highest tensile stresses at the crown and invert.
• Based on these analyses, the optimum thickness of concrete lining is approximately 1 inch (measured from the neutral axis of CSP) under fill height less than 24 ft.
• This analysis was based on non-damaged CSP resistance. It indicates that the use of concrete lining will compensate for the section loss of existing deteriorated CSP, but additional investigation is needed to estimate reduction in section capacity and lining effectiveness for deteriorated sections.
52
SECTION 6: CONCLUSIONS AND RECOMMENDATIONS This project investigated the potential of using PVA reinforced shotcrete for strengthening deteriorating metal highway drainage culverts. Significant advances were made with material, implementation, and analytical goals. The laboratory-scale component of the investigation verified the significant tensile strength, ductility, and strain-hardening characteristics that have been presented by others. However, achieving these characteristics proved to be challenging, even in a controlled laboratory environment. Ductility and strength performance depends upon using very precise and specific constituents, including fine silica sand with average particle diameter of 110 µm, proprietary admixtures required to prevent clumping of the fibers, and pre-oiled fibers that are engineered to balance the chemical bond and mechanical slip required to achieve significant ductility. Also, since PVA fibers are hydrophilic, achieving proper water content proved challenging. These challenges were amplified when developing a methodology for pumping and spraying the PVA concrete on the inside of a corrugated steel pipe. Many iterations were required to balance the challenges of pumpability and sprayability with the requirement that the liner material must readily adhere to the crown of the metal pipe. After successfully lining a 48 inch pipe, a three-point bending test was conducted to illustrate the resistance improvements provided by the liner. Although the strength and stiffness enhancement provided by the liner was evident, the characteristic microcracking and ductility demonstrated in the laboratory was not observed in the 3-point load test. FE analyses indicate that a thin liner application (approximately 1 inch thickness) would be optimum for typical applications, assuming tension enhancement demonstrated in the laboratory can be achieved under field conditions. Finally, an analytical approach was derived for designing the required liner thickness, and practical field implementation challenges were outlined. Overall, the project team believes that the rehabilitation approach investigated offers great potential as a solution to the metal culvert deterioration problem. The PVA-ECC material offers intriguing and unique characteristics that would help minimize the liner thickness required, but comes with several practical implementation challenges. It is recommended that the next step be to demonstrate that the constructability challenges can be overcome, and that a uniform structurally sound liner can be applied under field conditions. The following specific actions are recommended to promote the technology towards a valuable fielded approach:
1. Industry partner (Blastcrete Equipment Co.) demonstrate the fieldability of the spray-on concrete liner approach under an ALDOT product evaluation agreement or other agreed upon technology demonstration mechanism;
2. Develop field construction guidelines, define limitations where the approach is not
appropriate, and adopt quality assurance and strength verification test procedures;
53
3. Consider other fiber reinforcement options that would be easier to implement, and
investigate the issues associated with those approaches;
4. Investigate long-term stability issues to ensure stable strength over the service life of the culvert; monitor several locations where the approach has been applied;
5. Refine and validate engineering and design methodology through testing, and relate to
existing culvert design specifications; test a range of lined culverts in a controlled laboratory setting to validate load resistance definitions used for design;
6. Look into other DOT repair needs where a fiber reinforced shotcrete approach may offer a cost-effective solution.
54
REFERENCES ABAQUS (2003). Inc. ABAQUS analysis user’s manual. Pawtucket, RI. AISI (1994). Handbook of Steel Drainage & Highway Construction Products, 5th, AISI, Washington, DC. Alabama County Engineers Association (1999). “The Crisis Continues,” ACEA Legislative Report. American Association of State Highway Transportation Officials (AASHTO) (2002). “The Bottom Line,” AASHTO TEA-21 Reauthorization Steering Committee, Washington, DC. American Association of State Highway Transportation Officials (AASHTO) (2004). LRFD Bridge Design Specifications, 3rd ed. AASHTO, Washington, D.C. Balaguru P, S.S. (1992). Fiber Reinforced Cementitious Composites, McGraw-Hill Publishing Company Ltd. Contech (2000). HEL-COR CL Concrete-Lined Corrugated Steel Pipe, www.contech-cpi.com Duncan JM, Chang CY (1970). Nonlinear analysis of stress and strain on soils. J. Soil Mech. and Found Div., ASCE ; 96(5): 1629-1653. Kanda, T. and Li, V.C. (1999). Effect of fiber strength and fiber-matrix interface on crack bridging in cement composites, Journal of Engineering Mechanics: 125(3): 290-299. Kim, Y.Y., Kong, H.-J. and Li, V.C. (2003). Design of Engineered Cementitious Composite Suitable for Wet-Mixture Shotcreting, ACI Materials Journal: 100(6): 511-518. Kim, Y.Y., Fischer, G., Lim, Y.M. and Li, V.C. (2004). Mechanical performance of sprayed engineered cementitious composite using wet-mix shotcreting process for repair applications, ACI Materials Journal: 101(1): 42-49. Kim K, Yoo CH (2005). Design Loading for Deeply Buried Box Culverts, J. Geotech. Geoenviron. Eng., ASCE; 131(1): 20-27. Kondner RL (1963). Hyperbolic stress-strain response: cohesive soils, J. Soil Mech. Found. Div., ASCE; 98(1): 115-143. Kong, H.-J., Bike, S.G. and Li, V.C. (2003a). Development of a self-consolidating engineered cementitious composite employing electrosteric dispersion/stabilization, Cement and Concrete Composites: 25(3): 301-309.
55
Kong, H.-J., Bike, S.G. and Li, V.C. (2003b). Constitutive rheological control to develop a self-consolidating engineered cementitious composite reinforced with hydrophilic poly(vinyl alcohol) fibers, Cement and Concrete Composites: 25(3): 333-341. Li, V. C. (2002), “Large Volume, High-Performance Applications of Fibers in Civil Engineering,” Journal of Applied Polymer Science, Vol. 83, 660-686. Li, V.C. and Mishra, D.K. (1996). Structural applications of engineered cementitious composites, Indian Concrete Journal: 70(10): 561-567. Li, V.C., Wu, C., Wang, S., Ogawa, A. and Saito, T. (2002). Interface tailoring for strain-hardening polyvinyl alcohol-engineered cementitious composite (PVA-ECC), ACI Materials Journal: 99(5): 463-472. Li, V.C., Wang, S. and Wu, C. (2001). Tensile strain-hardening behavior or polyvinyl alcohol engineered cementitious composite (PVA-ECC), ACI Materials Journal: 98(6): 483-492. Li, V.C. (2002). Large volume, high-performance applications of fibers in civil engineering, Journal of Applied Polymer Science: 83(3): 660-686. Li, V.C. (2003). On Engineered Cementitious Composite - A Review of the Material and Its Application, Journal of Advanced Concrete Technology: 1(3): 215-230. Li, V.C. and Leung, C.K.Y. (1992). Steady-state and multiple cracking of short random fiber composites, Journal of Engineering Mechanics: 118(11): 2246-2264. Lin RSD (1987). Direct determination of bulk modulus of partially saturated soils”, Project Report ACP87-341P, M.S. Degree, University of Massachusetts, Amherst, MA. Lin, Z. and Li, V.C. (1997). Crack bridging in fiber reinforced cementitious composites with slip-hardening interfaces, Journal of the Mechanics and Physics of Solids: 45(5): 763-787. Marshall, D.B. and Cox, B.N. (1988). J-integral method for calculating steady-state matrix cracking stresses in composites, Mechanics of Materials: 7(2): 127-133. Musser SC (1989). CANDE-89 user manual. FHWA-RD-89-169. Federal Highway Administration, U.S. Department of Transportation. NCHRP (2008), Report 619: Modernize and Upgrade CANDE for Analysis and LRFD Design of Buried Structures, National Cooperative Highway Research Program, TRB. Peled, A., Cyr, M.F. and Shah, S.P. (2000). High content of fly ash (Class F) in extruded cementitious composites, ACI Materials Journal: 97(5): 509-517.
56
Redon, C., Li, V.C., Wu, C., Hoshiro, H., Saito, T. and Ogawa, A. (2001). Measuring and modifying interface properties of PVA fibers in ECC matrix, Journal of Materials in Civil Engineering: 13(6): 399-406. Rinker Materials (2006). Concrete-Lined Corrugated Metal Pipe, Info Series. Selig ET (1988). Soil parameters for design of buried pipelines. In Pipeline Infrastructure: Proc., Pipeline Infrastructure Conference, ASCE. Takashima, H., Miyagai, K., Hashida, T. and Li, V.C. (2003). A design approach for the mechanical properties of polypropylene discontinuous fiber reinforced cementitious composites by extrusion molding, Engineering Fracture Mechanics: 70(7-8): 853-870. Wang, S. and Li, V.C. (2007). Engineered cementitious composites with high-volume fly ash, ACI Materials Journal: 104(3): 233-241. Wang, S. and Li, V.C. (2006). High-early-strength engineered cementitious composites, ACI Materials Journal: 103(2): 97-105. Yang, E.-H., Yang, Y. and Li, V.C. (2007). Use of high volumes of fly ash to improve ECC mechanical properties and material greenness, ACI Materials Journal: 104(6): 620-628. Zheng, Z. and Feldman, D. (1995). Synthetic fibre-reinforced concrete, Progress in Polymer Science (Oxford): 20(2): 185-210.
57
APPENDIX A: MATERIAL TECHNICAL DATA SHEETS
58
59
60
61
62
63
64
APPENDIX B: DATA PLOTS
65
Figure B1: The effect of CA content on the flexure properties
Figure B2: The effect of CA content on tensile properties
66
Figure B3: The effect of CA content on the compressive properties
Figure B4: The effect of water content on the flexural properties
67
Figure B5: The effect of water content on the tensile properties
Figure B6: The effect of water content on the compressive properties