PIPING PROFITS Mapping the 6,038 subsidiaries owned by ten of the world’s most powerful Extractive Industry giants and the quest by Latin American journalists to nd out more ;OPZ YLWVY[ OHZ YLJLP]LK ÄUHUJPHS Z\WWVY[ MYVT [OL 9V`HS 5VY^LNPHU 4PUPZ[Y` VM -VYLPNU (MMHPYZ [OYV\NO º;OL +PHSVN\L 7YVQLJ[ *HWP[HS MVY +L]LSVWTLU[» HUK MYVT [OL 5VY^LNPHU (NLUJ` MVY +L]LSVWTLU[ *VVWLYH[PVU 5VYHK 7\ISPZO >OH[ @V\ 7H` 5VY^H` [HRLZ M\SS YLZWVUZPIPSP[` MVY [OL JVU[LU[ VM [OPZ YLWVY[ Written and researched by Nick Mathiason
Transcript
PIPING PROFITSMapping the 6,038 subsidiaries owned by ten of the world’s most powerful Extractive Industry giants and the quest by Latin American journalists to !nd out more
In many countries north and south of the equator, citizens are asking whether lucrative deals to extract their countries’ non-renewable and finite naturalresources provide meaningful investment opportunities to escape poverty.
Until now, the main focus of questions in this respect has been on corruptionand poor leadership, as citizens have both a right and a duty to hold theirleaders accountable. History has given us countless examples of a state’sapparatus and its leaders failing to protect citizens and promote democracy.
That said, many nation states find it virtually impossible to penetrate thesecrecy surrounding international billion dollar agreements to extract non-renewable and finite natural resources.
Global financial and technological integration has made it easier formultinational companies to structure transactions and profit betweenjurisdictions, helped by armies of corporate accountants and lawyers. Out ofpublic sight, around 60-70% of multinational trade is intragroup through theuse of subsidiaries.
So Publish What You Pay Norway wanted to establish the number of subsidiariesextractive companies use, where they are located and how many of them areincorporated in so-called ‘secrecy jurisdictions’.
This report would not have been possible without funding from the NorwegianMinistry of Foreign Affairs through its Dialogue programme. We are verygrateful for this.
We commissioned Nick Mathiason, Business Correspondent at the Bureauof Investigative Journalism and a former senior Guardian and Observerjournalist, to carry out a journalistic investigation, working with participants inour TRACE programme to see what information they could gather. They haveworked tirelessly to uncover information in many countries worldwide.
We are honoured that Raymond Baker, director of Global Financial Integrityand the author of Capitalism’s Achilles Heel, has agreed to write theintroduction to this report. We would also like to thank Kevin Kallaugher, theeminent Economist illustrator, for creating the art on the front cover, and worldrenowned photographer Gideon Mendel for contributing his photographs ofAfrican miners which appear in this report.
Finally, we would like to thank all those who have supported us with theirknowledge and precious time in the making of this report.
Mona Thowsen National coordinator, PWYP Norway
5PIPING PROFITS
LEGAL DISCLAIMER : ABBREVIATIONS
Legal disclaimer:This publication is based on information provided to Publish What You Pay Norway (‘PWYP Norway’) and individuals acting on behalf of PWYP Norway by the companies mentioned herein and information that is publicly available. The conclusions presented herein are based only on information so provided. PWYP Norway and those acting on behalf of PWYP Norway have strived towards acquiring full overview of all relevant information and data to prepare this publication including by way of direct requests to the companies mentioned herein. We do not accept liability whatsoever for any insufficiency or inadequacy of the information and data that this publication is based upon.
While PWYP Norway has taken all reasonable care to ensure that the information contained in this publication is accurate, publicly available information and data has not been verified by the companies and neither PWYP Norway or any person acting on behalf of PWYP Norway in the drafting and preparation of this publication can be held legally responsible for the content or guarantee that it is totally free from errors or inaccuracies.
Any references contained in this publication pertaining to any kind of sources, publications or websites from third parties, are inserted for convenience only and are purely for informative purposes only and do not constitute endorsement of material on those sites, publications or sources. PWYP Norway and those acting on its behalf accept no liability whatsoever for any loss or damage arising from the use of such information.
ABBREVIATIONS
ABG ............................ Africa Barrick Gold
PWYP Norway ........... Publish What You Pay Norway
SEC .............................. Securities and Exchange Commission
SEDAR ......................... System for Electronic Document Analysis and Retrieval
6 PIPING PROFITS
EXECUTIVE SUMMARY
EXECUTIVE SUMMARY
In this report, Publish What You Pay Norway (PWYP Norway) has attempted to unravel labyrinthine corporate structures created by some of the world’s biggest energy and mining companies.
Trawling filings made in British company registers and in United States and Canadian stock exchanges, PWYP Norway has investigated:
1) how many subsidiaries ten of the most powerful Extractive Industry Companies (EICs) control;
2) where those subsidiaries are incorporated;
3) the proportion of EIC subsidiaries incorporated in Secrecy Jurisdictions;
4) the Secrecy Jurisdictions most widely used by powerful EICs;
5) the intense difficulties faced by journalists and campaigners in Bolivia and Ecuador in accessing key financial and industrial performance indicators from major companies operating in their countries.
The ten Extractive Industry (EI) giants largely featured in this study are based in Australia, Canada, Switzerland, the United Kingdom and the United States. Their operations and influence are global.
The companies Piping Profits studied are ExxonMobil, ConocoPhillips, Chevron, BP and Royal Dutch Shell in the oil and gas sector and Glencore International AG, Rio Tinto, BHP Billiton, Anglo American and Barrick Gold Corporation in the broader extractive sector.1
These ten global corporations state that they generate revenues of $1,824 billion, state their costs as $1,592 billion, make $144.7 billion profits net of tax and pay $106.9 billion in tax according to their ‘consolidated’ accounts.2
‘Consolidated’ accounts are the sum of millions of separate transactions from thousands of subsidiary companies which EICs either own outright or enjoy substantial control over that are scattered throughout the world.3
Piping Profits has looked beyond EICs consolidated accounts and found that combined the ten most powerful EI giants own 6,038 separate companies.
This in itself reveals the complicated nature of the EI. BP, the UK based oil giant, lists 2,870 separate subsidiary entries in its 2010 Annual Report. But that is only part of the story.
Piping Pro!ts also reveals that 2,083 or 34.5% of these 6,038 subsidiaries are incorporated in Secrecy Jurisdictions – places where among many other advantages for companies requiring secrecy, company accounts and bene!cial ownership details are not publicly available.
This presents difficulties for citizens in resource-rich nations or shareholders with their pension money invested in EICs wanting to understand the performance of a particular company’s operations in a specific jurisdiction.
1 We also mapped three Norwegian Exploration & Production firms: Statoil, DNO International and InterOil whose results are not included in the main findings but detailed later in this report.
2 Financial details taken from the Ten EICs Annual Reports in 2010 except BP where we used the 2008 results as explained more fully later.3 http://www.ocf.berkeley.edu/~cchang/pdf%20docs/ch003.pdf
7PIPING PROFITS
EXECUTIVE SUMMARY
For instance:
period by a particular company in a specific country?
incurred if they are largely hidden from view?
incentives struck by governments and executives behind closed doors?
Accurate information of an EIC’s assets and performance in each country it operates would:
1) help investors quantify the risk of investing in it;
2) help generate information that could be used by civil society to assess whether EIC tax and royalty payments represent a good deal for their country; and
3) help civil society track how EI taxes have been spent in their country.
But getting any specific operational and financial performance information from oil and mining firms, as proved by a number of journalists based in Bolivia and Ecuador working on the Piping Profits report, was difficult, if not impossible.
EI giants’ corporate ownership structures, their use of secrecy jurisdictions and the lack of meaningful information they impart is a major reason why stakeholders in resource-rich nations often meet a wall of silence when asking questions about EICs. This makes it very difficult to hold their politicians and the companies that extract oil, gas and minerals to account.
These structures seem to hinder efficient markets, level playing fields and improved governance. Even worse, the same structures can potentially encourage corruption and aggressive tax avoidance, so depriving citizens in least developed and emerging nations of manifold political, economic and social opportunities.
Many multinational companies are adept at using controversial techniques to significantly reduce perceived profits. This in turn means they pay less tax in revenue generating countries.4
Techniques include:
1) creating subsidiary companies to act as the ultimate owners of brands and assets in opaque jurisdictions like the Netherlands;
2) the payments of large management fees by revenue producing companies in one country to another group company that is based in a tax haven;
3) shrouding revenues made by a revenue generating company through inter-company trading activity in an activity known as transfer pricing; and
4) thin capitalisation which is when a loan is issued by a group subsidiary member to a revenue generating one at sometimes very steep interest rates.
There is nothing to suggest that the companies featured in this report act in this way or illegally evade tax.
However, among the many findings of Piping Profits is that the global EI’s favourite place by far to incorporate is the US state of Delaware. The so-called First State also happens to be the headquarters of global corporate secrecy5 where:
1) details of trusts on public record are not available;
2) international regulatory requirements are not sufficiently complied with;
3) company accounts are not available on public record;
4) beneficial ownership of companies is not recorded on public record;
5) company ownership details are not maintained in official records; and
6) protected cell companies are allowed.
There are 915 Delaware subsidiaries owned by the ten EI majors – 15.2% of the overall 6,038.
The EICs sampled owned 1,154 subsidiaries incorporated in the United States with 78.9% of them located in Delaware.
The second favourite EIC Secrecy Jurisdiction is the Netherlands, where 358 subsidiaries belonging to EI giants are based. The Netherlands does not
1) put"details of trusts on public record;"
2) require that company accounts or bene!cial ownership be available on public record; and
3) maintain"company ownership details in official records.
The Netherlands is the largest host of conduit companies worldwide and is an important jurisdiction for corporate internal debt shifting. It is why oil, gas and mining assets from all over the world are held, at least on paper, in the Netherlands including diamonds from Mali, gas from Egypt and oil from West Africa.
The Piping Pro!t Report also established that the most opaque major EIC in this study is Chevron.
of its US incorporated companies.
ConocoPhillips is the second most opaque oil and gas major in this report after Chevron with 57% of its 536 subsidiaries incorporated in Secrecy Jurisdictions.
Exxon is almost as shy when it comes to the incorporation of its subsidiaries. Some 52% of its 170 reported subsidiaries are held in Secrecy Jurisdictions.
Chevron, Conoco and Exxon are the three US EI major companies surveyed in this report. Combined, 439 (56.1%) of those three North American oil majors’ 783 subsidiaries are incorporated in Secrecy Jurisdictions.
Glencore International AG is the most opaque mining company in our survey with 46% of its 46 subsidiaries incorporated in Secrecy Jurisdictions. This is relevant given information contained in Glencore’s recent listing document which con!rms that its e#ective tax rate for its 2010 $234m tax bill, ‘was 9.3% compared to 12.6% for 2009’ on revenues of $144.9 billion and pro!ts of $4.1 billion.6 The Swiss-based !rm controls 60% of the world’s zinc, half the world’s copper, 38% of aluminium and 9% of the global grain market.
5 Financial Secrecy Index http://www.financialsecrecyindex.com/2009results.html6 Glencore International’s Initial Public Offering Prospectus – http://www.scribd.com/doc/54605519/Glencore-IPO-
mtorres
Highlight
9PIPING PROFITS
EXECUTIVE SUMMARY
The findings contained in this report are, we believe, of critical concern because natural resources offer perhaps the largest financial potential to improve the economic and social opportunities for hundreds of millions of people living in least developed and emerging countries. Aid will never reach necessary volumes, and developing countries should have the right to mobilise their own resources.
Yet this report o#ers a clear indication that a veil of secrecy might shroud those opportunities.
That is why PWYP Norway believes every company should publish their full revenues, costs, profits, tax and the amount of natural resources it has used, written off and acquired in any given year in every country it operates.
This is full Country-by-Country Reporting (CBCR) and it is clearly urgently needed given the secretive nature of the EI industry.
This report is published at a critical time. Within the 2010 Dodd Frank Wall Street Reform and Consumer Protection Act (Dodd-Frank)7 is a useful disclosure that requires all US-listed firms (American and foreign) to report to the Securities and Exchange Commission (SEC) detailed payments made to any state in which it operates on a project-by-project basis. The SEC is finalising how those rules will be applied.
Dodd-Frank does not implement full CBCR. But the 2011 version of the Stop Tax Haven Abuse Act8 does contain a full CBCR provision.
The European Union is also poised to publish similar legislation. As yet it is unclear how strong its legislation will be.
If these policies are framed in the public rather than the corporate interest to produce a full CBCR international standard, they have the potential to improve problems associated with corruption, aggressive tax avoidance and secrecy immeasurably. This in turn will improve beyond recognition the political, economic and social progress made by least developed and emerging resource-rich nations.
The US and EU are both at a major crossroads with the formation of these policies.
There are, however, serious concerns that these new international rules currently drafted and discussed will fall short of implementing full CBCR and so fail to address and improve good governance and e$cient markets as well as tackling corruption and aggressive tax avoidance.
‘I always heard it was very complex – and sometimes even dangerous – to obtain !nancial information about the activity of the Extractive Industries,’ concluded Bolivian campaigner Marco Escalera after spending six weeks attempting to draw out key !nancial information from EICs operating in his country. ‘Whether it is the extractive industries or the state itself, they close ranks against the common enemy: civil society questions. The story is repeated over and over again: There is no access to timely and reliable information.’
Policymakers in the EU and US currently have a choice:
1) whether to frame new CBCR legislation to aid people like Marco Escalera in his quest for clarity, justice and equity based on the public interest; or
2) to tolerate conditions that allow corruption and aggressive tax avoidance to thrive.
Soon we will know whose side legislators in the EU and US are on.
INTRODUCTION BY RAYMOND BAKEROver the last half century there has arisen over our world a complex global shadow financial system that manages, moves, and secretes trillions of dollars a year. This system comprises tax havens, secrecy jurisdictions, shell corporations, anonymous trust accounts, fake foundations, trade mispricing practices, and a variety of money laundering techniques. Drug traffickers, other racketeers, corrupt government officials and commercial tax evaders have equal access to this system. By some estimates it handles perhaps half of global trade and capital movements, interjected between the beginning and the end of transactions to shield sources or uses of funds.
The development of this system accelerated in the 1960s for two reasons. First, that period was the era of independence, with 48 countries gaining their freedom from colonial powers. Some of the economic and political elites in these new nations wanted to get their money out by any means possible. Western banks and governments serviced this desire for capital flight with a great deal of creativity and courtesy. Second, corporations began to spread their flags around the world. There are now more than 60,000 multinationals operating usually in dozens of countries. Many of these corporations normalized the use of the shadow financial system to shift profits round the world.
Economists usually attribute a ‘rational’ explanation to this phenomenon. Individuals are said to be engaged in portfolio diversification or protection against inflation or confiscation. Corporations are escaping taxes in far-flung operations and even in home countries. All true, but such explanations miss the more fundamental motivation. The essential purpose of the global shadow financial system is the shift of money from poor to rich. This is about getting rich secretly and not having to account for such riches locally. The hidden accumulation of wealth, whether by persons or corporations, is the driving force sustaining and expanding the shadow system. The facilitation of opacity is what the system was intended to do from the 1960s onward, and it performs this function most efficiently, to the detriment of the poor across the globe.
What can change this now entrenched reality? Many bankers and treasury o$cials argue that this subject matter is extremely complex, fraught with interlaced intricacies preventing easy solutions. Not so. The focused application of political will can readily alter the status quo. Take for example shell banks, which used to be part of the global shadow financial system – banks fronted by nominees and trustees in such a way that no one knew who were the real owners and managers. In October 2001, a month after 9/11, the United States enacted the Patriot Act aimed at curtailing terrorist activity and its financing. The Patriot Act said that no US bank could receive money from a foreign shell bank, no other bank in the world could send money to the United States that it had received from a shell bank, and that this prohibition included wire transfers that might momentarily pass through New York correspondent bank accounts before speeding off elsewhere. Within weeks the number of shell banks dropped from thousands to a handful. There are a few still operating in Europe and Asia, all very careful to assure that their activities never touch the United States. In other words, with a stroke of the legislative pen shell banks were virtually erased from the global shadow financial system. This was achieved through an exercise of political will.
11PIPING PROFITS
INTRODUCTION
Nowhere has the absence of political will been more evident than in the extractive industries. That is, until now. Finally, with the Dodd-Frank legislation in the United States and similar measures expected in the European Union soon, oil and mining companies will be required to account for what they pay to governments in production shares, bonuses, royalties, and taxes on a project-by-project basis. This is a much needed step in the right direction.
But it does not begin to curtail the use of the shadow financial system by extractive industries, as convincingly demonstrated by Publish What You Pay Norway in this report, Piping Profits. Ten of the most powerful oil and mining companies operate through 6,038 subsidiaries. Over one-third of these subsidiaries are located in tax havens and secrecy jurisdictions where company accounts are not required or available. Quite simply, it is impossible to determine what money flows into or out of these entities, for what purposes. Even, as this report shows, when journalists and advocates ask companies for basic information about their local activities, they are deflected and stonewalled. Opacity works. Don’t tamper with my right to horde money you can’t see.
PWYP Norway, while strongly supportive of the Extractive Industries Transparency Initiative and the original Publish What You Pay agenda which focussed on payments to government, goes further and urges full country-by-country reporting for oil and mining companies in every jurisdiction where they operate. This means reporting on an annual basis gross revenues, costs, profits, taxes paid, resources extracted, and remaining reserves.
Only with such reporting can citizens know what is happening to their birthright: What resources did we begin with? How much did we produce? What did we get for it? What’s left? Only with such reporting can investors know the value of their holdings.
Only with such reporting can governments know they are collecting their fair share of revenues and taxes. Country-by-country reporting, for extractive industries and eventually for all multinational corporations, is the essential step on the road toward a more transparent economic order. And transparency is a necessary step toward a more equitable world.
Financial opacity serves only the rich. The time has come to own up to the poor.
Raymond Baker
Director, Global Financial Integrity
Raymond Baker is director of Global Financial Integrity, a Washington-based think-tank leading international efforts to curtail illicit financial flows and enhance global development and security
12 PIPING PROFITS
PART 1: METHODOLOGY
PART 1: METHODOLOGYThis report’s aim is to:
1) locate precisely in which countries the subsidiaries of the world’s most powerful oil, gas and mining companies are found;
2) establish the number and proportion of Extractive Industry (EI) subsidiaries based in Secrecy Jurisdictions; and
3) test whether it is possible for journalists in Bolivia and Ecuador to ascertain key financial performance and tax information from strategically important subsidiaries of EI Companies (EICs) operating in their countries.
To do this, our first task was to select the 10 most powerful Extractive Industry Companies (EICs) which also reflect the diversity of the sector: oil, gas, mining and trading.
Selecting the Oil & Gas CompaniesThe world’s ten biggest oil companies, according to Petroleum Intelligence Weekly’s (PIW) 2010 ranking, included four state owned companies and six publicly quoted ones.
Of the five biggest oil and gas companies in the PIW 2010 league table, four are owned by the governments of Saudi Arabia, Iran, Venezuela and China. By nature their international reach is limited. And despite our best efforts, we could not establish the subsidiaries of these companies let alone where they are based. So, with regret we ruled them out of our study. We would, however, be very grateful for any help in tracing those state-owned EICs.
Among the remaining six firms included in the PIW Top Ten are ExxonMobil, BP, Royal Dutch Shell, ConocoPhillips, Chevron and Total.
The information we required to fulfill our task – establishing the jurisdiction where EICs’ subsidiaries are incorporated – is available in filings submitted by publicly quoted companies in some, but not all, countries.
It should be noted there is seemingly no requirement for French companies to reveal the jurisdiction where their subsidiaries are based. Despite repeated requests for Total to submit information, it steadfastly refused to do so. We will discuss this situation in greater detail later in this report.
So we targeted just five oil and gas companies: the above companies regrettably minus Total.
The Mining FirmsWe selected the world’s five biggest mining companies based on the PricewaterhouseCoopers’ document, Mine 2011: the Game has changed. Mine 2011 ranks the world’s 40 biggest mining companies based on market capitalisation in 2009 and 2010. Over this two year period, the top five mining firms were BHP Billiton, Vale, Rio Tinto, China Shenhua and Anglo American.
13PIPING PROFITS
PART 1: METHODOLOGY
We had difficulties accessing relevant subsidiary information for Vale, a Brazilian mining giant. In its US SEC filings, the information we required did not appear to be present.
China Shenhua’s activities are principally focused on coal and power production in China. Its subsidiaries are virtually all based in China according to its annual report. So we judged that while the company is a global giant, its strategic interest was not as significant, for instance, as Glencore International AG.
Glencore has operations in many countries, is a dominant player in a number of mining sectors, listed shares on the London Stock Exchange for the first time in May 2011 and now has a market capitalization of £33bn.
We also selected Barrick Gold Corporation, the world’s biggest gold company. It is the eighth biggest mining company in the world according to the PWC report over the last two years. But given the price of gold metal is breaking historic records, we believe, it is appropriate to assess Barrick.
The Norwegian Extractive Industry CompaniesWe also included in our target companies Norwegian Extractive Industry companies with significant production units overseas. The three we considered to be the most significant and active are: Statoil, DNO International and InterOil.
Finding the raw data for the subsidiaries The 13 companies selected are based or listed in the UK, the United States, Canada and Norway. As stated previously, accessing the information in France and Brazil proved difficult. In France, there is no obligation to publish the jurisdiction of French company subsidiaries. In Brazil, we could not establish whether this was the case or not.
In the UK, the public can establish the country of incorporation of company subsidiaries at Companies House – the official UK register of companies. All UK based companies have to file this information in their Annual Return (AR01) which includes all subsidiaries and their place of incorporation.
In the United States, companies are required to list their subsidiaries and their place of incorporation in Exhibit 21 of their annual report on Form 10-K. We searched for United States holding company 10-K filings on the Securities and Exchange Commission EDGAR system9 where the required information can be found fairly easily.
In Canada, we searched Barrick Gold Corporation using the System for Electronic Document Analysis and Retrieval (SEDAR). In Barrick’s Annual Information Form, we discovered a ‘subsidiary organogram’ which laid out Barrick’s full corporate structure including the information we were looking for – the jurisdiction of incorporation. We will feature this fascinating organogram in more detail later in this report.
In Norway, we found it hard to establish whether there exists a standard or official way of accessing the country of incorporation for subsidiaries belonging to Norwegian companies. It was unclear whether The Brønnøysund Register Centre, Norway’s principal company register, held the required information. We found the subsidiaries belonging to Statoil, DNO International and Interoil by going through their published Annual Reports and requesting the companies selected to confirm the country of incorporation. Some of the Norwegian companies volunteer this information in their Annual Reports.10
9 http://www.sec.gov/edgar/searchedgar/webusers.htm10 For a full analysis of Norwegian company information protocols, please see the Appendix of this report.
14 PIPING PROFITS
PART 1: METHODOLOGY
Gathering the DataUS and Canadian company filings are available in digital format and so were entered into the web-based database built for this project using a specially written script.
Unfortunately, UK Annual Returns tend to be scanned documents. Consequently, subsidiary data has to be manually entered which took several weeks of repetitive work.
Mapping the data: Defining Secrecy JurisdictionsOnce we entered the subsidiary data, our next task was to establish the proportion of subsidiaries based in Secrecy Jurisdictions and Tax Havens.
No consensus exists on the definition of a Secrecy Jurisdiction or Tax Haven, so we used three international definitions. This gives interested parties a choice on which to base their own conclusions.
The Definitions we used 1) A ‘List of Offshore Financial Centers’ published by both the International Monetary
Fund and the Financial Stability Forum (FSF) in 2000.11 This list has been widely referred to subsequently as a definition of tax havens or offshore financial centres (OFC). This list features 46 countries including Ireland which has grown significantly over the last 25 years to become a hugely significant OFC.
2) A list drawn up by the United States Internal Revenue Service (IRS) court filings that identified jurisdictions as ‘probable locations for US tax evasion.’ This list was referenced in the Stop Tax Haven Abuse Act 200912 introduced by Senators Levin, Whitehouse, McCaskill and Nelson. It does not include Ireland but includes most of the other jurisdictions listed by the IMF/FSF. An updated version of this Act was published in July 2011. It did not feature this list.
3) The Financial Secrecy Index (FSI) study in 2009 by the Tax Justice Network.13 This is our preferred definition, as it is the only benchmark that meticulously assesses the financial transparency of jurisdictions. The FSI merged two data sets:
i) a jurisdiction’s share of the global market for offshore financial services; and
ii) the degree of secrecy provided by its laws and regulations. Secrecy was assessed using 12 key questions around the ability to access key financial information.
Each country received an Opacity Score based on whether for instance accounts, trust ownership and beneficial ownership information is available for public inspection.
This study isolated the Opacity Score element of the FSI and included countries that scored more than 50%. The number of countries this covers equals 59 including the United States because of the corporate legal conditions found in Delaware.
The Delaware QuestionIn their SEC !lings, US companies include the State in which their American subsidiaries are located. This is a very important fact.
In the United States, the level of corporate disclosure between the 50 States varies considerably. The states widely judged to have the lowest levels of disclosure are Delaware, Nevada and Wyoming. These ‘secrecy states’ tend to be very popular states with corporations. More than 900,000 business entities choose Delaware as a location to incorporate.14 The number of businesses exceeds Delaware’s human population of 855,000.
UK companies’ filings do not disclose which US State their subsidiaries are located in. But it is possible to establish UK companies’ Delaware connection by checking the name of any subsidiary against a Corporate Register of Companies run by the State of Delaware on its website.15
The subsidiaries based in Delaware belonging to companies in the UK and other countries were included in the Opacity Index. This is because Delaware, according to the 2009 FSI:
1) does not put details of trusts on public record;
2) does not comply sufficiently with international regulatory requirements;
3) does not require that company accounts be available on public record;
4) does not require that beneficial ownership of companies is recorded on public record;
5) does not maintain company ownership details in official records;
6) does not exchange tax information pursuant to the European Union Savings Tax Directive;
7) does not have adequate access to banking information;
8) allows protected cell companies;
9) allows company redomiciliation; and
10) provides banking secrecy
There are similar concerns with respect to Nevada and Wyoming. This is why subsidiaries of United States companies incorporated in these states were also included in our High Opacity metric. As stated before, UK EICs do not disclose which individual US state they incorporate in. We have not yet established for ourselves whether UK EIC subsidiaries are incorporated in Nevada and Wyoming.
The absence of this data means the overall 34.5% Opacity Score we have for EICs could be slightly higher.
The BP issueWe found BP the hardest company in our sample study to assess. BP’s 2010 Annual Return contains a 68-page ownership grid which lists 2,870 separate subsidiaries divided into 14 ‘tiers’. But there are a huge amount of repeated company entries among those 2,870 entities.
Weeding out all the obvious repetitions, we arrived at 1,596 BP subsidiaries. BP has told us it controls 1,491 subsidiaries as of September 2011. But it disappointingly would not supply us with any documents listing its subsidiaries beyond what is in the public domain.
PART 2: THE EXTRACTION INDUSTRY PARTICIPATION PROFILE
PART 2: THE EXTRACTIVE INDUSTRY PARTICIPATION PROFILE The EICs surveyed in our investigation are profiled here.
Oil and Gas 1617181920212223
16 Exxon 2010 annual report http://phx.corporate-ir.net/External.File?item=UGFyZW50SUQ9ODk0MzZ8Q2hpbGRJRD0tMXxUeXBlPTM=&t=1 17 E&P stands for Exploration & Production.18 http://www.annualreportandform20f.shell.com/2010/servicepages/downloads/files/all_shell_20f_10.pdf19 http://www.bp.com/assets/bp_internet/globalbp/globalbp_uk_english/set_branch/STAGING/common_assets/downloads/pdf/BP_Annual_Report_and_Form_20F.pdf We used BP’s 2008 figures as
last year was distorted by the Gulf of Mexico spillage disaster which saw BP record a loss. 2009 was a bad year for ALL the oil majors as the oil price dropped sharply after the 2008 spike. We consider 2008 and 2010 roughly comparable.
20 As explained, BP lists 2,870 separate entities in its Annual Return. The company states it has 1,491. Using just the company’s Annual Return, we have identified 1,596 separate entities.21 http://www.chevron.com/annualreport/2010/documents/pdf/Chevron2010AnnualReport.pdf22 estimate23 http://www.conocophillips.com/EN/about/company_reports/annual_report/Documents/2010_SummaryAnnualReport.pdf
Key Facts: Exxon’s current portfolio of more than 130 major development projects could deliver more than 26 billion net oil- equivalent barrels during its lifetime. Its revenues in 2011 are predicted to increase to over $470 billion.
Key Fact: ‘ConocoPhillips has exploration activities in 17 countries and produced hydrocarbons in 14 countries, with proven reserves in 16 countries. Producing areas included the United States, Norway, the United Kingdom, Canada, Australia, offshore Timor-Leste in the Timor Sea, Indonesia, China, Vietnam, Libya, Nigeria, Algeria, Russia and Qatar.’
Key Fact: ‘Chevron is the largest private producer of oil in Kazakhstan, the top oil and natural gas producer in Thailand, the largest oil producer in Indonesia and the top leaseholder in the US Gulf of Mexico. It has major operations in Nigeria, Angola, Chad, the Democratic Republic of Congo and Venezuela.’
Key Fact: BP has proven reserves of 18 billion barrels of oil equivalent.
Revenues: $383.2 billionTotal Costs: $330.2 billionTotal Tax on Income: $21.5 billionNet Profit: $30.4 billionE&P17 Country Total: 38Subsidiaries: 170High Opacity: 52%
Revenues: $198.6 billionTotal Costs: $178.9 billionProvision for Income Tax: $8.33 billionNet Profit: $11.3 billionE&P Country Total: 31Subsidiaries: 536High Opacity: 57%
Revenues: $204.9 billionTotal Costs: $172.9 billionTotal Tax on Income: $12.9 billionNet Profit: $19 billionE&P Country Total: 2422
Subsidiaries: 77High Opacity: 62%
Revenues: $367 billionTotal Costs: $331.8 billionTotal Tax on Income: $12.6 billionNet Profit: $21.6 billionE&P Country Total: 29Subsidiaries: 1,49120
High Opacity: 35%
ExxonMobil16
ConocoPhillips23
Chevron21BP19
Key Fact: In 2010, Royal Dutch Shell reduced costs by $2bn. The company made nine notable discoveries in 2010 that in total exceeded production volume. New projects will emerge in the Gulf of Mexico, Australia, Iraq and China.
Revenues: $378.1 billionTotal Costs: $342.8 billionTotal Tax on Income: $35.3 billionNet Profit: $20.4 billionE&P Country Total: 25Subsidiaries: 1,273High Opacity: 41%
PART 2: THE EXTRACTION INDUSTRY PARTICIPATION PROFILE
Key Facts: Glencore’s 2010 financial statement confirms that its effective tax rate for the firm’s $234m tax bill, ‘excluding share of income from associates which is recorded post tax, was 9.3% compared to 12.6% for 2009’. The firm controls 60% of the world’s zinc, half the world’s copper, 38% of aluminium and 9% of the global grain market.
Key Facts: BHP is the world’s largest diversified mining company producing oil, coal, iron ore, copper, aluminium uranium and diamonds. In July 2011, it eclipsed previous record production levels in four commodities.
Key Facts: Canadian-based Barrick Gold Corporation’s gold production increased to 7.8 million ounces at total cash costs of $457 per ounce. The Company says it consistently replaced its reserves in each of the last five years. Gold reserves now stand at about 140 million ounces, the largest in the industry. In addition, measured and indicated gold resources grew 24% to 76 million ounces. ‘Inferred’ gold resources increased by 18% to 37 million ounces. Barrick also owns 6.5 billion pounds of copper reserves, 13 billion pounds of measured and indicated copper resources and 9.1 billion pounds of inferred copper resources.
Key Fact: Rio Tino’s aluminium division’s revenues at $773m grew by more than 26% in 2010. Copper, which accounts for 17% of group revenues, grew by $1.5bn to $7.7bn. Iron ore is Rio’s major cash generator accounting for 68% of revenue. Rio is expanding iron ore facilities in Pilbara, Australia; Simandu, Guinea and Orissa, India.
Key Facts: Anglo controls the world’s largest platinum reserves and is the largest primary producer of platinum, with 40% of world supply. Anglo owns 45% of De Beers which controls 35% of the world’s rough diamond and whose principal entities are based in Luxembourg, one of Europe’s most opaque jurisdictions. Iron ore and copper are among the firm’s major earners.
Key Facts: Statoil’s"biggest activities are located in Norway but its future success will be determined in countries like Angola which currently accounts for 37% of its international oil and gas output. It is the world’s 13th biggest oil and gas firm. The Norwegian government owns 67% of its shares.
Key Facts: DNO is based in Oslo, Norway. Most of its oil currently produced comes from the Kurdistan region of Iraq. It is also active in Yemen, UK, Equatorial Guinea and Mozambique. DNO International’s finance costs are put at NOK 407.7m, triggering a loss.
Key Facts: InterOil is just six years old but has significant oil and natural gas assets in Colombia, Peru and Ghana. InterOil’s finance costs are put at $66.8 million triggering a loss.
Revenues: $95.23 billionCosts: $70.6 billionIncome before tax $24.6 billionTaxation: $17.84 billionNet Income: $6.77 billionE&P Country Total: 16Subsidiaries: 35High Opacity: 11%
PART 3: INSIDE THE SECRET MONEY MAZEThe DataThis investigation discovered that the ten global EICs featured in this report between them own a total of 6,038 subsidiary companies across the world.
It should be recognised that the list of subsidiaries supplied by EICs in public filings are only the ones they deem to be materially important. It is likely EICs own even more subsidiaries than they disclose.
But of these 6,038 subsidiaries, 2,083 or 34.5% are incorporated in jurisdictions with high levels of corporate secrecy as defined by the Financial Secrecy Index.
Using the combined IMF and FSF definition, the top global EICs own a total of 681 subsidiaries or 11% in ultra-low tax havens. Using the US Internal Revenue Service definition yields 576 subsidiaries or 10%.
Table 1: The Global Extractive Industry and its reliance on Secrecy Jurisdictions33
33 Secret states figures also include five incorporated in Nevada and one in Wyoming
Company Total subsidiaries FSI listed % IMF listed % IRS listed %
The Extractive Industry’s Favourite LocationsOverwhelmingly, the global extractive industry’s favoured location to incorporate is the United States. And 78.9% of the 1,154 US subsidiaries belonging to some of the world’s most powerful EIs are located in Delaware. Delaware has more business entities choosing the so-called First State as their home than humans – 900,000 companies to 855,000 people.
Table 2: The Top 25 Jurisdictions where Extractive Industry Subsidiaries are Incorporated
Delaware is increasingly recognised as the headquarters of international corporate secrecy. In 2009, The Observer reported:
Delaware – the political power-base of the US vice-president, Joe Biden – offers high levels of banking secrecy and does not make details of trusts, company accounts and beneficial ownership a matter of public record. Delaware also allows companies to re-domicile within its borders with minimal disclosure, and allows the existence of privacy-enhancing ‘protected cell’ or ‘segregated portfolio’ companies, among many other stratagems useful for protecting the identity of those who do business there.
The only financial privacy indicator on which Delaware scores positively is that it is party to a large number of international tax information sharing agreements, but this is because those agreements are signed by the United States.
Delaware state o$cials say it is not the ability to protect identities that attracts so many companies and individuals to register businesses; rather, it is the state’s sophisticated judicial system, which has evolved, they say, into the top corporate dispute resolution centre in America.
1,154921
611358
284263
248198
12784
7567
59545453515149484441403737
United States United Kingdom
Australia NetherlandsSouth Africa
GermanyCanada France
Bermuda ChinaBrazil
British Virgin Islands Singapore
BahamasMalaysia
ZimbabweSwitzerland
New Zealand Cayman Islands
Luxembourg Chile
Spain Hong Kong
IrelandNigeria
21PIPING PROFITS
PART 3: INSIDE THE SECRET MONEY MAZE
But lawyer Jack Blum, a former US Senate sta# attorney who has worked on high-pro!le fraud cases, including the BCCI investigation, says: ‘Secrecy in Delaware has been a massive problem and has been for sometime. They have a lot of rules that… make it so advantageous to be there that it is breathtaking.’ And, he adds, requests for legal assistance from other countries fall on deaf ears. ‘The requests pile up in district courts. It’s beyond embarrassing. It’s a disgrace.’
Table 3: Extractive Industry’s United States and Delaware subsidiaries:(Delaware EI subsidiaries as a proportion of its US subsidiaries)
Company Total USA Del. Del %
Anglo American 837 9 7 77.78
Barrick Gold Corporation 115 25 9 36.00
BHP 462 63 51 80.95
BP 1596 450 354 78.67
Chevron 77 33 23 69.70
Conoco Phillips Holdings Co. 427 157 136 86.62
Conoco Phillips Petroleum Ref. 109 37 32 86.49
DNO International 5 0 0 0.00
Exxon 170 50 44 88.00
Glencore International AG 46 4 4 100.00
Interoil 15 0 0 0.00
Rio Tinto plc 926 145 95 65.52
Shell (Corporate) 128 12 11 91.67
Shell (Downstream) 694 79 69 87.34
Shell (Projects & Technology) 52 13 10 76.92
Shell (Trading) 39 11 11 100.00
Shell (Upstream Americas) 89 60 54 90.00
Shell (Upstream International) 271 5 5 100.00
Statoil 35 1 1 100.00
22 PIPING PROFITS
PART 3: INSIDE THE SECRET MONEY MAZE
The Netherlands connectionDelaware is, by a margin of almost three times, the EI sectors’ favourite place to incorporate compared with other Secrecy Jurisdictions, using the Opacity Score component within the Tax Justice Network’s 2009 FSI.
In second place, by a similar wide margin, is the Netherlands. The Netherlands is not normally bracketed with palm-fringed island paradises or snow-coated Alpine micro-states when corporate financial secrecy is discussed.
Table 4: The Extractive Industries Subsidiaries Favourite Secrecy Jurisdictions
DelawareNetherlands
BermudaBritish Virgin Islands
SingaporeBahamasMalaysia
SwitzerlandCayman Islands
LuxembourgHong Kong
IrelandBelgium
AustriaPhilippines
BarbadosJersey
United Arab EmiratesLiberia
PanamaMauritius
Isle of ManGuernsey
CyprusNevada
HungaryBrunei Darussalam
UruguayBahrain
Saint LuciaNetherlands Antilles
MaltaCook Islands
Gibraltar (UK)Saint Kitts and Nevis
WyomingMarshall Islands
Antigua and BarbudaLebanon
Costa RicaAnguilla
915358
12767
595454514948
403735
2523
19181513101086655432222221111111
23PIPING PROFITS
PART 3: INSIDE THE SECRET MONEY MAZE
But the Netherlands, the country where the world’s first multinational was formed – The Dutch East India Company – offers advantages for companies that want or need to place a veil of mystery over their affairs.
The Netherlands:
1) does not put"details of trusts on public record;"
2) does not comply sufficiently with"international regulatory requirements;"
3) does not require that"company accounts be available on public record;34
4) does not require that"beneficial ownership of companies is recorded on public record;
5) does not maintain"company ownership details in official records; and
6) does not provide adequate access to banking information.
The Netherlands is also the largest host of conduit companies worldwide and is an important jurisdiction for corporate internal debt shifting. Studies have revealed how the use of Dutch financing affiliates affects the capital structure of European multinationals.
As Francis Weyzig, in his comprehensive 2007 paper The Central Role of Dutch Financing Companies in Tax Avoidance strategies, wrote:
It turns out that many conduit constructions involve affiliates in the Netherlands. These affiliates are officially registered by the Dutch Central Bank (DNB) as Special Financial Institutions (SFIs). According to the DNB definition, SFIs are foreign owned and are used at least partly for fiscal reasons. The SFI register is not public. The volume of investments using SFI structures is enormous: 13% of all inward FDI stocks worldwide is held via some 10,000 Dutch SFIs (Weyzig & Van Dijk 2007). This makes the Netherlands the largest conduit country worldwide.
Among the 358 Netherlands subsidiaries belonging to the world’s most powerful Extractive Industry companies are subsidiaries whose names suggest their physical assets are held in a country which is not the Netherlands.
ConocoPhillipsConoco Pakistan Exploration & Production B.V.Conoco Taiwan Exploration & Production B.V.Conoco Trinidad (4a) B.V.Conoco Trinidad (4b) B.V.Conoco Venezuela B.V.
BPBP Pipelines Vietnam B.V.BP Trinidad Exploration B.V.Korea Energy Investment Holdings B.V.Amoco Chemical Malaysia Holding I B.V.Baku-Tbilisi-Ceyhan Pipeline Holding B.V.Amoco Chemical Malaysia Holding B.V.Amoco Chemical Malaysia Holding B.V.
34 Although the annual accounts of most Dutch companies are available online, there is an important exception to this rule. In the second book of the Dutch Civil Code, disclosure requirements are specified in part 10 and onwards, from article 394 onwards. Generally, the amount of detail of the financial information depends on the size of the company. The exception clause is in article 403 which says roughly that a company does not need to publish its accounts if: a) the financial figures of the legal entity are consolidated into the accounts of another legal entity (the ultimate parent or some intermediate holding) to which the EU require-ments regarding financial reporting apply (that is, the consolidating company is located in the EU); b) those consolidated accounts are published in or translated into Dutch, English, French or German; c) the consolidating entity has declared full liability for any debts of the Dutch legal entity; d) the declaration of liability and the accounts of the consolidating entity or a reference to those accounts have been deposited with the chamber of commerce where the Dutch legal entity is registered (Art. 403, second book Dutch Civil Code). In practice this allows multinational companies to hide accounts of Dutch subsidiaries from view. As regards online information, the address and type of business is freely available for most entities. Other information is available for a fee ranging from !0,50 to !2,90.
24 PIPING PROFITS
PART 3: INSIDE THE SECRET MONEY MAZE
BP Angola (Block 18) B.V.Amoco Trinidad Gas B.V.BP Exploration Turkiye B.V.Amoco Venezuela Energy Company B.V.BP Egypt East Tanka B.V.BP Egypt West Mediterranean (Block B)
Anglo AmericanAA Holdings Argentina B.V.Anglo American India Holdings B.V.Anglo American Russia Holdings 1 B.V.Kumba Holdings West Africa B.V.Kumba Investments Guinea B.V.
GlencoreGlencore Grain B.V.
Rio TintoMali Diamond Exploration B.V.
It is not possible under Netherlands companies law to examine key financial and tax information of subsidiaries which contains natural resources in developing and emerging economies. This is a significant barrier for those seeking transparency and accountability in this very important context.
It seems that the Netherlands provides excellent conditions for corporations keen to avoid too much scrutiny. Conversely, the Netherlands is problematic for citizens of resource rich nations who want nothing more than to check and assess how oil, gas or minerals have been used in any given year, how much revenue and pro!t has been generated from that activity and what are the taxes and royalties their country receives.
25PIPING PROFITS
PART 3: INSIDE THE SECRET MONEY MAZE
Country Subsidiaries
Argentina 1
Australia 3
Bahamas 5
Bermuda 16
Brazil 1
Canada 4
France 1
Indonesia 1
Liberia 1
New Zealand 1
Nigeria 5
Philippines 1
Singapore 1
United Kingdom 3
United States 33
Total 77
EXTRACTIVE INDUSTRY COMPANY BREAKDOWNS
Chevron, the world’s eighth largest oil and gas firm with revenues of $204.9 billion, is the most opaque EIC according to our findings with proportionately more subsidiaries in Secrecy Jurisdictions than any other firm.
Table 5: Chevron, the Extractive Industry giant that has more subsidiaries in Secrecy Jurisdictions than any other in this study
1) Of Chevron’s 77 subsidiaries, 62% are in Secrecy Jurisdictions.
2) Of Chevron’s 33 American subsidiaries, 23 of them are in Delaware – over two thirds of its US incorporated companies.
3) 21 out of Chevron’s 77 subsidiaries (27%) are in either Bermuda or the Bahamas.
Chevron, according to its annual report, ‘is the largest private producer of oil in Kazakhstan, the top oil and natural gas producer in Thailand, the largest oil producer in Indonesia and the top leaseholder in the US Gulf of Mexico. It has major operations in Nigeria, Angola, Chad, the Democratic Republic of Congo and Venezuela.’
Chevron’s role as a major actor in sub-Saharan Africa is a cause for concern in this context given its status as the most opaque major EIC in this study.
PIPING PROFITS26
Table 6: Barrick Gold Corporations’ pipe-like maze of subsidiaries
PART 3: INSIDE THE SECRET MONEY MAZE
27PIPING PROFITS
PART 3: INSIDE THE SECRET MONEY MAZE
Barrick Gold: follow the money if you canThis corporate organogram (Table 6) belongs to Barrick Gold Corporation (BGC) with BGC sitting at the top of a corporate money maze – a network akin to a pipe system pumping profits. Barrick last year made $3.29 billion net of tax. This graphic is found in BGC’s Annual Information Form filed in the Toronto Stock Exchange.
Some of Barrick’s corporate complexity may be explained by the fact that it only partially owns certain entities within this structure. Of its 24 gold mines, nine are part owned. Of those nine, only one sees Barrick with a share of less than 50% and that is for a relatively minor gold producing mine in Nevada, United States.
In 2010, Barrick sold shares in its African gold mining business principally focussed in Tanzania. It has a residual 73.9% holding in the new business, Africa Barrick Gold (ABG). ABG’s assets, cashflows and liabilities are consolidated into Barrick35. Barrick’s ownership of ABG appears from this diagram to be split.
Royalties payable to states are partially explained in Barrick’s Annual Information Form. Its stated adherence to Corporate Social Responsibility principles are admirable. But the firm’s complexity, combined with 27% of its subsidiaries incorporated in highly secretive jurisdictions, makes it hard to gauge its overall performance in the countries it operates. It seems the chain of ownership of its subsidiaries, and therefore the path those subsidiaries’ profits take to reach Barrick, are very often routed through not just one but a series of consecutive Secrecy Jurisdictions.
This diagram is a graphic illustration of why CBCR is necessary.
Other Key EI Major Company Findings 1) ConocoPhillips is the second most opaque oil and gas major after Chevron with 57% of
its 536 subsidiaries incorporated in Secrecy Jurisdictions.
2) Exxon is almost as opaque when it comes to the incorporation of its subsidiaries. Some 52% of its 170 reported subsidiaries are held in Secrecy Jurisdictions.
3) Chevron, Conoco and Exxon are the three US EI major companies surveyed in this report. Combined, more than half their 783 subsidiaries are incorporated in Secrecy Jurisdictions.
4) Royal Dutch Shell has a very high opacity score in five of its six divisions.
a) Its Upstream America division has 69% of its 89 subsidiaries incorporated in Secrecy Jurisdictions. 54 of them are based in Delaware..
b) Shell’s 39-subsidiary Trading division has an opacity score of 64% including three subsidiaries in the Isle of Man and 11 in Delaware,
c) Shell’s 128-subsidiary Corporate division has a 50% Opacity score. Shell’s overall average is reduced because of its 694-subsidiary Downstream division has a 32% Opacity score.
5) Glencore International AG is the most opaque mining company in our survey with 46% of its 46 subsidiaries incorporated in Secrecy Jurisdictions. This is relevant given that Glencore’s 2010 financial statement confirms that its effective tax rate for its $234m tax bill, ‘was 9.3% compared to 12.6% for 2009’ on revenues of $144.9 billion and profits of $4.1 billion. As stated earlier in this report, the Swiss-based firm controls 60% of the world’s zinc, half the world’s copper, 38% of aluminium and 9% of the global grain market.
Norway’s Exploration & Production CompaniesThe influence of Norway’s EI beyond its own shores is relatively small compared with the ten EI Major Companies but it is growing.
Encouragingly, compared with its major international competitors, Norway’s EICs in this sample operate statistically in fewer Secrecy Jurisdictions.
Statoil Only Statoil, the majority state owned oil and gas company, can call itself a global major. It is currently the world’s 13th biggest oil and gas firm.
Statoil’s financial power has been built on its North Sea assets. But as Statoil’s North Sea assets become depleted, its future will be increasingly built beyond its shores in countries such as Angola in particular as well as Brazil, Iran and Libya where the company has made significant investments.
Statoil’s Opacity Score of 11% is significantly lower than its peer group of EIC majors. But its reliance for revenues will increase from overseas jurisdictions. Many of the countries in which Statoil operates have, and continue to experience, severe corruption and governance challenges. This serves as a severe challenge to Statoil.
Of all the companies surveyed in this report, Statoil presents the fullest most transparent breakdown of its financial performance in its overseas businesses.
Its Fact Book contains details of investments, revenues, purchases of goods and services, direct and indirect taxes, profits, signature bonuses, employee numbers and payment made to them.
Statoil’s reporting in this respect is the best and most transparent found in this investigation. But its reporting is still insufficient as there are no figures to suggest how many reserves were used and written off in each jurisdiction it operates in. And its costs disclosures lack detail. Only a full CBCR standard would allow stakeholders to ascertain an accurate picture of Statoil’s performance in specific jurisdictions.
InterOilInterOil, with revenues of $104.7m, is just six years old but has signi!cant oil and natural gas assets in Colombia, Peru and Ghana. Of the Norwegian Exploration & Production companies surveyed here, it is by some way the most opaque with seven of its 15 subsidiaries incorporated in Secrecy Jurisdictions which remain true in whichever de!nition – IMF, IRS or FSI – is applied.
Table 7: Norway’s EIC and secrecy
Company Total subsidiaries High Opacity % IMF listed % IRS listed %
DNO International 5 0 0 0 0 0 0
Ineroil 15 7 47 7 47 7 47
Statoil 35 4 11 2 6 1 3
All companies 55 11 20 9 16 8 15
29PIPING PROFITS
Country Subsidiaries
Belgium 1
Denmark 1
Germany 1
Ireland 1
Norway 28
Switzerland 1
United Kingdom 1
United States 1
Total 35
PART 3: INSIDE THE SECRET MONEY MAZE
Table 8: Statoil’s subsidiary country breakdown
Table 9: InterOil’s subsidiary country breakdown
Total – the French EI refused to release details of where its subsidiaries are incorporated
This report wanted to assess the subsidiaries of French energy major, Total. It could not do so. This is because, unlike its contemporaries from Canada, the United Kingdom or the United States, there appears to be no statutory mechanism in France to compel Total to publish this information. Total refused to release incorporation location details despite every encouragement. It stated information ‘generally required by our stakeholders’ was to be found on the investor section of its website.
Total’s stance is regrettable. It would, for instance, be interesting to note or attempt to guess which of Total’s 685 subsidiaries owns its Burmese oil and gas assets, the revenues from which help keep the military junta afloat.
In an email, Total stated it ‘controls fewer than ten subsidiaries based in countries named on the list of non-cooperating States and territories as defined by French legislation. These entities are established in Brunei, Costa Rica, Liberia, the Philippines and Panama, where they are engaged in operational activities (such as oil and gas exploration and
Country Subsidiaries
Angola 1
British Virgin Islands 1
Colombia 1
Cyprus 4
Norway 4
Peru 2
Switzerland 2
Total 15
30 PIPING PROFITS
PART 4: BOLIVIAN AND ECUADORIAN JOURNALISTS’ ASK QUESTIONS
production in Brunei, specialty chemicals manufacture or motor fuels distribution in the Philippines, Costa Rica and Liberia).’
Total stresses that ‘these locations were not selected for the purpose of tax optimisation’. Total also owns subsidiaries in the Bahamas and Bermuda. It says these subsidiaries ‘were not established for fiscal reasons: they are often a historical legacy’. Total says it has already repatriated entities registered in Jersey and the British Virgin Islands to France, and is studying the feasibility of repatriation for other entities as well.
In further email exchanges, Total states that it strongly adheres to protocols that engender good governance such as the EITI. But the company is against the introduction of new CBCR standards as it believes new rules would not guarantee fair competition between ‘industry actors’ and risks not respecting states’ sovereignty.
PART 4: BOLIVIAN AND ECUADORIAN JOURNALISTS ASK QUESTIONSPWYP Norway organises the TRACE programme, a three module educational programme implemented over the course of one year. The TRACE programme is designed to spread technical knowledge and best practice, provide advocacy tools and create a space for sharing, strategising and networking for campaigners, union representatives and journalists aiming to improve EI transparency within their countries.
In 2010-2011, TRACE was organised for Latin-American participants, and among the countries taking part are Bolivia and Ecuador.
In May, a small group of journalists and campaigners from those two countries agreed to participate in a news gathering experiment. The idea was to identify key EICs operating in their countries. Individual EI mines and companies were then approached with 12 questions related to their !nancial and business performance speci!cally in Bolivia and Ecuador.
The work began in June and concluded four weeks later.
The companies selected in Bolivia were:
1) Minera San Cristóbal S.A, owned by the Japanese Sumitomo Corporation;36
2) Sinchi Wayra owned by Glencore;37
3) Repsol, the Spanish oil and gas major; and
4) Petrobras, the Brazilian energy giant.
The companies selected in Ecuador were:
1) Canada Grande, domiciled in the British Virgin Islands;
2) CNPC International, Chinese energy giant;
3) PetroOriental, Chinese firm jointly owned by CNPC and SINOPEC;
4) Andes Petroleum Ecuador, Chinese firm jointly owned by CNPC and SINOPEC. Domiciled in Bermuda;38
5) Repsol, the Spanish oil and gas major;
6) Petrobras, the Brazilian energy giant; and
7) Burlington Resources, owned by US energy major ConocoPhillips, registered in Bermuda.39
PART 4: BOLIVIAN AND ECUADORIAN JOURNALISTS’ ASK QUESTIONS
The questions the Trace journalists submitted to these companies were:
1) What were Extractive Industry (EI) Co revenue and profits in Country A last year?
2) How much is the cost of production?
3) What proportion of that is in wages?
4) What proportion of that is in administration?
5) How much tax was paid by EI Co in Country A?
6) What investment incentives does EI Co benefit from in Country A?
7) What is the nature of any tax agreement struck between EI Co and Country A?
8) What"volume"of reserves were there at"the beginning"of the year?
9) What"volume"of reserves was discovered or"abandoned during the year?
10) What volume of reserves was extracted during the year?
11) What volume of reserves were there at the close of the year?
12) What was the market value of reserves at the close of year?
After weeks of repeated communications on the telephone and via email, both the Bolivia and Ecuador teams received no information that adequately addressed their questions from any EI company.
The Ecuadorian team established the precise tax payments paid by their target companies through communications with their country’s National Petroleum Directorate and National Tax Office. This figure covers a profit tax, royalties and employee taxes. But without oil or gas production figures as well as an appreciation of costs, these figures, though useful, are insufficient to get a fair and true assessment of whether Ecuador is getting a good deal from its natural resources.
The Tax Figures collated by the Ecuador Team appear in the Appendix section of this report.
Marco Escalera, a Bolivian campaigner, summing up his experience in attempting to access financial and performance information, said:
‘I always heard it was very complex – and sometimes even dangerous – to obtain financial information about the activity of the Extractive Industries. Regardless of which actor is questioned: the extractive industry company or the state itself as actor/watchdog, they close ranks against the common enemy which seems in their eyes to be civil society oversight and questioning. The story is repeated over and over again: There is no access to timely and reliable information.
‘Access to information is vital and hugely important. Yet these companies do not seem to know or do not recognise the jurisdiction of the states where they operate if it affects their interests.
‘So we desperately need country-by-country reporting to achieve a solid understanding of these industries. We need to have an overview that allows us to understand and probe details concerning these activities. It is a very good idea to build information country by country. So we know the flow of capital resulting from the exploitation of non-renewable natural resources.
‘Bolivia does not make real efforts to enforce the transparency of the extractive industry’s activities. No citizen can have timely access to records. The state company (YPFB) in the last five years has not developed the necessary expertise to enable it to monitor and control the oil and gas activity. We do not know how much is produced. I personally think that civil society and the political system need to work together to devise a national policy on the exploitation of natural resources so as to benefit to the greatest extent the majority of Bolivians.’
32 PIPING PROFITS
PART 5: CONCLUSIONS
PART 5: CONCLUSIONS
EIC subsidiaries perform a variety of functions. They:
1) directly own oil, gas and mining assets;
2) allow joint venture partnerships with other entities to function;
3) perform necessary administrative and corporate operations such as provide pension services to employees; and
4) enable tax minimisation strategies to flourish.
Subsidiaries offer another vital function. They can provide a conduit to:
a) hide cash and profits from tax authorities in either or both the resource-rich and headquarter countries; and/or
b) make illicit payments to politicians and officials. There is no evidence that any of the subsidiaries in this investigation act in this way.
Some EICs have recently started to publish how much tax they pay in countries where they operate major concessions.
BHP Billiton, for instance, publishes a specific breakdown of the $7.1 billion in taxes it pays in 12 countries including Australia, Chile, South Africa and Algeria as part of its commitment to the Extractive Industries Transparency Initiative (EITI).
This information is useful for holding governments to account but is insufficient to gain a true and accurate picture of the operations of the profit generating elements within an EIC.
This is because no one outside senior executives within EICs – and perhaps the politicians and officials where resources are extracted – can be certain:
1) how much oil, gas or minerals a particular subsidiary owns;
2) how much oil, gas or minerals it has produced in any given year;
3) how much revenue and profits it makes;
4) how much tax and royalties it pays; or
5) what investment and other incentives it enjoys.
Until now it has never been established how many subsidiaries the world’s biggest EICs own and where they are based. It has also never been fully appreciated how many EIC subsidiaries are located in jurisdictions where it is hard, if not impossible, to gauge a financial understanding of these conduits – so-called Secrecy Jurisdictions.
It is important to understand the entire operational picture of an EIC in order to determine whether it is acting in line with socially accepted corporate accountability norms or standards that the EIC has pledged to meet.
33PIPING PROFITS
PART 5: CONCLUSIONS
But the concept of corporate accountability fails to do justice to what is at stake here. In our financial and regulatory world, there is absolutely no requirement for EICs in the resource-rich countries they operate to publish, in a publicly available format, precisely and on an annual basis essential information such as their:
1) total reserves;
2) the amount of resources extracted;
3) the revenues they have made in that country;
4) the costs they incurred;
5) the operating profits they gained;
6) the taxes they paid; and
7) the incentives they benefit from or are offered
This leaves citizens blind to the economic opportunities that have on many occasions been denied them through the signing of oil, gas or mining concessions that are not necessarily in the public interest.
Furthermore, without the publication of this key information, societies in resource-rich nations have no evidence base to redress potential corruption issues. In this context, the incorporation of one third of all EICs’ subsidiaries in Secrecy Jurisdictions assumes significance and engenders major cause for concern.
34 PIPING PROFITS
PART 6: RECOMMENDATIONS
PART 6: RECOMMENDATIONSBased on the findings of the Piping Profits report, Publish What You Pay Norway recommends:
1) The adoption of a full Country-by-Country Reporting International Accounting Standard. (see Defining Elements40)
2) All accounts of companies and details of beneficial ownership to be made publicly available in every country a company operates, even if that company’s accounts are consolidated into another entity.
3) All Extractive Industry Companies to state the location of incorporation of their subsidiaries in their public filings and those filings to be available clearly and in an electronic format.
4) EI major companies to improve the level of engagement with stakeholders – especially those seeking to promote transparency – in countries where they extract natural resources; to become agents of progress rather than, on occasions, tools of secrecy and obfuscation.
PART 7: THE TRACE DATABASE % A NEW GLOBAL INFORMATION RESOURCE
PART 7: THE TRACE DATABASE " A NEW GLOBAL INFORMATION RESOURCE Compiling and checking 6,038 subsidiaries owned by 13 EICs (ten of which are global giants) required a database to record details of:
The Parent Company The Subsidiary Name The location in which the subsidiary is incorporated The individual state in which a United States subsidiary is located The percentage of the subsidiary owned by the parent company
This has all been recorded in the TRACE Database for 13 companies.
The database is now available as a public resource for campaigners, academics, journalists, politicians and interested members of the public anywhere in the world. We hope you find the TRACE Database useful. We are keen to hear what you think about it and how it could be improved.
You can find the TRACE database on Publish What You Pay Norway’s website at http://www.publishwhatyoupay.no/
Each Subsidiary on the TRACE Database has its own separate Entry. Within the Subsidiary Entry, there are additional Data Entry Fields. Among the items are
Employee Numbers Turnover Costs Profits Tax Paid And a Notes Field which can be used to record how many reserves were used and
written off in a given year or details about any joint venture partners
Unfortunately, these additional Data Entry Fields are blank for one major, fundamental reason.
Information on turnover, costs, profits and reserves on an individual subsidiary basis – or on a country basis – has not been put in the public domain by the EI sector. Until this changes, the public in mineral-rich countries will be in the dark about the deals struck for these minerals in their name.
The overriding objective of the TRACE Database is to see as much of its Data Entry Fields filled. This, we hope, will be possible in the not-too-distant future.
For that to happen, we require the help of all interested parties to place pressure on all relevant actors to make Country-by-Country Reporting a reality.
36 PIPING PROFITS
APPENDIX
APPENDIXOIL COMPANIES AND THEIR CONTRACTS WITH THE ECUADORIAN STATE: TAXES PAID, PROVEN RESERVES AND COMMERCIAL AGREEMENTS
Currently, Ecuador has 36 oil contracts, the majority under a unified exploitation and participation modality. Our team of Ecuadorian journalists and researchers cannot establish the volumes of proven reserves of each contracted company because Ecuador does not have concession contracts. The main companies operating in Ecuador are:
CANADA GRANDE LIMITEDCreated in 1998, domiciled in the Virgin Islands, with an initial capital of $102,000.
Company Oil Block Contract type
CANADA GRANDE 1 Modifiable Share
CNPC INTENATIONAL (AMAZON) LTD. 11 Share
PETROORIENTAL S.A. 14 Modified Share
REPSOL YPF 16 Modifiable Share
PETROORIENTAL S.A. 17 Modified Share
PETROBRAS ENERGIA ECUADOR ECUADORTLC 18 Share
BURLINGTON RESOURCES 24 Share
ANDES PETROLEUM ECUADOR LTD. Tarapoa Modifiable Share
ANDES PETROLEUM ECUADOR 18 B-Fanny Unified Exploitation Agreement
ANDES PETROLEUM ECUADOR Mariann 4-A Unified Exploitation Agreement
PETROBRAS ENERGIA ECUADOR ECUADORTLC Palo Azul Unified Exploitation Agreement
Source: Dirección Nacional de Hidrocarburos (National Petroleum Directorate).
Fiscal Year Income tax paid
2010 $0.00
2009 $0.00
2008 $0.00
2007 $0.00
2006 $31 240.39
2005 $8 565.51
2004 $24 638.37
2003 $6 652.99
2002 $4 732.30
2001 $4 286.97
Source: Servicio de Rentas Internas (SRI); National Tax Office.
37PIPING PROFITS
CNPC, represented by two companies in Ecuador
This Chinese company tends to avoid all requests for information and questions about production systems, costs and profits. Communication and public relationship officers often respond by stating that they need to ask ‘Beijing’ first.
The first company name that appeared in Ecuador was CNPC CHUANQING DRILLING ENGINEERING COMPANY LIMITED, which was incorporated in 2001, with Chinese nationality, and an initial capital of $2,000.
Its second ‘denomination’ was CNPC INTERNATIONAL (AMAZON) LTD., incorporated in 2003, domiciled in British Virgin Islands, with an initial capital of $2,000.
APPENDIX
Source: Servicio de Rentas Internas (SRI); National Tax Office.
Source: Servicio de Rentas Internas (SRI); National Tax Office.
Fiscal Year Income tax paid
2010 $644 278.90
2009 $721 568.95
2008 $228 345.19
2007 $290 024.52
2006 $112 877.48
2005 $156 161.25
2004 $30 208.36
2003 $21 066.62
2002 $0.00
2001 $0.00
Fiscal Year Income tax paid
2010 $0.00
2009 $0.00
2008 $0.00
2007 $0.00
2006 $0.00
2005 $0.00
2004 $0.00
2003 $0.00
38 PIPING PROFITS
APPENDIX
PETROORIENTALFounded in 1987 as a French company despite being actually Chinese and part of the CNPC group. Its initial capital was $2,000. Again, all information requests are avoided. Its officers say they need to ask ‘Beijing headquarters’ before responding to us.
ANDES PETROLEUMCreated in 1986, domiciled in Bermuda, with an initial capital of $2,000. From 1996 through to 2001, this company had 12 representatives from different countries, but mostly from the United States. Since 2001, all four representatives were Chinese. As with previous Chinese companies, no answers are provided by company officers without authorisation from Beijing headquarters.
Fiscal Year Income tax paid
2010 $4 868 680.92
2009 $9 084 628.84
2008 $5 467 461.41
2007 $10 609 822.82
2006 $10 216 906.52
2005 $6 558 562.52
2004 $0.00
2003 $0.00
2002 $0.00
2001 $0.00
Fiscal Year Income tax paid
2010 $33 554 297.67
2009 $16 438 142.72
2008 $66 045 740.84
2007 $42 355 484.72
2006 $37 530 825.14
2005 $38 125 264.38
2004 $23 966 424.50
2003 $11 474 149.82
2002 $8 632 716.34
2001 $6 673 647.03
Source: Servicio de Rentas Internas (SRI); National Tax Office.
Source: Servicio de Rentas Internas (SRI); National Tax Office.
39PIPING PROFITS
APPENDIX
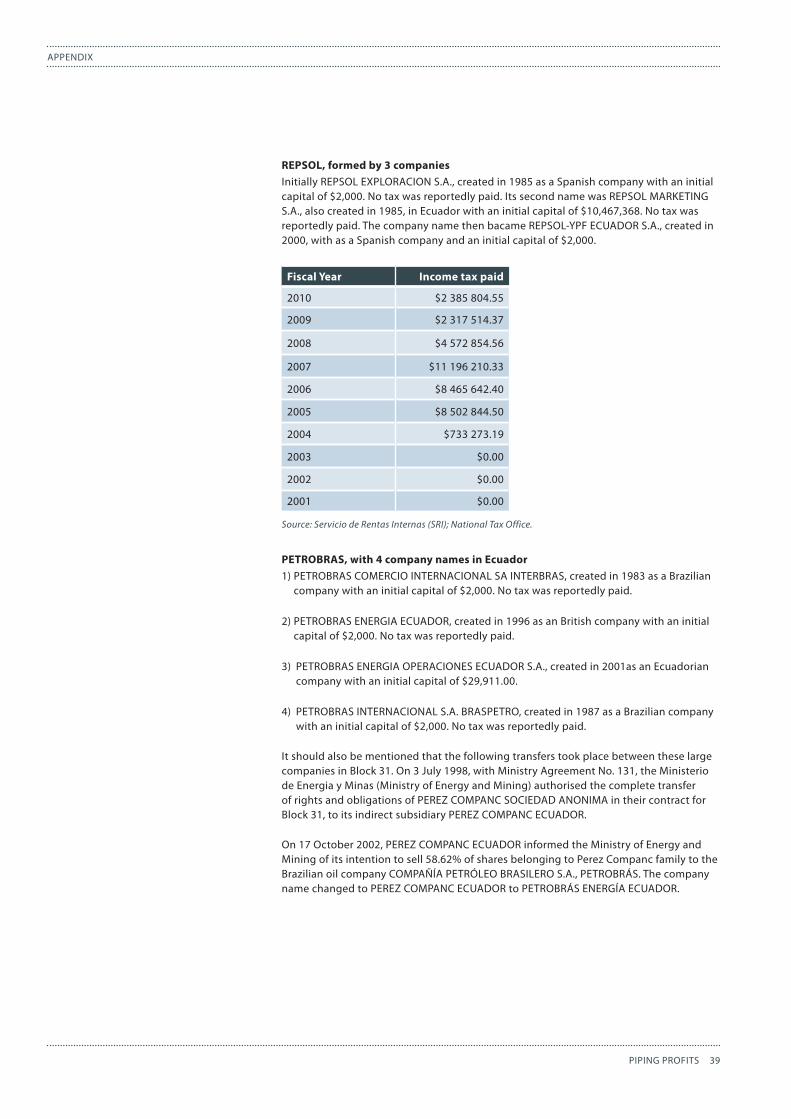
REPSOL, formed by 3 companiesInitially REPSOL EXPLORACION S.A., created in 1985 as a Spanish company with an initial capital of $2,000. No tax was reportedly paid. Its second name was REPSOL MARKETING S.A., also created in 1985, in Ecuador with an initial capital of $10,467,368. No tax was reportedly paid. The company name then bacame REPSOL-YPF ECUADOR S.A., created in 2000, with as a Spanish company and an initial capital of $2,000.
PETROBRAS, with 4 company names in Ecuador 1) PETROBRAS COMERCIO INTERNACIONAL SA INTERBRAS, created in 1983 as a Brazilian
company with an initial capital of $2,000. No tax was reportedly paid.
2) PETROBRAS ENERGIA ECUADOR, created in 1996 as an British company with an initial capital of $2,000. No tax was reportedly paid.
3) PETROBRAS ENERGIA OPERACIONES ECUADOR S.A., created in 2001as an Ecuadorian company with an initial capital of $29,911.00.
4) PETROBRAS INTERNACIONAL S.A. BRASPETRO, created in 1987 as a Brazilian company with an initial capital of $2,000. No tax was reportedly paid.
It should also be mentioned that the following transfers took place between these large companies in Block 31. On 3 July 1998, with Ministry Agreement No. 131, the Ministerio de Energia y Minas (Ministry of Energy and Mining) authorised the complete transfer of rights and obligations of PEREZ COMPANC SOCIEDAD ANONIMA in their contract for Block 31, to its indirect subsidiary PEREZ COMPANC ECUADOR.
On 17 October 2002, PEREZ COMPANC ECUADOR informed the Ministry of Energy and Mining of its intention to sell 58.62% of shares belonging to Perez Companc family to the Brazilian oil company COMPAÑÍA PETRÓLEO BRASILERO S.A., PETROBRÁS. The company name changed to PEREZ COMPANC ECUADOR to PETROBRÁS ENERGÍA ECUADOR.
Fiscal Year Income tax paid
2010 $2 385 804.55
2009 $2 317 514.37
2008 $4 572 854.56
2007 $11 196 210.33
2006 $8 465 642.40
2005 $8 502 844.50
2004 $733 273.19
2003 $0.00
2002 $0.00
2001 $0.00
Source: Servicio de Rentas Internas (SRI); National Tax Office.
40 PIPING PROFITS
APPENDIX
Similarly, on 10 August 2001, PETROBRAS INTERNACIONAL S.A. BRASPETRO, assigned 35% of its rights and obligations on Block 14, as stated in a participation contract, to the company VINTAGE OIL ECUADOR S.A. The result was a 75% participation of VINTAGE OIL ECUADOR S.A. Later on Vintage changed its name to EnCanEcuador.
BURLINGTON: 3 company names in Ecuador1) BURLINGTON RESOURCES ANDEAN LIMITED, created in 2002, registered in Bermuda,
with an initial capital of $2,000.
Fiscal Year Income tax paid
2010 $160 615.66
2009 $0.00
2008 $0.00
2007 $0.00
2006 $0.00
2005 $0.00
2004 $0.00
2003 $0.00
2002 $0.00
Source: Servicio de Rentas Internas (SRI); National Taxes Office.
Fiscal Year Income tax paid
2010 $26 241.95
2009 $15 631.41
2008 $40 572.87
2007 $19 561.06
2006 $0.00
2005 $125 619.25
2004 $120 634.79
2003 $123 513.87
2002 $109 673.01
2001 $23 892.47
Source: Servicio de Rentas Internas (SRI); National Tax Office.
41PIPING PROFITS
APPENDIX
Fiscal Year Income tax paid
2010 $ 176 739.82
2009 $0.00
2008 $0.00
2007 $0.00
2006 $0.00
2005 $0.00
2004 $0.00
2003 $0.00
2002 $0.00
2001 $0.00
Source: Servicio de Rentas Internas (SRI); National Tax Office.
2) BURLINGTON RESOURCES ECUADOR LIMITED, created in 1999, also Bermudan, with an initial capital of $4,000.
3) BURLINGTON RESOURCES ORIENTE LIMITED, also created in 1999 and also Bermudan, with an initial capital of $4,000. No tax was reportedly paid.
NORWEGIAN COMPANY INFORMATION TRANSPARENCY PROTOCOLSFor Norway, the primary public sources for information on companies and groups of companies are the Central Coordinating Register for Legal Entities41, the Register of Business Enterprises (‘Register of Business Enterprises’)42, the Register of Company Accounts43 the other registers kept at the Brønnøysund Register Centre44.
The Central Coordinating Register for Legal Entities coordinates information on entities registered in various legal registers. Groups should be registered in the Central Coordinating Register for Legal Entities45. Information on parent companies shall be registered there46.
Most Norwegian business enterprises are under a duty to register in the Register of Business Enterprises47. Foreign business enterprises operating a business in the country or on the Norwegian continental shelf must also be registered. The Register of Business Enterprises includes information on inter alia the company’s bylaws and information
41 Governed by the Central Coordinating Register for Legal Entities Act 03.06.1994 number 15 (‘Central Coordinating Register for Legal Entities Act’) unofficial English translation available on http://www.brreg.no/english/acts/enhetsregisterlov.html.
42 Governed by the Register of Business Enterprises Act, 21.06.1985 number 78 (‘Business Register Act’). An unofficial English ver-sion is available on http://www.brreg.no/english/acts/foretaksregisterlov.html
43 See the Act relating to Annual Accounts etc. 17.07.1998 number 56 section section 8-2 and Regulation regarding submission of annual accounts to the Register of Company Accounts and right to access to annual accounts, 16 December 1998 number 1234 section 1-3
44 http://www.brreg.no/english/ for information45 See section 4 of the Central Coordinating Register for Legal Entities Act and regulation 09.02.1995 number 114 chapter 246 See section 6, subsection 1 letter k of the Central Coordinating Register for Legal Entities Act47 For a full overview of business enterprises required and permitted to register, see Chapter II of the Business Register Act.
42 PIPING PROFITS
PIPING PROFITS
on the corporate management48. The Business Register Act section 8-1 stipulates that any person may have access to information in the business register and to receive a transcript of this information49.
The provisions in the Norwegian Freedom of Information Act50 apply to information that is not registered. This provision is frequently used by journalist and others when searching for information.
For the present purposes the Register of Company Accounts provides the most important information. Pursuant to the Act relating to Annual Accounts etc. 17.07.1998 number 56 (‘the Accounting Act’)51 section 3-1, enterprises with a statutory duty to prepare annual accounts52 shall prepare and submit annual accounts and directors’ reports in accordance with the Accounting Act for every financial year.
Section 3-2 establishes that for large companies53 the annual accounts shall contain an income statement, balance sheet, cash flow statement and notes. Pursuant to section 7-15 subsection 1, the notes to the annual accounts for large companies shall disclose, amongst other, the business name and business address of, and shareholding and voting rights in, subsidiaries, associates54 and joint ventures.
As for groups, the Accounting Act section 3-6 establishes that company groups55 as a main rule56 must provide consolidated accounts based on the individual company accounts of the consolidated enterprises. Section 3-2 establishes that for parent companies, the annual accounts consist of the company accounts and consolidated accounts. The consolidated accounts shall include the parent company and all its subsidiaries. Note that as a starting point small enterprises do not have to prepare consolidated accounts, however this does not apply if one of the companies in the group has shares, units, primary capital certificates or bonds listed on a stock exchange, authorised marketplace or similar regulated market in another country.
Section 7-15 on notes for large companies establishes in subsection 2 that an enterprise which is a subsidiary shall state the business name and registered office of the parent company that prepares consolidated accounts in which the enterprise is included. The address where consolidated accounts can be obtained must be stated.
48 For a full overview of registered information, see chapter III of the Business Register Act.49 This does not apply to national identity numbers.50 Act 19 May 2006 number 16. An unofficial English version is available on http://www.ub.uio.no/ujur/ulovdata/lov-20060519-016-
eng.pdf51 The Act is available in Norwegian on http://www.lovdata.no/all/hl-19980717-056.html52 See the Accounting Act s. 1-1 subsection 1 which stipulates that ‘The Act shall apply to enterprises with statutory obligation to
keep accounts as set out in section 1-2, subsection 1, nos. 1 to 12, domiciled in Norway, and enterprises with statutory obligation to keep accounts as set out in section 1-2 no. 13.’ (Unofficial translation) The list in section 1-2 subsection 1 includes inter alia Norwegian private and public limited companies and foreign enterprises which carry on or participate in activities in this country or on the Norwegian continental shelf, and which are taxable to Norway pursuant to Norwegian internal law.
53 See the definition in the Accounting Act section 1-5; section 3-2 exempts small enterprises from having to present a cash flow statement.
54 Section 1-4 of the Accounting Act defines associates as follows: ‘An associate is an enterprise in which the investor has significant influence but which is neither a subsidiary nor a joint venture of the investor, cf. section 5-17 subsection 1. Significant influence shall normally be deemed to exist if the investor holds sufficient shares or units to represent at least 20 per cent of the voting power in the enterprise.’
55 Section 1-3 stipulates ‘A parent company and its subsidiary or subsidiaries constitute a group. Enterprises obligated to keep accounts pursuant to section 1-2, subsection 1 but not comprised by number 12 or 14, is a parent company if the enterprise based on agreement or as holder of shares or units has a controlling interest in another enterprise. The enterprise shall be deemed to have controlling interest if: 1. holding such number of shares or units in another enterprise so as to represent the voting majority in the other enterprise, unless it can clearly be proven in special cases that such ownership does not after all provide any controlling interests; or 2. being entitled to appoint or remove a majority of the members of the board of directors in the other enterprise. Enterprise with such relation to a parent company as set out in subsection 2, shall be deemed a subsidiary. [..]’ (Unofficial translation)
56 Exemptions in sections 3-7 and 3-8.
43
PIPING PROFITS
PIPING PROFITS
Furthermore, pursuant to section 7-15 subsection 5, consolidated accounts shall state the name of any enterprise in which the enterprise that is obliged to keep accounts itself or through its subsidiaries owns so many shares or units that these represent the majority of the votes in the enterprise but which is not a subsidiary because it can clearly be proven that such ownership nevertheless does not provide a controlling influence, cf section 1-3, subsection 2, no. 1. The factors which prove that such ownership nevertheless does not provide a controlling influence shall be stated.
The Director’s report shall inter alia disclose the nature and location of the business, including information on any branch offices, and the directors’ report of enterprises that prepare consolidated accounts shall also cover the group’s operations, see section 3-3 and 3-3a.
The enterprise shall file a copy of the annual accounts, the directors’ report and the auditor’s report with the Register of Company Accounts, see section 8-2 of the Accounting Act. Section 8-1 of the Act stipulates that the annual accounts, the directors’ report and the auditor’s report are public documents and that anyone are entitled to study the documents at the office of the enterprise or at the Register of Company Accounts57.
Furthermore, it is possible to obtain information on ownership through access to the register of shareholders at the offices of the company in question. In Norway, every company that is organized a limited shareholding company, listed or private, is obliged to keep an updated and complete list of shareholders. The register of shareholders shall be accessible to anyone5658.
Another source of information is Oslo Stock Exchange5759 where it is possible to obtain information on the listed companies from their initial prospectus. Information on the initial prospectus may become outdated, but pursuant to the Securities Trading Act 29.06.2007 number 7560 section 5-2 cf. 3-2 it is possible to obtain updated information on the listed companies due to the requirement on listed companies to submit information that may influence the market.
We found out the subsidiaries belonging to Statoil, DNO International and Interoil by going through their published Annual Reports and requesting the companies selected to confirm the country of incorporation. Some of the Norwegian companies volunteer this information in their Annual Report. Others, like DNO, also responded to concrete questions in email.
57 Certain exceptions apply, see the Accounting Act section 8-1, second subsection58 See the Norwegian Limited Liability Companies Act 13.06.1997 number 44 section 4-5 and 4-6 and the Public Limited Liability
Companies Act 13.06.1997 number 45 section 4-4 and 4-559 Global market value of the Norwegian Stock Exchange: http://resources.revenuewatch.org/sites/default/files/RWI_global_list-
ings_06082011.pdf60 Copy in English is available on http://www.oslobors.no/ob_eng/Oslo-Boers/Regulations/Acts (Unofficial translation)
The Piping Profits Report
Researched and written by Nick Mathiason
The Bolivia Fact Finding Mission was led by Weimar Arandia and Marco A. R. Escalera Rivero
The Ecuador Fact Finding Mission was led by Marcelo Varela and Christian Zurita. Fernando Villavicencio researched and Juan Freile translated
Web Database Design by Jonny Chubb at London Timeware
Database Entry by Paul Browne, Emma Kelly, Caroline Mathiason and Evie Salomon
Art Production and Layout by Kate Fishpool
Front Cover Cartoon by Kal
Photographs by Gideon Mendel
Proof Reading by Ros Weaver
Many thanks to Patrick Benson, John Christensen, Jonny Chubb, Heather Lowe, Marcus Meinzer, Ros Weaver, Daniel Hennessey, David Hirst at 5RB, Øyvind Gallefoss, Anders Firing Lunde, Sunniva Lofthus Sandø, Alice Powell, Joseph Williams and in particular Richard Murphy.