Unilever Roadshow First Quarter Results 2004 Certain of the comments and materials in this presentation may contain forward-looking statements within the meaning of the Private Securities Litigation Reform Act of 1995. These statements are based upon current expectations and assumptions regarding anticipated developments and other factors affecting the Company. Actual results may differ materially from those included in these statements due to a variety of factors including, among others, those described in the company’s filings with the Securities and Exchange Commission and in the transcript of this presentation, which will be accessible via our website at www.unilever.com. Managing the levers of Value Creation 1995 1999 2003 Operating Margin % (beia) Total Operating Assets % sales Tax Rate (beia) % Free Cash Flow €bn ROIC % Cost of Capital down by 150 bps since 1995 Distribution to shareholders since 1995 is €17 billion A focused brand portfolio in markets with ‘momentum’ growth rate of around 4% - not yet delivering consistent performance Sustained high single digit EPS growth over first 70 years Through the 90s EPS growth 9% 2000-2003 low double digit EPS (beia) growth 8.7 38 34 1.4 9.2 15.8 20 29 3.9 12.5 11.1 29 32 2.8 16.7
Transcript
Unilever Roadshow
First Quarter Results 2004
Certain of the comments and materials in this presentation may contain forward-looking statements within the meaning of thePrivate Securities Litigation Reform Act of 1995. These statements are based upon current expectations and assumptionsregarding anticipated developments and other factors affecting the Company. Actual results may differ materially from thoseincluded in these statements due to a variety of factors including, among others, those described in the company’s filings with theSecurities and Exchange Commission and in the transcript of this presentation, which will be accessible via our website atwww.unilever.com.
Managing the levers of Value Creation
1995 1999 2003
Operating Margin % (beia)
Total Operating Assets % sales
Tax Rate (beia) %
Free Cash Flow €bn
ROIC %
Cost of Capital down by 150 bps since 1995
Distribution to shareholders since 1995 is €17 billion
A focused brand portfolio in markets with ‘momentum’ growthrate of around 4% - not yet delivering consistent performance
Sustained high single digit EPS growth over first 70 yearsThrough the 90s EPS growth 9%
Performance of Slim.Fast, Prestige and Frozen Foods 100 bps• Slimfast & Prestige progressive share loss during 2003
gave low exit rate thus H1’04 is a tough comparator• Frozen Foods - focus on faster growing segments
Tough business environment has continued with:
• Slower market growth : market growth 3% in aggregate
and around half this rate across
Western Europe and North America
• Aggressive price based competition in a few markets
One less trading day net of prior year destocking 50 bps
Reduced growth contribution from Hair & Skin Japan and Hair UScaused by competitive pressures - impact mass PC growth -250 bps
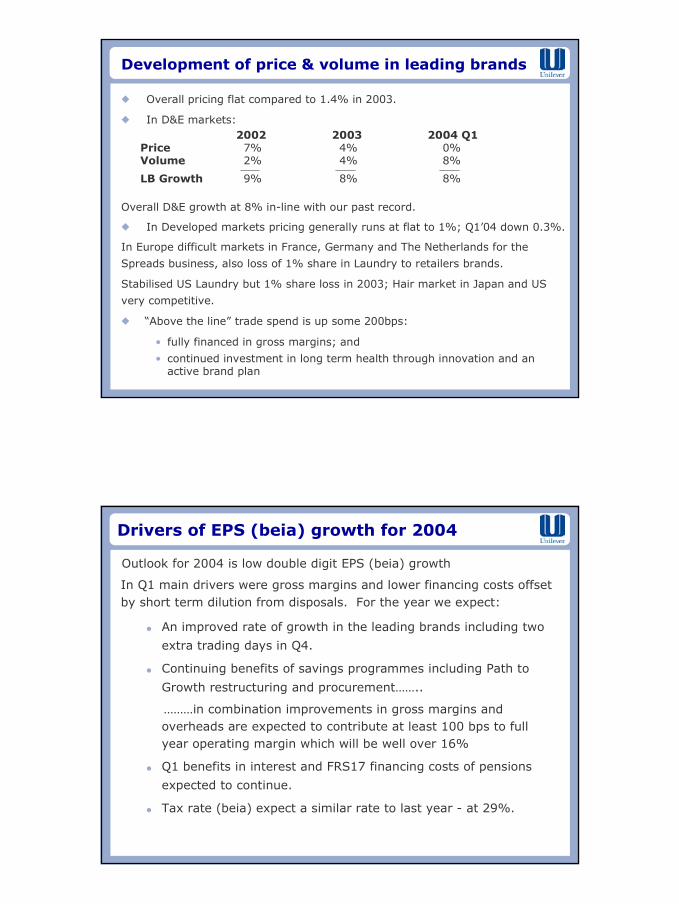
Development of price & volume in leading brands
� Overall pricing flat compared to 1.4% in 2003.
� In D&E markets:
� In Developed markets pricing generally runs at flat to 1%; Q1’04 down 0.3%.
In Europe difficult markets in France, Germany and The Netherlands for the
Spreads business, also loss of 1% share in Laundry to retailers brands.
Stabilised US Laundry but 1% share loss in 2003; Hair market in Japan and US
very competitive.
� “Above the line” trade spend is up some 200bps:
• fully financed in gross margins; and
• continued investment in long term health through innovation and anactive brand plan
Overall D&E growth at 8% in-line with our past record.
2002 2003 2004 Q1Price 7% 4% 0%Volume 2% 4% 8%
LB Growth 9% 8% 8%
Drivers of EPS (beia) growth for 2004
� An improved rate of growth in the leading brands including two
extra trading days in Q4.
� Continuing benefits of savings programmes including Path to
Growth restructuring and procurement……..
………in combination improvements in gross margins andoverheads are expected to contribute at least 100 bps to fullyear operating margin which will be well over 16%
� Q1 benefits in interest and FRS17 financing costs of pensions
expected to continue.
� Tax rate (beia) expect a similar rate to last year - at 29%.
In Q1 main drivers were gross margins and lower financing costs offsetby short term dilution from disposals. For the year we expect:
Outlook for 2004 is low double digit EPS (beia) growth
Drivers of long term Value Creation 2005-10
Priority is sustained top-third TSR
. . . . by pulling the right combination of value driversin any given situation
� generation of free cash flow (>€30bn ‘05-’10)
� development of our return on invested capital (�17% by 2010)
� managing our weighted average cost of capital (consistent with strong single A rating)
Leading in Developing & Emerging markets
� The world’s population will grow from6 billion (2000) to 6.8 billion (2010) and 7.5 billion (2020)
� 95+% of the population increase and 85%+ of the world’s population2000 to 2010 will be in the developing world
� Asia will be 55%+ of the world’s population by 2010
� D&E purchasing power will exceed the developed world 2006
Unilever:� Through 1990s we had average organic growth in D&E of 9% p.a.� Through the 1990s our presence in D&E increased from less than
20% to one third� 70+ years experience: strong local understanding & management� Leverage strong HPC distribution network for Food brands� Rising per capita income in D&E markets drives growth of our
products
Personal Care performance in Q1 2004
Getting behind Q1 top line performance:
• +11% leading brand growth in prior year giving tough comparator• Also impacted by 1 less trading day in this quarter• Currently seeing lower market growth rate in developed world.• Competitive markets particularly in US and Japan Hair with some share
loss - impact on growth of 250 bps.US Hair: Dove well established: 5% share in shampoo, with
continued activity in 2004.Suave - relaunched in April with sustained programme through 2004
Japan Hair: Intense activity from local competitors in innovationssensitive market. Need for clear differentiation with our own plansfocusing on innovation initially in Mod’s with Dove and Lux later
Growth drivers:• Innovation programme across leading brands and categories• Strong brands, leaders in their markets• D&E markets where Personal Care growth remained strong in Q1• Regaining momentum in US
NB All numbers for mass PC
Building our business
through brands
Development of Leading Brands : Personal Care
Leading brands growth %
Mass Personal Care 9.0 7.910.8
Prestige (7.2) (18.1)1.32.8
7.5
2000 2001 2002 2003
Total Personal Care 7.6 6.110.17.0
2.5
(14.8)
Q12004
1.5
Mass personal care reflects strong prior year and competitive markets in Hair.
Strong brand development programme across all categories:
Hair : Sunsilk and Dove range extensions; specific programmes for US &
Japan.
Skin : Dove range extensions in face and body; Ponds active in US and across
Asia; Lux extends reach in D&E.
Deo : strong programme across all brands through new variants, fragrances
and applicators. Specific products for lower disposable incomes.
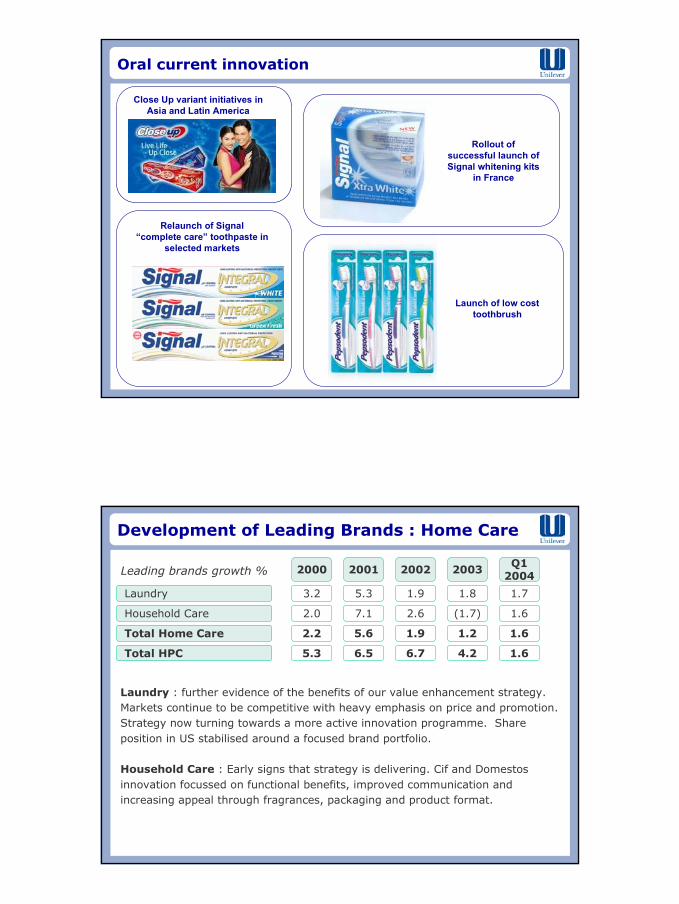
Oral : rollout of successful Signal Whitening Kits, launch of low cost toothbrushes
Prestige : new leadership team making progress with restructuring plan.
Hair current innovation
Dove range forColoured hair in
Europe
Suave in the US
Dove in the USincluding large sizesand foam conditioner
for fine hair
Mod’s shampoo andstyling products in
Japan
Extension of the Sunsilk rangein Europe and Latin America for
Close Up variant initiatives inAsia and Latin America
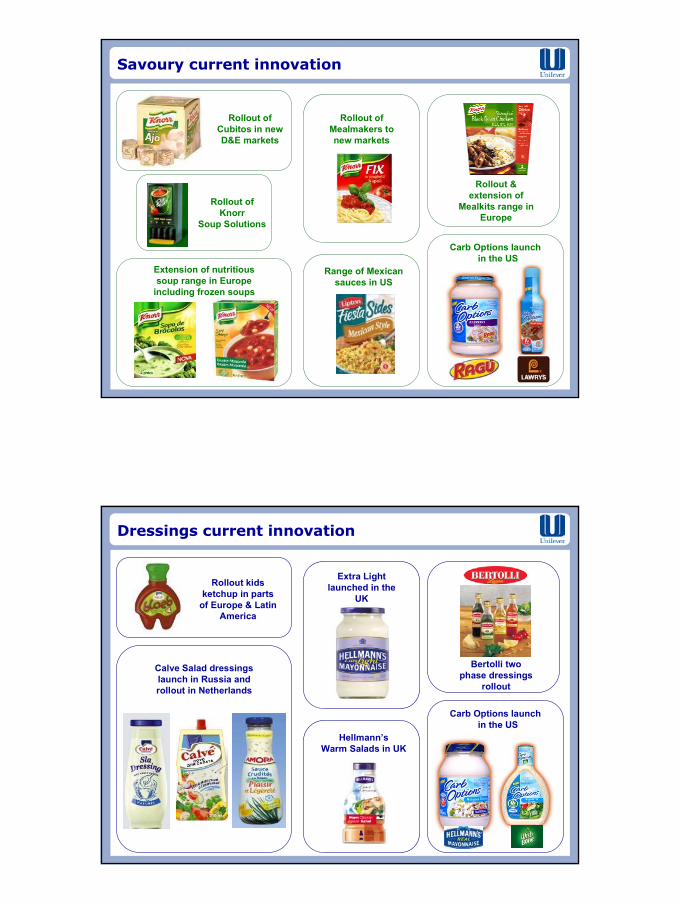
Development of Leading Brands : Home Care
Leading brands growth %
Laundry 5.3 1.81.93.2
Household Care 7.1 (1.7)2.62.0
Total HPC 6.5 4.26.75.3
2000 2001 2002 2003
1.7
1.6
1.6
Q12004
Total Home Care 5.6 1.21.92.2 1.6
Laundry : further evidence of the benefits of our value enhancement strategy.Markets continue to be competitive with heavy emphasis on price and promotion.Strategy now turning towards a more active innovation programme. Shareposition in US stabilised around a focused brand portfolio.
Household Care : Early signs that strategy is delivering. Cif and Domestosinnovation focussed on functional benefits, improved communication andincreasing appeal through fragrances, packaging and product format.
Home Care current innovation
Improvedcleaning “Fizz”product rollout
New fragrances &variants behind
Comfort & Snuggle
Rollout of “Easy Iron”in Latin America
Fast Dry activity
OMO “pockets” successfullylaunched & rolled out in LatinAmerica and Africa - with new
formulations, packaging,fragrance & advertising
Cif &Domestosinnovationfocused on
the core
Development of Leading Brands : Foods
Leading brands growth%
6.0 4.2 5.1 2.2
4.5 3.3 3.3 6.3
Savoury & Dressings
Tea based beverages
2003200220012000
3.4
4.4
Q12004
Savoury : building on country entries in 2003; new ranges of affordable products;
new soups with improved nutritional delivery; enhancing range of convenience
meals with new flavours; Carb Options range in the US.
Dressings : building on core “good for you” credentials; Carb Options in the US
and “light” variants across Hellmann’s, Calve and Wishbone. Extending both brand
footprint : mustards, ketchup, sauces; and geographic reach.
Tea based beverages : broad programme behind Lipton with new fruit tea
varieties, extension of success in Green Tea and US roll-out of flavoured black teas.
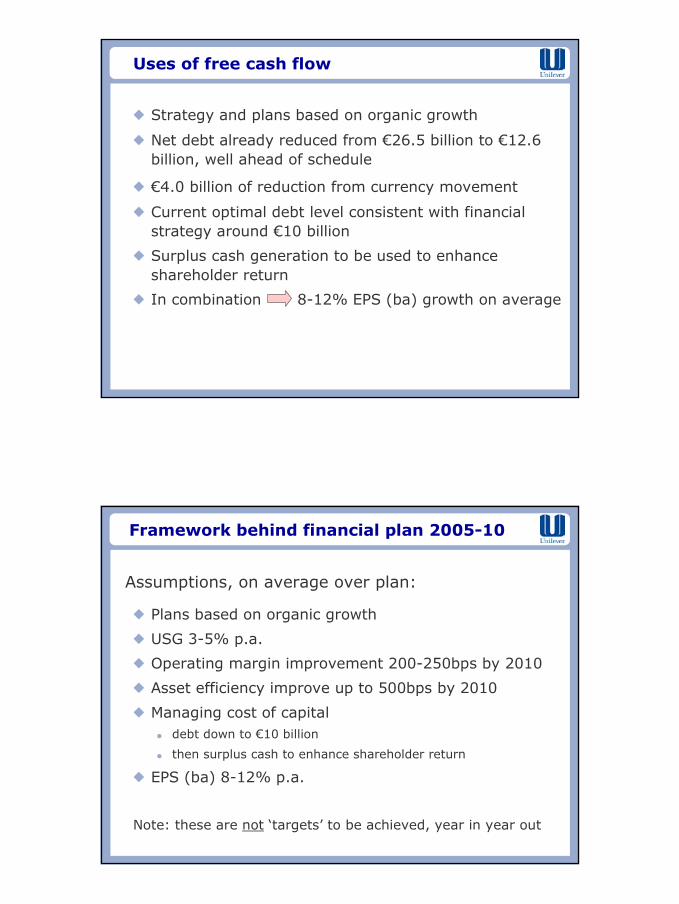
Savoury current innovation
Rollout ofCubitos in newD&E markets
Rollout ofMealmakers tonew markets
Rollout &extension of
Mealkits range inEurope
Range of Mexicansauces in US
Carb Options launch in the US
Rollout ofKnorr
Soup Solutions
Extension of nutritioussoup range in Europe
including frozen soups
Dressings current innovation
Rollout kidsketchup in parts
of Europe & LatinAmerica
Extra Lightlaunched in the
UK
Bertolli twophase dressings
rollout
Hellmann’sWarm Salads in UK
Carb Options launch in the US
Calve Salad dressingslaunch in Russia androllout in Netherlands
Tea current innovation
Lipton CarbOptions launched
in the US
Lipton Aquaelaunched in
France
Lipton Ice Lightlaunched in
Europe
Rollout Fruit Fusionrange in Europe
Build on launch of LiptonGreen in 10 countries in
Europe 2003
Development of Leading Brands : Foods
Leading brands growth%
17.0 25.4 9.1 (17.1)
1.2 2.9 4.0 4.4
3.0 0.3 0.9 (0.9)
1.9 4.1 4.4 1.2
Health & Wellness
Ice Cream
Frozen
Total Foods
2003200220012000
(12.9)
2.1
(3.1)
1.0
Q12004
(1.5) 5.5 4.3 (0.7)Spreads & Cooking (0.6)
Spreads : expected increase in activity behind both family and heart health brands.Pricing action in some European markets.
Health & Wellness : Slim.Fast plan being implemented : Low Carb now nearly20% of sales and being extended; balanced nutrition range doing well, traditionalshakes range next for relaunch.
Ice Cream : growth driven by a strong performance in the US with a further sharegain. European season just starting with active programme across the range.
Frozen : sales reduction reflects actions to further rationalise product portfolio.
Spreads & Cooking current innovation
Rollout SavourySpreads
Cremefine Dairy CreamAlternatives range roll-out in Europe
Skippy Carb Optionslaunched in US
Relaunch of Flora/Becelin parts of Europe - newformulation, packaging
& advertising
Cholesterol loweringyoghurt and milk
launched under thepro.activ brand in
Europe
Health & Wellness current innovation
Carb Optionslaunched in the
US
AdeS relaunch in partsof Latin America
The first 5 low carb products in theSlim.Fast range already represent
20% of salesNext range of 17 soon to be launched
Ice Cream current innovation
Carb Smartin the US
Cornetto “LovePotion” in Europe
Magnum Intenselaunched in
Europe
Solerorelaunch in Europe
Carte d’Or and MagnumLight launched in
Europe
Range of low-fat, no sugaradded and sugar free options
across leading brands in the US
0% fat
Frozen Food current innovation
Extension ofnutritiousmeals for
kidsthrough
Captain’spromise
Slim.Fastfrozen meals
madepromising start
in UK
Iglo, Bird’s Eye and Findusbrands extend Steamfresh
vegetables range and rolloutSteamfresh Fish
Knorr Frozenmeals now
available in 7countries in
Europe
“taste, quality, nutritionally balanced”
Progress on Path to Growth
Accelerate top-line growth
Boost operating margin
Raise operating asset efficiency
A competitive cost of capital
Levers ofEconomic Value
Path to Growth: Levers of economic value
Path to Growth
Free
Cash
Flow
Growth
Top
1/3
TSR
Portfolioimprovement
Focus on leadingbrands
Simplification
World class supplychain
Enterprise culture
� Portfolio of Global Brands & Local Jewels
� 400 brands - 200 brand positions
� Disposed of 150 businesses with proceeds of €7.5 billion
� Leading brands: 75% (1999) 94% (Q104) 95% (2004)
� 12 leading brands with turnover of €1 billion (4 in 1999)
Top line:Improved brand & business portfolio Leading brands from 75%-94% of the portfolio
Operating margin: Operating margin MAT 15.8% up 470 bps
Capital efficiency:Capital efficiency improved by 870 bps
Balance Sheet efficiency:100 bps improvement in WACC and underlyingtax rate lowered by 200 bps
Progress on levers of economic valueFree Cash
Flow(ungeared)
>€16bnsince the
start of Pathto Growth
Top thirdTSR
overarchingambition
First 70 years
EPS growth 8%
Through the ‘90s
EPS growth 9%
2000 - 2003low double digit EPS
(beia) growth
Unilever 2010
Consumer Hotspots
Multipleshoppingchannels
Need tocommunicatewith anyone,
anywhere
Betterquality of
life
Information &entertainment
on demand
Desire toimprove
standard of living
Changingfamily
structures
Smallincomes,
bigaspirations
Demand for personalised products &services
Personalresponsibility for
own welfare
Personal healthiness
“Good for You”
Convenience
“saves me time”
Indulgence
“treating yourself”
Reduced loyalty totraditional structures
Health as abirthright
Desire for healthy appearance
Protect theenvironment
Increase in travel
Mission Statement
“Unilever’s mission is to add vitality to life.We meet the everyday needs for nutrition,hygiene and personal care with brandsthat help people feel good, look good andget more out of life.”
Winning through consumer intimacy
Power in the localshopping basket
Winningwhere thepeople are
Global scale, localtouch
Availabilitywhere consumerswish to consume
Strong brandsbuild trust
BuildingRelationships
Invest inCorporate Reputation
Stay in touch withthe consumer
Technology tosupport
differentiation
Management Guidance
� Shorter-term performance metrics vs longer-term valuecreation
� Did not give ourselves enough flexibility on key metrics
� From 2005 focus will be on communicating progress with longerterm metrics and specific attributes of the year, includingdevelopments in the business environment, that could influencethem
� We will not give specific guidance on other metrics such as top-linegrowth or EPS
� Our aim is to build communication around the drivers of robustlonger-term value growth
The framework based on Value Creation
Priority is sustained top-third TSR
The drivers:
� Growth of free cash flow over time
� Growth in economic profit - the basis for the generation of
future cash flows
Linking growth in economic profit to growth in return on
Free cash flow is defined as: cash flow from operating activities, less capex andfinancial investment and after charging tax
Average annual conversion from NOPAT of over 90%
Free cash flow 1994 - 2003
€ m
illio
ns
Plan 2005 - 2010is for free cash
flow generation ofover €30 billion
3 year rolling average
Further improving capital efficiency
Capital expenditure to average around 2.5% of salesover the period
Asset efficiency enhanced through:
� intra-regional sourcing
� moving outsourcing from 15 to 25%
� selective cross-regional sourcing
Working capital management further improvedincluding more direct response to the “demand signal”and common coding with customers
Further simplification through harmonisation and SKUreduction giving benefits in asset utilisation, workingcapital and cost reduction
Return on Invested Capital
0
2
4
6
8
10
12
14
16
18
20
1994 1995 1996 1997 1998 1999 2000 2001 2002 2003
%
Plan 2010at least
17%
Return on invested capital is defined as:Return : profit before amortisation of goodwill before net interest payable and after taxInvested Capital : fixed assets, working capital and all acquired goodwill, including goodwillalready written off
Note: 1997 excludes profit on disposal of chemicals business
Return on Invested Capital 1994 - 2003
Momentum growth rate
Market volume growth rate close to 3%
Additional growth of 50-100bps from market share gain
Partly offset by:normal retailer destocking
Pricing around 1%
Average underlying sales growth2005 - 2010 3-5%
Drivers of operating margin
Operating margin improvement
4 years
6 years
2000 - 2003
2005 - 2010 plan
+460bps
+200 - 250bps
Drivers:
Ongoing restructuring:
• investment included in operating margin 50-100bps with 100bps


![Unilever and tea sustainability [PRESENTER’S NAME], [TITLE], UNILEVER [COUNTRY]](https://static.documents.pub/doc/80x56/56649e4c5503460f94b41ad7/unilever-and-tea-sustainability-presenters-name-title-unilever-country.jpg)


