15
Q1/21 Results April 30, 2021

Q1/21 Results April 30, 2021

Forward looking statements
1
This presentation contains forward-looking statements that are based on our management’s beliefs and assumptions and on informat ion currently available to our management. Although we believe that the expectations reflected in these forward-looking statements are reasonable, these statements relate to future events or our future financial performance, and involve known and unknown risks, uncertainties and other factors that may cause our actual results, levels of activity, performance or achievements to be materially different from any future results, levels of activity, performance or achievements expressed or implied by these forward-looking statements. In some cases, you can identify forward-looking statements by terminology such as “may,” “will,” “should,” “expects,” “intends,” “plans,” “anticipates,” “believes,” “estimates,” “predicts,” “potential,” “continue” or the negative of these terms or other comparable terminology. These statements are only predictions. You should not place undue reliance on forward-looking statements because they involve known and unknown risks, uncertainties and other factors, which are, in some cases, beyond our control and which could materially affect results. Factors that may cause actual results to differ materially from current expectations include, among other things, the risks described below. If one or more of these or other risks or uncertainties occur, or if our underlying assumptions prove to be incorrect, actual events or results may vary significantly from those implied or projected by the forward-looking statements. No forward-looking statement is a guarantee of future performance. You should read this press release completely and with the understanding that our actual future results may be materially different from any future results expressed or implied by these forward-looking statements.
In particular, forward-looking statements in this press release may include statements about: the ultimate duration of the COVID-19 pandemic and its short-term and long-term impact on our business and the global economy; anticipated trends, conditions and investor sentiment in the global markets and ETPs; anticipated levels of inflows into and outflows out of our ETPs; our ability to deliver favorable rates of return to investors; competition in our business; our ability to develop new products and services; our ability to maintain current vendors or find new vendors to provide services to us at favorable costs; our ability to successfully operate and expand our business in non-U.S. markets; and the effect of laws and regulations that apply to our business. Our business is subject to many risks and uncertainties, including without limitation:
• adverse market developments arising from the COVID-19 pandemic could negatively impact our assets under management, resulting in a decline in our revenues and other potential operational challenges;• declining prices of securities, gold and other precious metals and other commodities can adversely affect our business by reducing the market value of the assets we manage or causing WisdomTree ETP
investors to sell their fund shares and trigger redemptions; • fluctuations in the amount and mix of our AUM, whether caused by disruptions in the financial markets or otherwise including but not limited to a pandemic event such as COVID-19, may negatively impact
revenues and operating margins, and may impede our ability to refinance our debt upon maturity or increase the cost of borrowing upon a refinancing; • competitive pressures could reduce revenues and profit margins;• we derive a substantial portion of our revenues from a limited number of products, and as a result, our operating results are particularly exposed to investor sentiment toward investing in the products’
strategies and our ability to maintain the AUM of these products, as well as the performance of these products and market-specific and political and economic risk; • a significant portion of our AUM is held in products with exposure to U.S. and international developed markets and we therefore have exposure to domestic and foreign market conditions and are subject to
currency exchange rate risks; • withdrawals or broad changes in investments in our ETPs by investors with significant positions may negatively impact revenues and operating margins; • over the last few years, we have expanded our business internationally. This expansion subjects us to increased operational, regulatory, financial and other risks; • many of our ETPs have a limited track record, and poor investment performance could cause our revenues to decline; and • we depend on third parties to provide many critical services to operate our business and our ETPs. The failure of key vendors to adequately provide such services could materially affect our operating business
and harm WisdomTree ETP investors.
Other factors, such as general economic conditions, including currency exchange rate fluctuations, also may have an effect on the results of our operations. For a more complete description of the risks noted above and other risks that could cause our actual results to differ from our current expectations, please see the section entitled “Risk Factors” in our Annual Report on Form 10-K for the year ended December 31, 2020.
The forward-looking statements in this presentation represent our views as of the date of this presentation. We anticipate that subsequent events and developments may cause our views to change. However, while we may elect to update these forward-looking statements at some point in the future, we have no current intention of doing so except to the extent required by applicable law. Therefore, these forward-looking statements do not represent our views as of any date other than the date of this presentation.
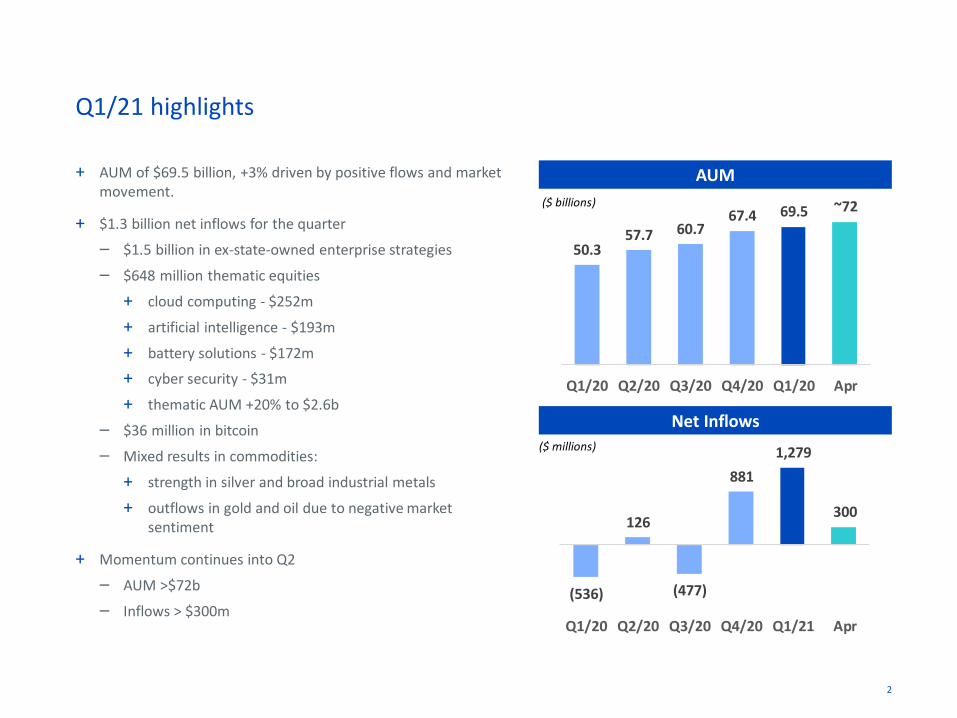
(536)
126
(477)
881
1,279
300
Q1/20 Q2/20 Q3/20 Q4/20 Q1/21 Apr
50.357.7 60.7
67.4 69.5 ~72
Q1/20 Q2/20 Q3/20 Q4/20 Q1/20 Apr
Q1/21 highlights
2
+ AUM of $69.5 billion, +3% driven by positive flows and market movement.
+ $1.3 billion net inflows for the quarter
– $1.5 billion in ex-state-owned enterprise strategies
– $648 million thematic equities
+ cloud computing - $252m
+ artificial intelligence - $193m
+ battery solutions - $172m
+ cyber security - $31m
+ thematic AUM +20% to $2.6b
– $36 million in bitcoin
– Mixed results in commodities:
+ strength in silver and broad industrial metals
+ outflows in gold and oil due to negative market sentiment
+ Momentum continues into Q2
– AUM >$72b
– Inflows > $300m
AUM
Net Inflows
($ millions)
($ billions)

3
Revenue, Income, EPS
($ millions)
Highlights/Unusual Items
EPS: ($0.10) (5) $0.09 (6)($0.06) (2) ($0.09) (3)
(1) See “Non-GAAP Financial Measurements” (5) Includes $0.16 of net losses(2) Includes $0.13 of net losses (6) Includes $0.01 of net gain(3) Includes $0.14 of net losses(4) Includes $0.08 of net losses
($0.01) (4)
Net Income/(loss):
($13.5) $15.1($8.6) ($13.3) ($0.3)
Total Revenue Adjusted Net Income (non-GAAP)(1)
Adjusted EPS(non-GAAP) (1): $0.06 $0.08$0.07 $0.05 $0.07
Q1/21Q1/20 Q2/20 Q3/20 Q4/20
Strong revenue and earnings growth
+ Revenues increased 9% due to higher average AUM, primarily from net inflows
+ Adjusted earnings increased 36% due to flat expenses and revenue growth
+ $2.8 million after tax, non-cash gain associated with revaluation of deferred consideration (gold payment) and net $0.2 million of other non-operating gains/charges
3
63.9
58.1
64.6
67.1
72.8
11.2
8.5
11.0
9.2
12.5

4
Gross Margin (1)
Operating Income Margin
Operating margins and gross margins increased sequentially
+ Higher revenues and flat expenses impacting higher margins in the quarter
+ Gross margins increased due to higher average AUM as well as Q4/20 reflected fund rebalancing fees and Brexit expenses.
Full year guidance remains 77% to 78%
4
77.3% 75.1% 76.5% 75.6%78.7%
Q1/20 Q2/20 Q3/20 Q4/20 Q1/21
24.5%20.3%
22.8%19.2%
25.5%
Q1/20 Q2/20 Q3/20 Q4/20 Q1/21
(1) See “Non-GAAP financial measurements”

5
54,152 54,223
1,800
691
(1,159)
(829) (179 ) (147 )(106 )
Discretionary spending includes marketing, sales, professional fees, occupancy & equipment, depreciation & amortization, other
Expense Base Change – Q4/20 to Q1/21
Q4/20 Mktg.Sales
FundCosts
Other Q1/21Comp Prof.Fees
($ in thousands)
Expenses stay flat
+ Higher compensation expense from seasonal payroll taxes.
Updated guidance: annual compensation expense expected at top end of $75-$85 million range.
+ Higher professional fees due to product development of our digital asset initiative
+ Lower spending in marketing and sales due to timing
+ Higher Brexit and rebalancing costs in Q4/20
+ Lower gold prices, exit of London lease and other related expenses
+ Discretionary spending well controlled - $10.5 million.
Full year guidance remains at $49 million.
5
Gold Occup.
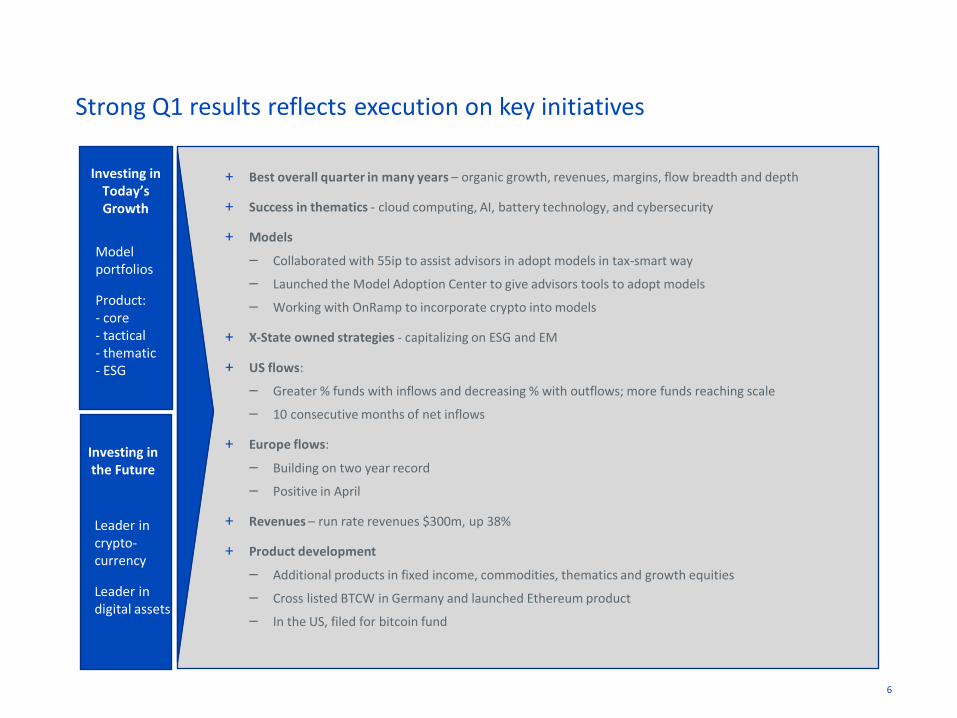
Strong Q1 results reflects execution on key initiatives
6
Leader in crypto-currency
Leader in digital assets
Model portfolios
Product: - core - tactical - thematic - ESG
+ Best overall quarter in many years – organic growth, revenues, margins, flow breadth and depth
+ Success in thematics - cloud computing, AI, battery technology, and cybersecurity
+ Models
– Collaborated with 55ip to assist advisors in adopt models in tax-smart way
– Launched the Model Adoption Center to give advisors tools to adopt models
– Working with OnRamp to incorporate crypto into models
+ X-State owned strategies - capitalizing on ESG and EM
+ US flows:
– Greater % funds with inflows and decreasing % with outflows; more funds reaching scale
– 10 consecutive months of net inflows
+ Europe flows:
– Building on two year record
– Positive in April
+ Revenues – run rate revenues $300m, up 38%
+ Product development
– Additional products in fixed income, commodities, thematics and growth equities
– Cross listed BTCW in Germany and launched Ethereum product
– In the US, filed for bitcoin fund
Investing in the Future
Investing in Today’s Growth

Investing in the future
+ Q1 represented growth, momentum and execution
+ Focus on the future:
– Crypto products
– Digital assets
+ Participated in Securrency series B along with Abu Dhabi Catalyst Partners, State Street
and US Bank
+ Regulated digital assets and blockchain will have an important role in financial services
+ Filed for blockchain enabled digital short term treasury fund
+ Strategically well positioned in the fast developing digital asset space
8
Appendix

9
Q4/20 Q1/21NetFlows
MarketMove
Quarterly ETF AUM Change
($ billions)
Q1/21 Net Flows by Category
($ millions)
Commodity &Currency
Fixed Income
International Developed
U.S. Equity
Emerging Market Equity
Leveraged/Inverse
Alternative
AUM and net inflows
9
67.4
69.5
1.3
0.8
(624)
(4)
(0)
10
17
218
1,662

10
108.8
97.4
1.9
(5.6)
(4.9) (2.6) (0.2)
Balance Sheet
($ millions)
(1) Includes securities owned and securities held to maturity
Q1/21 Change in Cash & Securities (1)
Dec 31, 2020
Mar 31, 2021
OperatingCash Flow
Dividends ShareBuybacks
Other
($ millions)
Purchase ofInvestments/Fixed Assets
Balance sheet
10
Mar. 31, Dec. 31,
2021 2020
Assets
Cash and securities (1) $97.4 $108.8
Investments (2) 13.8 8.1
Accounts receivable 30.3 29.5
Deferred tax asset, net 6.2 8.1
Fixed assets, net 7.4 7.6
Goodwill and intangibles 687.1 687.1
Other assets 20.8 20.5
Total assets $863.0 $869.7
Liabilities
Fund management and administration $18.0 $19.6
Compensation and benefits 8.6 22.8
Accounts payable and other liabilities 11.4 10.2
Long-term debt 171.2 166.6
Deferred consideration (gold payments) 227.1 230.1
Lease Liabilities 17.0 17.4
Other non-current liabilities 2.9 4.1
Total liabilities 456.2 470.8
Preferred stock 132.6 132.6
Stockholders' equity 274.2 266.3
Total liabilities and stockholders' equity $863.0 $869.7

11
Consolidated financial results
11
2020 2021
Q1 Q2 Q3 Q4 Q1
Revenues
Advisory fees 62,950$ 57,208$ 63,919$ 66,105$ 71,616$
Other income 924 918 721 954 1,214
Total revenues 63,874 58,126 64,640 67,059 72,830
Expenses
Compensation and benefits 17,295 17,455 19,098 20,827 22,627
Fund management and administration 14,485 14,461 15,219 16,350 15,521
Marketing and advertising 2,468 1,949 2,996 3,715 3,006
Sales and business development 3,417 2,181 2,386 2,595 2,145
Contractual gold payments 3,760 4,063 4,539 4,449 4,270
Professional and consulting fees 1,273 1,357 950 1,322 2,013
Occupancy, communications and equipment 1,551 1,643 1,611 1,622 1,475
Depreciation and amortization 256 251 253 261 252
Third party distribution fees 1,355 1,340 1,233 1,291 1,343
Acquisition & disposition related costs 383 33 -- -- --
Other 1,997 1,596 1,611 1,720 1,571
Total expenses 48,240 46,329 49,896 54,152 54,223
Operating Income 15,634 11,797 14,744 12,907 18,607
Interest Expense (2,419) (2,044) (2,511) (2,694) (2,296)
Gain/(loss) on revaluation of deferred consideration (2,208) (23,358) (8,870) (22,385) 2,832
Interest Income 163 119 111 351 231
Impairments (19,672) -- (3,080) -- (303)
Debt Extinguishment -- (2,387) -- -- --
Other gains/(losses) (2,507) 1,819 744 524 (5,893)
Income/(loss) before taxes (11,009) (14,054) 1,138 (11,297) 13,178
Income tax (benefit)/expense (2,371) (804) 1,408 2,200 (1,969)
Net Income/(loss) (8,638)$ (13,250)$ (270)$ (13,497)$ 15,147$
As adjusted (non-GAAP)
Total operating expenses 47,857$ 46,296$ 49,896$ 54,152$ 54,223$
Operating income 16,017$ 11,830$ 14,744$ 12,907$ 18,607$
Income before income taxes 14,358$ 10,911$ 13,242$ 11,504$ 15,583$
Income tax expense 3,134$ 2,417$ 2,205$ 2,281$ 3,079$
Net income 11,224$ 8,494$ 11,037$ 9,223$ 12,504$
Earnings per share - diluted 0.07$ 0.05$ 0.07$ 0.06$ 0.08$

12
In an effort to provide additional information regarding our results as determined by GAAP, we also disclose certain non-GAAP information which we believe provides useful and meaningful information. Our management reviews these non-GAAP financial measurements when evaluating our financial performance and results of operations; therefore, we believe it is useful to provide information with respect to these non-GAAP measurements so as to share this perspective of management. Non-GAAP measurements do not have any standardized meaning, do not replace nor are superior to GAAP financial measurements and are unlikely to be comparable to similar measures presented by other companies. These non-GAAP financial measurements should be considered in the context with our GAAP results. The non-GAAP financial measurements contained in this release include:
• Adjusted operating income, operating expenses, income before income taxes, income tax expense, net income and diluted earnings per share. We disclose adjusted operating income, operating expenses, income before income taxes, income tax expense, net income and diluted earnings per share as non-GAAP financial measurements in order to report our results exclusive of items that are non-recurring or not core to our operating business. We believe presenting these non-GAAP financial measures provides investors with a consistent way to analyze our performance. These non-GAAP financial measures exclude the following:
• Unrealized gains or losses on the revaluation of deferred consideration: Deferred consideration is an obligation we assumed in connection with the ETFS acquisition that is carried at fair value. This item represents the present value of an obligation to pay fixed ounces of gold into perpetuity and is measured using forward-looking gold prices. Changes in the forward-looking price of gold and changes in the discount rate used to compute the present value of the annual payment obligation may have a material impact on the carrying value of the deferred consideration and our reported financial results. We exclude this item when calculating our non-GAAP financial measurements as it is not core to our operating business. The item is not adjusted for income taxes as the obligation was assumed by a wholly-owned subsidiary of ours that is based in Jersey, a jurisdiction where we are subject to a zero percent tax rate.
• Tax shortfalls and windfalls upon vesting and exercise of stock-based compensation awards: GAAP requires the recognition of tax windfalls and shortfalls within income tax expense. These items arise upon the vesting and exercise of stock-based compensation awards and the magnitude is directly correlated to the number of awards vesting/exercised as well as the difference between the price of our stock on the date the award was granted and the date the award vested or was exercised. We exclude these items when calculating our non-GAAP financial measurements as they introduce volatility in earnings and are not core to our operating business.
• Other items: Impairment charges, an unrealized gain recognized on our investment in Securrency, interest expense from the amortization of discount arising from the bifurcation of the conversion option embedded in the convertible notes (prior to January 1, 2021, the effective date of Accounting Standards Update 2020-06, Debt – Debt with Conversion and Other Options, Cash Conversion), a loss on extinguishment of debt, the release of a deferred tax asset valuation allowance recognized on interest carryforwards arising from our debt previously outstanding in the United Kingdom, a gain arising from an adjustment to the estimated fair value of consideration received from the exit of our investment in AdvisorEngine, a gain recognized upon the sale of our Canadian ETF business and acquisition and disposition-related costs are excluded when calculating our non-GAAP financial measurements.
• Adjusted effective income tax rate. We disclose our adjusted effective income tax rate as a non-GAAP financial measurement in order to report our effective income tax rate exclusive of items that are non-recurring or not core to our operating business. We believe reporting our adjusted effective income tax rate provides investors with a consistent way to analyze our income taxes. Our adjusted effective income tax rate is calculated by dividing adjusted income tax expense by adjusted income before income taxes. See above for information regarding the items that are excluded.
• Gross margin and gross margin percentage. We disclose our gross margin and gross margin percentage as non-GAAP financial measurements because we believe they provide investors with a consistent way to analyze the amount we retain after paying third-party service providers to operate our ETPs. These ratios also assist us in analyzing the profitability of our products. We define gross margin as total operating revenues less fund management and administration expenses. Gross margin percentage is calculated as gross margin divided by total operating revenues.
• Adjusted operating income margin. We disclose adjusted operating income margin as a non-GAAP financial measurement in order to report our operating income margin exclusive of items that are non-recurring
or not core to our operating business.
Non-GAAP financial measurements
12

13
Non-GAAP reconciliation to GAAP results
13
Three Months Ended
($ in thousands) Mar. 31 Dec 31 Sept. 30 Jun. 30 Mar. 31
Unaudited 2021 2020 2020 2020 2020
Adjusted net income and diluted earnings per share:
Net income, as reported 15,147$ (13,497)$ (270)$ (13,250)$ (8,638)$
Add back: Impairments, net of income taxes 245 -- 2,326 -- 19,672
Add back: Loss on extinguishment of debt, net of income taxes -- -- -- 1,910 --
Deduct: Release of deferred tax asset valuation allowance -- -- -- (2,842) --
recognized on interest carryforwards arising from our debt previously
outstanding in the United Kingdom
Add back: Interest expense from the amortization of discount arising from -- 314 286 42 --
bifurcation of the conversion option embedded in the convertible notes,
net of tax
Deduct: Gain arising from an adjustment to the estimated fair value of -- -- (225) (868) --
consideration received from Advisor Engine
Add back: Acquisition and disposition related costs, net of income taxes -- -- -- 25 358
Add back/(deduct): Tax shortfalls/(windfalls) upon vesting and 123 21 50 119 501
exercise of stock-based compensation awards
Deduct: Unrealized gain recognized on invesment in Securrency, net of
income taxes (179) -- -- -- --
Deduct: Gain recognized upon sale of our former Canadian Business -- -- -- -- (2,877)
Add back / (deduct): Unrealized loss/(gain) on revaluation of
deferred consideration (2,832) 22,385 8,870 23,358 2,208
Adjusted net income 12,504 9,223 11,037 8,494 11,224
Weighted average common share - diluted 161,831 161,138 160,876 166,634 167,561
Adjusted earnings per share - diluted $0.08 $0.06 $0.07 $0.05 $0.07
Adjusted operating income and adjusted operaging income margin:
Operating revenues 72,830$ 67,059$ 64,640$ 58,126$ 63,874$
Operating income 18,607 12,907 14,744 11,797 15,634
Add: Acquisition and disposition related costs, before income taxes -- -- -- 33 383
Adjusted operating income 18,607$ 12,907$ 14,744$ 11,830$ 16,017$
Adjusted operating income margin 25.5% 19.2% 22.8% 20.4% 25.1%
Adjusted Total Operating Expenses
Total Operating expenses 54,223$ 54,152$ 49,896$ 46,329$ 48,240$
Deduct: Acquisition and disposition-related costs, before income taxes -- -- -- (33) (383)
Adjusted operating expenses 54,223$ 54,152$ 49,896$ 46,296$ 47,857$
($ in thousands) Mar. 31 Dec 31 Sept. 30 Jun. 30 31-Mar
Unaudited 2021 2020 2020 2020 2020
Gross Margin and Gross Margin Percentage
Operating Revenues 72,830$ 67,059$ 64,640$ 58,126$ 63,874$
Deduct: Fund management and administration (15,521) (16,350) (15,219) (14,461) (14,485)
Gross margin 57,309$ 50,709$ 49,421$ 43,665$ 49,389$
Gross margin percentage 78.7% 75.6% 76.5% 75.1% 77.3%
Adjusted Effective Income Tax Rate
Income/(loss) before income taxes 13,178$ (11,297)$ 1,138$ (14,054)$ (11,009)$
Add back/(deduct): Unrealized loss/(gain) on revaluation of (2,832) 22,385 8,870 23,358 2,208
deferred consideration
Add back: Loss on extinguishment of debt -- -- -- 2,387 --
Add back: Interest expense from the amortization of discount arising from -- 416 379 55 --
bifurcation of the conversion option embedded in the convertible notes,
net of tax
Deduct: Gain arising from an adjustment to the estimated fair value of -- -- (225) (868) --
consideration received from Advisor Engine
Deduct: Unrealized gain recognized on invesment in Securrency, before
income taxes (237) -- -- -- --
Deduct: Gain recognized upon sale of Canadian Business -- -- -- -- (2,877)
Add back: Loss recognized upon reduction of tax indemnification asset 5,171 -- -- -- 5,981
Add back: Impairments, before income tax 303 -- 3,080 -- 19,672
Add back: Acquisition and disposition related costs, before income taxes -- -- -- 33 383
Adjusted income before income taxes 15,583$ 11,504$ 13,242$ 10,911$ 14,358$
Income tax (benefit)/expense (1,969)$ 2,200$ 1,408$ (804)$ (2,371)$
Add back: Tax benefit arising from loss on extinguishment of debt -- -- -- 477 --
Add back: Release of deferred tax asset valuation allowance
recognized on interest carryforwards arising from our debt previously
outstanding in the United Kingdom -- -- -- 2,842 --
Add back: tax beneft from the amortization of discount associated with the -- 102 93 13 --
bifurcation of the conversion option embedded in the convertible notes
Deduct: tax expense on unrealized gain on Securrency investment (58) -- -- -- --
Add back: Tax benefit arising from impairments 58 -- 754 -- --
Add back: Tax benefit arising reduction in unrecognized tax benefits 5,171 -- -- -- 5,981
Add back/(deduct): Tax windfalls/(shortfalls) upon vesting and exercise (123) (21) (50) (119) (501)
of stock-based compensation awards
Add back: Tax benefit arising from acquisition/disposition related costs -- -- -- 8 25
Adjusted income tax expense 3,079$ 2,281$ 2,205$ 2,417$ 3,134$
Adjusted effective income tax rate 19.8% 19.8% 16.7% 22.2% 21.8%
Three Months Ended


