37
Q3 CORPORATE REPORT January 1 - March 31, 2018 April 27, 2018
Q3 CORPORATE REPORTJanuary 1 - March 31, 2018
April 27, 2018
• State of the Lottery Summary
• Financial Update
• Sales Update
• Corporate Responsibility
• Marketing Updates
• Game Updates
• Wyoming Responsible Gambling
Coalition Campaign
• Thank you
O V E R V I E W / A G E N D A
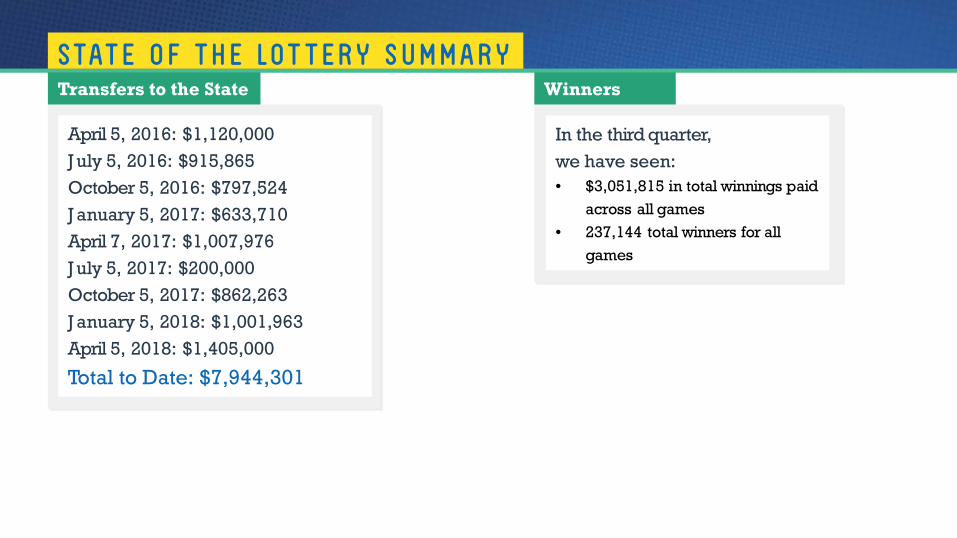
STAT E O F T H E LOT T E R Y S U M M A R Y
April 5, 2016: $1,120,000J uly 5, 2016: $915,865October 5, 2016: $797,524J anuary 5, 2017: $633,710April 7, 2017: $1,007,976J uly 5, 2017: $200,000October 5, 2017: $862,263J anuary 5, 2018: $1,001,963April 5, 2018: $1,405,000
Total to Date: $7,944,301
Transfers to the State Winners
In the third quarter, we have seen:• $3,051,815 in total winnings paid
across all games • 237,144 total winners for all
games

F I N A N C I A L U P D AT E
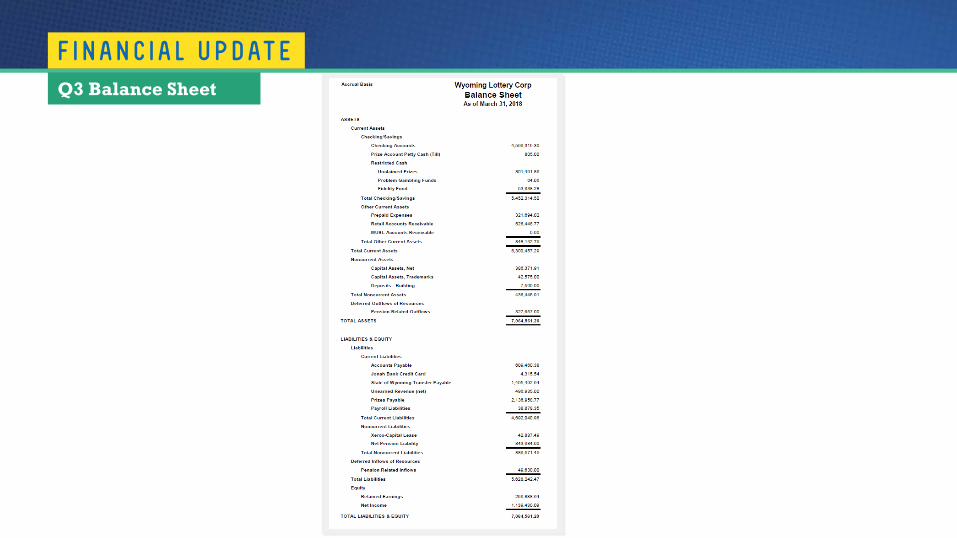
F I N A N C I A L U P D AT EQ3 Balance Sheet

F I N A N C I A L U P D AT EQ3 Profit & Loss

F I N A N C I A L U P D AT EYTD Profit & Loss
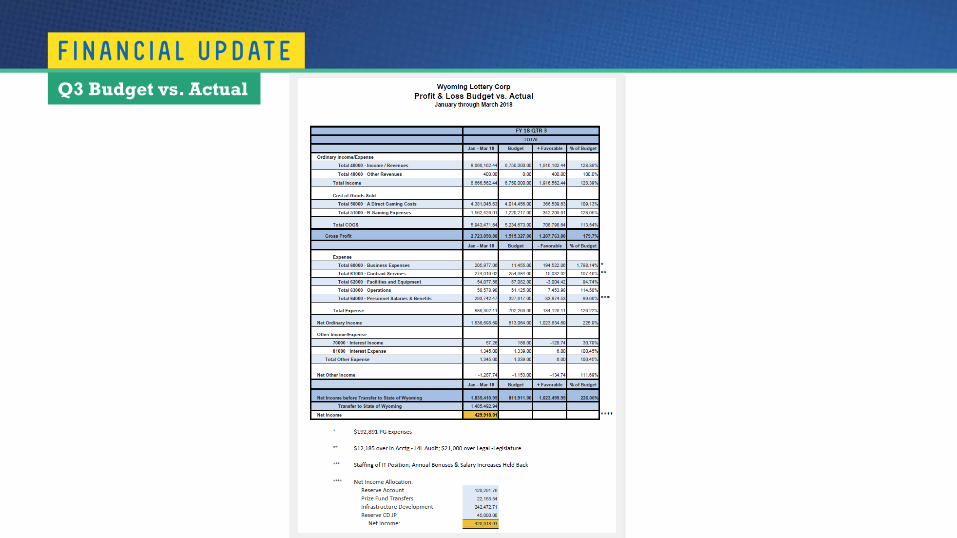
F I N A N C I A L U P D AT EQ3 Budget vs. Actual

F I N A N C I A L U P D AT EYTD Budget vs. Actual

S A L E S U P D AT E
0
5,000,000
10,000,000
15,000,000
20,000,000
25,000,000
30,000,000
1 2 3 4 5 6 7 8 9 10 11 12 13 14 15 16 17 18 19 20 21 22 23 24 25 26 27 28 29 30 31 32 33 34 35 36 37 38 39 40 41 42 43 44 45 46 47 48 49 50 51 52
Sale
s
2018FY Projections 2018FY Actual Sales YTD
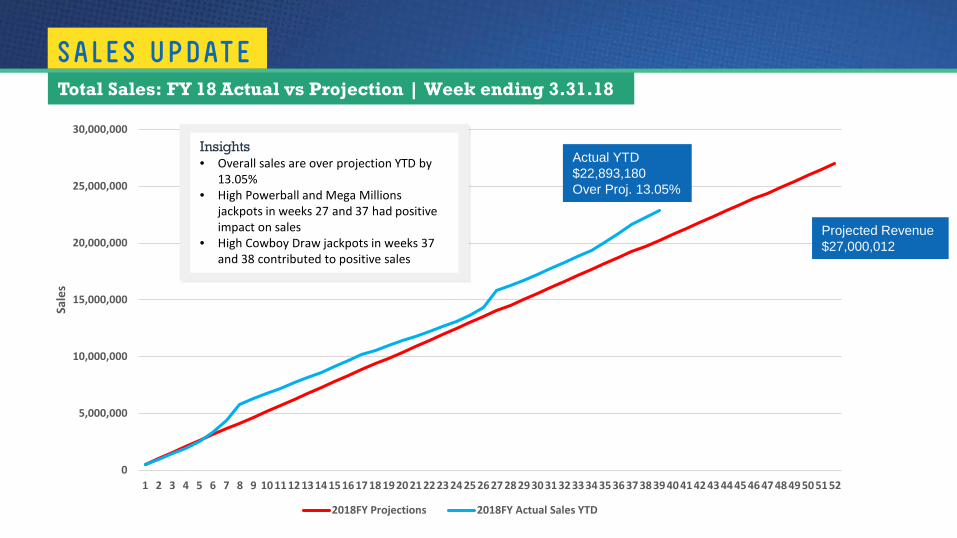
S A L E S U P D AT ETotal Sales: FY 18 Actual vs Projection | Week ending 3.31.18
Insights• Overall sales are over projection YTD by
13.05%• High Powerball and Mega Millions
jackpots in weeks 27 and 37 had positive impact on sales
• High Cowboy Draw jackpots in weeks 37 and 38 contributed to positive sales
Actual YTD $22,893,180Over Proj. 13.05%
Projected Revenue $27,000,012

0
1,000,000
2,000,000
3,000,000
4,000,000
5,000,000
6,000,000
7,000,000
8,000,000
9,000,000
1 2 3 4 5 6 7 8 9 10 11 12 13
2018 3rd Quarter Projections Actual 3rd Quarter Sales
S A L E S U P D AT ETotal 3rd Quarter Sales: FY 18 Actual vs Projection | Week ending 3.31.18
Insights• FY18 Quarterly Sales Projection:
$6,750,003• Q3 Actual Sales: $8,549,232• Over projection by 26.6% for the quarter
versus 2nd Quarter being under by 7.86%
Actual 3rd
Quarter Sales: $8,549,232
Projected 3rd
Quarter Sales: $6,750,003Sa
les

0
5,000,000
10,000,000
15,000,000
20,000,000
25,000,000
1 2 3 4 5 6 7 8 9 10 11 12 13 14 15 16 17 18 19 20 21 22 23 24 25 26 27 28 29 30 31 32 33 34 35 36 37 38 39
Sale
s
FY'18 Actual Sales YTD FY'17 Actual Sales
S A L E S U P D AT ETotal Sales: FY18 vs. FY17| Week ending 3.31.18
Insights• Total sales YTD FY18: $22,893,180• Total sales FY17 same time last year:
$19,232,943• Difference year over year: $3,660,237
increase in sales for FY18
FY18 PB Jackpot $758 Million

0
200,000
400,000
600,000
800,000
1,000,000
1,200,000
1,400,000
1,600,000
1 2 3 4 5 6 7 8 9 10 11 12 13 14 15 16 17 18 19 20 21 22 23 24 25 26 27 28 29 30 31 32 33 34 35 36 37 38 39
Sale
s
2018 Weekly Sales 2017FY Weekly Sales
FY18 PB Jackpot: $559 MillionMM Jackpot: $451 Million
FY18 PB Jackpot: $456 MillionMM Jackpot: $345 MillionCD Jackpot: $1.14 Million
S A L E S U P D AT ETotal Sales: Actual weekly sales FY18 vs. FY17 | Week ending 3.31.18
Insights• Average Weekly Sales: $587,005• Weekly Pace Amount: $519,000• Week 27 sales were $1,492,306 due to PB
and MM jackpots• Week 37 sales were $861,878 due to all
jackpots increasing together
FY17 PB Jackpot $478 Million
FY18 PB Jackpot $758 Million

0
200,000
400,000
600,000
800,000
1,000,000
1,200,000
1 2 3 4 5 6 7 8 9 10 11 12 13 14 15 16 17 18 19 20 21 22 23 24 25 26 27 28 29 30 31 32 33 34 35 36 37 38 39
Sale
s
Powerball Sales FY'18 Powerball Sales FY'17
FY18 PB Jackpot $559 Million
FY18 PB Jackpot $456 Million
S A L E S U P D AT EPowerball Sales FY18 vs FY17| Week ending 3.31.18
Insights• FY18 sales to date: $8,801,171• FY17 sales same time last year:
$6,856,815• Weekly projected pace amount: $176,231• Weekly sales average YTD: $225,671
FY18 PB Jackpot $758 Million
FY17 PB Jackpot $349 Million
FY17 PB Jackpot $320 Million
FY17 PB Jackpot $470 Million

0
50,000
100,000
150,000
200,000
250,000
300,000
350,000
400,000
450,000
1 2 3 4 5 6 7 8 9 10 11 12 13 14 15 16 17 18 19 20 21 22 23 24 25 26 27 28 29 30 31 32 33 34 35 36 37 38 39
Sale
s
Mega Millions Sales FY'18 Mega Millions Sales FY'17
FY18 MM Jackpot $451 Million FY18 MM
Jackpot $521 Million
S A L E S U P D AT EMega Millions Sales FY18 vs FY17| Week ending 3.31.18
Insights• FY18 sales to date: $4,132,910• FY17 sales same time last year: $3,028,987• Weekly projected pace amount: $62,000• Weekly sales average YTD: $105,972• Mega Millions has seen two jackpots over
$450 Million since the matrix change in October 2017FY18 MM
Jackpot $393 Million
FY17 MM Jackpot $540 Million
Matrix Change Oct. 29th
0
50,000
100,000
150,000
200,000
250,000
300,000
350,000
400,000
450,000
1 2 3 4 5 6 7 8 9 10 11 12 13 14 15 16 17 18 19 20 21 22 23 24 25 26 27 28 29 30 31 32 33 34 35 36 37 38 39
Sale
s
Cowboy Draw Sales FY'18 Cowboy Draw Sales FY'17
FY18 CD Jackpot $1.08 Million
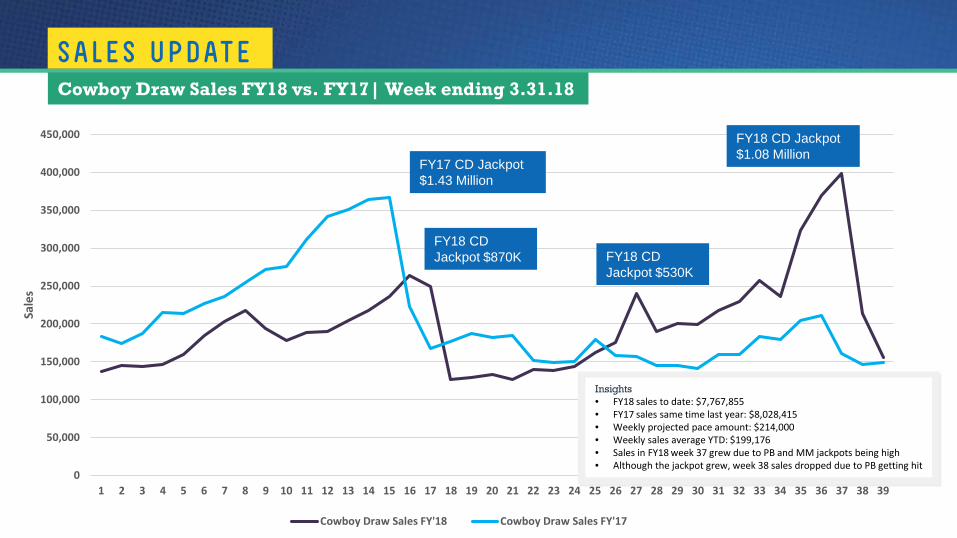
S A L E S U P D AT ECowboy Draw Sales FY18 vs. FY17| Week ending 3.31.18
Insights• FY18 sales to date: $7,767,855• FY17 sales same time last year: $8,028,415• Weekly projected pace amount: $214,000• Weekly sales average YTD: $199,176• Sales in FY18 week 37 grew due to PB and MM jackpots being high• Although the jackpot grew, week 38 sales dropped due to PB getting hit
FY17 CD Jackpot $1.43 Million
FY18 CD Jackpot $870K FY18 CD
Jackpot $530K
0
20,000
40,000
60,000
80,000
100,000
120,000
1 2 3 4 5 6 7 8 9 10 11 12 13 14 15 16 17 18 19 20 21 22 23 24 25 26 27 28 29 30 31 32 33 34 35 36 37 38 39
Sale
s
Lucky for Life Sales FY'18 Lucky for life Sales FY'17
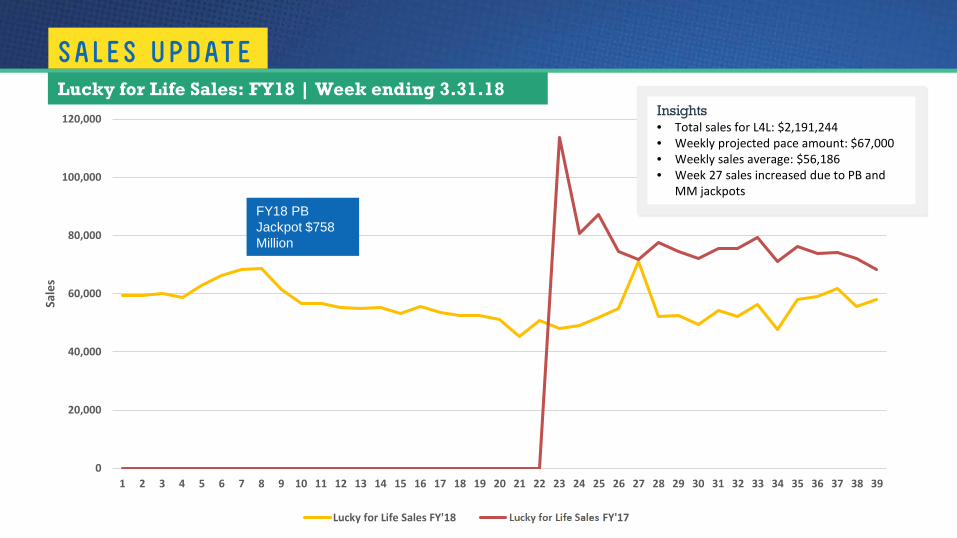
S A L E S U P D AT ELucky for Life Sales: FY18 | Week ending 3.31.18
Insights• Total sales for L4L: $2,191,244• Weekly projected pace amount: $67,000• Weekly sales average: $56,186• Week 27 sales increased due to PB and
MM jackpotsFY18 PB Jackpot $758 Million

0
20,000
40,000
60,000
80,000
100,000
120,000
140,000
1 2 3 4 5 6 7 8 9 10 11 12 13 14 15 16 17 18 19 20 21 22 23 24 25 26 27 28 29 30 31 32 33 34 35 36 37 38
'Round Up Sales FY'18"
S A L E S U P D AT ERound Up Sales FY18| Week ending 3.31.18
Insights• Round Up Total Sales YTD: $2,559,773• Total Plays: 203,424• Round Up sales increased as jackpots grew
simultaneously (weeks 27 and 37) when both PB and MM had high jackpots

0
200,000
400,000
600,000
800,000
1,000,000
1,200,000
1 2 3 4 5 6 7 8 9 10 11 12 13 14 15 16 17 18 19 20 21 22 23 24 25 26 27 28 29 30 31 32 33 34 35 36 37 38 39
Sale
s
Powerball sales Mega Millions Sales Cowboy Draw Sales Lucky for Life Sales 'Round Up Sales"
S A L E S U P D AT EWyoLotto Product Sales YTD| Week ending 3.31.18 Insights
• Total Sales YTD Powerball: $8,801,171 (38.4%)• Total Sales YTD Mega Millions: $4,132,910 (18%)• Total Sales YTD Cowboy Draw: $7,767,855 (34%)• Total Sales Lucky for Life: $2,191,244 (9.6%)• Total Sales: $22,893,180• Round Up Sales Total: $2,559,773 (203,424 plays)

CORPORATE RESPONSIBIL ITY

C O R P O R AT E R E S P O N S I B I L I T Y
Initiatives to prevent problem gambling:• Single transactions are capped at $125
and products are not available 24/7• The Problem Gambling Hotline is posted
on the back of every ticket, listed on play slips, and featured on our website.
• Problem Gambling brochures are located wherever Lottery tickets are sold
• Continued education regarding Problem and Responsible Gambling is a priority
Problem Gambling
WyoLotto continues to demonstrate its care for Wyoming communities and citizens.
C O R P O R AT E R E S P O N S I B I L I T YGame Security
Leadership in game security and integrity: • With each game release and subsequent
upgrades, the central game system and Random Number Generator (RNG) are tested
• With each batch release, the Statement of Work (SOW) is thoroughly reviewed for accuracy and release outcomes are verified
• In advance of all system changes, game risks are proactively documented, assessed and analyzed
• Lottery’s Internal Control System (ICS) provides its players with a sense of security, knowing the central gaming system is operating at the highest degree of integrity
• The Lottery works with the Department of Family Services (DFS) to collect back child support owed by a player from prize payments

M A R K E T I N G U P D AT E S
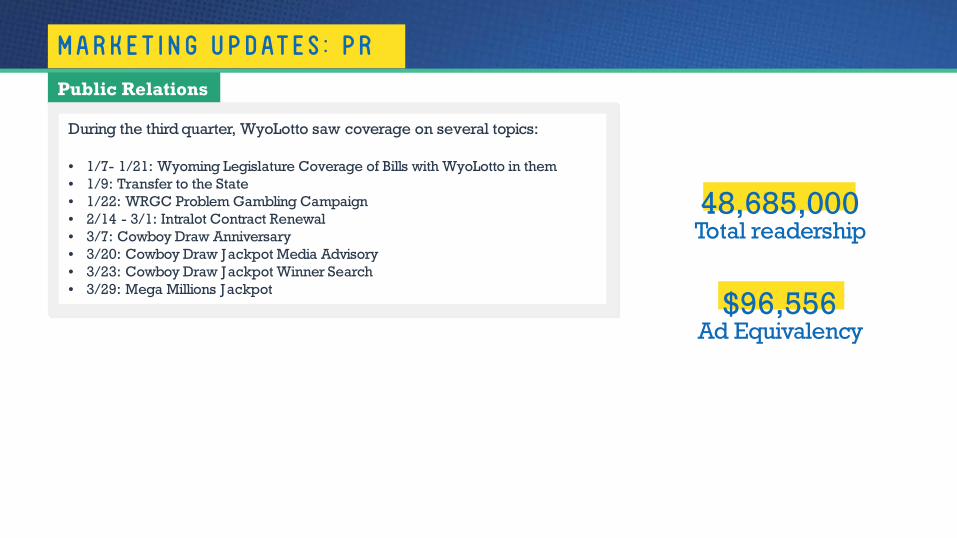
48,685,000Total readership
Public Relations
During the third quarter, WyoLotto saw coverage on several topics:
• 1/7- 1/21: Wyoming Legislature Coverage of Bills with WyoLotto in them• 1/9: Transfer to the State• 1/22: WRGC Problem Gambling Campaign• 2/14 - 3/1: Intralot Contract Renewal• 3/7: Cowboy Draw Anniversary• 3/20: Cowboy Draw Jackpot Media Advisory• 3/23: Cowboy Draw Jackpot Winner Search• 3/29: Mega Millions Jackpot
M A R K E T I N G U P D AT E S : P R
$96,556Ad Equivalency
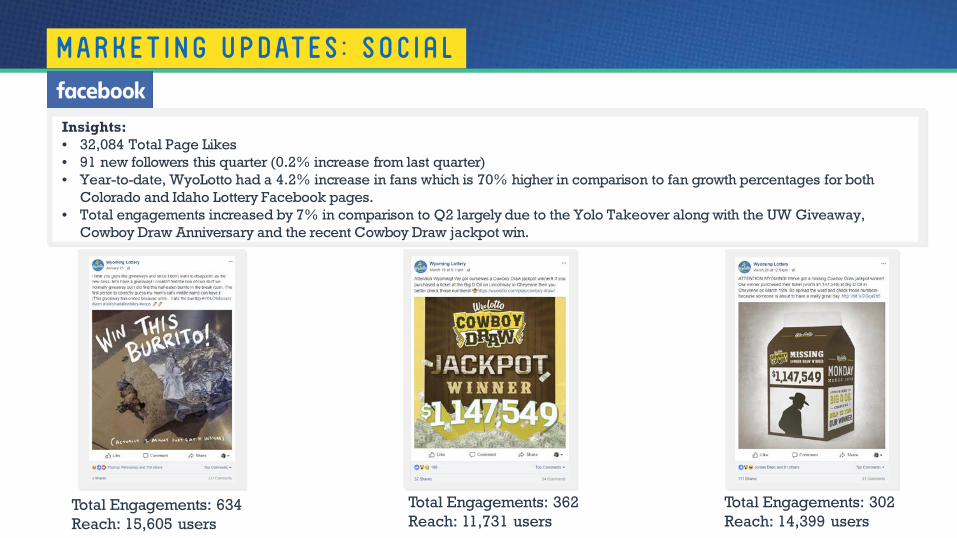
Insights:• 32,084 Total Page Likes• 91 new followers this quarter (0.2% increase from last quarter)• Year-to-date, WyoLotto had a 4.2% increase in fans which is 70% higher in comparison to fan growth percentages for both
Colorado and Idaho Lottery Facebook pages.• Total engagements increased by 7% in comparison to Q2 largely due to the Yolo Takeover along with the UW Giveaway,
Cowboy Draw Anniversary and the recent Cowboy Draw jackpot win.
M A R K E T I N G U P D AT E S : S o c i a l
Total Engagements: 634Reach: 15,605 users
Total Engagements: 362Reach: 11,731 users
Total Engagements: 302Reach: 14,399 users

Total Engagements: 118Reach: 60,508 users
Total Engagements: 6Reach: 8,923 users
Total Engagements: 44Reach: 2,049 users
M A R K E T I N G U P D AT E S : S o c i a l
Insights:• 1,247 Followers• 18 new followers this quarter (1.5% increase from last quarter)• Total engagements increased by 9.8% from last quarter primarily due to the UW Giveaway and Yolo Takeover.

Insights
• Overall site traffic saw a 21% increase from the previous quarter, primarily due to the increases in social, organic search and direct related traffic.
• Email generated 31% more website users than the previous quarter
• The homepage saw a 34.67% increase in use from the previous quarter
• There was a 3.71% increase in page views/session time from last quarter
M A R K E T I N G U P D AT E S : W E B S I T E
Top Cities Visiting
1. Cheyenne – 24.96%
2. Casper – 14.69%
3. Rock Springs – 13.98%
4. Gillette – 5.6%
5. Laramie – 5%
Email Marketing
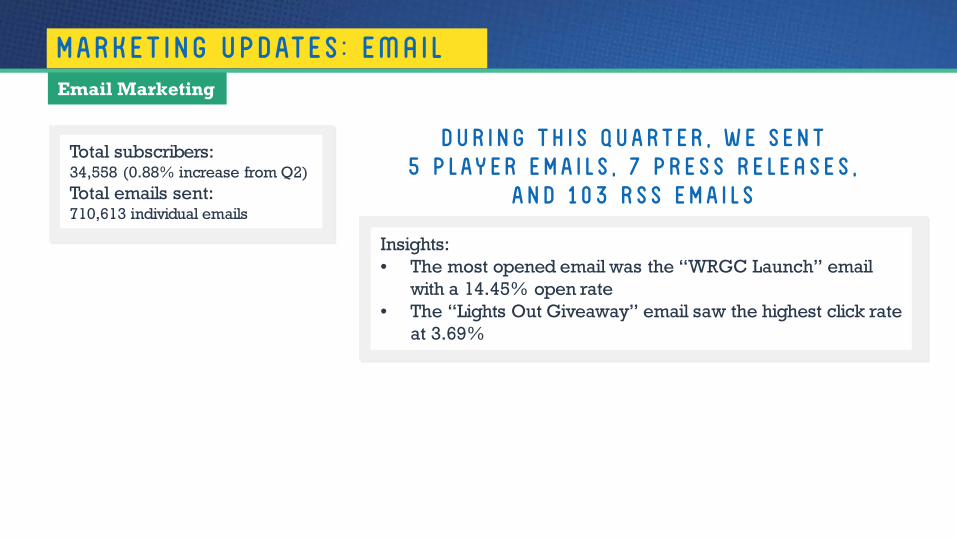
Total subscribers: 34,558 (0.88% increase from Q2)Total emails sent: 710,613 individual emails
Insights:• The most opened email was the “WRGC Launch” email
with a 14.45% open rate• The “Lights Out Giveaway” email saw the highest click rate
at 3.69%
D U R I N G T H I S Q U A R T E R , W E S E N T 5 P L A Y E R E M A I L S , 7 p r e s s r e l e a s e s ,
A N D 1 0 3 R S S E M A I L S
M A R K E T I N G U P D AT E S : E m a i l

G A M E U P D AT E S

This Quarter
Since the launch of Cowboy Draw, we’ve seen:• 17 lucky players hit the jackpot• $23,931,842 in prizes awarded• 1,230,968 winners
Since Launch
G A M E U P D AT E S : C O W B O Y D R A W
In the third quarter, we have seen:• 112,651 total Cowboy Draw winners• $2,065,179 in total Cowboy Draw
winnings• 156 players that each won $1,000 • One lucky jackpot winner of
$1,147,549 in Cheyenne on March 19 Since the game’s launch on March 15, 2015, 17 lucky players have hit the jackpot.
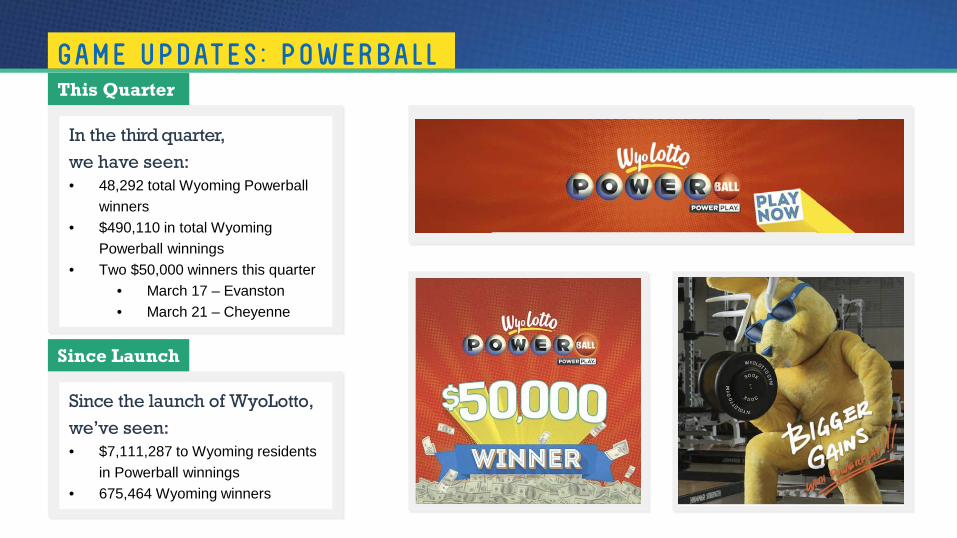
G A M E U P D AT E S : P O W E R B A L L
In the third quarter, we have seen:• 48,292 total Wyoming Powerball
winners• $490,110 in total Wyoming
Powerball winnings• Two $50,000 winners this quarter
• March 17 – Evanston• March 21 – Cheyenne
This Quarter
Since the launch of WyoLotto, we’ve seen:• $7,111,287 to Wyoming residents
in Powerball winnings• 675,464 Wyoming winners
Since Launch
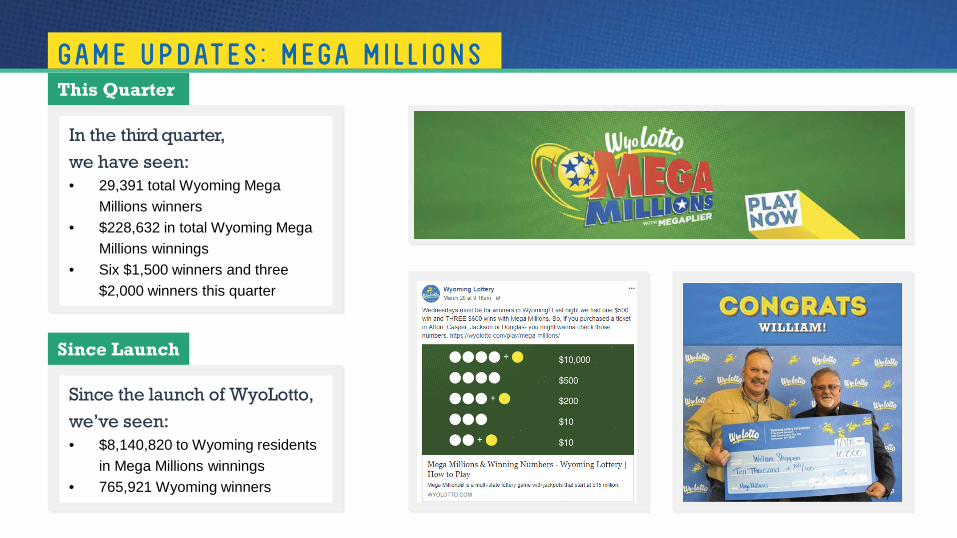
G A M E U P D AT E S : M E G A M I L L I O N S
In the third quarter, we have seen:• 29,391 total Wyoming Mega
Millions winners• $228,632 in total Wyoming Mega
Millions winnings• Six $1,500 winners and three
$2,000 winners this quarter
This Quarter
Since the launch of WyoLotto, we’ve seen:• $8,140,820 to Wyoming residents
in Mega Millions winnings• 765,921 Wyoming winners
Since Launch

G A M E U P D AT E S : L U C K Y FO R L I F E
In the third quarter, we have seen:• 46,810 total Wyoming Lucky for
Life winners• $267,894 in total Wyoming Lucky
for Life winnings• Three $5,000 winners
This Quarter
Since game launch (Dec. 4, 2016), we’ve seen:• $1,971,240 to Wyoming residents
in Lucky for Life winnings• 274,986 Wyoming winners
Since Launch

W y o m i n g r e s p o n s i b l e G a m b l i n g C o a l i t i o n
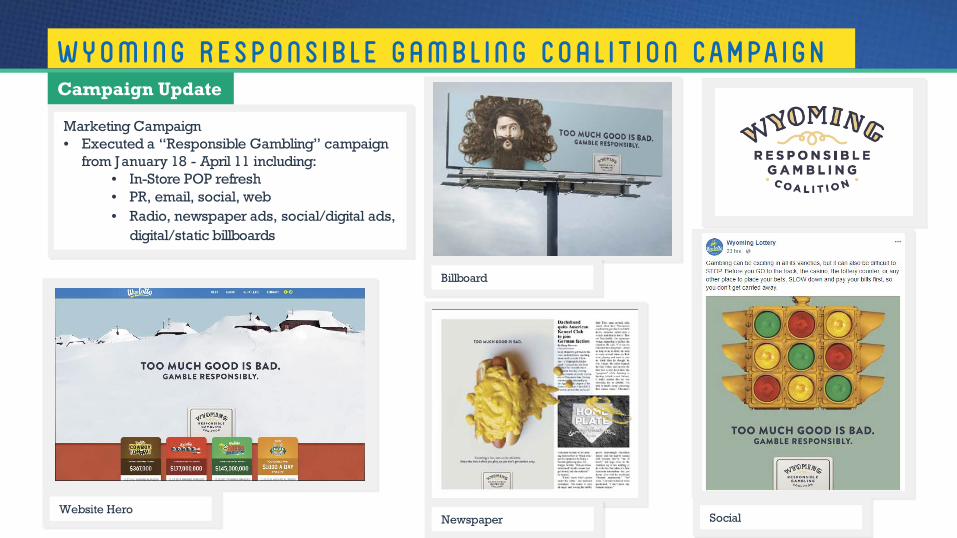
W y o m i n g R e s p o n s i b l e G a m b l i n g C o a l i t i o n C A M PA I G NCampaign Update
Marketing Campaign• Executed a “Responsible Gambling” campaign
from January 18 - April 11 including:• In-Store POP refresh• PR, email, social, web• Radio, newspaper ads, social/digital ads,
digital/static billboards
Website Hero
Billboard
Newspaper Social


