36
QANTAS AIRWAYS LIMITED AND ITS CONTROLLED ENTITIES PRELIMINARY FINAL REPORT FOR THE FINANCIAL YEAR ENDED 30 JUNE 2013 ABN: 16 009 661 901 ASX CODE: QAN

QANTAS AIRWAYS LIMITED AND ITS CONTROLLED ENTITIES
PRELIMINARY FINAL REPORT FOR THE FINANCIAL YEAR ENDED 30 JUNE 2013
ABN: 16 009 661 901
ASX CODE: QAN

QANTAS AIRWAYS LIMITED PRELIMINARY FINAL REPORT ABN: 16 009 661 901 YEAR ENDED 30 JUNE 2013
Table of Contents
ASX Appendix 4E – Preliminary Final Report Results for Announcement to the Market 1 Other Information 13 Consolidated Income Statement 14 Consolidated Statement of Comprehensive Income 15 Consolidated Balance Sheet 16 Consolidated Statement of Changes in Equity 17 Consolidated Cash Flow Statement 19 Notes to the Preliminary Final Report 20
Additional Information Operational Statistics 33 Gearing Ratio 34

QANTAS AIRWAYS LIMITED PRELIMINARY FINAL REPORT ABN: 16 009 661 901 YEAR ENDED 30 JUNE 2013
Page 1
RESULTS FOR ANNOUNCEMENT TO THE MARKET Qantas Airways Limited (Qantas) and its controlled entities (the Qantas Group or Group) Results for Announcement to the Market are detailed below.
June 2013$M
June 2012$M
Change $M
Change%
Revenue and other income 15,902 15,724 178 1.1% Statutory profit/(loss) after tax 6 (244) 250 102.5% Statutory profit/(loss) after tax attributable to members of Qantas 5 (245) 250 102.0% Underlying profit before tax 192 95 97 102.1%
DIVIDENDS
No interim dividend was paid in relation to the year ended 30 June 2013. No final dividend will be paid in relation to the year ended 30 June 2013.
EXPLANATION OF RESULTS The Qantas Group reported an improved Underlying PBT1 of $192 million for the year ended 30 June 2013, up $97 million on last year. Statutory Profit Before Tax (Statutory PBT) is up $366 million to $17 million and Statutory Profit After Tax is up $250 million to $6 million. Highlights of the full-year result include:
- Underlying PBT $192 million in challenging market conditions o Significant net underlying unit cost improvement2 o Resilient Group Domestic earnings despite yield pressure o Steady improvement in Qantas International o Record result for Qantas Loyalty3
- Delivering on strategic priorities o Strengthening Group Domestic position o Enhancing alliances, launch of Emirates partnership o Qantas Transformation delivering benefits o Growing Qantas Loyalty o Building Jetstar in Asia
- Securing the future with financial discipline o Positive net free cash flow4 of $372 million o Significant debt reduction o Prudent capital management o Strong liquidity position
1 Underlying Profit Before Tax (PBT) is the primary reporting measure used by the Qantas Group’s chief operating decision-making bodies, being the
Chief Executive Officer, Group Management Committee and the Board of Directors, for the purpose of assessing the performance of the Group. The primary reporting measure of the Qantas International, Qantas Domestic, Jetstar Group, Qantas Loyalty and Qantas Freight operating segments is Underlying EBIT as net finance costs are managed centrally. The primary reporting measure of the Corporate/Unallocated segment is Underlying PBT. Refer to page 12 for a reconciliation of Underlying PBT to Statutory PBT.
2 Net Underlying Unit Cost is the primary measure of unit cost used by the Qantas Group. It is measured as Underlying PBT less passenger revenue and fuel per ASK. Comparable unit cost is also provided as a measure of net underlying unit cost adjusted to aid comparability between reporting periods. Comparable unit cost is calculated as Net Underlying Unit Cost adjusted for the impact of industrial action (2011/2012), Boeing settlement, change in estimate of passenger revenue received in advance, carbon tax (2012/2013) and movements in average sector length.
3 Qantas Loyalty record Underlying EBIT result compared to prior periods normalised for changes in accounting estimates of the fair value of points and breakage expectations effective 1 January 2009. The Qantas Frequent Flyer segment was renamed Qantas Loyalty during the year.
4 Net free cash flow – Operating cash flows less investing cash flows. Net free cash flow is a measure of the amount of operating cash flows that are available (i.e. after investing activities) to fund reductions in net debt or payments to shareholders.

QANTAS AIRWAYS LIMITED PRELIMINARY FINAL REPORT ABN: 16 009 661 901 YEAR ENDED 30 JUNE 2013
Page 2
Explanation of Results (continued) Underlying PBT The Qantas Group Underlying PBT increased to $192 million in challenging market conditions. The result was underpinned by a significant improvement in net underlying unit cost2 and reflects the Group’s delivery of its strategic priorities.
Group Underlying Income Statement Summary June June %2013 2012 Change Change
Net passenger revenue5 $M 13,673 13,625 48 - Net freight revenue6 $M 935 903 32 4 Other revenue5,6 $M 1,294 1,196 98 8 Revenue $M 15,902 15,724 178 1
Operating expenses (excluding fuel)7 $M (9,273) (9,200) (73) (1)Share of net (loss)/profit of associates and jointly controlled entities $M (39) 3 (42) >(100)
Fuel7 $M (4,243) (4,329) 86 2 Depreciation and amortisation $M (1,450) (1,384) (66) (5)Non-cancellable aircraft operating lease rentals $M (525) (549) 24 4 Expenses $M (15,530) (15,459) (71) -
Underlying EBIT8 $M 372 265 107 40 Net finance costs7 $M (180) (170) (10) (6)Underlying PBT $M 192 95 97 102
5 Net passenger revenue has been adjusted in 2012/2013 to include associated ancillary passenger revenue, passenger service fees, charter revenue
and lease revenue from codeshare previously reported as Other revenue. 2011/2012 net passenger revenue and other revenue has been reclassified accordingly. These items remain excluded from the calculation of yield.
6 Net Freight revenue has been adjusted in 2012/2013 to include lease revenue from codeshare previously reported as other revenue. 2011/2012 net freight revenue and other revenue has been reclassified accordingly.
7 Underlying operating expenses (excluding fuel), fuel and net finance costs differ from equivalent statutory expenses due to items excluded from Underlying PBT, such as adjustments for impacts of AASB 139 which relate to other reporting periods and other items identified by Management. Refer to page 12 for a reconciliation of Underlying PBT to Statutory PBT.
8 Underlying Earning Before Net Finance Costs and Tax (EBIT) is the primary reporting measure for all segments except Corporate/Unallocated. 9 ASK – total number of seats available for passengers, multiplied by the number of kilometres flown. 10 RPK – total number of passengers carried, multiplied by the number of kilometres flown. 11 Revenue Seat factor – RPKs divided by ASKs. Also known as seat factor, load factor or load. 12 Yield (excluding FX) – Passenger revenue excluding FX, divided by RPKs. 13 Comparable Unit Cost – Net Underlying Unit Cost adjusted for the impact of Industrial Action (2011/2012), Boeing settlement, change in estimate of
passenger revenue received in advance (2012/2013), carbon tax (2012/2013) and movements in average sector length.
June June %Operating statistics 2013 2012 Change ChangeAvailable Seat Kilometres (ASK)9 M 139,909 139,423 486 - Revenue Passenger Kilometres (RPK)10 M 110,905 111,692 (787) (1)Passengers Carried 000 48,276 46,708 1,568 3 Revenue Seat Factor11 % 79.3 80.1 (0.8) (1)Yield (excluding FX)12 c/RPK 10.33 10.58 (0.25) (2)Net Underlying Unit Cost2 c/ASK 4.99 5.30 0.31 6 Comparable Unit Cost13 c/ASK 4.97 5.23 0.26 5
QANTAS AIRWAYS LIMITED PRELIMINARY FINAL REPORT ABN: 16 009 661 901 YEAR ENDED 30 JUNE 2013
Page 3
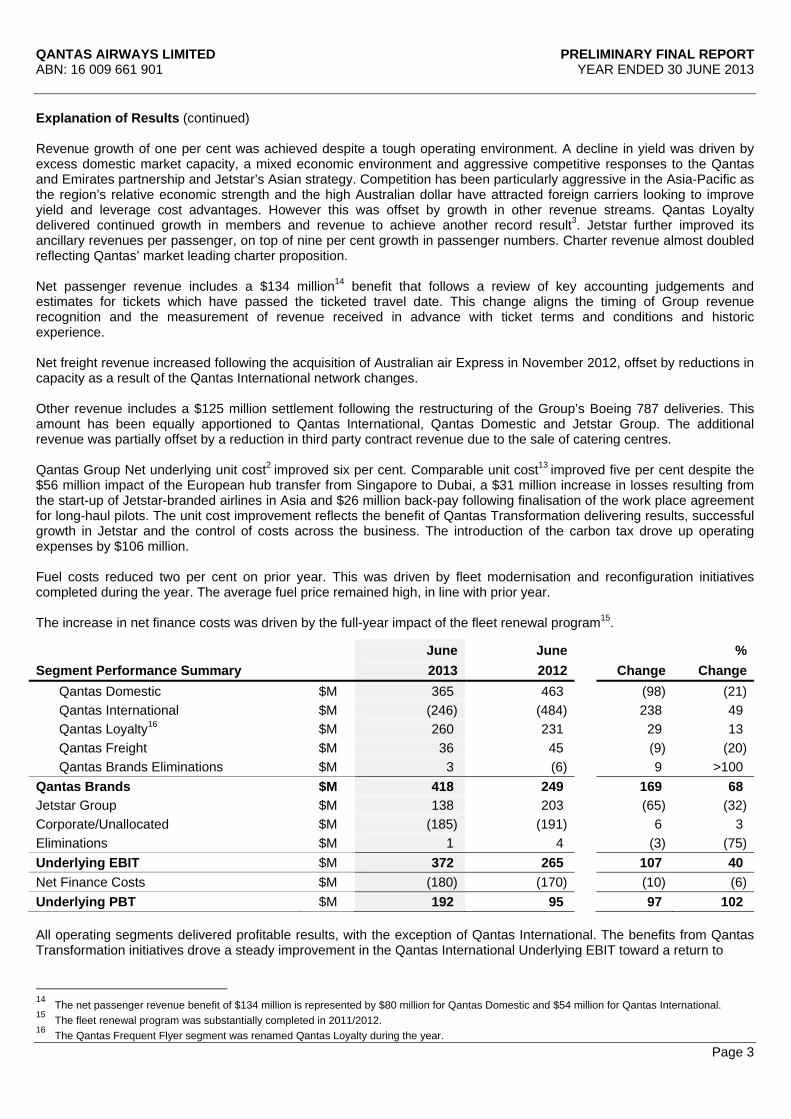
Explanation of Results (continued) Revenue growth of one per cent was achieved despite a tough operating environment. A decline in yield was driven by excess domestic market capacity, a mixed economic environment and aggressive competitive responses to the Qantas and Emirates partnership and Jetstar’s Asian strategy. Competition has been particularly aggressive in the Asia-Pacific as the region’s relative economic strength and the high Australian dollar have attracted foreign carriers looking to improve yield and leverage cost advantages. However this was offset by growth in other revenue streams. Qantas Loyalty delivered continued growth in members and revenue to achieve another record result3. Jetstar further improved its ancillary revenues per passenger, on top of nine per cent growth in passenger numbers. Charter revenue almost doubled reflecting Qantas’ market leading charter proposition. Net passenger revenue includes a $134 million14 benefit that follows a review of key accounting judgements and estimates for tickets which have passed the ticketed travel date. This change aligns the timing of Group revenue recognition and the measurement of revenue received in advance with ticket terms and conditions and historic experience. Net freight revenue increased following the acquisition of Australian air Express in November 2012, offset by reductions in capacity as a result of the Qantas International network changes. Other revenue includes a $125 million settlement following the restructuring of the Group’s Boeing 787 deliveries. This amount has been equally apportioned to Qantas International, Qantas Domestic and Jetstar Group. The additional revenue was partially offset by a reduction in third party contract revenue due to the sale of catering centres. Qantas Group Net underlying unit cost2 improved six per cent. Comparable unit cost13 improved five per cent despite the $56 million impact of the European hub transfer from Singapore to Dubai, a $31 million increase in losses resulting from the start-up of Jetstar-branded airlines in Asia and $26 million back-pay following finalisation of the work place agreement for long-haul pilots. The unit cost improvement reflects the benefit of Qantas Transformation delivering results, successful growth in Jetstar and the control of costs across the business. The introduction of the carbon tax drove up operating expenses by $106 million. Fuel costs reduced two per cent on prior year. This was driven by fleet modernisation and reconfiguration initiatives completed during the year. The average fuel price remained high, in line with prior year. The increase in net finance costs was driven by the full-year impact of the fleet renewal program15.
June June %Segment Performance Summary 2013 2012 Change Change
Qantas Domestic $M 365 463 (98) (21)Qantas International $M (246) (484) 238 49 Qantas Loyalty16 $M 260 231 29 13 Qantas Freight $M 36 45 (9) (20)Qantas Brands Eliminations $M 3 (6) 9 >100
Qantas Brands $M 418 249 169 68 Jetstar Group $M 138 203 (65) (32)Corporate/Unallocated $M (185) (191) 6 3 Eliminations $M 1 4 (3) (75)Underlying EBIT $M 372 265 107 40 Net Finance Costs $M (180) (170) (10) (6)Underlying PBT $M 192 95 97 102 All operating segments delivered profitable results, with the exception of Qantas International. The benefits from Qantas Transformation initiatives drove a steady improvement in the Qantas International Underlying EBIT toward a return to
14 The net passenger revenue benefit of $134 million is represented by $80 million for Qantas Domestic and $54 million for Qantas International. 15 The fleet renewal program was substantially completed in 2011/2012. 16 The Qantas Frequent Flyer segment was renamed Qantas Loyalty during the year.

QANTAS AIRWAYS LIMITED PRELIMINARY FINAL REPORT ABN: 16 009 661 901 YEAR ENDED 30 JUNE 2013
Page 4
Explanation of Results (continued) profit by 2014/2015. The Qantas and Emirates partnership announced in September 2012 and launched on 31 March 2013, will deliver substantial benefits. The Underlying EBIT result includes a $56 million adverse impact associated with transitioning Qantas’ European hub to Dubai. Qantas Domestic reported a resilient Underlying EBIT of $365 million despite intense competition and excess market capacity impacting yield and load. The Qantas Domestic result includes $77 million of carbon tax. Qantas Domestic achieved superior on-time performance17 for the fourth consecutive year and remains the domestic airline of choice for the corporate market supported by continuing network and product enhancements. Jetstar achieved a seven per cent increase in revenue while advancing its strategy of growth in Asia. Jetstar’s full-year Underlying EBIT of $138 million reflects the impact of domestic competitive pressures, $29 million of carbon tax and $50 million in associate start-up losses to position Jetstar for success in Asia through its Jetstar-branded airlines in Jetstar Japan, Jetstar Hong Kong and Jetstar Pacific. Overall, the Qantas Group’s domestic operations contributed more than $450 million to Underlying EBIT. Qantas Loyalty achieved a record18 full-year Underlying EBIT of $260 million, a 13 per cent improvement on last year. Partner expansion and new award and redemption opportunities have driven program membership up nine per cent, to 9.4 million members in 2012/2013, targeting 10 million members by June 2014. Qantas Freight Underlying EBIT of $36 million was down $9 million on last year. This was driven by reductions in Qantas International capacity, weaker domestic market conditions and the sale of StarTrack. Qantas Freight restructured its domestic business through the sale of StarTrack and the acquisition and integration of Australian air Express. Delivering on strategic priorities The Group’s objective is to deliver sustainable returns to shareholders by leveraging its portfolio of leading airline brands and loyalty program while being the first choice for customers in the markets we serve.
17 Source: BITRE July 2009-June 2013 18 Qantas Loyalty record Underlying EBIT result compared to prior periods normalised for changes in accounting estimates of the fair value of points
and breakage expectations effective 1 January 2009.

QANTAS AIRWAYS LIMITED PRELIMINARY FINAL REPORT ABN: 16 009 661 901 YEAR ENDED 30 JUNE 2013
Page 5
Explanation of Results (continued) The Qantas Group has made significant progress in delivering on its strategic priorities during the year.
- Strengthening the Group’s domestic position - Enhancing alliances, launch of Emirates partnership - Qantas Transformation delivering benefits - Growing Qantas Loyalty - Building Jetstar in Asia
Strengthening the Group’s domestic position The Group has maintained its leading network advantage through its profit maximising 65% domestic market share. The dual brand strategy of Qantas and Jetstar is working effectively to provide the right product and a margin advantage across the business, premium leisure and price-sensitive markets. Enhancing alliances, launch of Emirates partnership Qantas’ world leading airline partnership with Emirates was successfully launched on 31 March 2013. The partnership delivers on Qantas’ outstanding customer product offering and enables Qantas to provide its customers with 98 weekly services between Australia and Dubai. Dubai’s 24 hour hub provides seamless connections to over 175 destinations worldwide for Qantas customers. This has enabled the exit of loss making routes and the restructure of the Asian network. The Qantas and Emirates partnership continues to expand with joint network bookings across the trans-Tasman available from August 2013. Together, we will operate around 130 services per week from Auckland, Christchurch, Wellington and Queenstown to Australian east coast cities – then onwards to more than 65 destinations in the Middle East, North Africa and Europe. With increased dedicated capacity to Singapore and Hong Kong, enabling more same-day connectivity across Asia, Qantas International is well placed to better service the Asian market – the world’s fastest growing aviation market. Ongoing enhancement to the Asian code shares, including the expansion of the China Eastern partnership, will also deliver improved connectivity and reach into Asia. The gateway strategy extends beyond the Emirates Partnership and Asia:
• Daily flying into Dallas Fort Worth, with connections to American Airlines US domestic network. • Ongoing discussions with LATAM to strengthen Santiago as the gateway to South America, with TAM joining
oneworld in 2014. • Reaffirming our partnership with South African Airways, opening up southern Africa via Johannesburg.
Qantas Transformation delivering benefits Qantas Transformation initiatives delivered benefits to Underlying EBIT of $428 million in 2012/2013. This is made up of $171 million from strategic initiatives and additional benefits of $257 million through operational initiatives to offset the impact of inflation and improve unit cost. The Qantas Transformation strategic initiatives delivered in 2012/2013 include:
• The exit of loss making routes. • The completion of the reconfiguration program19 to improve product quality, consistency and fleet economics of
12 A380-800 and nine B747-400 aircraft. • The consolidation of engineering and catering facilities.
The Qantas Transformation is expected to deliver cumulative strategic benefits to Underlying EBIT of $300 million in 2013/2014. The aim is for Qantas International to be profitable in 2014/2015 and Qantas Brands to sustainably achieve cost of capital in the long-term. 19 Last aircraft completed in July 2013.

QANTAS AIRWAYS LIMITED PRELIMINARY FINAL REPORT ABN: 16 009 661 901 YEAR ENDED 30 JUNE 2013
Page 6
Explanation of Results (continued) Growing Qantas Loyalty Qantas Loyalty is generating its next wave of growth through the launch of Qantas Cash, loyalty services, the Qantas Frequent Flyer Toolbar and continues to leverage its existing loyalty program expertise through management of new client programs. Building Jetstar in Asia Jetstar has positioned its highly recognised brand to benefit from growth opportunities in the Asian market with the successful launch of Jetstar Japan, the development of Jetstar Hong Kong20 and the completion of Jetstar Pacific’s fleet renewal21. In March 2013 the Australian Competition and Consumer Commission granted approval to coordinate networks between the Asian-based Jetstar-branded airlines.
Jetstar Japan successfully launched in July 2012 with investors Mitsubishi, Japan Airlines and Century Tokyo Leasing Corporation. Since launch, it has carried 2 million passengers and is now the largest domestic low-cost carrier operating in Japan22. The fleet has grown to 13 aircraft and is expected to grow to 24 aircraft in the short to medium term. All of Jetstar Japan’s aircraft have been sourced by Qantas, demonstrating the flexibility of the Group’s fleet plan in supporting the Asian strategy. Jetstar Hong Kong’s application for regulatory approval is underway with China Eastern Airlines and the new local investor Shun Tak Holdings. The airline has built up a local management team, started pilot and cabin crew recruitment as well as advanced its Air Operators Certificate application. Regulatory approval is expected by end of calendar year 201320. The airline is planned to grow up to 18 aircraft within the medium term. Material Business Risks23 The aviation industry is subject to a number of inherent risks. These include, but are not limited to, exposure to changes in economic conditions, significant aviation incidents, changes in government regulations, fuel and foreign exchange volatility and other exogenous events such as natural disasters, war or epidemic. Qantas is subject to a number of specific business risks which may impact the achievement of the Group’s strategy and financial prospects:
• Competitive intensity ‐ Excess market capacity impacts industry profitability o Australia’s liberal aviation policy settings coupled with the strength of the Australian economy relative to
global economic weakness and the strong Australian dollar has attracted more offshore competitors to the Australian international aviation market including state sponsored airlines. Qantas is responding by building key strategic partnerships and maintaining a strong focus on improving the cost base through the transformation agenda. Qantas continues to leverage its considerable fleet flexibility to appropriately manage the international network.
o The Australian domestic aviation market has attracted increased competition in recent years. The resulting intensity of competition and risk of continued capacity growth in excess of demand is being mitigated by Qantas maintaining the 65% profit maximising domestic market share and executing Qantas Group’s dual brand strategy. This strategy leverages Qantas Domestic (including QantasLink) to serve business and premium leisure customers and Jetstar to serve price sensitive customers. Qantas Domestic is improving its cost base through its transformation initiatives and fleet renewal while Jetstar is working to maintain its low-cost leadership position.
• Jetstar-branded airlines in Asia ‐ The Jetstar-branded airlines being established across Asia (Jetstar Japan and
Jetstar Hong Kong) are in the start-up phase. The inherent risk associated with start-up operations, including obtaining necessary regulatory approvals, is being mitigated through selection of strong local partners, leveraging their strength in each market and sharing risk through appropriate equity structures.
20 Subject to regulatory approval. 21 Completed fleet transformation replacing its 737-400 fleet with A320-200 aircraft 18 January 2013. 22 Based on fleet size and domestic ASKs as at 22 August 2013, compared to Peach and Air Asia Japan. 23 An expanded discussion of material business risks has been provided following the introduction of ASIC Regulatory Guide 247 on Presentation of an
Operating and Financial Review in March 2013.

QANTAS AIRWAYS LIMITED PRELIMINARY FINAL REPORT ABN: 16 009 661 901 YEAR ENDED 30 JUNE 2013
Page 7
Explanation of Results (continued) Qantas mitigates the potential impact of risk on the Group’s financial prospects by maintaining a strong capital base to maintain creditor confidence, sustain future development of the business and maximise shareholder value. Qantas targets a capital structure consistent with an investment grade credit rating while maintaining adequate liquidity. The Group maintains access to a broad range of capital sources and the capacity to manage capital expenditure through a flexible fleet order book and processes to strategically prioritise investments and divest non-core assets. In addition, due to the size and complexity of the operations Qantas is also exposed to a number of other risks that may impact the Group:
• Industrial relations - The risk of industrial action relating to Qantas’ collective agreements with its employees is being mitigated through continuous stakeholder and employee engagement initiatives. The success of these programs is reflected through improving employee engagement scores.
• Continuity of critical systems ‐ Qantas operations depend on the continuous functioning of a number of information technology and communication services. Qantas has an extensive control and management framework to reduce the likelihood of outages, ensure early detection and to mitigate the impact.
Securing the future with financial discipline
- Positive net free cash flow24 of $372 million - Significant debt reduction - Prudent capital management - Strong liquidity position
June June %
Cash Flow Summary 2013 2012 Change ChangeOperating cash flows $M 1,417 1,810 (393) (22)Investing cash flows $M (1,045) (2,282) 1,237 54 Net free cash flow24 $M 372 (472) 844 >100 Financing cash flows $M (953) 370 (1,323) >100Effect of foreign exchange on cash $M 12 4 8 >100 Cash at period end $M 2,829 3,398 (569) (17) Qantas has strengthened its financial position during the period. Positive net free cash flows and an ongoing strong liquidity position supported an eight per cent reduction in net on balance sheet debt and continuing on-market share buy-back. Over $1.8 billion of debt and related hedging was repaid or refinanced during the year. Positive net free cash flow of $372 million was achieved for the period. This is the third consecutive half year of positive net free cash flow and reflects the Group’s continued focus on maintaining an investment grade credit rating25 by strengthening the balance sheet through disciplined capital management. Qantas invested $1.3 billion in its customer product and fleet during the year. Six new unencumbered aircraft were added to the fleet (three B737-800s and three A320-200s). In addition, several non-core assets were sold, including the Group’s interest in StarTrack and the Sydney Riverside and Cairns catering facilities. The Group continues to retain significant flexibility in its financial position, funding strategies and fleet plan to ensure that it can respond to changing market conditions and remain positioned for sustainable growth. The Group finished the period with a strong liquidity position including $2.8 billion in cash and $630 million in undrawn standby and revolving facilities. Qantas’ debt maturity profile was further extended during the period. The Group’s syndicated loan facility was refinanced and oversubscriptions were taken up increasing the facility to $550 million. In addition the Group issued $250 million of unsecured fixed rate notes with a maturity in 2020, with the proceeds being used to repay existing shorter-term debt.
24 Net free cash flow – Operating cash flows less investing cash flows. Net free cash flow is a measure of the amount of operating cash flows that are
available (i.e. after investing activities) to fund reductions in net debt or payments to shareholders. 25 Qantas is investment grade rated by both Moody’s (Baa2) and Standard & Poor’s (BBB-).

QANTAS AIRWAYS LIMITED PRELIMINARY FINAL REPORT ABN: 16 009 661 901 YEAR ENDED 30 JUNE 2013
Page 8
Explanation of Results (continued) June June %Debt and Gearing Analysis 2013 2012 Change Change
Net on balance sheet debt26 $M 3,226 3,507 281 8 Net Debt including operating lease liabilities27 $M 4,819 5,367 548 10 Adjusted Equity28 $M 5,654 5,559 95 2 Gearing Ratio29 46:54 49:51 3pts 6
Fleet The Qantas Group remains committed to a fleet strategy that provides for long-term fleet renewal, simplification and disciplined growth. The fleet strategy is designed to support the strategic objectives of the Group’s two flying brands, whilst retaining significant flexibility to respond to changes in market conditions. At 30 June 2013, the Qantas Group fleet, including Jetstar Asia, Qantas Freight and Network Aviation, comprised 312 aircraft. During 2012/2013 the Group purchased 17 aircraft (including four purchased ex-lease) and leased 11 aircraft:
• Qantas – seven B737-800s (owned), one A330-200 (leased), three Bombardier Q400s (owned) and four B767-300s (purchased ex-lease).
• Jetstar (including Jetstar Asia) – 13 A320-200s (three owned and 10 leased). The Group removed 20 aircraft from service during the year including nine lease returns. This included five B747-400s, three B767-300s, six B737-400s and six A320-200s. The Qantas Group’s scheduled passenger fleet average age is now 7.9 years, the lowest average age since privatisation. The benefits of fleet investment include improved customer satisfaction, environmental outcomes, improving yields, operational efficiencies and cost reductions. Qantas Domestic
- Clear profit leader in the domestic market - Strengthening domestic market position despite challenging competitive environment - Superior on-time performance - Record levels of consistent customer satisfaction - Enhancing regional and charter offering
Qantas Domestic Underlying EBIT of $365 million for the year ended 30 June 2013 was $98 million down from the prior year.
The reduction in Underlying EBIT was driven by the introduction of the carbon tax and capacity growth in the Australian domestic market of eight per cent30, exceeding market demand. This challenging competitive environment resulted in reduced loads and weaker yields. 26 Net on balance sheet debt includes interest-bearing liabilities and the fair value of hedges related to debt less cash, cash equivalents and aircraft
security deposits. 27 Net debt including operating lease liabilities includes net on balance sheet debt and off balance sheet aircraft operating lease liabilities. Operating
lease liabilities are measured as the present value of minimum lease payments for aircraft operating leases which, in accordance with AASB 117: Leases, is not recognised on balance sheet. This operating lease liability has been calculated in accordance with Standard and Poor’s methodology using an assumed interest rate of nine per cent.
28 Adjusted equity includes Equity adjusted to exclude hedge reserves, defined benefit superannuation prepayments (net of deferred tax) and to include any vested benefit surplus / deficit of defined benefit superannuation plans (net of deferred tax).
29 Gearing Ratio is net debt including operating lease liability to net debt including operating lease liability and adjusted equity. The gearing ratio is used by management to represent the Qantas Group’s debt obligation including obligations under operating leases.
30 BITRE July 2012 to June 2013
June June %2013 2012 Change Change
Total Revenue and Other Income $M 6,218 6,063 155 3 Revenue Seat Factor % 75.9 77.7 (1.8) pts (2)Underlying EBIT $M 365 463 (98) (21)

QANTAS AIRWAYS LIMITED PRELIMINARY FINAL REPORT ABN: 16 009 661 901 YEAR ENDED 30 JUNE 2013
Page 9
Explanation of Results (continued) Qantas Domestic’s comparable unit cost31 improved three per cent on last year. Cost savings included transformation benefits associated with the consolidation of the Tullamarine Heavy Maintenance base into the Brisbane facility, consolidation of engineering support functions, improved fleet economics, rationalisation of catering facilities and other program initiatives. Domestic customer satisfaction and advocacy is at its highest consistent levels and the net promoter score is at its highest level since recording commenced in August 2008. Qantas Domestic was recognised through a number of industry awards:
• ‘Best Domestic Airline’32 four years running • ‘Regional Airline of the Year’33 • ‘Best Regional Airline’34 • ‘Best Australian Lounges’35
Qantas has achieved superior on time performance for the last four years36. Qantas strengthened its customer proposition through investing in a number of customer product enhancements in the year. This included the expansion of in-seat entertainment across the domestic network37 and completion of the B767-300 fleet refurbishment, including Q-Streaming in-flight entertainment. Qantas continues to be the clear choice for business travellers and has maintained its corporate market revenue share. Qantas continues to support the regional market position through QantasLink and Network Aviation services securing significant corporate charter contracts in the year. QantasLink took delivery of three Bombardier Q400 aircraft during the year and announced a further three Bombardier Q400 and five leased B717-200 aircraft to join the network from the second half of 2013. Qantas International
- Steady improvement in Underlying EBIT - Qantas Transformation initiatives delivering unit cost improvements - Successful launch of the Qantas Emirates partnership providing a substantially enhanced customer offering - Highest customer satisfaction on record38
June June %2013 2012 Change Change
Total Revenue and Other Income $M 5,496 5,770 (274) (5) Revenue Seat Factor % 81.6 82.1 (0.5) pts (1)Underlying EBIT $M (246) (484) 238 49 Qantas International Underlying EBIT loss of $(246) million for the year represents a $238 million (or 49 per cent) improvement on the prior year. The improved result reflects ongoing transformation benefits. Cost saving initiatives include the consolidation of heavy maintenance facilities and the exit of loss making routes (including the Singapore to Frankfurt service) which enabled retirement of older B747-400 aircraft. These combined benefits have delivered a comparable unit cost39 improvement of five per cent compared to prior year. Productivity and cost benefits have more than offset the impact that increased 31 Comparable Unit Cost–net Underlying Unit Cost adjusted for the impact of Industrial Action (2011/2012), Boeing settlement, change in estimate of
passenger revenue received in advance (2012/2013) , carbon tax (2012/2013) and movements in average sector length. 32 Australian Federation of Travel Agents National Industry Awards 2010-2013. 33 Air Transport World Awards 2012. 34 Australian Traveller Magazine Awards 2012. 35 Australian Business Traveller Magazine Awards 2012. 36 BITRE July 2010 to June 2013. 37 Twenty B737-800 aircraft delivered by 30 June 2013 including in-seat entertainment. Available on selected routes. 38 Annual average calendar year customer satisfaction. Qantas started recording customer satisfaction in 2003. 39 Comparable unit cost – Net Underlying Unit Cost adjusted for the impact of Industrial Action (2011/2012) and Boeing settlement (2012/2013),
change in estimate of passenger revenue received in advance (2012/2013) and movements in average sector length.

QANTAS AIRWAYS LIMITED PRELIMINARY FINAL REPORT ABN: 16 009 661 901 YEAR ENDED 30 JUNE 2013
Page 10
Explanation of Results (continued) competition has had on industry wide fares. International market capacity in and out of Australia grew by five per cent40 during the year. Significant improvement to Qantas’ international product resulted in increased customer advocacy and record customer satisfaction38. A range of business inflight customer enhancements were introduced, including the sleeper service, a new menu offering and select on Q-Eat. The launch of the Qantas Emirates partnership coincided with the roll out of chauffeur drive and Dubai connect. The completion of the B747-400 reconfiguration program has also ensured that customer satisfaction on these services is on par with the A380-800 product. The new Singapore premium lounge was opened, offering an enhanced customer experience. Jetstar
- Strong position in attractive growth markets - Best low-cost carrier Australia-Pacific41 - Continued growth in ancillary revenue per passenger - Unit cost42 improvement - Building a strong brand across Asia - Leading low-cost technology and customer offering
June June %2013 2012 Change Change
Total Revenue and Other Income $M 3,288 3,076 212 7 Seat Factor % 79.1 79.2 (0.1) pts (0.1) Underlying EBIT $M 138 203 (65) (32)
Jetstar Underlying EBIT for year ended 30 June 2013 was $138 million, down $65 million from the prior corresponding period. The decline in earnings was primarily driven by start-up losses from Jetstar Japan and Jetstar Hong Kong, introduction of the carbon tax and excessive domestic market capacity. Jetstar’s revenue growth has been supported by increased capacity (seven per cent) and passengers (nine per cent), coupled with Jetstar’s continued focus on ancillary revenue. Jetstar has been profitable every year since launch and awarded best low-cost carrier in Australia-Pacific41 for the third consecutive year. Jetstar continued to grow its ancillary revenue per passenger (up five per cent43). Jetstar improved unit cost42 by three per cent compared to last year retaining its low-cost carrier margin advantage. Jetstar Asia continues to build a strong brand with 10 per cent passenger growth in an increasingly competitive market. Jetstar Asia delivered its second consecutive year of profitability44. Jetstar Pacific has successfully completed its fleet renewal program. It is now flying five A320-200s with an average fleet age of eight years. This has delivered a significant improvement in fleet economics, resulting in unit cost improvement. Jetstar Pacific has planned growth to 15 aircraft by financial year 2016/2017. Jetstar will be the first low-cost carrier in the Asia-Pacific to fly the B787-8 Dreamliner, with the first flight planned by the end of the 2013 calendar year. There are currently seven A320-200s across the Jetstar-branded airlines fitted with fuel-saving sharklets.
40 BITRE July 2012 to June 2013 41 SKYTRAX Awards 2013 – Jetstar Airways. 42 Unit cost – Jetstar unit cost is measured using controllable unit cost in line with industry benchmarks for low-cost carriers. Controllable unit cost is
measured as total expenses excluding fuel per ASK. Expenses relating to carbon tax, Jetstar Asia and Jetstar-branded associates are excluded to aid comparability between reporting periods.
43 Jetstar ancillary revenue excluding Jetstar Asia and Jetstar-branded associates. 44 Underlying EBIT contribution to Jetstar Group result.

QANTAS AIRWAYS LIMITED PRELIMINARY FINAL REPORT ABN: 16 009 661 901 YEAR ENDED 30 JUNE 2013
Page 11
Explanation of Results (continued) Qantas Loyalty
- Record45 Underlying EBIT of $260 million, up 13 per cent on the prior year - Member growth of nine per cent to 9.4 million members - 5.6 million awards redeemed, up 10 per cent - Billings up to $1.2 billion - Qantas Cash launching - Net promoter score at record high46
June June %2013 2012 Change Change
Members M 9.4 8.6 0.8 9 Awards Redeemed M 5.6 5.1 0.5 10 Underlying EBIT $M 260 231 29 13
Qantas Loyalty achieved another record45 result with a 13 per cent improvement in Underlying EBIT to $260 million. This has been driven by strong billings, record member engagement46 and continued member growth to 9.4 million members. Redemptions grew 10 per cent driven by a 33 per cent increase in store awards due to Auto Rewards and new redemption options. New options include charitable redemptions to UNICEF, David Jones Gift Cards, digital gift cards (including Myer, JB Hi-Fi, Jetstar, iTunes) and popular additions to the technology range. Redemption margins increased following improvements to supply chain following the Wishlist acquisition. Qantas Cash was announced in the year and is due to launch in 2013. In addition to faster, smarter check-in, boarding and lounge access, the prepaid multi-currency travel card will give members new ways to earn points and the ability to hold up to nine different currencies on one card. During the year, Emirates and Malaysian Airlines were welcomed to Qantas’ airline partner network. The addition of Emirates gives Qantas frequent flyer members the ability to redeem points for 175 worldwide destinations across the Qantas and Emirates network. Members’ tier status is recognised with both airlines when flying on the Qantas-Emirates network and Gold members (or above) have access to global Qantas and Emirates lounges. Qantas Loyalty expanded its international hotel group partners with the introduction of Jumeirah Hotel Group and Atlantis The Palm Hotel, two of the largest hotel groups in Dubai. New financial card products were launched with David Jones, Westpac and Macquarie Bank. Qantas Freight
- Increased revenue in a competitive environment - Acquisition and integration of Australian air Express - Sale of StarTrack
June June %2013 2012 Change Change
Total Revenue and Other Income $M 1,056 1,013 43 4 Revenue Load Factor47 % 56.2 53.5 2.7 pts 5 Underlying EBIT $M 36 45 (9) (20) Qantas Freight’s Underlying EBIT was $36 million, down $9 million on last year. This was driven by a 11 per cent reduction in international freight capacity, mostly resulting from Qantas International network changes, partially offset by a three per cent international yield improvement48 and implementation of the Emirates SkyCargo partnership. 45 Qantas Loyalty record Underlying EBIT result compared to prior periods normalised for changes in accounting estimates of the fair value of points
and breakage expectations effective 1 January 2009. 46 Net promoter score is at its highest level since reporting started in 2008. 47 Revenue Load Factor – Revenue Freight Tonne Kilometre (RFTK) over Available Freight Tonne Kilometre (AFTK). 48 International freight revenue per AFTK, excluding FX

QANTAS AIRWAYS LIMITED PRELIMINARY FINAL REPORT ABN: 16 009 661 901 YEAR ENDED 30 JUNE 2013
Page 12
Explanation of Results (continued) In November 2012, Qantas Freight sold its share in StarTrack, resulting in a $30 million gain on sale (reflected in net profit on disposal of investment excluded from Underlying EBIT) and acquired the remaining share of Australian air Express. The integration of Australian air Express is now underway, with expected completion in the 2013/2014 year, delivering significant synergies and creating Australia’s leading independent air freight provider. The consolidation of Australian air Express contributed to the increase in revenue in the year. Reconciliation of Underlying PBT to Statutory PBT The full-year ended 30 June 2013 Statutory PBT of $17 million is a substantial turnaround from a loss of $349 million in the prior period. Underlying PBT Underlying PBT is the primary reporting measure used by the Qantas Group’s chief operating decision-making bodies, being the Chief Executive Officer, Group Management Committee and the Board of Directors, for the purpose of assessing the performance of the Group. The primary reporting measure of the Qantas International, Qantas Domestic, Jetstar Group, Qantas Loyalty and Qantas Freight operating segments is Underlying EBIT. The primary reporting measure of the Corporate/Unallocated segment is Underlying PBT as net finance costs are managed centrally. Underlying PBT is derived by adjusting Statutory PBT for the impacts of AASB 139 Financial Instruments: Recognition and Measurement (AASB 139) which relate to other reporting periods and identifying certain other items which are not included in Underlying PBT. June June %Reconciliation of Underlying to Statutory PBT 2013 2012 Change ChangeUnderlying PBT $M 192 95 97 >100 Items not included in Underlying PBT - AASB 139 mark-to-market movements relating to
other reporting periods $M 32 (46) 78 >100
Items not included in Underlying PBT - Net impairment of property, plant and equipment $M (86) (147) 61 41 - Redundancies and restructuring $M (118) (203) 85 42 - Net impairment of investments $M 2 (19) 21 >100 - Impairment of goodwill and other intangible assets $M (24) (18) (6) (33)- Write down of inventory $M (4) (13) 9 69 - Net profit on disposal of investment $M 30 - 30 100 - Other $M (7) 2 (9) >(100)Total items not included in Underlying PBT $M (175) (444) 269 61 Statutory PBT $M 17 (349) 366 >100 AASB 139 mark-to-market movements relating to other reporting periods All derivative transactions undertaken by the Qantas Group represent economic hedges of underlying risk and exposures. The Qantas Group does not enter into speculative derivative transactions. Notwithstanding this, AASB 139 requires certain mark-to-market movements in derivatives which are classified as ’ineffective’ to be recognised immediately in the Consolidated Income Statement. The recognition of derivative valuation movements in reporting periods which differ from the designated transaction causes volatility in statutory profit that does not reflect the hedging nature of these derivatives. Underlying PBT reports all hedge derivative gains and losses in the same reporting period as the underlying transaction by adjusting the reporting period’s statutory profit for derivative mark-to-market movements that relate to underlying exposures in other reporting periods.

QANTAS AIRWAYS LIMITED PRELIMINARY FINAL REPORT ABN: 16 009 661 901 YEAR ENDED 30 JUNE 2013
Page 13
Explanation of Results (continued) All derivative mark-to-market movements which have been excluded from Underlying PBT will be recognised through Underlying PBT in future periods when the underlying transaction occurs. Other items not included in Underlying PBT Items which are identified by Management and reported to the chief operating decision-making bodies as not representing the underlying performance of the business are not included in Underlying PBT. The determination of these items is made after consideration of their nature and materiality and is applied consistently from period to period. Items not included in Underlying PBT primarily result from major transformational/restructuring initiatives, transactions involving investments and impairments of assets outside the ordinary course of business. Items not included in Underlying PBT in the 2012/2013 year were driven by the Qantas Transformation. Costs include aircraft impairment due to early retirement following strategic network changes, further consolidation of engineering and catering facilities, the integration of Australian air Express offset by the gain on sale of the StarTrack joint venture in October 2012.
ASIC GUIDANCE The Preliminary Final Report has been prepared in accordance with ASX Listing Rule 4.3A and has been derived from the unaudited Annual Financial Report. In December 2011, ASIC issued Regulatory Guide 230. To comply with this Guide, Qantas is required to make a clear statement about whether information disclosed in documents other than the financial report has been audited or reviewed in accordance with Australian Auditing Standards. In line with previous years and in accordance with the Corporations Act 2001, the Review of Operations is unaudited. The Review of Operations contains disclosures which are extracted or derived from the Annual Financial Report for the year ended 30 June 2013, which is being audited and is expected to be made available in September 2013. OTHER INFORMATION June 2013
$ June 2012
$ Net Tangible Assets per ordinary share 2.34 2.33
The information provided in this report contains all the information required by ASX Listing Rule 4.3A.

QANTAS AIRWAYS LIMITED PRELIMINARY FINAL REPORT ABN: 16 009 661 901 YEAR ENDED 30 JUNE 2013
Page 14
CONSOLIDATED INCOME STATEMENT For the year ended 30 June 2013 June 2013 June 2012 Note $M $MRevenue and other income Net passenger revenue 13,673 13,625Net freight revenue 935 903Other 3 1,294 1,196
15,902 15,724
Expenditure Manpower and staff related 3,825 3,774Fuel 4,154 4,220Aircraft operating variable 3,066 2,980Depreciation and amortisation 1,450 1,384Non-cancellable aircraft operating lease rentals 525 549Share of net loss/(profit) of associates and jointly controlled entities
39 (3)
Other 3 2,639 2,993
15,698 15,897
Statutory profit/(loss) before income tax expense and net finance costs
204 (173)
Finance income 109 181Finance costs (296) (357)
Net finance costs (187) (176)
Statutory profit/(loss) before income tax expense 17 (349)
Income tax (expense)/benefit (11) 105
Statutory profit/(loss) for the year 6 (244)
Attributable to: Members of Qantas 5 (245)Non-controlling interests
1 1
Statutory profit/(loss) for the year 6 (244)
Statutory profit/(loss) per share attributable to members of Qantas:
Basic/diluted profit/(loss) per share (cents) 0.2 (10.8)
The above Consolidated Income Statement should be read in conjunction with the accompanying notes.

QANTAS AIRWAYS LIMITED PRELIMINARY FINAL REPORT ABN: 16 009 661 901 YEAR ENDED 30 JUNE 2013
Page 15
CONSOLIDATED STATEMENT OF COMPREHENSIVE INCOME For the year ended 30 June 2013 June 2013 June 2012 $M $M Statutory profit/(loss) for the year 6 (244)
Effective portion of changes in fair value of cash flow hedges, net of tax 111 (42) Transfer of hedge reserve to the Consolidated Income Statement, net of tax1
(50) (89)
Recognition of effective cash flow hedges on capitalised assets, net of tax 21 92 Foreign currency translation of controlled entities 10 3 Foreign currency translation of associates (1) 4
Other comprehensive income/(loss) for the year 91 (32)
Total comprehensive income/(loss) for the year2 97 (276)
Total comprehensive income/(loss) attributable to: Members of Qantas 96 (277) Non-controlling interests 1 1
Total comprehensive income/(loss) for the year 97 (276)
1 These amounts were allocated to revenue of $(59) million (2012: $(13) million), fuel expenditure of $(8) million (2012: $(116) million), finance costs of $nil (2012: $3 million), other costs of $(4) million (2012: $nil) and income tax expense of $21 million (2012: $37 million) in the Consolidated Income Statement. 2 All items included in other comprehensive income may be reclassified to profit or loss in the future. The above Consolidated Statement of Comprehensive Income should be read in conjunction with the accompanying notes.

QANTAS AIRWAYS LIMITED PRELIMINARY FINAL REPORT ABN: 16 009 661 901 YEAR ENDED 30 JUNE 2013
Page 16
CONSOLIDATED BALANCE SHEET As at 30 June 2013 June 2013 June 2012 $M $M Current assets Cash and cash equivalents 2,829 3,398 Receivables 1,436 1,111 Other financial assets 180 88 Inventories 364 376 Assets classified as held for sale 42 73 Other 394 414
Total current assets 5,245 5,460
Non-current assets Receivables 174 472 Other financial assets 27 17 Investments accounted for using the equity method 190 457 Property, plant and equipment 13,827 14,139 Intangible assets 714 610 Other 23 23
Total non-current assets 14,955 15,718
Total assets 20,200 21,178
Current liabilities Payables 1,859 1,876 Revenue received in advance 3,032 3,172 Interest-bearing liabilities 835 1,119 Other financial liabilities 86 369 Provisions 558 570 Liabilities classified as held for sale - 12
Total current liabilities 6,370 7,118
Non-current liabilities Revenue received in advance 1,186 1,136 Interest-bearing liabilities 5,245 5,430 Other financial liabilities 54 224 Provisions 718 737 Deferred tax liabilities 673 644
Total non-current liabilities 7,876 8,171
Total liabilities 14,246 15,289
Net assets 5,954 5,889
Equity Issued capital 4,693 4,729 Treasury shares (43) (42) Reserves 128 36 Retained earnings 1,171 1,162
Equity attributable to the members of Qantas 5,949 5,885 Non-controlling interests 5 4
Total equity 5,954 5,889
The above Consolidated Balance Sheet should be read in conjunction with the accompanying notes.
QANTAS AIRWAYS LIMITED PRELIMINARY FINAL REPORT ABN: 16 009 661 901 YEAR ENDED 30 JUNE 2013
Page 17
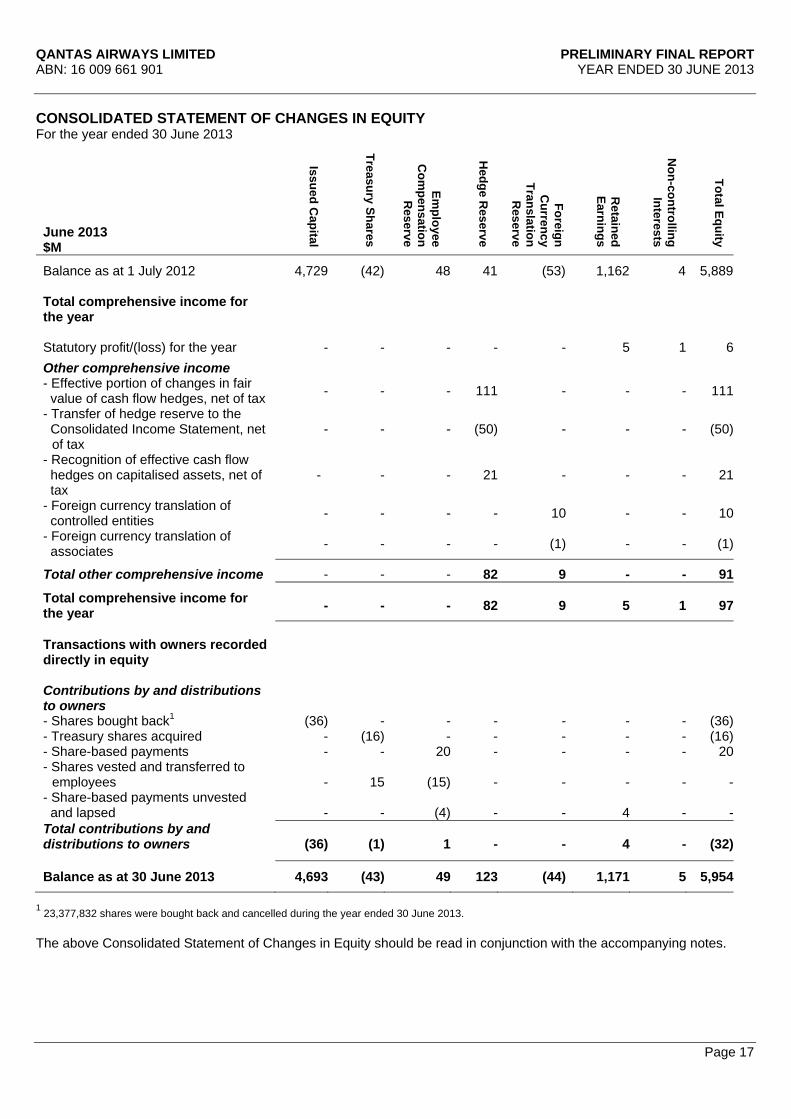
CONSOLIDATED STATEMENT OF CHANGES IN EQUITY For the year ended 30 June 2013
June 2013 $M
Issued Capital
Treasury Shares
Employee
Com
pensation R
eserve
Hedge R
eserve
Foreign C
urrency Translation
Reserve
Retained
Earnings
Non-controlling
Interests
Total Equity
Balance as at 1 July 2012 4,729 (42) 48 41 (53) 1,162 4 5,889 Total comprehensive income for the year Statutory profit/(loss) for the year - - - - - 5 1 6Other comprehensive income - Effective portion of changes in fair value of cash flow hedges, net of tax - - - 111 - - - 111
- Transfer of hedge reserve to the Consolidated Income Statement, net --of tax
- - - (50) - - - (50)
- Recognition of effective cash flow hedges on capitalised assets, net of tax
- - - 21 - - - 21
- Foreign currency translation of controlled entities - - - - 10 - - 10
- Foreign currency translation of associates - - - - (1) - - (1)
Total other comprehensive income - - - 82 9 - - 91
Total comprehensive income for the year - - - 82 9 5 1 97
Transactions with owners recorded directly in equity Contributions by and distributions to owners - Shares bought back1 (36) - - - - - - (36)- Treasury shares acquired - (16) - - - - - (16)- Share-based payments - - 20 - - - - 20- Shares vested and transferred to --employees - 15 (15) - - - - -- Share-based payments unvested and lapsed - - (4) - - 4 - -Total contributions by and distributions to owners (36) (1) 1 - - 4 - (32)
Balance as at 30 June 2013 4,693 (43) 49 123 (44) 1,171 5 5,954
1 23,377,832 shares were bought back and cancelled during the year ended 30 June 2013.
The above Consolidated Statement of Changes in Equity should be read in conjunction with the accompanying notes.

QANTAS AIRWAYS LIMITED PRELIMINARY FINAL REPORT ABN: 16 009 661 901 YEAR ENDED 30 JUNE 2013
Page 18
CONSOLIDATED STATEMENT OF CHANGES IN EQUITY For the year ended 30 June 2013
June 2012 $M
Issued Capital
Treasury Shares
Employee
Com
pensation R
eserve
Hedge R
eserve
Foreign C
urrency Translation
Reserve
Retained
Earnings
Non-controlling
Interests
Total Equity
Balance as at 1 July 2011 4,729 (72) 65 80 (60) 1,405 4 6,151
Total comprehensive income for the year
Statutory profit/(loss) for the year - - - - - (245) 1 (244)
Other comprehensive income - Effective portion of changes in fair value of cash flow hedges, net of tax - - - (42) - - - (42)
- Transfer of hedge reserve to the Consolidated Income Statement, net -of tax
- - - (89) - - - (89)
- Recognition of effective cash flow hedges on capitalised assets, net of tax
- - - 92 - - - 92
- Foreign currency translation of controlled entities - - - - 3 - - 3
- Foreign currency translation of associates - - - - 4 - - 4
Total other comprehensive (loss)/ income - - - (39) 7 - - (32)
Total comprehensive (loss)/income for the year - - - (39) 7 (245) 1 (276)
Transactions with owners recorded directly in equity
Contributions by and distributions to owners
- Treasury shares acquired - (16) - - - - - (16)- Share-based payments - - 31 - - - - 31- Shares vested and transferred to --employees - 46 (46) - - - - -
- Share-based payments unvested and lapsed - - (2) - - 2 - -
- Dividends declared - - - - - - (1) (1)Total contributions by and distributions to owners - 30 (17) - - 2 (1) 14
Balance as at 30 June 2012 4,729 (42) 48 41 (53) 1,162 4 5,889
The above Consolidated Statement of Changes in Equity should be read in conjunction with the accompanying notes.

QANTAS AIRWAYS LIMITED PRELIMINARY FINAL REPORT ABN: 16 009 661 901 YEAR ENDED 30 JUNE 2013
Page 19
CONSOLIDATED CASH FLOW STATEMENT For the year ended 30 June 2013 June 2013 June 2012 $M $M Cash flows from operating activities Cash receipts in the course of operations 16,582 16,699 Cash payments in the course of operations (15,185) (14,795) Interest received 110 170 Interest paid (229) (285) Dividends received from associates and jointly controlled entities 142 22 Income taxes (paid)/refunded (3) (1)
Net cash from operating activities 1,417 1,810
Cash flows from investing activities Payments for property, plant and equipment and intangible assets (1,247) (2,129) Net payments for aircraft assigned to associates1 (12) (92) Interest paid and capitalised on qualifying assets (61) (83) Proceeds from disposal of property, plant and equipment 32 54 Net proceeds from repayment of loans receivable from jointly controlled entities
125 -
Proceeds from sale and operating leaseback of non-current assets 8 12 Proceeds from disposal of controlled entity, net of cash disposed 18 - Proceeds from disposal of jointly controlled entities 189 - Payments for the acquisition of controlled entities, net of cash acquired
(24) (11)
Payments for investments in associates and jointly controlled entities (73) (33)
Net cash used in investing activities (1,045) (2,282)
Cash flows from financing activities Payments for shares bought back2 (36) - Payments for treasury shares (16) (16) Proceeds from borrowings 846 688 Repayments of borrowings (1,494) (566) Proceeds from sale and finance leaseback of non-current assets 83 283 Net payments for aircraft security deposits and hedges related to debt (336) (18) Dividends paid to non-controlling interests - (1)
Net cash (used in)/from financing activities (953) 370
Net decrease in cash and cash equivalents held (581) (102)
Cash and cash equivalents at the beginning of the year 3,398 3,496
Effects of exchange rate changes on cash and cash equivalents 12 4
Cash and cash equivalents at the end of the year 2,829 3,398
1 Net payments for aircraft assigned to Jetstar Japan Co., Ltd and Jetstar Hong Kong Airways Limited. 2 23,377,832 shares were bought back and cancelled during the year ended 30 June 2013. The above Consolidated Cash Flow Statement should be read in conjunction with the accompanying notes.

QANTAS AIRWAYS LIMITED PRELIMINARY FINAL REPORT ABN: 16 009 661 901 YEAR ENDED 30 JUNE 2013
Page 20
NOTES TO THE PRELIMINARY FINAL REPORT For the year ended 30 June 2013 Note 1. Statement of Significant Accounting Policies (a) Statement of Compliance The Preliminary Final Report (the Report) has been prepared in accordance with Australian Accounting Standards (AASBs) adopted by the Australian Accounting Standards Board and the Corporations Act 2001. The Annual Financial Report also complies with International Financial Reporting Standards (IFRSs) and interpretations adopted by the International Accounting Standards Board. The Report is presented in Australian dollars, which is the functional currency of Qantas Airways Limited (Qantas) and its controlled entities (the Qantas Group), and has been prepared on the basis of historical cost except in accordance with relevant accounting policies where assets and liabilities are stated at their fair values. Assets classified as held for sale are stated at the lower of carrying amount and fair value less cost to sell. The Annual Financial Report is in the process of being audited and is expected to be made available in September 2013. This Report should also be read in conjunction with any public announcements made by Qantas during the year in accordance with the continuous disclosure requirements arising under the Corporations Act 2001 and ASX Listing Rules. (b) Significant Accounting Policies The accounting policies applied by the Qantas Group in this Report are the same as those applied by the Qantas Group in the Annual Financial Report for the year ended 30 June 2012. (c) Comparatives Where applicable, various comparative balances have been reclassified to align with current year presentation. From 1 July 2012, the Qantas Segment was restructured as two separate operating segments – Qantas Domestic and Qantas International. The presentation of the comparatives in Note 2 has been changed to reflect the current structure. In addition the Qantas Group reclassified amounts from Other revenue/income to Net passenger revenue and Net freight revenue as discussed in Note 3. Other reclassifications have no material impact on the Report. (d) Estimates The preparation of this Report requires Management to make judgements, estimates and assumptions that affect the application of accounting policies and the reported amounts of assets, liabilities, income and expenses. Actual results may differ from these estimates. In preparing this Report, the significant judgements made by Management in applying the Qantas Group’s accounting policies and the key sources of uncertainty in estimation were the same as those applied to the Annual Financial Report for the year ended 30 June 2012, except for: Change in Accounting Estimate - Passenger Revenue During the year a review was undertaken of the key judgements and estimates impacting the timing of revenue recognition and the measurement of revenue received in advance for tickets which have passed the ticketed travel date. To more appropriately align the Qantas Group’s revenue recognition and liability measurement estimates with ticket terms and conditions and historic experience, revenue increased by $134 million for the year ended 30 June 2013 through a reduction in revenue received in advance. Tickets that have passed the ticketed travel date will be recognised as revenue in accordance with these revised estimates based on the ticketed terms and conditions and historic experience.

QANTAS AIRWAYS LIMITED PRELIMINARY FINAL REPORT ABN: 16 009 661 901 YEAR ENDED 30 JUNE 2013
Page 21
NOTES TO THE PRELIMINARY FINAL REPORT For the year ended 30 June 2013 Note 1. Statement of Significant Accounting Policies (continued) (e) Carrying amount of non-financial assets (i) Assets classified as held for sale Non-current assets, or disposal groups comprising assets and liabilities, that are expected to be recovered primarily through sale rather than through continued use are classified as held for sale. Immediately before classification as held for sale, the measurement of the assets or components of a disposal group is remeasured in accordance with the Qantas Group’s accounting policies. Thereafter, the assets, or disposal group, are measured at the lower of carrying amount and fair value less costs to sell. Any impairment loss on a disposal group is first allocated to goodwill and then to remaining assets and liabilities on a pro-rata basis except that no loss is allocated to inventories, financial assets or deferred tax asset. Impairment losses on initial classification as held for sale and subsequent gains or losses on remeasurement are recognised in the Consolidated Income Statement. (ii) Cash generating units The carrying amounts of non-financial assets are reviewed at each balance date to determine whether there is any indication of impairment. If any such indication exists, the asset’s recoverable amount is estimated. For goodwill and intangible assets with indefinite lives, recoverable amounts are estimated each year. The recoverable amount of an asset is the greater of its fair value less costs to sell and its value in use. Assets which primarily generate cash flows as a group, such as aircraft, are assessed on a cash generating unit (CGU) basis, inclusive of related infrastructure and intangible assets and compared to net cash inflows for the CGU. Estimated net cash flows used in determining recoverable amount are discounted to their net present value using a pre-tax discount rate that reflects current market assessments of the time value of money and the risks specific to the assets. Identification of an asset’s CGU requires judgement, as it requires identification of the lowest aggregation of assets that generate largely independent cash inflows. In Management’s judgement, the lowest aggregation of assets, which give rise to CGUs as defined by AASB 136: Impairment of Assets are the Qantas Brands CGU and the Jetstar Group CGU. In the case of Qantas Brands, the management of this CGU is structured into four operating segments being Qantas Domestic, Qantas International, Qantas Loyalty and Qantas Freight (as set out in Note 2). The Qantas Brands’ aircraft fleet is considered a network asset of Qantas Brands. As a network asset, the aircraft fleet cannot be allocated at a lower level than the Qantas Brands CGU for impairment testing other than on an arbitrary basis. Accountability and business performance is managed at an operating segment level. However, decisions to acquire, dispose or utilise the fleet are made centrally, after considering the impact across all Qantas Brands operating segments with no single operating segment having decision rights. Accordingly, the Qantas Brands CGU, which includes the aircraft fleet and other supporting assets of the Qantas Brands operating segments, is the smallest group of assets that generates cash inflows that are largely independent of cash inflows from other groups of assets (namely the Jetstar Group CGU). That is, the cash inflows of the Qantas Domestic, Qantas International, Qantas Loyalty and Qantas Freight segments as reported in Note 2 cannot be generated without the Qantas Brands aircraft fleet and other supporting assets.
QANTAS AIRWAYS LIMITED PRELIMINARY FINAL REPORT ABN: 16 009 661 901 YEAR ENDED 30 JUNE 2013
Page 22
NOTES TO THE PRELIMINARY FINAL REPORT For the year ended 30 June 2013 Note 2. Underlying PBT and Operating Segments (a) Underlying PBT Underlying PBT is the primary reporting measure used by the Qantas Group’s chief operating decision-making bodies, being the Chief Executive Officer, Group Management Committee and the Board of Directors, for the purpose of assessing the performance of the Qantas Group. The primary reporting measure of the Qantas Domestic, Qantas International, Qantas Loyalty, Qantas Freight and Jetstar Group operating segments is Underlying EBIT. The primary reporting measure of the Corporate segment is Underlying PBT as net finance costs are managed centrally and are not allocated to Qantas Domestic, Qantas International, Qantas Loyalty, Qantas Freight and Jetstar Group operating segments. Refer to Note 2(d) for a detailed description of Underlying PBT and a reconciliation of Statutory profit/(loss) before tax to Underlying PBT. (b) Operating Segments From 1 July 2012, the Qantas Segment was restructured as two separate operating segments – Qantas Domestic and Qantas International. The presentation of the comparatives has been changed to reflect the current structure. The Qantas Group comprises the following operating segments: Qantas Brands Qantas Domestic, Qantas International, Qantas Loyalty and Qantas Freight operating segments are collectively referred to as Qantas Brands. Qantas Brands is a CGU comprising those operations of the Qantas Group which are dependent on the Qantas fleet and the Qantas Brand to collectively generate cash inflows and derive value. To drive business focus, assign accountability and monitor performance, the Qantas Brands operations are managed through four operating segments. This management approach has not involved separating the operating segments into stand alone entities or implying the capital structuring or transactions that would be required for such a separation. The Qantas fleet and the Qantas Brand together support all the operating segments within Qantas Brands. In order to set targets and assess the performance, including accountability of the operating segments (as measured by Underlying EBIT), Qantas Domestic and Qantas International report depreciation expense for passenger aircraft and Qantas Freight reports depreciation expense for freighters.
- Qantas Domestic The Australian domestic passenger flying business of Qantas Brands.
- Qantas International The International passenger flying business of Qantas Brands.
- Qantas Loyalty Operates the Qantas customer loyalty program for Qantas Brands (Qantas Frequent Flyer) as well as other marketing services, loyalty and recognition programs.
- Qantas Freight The air cargo and express freight business of Qantas Brands. Jetstar Group
The Jetstar Group are those operations of the Qantas Group which are dependent on the Jetstar fleet and the Jetstar Brand being the Jetstar passenger flying businesses (including Jetstar Group’s investments in Jetstar branded airlines in Asia).
Corporate/Unallocated
Costs associated with the centralised management and governance of the Qantas Group, together with certain items which are not allocated to business segments and other businesses of the Qantas Group which are not considered to be significant reportable segments are reported in Corporate/Unallocated.

QANTAS AIRWAYS LIMITED PRELIMINARY FINAL REPORT ABN: 16 009 661 901 YEAR ENDED 30 JUNE 2013
Page 23
NOTES TO THE PRELIMINARY FINAL REPORT For the year ended 30 June 2013 Note 2. Underlying PBT and Operating Segments (continued)
(c) Analysis by Operating Segment1
June 2013 $M
Qantas
Dom
estic
Qantas
International
Qantas
Loyalty
Qantas
Freight
Eliminations
Total Qantas
Brands
2
Jetstar Group
Corporate /
Unallocated
6
Eliminations
Consolidated
Revenue and other income
External segment revenue3,4 5,731
4,821 1,096 1,048 9 12,705 3,129 71 (3) 15,902
Intersegment revenue 487
675 109 8 (1,167) 112 159 (70) (201) -
Total segment revenue and other income 6,218
5,496 1,205 1,056 (1,158) 12,817 3,288 1 (204) 15,902
Share of net profit/(loss) of associates and jointly controlled entities5 5
4 - 2 - 11 (50) - - (39)Underlying EBITDAR7 1,147 495 263 66 3 1,974 543 (171) 1 2,347Non-cancellable operating lease rentals (163)
(68) - (5) - (236) (289) - - (525)
Depreciation and amortisation (619)
(673) (3) (25) - (1,320) (116) (14) - (1,450)
Underlying EBIT 365 (246) 260 36 3 418 138 (185) 1 372
Underlying net finance costs
(180) (180)
Underlying PBT (365) 192
1 Qantas Domestic, Qantas International, Qantas Loyalty, Qantas Freight, Jetstar Group and Corporate/Unallocated are the operating segments of the Qantas Group. 2 Qantas Brands is a CGU comprising those operations of the Qantas Group which are dependent on the Qantas fleet and the Qantas brand to collectively generate cash inflows and derive value. Qantas Brands is managed through four operating segments being Qantas Domestic, Qantas International, Qantas Loyalty and Qantas Freight. 3 Includes settlement income of $125 million following the restructure of the Boeing 787 aircraft delivery schedule (reported equally across Qantas Domestic, Qantas International and Jetstar Group). 4 External segment revenue includes the impact of the change in accounting estimates - passenger revenue of $134 million (Qantas Domestic $80
million and Qantas International $54 million) as described in Note 1(d). 5 Qantas Domestic and Qantas International’s share of net profit/(loss) of associates and jointly controlled entities amounts to $4.5 million and $4.5
million respectively. 6 Corporate/Unallocated is the only operating segment with Underlying PBT as the primary reporting measure. The primary reporting measure of
other operating segments is Underlying EBIT. 7 Underlying EBITDAR represents Underlying earnings before income tax expense, depreciation, amortisation, non-cancellable aircraft operating lease rentals and net finance costs.

QANTAS AIRWAYS LIMITED PRELIMINARY FINAL REPORT ABN: 16 009 661 901 YEAR ENDED 30 JUNE 2013
Page 24
NOTES TO THE PRELIMINARY FINAL REPORT For the year ended 30 June 2013 Note 2. Underlying PBT and Operating Segments (continued) (c) Analysis by Operating Segment (continued)
June 2012 $M
Qantas
Dom
estic
Qantas
International
Qantas
Loyalty
Qantas
Freight
Eliminations
Total Qantas
Brands
Jetstar G
roup
Corporate /
Unallocated
Eliminations
Consolidated
Revenue and other income
External segment revenue 5,603
5,079 1,058 1,004 3 12,747 2,915 61 1 15,724
Intersegment revenue 460
691 99 9 (1,168) 91 161 (55) (197) -
Total segment revenue and other income 6,063
5,770 1,157 1,013 (1,165) 12,838 3,076 6 (196) 15,724
Share of net profit/(loss) of associates and jointly controlled entities 3
3 - 16 - 22 (19) - - 3Underlying EBITDAR 1,186 317 234 67 (6) 1,798 574 (178) 4 2,198Non-cancellable operating lease rentals (159)
(103) - (4) - (266) (283) - - (549)
Depreciation and amortisation (564)
(698) (3) (18) - (1,283) (88) (13) - (1,384)
Underlying EBIT 463 (484) 231 45 (6) 249 203 (191) 4 265
Underlying net finance costs
(170) (170)
Underlying PBT (361) 95
Basis of Preparation
Underlying EBIT of the Qantas Group’s operating segments is prepared and presented on the basis that reflects the revenue earned and the expenses incurred by each operating segment. All revenues earned and expenses incurred by Qantas Loyalty, Qantas Freight and Jetstar Group are reported directly by these segments. For Qantas Airlines where revenues earned and expenses incurred are directly attributable to either Qantas International or Qantas Domestic they have been reported as such. Where revenues earned and expenses incurred by Qantas Airlines are not individually attributable to either Qantas International or Qantas Domestic, they are reported by these operating segments using an appropriate allocation methodology.

QANTAS AIRWAYS LIMITED PRELIMINARY FINAL REPORT ABN: 16 009 661 901 YEAR ENDED 30 JUNE 2013
Page 25
NOTES TO THE PRELIMINARY FINAL REPORT For the year ended 30 June 2013 Note 2. Underlying PBT and Operating Segments (continued) (c) Analysis by Operating Segment (continued) The significant accounting policies applied in implementing this basis of preparation are set out on the following page. These accounting policies have been consistently applied to all periods presented in the Preliminary Final Report. Segment performance measure
Basis of preparation
External segment revenue
External segment revenue is reported by operating segments as follows: - Net passenger revenue is reported by the operating segment which operated the relevant
flight or provided the relevant service. For Qantas Airlines, where a multi-sector ticket covering international and domestic travel is sold, the revenue is reported by Qantas Domestic and Qantas International on a pro-rata basis using an industry standard allocation process.
- Net freight revenue includes air cargo and express freight revenue and is reported by the Qantas Freight operating segment.
- Frequent Flyer redemption revenue, marketing revenue, membership fees and other related revenue is reported by the Qantas Loyalty operating segment.
- Other revenue is reported by the operating segment that earned the revenue.
Inter-segment revenue
Inter-segment revenue for Qantas Domestic, Qantas International and Jetstar Group operating segments primarily represents: - Net passenger revenue arising from the redemption of frequent flyer points for Qantas Group
flights by Qantas Loyalty; and - Net Freight revenue from the utilisation of Qantas Brands and Jetstar Group’s aircraft
bellyspace by Qantas Freight. Inter-segment revenue for Qantas Loyalty primarily represents marketing revenue arising from the issuance of frequent flyer points to Qantas Domestic, Qantas International and Jetstar Group. Inter-segment revenue transactions, which are eliminated on consolidation, occur in the ordinary course of business at prices that approximate market prices. Qantas Loyalty does not derive net profit from intersegment transactions relating to frequent flyer point issuances and redemptions.
Share of net profit/(loss) of associates and jointly controlled entities
Share of net profit/(loss) of associates and jointly controlled entities is reported by the operating segment which is accountable for the management of the investment. The share of net profit/(loss) of associates and jointly controlled entities for Qantas Airlines investments has been equally shared between Qantas Domestic and Qantas International.
Underlying EBITDAR
The significant expenses impacting Underlying EBITDAR are as follows: - Manpower and staff related costs are reported by the operating segment that utilises the
manpower. Where manpower supports both Qantas Domestic and Qantas International, costs are reported by Qantas Domestic and Qantas International using an appropriate allocation methodology.
- Fuel expenditure is reported by the segment that consumes the fuel in its operations. - Aircraft operating variable costs are reported by the segment that incurs these costs. - All other expenditure is reported by the operating segment to which they are directly
attributable or in the case of Qantas Airlines between Qantas Domestic and Qantas International using an appropriate allocation methodology. To apply this accounting policy, where necessary expenditure is recharged between operating segments as a cost recovery.

QANTAS AIRWAYS LIMITED PRELIMINARY FINAL REPORT ABN: 16 009 661 901 YEAR ENDED 30 JUNE 2013
Page 26
NOTES TO THE PRELIMINARY FINAL REPORT For the year ended 30 June 2013 Note 2. Underlying PBT and Operating Segments (continued) (c) Analysis by Operating Segment (continued)
Segment performance measure
Basis of preparation
Depreciation and amortisation
Qantas Domestic, Qantas International and Jetstar Group report depreciation expense for passenger aircraft owned by the Qantas Group and flown by the segment. Qantas Freight reports depreciation expense for freight aircraft owned by the Qantas Group. Other depreciation and amortisation is reported by the segment that uses the related asset.
Non-cancellable aircraft operating lease rentals
Qantas Domestic, Qantas International and Jetstar Group report non-cancellable aircraft operating lease rentals for passenger aircraft externally leased by the Qantas Group and flown by the segment. Qantas Freight reports non-cancellable aircraft operating lease rentals for freighter aircraft externally leased by the Qantas Group.
(d) Description of Underlying PBT and Reconciliation from Statutory Profit Before Tax (Statutory PBT) Underlying PBT is a non-statutory measure, and is the primary reporting measure used by the Qantas Group’s chief operating decision-making bodies, being the Chief Executive Officer, Group Management Committee and the Board of Directors. The objective of measuring and reporting Underlying PBT is to provide a meaningful and consistent representation of the underlying performance of each operating segment and the Qantas Group. Underlying PBT is derived by adjusting Statutory PBT for the impacts of AASB 139: Financial Instruments: Recognition and Measurement (AASB 139) which relate to other reporting periods and identifying certain other items which are not included in Underlying PBT. (i) Adjusting for impacts of AASB 139 which relate to other reporting periods All derivative transactions undertaken by the Qantas Group represent economic hedges of underlying risk and exposures. The Qantas Group does not enter into speculative derivative transactions. Notwithstanding this, AASB 139 requires certain mark-to-market movements in derivatives which are classified as “ineffective” to be recognised immediately in the Consolidated Income Statement. The recognition of derivative valuation movements in reporting periods which differ from the designated transaction causes volatility in statutory profit that does not reflect the hedging nature of these derivatives. Underlying PBT reports all hedge derivative gains and losses in the same reporting period as the underlying transaction by adjusting the reporting period’s statutory profit for derivative mark-to-market movements that relate to underlying exposures in other reporting periods. This adjustment is calculated as follows: - Derivative mark-to-market movements recognised in the current reporting period’s statutory profit that are associated
with current period exposures remain included in Underlying PBT - Derivative mark-to-market movements recognised in the current reporting period’s statutory profit that are associated
with underlying exposures which will occur in future reporting period are excluded from Underlying PBT - Derivative mark-to-market movements recognised in the current reporting period’s statutory profit that are associated
with capital expenditure are excluded from Underlying PBT and subsequently included in Underlying PBT as an implied adjustment to depreciation expense for the related assets commencing when the assets are available for use
- Derivative mark-to-market movements recognised in previous reporting period’s statutory profit that are associated with underlying exposures which occurred in the current period are included in Underlying PBT
- Ineffectiveness and non-designated derivatives relating to other reporting periods affecting net finance costs are excluded from Underlying PBT
All derivative mark-to-market movements which have been excluded from Underlying PBT will be recognised through Underlying PBT in future periods when the underlying transaction occurs.

QANTAS AIRWAYS LIMITED PRELIMINARY FINAL REPORT ABN: 16 009 661 901 YEAR ENDED 30 JUNE 2013
Page 27
NOTES TO THE PRELIMINARY FINAL REPORT For the year ended 30 June 2013 Note 2. Underlying PBT and Operating Segments (continued) (d) Description of Underlying PBT and Reconciliation from Statutory Profit Before Tax (Statutory PBT) (continued) (ii) Other items not included in Underlying PBT
Items which are identified by Management and reported to the chief operating decision-making bodies as not representing the underlying performance of the business are not included in Underlying PBT. The determination of these items is made after consideration of their nature and materiality and is applied consistently from period to period.
Items not included in Underlying PBT primarily result from revenues or expenses relating to business activities in other reporting periods, major transformational/restructuring initiatives, transactions involving investments and impairments of assets outside the ordinary course of business. (iii) Underlying EBIT Underlying EBIT is calculated using a consistent methodology as outlined above but excluding the impact of statutory net finance costs and ineffective and non-designated derivatives relating to other reporting periods affecting net finance costs.
The reconciliation of Underlying PBT from Statutory PBT is detailed in the table below.
June 2013 June 2012 $M $M
Statutory PBT 17 (349)
Adjusted for ineffectiveness and non-designated derivatives relating to other reporting periods
- Exclude current year derivative mark-to-market movements relating to underlying exposures in future years
26
86
- Exclude current year derivative mark-to-market movements relating to capital expenditure
12
9
- Include prior years’ derivative mark-to-market movements relating to underlying exposures in the current year
(71)
(51)
- Include adjustment to depreciation expense relating to excluded capital expenditure mark-to-market movements
(6)
(4)
- Exclude ineffective and non-designated derivatives relating to other reporting periods affecting net finance costs
7
6
(32) 46
Other items not included in Underlying PBT
- Net impairment of property, plant and equipment1 86 147
- Redundancies and restructuring2 118 203
- Impairment of goodwill and other intangible assets3 24 18
- Net profit on disposal of investment in jointly controlled entity (30) -
- Net impairment of investments (2) 19
- Write down of inventory 4 13
- Other 7 (2)
207
398
Underlying PBT
192 95
1 As disclosed in Note 3, net impairment of property, plant and equipment for the year ended 30 June 2013 was $93 million (2012: $157 million), of which $86 million (2012: $147 million) is presented as other items not included in Underlying PBT. 2 As disclosed in Note 3, redundancies and restructuring for the year ended 30 June 2013 was $122 million (2012: $206 million), of which $118 million (2012: $203 million) is presented as other items not included in Underlying PBT. 3 As disclosed in Note 3, net impairment of goodwill and intangible assets for the year ended 30 June 2013 was $24 million (2012: $20 million), of which $24 million (2012: $18 million) is presented as other items not included in Underlying PBT.

QANTAS AIRWAYS LIMITED PRELIMINARY FINAL REPORT ABN: 16 009 661 901 YEAR ENDED 30 JUNE 2013
Page 28
NOTES TO THE PRELIMINARY FINAL REPORT For the year ended 30 June 2013 Note 2. Underlying PBT and Operating Segments (continued) (e) Underlying PBT per Share
June 2013
June2012
Cents Cents
Basic/diluted Underlying PBT per share 8.5 4.2
(f) Analysis by Geographical Areas (i) Revenue and other income by geographic areas June
2013 June
2012 $M $MNet passenger and freight revenue Australia 10,864 10,447Overseas 3,744 4,081
Total net passenger and freight revenue 14,608 14,528
Other revenue/income (refer to Note 3) 1,294 1,196
Total revenue and other income 15,902 15,724
Net passenger and freight revenue is attributed to a geographic region based on the point of sale except where this information is not directly available in which case, allocation is on a pro-rata basis. Other revenue/income is not allocated to a geographic region as it is impractical to do so.
(ii) Non-current assets by geographic areas
Non-current assets which consist principally of aircraft supporting the Qantas Group’s global operations, are primarily located in Australia.

QANTAS AIRWAYS LIMITED PRELIMINARY FINAL REPORT ABN: 16 009 661 901 YEAR ENDED 30 JUNE 2013
Page 29
NOTES TO THE PRELIMINARY FINAL REPORT For the year ended 30 June 2013 Note 3. Other Revenue/Income and Other Expenditure
June 2013
June 2012
$M $M Other revenue/income1 Contract work revenue 296 380 Frequent Flyer store and other redemption revenue2 257 245 Frequent Flyer marketing revenue, membership fees and other revenue
268 235
Retail, advertising and other property revenue 148 131 Other 325 205
1,294 1,196
Other expenditure Selling and marketing 598 635 Property 482 429 Computer and communication 418 437 Capacity hire 311 266 Redundancies and restructuring 122 206 Airport security charges 145 131 Net impairment of property, plant and equipment 93 157 Net impairment of goodwill and other intangible assets 24 20 Net impairment of investments (2) 19 Net gain on sale of jointly controlled entity (30) - Contract work material 65 79 Ineffective and non-designated derivatives 76 165 Other 337 449
2,639 2,993
1 During the year the Qantas Group restated the Consolidated Income Statement for the reclassification of ancillary passenger revenue, passenger service fees, lease revenue from codeshare and charter revenue from Other revenue to Net passenger revenue and reclassification of freight lease revenue from Other revenue to Net freight revenue.
2 Frequent Flyer redemption revenue excludes redemptions on Qantas Group’s flights which are reported as net passenger revenue in the Consolidated Income Statement. Frequent Flyer marketing revenue is net of intra-group marketing revenue within the Qantas Group.

QANTAS AIRWAYS LIMITED PRELIMINARY FINAL REPORT ABN: 16 009 661 901 YEAR ENDED 30 JUNE 2013
Page 30
NOTES TO THE PRELIMINARY FINAL REPORT For the year ended 30 June 2013 Note 4. Investments Accounted for Using the Equity Method June 2013 June 2012 $M $M
Investment in associates - Jetset Travelworld Limited 118 114 - Other 72 49
Investment in jointly controlled entities - AUX Investments Pty Ltd - 294
190 457
Ownership interest June 2013 June 2012 % % Air Pacific Limited1 - - AUX Investments Pty Ltd2 - 50 Fiji Resorts Limited 21 21 Hallmark Aviation Services L.P. 49 49 HT & T Travel Philippines, Inc. 28 28 Holiday Tours and Travel (Thailand) Ltd 37 37 Holiday Tours and Travel Vietnam Co. Ltd 37 37 Holiday Tours and Travel (GSA) Ltd3 37 - Jetset Travelworld Limited 29 29 Jetstar Hong Kong Airways Limited4 33 - Jetstar Japan Co., Ltd. 33 33 Jetstar Pacific Airlines Aviation Joint Stock Company 30 30
LTQ Engineering Pty Limited 50 50
PT Holidays Tours & Travel 37 37 Tour East (T.E.T) Ltd 37 37
1 Legislative changes in Fiji culminated on 29 May 2012 with the Qantas Group removing its director representatives from the Board of Air Pacific Limited (Air Pacific). As a result, Air Pacific ceased to be an associate of the Qantas Group. The Qantas Group continues to hold a 46 per cent ownership interest in Air Pacific.
2 The Qantas Group sold its 50 per cent share in AUX Investments Pty Ltd on 13 November 2012. 3 Holiday Tours and Travel (GSA) Ltd was incorporated on 24 October 2012. 4 Jetstar Hong Kong Airways Limited was incorporated on 4 September 2012 as a joint venture between Qantas and China Eastern Airlines. On 5 June
2013, Shun Tak Holdings Limited took an equal one-third share in Jetstar Hong Kong resulting in the dilution of Qantas’ shareholding from 50 per cent to 33.33 per cent. The investment is now reported as an associate.
Note 5. Dividends No interim dividend was paid in relation to the year ended 30 June 2013. No final dividend will be paid in relation to the year ended 30 June 2013.

QANTAS AIRWAYS LIMITED PRELIMINARY FINAL REPORT ABN: 16 009 661 901 YEAR ENDED 30 JUNE 2013
Page 31
NOTES TO THE PRELIMINARY FINAL REPORT For the year ended 30 June 2013 Note 6. Commitments (a) Capital Expenditure Commitments
June 2013
$M June 2012
$M
Capital Expenditure Commitments contracted but not provided for in the Consolidated Financial Statements, payable, in relation to:
Within 12 months 1,097 1,201 Later than 12 months but not later than five years 4,618 7,930 Later than five years 3,444 4,928
9,159 14,059
The Qantas Group has a number of cancellation and deferral rights within its aircraft purchase contracts which can reduce or defer the above capital commitments. The Qantas Group also has further opportunities to place ordered aircraft with its associates. (b) Operating Lease Commitments as Lessee
June 2013
$M June 2012
$M
Non-cancellable operating lease commitments not provided for in the Consolidated Financial Statements
Aircraft and engines – payable:
Within 12 months 607 616 Later than 12 months but not later than five years 1,298 1,569 Later than five years 227 342
2,132 2,527
Non-aircraft – payable:
Within 12 months 193 185 Later than 12 months but not later than five years 568 528 Later than five years but not later than ten years 273 273 Later than ten years1 227 92 Provision for potential under-recovery of rentals on unused premises available for sub-lease
(4)
(8)
1,257 1,070
3,389 3,597
1 Represents the long-term extension of the Qantas Group Headquarters following refurbishments enabling the consolidation of other leases to be realised in the near term.

QANTAS AIRWAYS LIMITED PRELIMINARY FINAL REPORT ABN: 16 009 661 901 YEAR ENDED 30 JUNE 2013
Page 32
NOTES TO THE PRELIMINARY FINAL REPORT For the year ended 30 June 2013 Note 7. Entities over which control was gained or lost during the year On 31 October 2012, the Qantas Group disposed of its interest in the Cairns and Riverside catering facilities through the sale of the following entities:
• Q Catering Cairns Pty Limited • Q Catering Riverside Pty Limited • Airport Infrastructure Finance Pty. Limited
On 13 November 2012, the Qantas Group acquired 100 per cent of Australian air Express Pty Ltd (AaE) and disposed of its 50 per cent interest in a jointly controlled entity AUX Investments Pty Ltd, which was the holding company of Star Track Express Holdings Pty Limited and its controlled entities. The Qantas Group incorporated the following entity during the period:
• Jetstar Regional Services Pte. Ltd. (incorporated in Singapore on 4 December 2012) Note 8. Post Balance Date Events On 29 August 2013, Qantas announced the sale of its wholly owned subsidiary, Qantas Defence Services (QDS), to Northrop Grumman Australia, part of global aviation firm Northrop Grumman Corporation, for a price of $80 million for the business and other related assets, an amount in excess of the Group’s carrying value. Other than as disclosed above, there has not arisen in the interval between 30 June 2013 and the date of this Report any other event that would have had a material effect on the Financial Statements as at 30 June 2013.

QANTAS AIRWAYS LIMITED PRELIMINARY FINAL REPORT ABN: 16 009 661 901 YEAR ENDED 30 JUNE 2013
Page 33
OPERATIONAL STATISTICS For the year ended 30 June 2013
(unaudited) June 2013 June 2012 Change QANTAS DOMESTIC (INCLUDING QANTASLINK) - SCHEDULED SERVICES Passengers carried 000 22,116 21,983 0.6% Revenue passenger kilometres (RPK) M 28,352 28,174 0.6% Available seat kilometres (ASK) M 37,354 36,259 3.0% Revenue seat factor % 75.9 77.7 (1.8)pts
QANTAS DOMESTIC - SCHEDULED SERVICES Passengers carried 000 16,813 16,796 0.1% Revenue passenger kilometres (RPK) M 24,938 24,770 0.7% Available seat kilometres (ASK) M 32,119 31,203 2.9% Revenue seat factor % 77.6 79.4 (1.8)pts
QANTASLINK - SCHEDULED SERVICES Passengers carried 000 5,303 5,187 2.2% Revenue passenger kilometres (RPK) M 3,414 3,404 0.3% Available seat kilometres (ASK) M 5,235 5,056 3.5% Revenue seat factor % 65.2 67.3 (2.1)pts
JETSTAR DOMESTIC - SCHEDULED SERVICES Passengers carried 000 11,610 10,697 8.5% Revenue passenger kilometres (RPK) M 13,958 12,798 9.1% Available seat kilometres (ASK) M 17,055 15,242 11.9% Revenue seat factor % 81.8 84.0 (2.2)pts
QANTAS INTERNATIONAL - SCHEDULED SERVICES Passengers carried 000 5,765 6,034 (4.5)% Revenue passenger kilometres (RPK) M 47,983 51,165 (6.2)% Available seat kilometres (ASK) M 58,825 62,334 (5.6)% Revenue seat factor % 81.6 82.1 (0.5)pts
JETSTAR INTERNATIONAL - SCHEDULED SERVICES1 Passengers carried 000 5,146 4,677 10.0% Revenue passenger kilometres (RPK) M 14,715 13,106 12.3% Available seat kilometres (ASK) M 19,207 17,474 9.9% Revenue seat factor % 76.6 75.0 1.6pts
JETSTAR ASIA1 Passengers carried 000 3,639 3,317 9.7% Revenue passenger kilometres (RPK) M 5,897 6,449 (8.6)% Available seat kilometres (ASK) M 7,468 8,114 (8.0)% Revenue seat factor % 79.0 79.5 (0.5)pts QANTAS GROUP OPERATIONS
Passengers carried 000 48,276 46,708 3.4% Revenue passenger kilometres (RPK) M 110,905 111,692 (0.7)% Available seat kilometres (ASK) M 139,909 139,423 0.3% Revenue seat factor % 79.3 80.1 (0.8)pts Aircraft at end of year # 312 308 4 aircraft
QANTAS FREQUENT FLYER Awards redeemed M 5.6 5.1 9.8% Total members M 9.4 8.6 9.3%
FINANCIAL Yield (passenger revenue per RPK)2 c 10.33 10.58 (2.4)%
EMPLOYEES Full-time equivalent employees at end of year (FTE) # 33,265 33,584 (0.9)% RPK per FTE at year-end 000 3,334 3,326 0.2% ASK per FTE at year-end 000 4,206 4,151 1.3%
1 Jetstar Asia includes Singapore based operations only. Jetstar Asia statistics for the prior corresponding period include wide-body operations which were transferred from Jetstar Asia to Jetstar International from 1 July 2012
2 Yield (both current year and prior year) is calculated using prior year exchange rates

QANTAS AIRWAYS LIMITED PRELIMINARY FINAL REPORT ABN: 16 009 661 901 YEAR ENDED 30 JUNE 2013
Page 34
GEARING RATIO1 As at 30 June 2013
(unaudited)
June 2013
$M
June2012
$M
Equity 5,954 5,889Exclude hedge reserve (123) (41)Exclude defined benefit prepayment asset, net of deferred tax (195) (205)Recognise vested benefits surplus/(deficit) of defined benefit superannuation fund, net of deferred tax2
18
(84)
Adjusted Equity 5,654 5,559
On balance sheet debt Current interest-bearing liabilities 835 1,119Non-current interest-bearing liabilities 5,245 5,430Cash and cash equivalents (2,829) (3,398)Aircraft security deposits (21) (24)Fair value of hedges relating to debt3 (4) 380
Net on balance sheet debt 3,226 3,507
Operating lease liability4 1,593 1,860
Net debt including operating lease liability 4,819 5,367
On balance sheet debt ratio Net debt on balance sheet to net debt on balance sheet and equity (excluding hedge reserve)
36: 64
39:61
Gearing ratio Net debt including operating lease liability to net debt including operating lease liability and adjusted equity (excluding hedge reserve)
46: 54
49:51
1 Gearing ratio is Net debt including operating lease liability to net debt including operating lease liability and equity (excluding hedge reserve, defined benefit superannuation prepayments net of deferred tax and including vested benefits surplus/(deficit) of defined benefit superannuation plans, net of deferred tax). The gearing ratio is used by Management to represent the Qantas Group’s debt obligation including obligations under operating leases. 2 Equal to the difference between the Net Assets and the Vested Benefits of the Qantas Group’s Defined Benefit Superannuation Plans (using the most recently available actuarial assessment), net of deferred tax. 3 Fair value of hedges relating to debt are included in Other Financial Assets and Other Financial Liabilities on the Consolidated Balance Sheet in accordance with AASB 139: Financial Instruments: Recognition and Measurement. 4 Operating lease liability is the present value of minimum lease payments for aircraft operating leases which, in accordance with AASB 117: Leases, is not recognised on balance sheet. This operating lease liability has been calculated in accordance with Standard and Poor’s methodology using an assumed interest rate of nine per cent.


