QE-91-RI-20012.04 Keraudren Seismic Survey EP Summary PROJECT / FACILITY Bedout Basin - Keraudren Seismic Survey REVIEW INTERVAL (MONTHS) No Review Required SAFETY CRITICAL DOCUMENT NO Any hard copy of this document, other than those identified above, are uncontrolled. Please refer to the Santos Offshore Business Document Management System for the latest revision.
Any hard copy of this document, other than those identified above, are uncontrolled. Please refer to the Santos Offshore Business Document Management System for the latest revision.
Santos Ltd | Keraudren Seismic Survey EP Summary Page 2 of 248
Rev Rev Date Author / Editor Amendment
A 8/03/19 Advisian Pty Ltd/ Santos Issued for Santos internal review
B 27/03/19 Santos Updated with relevant RFFWI information
0 3/04/19 Santos Issued to NOPSEMA
1 10/04/19 Santos Issued to NOPSEMA addressing NOPSEMA comments
Santos Ltd | Keraudren Seismic Survey EP Summary Page 3 of 248
ACRONYMS
Abbreviation Description
AFMA Australian Fisheries Management Authority
AFZ Australian Fishing Zone
AHO Australian Hydrographic Office
AIS Automatic Identification System
ALARP As Low as Reasonably Practicable
AMOSC Australian Marine Oil Spill Centre
AMSA Australian Maritime Safety Authority
APASA Asia-Pacific Applied Sciences Association
BIAs Biologically Important Areas
CFA Commonwealth Fisheries Association
dB Decibels
DAWR Department of Agriculture and Water Resources
DoD Department of Defence
DoEE Department of Energy and Environment
DoF Department of Fisheries (WA)
DoT Department of Transport (WA)
DPaW Department of Parks and Wildlife (WA)
DPIRD Department of Primary Industries and Regional Development
DSEWPaC Department of Sustainability, Environment, Water, Population and Communities
DWER Department of Water Environmental Regulation
EF&LS Exmouth Freight & Logistics Services
EMBA Environment that May Be Affected
EP Environment Plan
EPA Environmental Protection Authority
EPBC Environment Protection and Biodiversity Conservation
EPO Environmental Performance Objective
EPSs Environmental Performance Standards
GHG Greenhouse gas
HSE Health Safety Environment
HSEMS Health Safety Environment Management System
Hz Hertz
IAPP International Air Pollution Prevention
Santos Ltd | Keraudren Seismic Survey EP Summary Page 4 of 248
Abbreviation Description
IMCRA Integrated Marine and Coastal Regionalisation of Australia
IMDG International Maritime Dangerous Goods
IMS Invasive Marine Species
IMT Incident Management Team
IUCN International Union for Conservation of Nature
JWM Jetwave Marine
KEF Key Ecological Feature
km Kilometre
km/hr Kilometres Per Hour
km2 Square Kilometres
L Litre
m Metres
m/h Metre per hour
m/s Metres Per Second
m3 Cubic Metres
MARPOL International Convention for the Prevention of Pollution from Ships
MGO Marine Gas Oil
mm Millimetres
MoC Management of Change
MP Marine Park
NEBA Net Environmental Benefit Analysis
NMSC National Marine Safety Committee
NOPSEMA National Offshore Petroleum Safety and Environmental Management Authority
NOx Oxides of Nitrogen
NWMR North West Marine Region
NWS North West Shelf
ODS Ozone Depleting Substance
OPEP Oil Pollution Emergency Plan
OPGGS (E) R Offshore Petroleum and Greenhouse Gas Storage (Environment) Regulations 2009
OSCP Oil Spill Contingency Plan
OSRL Oil Spill Response Limited
OWA Oiled Wildlife Advisors
OWRP Oiled Wildlife Response Plan
Santos Ltd | Keraudren Seismic Survey EP Summary Page 5 of 248
Abbreviation Description
PLEM Pipeline End Manifold
ppb Parts Per Billion
ppm Parts Per Million
ROV Remote Operated Vehicle
SMPEP Shipboard Marine Pollution Emergency Plan
SOPEP Shipboard Oil Pollution Emergency Plan
SOx Oxides of Sulphur
TSSC Threatened Species Scientific Committee
WA Western Australia
WAF Water accommodated fraction
WAFIC Western Australian Fishing Industry Council
WAOWRP WA Oiled Wildlife Response Plan
WDCS Whale and Dolphin Conservation Society
Santos Ltd | Keraudren Seismic Survey EP Summary Page 6 of 248
Santos Ltd | Keraudren Seismic Survey EP Summary Page 8 of 248
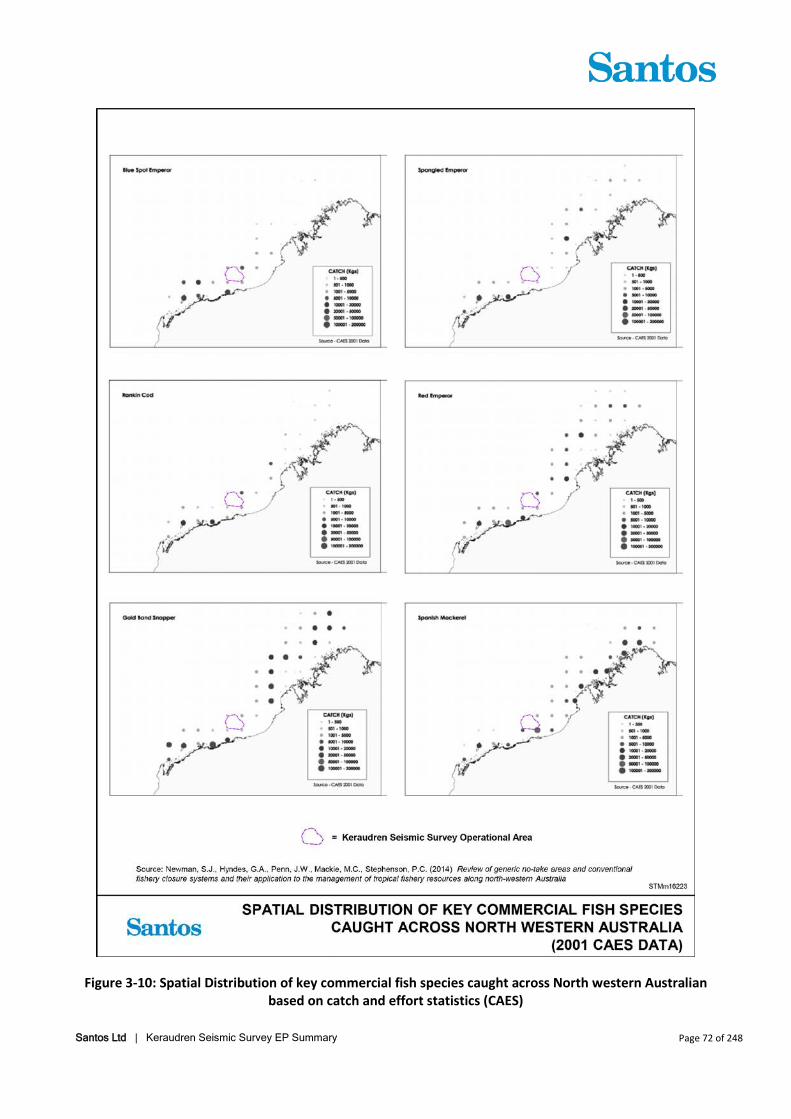
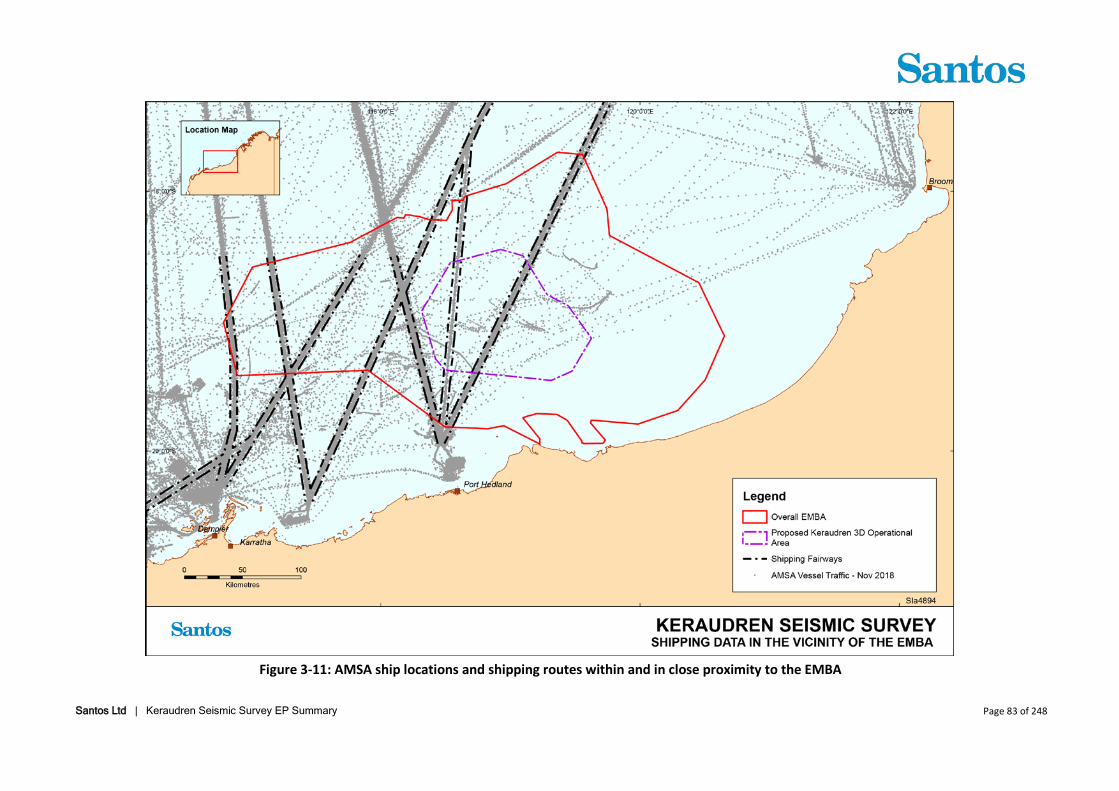
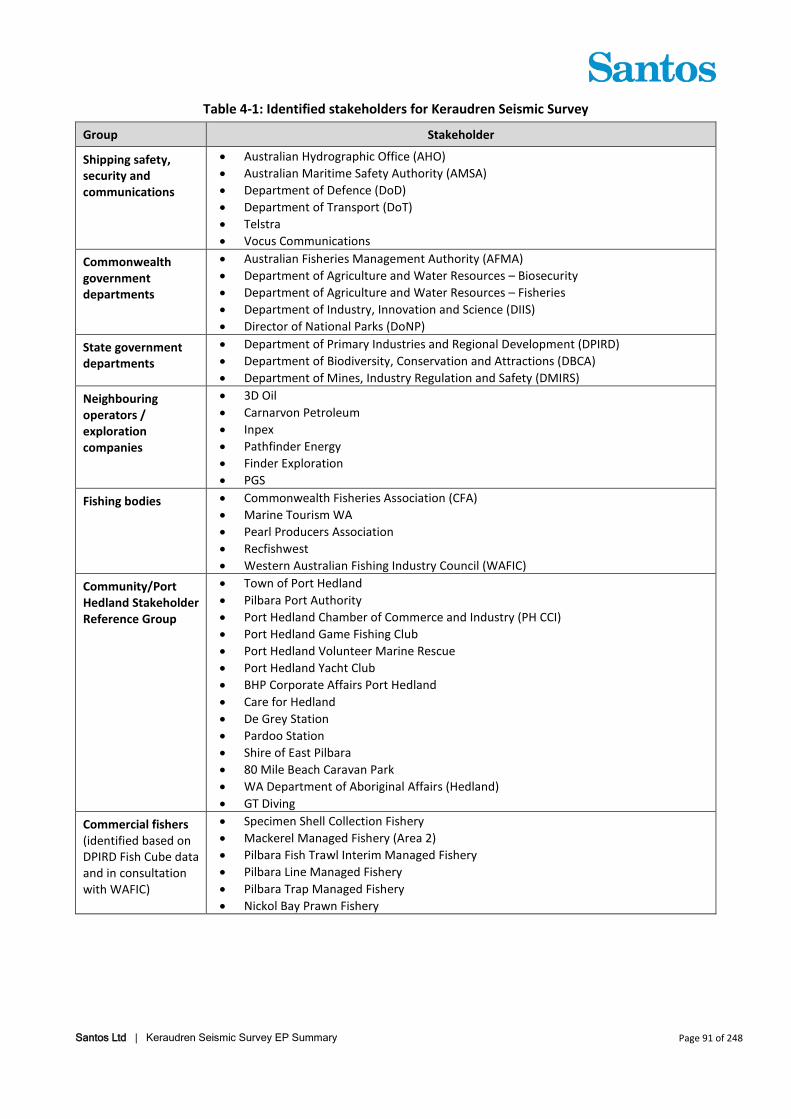
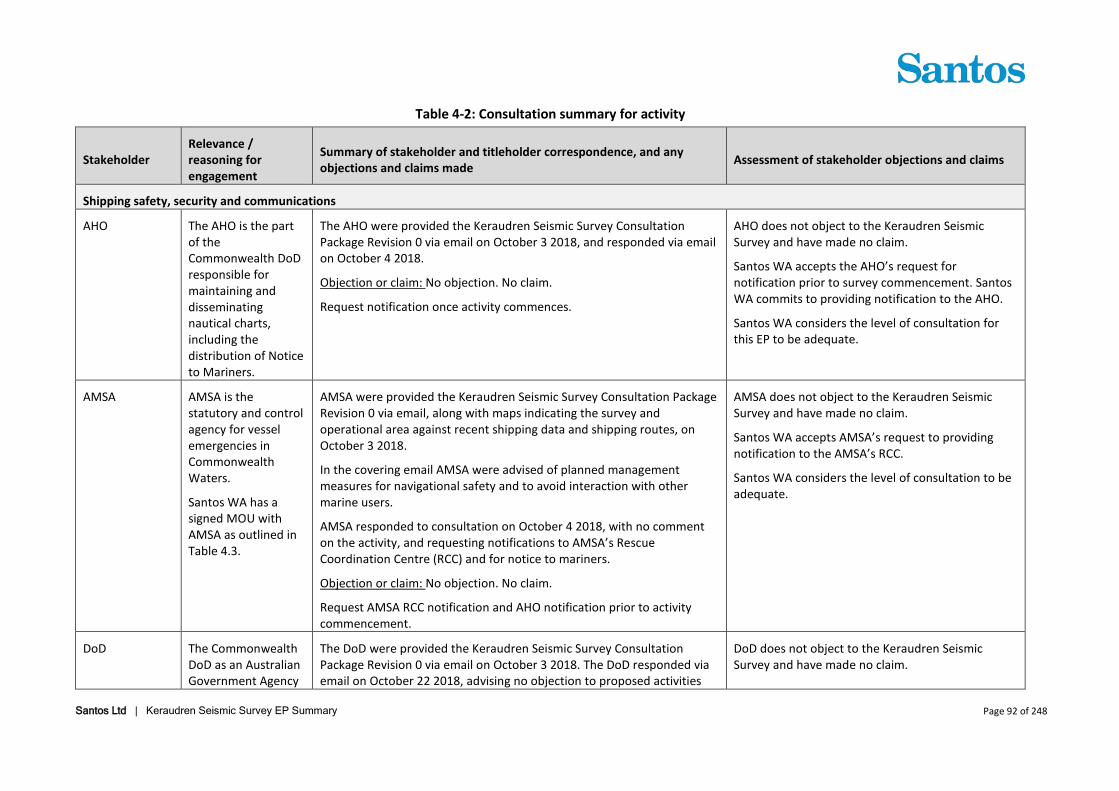
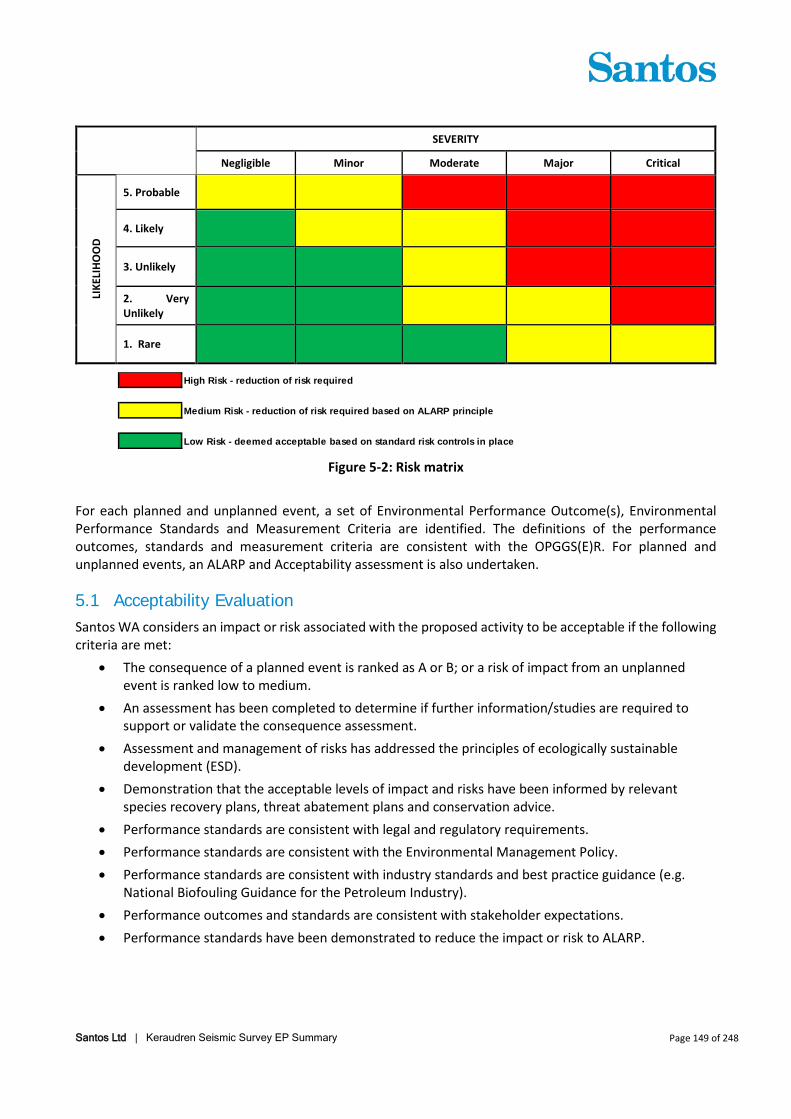
LIST OF FIGURES Figure 2-1: Location of full power zone, ramp up zone and operational area ............................................ 13 Figure 2-2: Exploration and Development Survey Areas, and notional location of potential future wells 14 Figure 2-3: Seismic vessels configuration for starboard streamer feather (top) and port feather (bottom) (not to scale) for the development component of the survey (dual source) ..................................................... 17 Figure 3-1: EMBA from the unplanned event of a worst-case MDO/MGO spill (surface oil, total water accommodated fraction (WAF) and dissolved WAF). Locations outside the EMBA where hydrocarbons may accumulate on shorelines are shown in pink (10 g/m2 - 100 g/m2) and green (>100 g/m2) ...................... 19 Figure 3-2: IMCRA 4.0 Provincial Bioregions within overlapping the EMBA ............................................... 21 Figure 3-3: Protected areas within and adjacent to the EMBA ................................................................... 27 Figure 3-4: Key ecological features within and near the operational area ................................................. 28 Figure 3-5: Northbound (a) and southbound (b) humpback whales migration durations (2008, 2009 and 2011). 30 Figure 3-6: Biologically important areas and habitat critical for turtles protected under the EPBC Act of relevance to the Keraudren seismic survey ................................................................................................ 42 Figure 3-7: Biologically important areas for EPBC Act protected marine mammal species within the vicinity of the EMBA 43 Figure 3-8: Biologically important areas for EPBC Act protected fish within the vicinity of the EMBA ...... 44 Figure 3-9: Spatial Distribution of Catch per Unit Effort for Index Species of the North western Scalefish Resources (2004-2008 data) ........................................................................................................................ 71 Figure 3-10: Spatial Distribution of key commercial fish species caught across North western Australian based on catch and effort statistics (CAES)............................................................................................................ 72 Figure 3-11: AMSA ship locations and shipping routes within and in close proximity to the EMBA .......... 83 Figure 5-1: Environmental impact and risk assessment process............................................................... 147 Figure 5-2: Risk matrix ............................................................................................................................... 149
LIST OF TABLES Table 2-1: Key terminology .......................................................................................................................... 11 Table 2-2: Proposed Keraudren 3D MSS areas of operation and coordinates ............................................ 12 Table 2-3: Acquisition parameters .............................................................................................................. 16 Table 3-1: Summary of largest unplanned credible hydrocarbon spill scenarios ....................................... 18 Table 3-2: Habitats listed according to presence within the operational area and EMBA ......................... 22 Table 3-3: Protected areas and features within the EMBA and shoreline locations .................................. 24 Table 3-4: Management Zones for the Australian Marine Parks found within the EMBA and the associated objectives ..................................................................................................................................................... 24 Table 3-5: Critical periods for migrating humpback whales in the vicinity of the Keraudren Seismic Operational Area 31 Table 3-6: Environmental values and sensitivities – threatened, migratory and conservation dependent marine fauna under the EPBC Act (CE= Critically Endangered, E= Endangered’ V= Vulnerable, M= Migratory, CD = Conservation Dependent) reported by the Protected Matters Search Tool. Assessment of values taken directly from the PMST. ............................................................................................................................... 33 Table 3-7: Commonwealth and State-managed fisheries in the vicinity of the operational area and EMBA. Operational area and EMBA presence and relevant events are assessed separately for fishery boundary
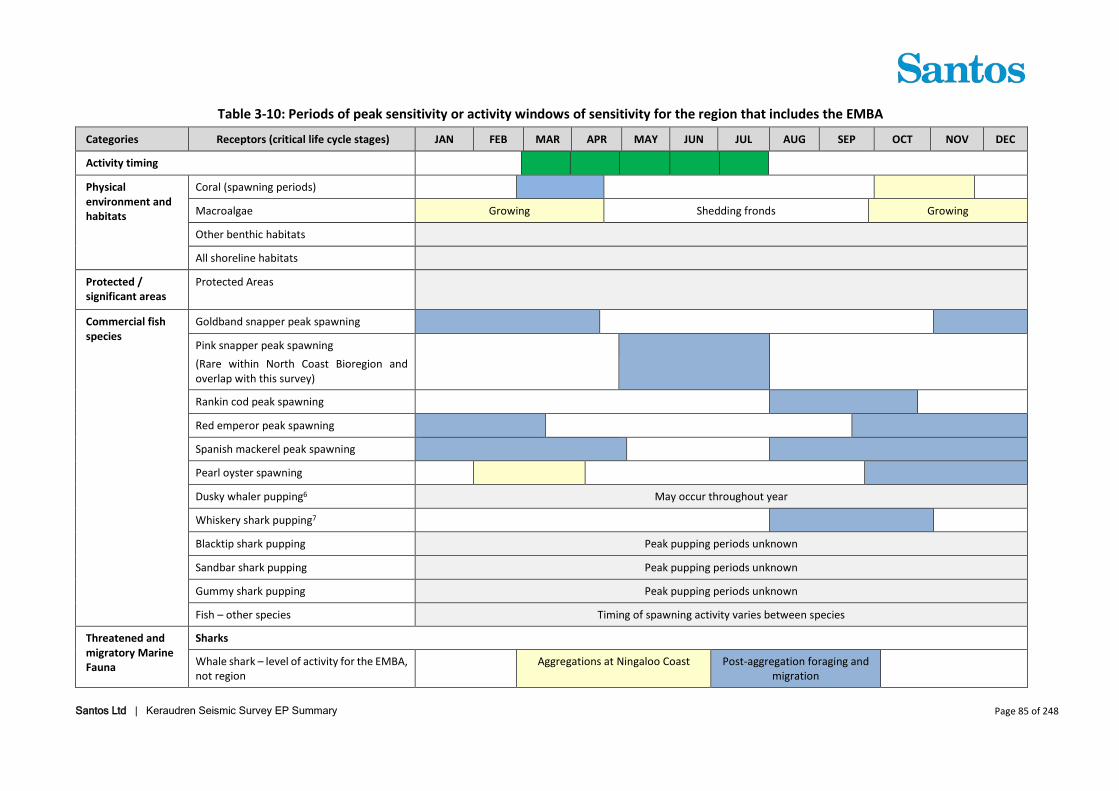
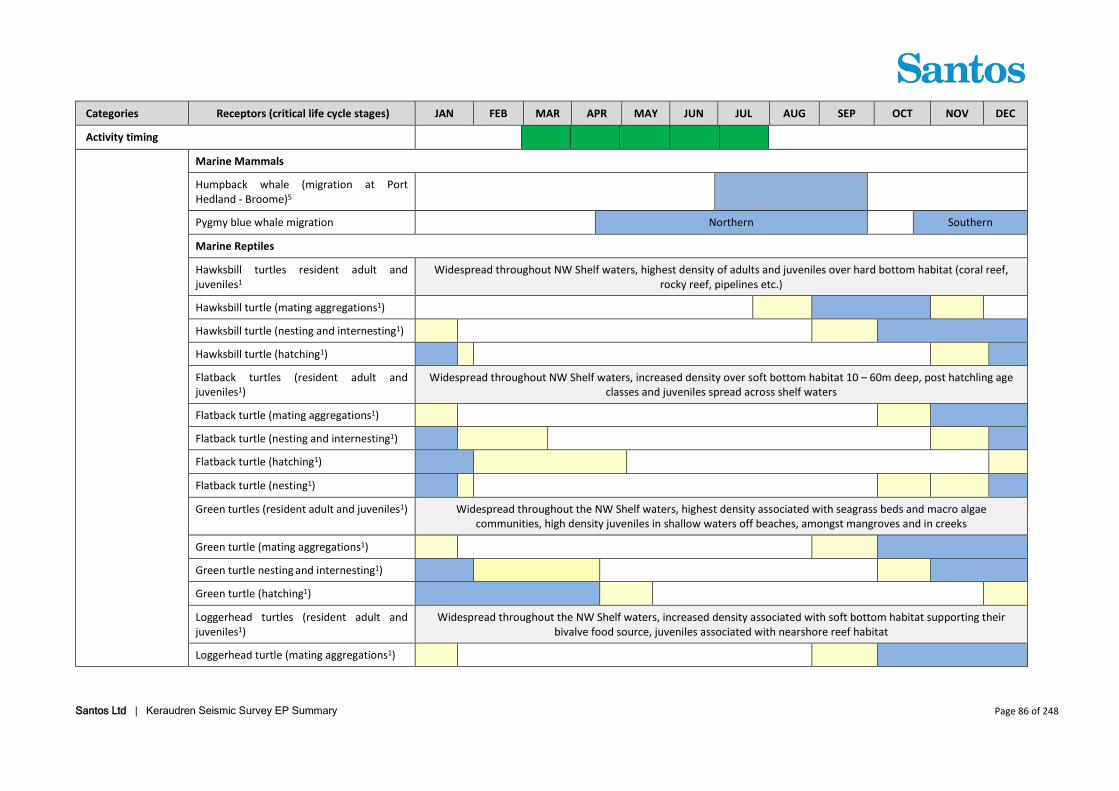
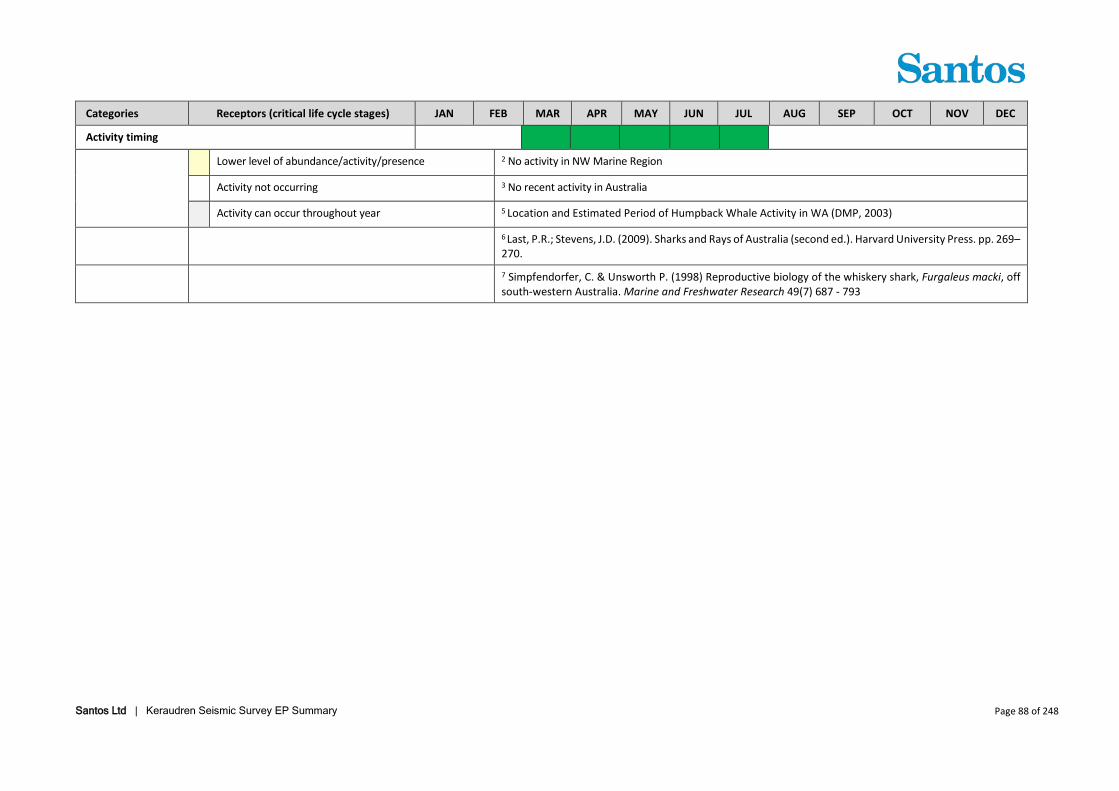
Santos Ltd | Keraudren Seismic Survey EP Summary Page 9 of 248
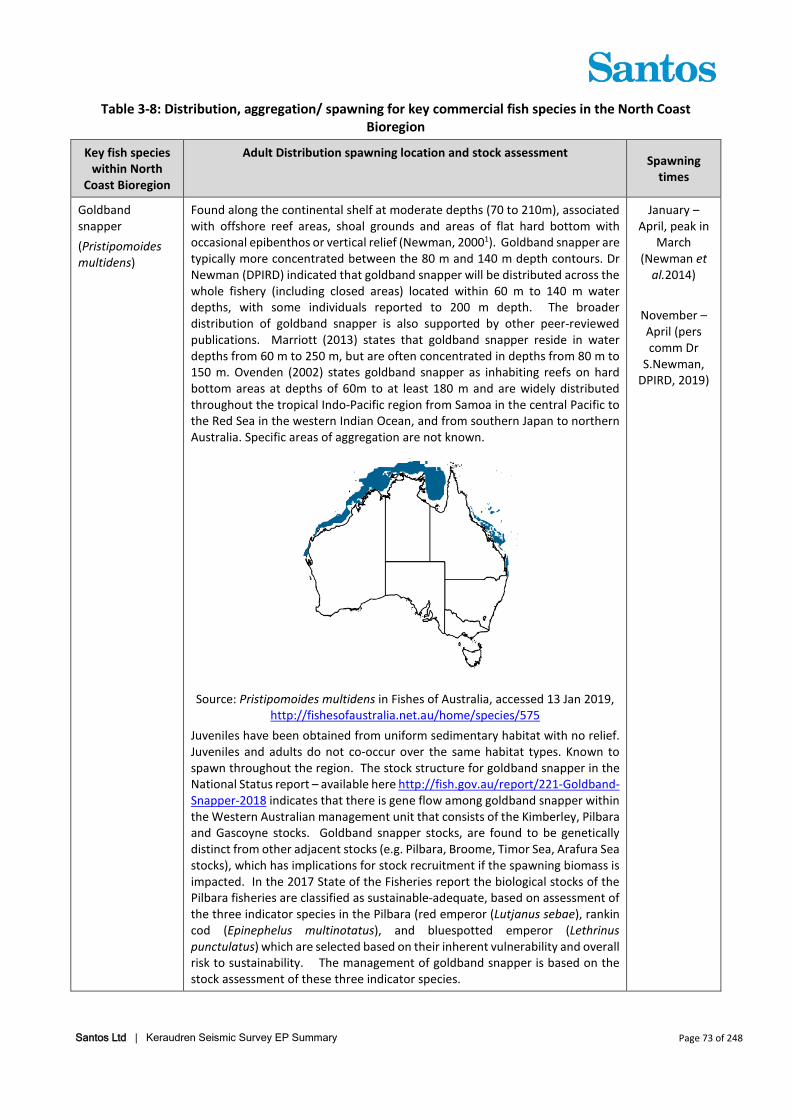
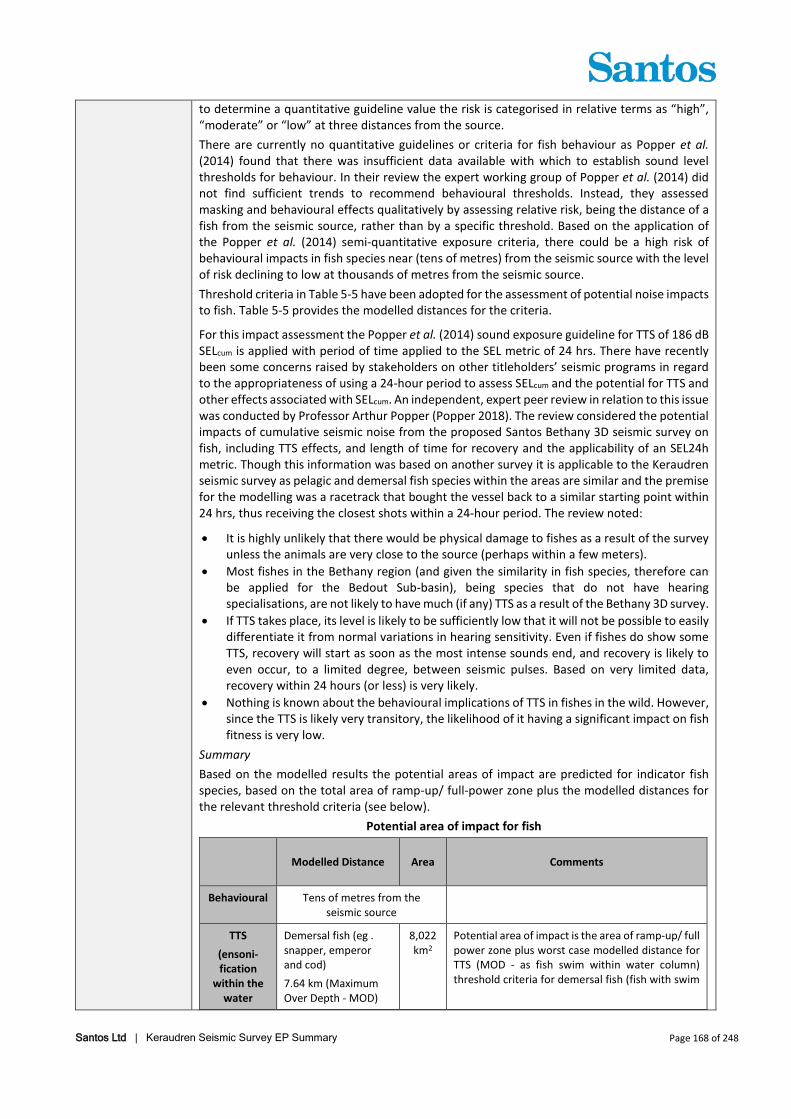
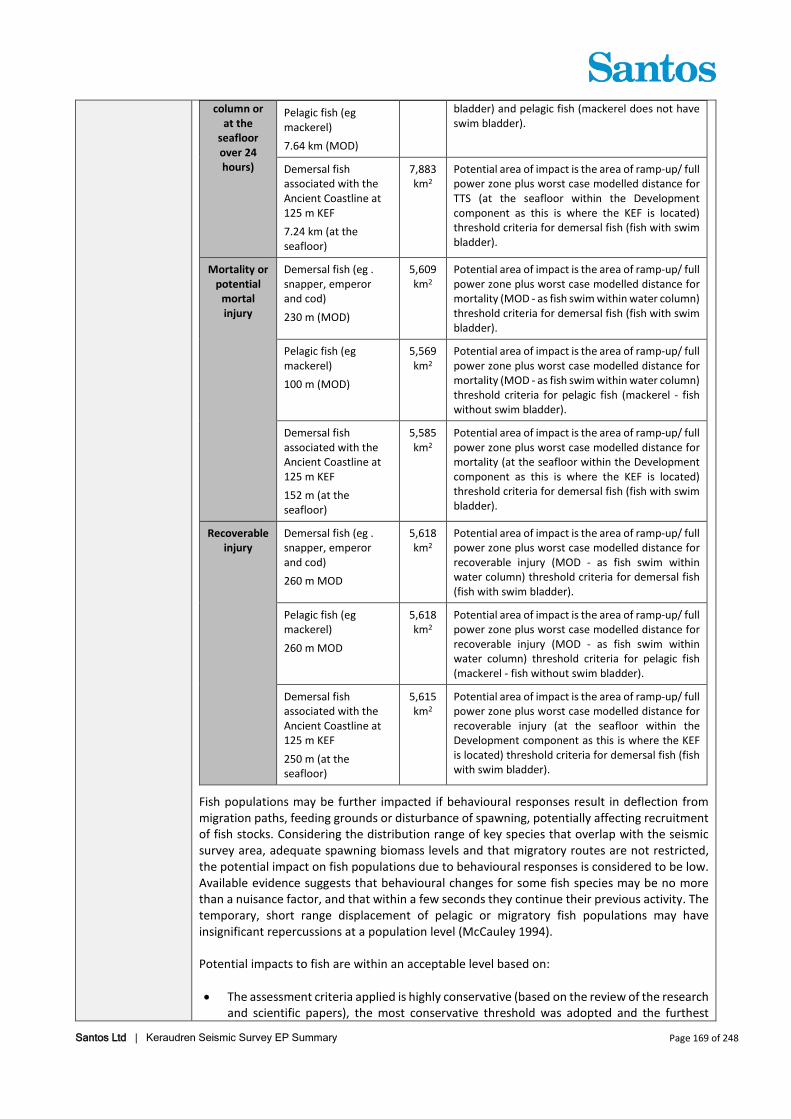
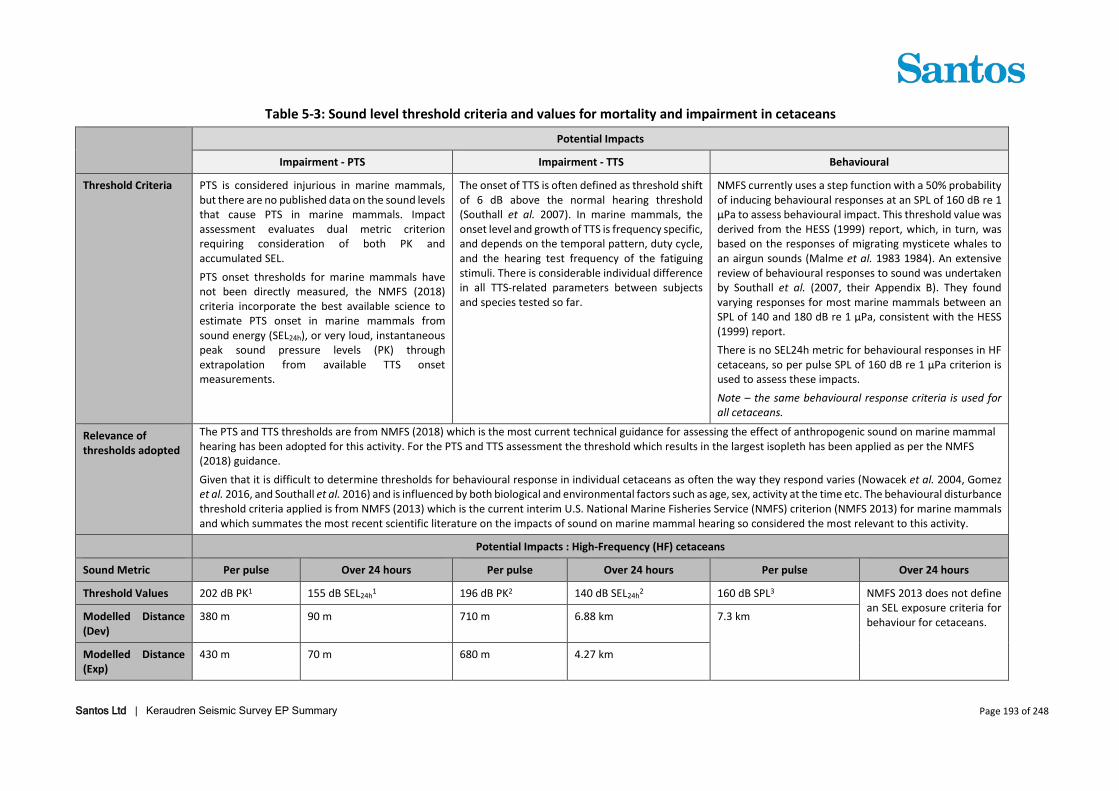
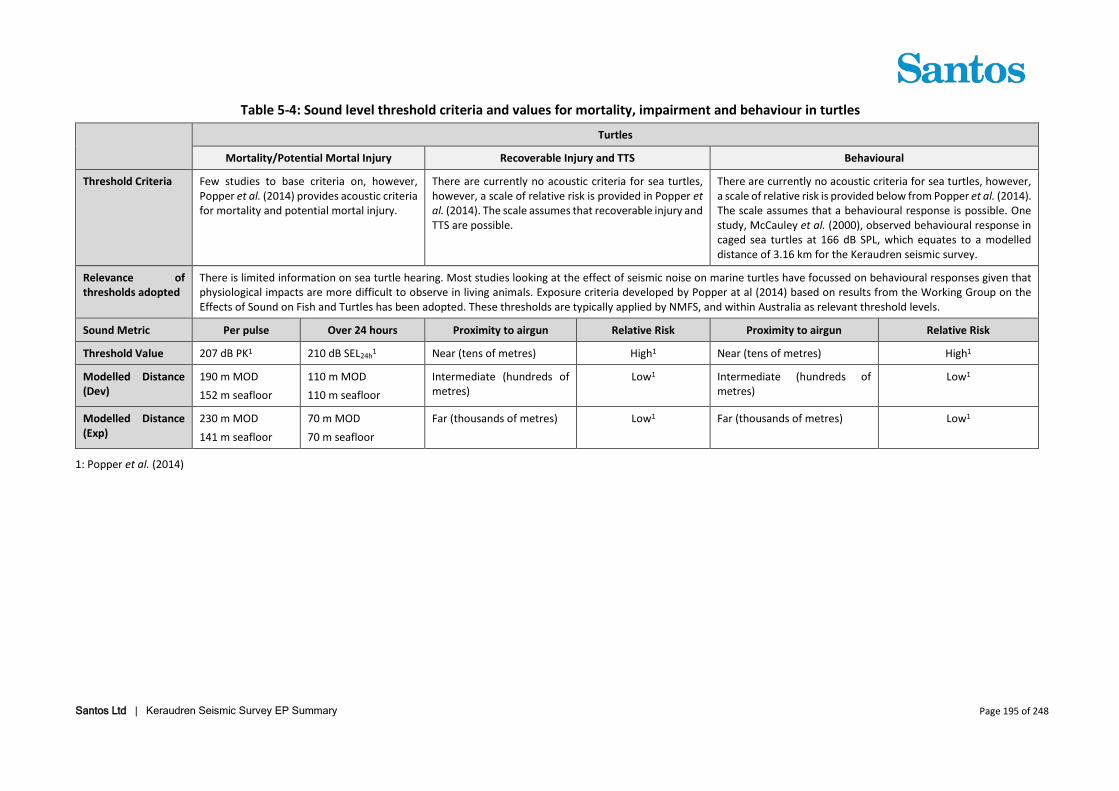
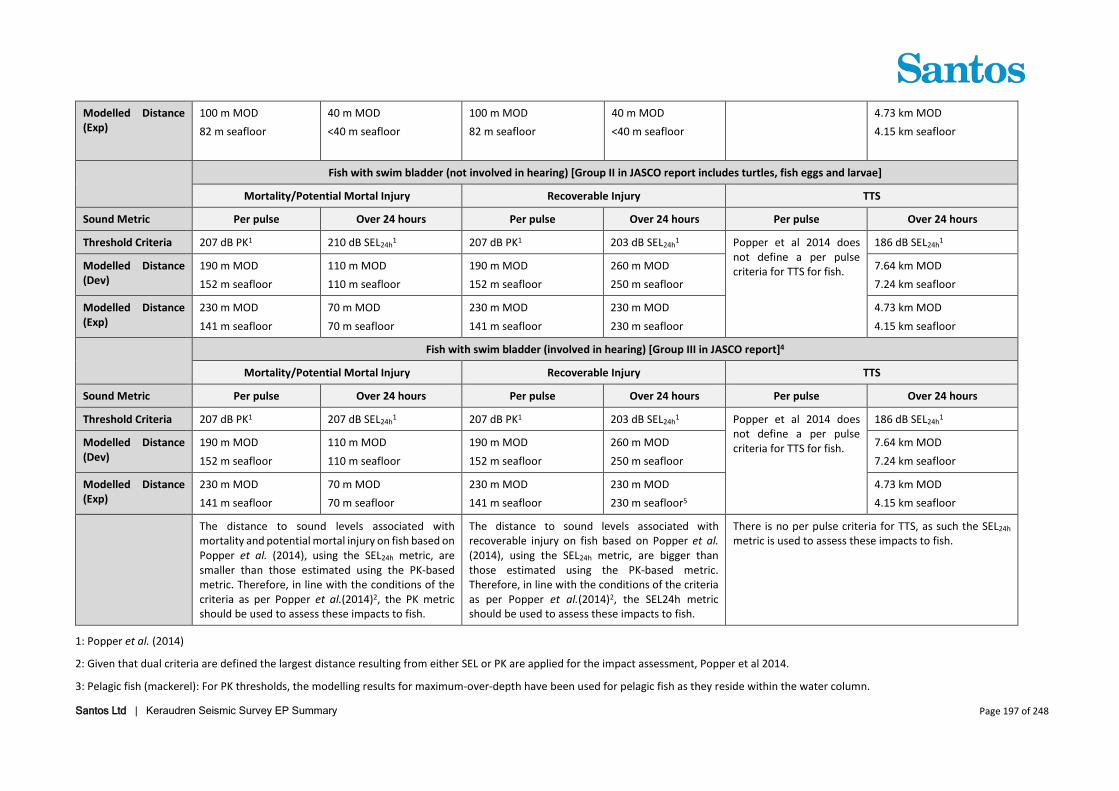
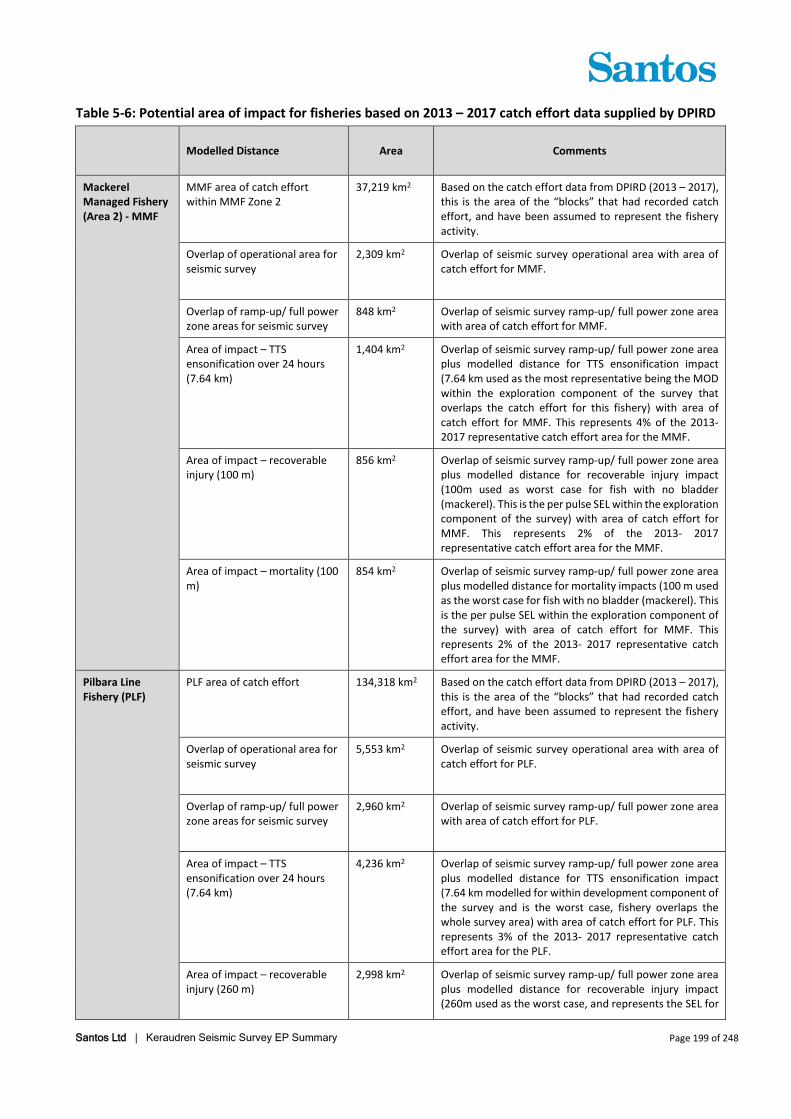
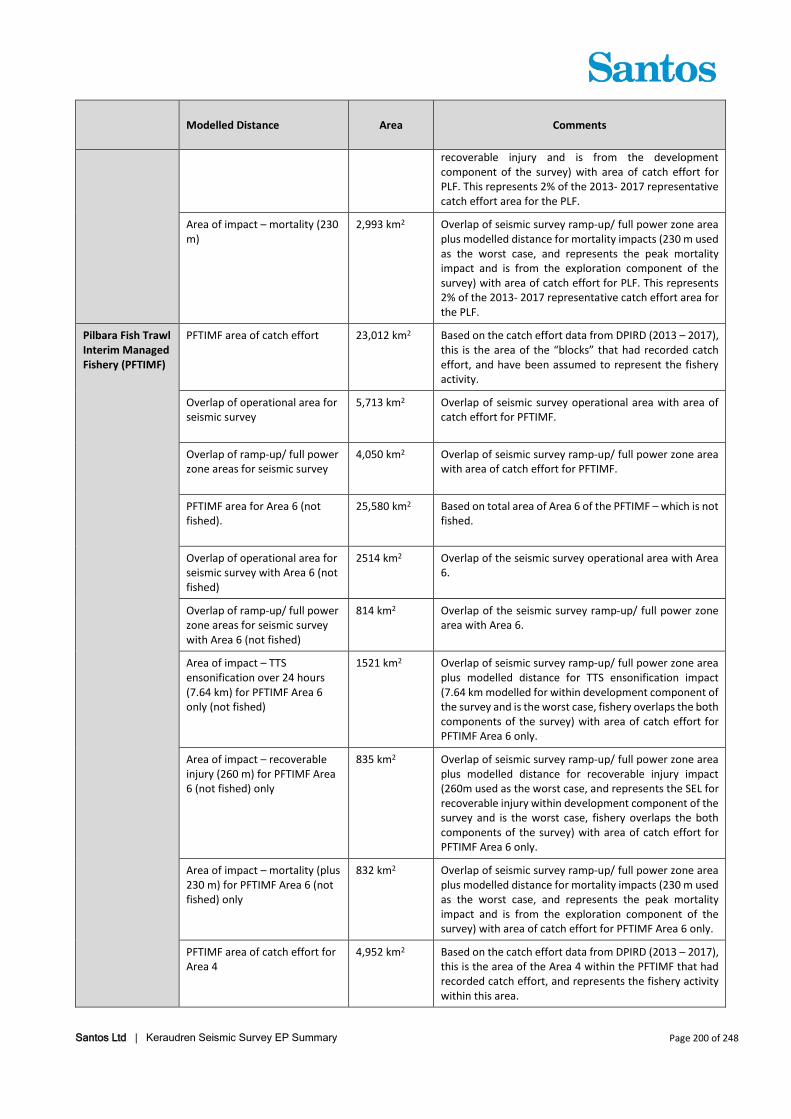
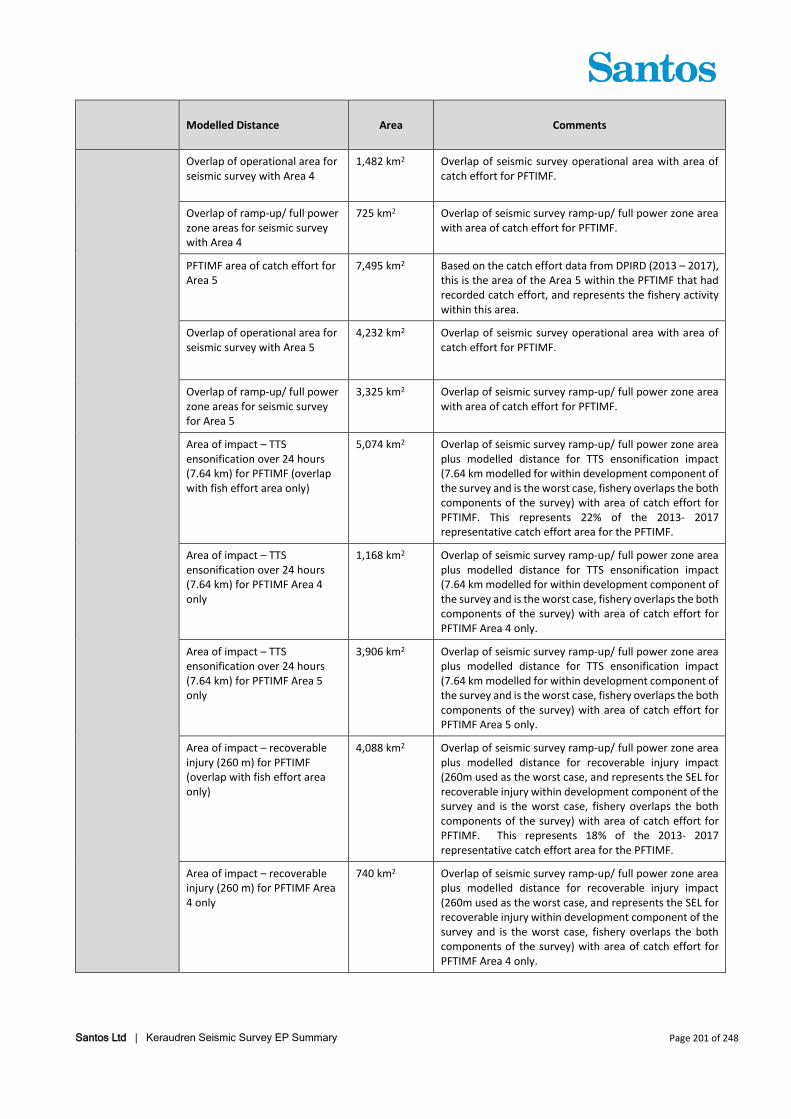
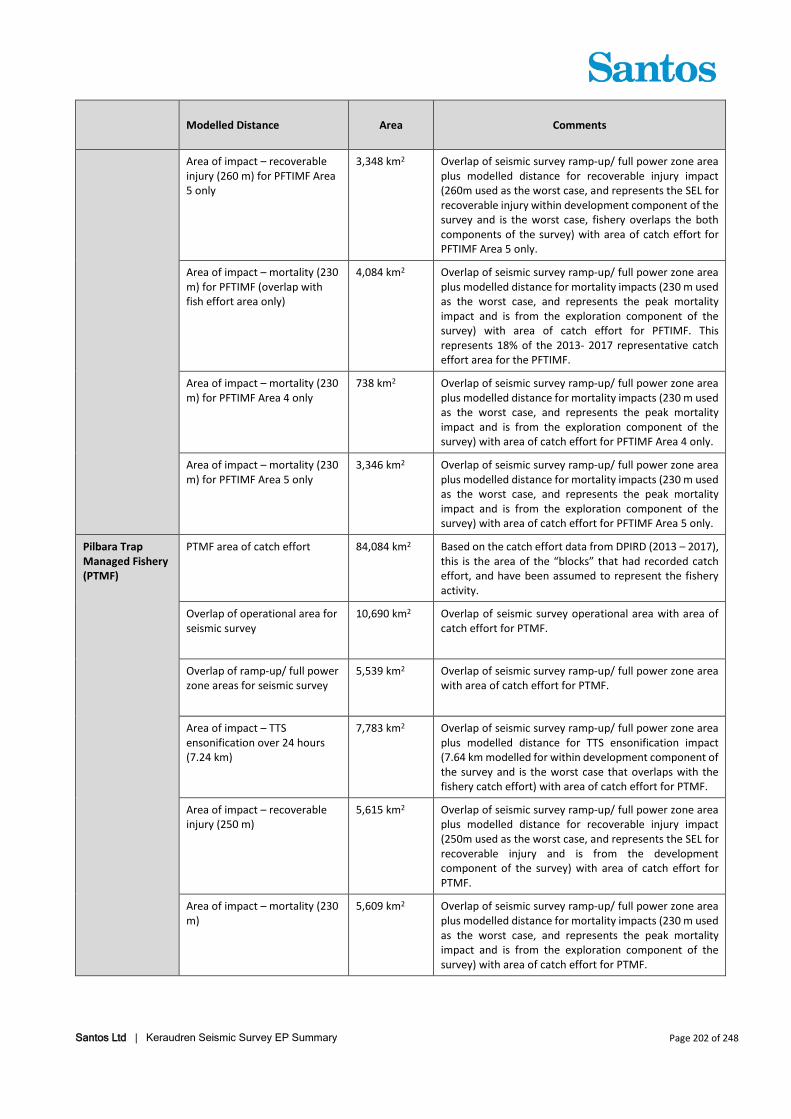
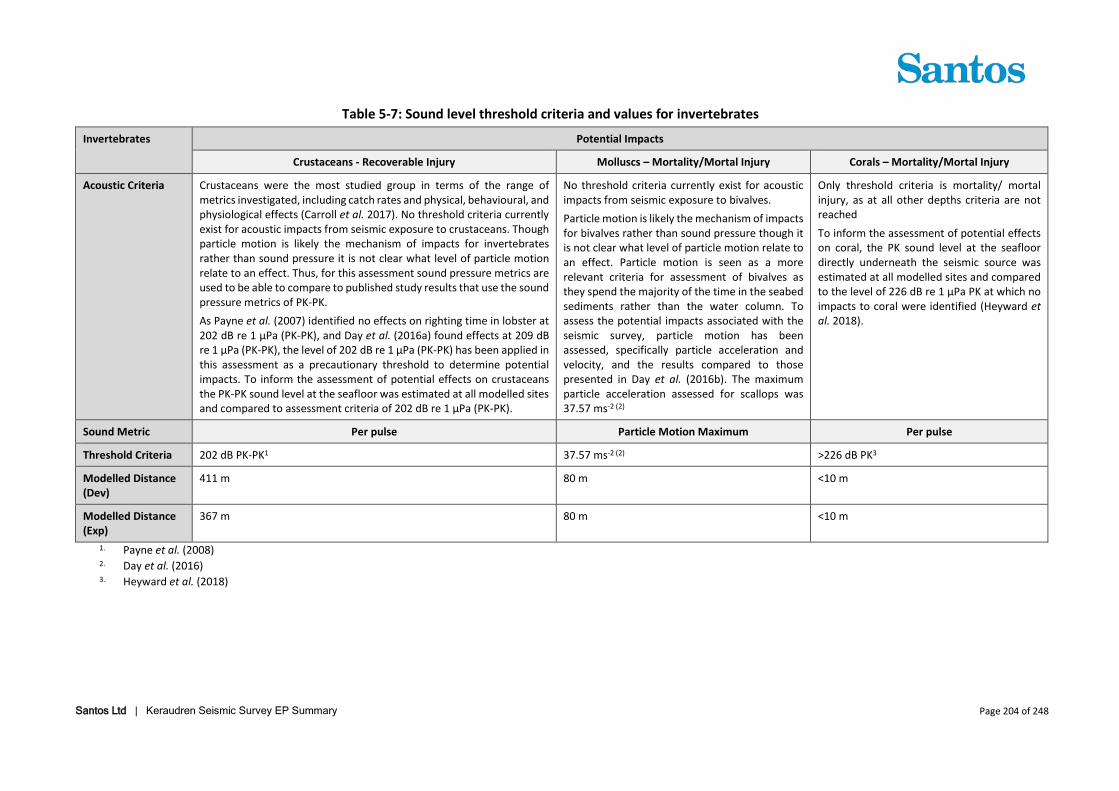
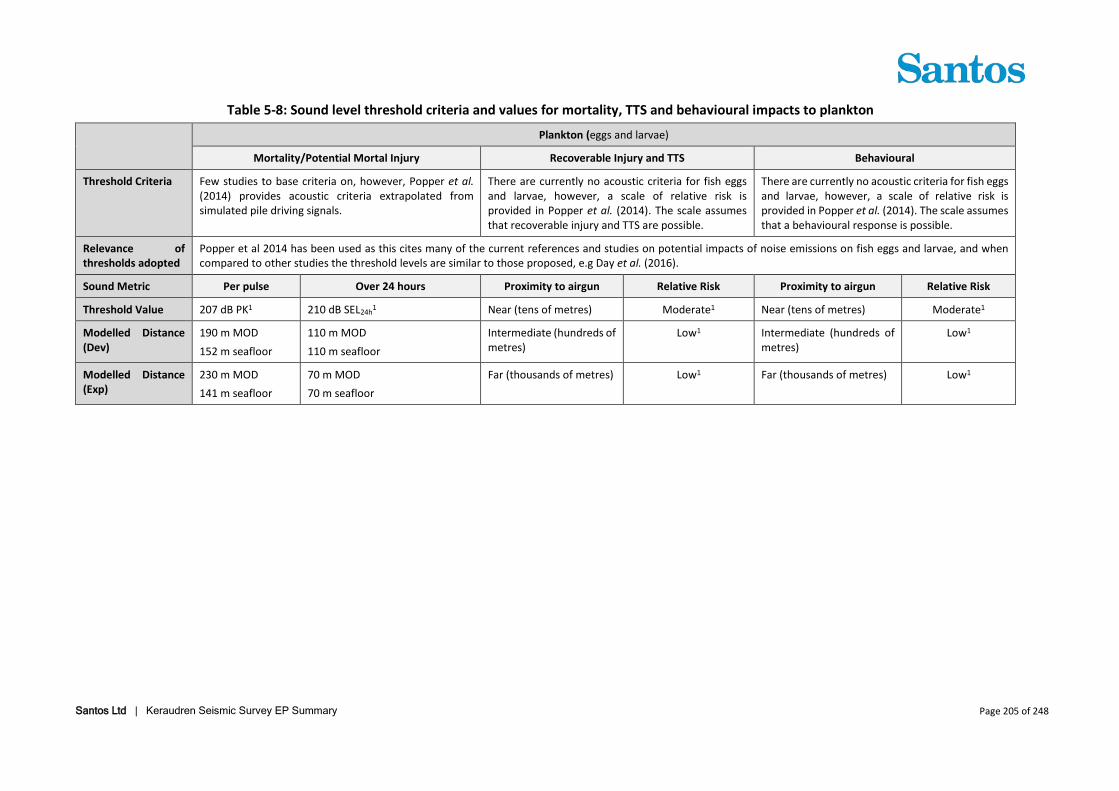
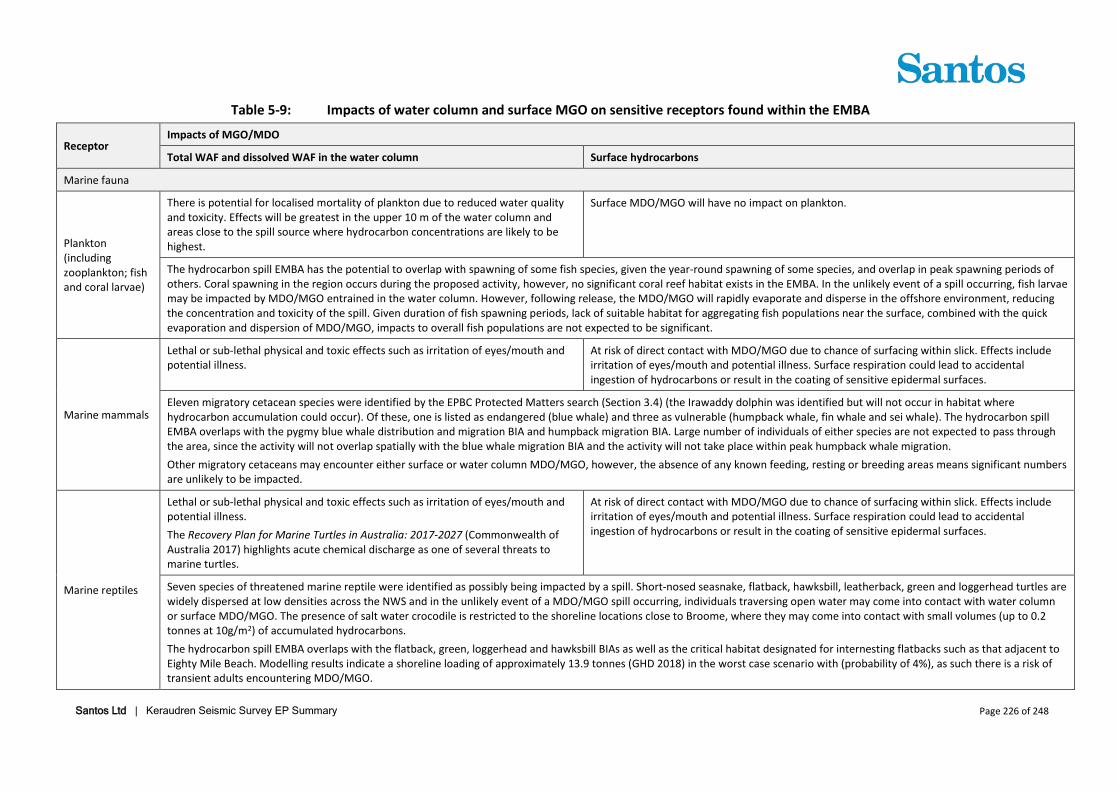
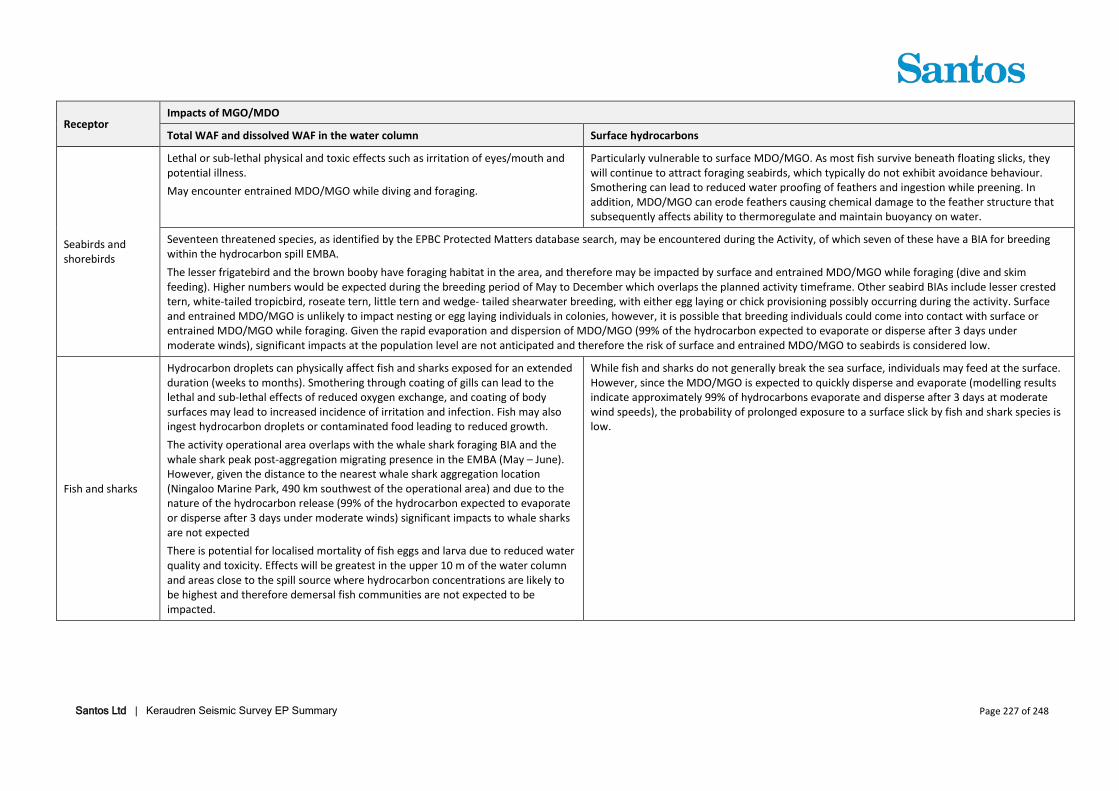
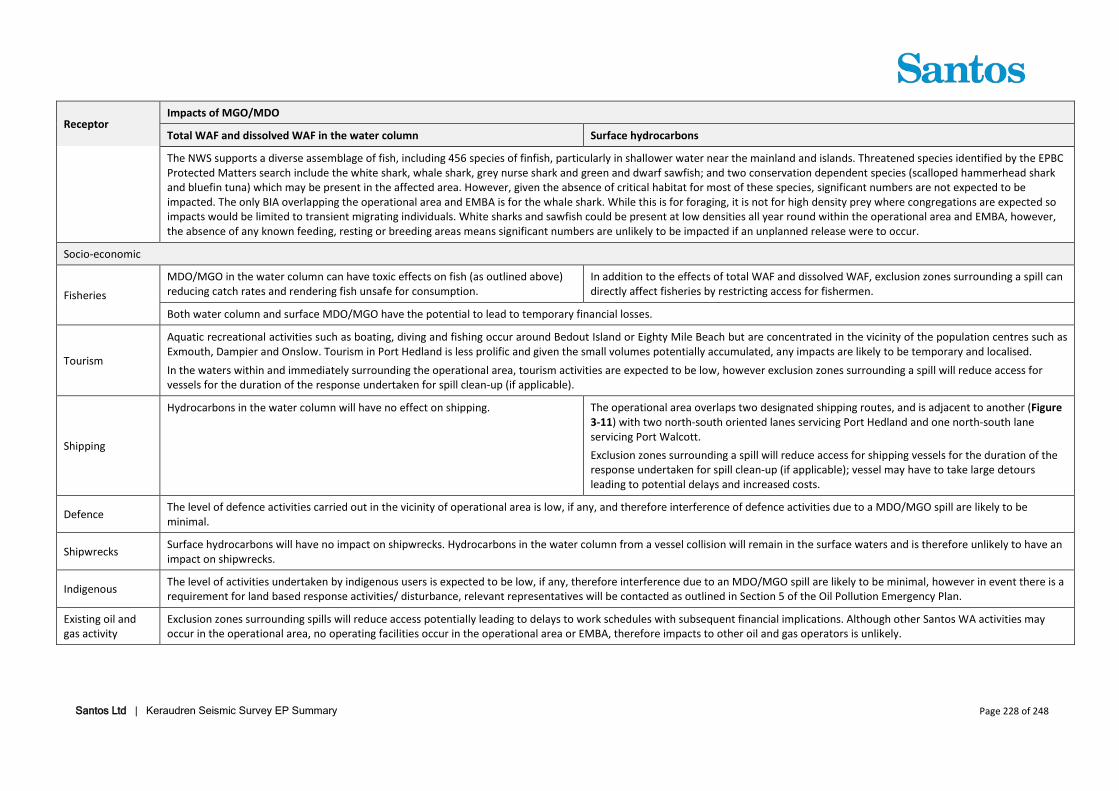
extent (legal boundaries for fishery operation), effort (level and spatial extent of known fishing effort) and resources (target species) ........................................................................................................................... 46 Table 3-8: Distribution, aggregation/ spawning for key commercial fish species in the North Coast Bioregion 73 Table 3-9: Socio-economic receptors within the EMBA .............................................................................. 80 Table 3-10: Periods of peak sensitivity or activity windows of sensitivity for the region that includes the EMBA 85 Table 4-1: Identified stakeholders for Keraudren Seismic Survey .............................................................. 91 Table 4-2: Consultation summary for activity ............................................................................................. 92 Table 5-1: Consequence level description ................................................................................................. 148 Table 5-2: Likelihood description ............................................................................................................... 148 Table 5-3: Sound level threshold criteria and values for mortality and impairment in cetaceans ........... 193 Table 5-4: Sound level threshold criteria and values for mortality, impairment and behaviour in turtles195 Table 5-5: Sound level threshold criteria and values for mortality and impairment in fish ..................... 196 Table 5-6: Potential area of impact for fisheries based on 2013 – 2017 catch effort data supplied by DPIRD 199 Table 5-7: Sound level threshold criteria and values for invertebrates .................................................... 204 Table 5-8: Sound level threshold criteria and values for mortality, TTS and behavioural impacts to plankton 205 Table 5-9: Impacts of water column and surface MGO on sensitive receptors found within the EMBA .. 226
Santos Ltd | Keraudren Seismic Survey EP Summary Page 10 of 248
1. Introduction Santos WA as operator in respect of the Keraudren Seismic Survey Environment Plan (QE-91-RI-20012.01) (the EP) will be responsible for all commitments and obligations in the EP. The title transferred name on 21 December 2018. On 27 November 2018, Santos completed its acquisition of Quadrant Energy. This had the effect that Santos Limited is now the ultimate holding company of Quadrant Energy Holdings Pty Ltd and its subsidiaries (which includes the operator in respect of this environment plan, Quadrant Energy Australia Limited). It also resulted in most of the Quadrant group of entities changing their name. Quadrant Energy Australia Limited (Quadrant) has changed its name to Santos WA Energy Limited (Santos WA). The ABN (ABN 39 009 301 964) has remained the same. The EP reflects the existing Quadrant policies, management systems, contracts and arrangements pending future transition into Santos’ management systems.
Santos WA plan to conduct marine seismic survey activities in the Bedout Sub-basin within exploration permit areas WA-435-P, WA-436-P, WA-437-P and WA-438-P, to inform location selection of future appraisal and development wells. Following a thorough survey selection process, the survey will be a modified version of a typical 3D marine seismic survey conducted with a secondary source vessel for a component of the survey. The primary survey vessel will deploy a seismic source array and streamers, a secondary vessel will deploy a seismic source only (and will be used for the Development component of the survey).
1.1 Compliance The overall purpose of the EP is to comply with statutory requirements of the Commonwealth Offshore Petroleum and Greenhouse Gas Storage (Environment) Regulations 2009 (OPGGS (E) Regulations); and to ensure that the activity is planned and conducted in line with Santos WA’s environmental policies and standards, including the corporate Environmental Policy. The EP was assessed and accepted by the National Offshore Petroleum Safety and Environmental Management Authority (NOPSEMA) on 25 March 2019. This EP summary has been prepared in accordance with the requirements of regulation 11 (4) of the OPGGS (E) Regulations.
1.2 Activity Durations and Timing All activities covered by the EP within the operational area are estimated to take 110 days to complete, including contingency for infill acquisition, weather downtime, standby and equipment failure. The timing of the activities will be dependent on vessel availability, weather conditions and receipt of the required statutory approvals. The activities will be undertaken within a window between 1 March 2019 and 31 July 2019.
At any time during the survey activity the survey vessels will depart the operational area if, in the opinion of the survey vessel masters, the safety of the vessels and crew members is at risk e.g. in the event of severe sea/weather conditions restricting manoeuvring capabilities.
Santos Ltd | Keraudren Seismic Survey EP Summary Page 11 of 248
2. Description of the Activity
2.1 Overview Recent exploration drilling undertaken by Quadrant in the Bedout Sub-basin has identified hydrocarbons within several reservoirs. To further appraise the hydrocarbon resources for development, Santos WA require additional subsurface data via a seismic survey. The existing acquired seismic data is not adequate for design and location of development wells.
Previous seismic survey data (including the Capreolous 3D MSS acquired in 2015) has revealed unique geology in the Bedout Basin. This affects the way in which sound waves generated by the seismic source are reflected by the subsurface formations, resulting in data anomalies from the shallower formations which reduce the interpretive value of the data for the deeper formations of interest. Furthermore, the target reservoirs are in excess of 4,000 m below the seafloor requiring acquisition of long offset data (hence the specification of 9,100 m long streamers). Existing seismic data provides information on the geology above the reservoir, but the images of the reservoir formation are inadequate for development design.
Key terminology is defined in Table 2-1 to clarify the activity and impact assessment sections. Table 2-1: Key terminology
Term Explanation
Activity The Keraudren 3D Marine Seismic Survey (MSS), including all supporting activities
Secondary vessel Seismic survey vessel towing secondary source arrays and no streamers
Source array Comprises the configuration of airguns required to discharge the required volume
Primary sources Two individual source arrays, towed by the Primary vessel
Secondary sources Two individual source arrays, towed by the Secondary vessel
Primary sail lines Sail lines traversed by the Primary vessel
Secondary sail lines Sail lines traversed by the Secondary vessel
Racetrack The method by which sail lines are traversed to acquire the seismic survey data, comprising circuits that resemble a simple racetrack
Seismic source interval Interval between individual seismic pulses, sometimes referred to as “source point interval”
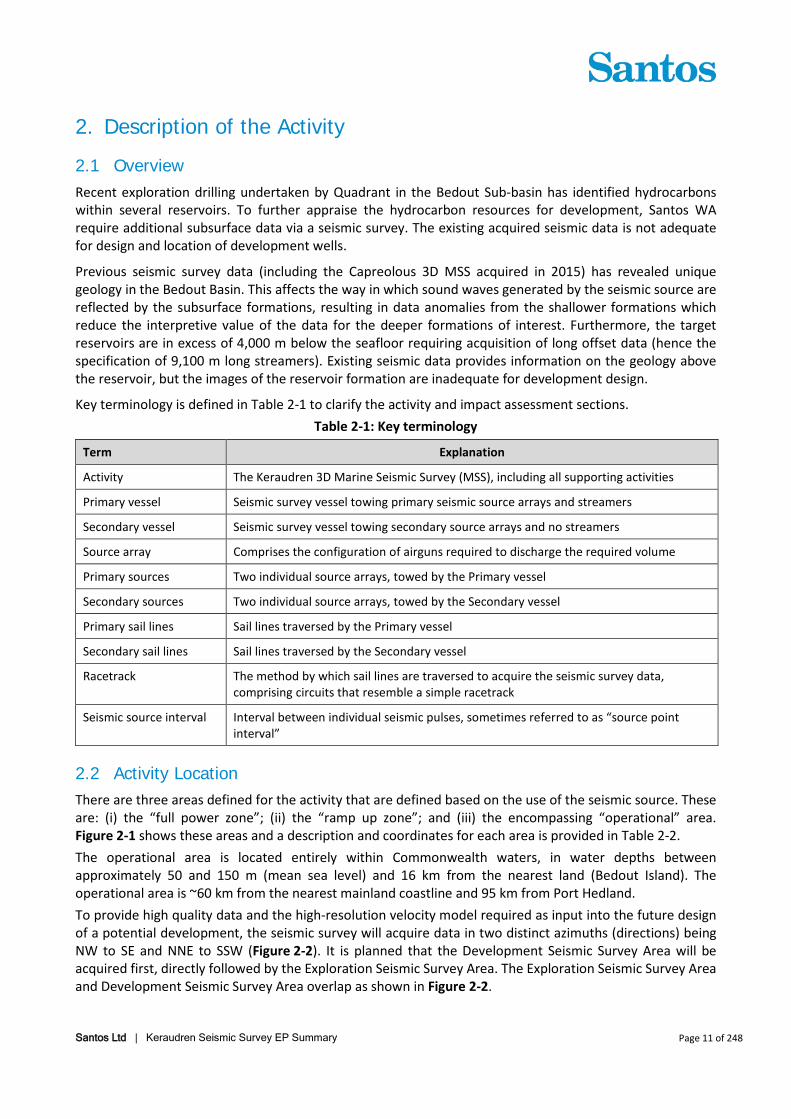
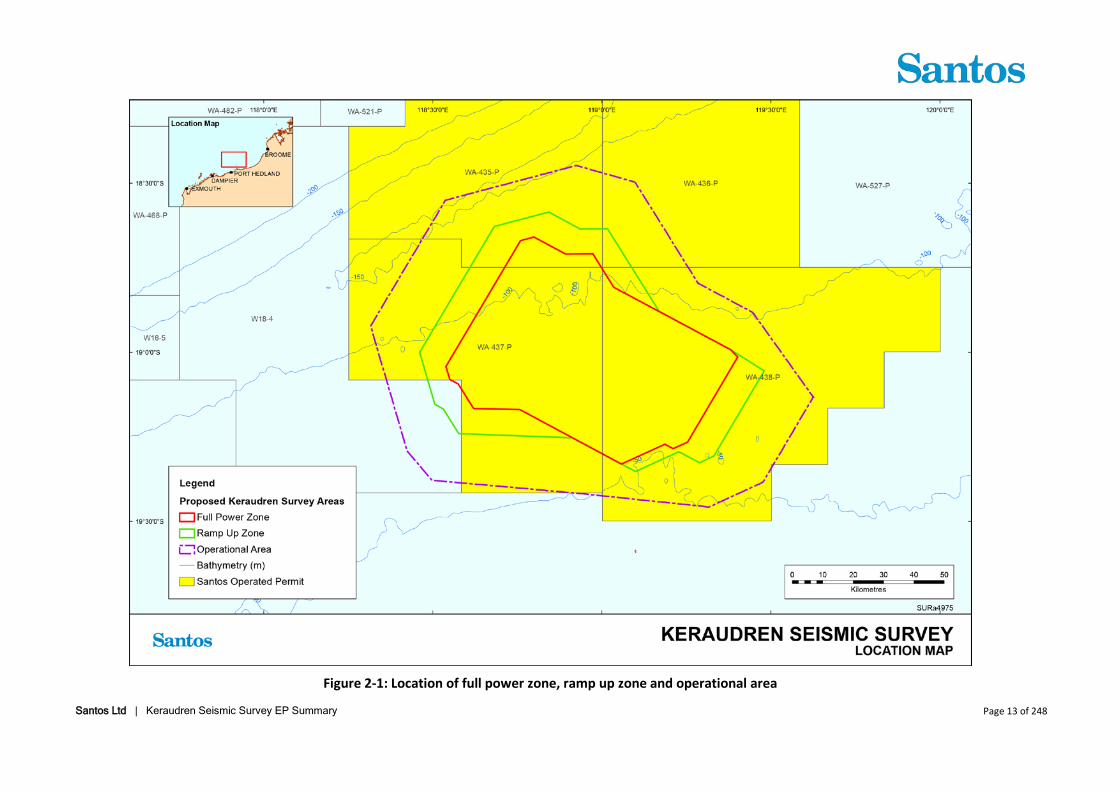
2.2 Activity Location There are three areas defined for the activity that are defined based on the use of the seismic source. These are: (i) the “full power zone”; (ii) the “ramp up zone”; and (iii) the encompassing “operational” area. Figure 2-1 shows these areas and a description and coordinates for each area is provided in Table 2-2. The operational area is located entirely within Commonwealth waters, in water depths between approximately 50 and 150 m (mean sea level) and 16 km from the nearest land (Bedout Island). The operational area is ~60 km from the nearest mainland coastline and 95 km from Port Hedland. To provide high quality data and the high-resolution velocity model required as input into the future design of a potential development, the seismic survey will acquire data in two distinct azimuths (directions) being NW to SE and NNE to SSW (Figure 2-2). It is planned that the Development Seismic Survey Area will be acquired first, directly followed by the Exploration Seismic Survey Area. The Exploration Seismic Survey Area and Development Seismic Survey Area overlap as shown in Figure 2-2.
Santos Ltd | Keraudren Seismic Survey EP Summary Page 12 of 248
Table 2-2: Proposed Keraudren 3D MSS areas of operation and coordinates
Operational Area Ramp Up Zone1 Full Power Zone1
The operational area defines the area within which the seismic vessels will operate during the normal conduct of the activity. It includes the full power and ramp up zones, but also a working buffer beyond these zones. The operations to be conducted within this area include active acquisition within the full power zone, source emissions within the ramp up zone, line changes, general equipment maintenance and other miscellaneous activities.
This is a zone that lies beyond the full power zone. Typically, this zone will be used to incrementally build the power of the sources from non-operation to full capacity, for the purpose of soft starts. Additionally, this zone also may be used for occasional source testing at, or below, full capacity. No seismic source will be operated in any capacity outside of the ramp up + full power zones.
This is the area within which the seismic sources will be operated in full acquisition mode to achieve the geophysical objectives of the survey. Within this zone, the normal mode of operation is to systematically traverse the pre-determined sail lines using the sources at full capacity. However, the sources may also be used at less than full capacity within this zone.
Area: 10,690 km2 (Operational Area + Ramp Up Zone + Full Power Zone)
Area: 1,667 km2 Area: 3,872 km2
Total Area1: 5,539 km2 (Ramp Up + Full Power Zones)
Longitude Latitude Longitude Latitude Longitude Latitude
Note: 1 – For the purpose of the noise impact assessment in Section 5.3.3 this includes for both the Ramp Up Zone and the Full Power Zone.
Santos Ltd | Keraudren Seismic Survey EP Summary Page 13 of 248
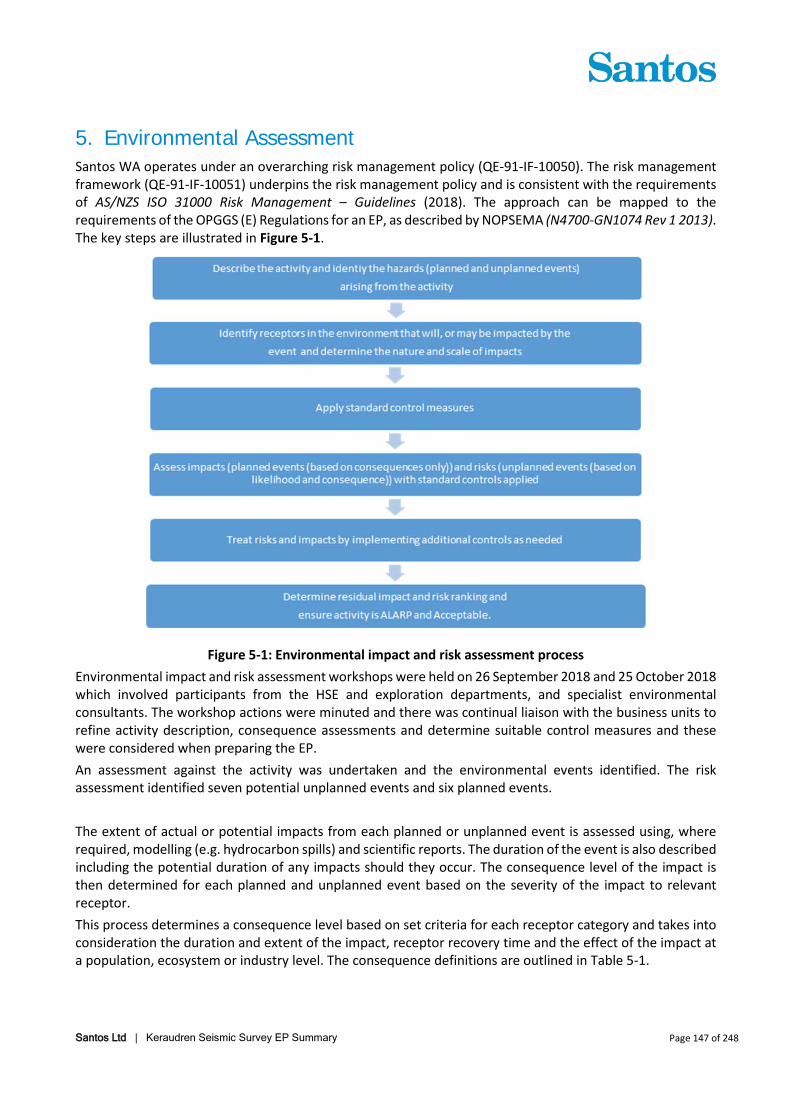
Figure 2-1: Location of full power zone, ramp up zone and operational area
Santos Ltd | Keraudren Seismic Survey EP Summary Page 14 of 248
Figure 2-2: Exploration and Development Survey Areas, and notional location of potential future wells
Santos Ltd | Keraudren Seismic Survey EP Summary Page 15 of 248
2.3 Acquisition Parameters The development component and exploration component of the seismic survey are described in the sections below and shown in Figure 2-2.
2.3.1 Development Component The proposed survey is a modified version of a typical 3D marine seismic survey with the use of a Primary vessel and a Secondary vessel for acquisition within the development component of the survey. The Secondary vessel will be deployed approximately 3,000 m behind the Primary seismic vessel and laterally offset by 225 m. The Primary vessel will be equipped in the usual manner of a typical 3D survey, towing two source arrays and twelve streamers. The Secondary vessel will deploy two source arrays and will not tow any streamers.
During the proposed seismic acquisition, the Primary vessel will traverse a series of pre-determined sail lines (primary sail lines) spaced at 450 m apart. The Primary source arrays will be separated by 112.5 m and will be deployed such that the port array is positioned 56.25 m to the port side of the sail line and the starboard array is positioned 56.25 m to the starboard side of the sail line (Figure 2-3). The Secondary vessel will traverse an independent set of sail lines (secondary sail lines) which are laterally offset by 225 m to the primary sail lines. The Secondary source arrays will be separated by 112.5 m, with the port array 56.25 m to the port side of the secondary sail line and the starboard array 56.25 m to the starboard side of the secondary sail line.
Each vessel will traverse its respective sail lines within the ramp up and full power zones at a speed of approximately 4.5 knots (8.3 km/hr). The four individual source arrays will be operated alternately every 25 m while travelling along the sail line, in such a manner that individual source pulses will be made every 6.25 m. That is, the Primary vessel will initially operate its port source, then it will be followed by the Secondary vessel port source, then followed by the Primary starboard source, and finally followed by the Secondary starboard source. This sequence will be repeated as the acquisition progresses, thereby providing a single source pulse every 6.25 m (approximately every 2.7 sec). Consecutive pulses will be separated in distance by approximately 3,000 m.
The timing is termed approximate, because the precise timing of each individual seismic pulse is governed by each vessel’s speed, which, in turn, is primarily determined by the independent dynamic sea conditions experienced by the individual vessel. The sea state, wind and currents combine to cause a vessel’s speed to constantly change.
Assuming average vessel speed of 8.3 km/hr, the Secondary vessel will follow the Primary vessel by approximately 22 minutes. Therefore, at any given position along the sail line, two pairs of seismic pulses will be experienced, each pair separated in time by approximately 22 minutes, and each individual pulse separated by a lateral distance of 112.5 m.
2.3.2 Exploration Component The exploration component of the survey will be undertaken using only the Primary vessel. During the proposed seismic acquisition (Figure 2-3), the Primary vessel will traverse a series of pre-determined sail lines spaced at 450 m apart. The Primary source arrays will be separated by 112.5 m and will be deployed such that the port array is positioned 56.25 m to the port side of the sail line and the starboard array is positioned 56.25 m to the starboard side of the sail line. The Primary vessel will traverse its respective sail lines within the ramp up and full power zone at a speed of approximately 4.5 knots (8.3 km/hr). The Primary vessel will operate each of its two source arrays alternately every 25 m while travelling along the sail line, giving rise to individual seismic pulses every 12.5 m. The above mode of acquisition will produce seismic pulses approximately every 5.4 seconds.
Santos Ltd | Keraudren Seismic Survey EP Summary Page 16 of 248
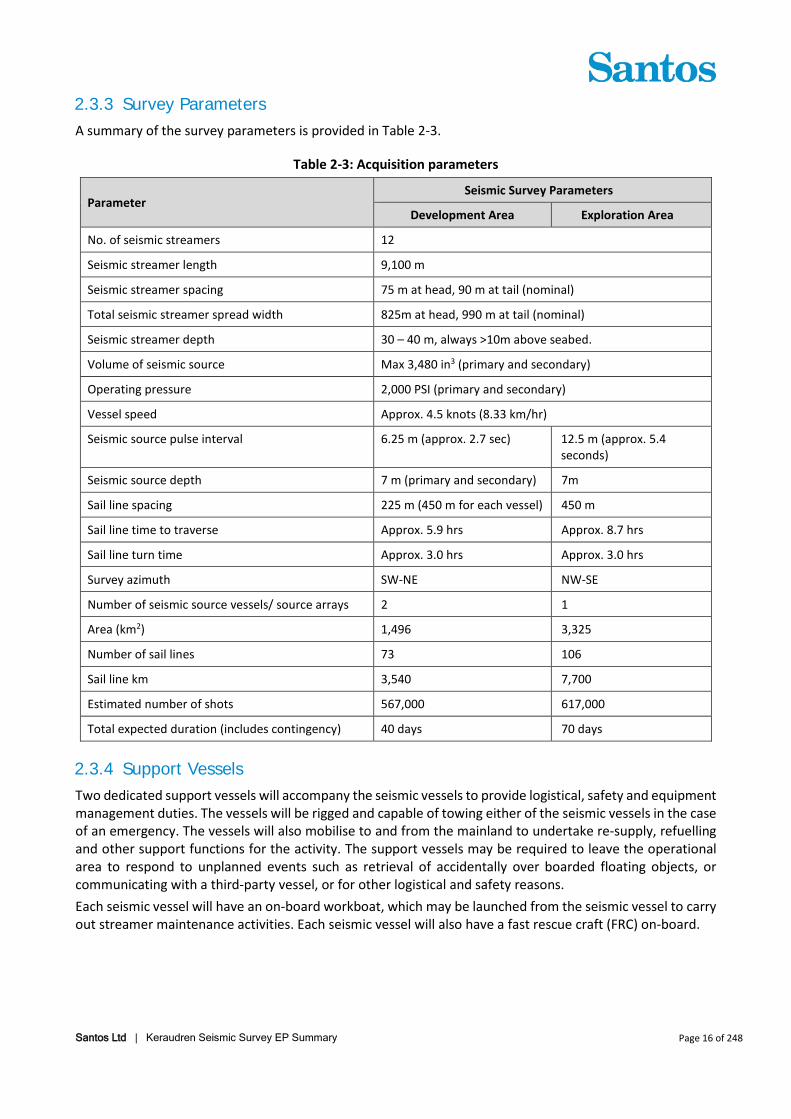
2.3.3 Survey Parameters A summary of the survey parameters is provided in Table 2-3.
Table 2-3: Acquisition parameters
Parameter Seismic Survey Parameters
Development Area Exploration Area
No. of seismic streamers 12
Seismic streamer length 9,100 m
Seismic streamer spacing 75 m at head, 90 m at tail (nominal)
Total seismic streamer spread width 825m at head, 990 m at tail (nominal)
Volume of seismic source Max 3,480 in3 (primary and secondary)
Operating pressure 2,000 PSI (primary and secondary)
Vessel speed Approx. 4.5 knots (8.33 km/hr)
Seismic source pulse interval 6.25 m (approx. 2.7 sec) 12.5 m (approx. 5.4 seconds)
Seismic source depth 7 m (primary and secondary) 7m
Sail line spacing 225 m (450 m for each vessel) 450 m
Sail line time to traverse Approx. 5.9 hrs Approx. 8.7 hrs
Sail line turn time Approx. 3.0 hrs Approx. 3.0 hrs
Survey azimuth SW-NE NW-SE
Number of seismic source vessels/ source arrays 2 1
Area (km2) 1,496 3,325
Number of sail lines 73 106
Sail line km 3,540 7,700
Estimated number of shots 567,000 617,000
Total expected duration (includes contingency) 40 days 70 days
2.3.4 Support Vessels Two dedicated support vessels will accompany the seismic vessels to provide logistical, safety and equipment management duties. The vessels will be rigged and capable of towing either of the seismic vessels in the case of an emergency. The vessels will also mobilise to and from the mainland to undertake re-supply, refuelling and other support functions for the activity. The support vessels may be required to leave the operational area to respond to unplanned events such as retrieval of accidentally over boarded floating objects, or communicating with a third-party vessel, or for other logistical and safety reasons. Each seismic vessel will have an on-board workboat, which may be launched from the seismic vessel to carry out streamer maintenance activities. Each seismic vessel will also have a fast rescue craft (FRC) on-board.
Santos Ltd | Keraudren Seismic Survey EP Summary Page 17 of 248
Figure 2-3: Seismic vessels configuration for starboard streamer feather (top) and port feather (bottom)
(not to scale) for the development component of the survey (dual source)
Santos Ltd | Keraudren Seismic Survey EP Summary Page 18 of 248
3. Description of the Environment
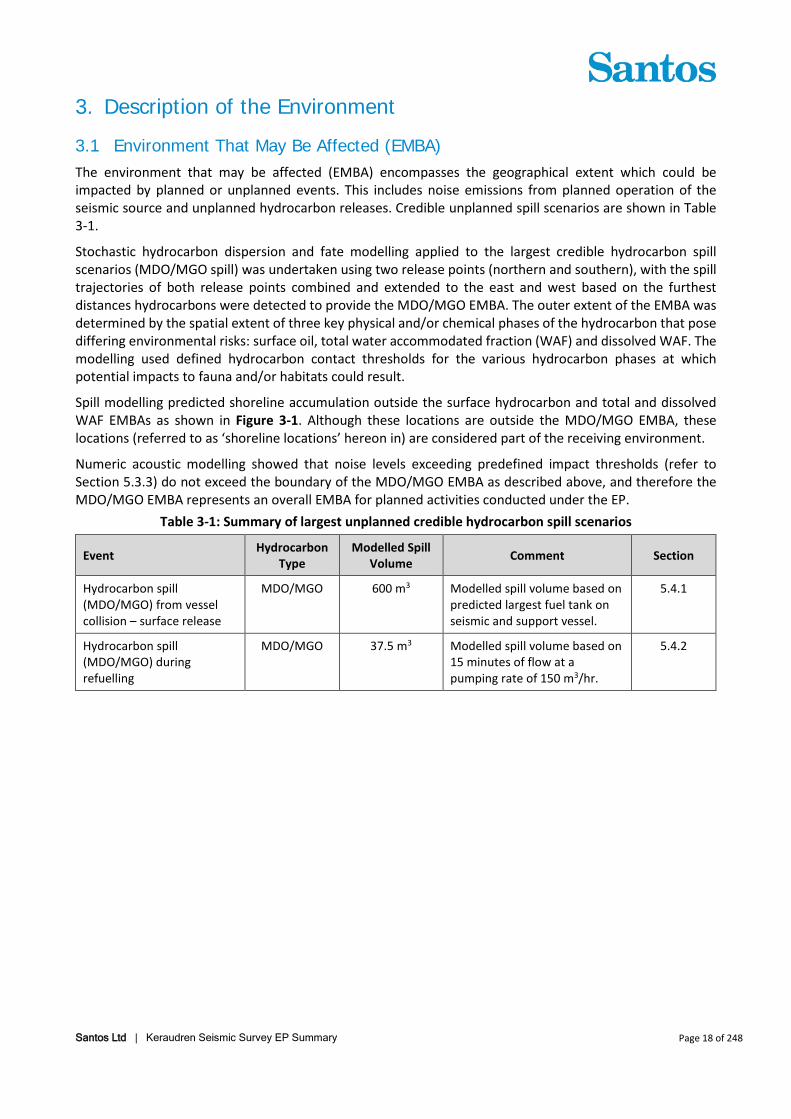
3.1 Environment That May Be Affected (EMBA) The environment that may be affected (EMBA) encompasses the geographical extent which could be impacted by planned or unplanned events. This includes noise emissions from planned operation of the seismic source and unplanned hydrocarbon releases. Credible unplanned spill scenarios are shown in Table 3-1.
Stochastic hydrocarbon dispersion and fate modelling applied to the largest credible hydrocarbon spill scenarios (MDO/MGO spill) was undertaken using two release points (northern and southern), with the spill trajectories of both release points combined and extended to the east and west based on the furthest distances hydrocarbons were detected to provide the MDO/MGO EMBA. The outer extent of the EMBA was determined by the spatial extent of three key physical and/or chemical phases of the hydrocarbon that pose differing environmental risks: surface oil, total water accommodated fraction (WAF) and dissolved WAF. The modelling used defined hydrocarbon contact thresholds for the various hydrocarbon phases at which potential impacts to fauna and/or habitats could result.
Spill modelling predicted shoreline accumulation outside the surface hydrocarbon and total and dissolved WAF EMBAs as shown in Figure 3-1. Although these locations are outside the MDO/MGO EMBA, these locations (referred to as ‘shoreline locations’ hereon in) are considered part of the receiving environment.
Numeric acoustic modelling showed that noise levels exceeding predefined impact thresholds (refer to Section 5.3.3) do not exceed the boundary of the MDO/MGO EMBA as described above, and therefore the MDO/MGO EMBA represents an overall EMBA for planned activities conducted under the EP.
Table 3-1: Summary of largest unplanned credible hydrocarbon spill scenarios
Event Hydrocarbon Type
Modelled Spill Volume Comment Section
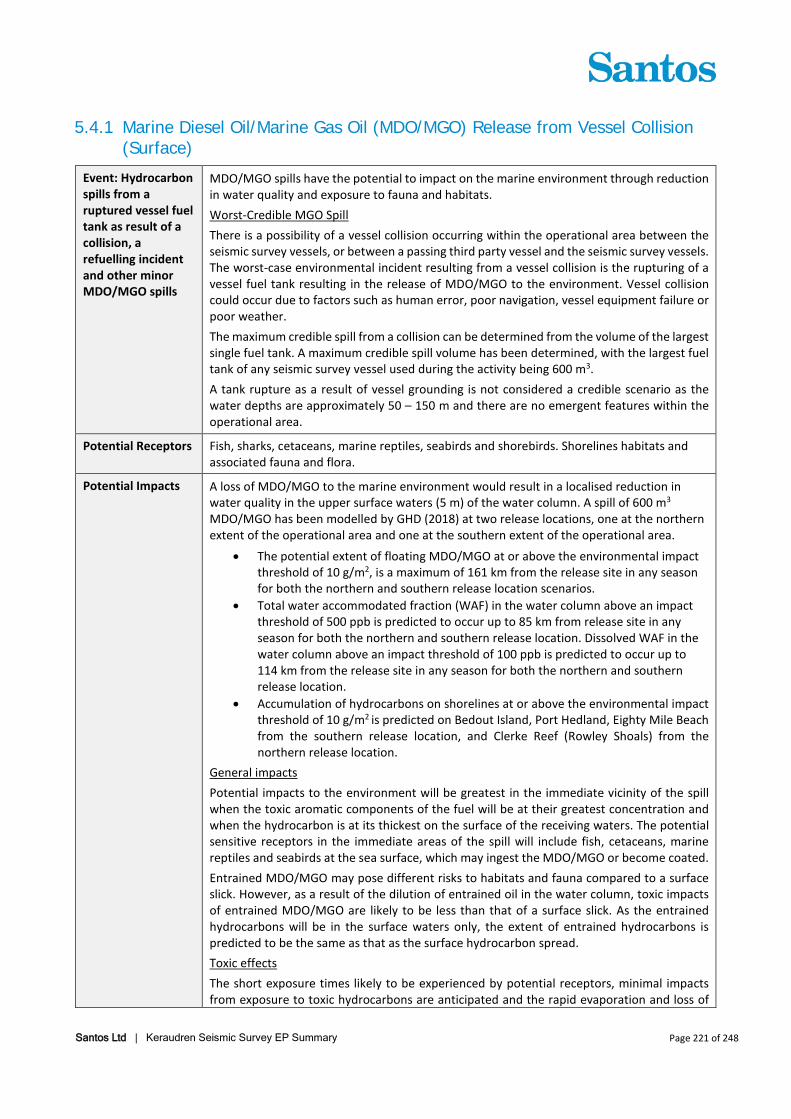
Hydrocarbon spill (MDO/MGO) from vessel collision – surface release
MDO/MGO 600 m3 Modelled spill volume based on predicted largest fuel tank on seismic and support vessel.
5.4.1
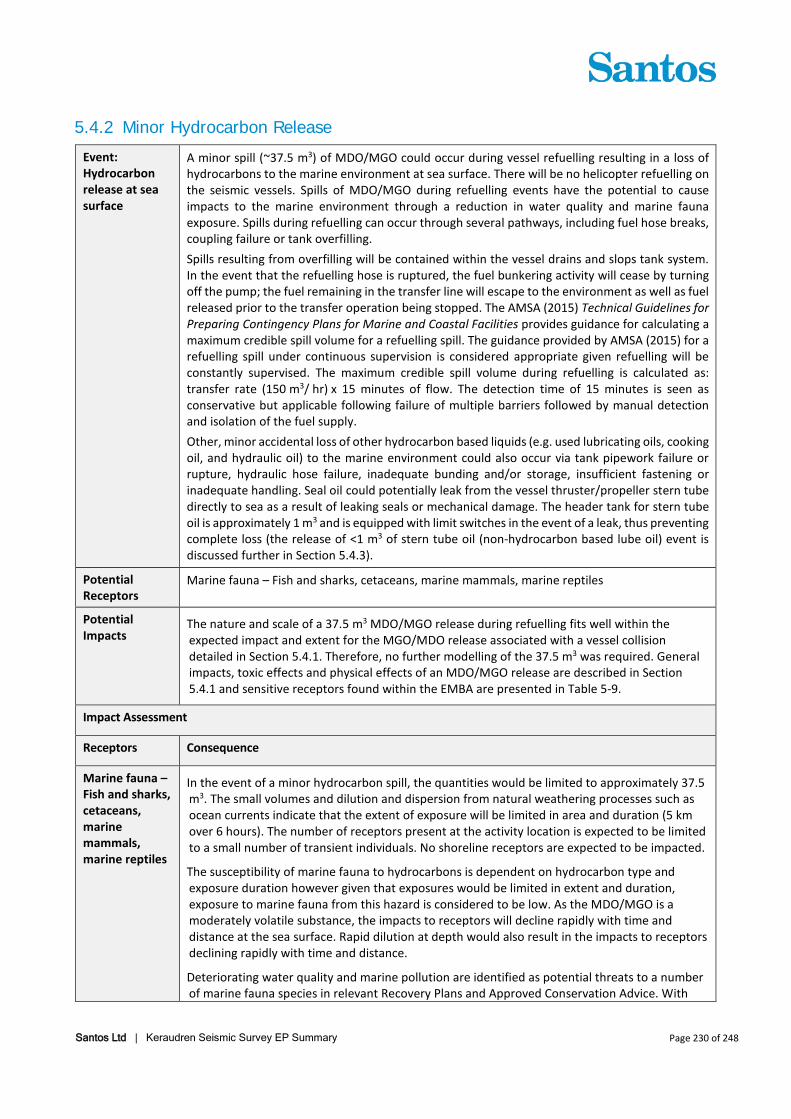
Hydrocarbon spill (MDO/MGO) during refuelling
MDO/MGO 37.5 m3 Modelled spill volume based on 15 minutes of flow at a pumping rate of 150 m3/hr.
5.4.2
Santos Ltd | Keraudren Seismic Survey EP Summary Page 19 of 248
Figure 3-1: EMBA from the unplanned event of a worst-case MDO/MGO spill (surface oil, total water accommodated fraction (WAF) and dissolved WAF).
Locations outside the EMBA where hydrocarbons may accumulate on shorelines are shown in pink (10 g/m2 - 100 g/m2) and green (>100 g/m2)
Santos Ltd | Keraudren Seismic Survey EP Summary Page 20 of 248
3.2 Physical Environment and Habitat
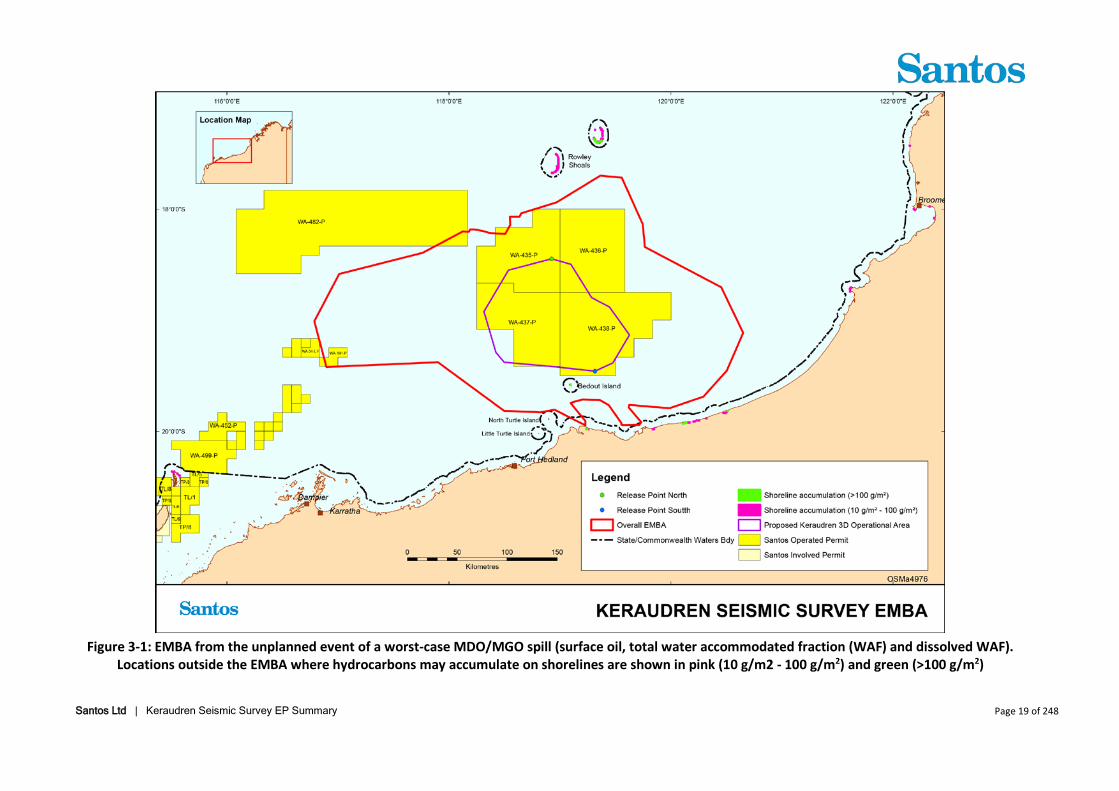
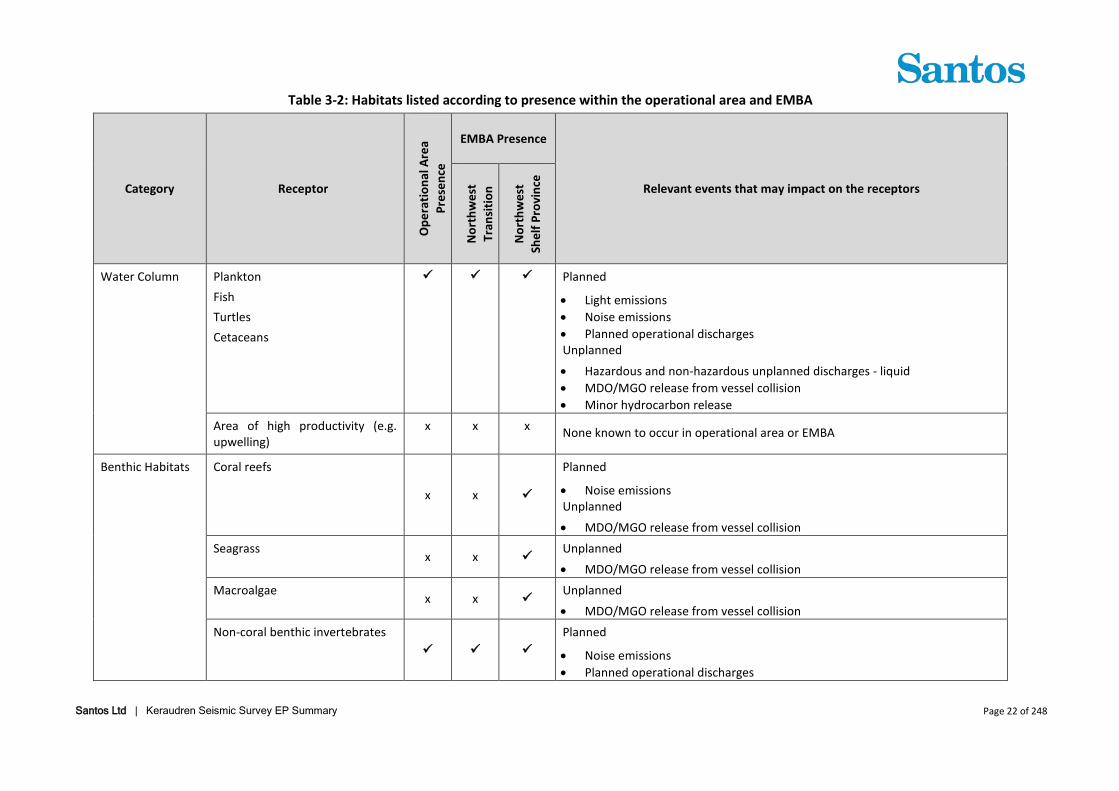
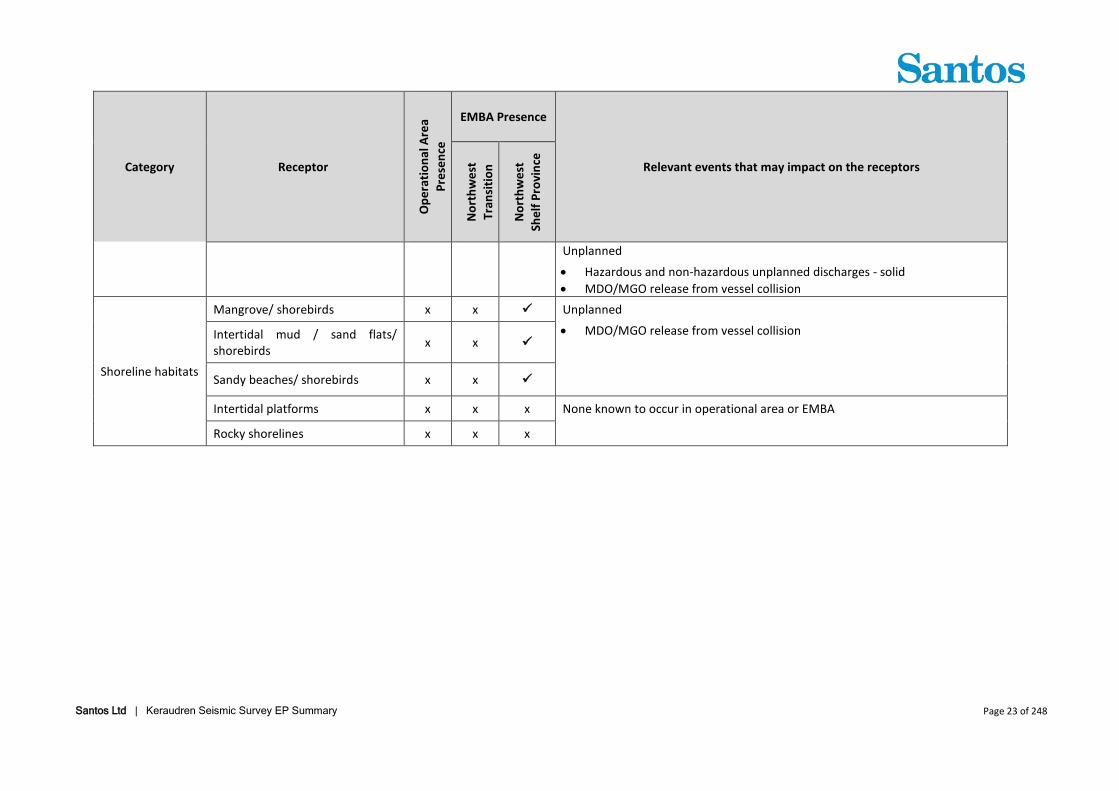
3.2.1 Physical Environment The operational area is situated within Commonwealth waters of the North-west Marine Region (DSEWPaC 2012). The North-west Marine Region (NWMR) is further divided into eight provincial bioregions defined under the Integrated and Marine and Coastal Regionalisation of Australia (IMCRA) Version 4.0 (DSEWPaC 2012). The operational area overlaps the Northwest Shelf Province and the EMBA overlaps the Northwest Shelf Province and Northwest Transition bioregions (Figure 3-2). The presence of marine and shoreline habitats within the operational area and EMBA is summarised in Table 3-2.
Santos Ltd | Keraudren Seismic Survey EP Summary Page 21 of 248
Figure 3-2: IMCRA 4.0 Provincial Bioregions within overlapping the EMBA
Santos Ltd | Keraudren Seismic Survey EP Summary Page 22 of 248
Table 3-2: Habitats listed according to presence within the operational area and EMBA
Santos Ltd | Keraudren Seismic Survey EP Summary Page 23 of 248
Category Receptor
Ope
ratio
nal A
rea
Pres
ence
EMBA Presence
Relevant events that may impact on the receptors
Nor
thw
est
Tran
sitio
n
Nor
thw
est
Shel
f Pro
vinc
e
Unplanned
• Hazardous and non-hazardous unplanned discharges - solid • MDO/MGO release from vessel collision
Shoreline habitats
Mangrove/ shorebirds x x Unplanned
• MDO/MGO release from vessel collision Intertidal mud / sand flats/ shorebirds x x
Sandy beaches/ shorebirds x x
Intertidal platforms x x x None known to occur in operational area or EMBA
Rocky shorelines x x x
Santos Ltd | Keraudren Seismic Survey EP Summary Page 24 of 248
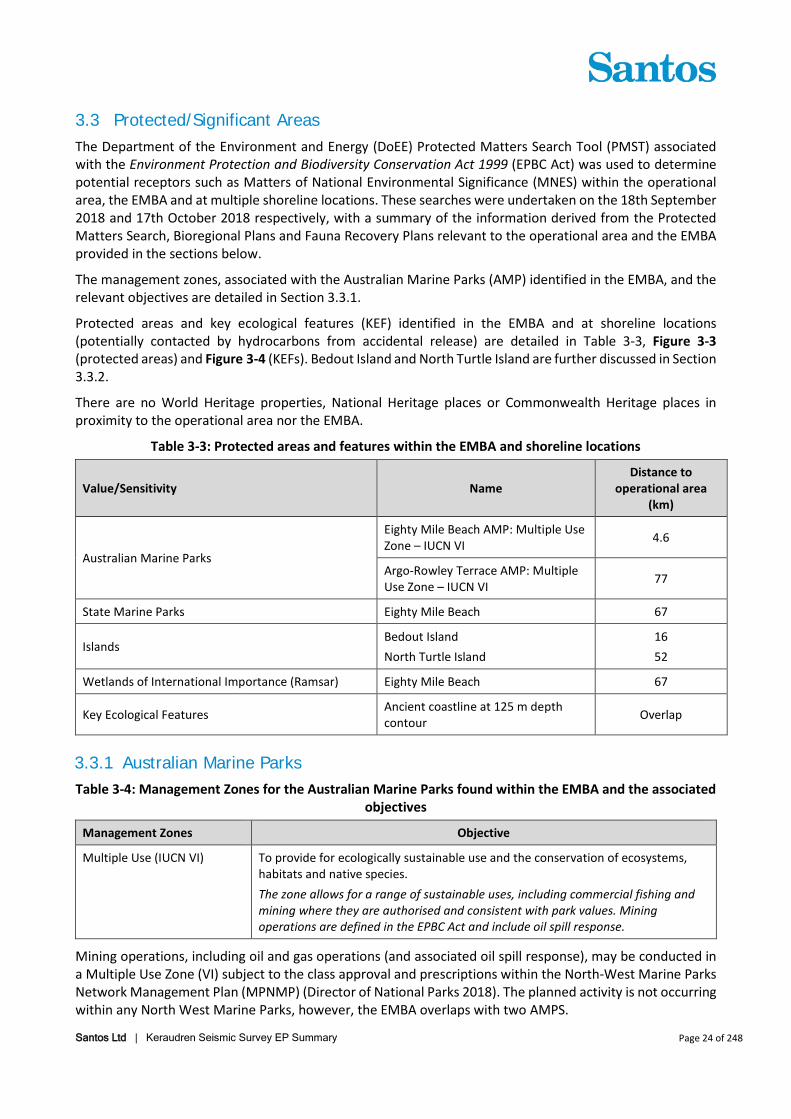
3.3 Protected/Significant Areas The Department of the Environment and Energy (DoEE) Protected Matters Search Tool (PMST) associated with the Environment Protection and Biodiversity Conservation Act 1999 (EPBC Act) was used to determine potential receptors such as Matters of National Environmental Significance (MNES) within the operational area, the EMBA and at multiple shoreline locations. These searches were undertaken on the 18th September 2018 and 17th October 2018 respectively, with a summary of the information derived from the Protected Matters Search, Bioregional Plans and Fauna Recovery Plans relevant to the operational area and the EMBA provided in the sections below.
The management zones, associated with the Australian Marine Parks (AMP) identified in the EMBA, and the relevant objectives are detailed in Section 3.3.1.
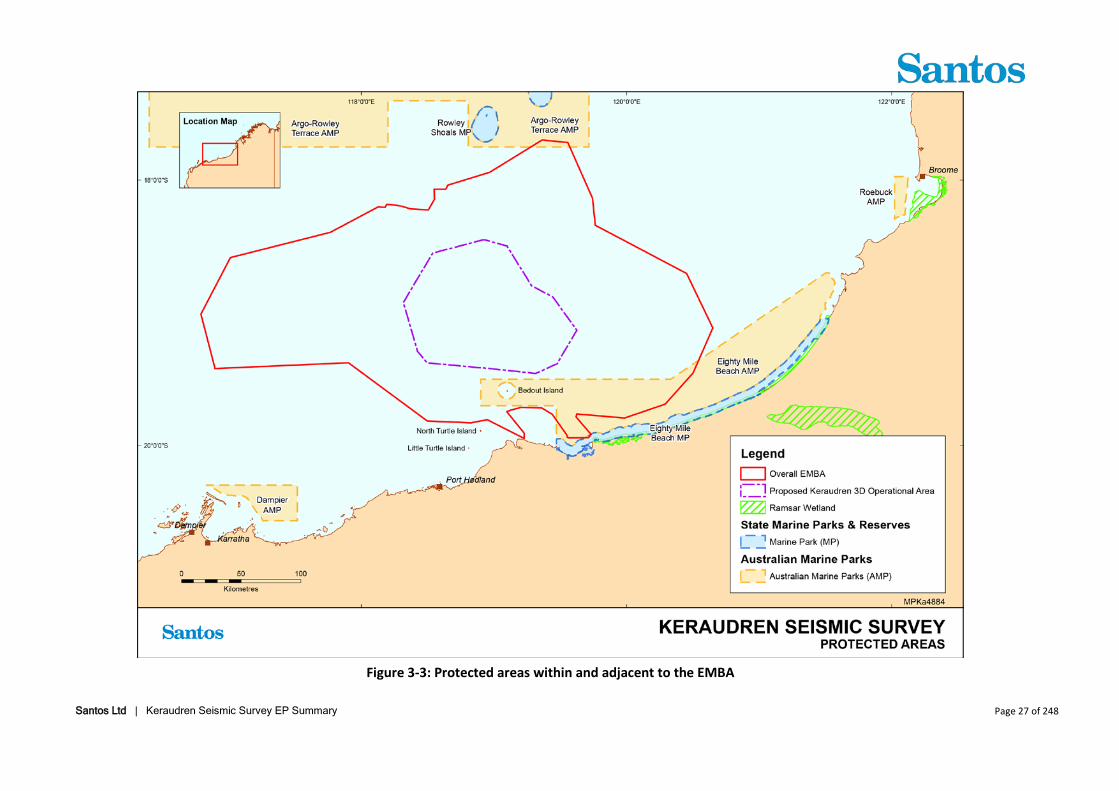
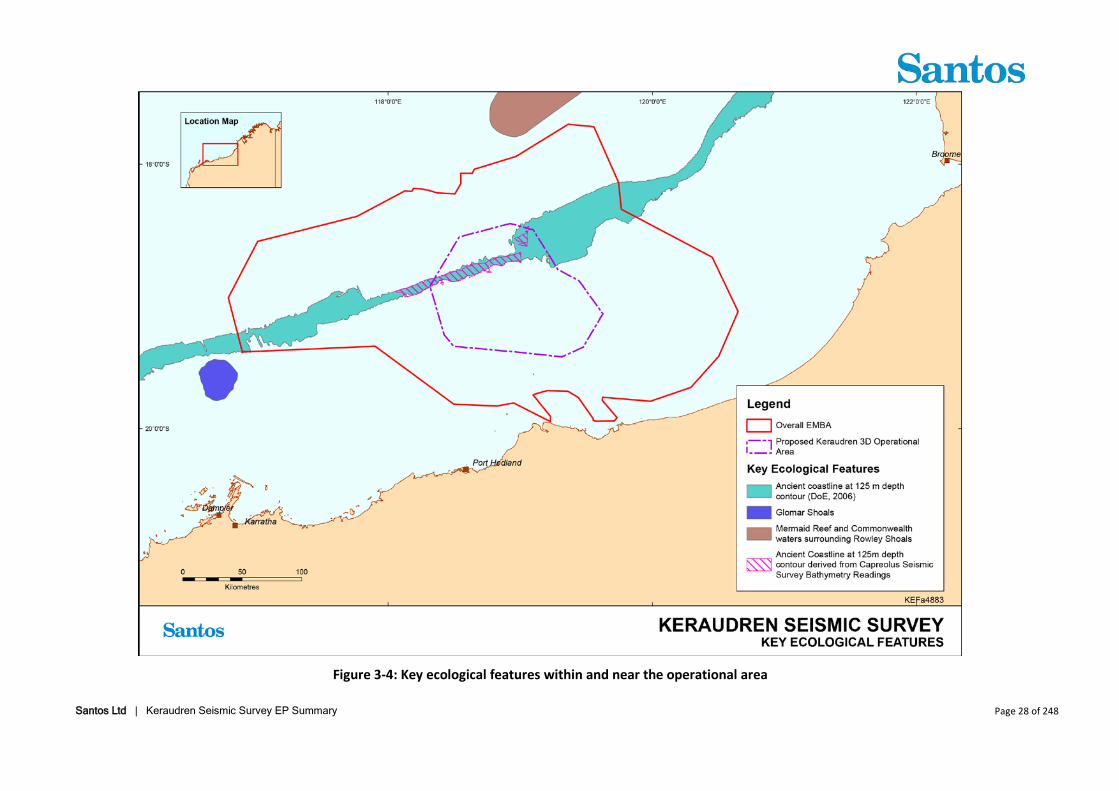
Protected areas and key ecological features (KEF) identified in the EMBA and at shoreline locations (potentially contacted by hydrocarbons from accidental release) are detailed in Table 3-3, Figure 3-3 (protected areas) and Figure 3-4 (KEFs). Bedout Island and North Turtle Island are further discussed in Section 3.3.2.
There are no World Heritage properties, National Heritage places or Commonwealth Heritage places in proximity to the operational area nor the EMBA.
Table 3-3: Protected areas and features within the EMBA and shoreline locations
Value/Sensitivity Name Distance to
operational area (km)
Australian Marine Parks
Eighty Mile Beach AMP: Multiple Use Zone – IUCN VI 4.6
Argo-Rowley Terrace AMP: Multiple Use Zone – IUCN VI 77
State Marine Parks Eighty Mile Beach 67
Islands Bedout Island North Turtle Island
16 52
Wetlands of International Importance (Ramsar) Eighty Mile Beach 67
Key Ecological Features Ancient coastline at 125 m depth contour Overlap
3.3.1 Australian Marine Parks Table 3-4: Management Zones for the Australian Marine Parks found within the EMBA and the associated
objectives
Management Zones Objective
Multiple Use (IUCN VI) To provide for ecologically sustainable use and the conservation of ecosystems, habitats and native species. The zone allows for a range of sustainable uses, including commercial fishing and mining where they are authorised and consistent with park values. Mining operations are defined in the EPBC Act and include oil spill response.
Mining operations, including oil and gas operations (and associated oil spill response), may be conducted in a Multiple Use Zone (VI) subject to the class approval and prescriptions within the North-West Marine Parks Network Management Plan (MPNMP) (Director of National Parks 2018). The planned activity is not occurring within any North West Marine Parks, however, the EMBA overlaps with two AMPS.
Santos Ltd | Keraudren Seismic Survey EP Summary Page 25 of 248
The ‘Class Approval – Mining Operations and Green House Gas Activities’ for the North-West MPNMP came into effect on 1 July 2018. In the event of spill response operations being required within an AMP, the activity is allowed in accordance with the Australian National Plan for Maritime Environmental Emergencies (MEE) without the need for a permit, class approval or activity licence or lease issued by the Director.
3.3.2 Bedout Island and North Turtle Island Bedout Island is a low and undulating, 31 ha sandy clay on limestone bedrock, heavily vegetated with spinifex. The island is an A-class nature reserve. BirdLife International (2018) describes the island as an undulating sand cay, vegetated with Spinifex longifolius, supporting breeding birds such as masked booby, white-bellied sea eagle, silver gull, crested tern and lesser crested tern. Burbidge et al. (1986) report numbers of occupied nests of brown booby (~10,000), masked booby (~178) and lesser frigatebird (2,290) surveyed in 1984 on Bedout Island. Bedout Island is fringed by coral reef and provides seabird and turtle foraging habitat.
North Turtle Island is an A-class nature reserve. The island is fringed by coral reef and provides turtle and seabird nesting and foraging habitat (BHP 2011; Davidson and Thomas-Dans, Landscope article, undated).
3.3.3 Ancient Coastline at 125 m Depth Contour The Ancient Coastline at the 125 m depth contour KEF is thought to provide areas of hard substrate that may contribute to higher biological diversity. Little published information is currently available, but the hard substrate may provide suitable habitat for demersal fish species including those that are site-attached. Site-attached fish species are typically associated with raised epibiota on banks, shoals and coral reefs. Some site-attached species (e.g. coral reef fish) have limited swimming ability and are therefore less likely or unable to move away from disturbance.
Santos WA commissioned a study to describe the fishes associated with the Ancient Coastline at the 125 m depth contour KEF within the full power zone of the Keraudren seismic survey (three sites = Location 2) and in comparable areas on Ancient Coastline KEF outside of the seismic survey area (six sites - three to the northeast (= Location 3) and three to the southwest (= Location 1) of the seismic survey area). Field work was completed in late October 2018 using the stereo baited remote underwater video system (SBRUVS) technique, with five units deployed on the Ancient Coastline KEF at each of nine sites within a depth range of 120 m to 130 m (RPS 2019). Key findings in relation to the ancient coastline KEF were:
• A total of 643 fish from 39 species and 17 families were recorded across the three KEF locations, with goldband snapper (Pristipomoides multidens) and yellow spotted rock cod (Epinephelus areolatus) being the only commercially important species observed at these locations on the KEF.
• No escarpment, complex relief, emergent bedrock or complex epibiota assemblages were recorded on video or observed on the vessel sounder at the KEF survey sites.
• Limited variation in fish assemblages of the KEF between the survey area (Location 2) and the reference sites (Locations 1 and 3).
• Although within-site variability was high, abundances of fish species were low in the area, comprising relatively mobile demersal fish species.
• The four most ubiquitous species were lunartail pufferfish (72% deployments), threadfin bream (67% deployments), longnose trevally (59% deployments) and giant trevally (47% deployments).
As part of the above study, an area of high relief seabed that was evident on the vessel depth sounder between 97 to 114 m water depth adjacent to Location 1 (south east of seismic operational area) was explored opportunistically. At this location, 5 SBRUVS units were deployed at three sites. A total of 388 fish from 38 species and 20 families were recorded. Two of these sites exhibited higher relief emergent habitat, a significant increase in cover of octocoral and greater occurrence and abundance of commercially important species such as red emperor (Lutjanus sebae), the yellow spotted rock cod (Epinephelus areolatus) and goldband snapper (Pristipomoides multidens). Seven species of commercially fished species were found at these sites compared to two species on the Ancient Coastline KEF. The third ‘exploratory’ site was more
Santos Ltd | Keraudren Seismic Survey EP Summary Page 26 of 248
similar to the planned locations surveyed than the two sites with higher relief habitat and greater number of fish species and abundance (RPS 2019).
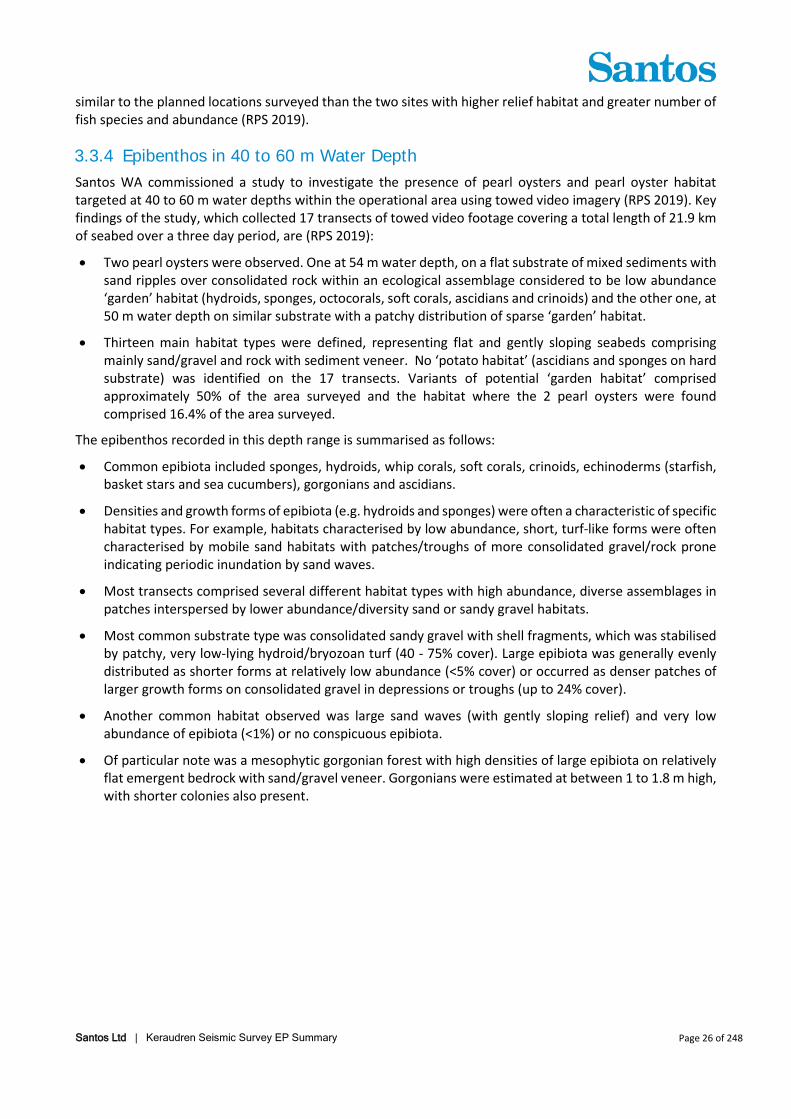
3.3.4 Epibenthos in 40 to 60 m Water Depth Santos WA commissioned a study to investigate the presence of pearl oysters and pearl oyster habitat targeted at 40 to 60 m water depths within the operational area using towed video imagery (RPS 2019). Key findings of the study, which collected 17 transects of towed video footage covering a total length of 21.9 km of seabed over a three day period, are (RPS 2019):
• Two pearl oysters were observed. One at 54 m water depth, on a flat substrate of mixed sediments with sand ripples over consolidated rock within an ecological assemblage considered to be low abundance ‘garden’ habitat (hydroids, sponges, octocorals, soft corals, ascidians and crinoids) and the other one, at 50 m water depth on similar substrate with a patchy distribution of sparse ‘garden’ habitat.
• Thirteen main habitat types were defined, representing flat and gently sloping seabeds comprising mainly sand/gravel and rock with sediment veneer. No ‘potato habitat’ (ascidians and sponges on hard substrate) was identified on the 17 transects. Variants of potential ‘garden habitat’ comprised approximately 50% of the area surveyed and the habitat where the 2 pearl oysters were found comprised 16.4% of the area surveyed.
The epibenthos recorded in this depth range is summarised as follows:
• Common epibiota included sponges, hydroids, whip corals, soft corals, crinoids, echinoderms (starfish, basket stars and sea cucumbers), gorgonians and ascidians.
• Densities and growth forms of epibiota (e.g. hydroids and sponges) were often a characteristic of specific habitat types. For example, habitats characterised by low abundance, short, turf-like forms were often characterised by mobile sand habitats with patches/troughs of more consolidated gravel/rock prone indicating periodic inundation by sand waves.
• Most transects comprised several different habitat types with high abundance, diverse assemblages in patches interspersed by lower abundance/diversity sand or sandy gravel habitats.
• Most common substrate type was consolidated sandy gravel with shell fragments, which was stabilised by patchy, very low-lying hydroid/bryozoan turf (40 - 75% cover). Large epibiota was generally evenly distributed as shorter forms at relatively low abundance (<5% cover) or occurred as denser patches of larger growth forms on consolidated gravel in depressions or troughs (up to 24% cover).
• Another common habitat observed was large sand waves (with gently sloping relief) and very low abundance of epibiota (<1%) or no conspicuous epibiota.
• Of particular note was a mesophytic gorgonian forest with high densities of large epibiota on relatively flat emergent bedrock with sand/gravel veneer. Gorgonians were estimated at between 1 to 1.8 m high, with shorter colonies also present.
Santos Ltd | Keraudren Seismic Survey EP Summary Page 27 of 248
Figure 3-3: Protected areas within and adjacent to the EMBA
Santos Ltd | Keraudren Seismic Survey EP Summary Page 28 of 248
Figure 3-4: Key ecological features within and near the operational area
Santos Ltd | Keraudren Seismic Survey EP Summary Page 29 of 248
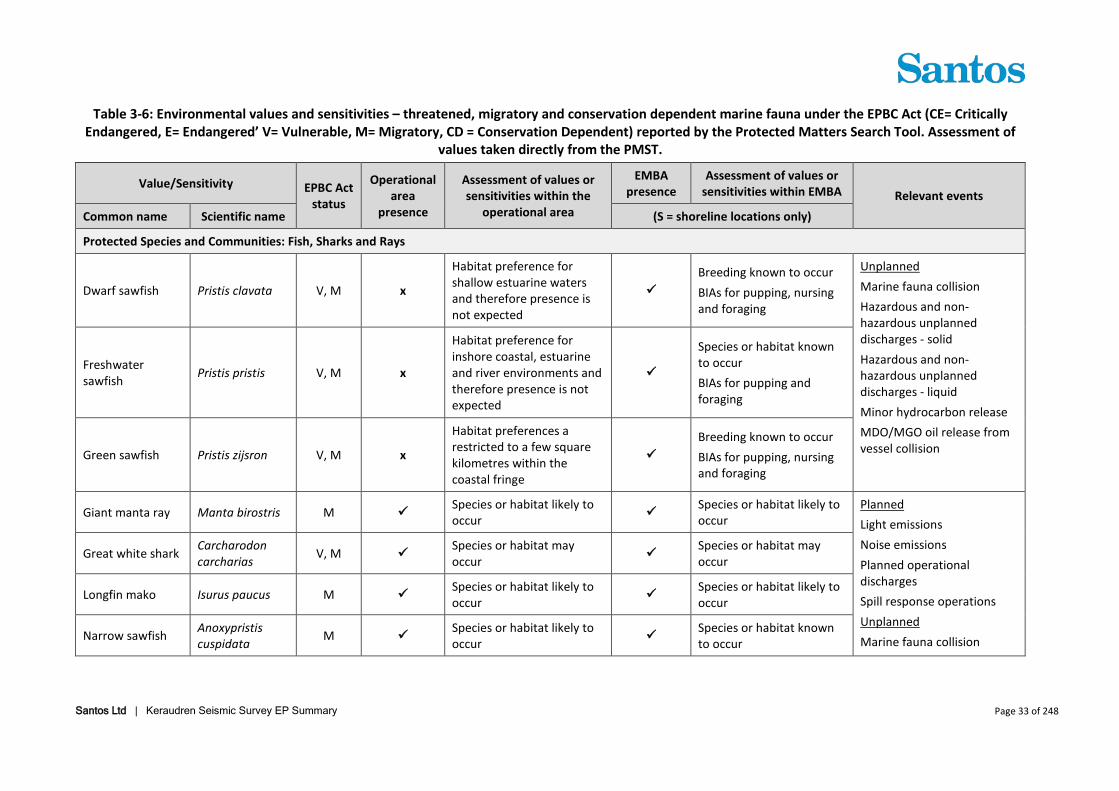
3.4 Threatened and Migratory Marine Fauna The Protected Matters Search Tool (PMST) report for the EMBA identified 21 Listed Threatened Species (LTS) and 34 Listed Migratory Species (LMS) as having the potential to occur within the EMBA. Additional PMST searches were conducted at each of the shoreline locations identified; each of these searches included a buffer 1 km in radius to capture other receptors that could occur within the vicinity. The LTS and LMS that may occur within the EMBA or shoreline locations are shown in Table 3-6, including any overlap with designated Biologically Important Areas (BIAs) and the relevant planned and unplanned events that may impact them. Species listed in the PMST report but described as terrestrial in the Species Profile and Threats (SPRAT) database (e.g. will not contact any potential oil MDO/MGO spill or be exposed to underwater noise emissions) have not been discussed.
The conservation dependent (CD) species identified (southern bluefin tuna (Thannus maccoyli) and the scalloped hammerhead shark (Sphyra lewini)) have been described in Section 3.4.2.
3.4.1 Marine Mammals The PMST report identified 12 cetacean species within the operational area, EMBA and/or shoreline locations. Of these, all are listed as migratory and four are listed as threatened under the EPBC Act.
Humpback Whale Migration
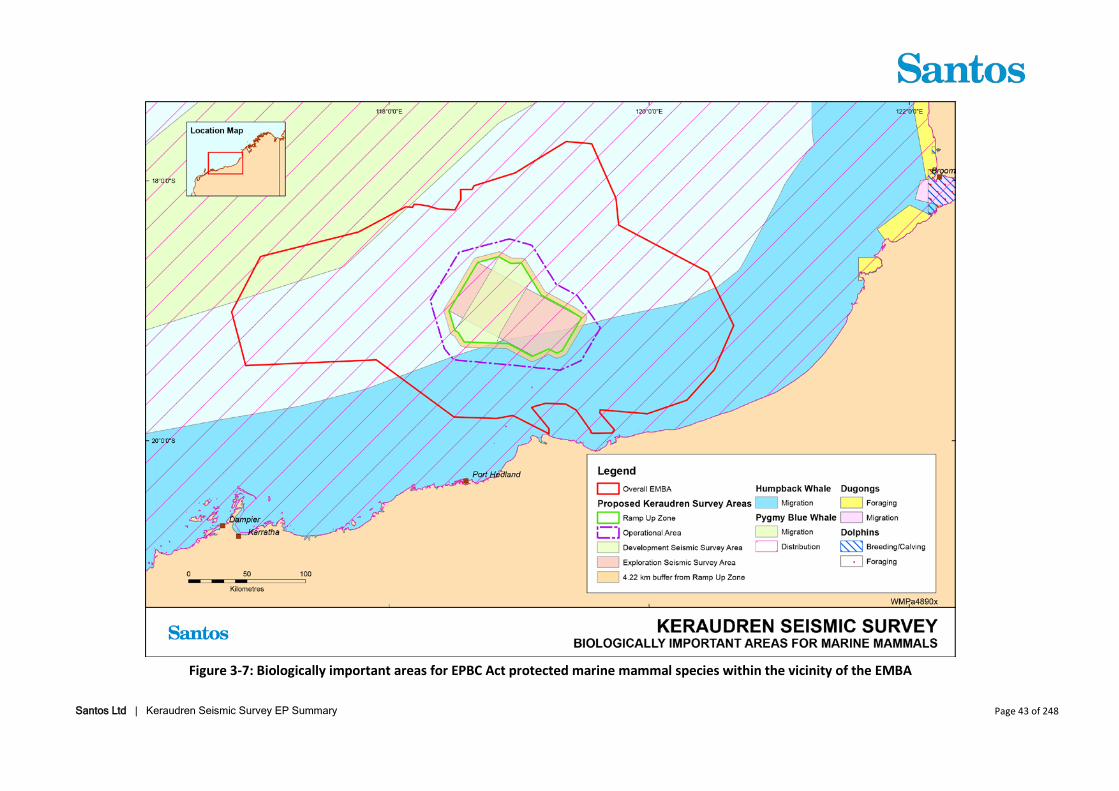
Humpback whales traverse waters off the west coast of Australia as they migrate annually from summer feeding grounds in Antarctica to the nearshore waters of the Kimberley region where they breed and calve during winter. Humpback whales are likely to be present in the survey area during the northbound migration and appear to remain on or within the 200 m isobath near the Montebello Islands and then moving closer to shore as they head further north to the calving grounds in the Kimberley. The humpback whale migration corridor is not an identified aggregation area or critical habitat, whales are in transit, and are migrating from their southern polar ‘summer’ feeding grounds to their northern tropical ‘winter’ calving / breeding grounds.
Peak northward migration across the North West Shelf is identified as from late July to early August, and peak southward migration from late August to early September (DotE 2015c). Data collected between 1995 and 1997 by the Centre for Whale Research indicates that the period for peak northern migration into the calving grounds in the Kimberley is mid to late July. The peak for southern migration is in the first half of September (Jenner et al.2001). Actual timing of annual migration may vary by as much as three weeks from year to year due to food availability in the Antarctic (DMP 2003).
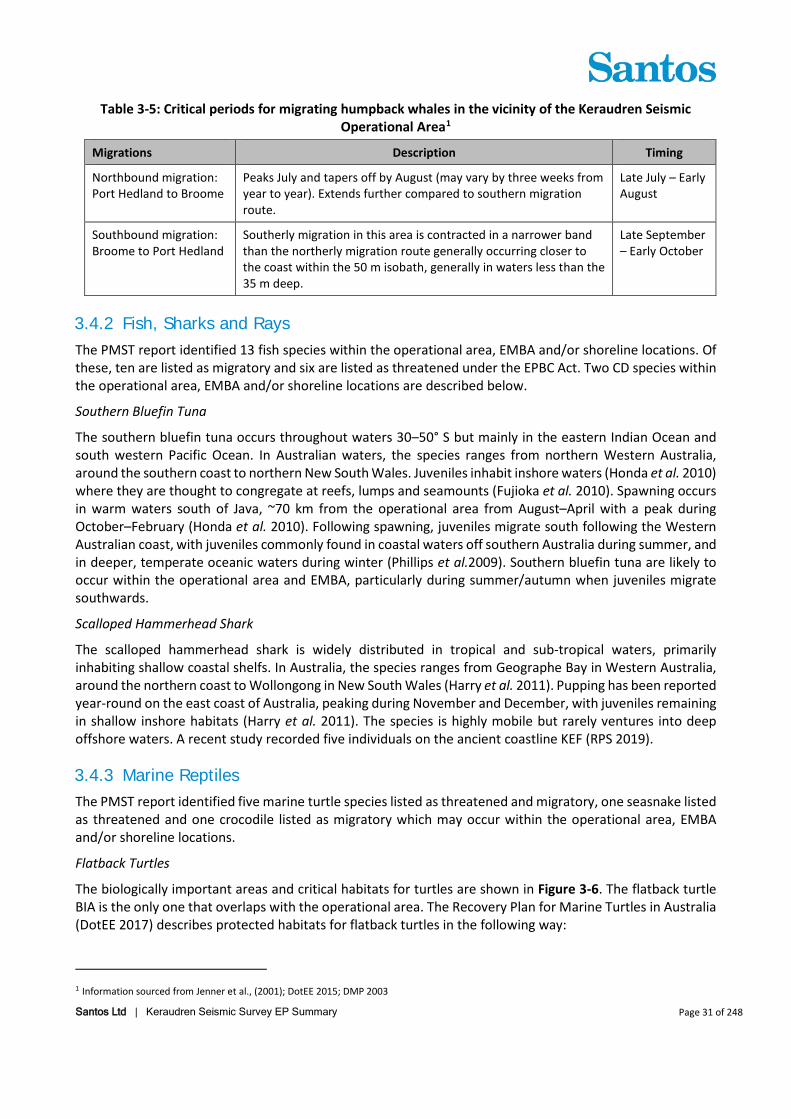
Based on migration data presented in Thums et al. 2018, it is possible that a small number of migrating individuals will traverse the survey area prior to seismic survey termination (Figure 3-5). This migration data collected over 2008, 2009 and 2011 for tagged humpback whales shows there are few migration paths that overlap with the proposed survey area, and where there is overlap the number of days that the humpback whales may spend within the survey area during their northern migration would be hours rather than days (i.e. <0.5 days, Figure 3-5).
Santos Ltd | Keraudren Seismic Survey EP Summary Page 30 of 248
Figure 3-5: Northbound (a) and southbound (b) humpback whales migration durations (2008, 2009 and
2011).
Santos Ltd | Keraudren Seismic Survey EP Summary Page 31 of 248
Table 3-5: Critical periods for migrating humpback whales in the vicinity of the Keraudren Seismic Operational Area1
Migrations Description Timing
Northbound migration: Port Hedland to Broome
Peaks July and tapers off by August (may vary by three weeks from year to year). Extends further compared to southern migration route.
Late July – Early August
Southbound migration: Broome to Port Hedland
Southerly migration in this area is contracted in a narrower band than the northerly migration route generally occurring closer to the coast within the 50 m isobath, generally in waters less than the 35 m deep.
Late September – Early October
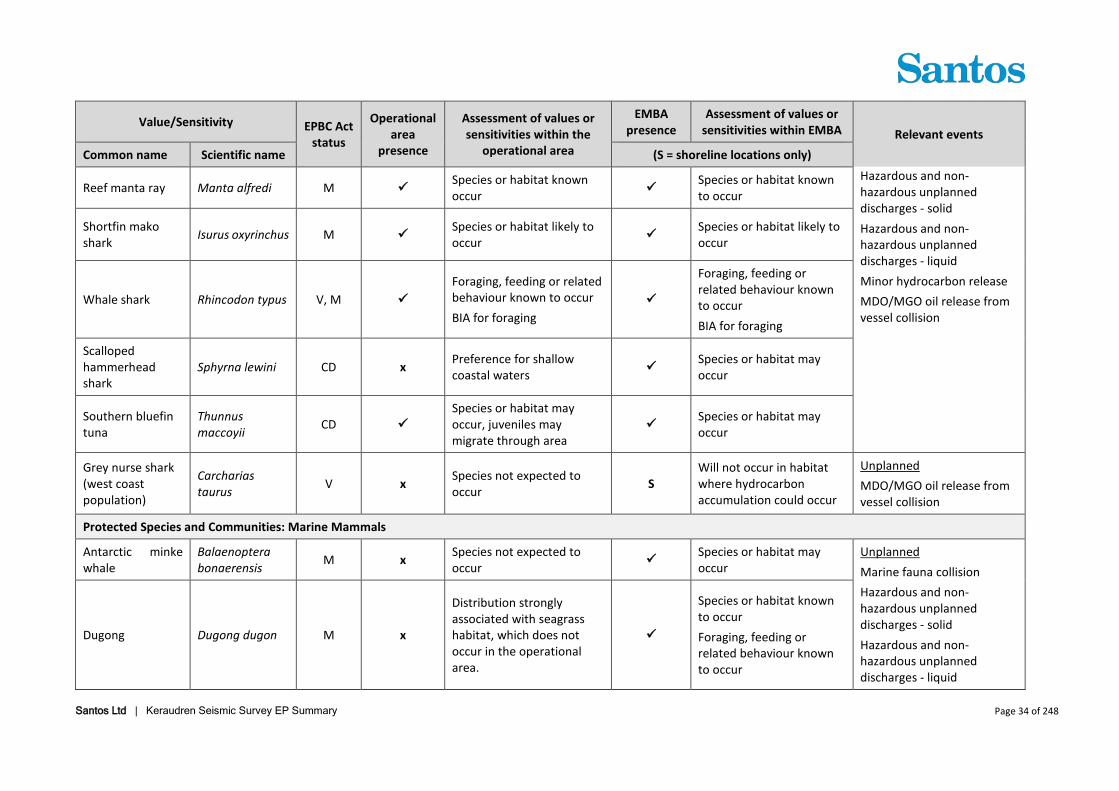
3.4.2 Fish, Sharks and Rays The PMST report identified 13 fish species within the operational area, EMBA and/or shoreline locations. Of these, ten are listed as migratory and six are listed as threatened under the EPBC Act. Two CD species within the operational area, EMBA and/or shoreline locations are described below.
Southern Bluefin Tuna
The southern bluefin tuna occurs throughout waters 30–50° S but mainly in the eastern Indian Ocean and south western Pacific Ocean. In Australian waters, the species ranges from northern Western Australia, around the southern coast to northern New South Wales. Juveniles inhabit inshore waters (Honda et al. 2010) where they are thought to congregate at reefs, lumps and seamounts (Fujioka et al. 2010). Spawning occurs in warm waters south of Java, ~70 km from the operational area from August–April with a peak during October–February (Honda et al. 2010). Following spawning, juveniles migrate south following the Western Australian coast, with juveniles commonly found in coastal waters off southern Australia during summer, and in deeper, temperate oceanic waters during winter (Phillips et al.2009). Southern bluefin tuna are likely to occur within the operational area and EMBA, particularly during summer/autumn when juveniles migrate southwards.
Scalloped Hammerhead Shark
The scalloped hammerhead shark is widely distributed in tropical and sub-tropical waters, primarily inhabiting shallow coastal shelfs. In Australia, the species ranges from Geographe Bay in Western Australia, around the northern coast to Wollongong in New South Wales (Harry et al. 2011). Pupping has been reported year-round on the east coast of Australia, peaking during November and December, with juveniles remaining in shallow inshore habitats (Harry et al. 2011). The species is highly mobile but rarely ventures into deep offshore waters. A recent study recorded five individuals on the ancient coastline KEF (RPS 2019).
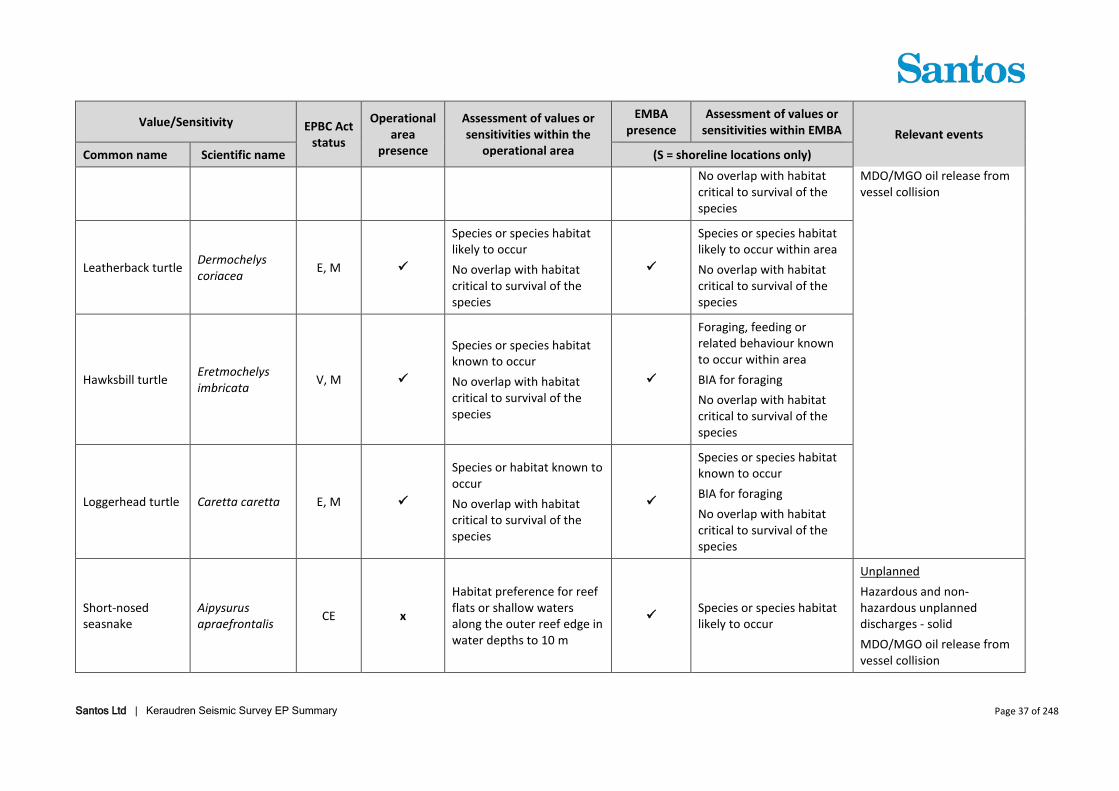
3.4.3 Marine Reptiles The PMST report identified five marine turtle species listed as threatened and migratory, one seasnake listed as threatened and one crocodile listed as migratory which may occur within the operational area, EMBA and/or shoreline locations.
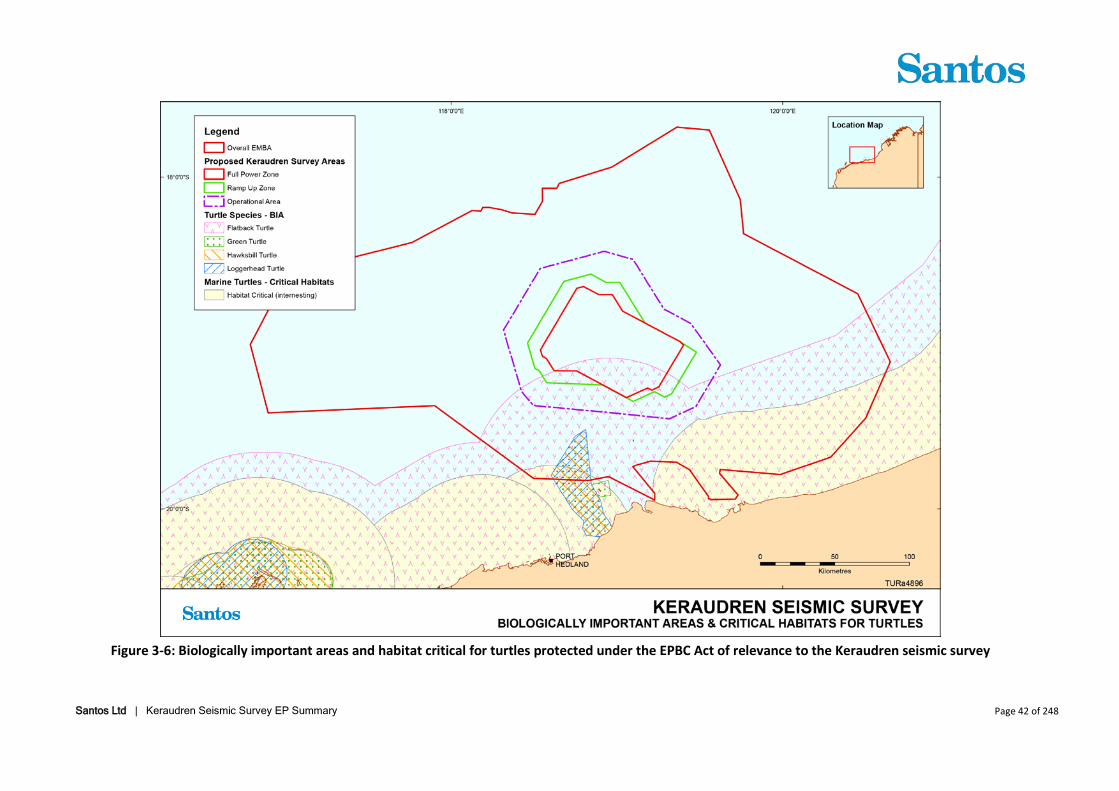
Flatback Turtles
The biologically important areas and critical habitats for turtles are shown in Figure 3-6. The flatback turtle BIA is the only one that overlaps with the operational area. The Recovery Plan for Marine Turtles in Australia (DotEE 2017) describes protected habitats for flatback turtles in the following way:
1 Information sourced from Jenner et al., (2001); DotEE 2015; DMP 2003
Santos Ltd | Keraudren Seismic Survey EP Summary Page 32 of 248
• Habitat critical for the survival of the species were identified by consensus of a panel of experts in marine turtle biology identifying nesting and internesting habitat for each stock. For flatback turtles, a 60 km buffer zone located immediately seaward of designated nesting habitat defines the habitat critical to the survival of this species to capture internesting behaviour.
• Biologically important areas for marine turtles are areas where protected species display biologically important behaviour such as breeding, foraging, resting and migration. These habitats are not yet described for flatback turtles such that habitat critical to the survival of the stock can be identified, however, this knowledge gap is to be addressed during the life of the recovery plan. In the interim, the recovery plan advises consideration of information in the National Conservation Values Atlas (NCVA) and the species profile and threat database (SPRAT).
3.4.4 Seabirds The PMST report identified 16 seabirds which have a recognized range that overlaps the operational area, EMBA and/or shoreline locations. Of these, 15 are migratory and two are listed as threatened under the EPBC Act. Additionally, a BIA for the migratory wedge-tailed shearwater (Ardenna pacifica) was found to overlap with the operational area and EMBA.
3.4.5 Shorebirds The PMST report identified 14 shorebirds which have a recognized range that overlaps the operational area, EMBA and/or shoreline locations. Of these, 11 are migratory and seven are listed as threatened under the EPBC Act.
Santos Ltd | Keraudren Seismic Survey EP Summary Page 33 of 248
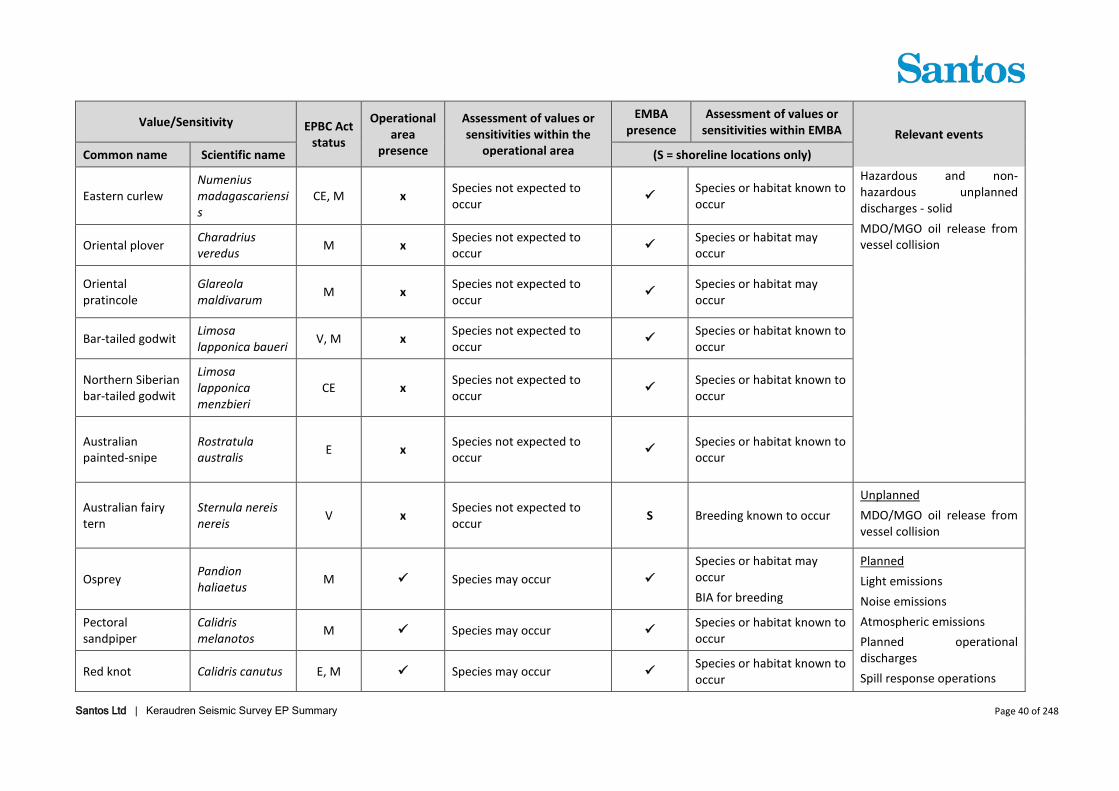
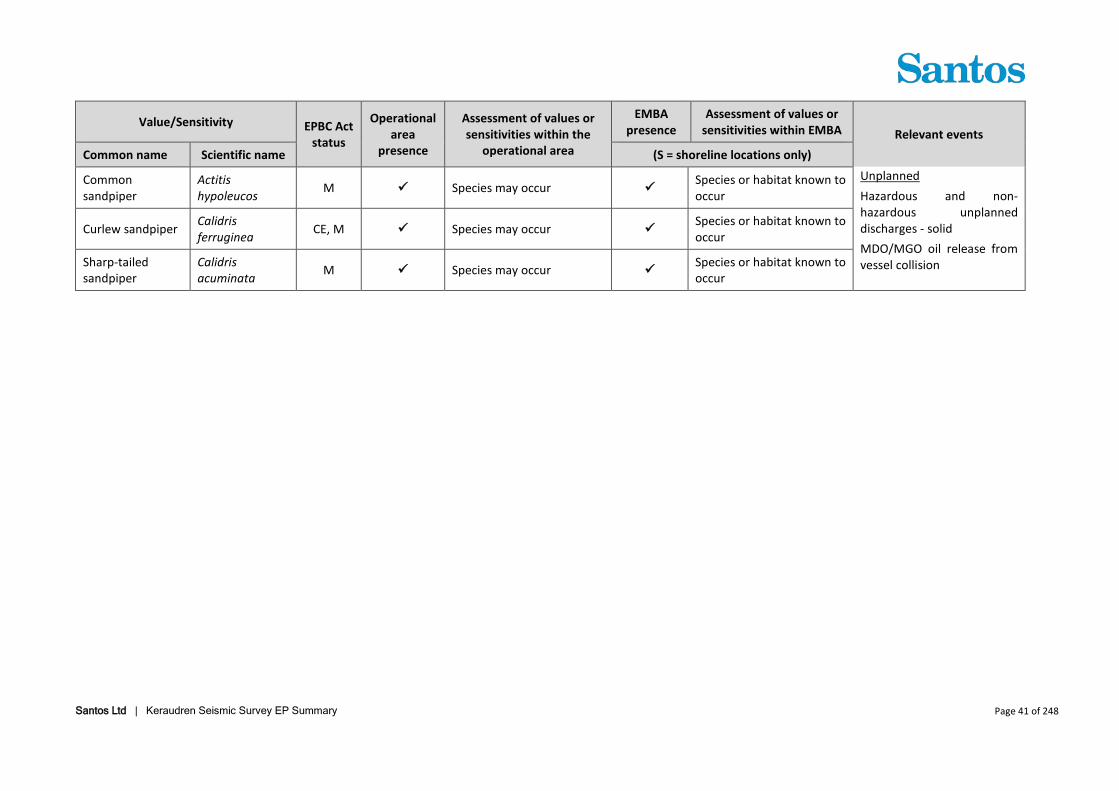
Table 3-6: Environmental values and sensitivities – threatened, migratory and conservation dependent marine fauna under the EPBC Act (CE= Critically Endangered, E= Endangered’ V= Vulnerable, M= Migratory, CD = Conservation Dependent) reported by the Protected Matters Search Tool. Assessment of
values taken directly from the PMST.
Value/Sensitivity EPBC Act status
Operational area
presence
Assessment of values or sensitivities within the
operational area
EMBA presence
Assessment of values or sensitivities within EMBA Relevant events
Common name Scientific name (S = shoreline locations only)
Protected Species and Communities: Fish, Sharks and Rays
Dwarf sawfish Pristis clavata V, M x
Habitat preference for shallow estuarine waters and therefore presence is not expected
Breeding known to occur BIAs for pupping, nursing and foraging
Unplanned Marine fauna collision Hazardous and non-hazardous unplanned discharges - solid Hazardous and non-hazardous unplanned discharges - liquid Minor hydrocarbon release MDO/MGO oil release from vessel collision
Freshwater sawfish Pristis pristis V, M x
Habitat preference for inshore coastal, estuarine and river environments and therefore presence is not expected
Species or habitat known to occur BIAs for pupping and foraging
Green sawfish Pristis zijsron V, M x
Habitat preferences a restricted to a few square kilometres within the coastal fringe
Breeding known to occur BIAs for pupping, nursing and foraging
Giant manta ray Manta birostris M Species or habitat likely to occur Species or habitat likely to
Great white shark Carcharodon carcharias V, M Species or habitat may
occur Species or habitat may occur
Longfin mako Isurus paucus M Species or habitat likely to occur Species or habitat likely to
occur
Narrow sawfish Anoxypristis cuspidata M Species or habitat likely to
occur Species or habitat known to occur
Santos Ltd | Keraudren Seismic Survey EP Summary Page 34 of 248
Value/Sensitivity EPBC Act status
Operational area
presence
Assessment of values or sensitivities within the
operational area
EMBA presence
Assessment of values or sensitivities within EMBA Relevant events
Common name Scientific name (S = shoreline locations only)
Reef manta ray Manta alfredi M Species or habitat known occur Species or habitat known
to occur Hazardous and non-hazardous unplanned discharges - solid Hazardous and non-hazardous unplanned discharges - liquid Minor hydrocarbon release MDO/MGO oil release from vessel collision
Shortfin mako shark Isurus oxyrinchus M Species or habitat likely to
occur Species or habitat likely to occur
Whale shark Rhincodon typus V, M Foraging, feeding or related behaviour known to occur BIA for foraging
Foraging, feeding or related behaviour known to occur BIA for foraging
Scalloped hammerhead shark
Sphyrna lewini CD x Preference for shallow coastal waters Species or habitat may
occur
Southern bluefin tuna
Thunnus maccoyii CD
Species or habitat may occur, juveniles may migrate through area
Species or habitat may occur
Grey nurse shark (west coast population)
Carcharias taurus V x Species not expected to
occur S Will not occur in habitat where hydrocarbon accumulation could occur
Unplanned MDO/MGO oil release from vessel collision
Protected Species and Communities: Marine Mammals
Antarctic minke whale
Balaenoptera bonaerensis M x Species not expected to
occur Species or habitat may occur
Unplanned Marine fauna collision Hazardous and non-hazardous unplanned discharges - solid Hazardous and non-hazardous unplanned discharges - liquid
Dugong Dugong dugon M x
Distribution strongly associated with seagrass habitat, which does not occur in the operational area.
Species or habitat known to occur Foraging, feeding or related behaviour known to occur
Santos Ltd | Keraudren Seismic Survey EP Summary Page 35 of 248
Value/Sensitivity EPBC Act status
Operational area
presence
Assessment of values or sensitivities within the
operational area
EMBA presence
Assessment of values or sensitivities within EMBA Relevant events
Common name Scientific name (S = shoreline locations only) Minor hydrocarbon release MDO/MGO oil release from vessel collision
Blue whale Balaenoptera musculus E, M
Species or habitat likely to occur BIA for distribution
Migration route known to occur BIAs for distribution and migration
Planned Noise emissions Planned operational discharges Spill response operations Unplanned Marine fauna collision Hazardous and non-hazardous unplanned discharges - solid Hazardous and non-hazardous unplanned discharges - liquid Minor hydrocarbon release MDO/MGO oil release from vessel collision
Bryde’s whale Balaenoptera edeni M Species or habitat may
occur Species or habitat likely to occur
Fin whale Balaenoptera physalus V, M Species or habitat likely to
occur Species or habitat likely to occur
Humpback whale Megaptera novaeangliae V, M
Species or habitat known to occur BIA for migration
Species or habitat known to occur BIA for migration
Indo-Pacific humpback dolphin Sousa chinensis M Species or habitat may
occur
Species or habitat likely to occur Breeding known to occur BIA for breeding
Killer whale Orcinus orca M Species or habitat may occur Species or habitat may
occur
Sei whale Balaenoptera borealis V, M Species or habitat likely to
occur Species or habitat likely to occur
Sperm whale Physeter macrocephalus M Species or habitat may
occur Species or habitat may occur
Santos Ltd | Keraudren Seismic Survey EP Summary Page 36 of 248
Value/Sensitivity EPBC Act status
Operational area
presence
Assessment of values or sensitivities within the
operational area
EMBA presence
Assessment of values or sensitivities within EMBA Relevant events
Common name Scientific name (S = shoreline locations only)
Spotted bottlenose dolphin
Tursiops aduncus M Species or habitat likely to
occur Species or habitat likely to occur
Irrawaddy Dolphin Orcaella brevirostris M x Species not expected to
occur S Will not occur in habitat where hydrocarbon accumulation could occur
Unplanned MDO/MGO oil release from vessel collision
Protected Species and Communities: Marine Reptiles
Flatback turtle Natator depressus V, M
Congregation or aggregation known to occur BIA for internesting around North Turtle Island No overlap with habitat critical to survival of the species2
Foraging, feeding or related behaviour known to occur within area BIAs for foraging and internesting (North Turtle Island and Eighty Mile Beach) Habitat critical to survival of the species – 60 km radius around Eighty Mile Beach
Planned Noise emissions Planned operational discharges Spill response operations Unplanned Marine fauna collision Hazardous and non-hazardous unplanned discharges - solid Hazardous and non-hazardous unplanned discharges - liquid Minor hydrocarbon release
Green turtle Chelonia mydas V, M
Species or species habitat known to occur No overlap with habitat critical to survival of the species
Foraging, feeding or related behaviour known to occur within area BIA for foraging
2 The EPBC Act Significant Impact Guidelines 1.1 – Matters of National Environmental Significance, define ‘habitat critical to the survival of a species’ as areas necessary: 1) for activities such as foraging, breeding or dispersal; 2) for the long-term maintenance of the species (including the maintenance of species essential to the survival of the species); 3) to maintain genetic diversity and long term evolutionary development; and 4) for the reintroduction of populations or recovery of the species. Nesting and internesting habitat critical to the survival of marine turtle species is outlined in the Recovery Plan for Marine Turtles in Australia 2017 - 2027.
Santos Ltd | Keraudren Seismic Survey EP Summary Page 37 of 248
Value/Sensitivity EPBC Act status
Operational area
presence
Assessment of values or sensitivities within the
operational area
EMBA presence
Assessment of values or sensitivities within EMBA Relevant events
Common name Scientific name (S = shoreline locations only) No overlap with habitat critical to survival of the species
MDO/MGO oil release from vessel collision
Leatherback turtle Dermochelys coriacea E, M
Species or species habitat likely to occur No overlap with habitat critical to survival of the species
Species or species habitat likely to occur within area No overlap with habitat critical to survival of the species
Hawksbill turtle Eretmochelys imbricata V, M
Species or species habitat known to occur No overlap with habitat critical to survival of the species
Foraging, feeding or related behaviour known to occur within area BIA for foraging No overlap with habitat critical to survival of the species
Loggerhead turtle Caretta caretta E, M
Species or habitat known to occur No overlap with habitat critical to survival of the species
Species or species habitat known to occur BIA for foraging No overlap with habitat critical to survival of the species
Short-nosed seasnake
Aipysurus apraefrontalis CE x
Habitat preference for reef flats or shallow waters along the outer reef edge in water depths to 10 m
Species or species habitat likely to occur
Unplanned Hazardous and non-hazardous unplanned discharges - solid MDO/MGO oil release from vessel collision
Santos Ltd | Keraudren Seismic Survey EP Summary Page 38 of 248
Value/Sensitivity EPBC Act status
Operational area
presence
Assessment of values or sensitivities within the
operational area
EMBA presence
Assessment of values or sensitivities within EMBA Relevant events
Common name Scientific name (S = shoreline locations only)
Salt-water crocodile
Crocodylus porosus M x Species not expected to
occur S Species or habitat likely to occur
Unplanned MDO/MGO oil release from vessel collision
Protected Species and Communities: Birds (Seabirds)
Lesser crested tern3
Thalasseus bengalensis M x Species not expected to
occur BIA for breeding
Unplanned Hazardous and non-hazardous unplanned discharges - solid Hazardous and non-hazardous unplanned discharges - liquid Minor hydrocarbon release MDO/MGO oil release from vessel collision
Caspian tern Hydroprogne caspia M x Species not expected to
occur Breeding known to occur
Crested tern Thalasseus bergii M x Species not expected to occur Breeding known to occur
Little tern Sternula albifrons M x Species not expected to
occur Breeding known to occur BIA for breeding and resting
Wedge-tailed shearwater4 Ardenna pacifica M x Species not expected to
occur BIA for breeding
Fork-tailed swift Apus pacificus M x Species not expected to occur Species or habitat likely to
occur
Masked booby Sula dactylatra M x Species not expected to occur Breeding known to occur
Common noddy Anous stolidus M Species may occur Species or habitat known to occur
Planned Light emissions Noise emissions Lesser frigatebird Fregata ariel M Species likely to occur Breeding known to occur
3 Lesser crested tern identified in PMST report under ‘other matters protected’, BIA overlaps with the EMBA
4 Wedge-tailed shearwater not identified in PMST report, however BIA overlaps with operational area and EMBA
Santos Ltd | Keraudren Seismic Survey EP Summary Page 39 of 248
Value/Sensitivity EPBC Act status
Operational area
presence
Assessment of values or sensitivities within the
operational area
EMBA presence
Assessment of values or sensitivities within EMBA Relevant events
Common name Scientific name (S = shoreline locations only) BIA for breeding Atmospheric emissions
Planned operational discharges Spill response operations Unplanned Hazardous and non-hazardous unplanned discharges - solid Hazardous and non-hazardous unplanned discharges - liquid Minor hydrocarbon release MDO/MGO oil release from vessel collision
Great frigatebird Fregata minor M Species may occur Species or habitat likely to occur
White-tailed tropicbird
Phaethon lepturus M
Foraging, feeding or related behaviour likely to occur within area BIA for breeding (provisioning of chicks)
Foraging, feeding or related behaviour likely to occur within area BIA for breeding
Roseate tern Sterna dougallii M Species likely to occur Breeding known to occur BIA for breeding
Streaked shearwater
Calonectris leucomelas M Species likely to occur Species or habitat known
to occur
Abbott’s booby Papasula abbotti E Species may occur Species or habitat may occur
Brown booby Sula leucogaster M Breeding known to occur Breeding known to occur BIA for breeding
Southern giant-petrel
Macronectes giganteus E, M x Species not expected to
occur S Species or habitat may occur
Unplanned MDO/MGO oil release from vessel collision
Bridled tern Onychoprio anaethetus M x Species not expected to
occur S Breeding known to occur BIA for breeding
Protected Species and Communities: Birds (Shorebirds)
Common greenshank Tringa nebularia M x Species not expected to
occur Species or habitat known to occur
Unplanned
Santos Ltd | Keraudren Seismic Survey EP Summary Page 40 of 248
Value/Sensitivity EPBC Act status
Operational area
presence
Assessment of values or sensitivities within the
operational area
EMBA presence
Assessment of values or sensitivities within EMBA Relevant events
Common name Scientific name (S = shoreline locations only)
Eastern curlew Numenius madagascariensis
CE, M x Species not expected to occur Species or habitat known to
occur
Hazardous and non-hazardous unplanned discharges - solid MDO/MGO oil release from vessel collision Oriental plover Charadrius
veredus M x Species not expected to occur Species or habitat may
occur
Oriental pratincole
Glareola maldivarum M x Species not expected to
occur Species or habitat may occur
Bar-tailed godwit Limosa lapponica baueri V, M x Species not expected to
occur Species or habitat known to occur
Northern Siberian bar-tailed godwit
Limosa lapponica menzbieri
CE x Species not expected to occur Species or habitat known to
occur
Australian painted-snipe
Rostratula australis E x Species not expected to
occur Species or habitat known to occur
Australian fairy tern
Sternula nereis nereis V x Species not expected to
occur S Breeding known to occur Unplanned MDO/MGO oil release from vessel collision
Calidris melanotos M Species may occur Species or habitat known to
occur
Red knot Calidris canutus E, M Species may occur Species or habitat known to occur
Santos Ltd | Keraudren Seismic Survey EP Summary Page 41 of 248
Value/Sensitivity EPBC Act status
Operational area
presence
Assessment of values or sensitivities within the
operational area
EMBA presence
Assessment of values or sensitivities within EMBA Relevant events
Common name Scientific name (S = shoreline locations only)
Common sandpiper
Actitis hypoleucos M Species may occur Species or habitat known to
occur Unplanned Hazardous and non-hazardous unplanned discharges - solid MDO/MGO oil release from vessel collision
Curlew sandpiper Calidris ferruginea CE, M Species may occur Species or habitat known to
occur
Sharp-tailed sandpiper
Calidris acuminata M Species may occur Species or habitat known to
occur
Santos Ltd | Keraudren Seismic Survey EP Summary Page 42 of 248
Figure 3-6: Biologically important areas and habitat critical for turtles protected under the EPBC Act of relevance to the Keraudren seismic survey
Santos Ltd | Keraudren Seismic Survey EP Summary Page 43 of 248
Figure 3-7: Biologically important areas for EPBC Act protected marine mammal species within the vicinity of the EMBA
Santos Ltd | Keraudren Seismic Survey EP Summary Page 44 of 248
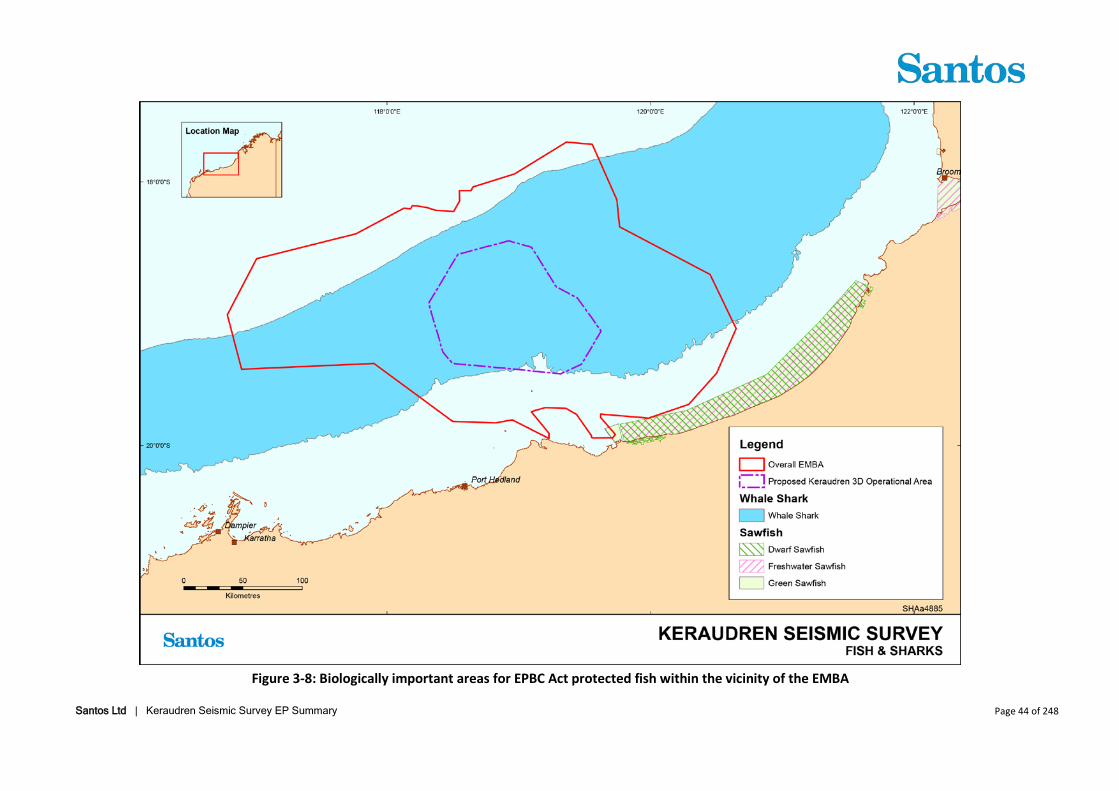
Figure 3-8: Biologically important areas for EPBC Act protected fish within the vicinity of the EMBA
Santos Ltd | Keraudren Seismic Survey EP Summary Page 45 of 248
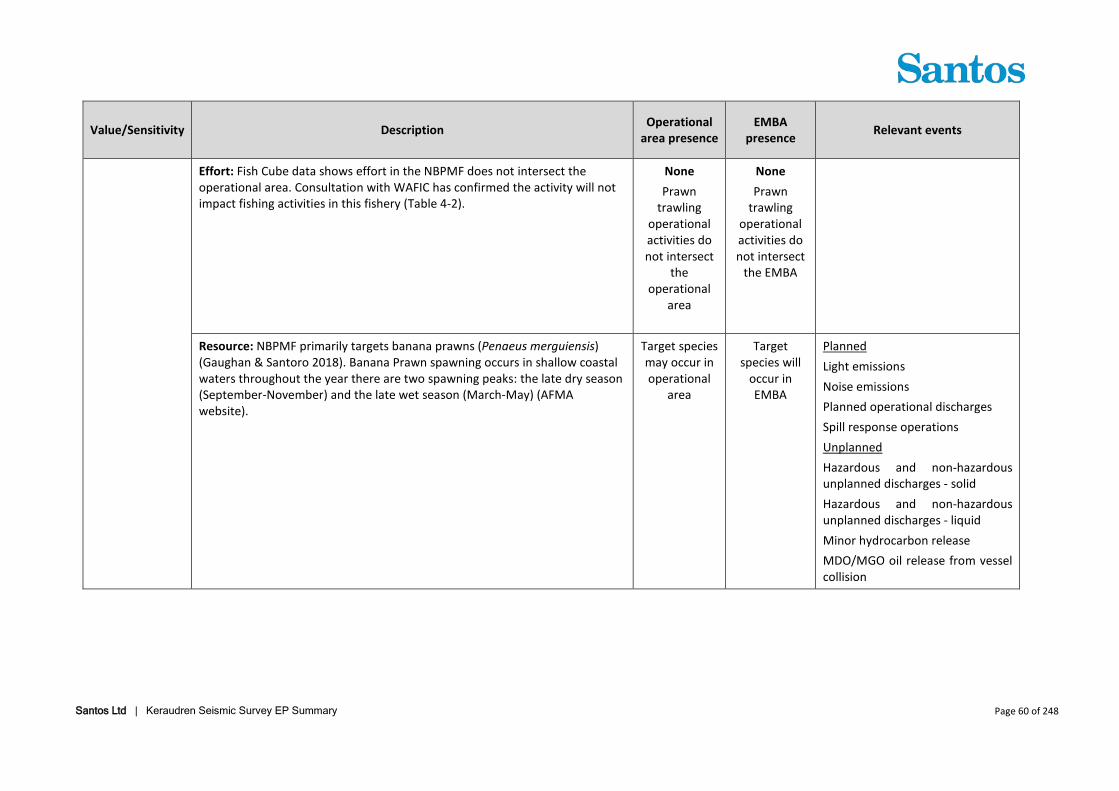
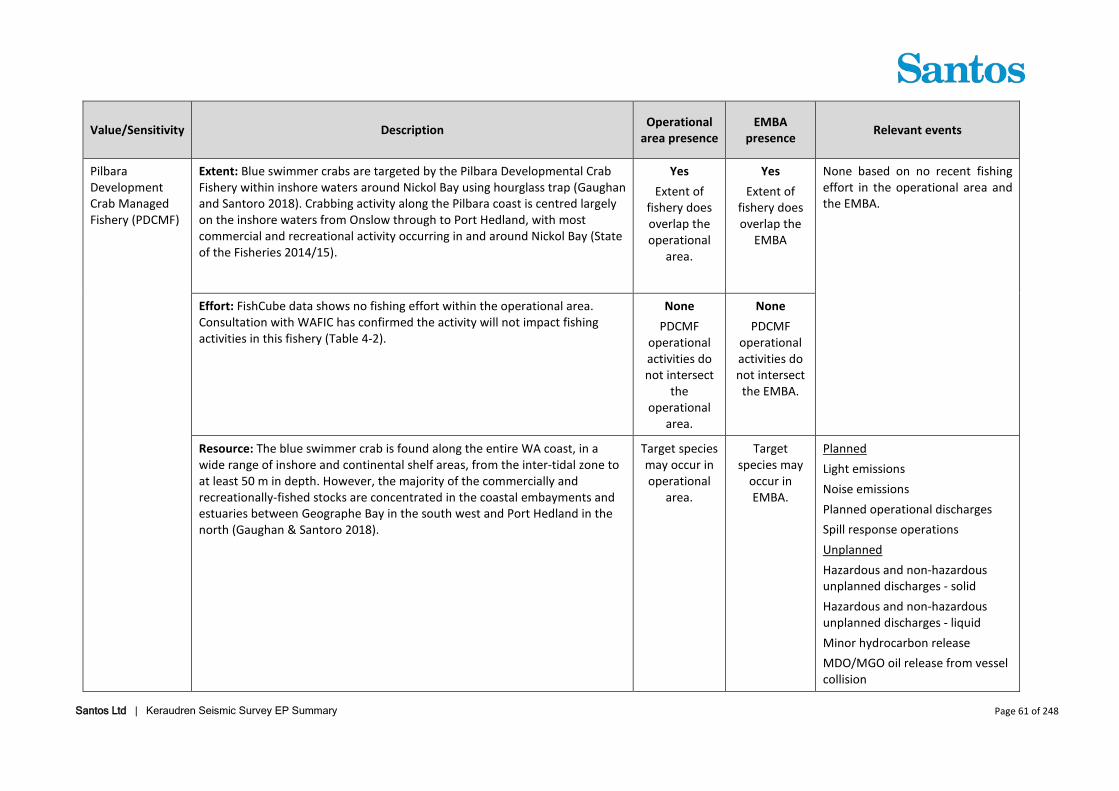
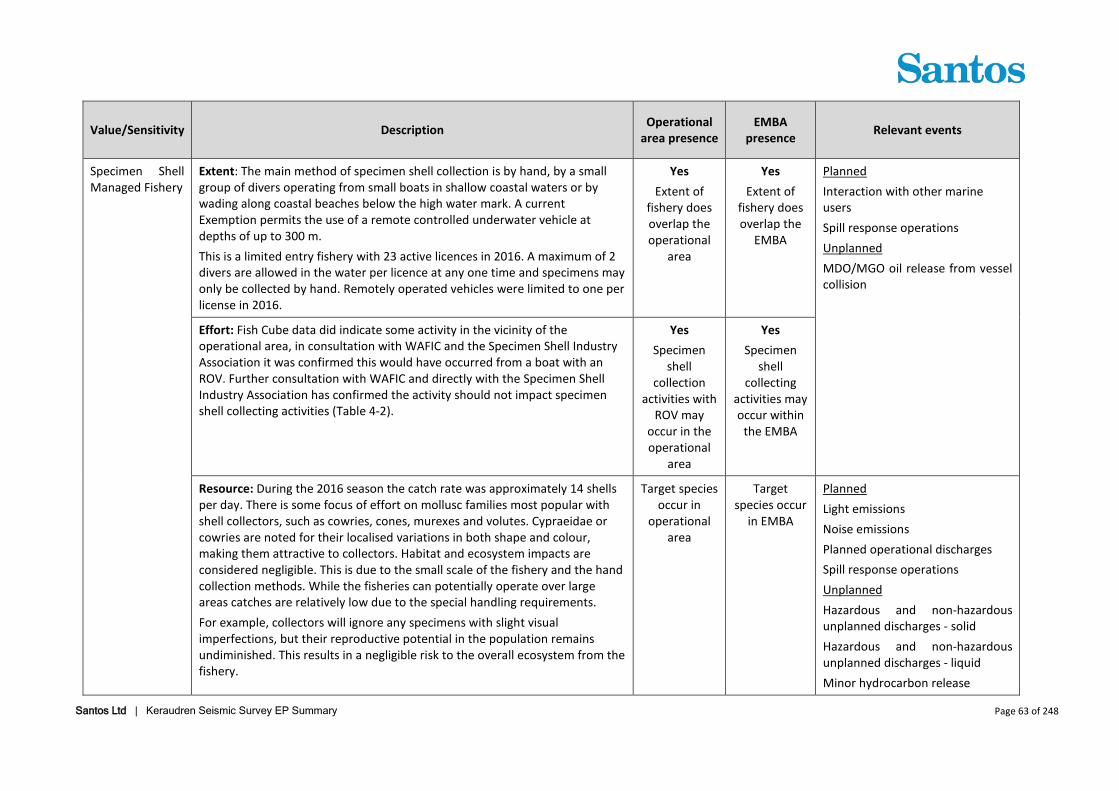
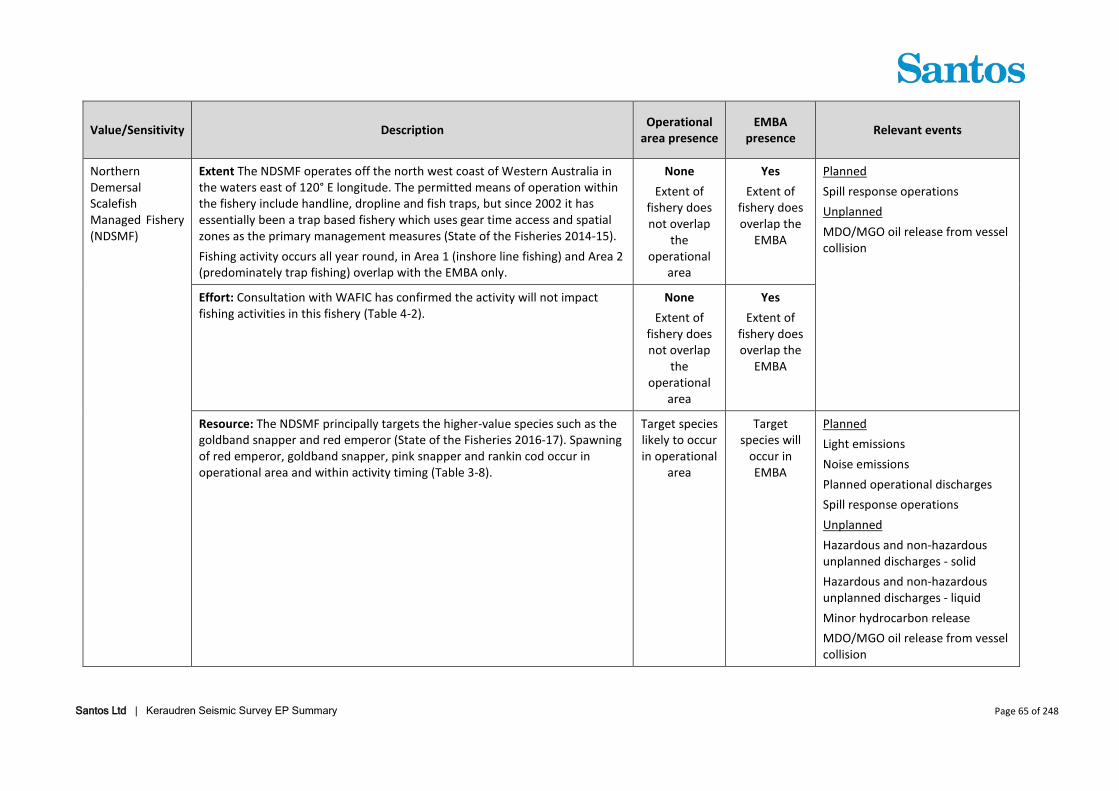
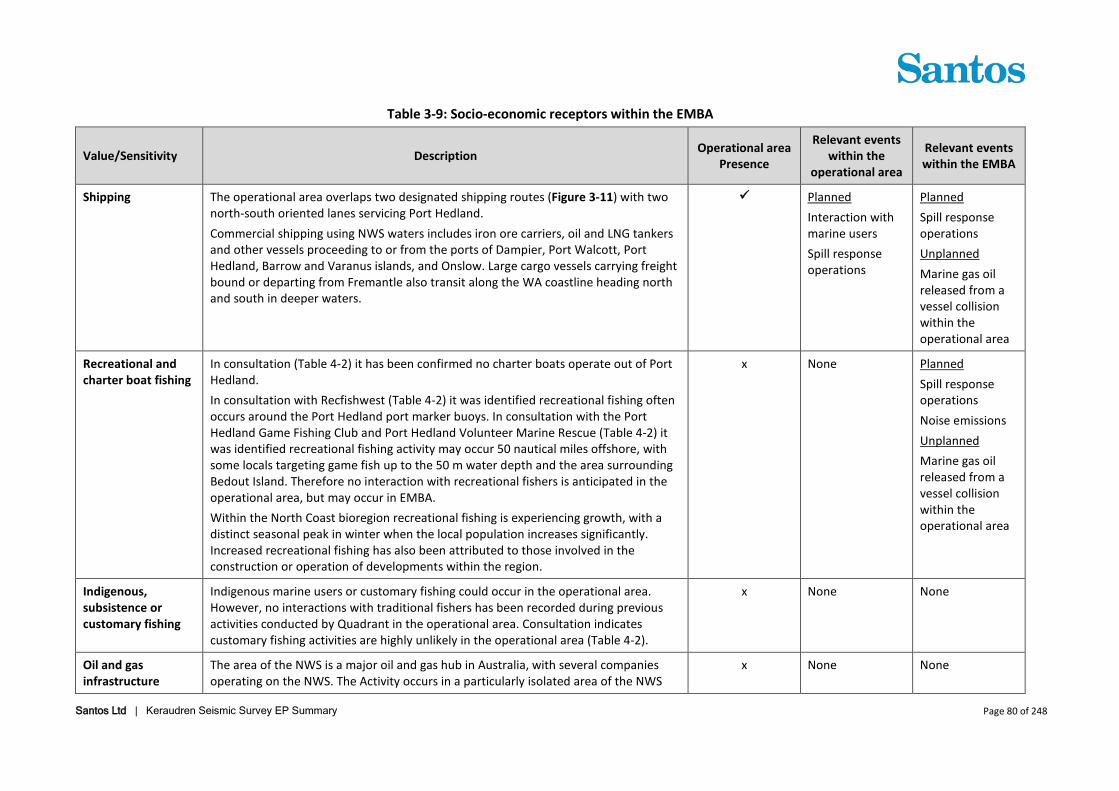
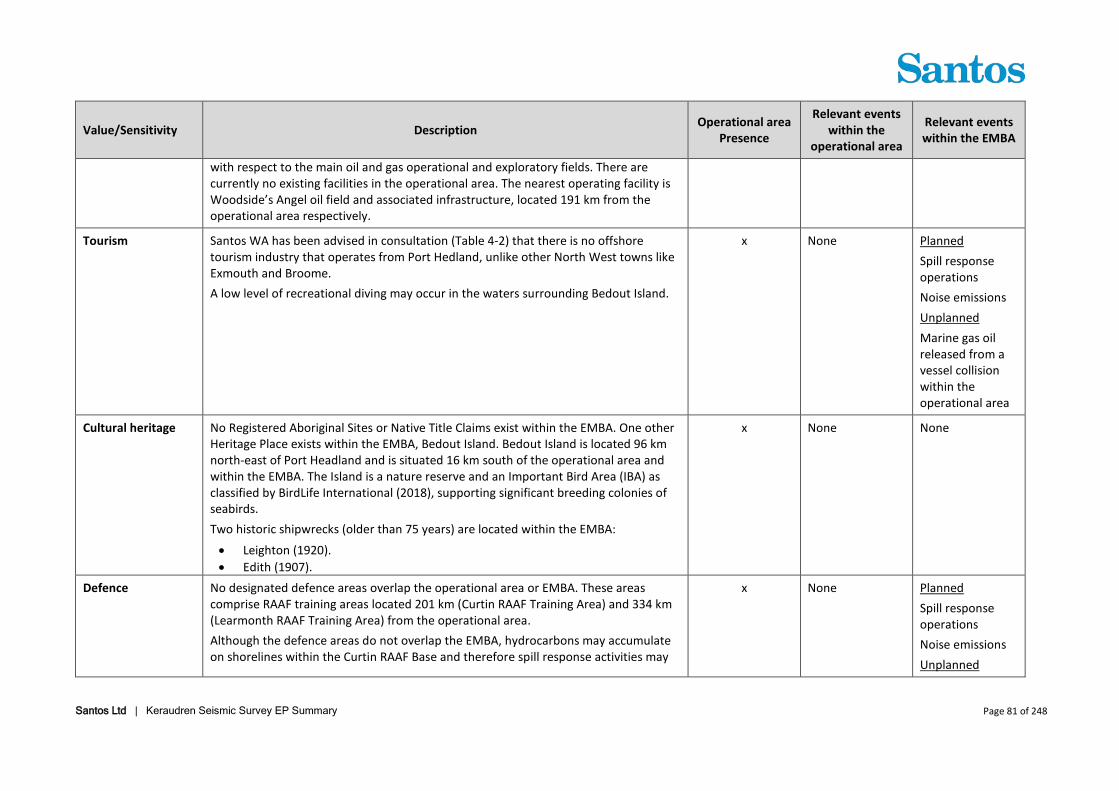
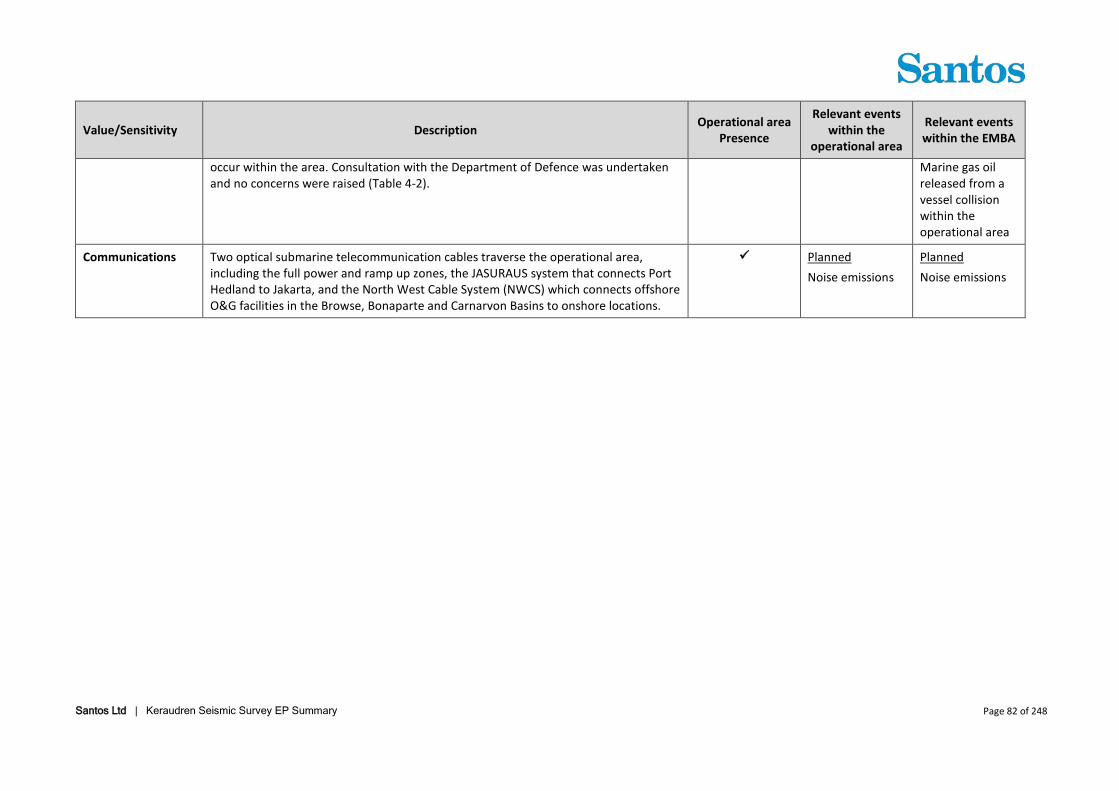
3.5 Socio-Economic Receptors Relevant State and Commonwealth fisheries that overlap the operational area and/or EMBA are shown in Table 3-7. Active fisheries were identified in consultation with the Department of Primary Industries and Regional Development (DPIRD) and West Australian Fishing Industry Council (WAFIC). Santos WA requested Fish Cube data from DPIRD for all fisheries with operational boundaries that overlap the operational area of the Keraudren seismic survey. Data was provided by DPIRD for five key fisheries only, all other fisheries had insufficient effort for data to be provided. Additional Fish Cube data was sought for the Mackerel Managed Fishery (Area 2) and the Pilbara Demersal Scalefish Fishery, from here on described individually as the Pilbara Fish Trawl Interim Managed Fishery, the Pilbara Trap Managed Fishery and Pilbara Line Managed Fishery. In addition, commercially important fish species that may be aggregating/spawning within the EMBA were identified through consultation with DPIRD and WAFIC. This information is provided, together with other key periods of sensitivity for socio-economic receptors in Table 3-8. Other socio-economic considerations such as shipping, recreational fishing, oil and gas industry, tourism and cultural heritage in relation to the operational area and EMBA are summarised in Table 3-9.
Santos Ltd | Keraudren Seismic Survey EP Summary Page 46 of 248
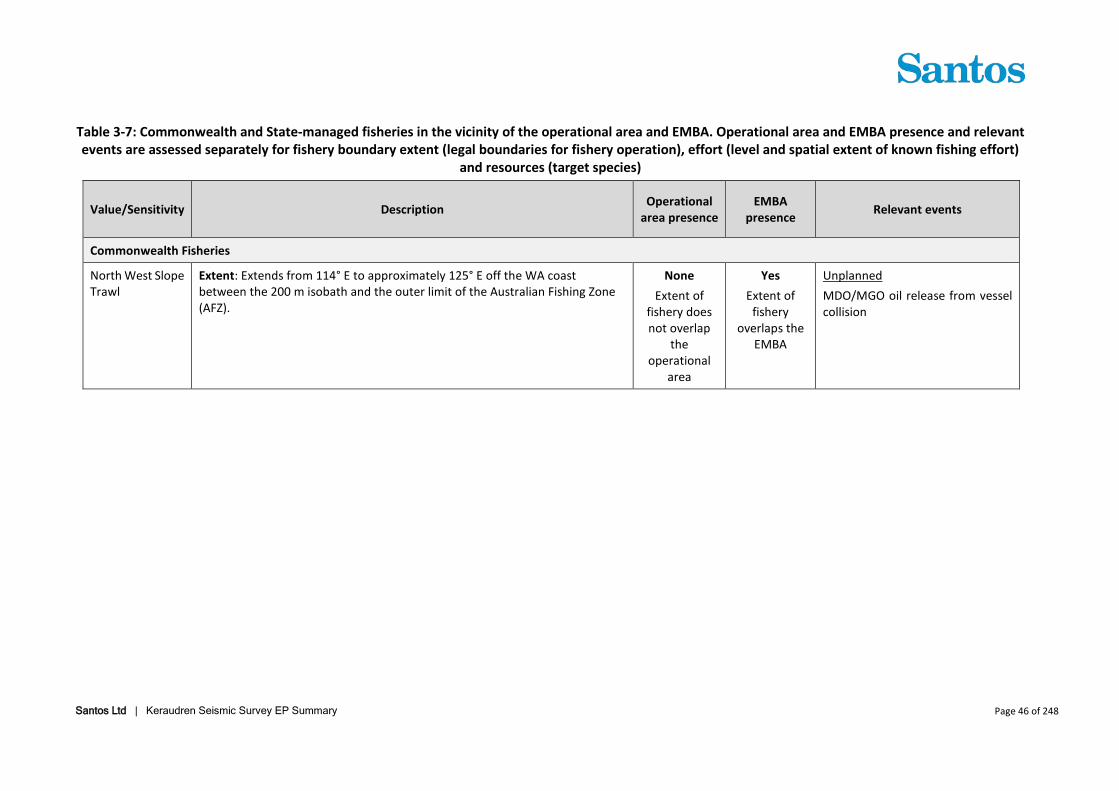
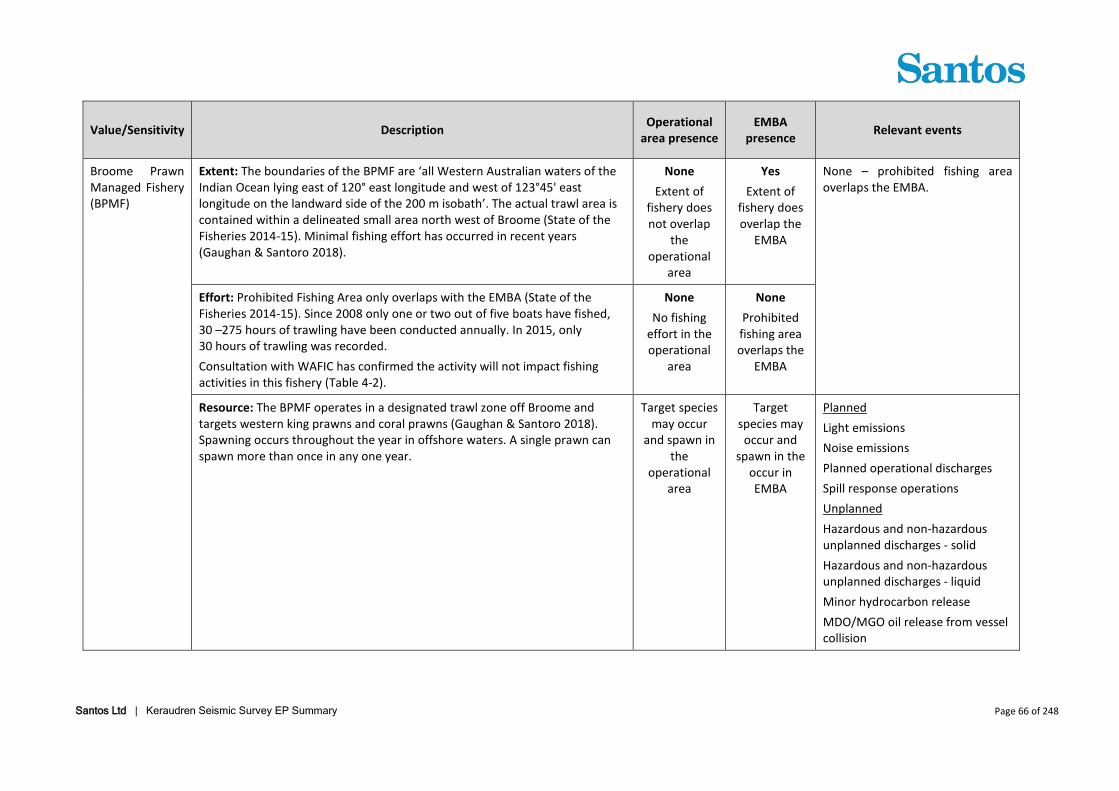
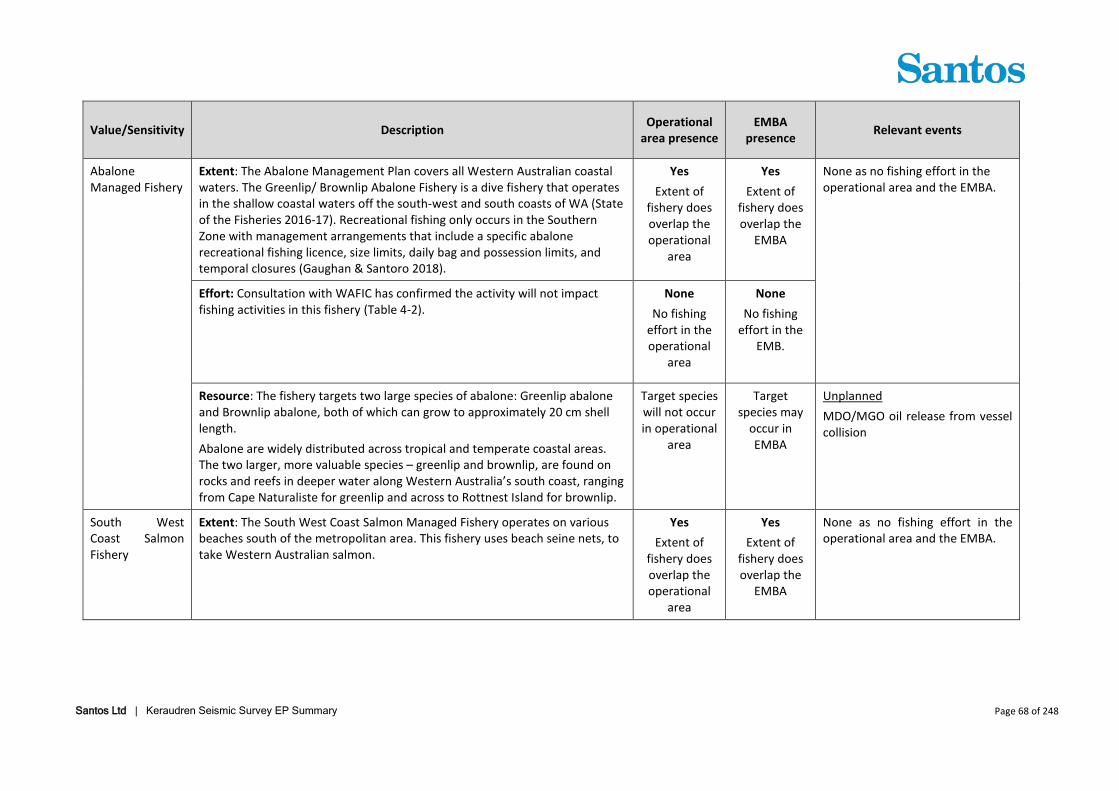
Table 3-7: Commonwealth and State-managed fisheries in the vicinity of the operational area and EMBA. Operational area and EMBA presence and relevant events are assessed separately for fishery boundary extent (legal boundaries for fishery operation), effort (level and spatial extent of known fishing effort)
and resources (target species)
Value/Sensitivity Description Operational area presence
EMBA presence Relevant events
Commonwealth Fisheries
North West Slope Trawl
Extent: Extends from 114° E to approximately 125° E off the WA coast between the 200 m isobath and the outer limit of the Australian Fishing Zone (AFZ).
None Extent of
fishery does not overlap
the operational
area
Yes Extent of
fishery overlaps the
EMBA
Unplanned MDO/MGO oil release from vessel collision
Santos Ltd | Keraudren Seismic Survey EP Summary Page 47 of 248
Value/Sensitivity Description Operational area presence
EMBA presence Relevant events
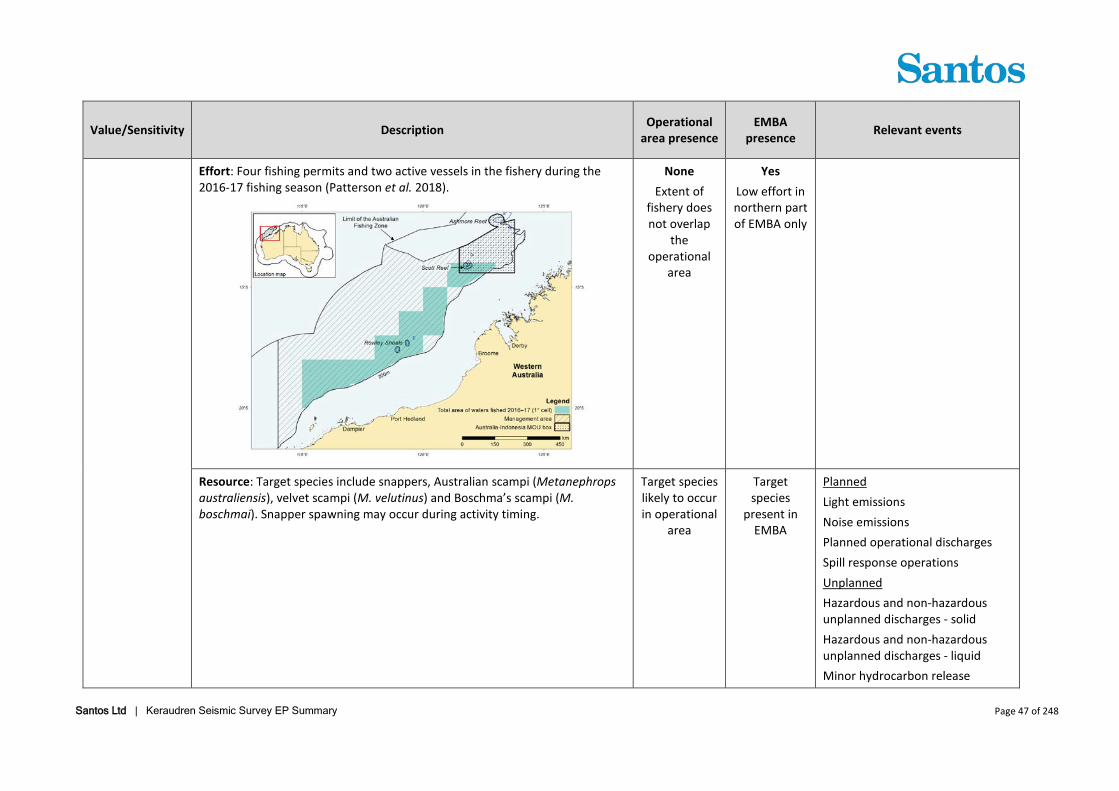
Effort: Four fishing permits and two active vessels in the fishery during the 2016-17 fishing season (Patterson et al. 2018).
None Extent of
fishery does not overlap
the operational
area
Yes Low effort in northern part of EMBA only
Resource: Target species include snappers, Australian scampi (Metanephrops australiensis), velvet scampi (M. velutinus) and Boschma’s scampi (M. boschmai). Snapper spawning may occur during activity timing.
Target species likely to occur in operational
area
Target species
present in EMBA
Planned Light emissions Noise emissions Planned operational discharges Spill response operations Unplanned Hazardous and non-hazardous unplanned discharges - solid Hazardous and non-hazardous unplanned discharges - liquid Minor hydrocarbon release
Santos Ltd | Keraudren Seismic Survey EP Summary Page 48 of 248
Value/Sensitivity Description Operational area presence
EMBA presence Relevant events
MDO/MGO oil release from vessel collision
Western Tuna and Billfish Fishery
Extent: Extends westward from Cape York Peninsula (142°30’ E) off Queensland to 34° S off the WA west coast. It also extends eastward from 34° S off the west coast of WA across the Great Australian Bight to 141° E at the South Australian–Victorian border.
Yes Extent of
fishery overlaps the operational
area
Yes Extent of
fishery overlaps the
EMBA
None based on no recent fishing effort in the operational area and the EMBA
Santos Ltd | Keraudren Seismic Survey EP Summary Page 49 of 248
Value/Sensitivity Description Operational area presence
EMBA presence Relevant events
Effort: Since 2005, there has been fewer than five vessels active in the Western Tuna and Billfish Fishery, down from 50 active vessels in 2000. In recent years, fishing effort has concentrated off south-west Western Australia and South Australia with no current effort on NWS (Patterson et al. 2018). This correlates with consultation feedback from AFMA and WAFIC (Table 4-2).
None No recent
fishing effort in operational
area
None No recent effort in EMBA
Santos Ltd | Keraudren Seismic Survey EP Summary Page 50 of 248
Value/Sensitivity Description Operational area presence
EMBA presence Relevant events
Resource: Bigeye tuna (Thunnus obesus), yellowfin tuna (T. albacares), broadbill swordfish (Xiphias gladius) and striped marlin (Tetrapturus audux). Migratory pelagic species migration routes may traverse operational area and EMBA, though these are undefined. No key spawning areas identified (Table 3-8).
May occur in operational
area
May occur in EMBA
Planned Light emissions Noise emissions Planned operational discharges Spill response operations Unplanned Hazardous and non-hazardous unplanned discharges - solid Hazardous and non-hazardous unplanned discharges - liquid Minor hydrocarbon release MDO/MGO oil release from vessel collision
Southern Bluefin Tuna Fishery
Extent: Fishery includes all waters of Australia, out to 200 nm from the coast. Yes Extent of
fishery overlaps the operational
area
Yes Extent of
fishery overlaps the
EMBA
None based on no recent fishing effort in the operational area and the EMBA.
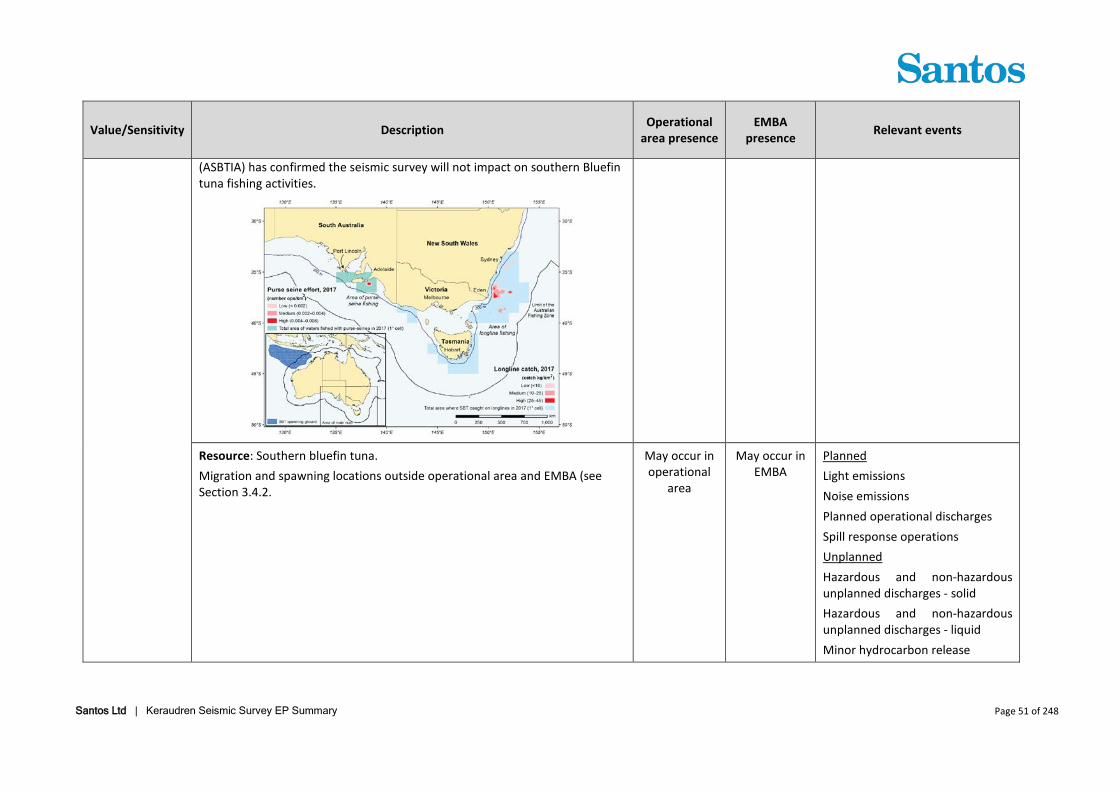
Effort: No current effort on NWS, fishing activity is concentrated in the Great Australian Bight and off South-east Australia (Patterson et al. 2018). Consultation with the Australian Southern Bluefin Tuna Industry Association
None No recent
fishing effort in operational
area
None No recent effort in EMBA
Santos Ltd | Keraudren Seismic Survey EP Summary Page 51 of 248
Value/Sensitivity Description Operational area presence
EMBA presence Relevant events
(ASBTIA) has confirmed the seismic survey will not impact on southern Bluefin tuna fishing activities.
Resource: Southern bluefin tuna. Migration and spawning locations outside operational area and EMBA (see Section 3.4.2.
May occur in operational
area
May occur in EMBA
Planned Light emissions Noise emissions Planned operational discharges Spill response operations Unplanned Hazardous and non-hazardous unplanned discharges - solid Hazardous and non-hazardous unplanned discharges - liquid Minor hydrocarbon release
Santos Ltd | Keraudren Seismic Survey EP Summary Page 52 of 248
Value/Sensitivity Description Operational area presence
EMBA presence Relevant events
MDO/MGO oil release from vessel collision
Western Skipjack Tuna Fishery
Extent: The Skipjack Tuna Fishery is split into two sectors; east and west. The Western Skipjack Tuna Fishery is located in Australian waters west of 142ᵒ 30’ 00ᵒE, out to 200 nm from the coast.
Yes Extent of
fishery overlaps the operational
area
Yes Extent of
fishery overlaps the
EMBA
None based on no recent fishing effort in the operational area and the EMBA.
Effort: There has been no fishing effort in the Skipjack Tuna Fishery since the 2009 season, and in that season activity concentrated off South Australia (Patterson et al. 2018). Fishing in the Skipjack Tuna Fishery is opportunistic, and highly dependent on availability and the domestic cannery market. Currently, no domestic cannery has active contracts for skipjack tuna (AFMA website).
None No recent
fishing effort in operational
area.
None No recent effort in EMBA.
Resource: Targeting skipjack tuna (Katsuwonus pelamis), this is a pelagic species and may occur in the operational area and EMBA. No key spawning areas identified (see Table 3-8).
May occur in operational
area
May occur in EMBA
Planned Light emissions Noise emissions Planned operational discharges Spill response operations Unplanned Hazardous and non-hazardous unplanned discharges - solid Hazardous and non-hazardous unplanned discharges - liquid Minor hydrocarbon release MDO/MGO oil release from vessel collision
Santos Ltd | Keraudren Seismic Survey EP Summary Page 53 of 248
Value/Sensitivity Description Operational area presence
EMBA presence Relevant events
State Fisheries
Pilbara Fish Trawl Interim Managed Fishery (PFTIMF)
Extent: The PFTIMF is situated in the Pilbara region in the north west of Australia. The PFTIMF boundaries are seaward of the 50 m isobath and landward of the 200 m isobath (Gaughan & Santoro 2018). In the 2018/2019 season, there are 11 licenses in the Pilbara Trawl Fishery and two active operators (Table 4-2).
Yes Extent of
fishery overlaps the operational
area
Yes Extent of
fishery overlaps the
EMBA
Planned: Interaction with other marine users Noise emissions Spill response operations Unplanned MDO/MGO oil release from vessel collision
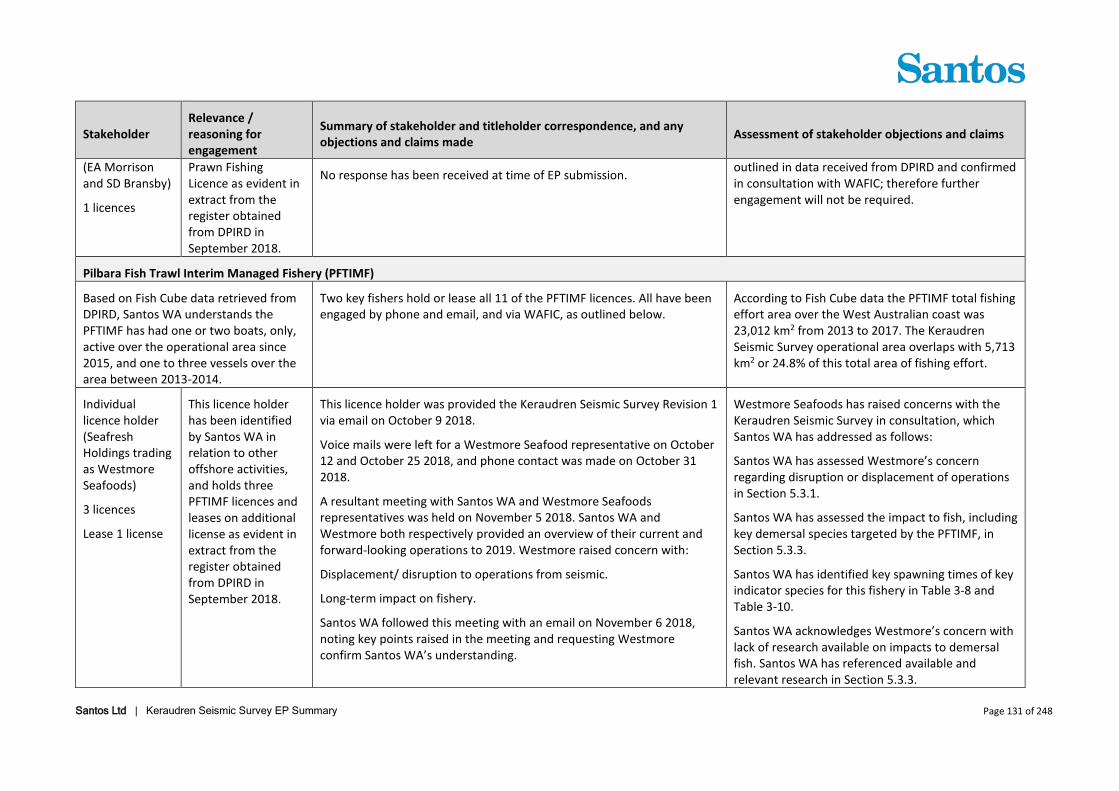
Effort: FishCube data shows fishing effort within the fishery over a 5 year period (2013 to 2017). PFTIMF effort over the West Australian coast is 23,012km2. The operational area overlaps with 5,713 km2 of the area of effort (24.8% of the area of fishing effort).
In consultation Santos WA has been advised up to four vessels may be operational in this fishery during 2019 (Table 4-2).
Yes Fishing
activity may occur in the operational
area
Yes Fishing
activity may occur in the
EMBA
Resource: The PFTIMF main target species include bluespotted emperor (Lethrinus punctulatus), red emperor (Lutjanus sebae), and rankin cod (Epinephelus multinotatus). Spawning of bluespotted emperor, red emperor, goldband snapper, pink snapper and rankin cod occur in operational area and within activity timing (Table 3-8).
Target species occur in
operational area.
Target species occur
in EMBA.
Planned Light emissions Noise emissions Planned operational discharges Spill response operations Unplanned Hazardous and non-hazardous unplanned discharges - solid Hazardous and non-hazardous unplanned discharges - liquid Minor hydrocarbon release MDO/MGO oil release from vessel collision
Santos Ltd | Keraudren Seismic Survey EP Summary Page 54 of 248
Value/Sensitivity Description Operational area presence
EMBA presence Relevant events
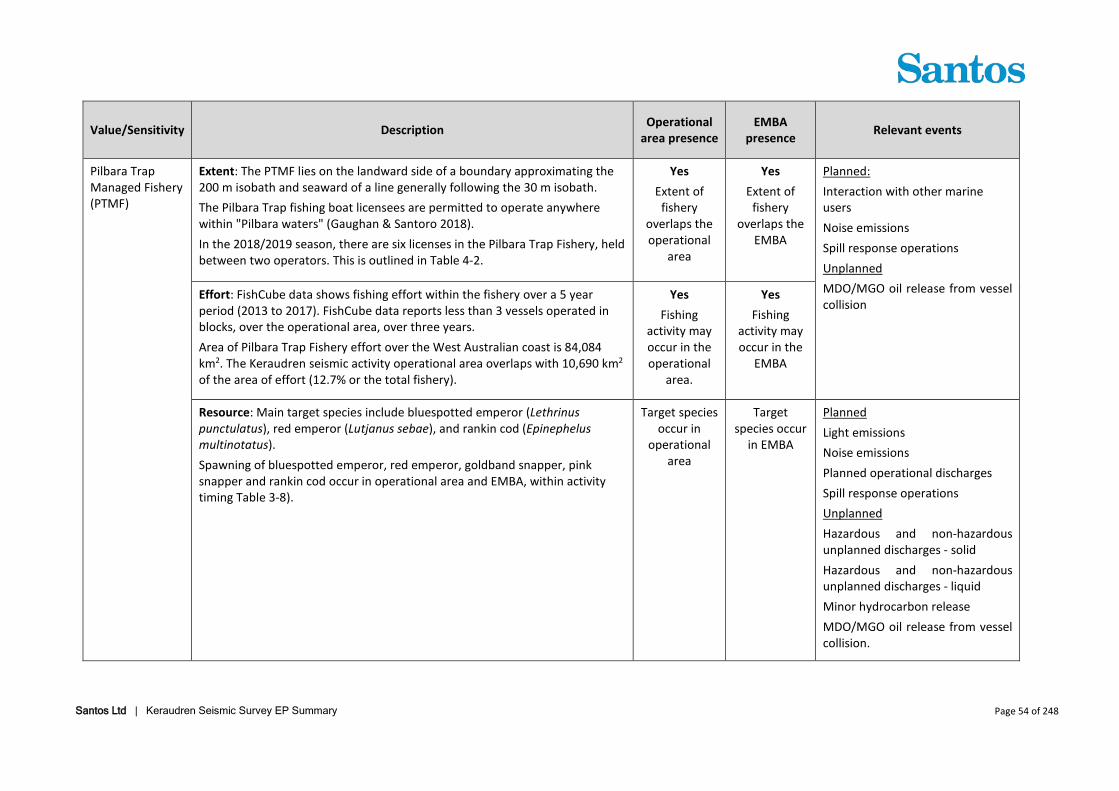
Pilbara Trap Managed Fishery (PTMF)
Extent: The PTMF lies on the landward side of a boundary approximating the 200 m isobath and seaward of a line generally following the 30 m isobath. The Pilbara Trap fishing boat licensees are permitted to operate anywhere within "Pilbara waters" (Gaughan & Santoro 2018). In the 2018/2019 season, there are six licenses in the Pilbara Trap Fishery, held between two operators. This is outlined in Table 4-2.
Yes Extent of
fishery overlaps the operational
area
Yes Extent of
fishery overlaps the
EMBA
Planned: Interaction with other marine users Noise emissions Spill response operations Unplanned MDO/MGO oil release from vessel collision
Effort: FishCube data shows fishing effort within the fishery over a 5 year period (2013 to 2017). FishCube data reports less than 3 vessels operated in blocks, over the operational area, over three years. Area of Pilbara Trap Fishery effort over the West Australian coast is 84,084 km2. The Keraudren seismic activity operational area overlaps with 10,690 km2 of the area of effort (12.7% or the total fishery).
Yes Fishing
activity may occur in the operational
area.
Yes Fishing
activity may occur in the
EMBA
Resource: Main target species include bluespotted emperor (Lethrinus punctulatus), red emperor (Lutjanus sebae), and rankin cod (Epinephelus multinotatus). Spawning of bluespotted emperor, red emperor, goldband snapper, pink snapper and rankin cod occur in operational area and EMBA, within activity timing Table 3-8).
Target species occur in
operational area
Target species occur
in EMBA
Planned Light emissions Noise emissions Planned operational discharges Spill response operations Unplanned Hazardous and non-hazardous unplanned discharges - solid Hazardous and non-hazardous unplanned discharges - liquid Minor hydrocarbon release MDO/MGO oil release from vessel collision.
Santos Ltd | Keraudren Seismic Survey EP Summary Page 55 of 248
Value/Sensitivity Description Operational area presence
EMBA presence Relevant events
Pilbara Line Managed Fishery (PLMF)
Extent: The PLMF fishing boat licensees are permitted to operate anywhere within "Pilbara waters" (Gaughan & Santoro 2018). In the 2018/2019 season there are nine individual licences in the Pilbara Line Fishery, held by seven operators. This is outlined in Table 4-2.
Yes Extent of
fishery overlaps the operational
area
Yes Extent of
fishery overlaps the
EMBA
Planned: Interaction with other marine users Noise emissions Spill response operations Unplanned MDO/MGO oil release from vessel collision
Effort: FishCube data shows fishing effort within the fishery over a 5 year period (2013 to 2017). Area of effort is 134,318 km2. Operational area overlaps with 5,553 km2 of the area of effort (4.1%). FishCube data reports less than three vessels operated in blocks over the operational area over three years.
Yes Fishing
activity may occur in the operational
area.
Yes Fishing
activity may occur in the
EMBA
Resource: Main target species include goldband snapper and ruby snapper, based on feedback from DPIRD in consultation. Spawning of commercial snapper species including goldband snapper and pink snapper may occur in operational area and EMBA, within activity timing (Table 3-8).
Target species occur in
operational area
Target species occur
in EMBA
Planned Light emissions Noise emissions Planned operational discharges Spill response operations Unplanned Hazardous and non-hazardous unplanned discharges - solid Hazardous and non-hazardous unplanned discharges - liquid Minor hydrocarbon release MDO/MGO oil release from vessel collision
Santos Ltd | Keraudren Seismic Survey EP Summary Page 56 of 248
Value/Sensitivity Description Operational area presence
EMBA presence Relevant events
Mackerel Managed Fishery (Area 2)
Extent: Trolling or handline. Near-surface trolling gear from vessels in coastal areas around reefs, shoals and headlands. Target species comprise spanish mackerel. The commercial catch of spanish mackerel was 276 tonnes in 2016 (Gaughan & Santoro 2018) and has been 270-330 tonnes per year since quotas were introduced in 2006.
Yes Extent of
fishery overlaps the operational
area
Yes Extent of
fishery overlaps the
EMBA
Planned Interaction with other marine users Noise emissions Spill response operations Unplanned MDO/MGO oil release from vessel collision
Effort: FishCube data shows the Mackerel Managed Fishing effort within Area 2 is 37, 219 km2. The operational area overlaps with 2,309 km2 of the area of effort (6.2%). Effort is restricted to the southern portion of the of the operational area (22 % - calculated as the area of operational area overlapping area of fishing effort (2,309 km2) / total operational area (10,690 km2) x 100)), which is corroborated by consultation with stakeholders that stated that the fishery typically operates in water depths less than 60 m (Table 4-2). FishCube data shows that less than 3 vessels operated in blocks overlapping the operational area over the last three years. Consultation with stakeholders advised that only one license holder is active in the area (Table 4-2). Santos WA was also advised that the southern portion of the operational area (where the FishCube blocks overlap) comprises important fishing grounds which are fished each year. Fishing activity occurs year-round but peaks in May to August, coinciding in part with the activity timing (Table 4-2).
Yes Fishing
activity likely to occur in
the operational
area
Yes Fishing
activity likely to occur in the EMBA
Santos Ltd | Keraudren Seismic Survey EP Summary Page 57 of 248
Value/Sensitivity Description Operational area presence
EMBA presence Relevant events
Resource: Spanish mackerel are an offshore, pelagic (surface-dwelling) fish which inhabit offshore and coastal reefs. No offshore reefs or shoals occur in the operational area, however, coastal reefs, and reefs fringing Bedout Island, are present within the EMBA. Spawning of Spanish mackerel identified by DPIRD will not overlap with activity timing, however stakeholder feedback indicates a different period for spawning which may overlap the activity timing (Table 3-8).
Yes Target species
occur in operational
area
Yes Target
species occur in EMBA
Planned Light emissions Noise emissions Planned operational discharges Spill response operations Unplanned Hazardous and non-hazardous unplanned discharges - solid Hazardous and non-hazardous unplanned discharges - liquid Minor hydrocarbon release MDO/MGO oil release from vessel collision
Pearl Oyster Managed Fishery
Extent: Operational area occurs within the boundaries of Zone 2 of the fishery. The collection of pearl oysters for the Pearl Oyster Managed Fishery is restricted to shallow diving depths below 35 m.
Effort: FishCube data shows no effort within the operational area, due to the restriction of pearl diving operational activities to shallow diving depths below 35 m.
None Pearl diving operational activities do not intersect
the operational
area
Yes Pearl diving operational
activities may intersect the
EMBA
Santos Ltd | Keraudren Seismic Survey EP Summary Page 58 of 248
Value/Sensitivity Description Operational area presence
EMBA presence Relevant events
Resource: The breeding season of pearl oysters starts in the spring months of September or October, extending to the autumn months of April and May. Although there is variability from month to month, the primary spawning occurs from the middle of October to December (Daume et al. 2016). Spawning in the main fishing areas of the Eighty Mile Beach region is concentrated around broodstock distributed between 8 and 15 m depth, with potential smaller contributions from the north-east (Condie et al. 2006). These spawning events lead to recruitment locally and alongshore to the south-west and also feed larvae into neighbouring shallow coastal environments and deeper waters to the west (~20 m depth). Larval dispersion from known broodstock populations mostly travel less than 30 km, however, some have been modelled as potentially travelling up to 60 km (Condie et al. 2006).
Target species may occur in operational
area.
Target species will
occur in EMBA
Planned Light emissions Noise emissions Planned operational discharges Spill response operations Unplanned Hazardous and non-hazardous unplanned discharges - solid Hazardous and non-hazardous unplanned discharges - liquid Minor hydrocarbon release MDO/MGO oil release from vessel collision
West Coast Deep Sea Crustacean Managed Fishery (WCDSCMF)
Extent: Trap fishery which operates seaward of the 150 m isobath. While the fishery includes the North Coast bioregion, fishing activities are predominately centred in the Gascoyne and West Coast bioregions. While the boundaries of the WCDSCMF are from the 150 m isobath to the edge of the Australian EEZ, most fishing is concentrated in deeper waters on the continental slope between 500 - 800 m depths. The product is landed live at ports between Carnarvon and Fremantle (Gaughan & Santoro 2018).
Yes Extent of
fishery does overlap the operational
area.
Yes Extent of
fishery does overlap the
EMBA
None based on no recent fishing effort in the operational area and the EMBA.
Effort: FishCube data shows no fishing effort within the operational area. Consultation with WAFIC has confirmed the activity will not impact fishing activities in this fishery (Table 4-2).
None WCDSCMF does not
intersect the operational
area
None WCDSCMF does not
intersect the EMBA
Santos Ltd | Keraudren Seismic Survey EP Summary Page 59 of 248
Value/Sensitivity Description Operational area presence
EMBA presence Relevant events
Resource: The West Coast Deep Sea Crustacean resource consists primarily of Crystal (snow), Champagne (spiny) and Giant (king) crabs. Catches are dominated by crystal crabs, landings of champagne and giant crabs predominantly occur off the south coast, as accessed by the South Coast Crustacean Managed Fishery (Gaughan & Santoro 2018). Crystal crabs are a deep-water species occurring on the continental shelf at depths of 300 – 1200 m. Reproductive development in crystal crab involves ovarian development before females become ovigerous. Ovarian development (late-stage vitellogenic oocytes) was found to be greatest in July-December compared to January to April (How et al.2015).
Target species may occur in operational
area
Target species may
occur in EMBA
Planned Light emissions Noise emissions Planned operational discharges Spill response operations Unplanned Hazardous and non-hazardous unplanned discharges - solid Hazardous and non-hazardous unplanned discharges - liquid Minor hydrocarbon release MDO/MGO oil release from vessel collision
Nickol Bay Prawn Managed Fishery (NBPMF)
Extent: The boundaries of the NBPMF are all the waters of the Indian Ocean and Nickol Bay between 116°45' east longitude and 120°east longitude on the landward side of the 200 m isobath’. The NBPMF incorporates the Nickol Bay, Extended Nickol Bay, Depuch and De Grey size managed fish grounds (State of the Fisheries 2014-15).
Yes Extent of
fishery does overlap the operational
area
Yes Extent of
fishery does overlap the
EMBA
None based on no recent fishing effort in the operational area and the EMBA.
Santos Ltd | Keraudren Seismic Survey EP Summary Page 60 of 248
Value/Sensitivity Description Operational area presence
EMBA presence Relevant events
Effort: Fish Cube data shows effort in the NBPMF does not intersect the operational area. Consultation with WAFIC has confirmed the activity will not impact fishing activities in this fishery (Table 4-2).
None Prawn
trawling operational activities do not intersect
the operational
area
None Prawn
trawling operational activities do not intersect
the EMBA
Resource: NBPMF primarily targets banana prawns (Penaeus merguiensis) (Gaughan & Santoro 2018). Banana Prawn spawning occurs in shallow coastal waters throughout the year there are two spawning peaks: the late dry season (September-November) and the late wet season (March-May) (AFMA website).
Target species may occur in operational
area
Target species will
occur in EMBA
Planned Light emissions Noise emissions Planned operational discharges Spill response operations Unplanned Hazardous and non-hazardous unplanned discharges - solid Hazardous and non-hazardous unplanned discharges - liquid Minor hydrocarbon release MDO/MGO oil release from vessel collision
Santos Ltd | Keraudren Seismic Survey EP Summary Page 61 of 248
Value/Sensitivity Description Operational area presence
EMBA presence Relevant events
Pilbara Development Crab Managed Fishery (PDCMF)
Extent: Blue swimmer crabs are targeted by the Pilbara Developmental Crab Fishery within inshore waters around Nickol Bay using hourglass trap (Gaughan and Santoro 2018). Crabbing activity along the Pilbara coast is centred largely on the inshore waters from Onslow through to Port Hedland, with most commercial and recreational activity occurring in and around Nickol Bay (State of the Fisheries 2014/15).
Yes Extent of
fishery does overlap the operational
area.
Yes Extent of
fishery does overlap the
EMBA
None based on no recent fishing effort in the operational area and the EMBA.
Effort: FishCube data shows no fishing effort within the operational area. Consultation with WAFIC has confirmed the activity will not impact fishing activities in this fishery (Table 4-2).
None PDCMF
operational activities do not intersect
the operational
area.
None PDCMF
operational activities do not intersect the EMBA.
Resource: The blue swimmer crab is found along the entire WA coast, in a wide range of inshore and continental shelf areas, from the inter-tidal zone to at least 50 m in depth. However, the majority of the commercially and recreationally-fished stocks are concentrated in the coastal embayments and estuaries between Geographe Bay in the south west and Port Hedland in the north (Gaughan & Santoro 2018).
Target species may occur in operational
area.
Target species may
occur in EMBA.
Planned Light emissions Noise emissions Planned operational discharges Spill response operations Unplanned Hazardous and non-hazardous unplanned discharges - solid Hazardous and non-hazardous unplanned discharges - liquid Minor hydrocarbon release MDO/MGO oil release from vessel collision
Santos Ltd | Keraudren Seismic Survey EP Summary Page 62 of 248
Value/Sensitivity Description Operational area presence
EMBA presence Relevant events
Marine Aquarium Fish Managed Fishery (MAFMF)
Extent: Effort within the operational area and EMBA is unknown but is unlikely due to the depth and the dive-based method of collection. The MAFMF is able to operate in all State waters (between the Northern Territory border and South Australian border). The fishery is typically more active in waters south of Broome with higher levels of effort around the Capes region, Perth, Geraldton, Exmouth and Dampier. Operators in the MAFMF are also permitted to take coral, live rock, algae, seagrass and invertebrates under the Prohibition on Fishing (Coral, ‘Live Rock’ and Algae) Order 2007 and by way of Ministerial Exemption (Gaughan & Santoro 2018).
Yes Extent of
fishery does overlap the operational
area.
Yes Extent of
fishery does overlap the
EMBA.
None based on no recent fishing effort in the operational area and the EMBA.
Effort: FishCube data shows no fishing effort within the operational area. Consultation with WAFIC has confirmed the activity will not impact fishing activities in this fishery (Table 4-2).
None MAFMF does not intersect
the operational
area.
None MAFMF does not intersect the EMBA.
Resource: The MAFMF resource potentially includes more than 950 species of marine aquarium fishes under the Marine Aquarium Fish Management Plan 1995.
Target species may occur in operational
area
Target species may
occur in EMBA
Planned Light emissions Noise emissions Planned operational discharges Spill response operations Unplanned Hazardous and non-hazardous unplanned discharges - solid Hazardous and non-hazardous unplanned discharges - liquid Minor hydrocarbon release MDO/MGO oil release from vessel collision
Santos Ltd | Keraudren Seismic Survey EP Summary Page 63 of 248
Value/Sensitivity Description Operational area presence
EMBA presence Relevant events
Specimen Shell Managed Fishery
Extent: The main method of specimen shell collection is by hand, by a small group of divers operating from small boats in shallow coastal waters or by wading along coastal beaches below the high water mark. A current Exemption permits the use of a remote controlled underwater vehicle at depths of up to 300 m. This is a limited entry fishery with 23 active licences in 2016. A maximum of 2 divers are allowed in the water per licence at any one time and specimens may only be collected by hand. Remotely operated vehicles were limited to one per license in 2016.
Yes Extent of
fishery does overlap the operational
area
Yes Extent of
fishery does overlap the
EMBA
Planned Interaction with other marine users Spill response operations Unplanned MDO/MGO oil release from vessel collision
Effort: Fish Cube data did indicate some activity in the vicinity of the operational area, in consultation with WAFIC and the Specimen Shell Industry Association it was confirmed this would have occurred from a boat with an ROV. Further consultation with WAFIC and directly with the Specimen Shell Industry Association has confirmed the activity should not impact specimen shell collecting activities (Table 4-2).
Yes Specimen
shell collection
activities with ROV may
occur in the operational
area
Yes Specimen
shell collecting
activities may occur within
the EMBA
Resource: During the 2016 season the catch rate was approximately 14 shells per day. There is some focus of effort on mollusc families most popular with shell collectors, such as cowries, cones, murexes and volutes. Cypraeidae or cowries are noted for their localised variations in both shape and colour, making them attractive to collectors. Habitat and ecosystem impacts are considered negligible. This is due to the small scale of the fishery and the hand collection methods. While the fisheries can potentially operate over large areas catches are relatively low due to the special handling requirements. For example, collectors will ignore any specimens with slight visual imperfections, but their reproductive potential in the population remains undiminished. This results in a negligible risk to the overall ecosystem from the fishery.
Target species occur in
operational area
Target species occur
in EMBA
Planned Light emissions Noise emissions Planned operational discharges Spill response operations Unplanned Hazardous and non-hazardous unplanned discharges - solid Hazardous and non-hazardous unplanned discharges - liquid Minor hydrocarbon release
Santos Ltd | Keraudren Seismic Survey EP Summary Page 64 of 248
Value/Sensitivity Description Operational area presence
EMBA presence Relevant events
MDO/MGO oil release from vessel collision
WA North Coast Shark Fishery
Extent: The Northern Shark Fishery comprises the State-managed WA North Coast Shark Fishery in the Pilbara and western Kimberley, and the Joint Authority Northern Shark Fishery in the eastern Kimberley. This fishery is currently closed to protect the breeding grounds of the resource which support the two southern shark fisheries. No fishing effort since 2008/09.
None Fishery is currently
closed
None Fishery is currently
closed
None the fishery is closed.
Effort: This fishery is currently closed, as confirmed in consultation with WAFIC (Table 4-2).
None Fishery is currently
closed
None Fishery is currently
closed
Resource: The main species targeted are the dusky whaler, sandbar, gummy and whiskery sharks. The flesh of sharks caught off the coast of Western Australia is highly regarded and commercially important. Migratory pelagic species migration routes may traverse the operational area though these are undefined. A review of the available literature could not identify peak pupping periods for all target species, information where available is provided in Table 3-8. Pupping typically occurs in shallow waters, however, is dependent on the species.
Target species may occur in operational
area Pupping may
occur in shallower
water depths of the
operational area
Target species may
occur in EMBA
Pupping may occur
particularly in shallow, coastal waters
Planned Light emissions Noise emissions Planned operational discharges Spill response operations Unplanned Hazardous and non-hazardous unplanned discharges - solid Hazardous and non-hazardous unplanned discharges - liquid Minor hydrocarbon release MDO/MGO oil release from vessel collision
Santos Ltd | Keraudren Seismic Survey EP Summary Page 65 of 248
Value/Sensitivity Description Operational area presence
Extent The NDSMF operates off the north west coast of Western Australia in the waters east of 120° E longitude. The permitted means of operation within the fishery include handline, dropline and fish traps, but since 2002 it has essentially been a trap based fishery which uses gear time access and spatial zones as the primary management measures (State of the Fisheries 2014-15). Fishing activity occurs all year round, in Area 1 (inshore line fishing) and Area 2 (predominately trap fishing) overlap with the EMBA only.
Effort: Consultation with WAFIC has confirmed the activity will not impact fishing activities in this fishery (Table 4-2).
None Extent of
fishery does not overlap
the operational
area
Yes Extent of
fishery does overlap the
EMBA
Resource: The NDSMF principally targets the higher-value species such as the goldband snapper and red emperor (State of the Fisheries 2016-17). Spawning of red emperor, goldband snapper, pink snapper and rankin cod occur in operational area and within activity timing (Table 3-8).
Target species likely to occur in operational
area
Target species will
occur in EMBA
Planned Light emissions Noise emissions Planned operational discharges Spill response operations Unplanned Hazardous and non-hazardous unplanned discharges - solid Hazardous and non-hazardous unplanned discharges - liquid Minor hydrocarbon release MDO/MGO oil release from vessel collision
Santos Ltd | Keraudren Seismic Survey EP Summary Page 66 of 248
Value/Sensitivity Description Operational area presence
EMBA presence Relevant events
Broome Prawn Managed Fishery (BPMF)
Extent: The boundaries of the BPMF are ‘all Western Australian waters of the Indian Ocean lying east of 120° east longitude and west of 123°45' east longitude on the landward side of the 200 m isobath’. The actual trawl area is contained within a delineated small area north west of Broome (State of the Fisheries 2014-15). Minimal fishing effort has occurred in recent years (Gaughan & Santoro 2018).
None Extent of
fishery does not overlap
the operational
area
Yes Extent of
fishery does overlap the
EMBA
None – prohibited fishing area overlaps the EMBA.
Effort: Prohibited Fishing Area only overlaps with the EMBA (State of the Fisheries 2014-15). Since 2008 only one or two out of five boats have fished, 30 –275 hours of trawling have been conducted annually. In 2015, only 30 hours of trawling was recorded. Consultation with WAFIC has confirmed the activity will not impact fishing activities in this fishery (Table 4-2).
None No fishing
effort in the operational
area
None Prohibited fishing area overlaps the
EMBA
Resource: The BPMF operates in a designated trawl zone off Broome and targets western king prawns and coral prawns (Gaughan & Santoro 2018). Spawning occurs throughout the year in offshore waters. A single prawn can spawn more than once in any one year.
Target species may occur
and spawn in the
operational area
Target species may occur and
spawn in the occur in EMBA
Planned Light emissions Noise emissions Planned operational discharges Spill response operations Unplanned Hazardous and non-hazardous unplanned discharges - solid Hazardous and non-hazardous unplanned discharges - liquid Minor hydrocarbon release MDO/MGO oil release from vessel collision
Santos Ltd | Keraudren Seismic Survey EP Summary Page 67 of 248
Value/Sensitivity Description Operational area presence
EMBA presence Relevant events
Beche-de-mer Fishery
Extent: Sea cucumbers (also known as bêche-de-mer or trepang) are collected by hand by divers and waders throughout the Kimberley region as part of the Bêche-de-Mer Fishery (State of the Fisheries 2016-17). The Western Australian beche-de-mer fishery is primarily based in the northern half of the State, from Exmouth Gulf to the Northern Territory border, however fishers do have access to all Western Australian waters not specifically closed to fishing (Gaughan & Santoro 2018).
Yes Extent of
fishery does overlap the operational
area
Yes Extent of
fishery does overlap the
EMBA
None as no fishing effort in the operational area and the EMBA.
Effort: FishCube data could not be provided as no effort in the operational area. Consultation with WAFIC has confirmed the activity will not impact fishing activities in this fishery (Table 4-2).
None No fishing
effort in the operational
area
None No fishing
effort in the EMBA
Resource: Catches are mainly comprised of two species, sandfish and redfish (Gaughan & Santoro 2018). The two main commercially retained species in WA, sandfish (H. scabra) and redfish (A. echinites), are widely distributed on soft sediments throughout shallow waters of the Indo-Pacific region. In tropical WA, sandfish and redfish occur primarily within low energy environments behind fringing reefs or within protected bays. Sandfish spawning can occur year-round, although the main spawning season occurs during September to November.
Target species may occur in operational
area
Target species may
occur in EMBA
Planned Light emissions Noise emissions Planned operational discharges Spill response operations Unplanned Hazardous and non-hazardous unplanned discharges - solid Hazardous and non-hazardous unplanned discharges - liquid Minor hydrocarbon release MDO/MGO oil release from vessel collision
Santos Ltd | Keraudren Seismic Survey EP Summary Page 68 of 248
Value/Sensitivity Description Operational area presence
EMBA presence Relevant events
Abalone Managed Fishery
Extent: The Abalone Management Plan covers all Western Australian coastal waters. The Greenlip/ Brownlip Abalone Fishery is a dive fishery that operates in the shallow coastal waters off the south-west and south coasts of WA (State of the Fisheries 2016-17). Recreational fishing only occurs in the Southern Zone with management arrangements that include a specific abalone recreational fishing licence, size limits, daily bag and possession limits, and temporal closures (Gaughan & Santoro 2018).
Yes Extent of
fishery does overlap the operational
area
Yes Extent of
fishery does overlap the
EMBA
None as no fishing effort in the operational area and the EMBA.
Effort: Consultation with WAFIC has confirmed the activity will not impact fishing activities in this fishery (Table 4-2).
None No fishing
effort in the operational
area
None No fishing
effort in the EMB.
Resource: The fishery targets two large species of abalone: Greenlip abalone and Brownlip abalone, both of which can grow to approximately 20 cm shell length. Abalone are widely distributed across tropical and temperate coastal areas. The two larger, more valuable species – greenlip and brownlip, are found on rocks and reefs in deeper water along Western Australia’s south coast, ranging from Cape Naturaliste for greenlip and across to Rottnest Island for brownlip.
Target species will not occur in operational
area
Target species may
occur in EMBA
Unplanned MDO/MGO oil release from vessel collision
South West Coast Salmon Fishery
Extent: The South West Coast Salmon Managed Fishery operates on various beaches south of the metropolitan area. This fishery uses beach seine nets, to take Western Australian salmon.
Yes Extent of
fishery does overlap the operational
area
Yes Extent of
fishery does overlap the
EMBA
None as no fishing effort in the operational area and the EMBA.
Santos Ltd | Keraudren Seismic Survey EP Summary Page 69 of 248
Value/Sensitivity Description Operational area presence
EMBA presence Relevant events
Effort: Consultation with WAFIC has confirmed the activity will not impact fishing activities in this fishery (Table 4-2).
None No fishing effort in
operational area
None No fishing effort in EMBA
Resource: Salmon form a single breeding stock across southern Australia. In Western Australia they are found in cooler southern waters, but salmon are also common in waters north of Perth metropolitan area during winter months. Salmon are responsive to ocean temperatures, and their seasonal movement is closely related to the strengths of the Leeuwin Current and Capes Current and subsequent water temperatures. In 2015 and 2016 very large schools of salmon were observed in south-western waters and as far north as Exmouth, which is further north than ever previously reported.
Target species will not occur in operational
area
Target species will not occur in
EMBA
None as the target species does not occur within the operational area and the EMBA.
Santos Ltd | Keraudren Seismic Survey EP Summary Page 70 of 248
3.5.1 Key Commercial Fish Species
The Pilbara Demersal Scalefish Fisheries includes Pilbara Fish Trawl (Interim) Managed Fishery (PFTIMF), the Pilbara Trap Managed Fishery and the Pilbara Line Fishery. The Pilbara demersal biological stocks are ranked by DPIRD as Sustainable-Adequate (Gaughan, D.J. and Santoro, K. (eds). 2018). The stock status is assessed periodically (approximately every 5 years), and in 2016 the spawning biomass stock for the three demersal indicator species for the Pilbara region was assessed as above the threshold target spawning biomass levels, classifying the biological stocks for the Pilbara region of the north coast demersal resource as sustainable - adequate. The indicator species landed by the demersal fisheries in the Pilbara subregion (region that the Keraudren activity overlaps) are the red emperor (Lutjanus sebae), rankin cod (Epinephelus multinotatus) and blue-spotted emperor (Lethrinus punctulatus). The status of the ruby snapper is also used as an indicator species for the offshore demersal scalefish resources targeted by the Pilbara Line Fishery.
The large pelagic resource is distributed throughout Western Australia (Gaughan, D.J. and Santoro, K. (eds). 2018). The three indicator species of the pelagic resource are Spanish mackerel (Scomberomorus commerson), grey mackerel (Scomberomorus semifasciatus), and Samson fish (Seriola hippos). Commercially the resource is accessed by the Mackerel Managed Fishery and in the North Coast Bioregion. Management changes were implemented for this fishery in 2006. The catch rates in the Pilbara management zone (and the Kimberley management zone) are stable and increasing, suggesting that the spawning stock for indicator species is stable or increasing and considered to be sustainable-adequate (Gaughan, D.J. and Santoro, K. (eds). 2018). The average annual catch for the Pilbara region for Mackerel Managed Fishery is below the set tolerance range.
Figure 3-9 provides the spatial distribution of catch per unit effort (CPUE) for indicator species of the north western Australia scalefish resources for 2004 - 2008, sourced from Gaughan et al 2018. The data shows that there is variability in the CPUE for the fishery indicator species including the specific areas the fish are caught, i.e. west areas (areas 1 and 2) versus east areas (areas 4 and 5), as well as variability in the water depths that have the greatest CPUE for each of the species. In summary:
• Red emperor is caught across all four of the PFTIMF areas, with the greatest effort for being in Area 2, followed by Area 5, and Area 4. The CPUE was greatest at 50 – 55 m water depth, at 10 kg. hr-1 and averaged 5 kg. hr-1 for depths 55 – 110 m.
• Rankin cod was fished in all areas, with the greatest CPUE from the western area of Area 5, with a CPUE of up to 9 kg. hr-1. The correlating water depth with the highest CPUE was 45 – 50 m (5 kg. hr-
1) and averaged 2 – 4 kg. hr-1 from 50 m – 100 m water depth.
• Blue-spotted emperor had the highest CPUE of approximately 35 kg. hr-1 within Area 1, and approximately 25 kg. hr-1 within Area 2. The highest CPUE was within water depths 45 – 70 m, averaging 25 – 50 m 5 kg. hr-1.
• Goldband snapper had the highest CPUE with Area 5, peaking at 45 – 60 kg. hr-1. There was little catch effort within the shallow waters (i.e. 45 m to 90 m water depth), with a peak at 100 – 105 m water depth of 75 kg. hr-1.
Newman et al. (2014) presents spatial distribution catch data for key commercial fish species including blue-spot emperor, spangled emperor, rankin cod, red emperor, goldband snapper and Spanish mackerel for 2001 across a much larger spatial scale than the Gaughan et al. (2018) study. These are shown in Figure 3-10 with the survey operational area overlain (indicatively), and summarised within Table 3-8.
Santos Ltd | Keraudren Seismic Survey EP Summary Page 71 of 248
Figure 3-9: Spatial Distribution of Catch per Unit Effort for Index Species of the North western Scalefish Resources (2004-2008 data)
Santos Ltd | Keraudren Seismic Survey EP Summary Page 72 of 248
Figure 3-10: Spatial Distribution of key commercial fish species caught across North western Australian based on catch and effort statistics (CAES)
Santos Ltd | Keraudren Seismic Survey EP Summary Page 73 of 248
Table 3-8: Distribution, aggregation/ spawning for key commercial fish species in the North Coast Bioregion
Key fish species within North
Coast Bioregion
Adult Distribution spawning location and stock assessment Spawning times
Goldband snapper (Pristipomoides multidens)
Found along the continental shelf at moderate depths (70 to 210m), associated with offshore reef areas, shoal grounds and areas of flat hard bottom with occasional epibenthos or vertical relief (Newman, 20001). Goldband snapper are typically more concentrated between the 80 m and 140 m depth contours. Dr Newman (DPIRD) indicated that goldband snapper will be distributed across the whole fishery (including closed areas) located within 60 m to 140 m water depths, with some individuals reported to 200 m depth. The broader distribution of goldband snapper is also supported by other peer-reviewed publications. Marriott (2013) states that goldband snapper reside in water depths from 60 m to 250 m, but are often concentrated in depths from 80 m to 150 m. Ovenden (2002) states goldband snapper as inhabiting reefs on hard bottom areas at depths of 60m to at least 180 m and are widely distributed throughout the tropical Indo-Pacific region from Samoa in the central Pacific to the Red Sea in the western Indian Ocean, and from southern Japan to northern Australia. Specific areas of aggregation are not known.
Source: Pristipomoides multidens in Fishes of Australia, accessed 13 Jan 2019,
http://fishesofaustralia.net.au/home/species/575 Juveniles have been obtained from uniform sedimentary habitat with no relief. Juveniles and adults do not co-occur over the same habitat types. Known to spawn throughout the region. The stock structure for goldband snapper in the National Status report – available here http://fish.gov.au/report/221-Goldband-Snapper-2018 indicates that there is gene flow among goldband snapper within the Western Australian management unit that consists of the Kimberley, Pilbara and Gascoyne stocks. Goldband snapper stocks, are found to be genetically distinct from other adjacent stocks (e.g. Pilbara, Broome, Timor Sea, Arafura Sea stocks), which has implications for stock recruitment if the spawning biomass is impacted. In the 2017 State of the Fisheries report the biological stocks of the Pilbara fisheries are classified as sustainable-adequate, based on assessment of the three indicator species in the Pilbara (red emperor (Lutjanus sebae), rankin cod (Epinephelus multinotatus), and bluespotted emperor (Lethrinus punctulatus) which are selected based on their inherent vulnerability and overall risk to sustainability. The management of goldband snapper is based on the stock assessment of these three indicator species.
Santos Ltd | Keraudren Seismic Survey EP Summary Page 74 of 248
Key fish species within North
Coast Bioregion
Adult Distribution spawning location and stock assessment Spawning times
Based on discussions with Dr Newman, goldband snapper tend to associate with hard bottom and school in areas where there are thin veneers of sand (~5 cm deep) that overlay hard substrate. Note that this habitat is widely distributed throughout the fishery and within the seismic survey area and that it is not fixed in space and time as the patches of sand move (e.g. strong currents, cyclones etc). Dr Newman added that goldband snapper can also be found in areas with higher relief i.e. steeper slope beds. Based on the recent data (DPIRD 2019) for goldband snapper:
• Spawning commences in November – December and ramps up through January – February, with a relative peak in March, and continues into April and sometimes May. Whilst March has historically been stated as having the “highest” amount of spawning, it is not significantly greater than the pre and proceeding months.
• There are no known environmental cues for goldband snapper spawning, whilst water temperature could be a driver, there is no certainty associated with this especially given the depth ranges of goldband snapper (80 to 140m), and given this water depth range it is unlikely that the moon phases would drive goldband spawning. Spawning could even be related to food availability.
• Spawning occurs throughout the goldband snapper range. Goldband are batch spawners, can spawn every three days, or every week during the spawning period, and do not have any known aggregating areas. Goldband snapper naturally form schools whether spawning or not. Schools do get larger as the snapper get ready to spawn (November – December).
Rankin cod (Epinephelus multiinotatus)
Rankin cod occur in the Indian Ocean, from the Persian Gulf to Madagascar and to Australia. In Australia, they are found from Shark Bay north to Darwin. The Western Australian population is considered distinct from other Indian Ocean localities based on colour pattern and scale counts (Heemstra and Randall 1993). The eggs of Epinephelus spp are pelagic (Leis and Carson-Ewart 2000).
Source: Dianne J. Bray, Epinephelus multinotatus in Fishes of Australia,
accessed 13 Jan 2019, http://fishesofaustralia.net.au/home/species/4416 Juveniles occur on inshore reefs. Adults typically occur in deeper waters to a depth of at least 90 m. Rankin cod may occur as solitary or in small groups.
Santos Ltd | Keraudren Seismic Survey EP Summary Page 75 of 248
Key fish species within North
Coast Bioregion
Adult Distribution spawning location and stock assessment Spawning times
Rankin cod spawn from August to October. Immature fish are rare in the Pilbara fishery (DoF 2004). Rankin cod are broadcast spawners of pelagic eggs. They appear to spawn across much of the continental shelf of the Pilbara region (DOF 2004). This reproductive strategy facilitates broad dispersal of the pelagic eggs and larvae by alongshore currents. This is further supported by Catch Per Unit Effort (CPUE) data presented in Gaughan et al 2018 which indicates that the depth range with the highest CPUE for Rankin Cod is indicated as 60m to 90m (refer Figure 3-9). Figure 3-10 shows the spatial distribution based on catch effort data for 2001 (CAES) across north western Australia. The Pilbara and Kimberley stocks are considered separate from a fishery management perspective (Newman et al. (2014)).
Blue-spotted emperor (Lethrinus punctulatus and Lethrinus Hutchinsi)
Adults occur in shelf waters to depths of at least 80 m. They are associated with coral reef or lagoon areas over substrates of hard coral, gravel, sand or rubble. They can also be associated with sponge and gorgonian dominated habitats and can occur in clear or turbid waters. There is limited data on reproduction of blue-spot emperor. Juveniles are bottom feeding species and found in seagrass beds and mangrove swamps. Fishes of Australia did not have distribution data for these species. There is no evidence of discrete spawning populations of the blue-spotted emperor in WA. However, some old data suggest limited longshore mixing. Blue-spot emperor is distributed throughout north-western Australia, with the highest catches being landed from the central Pilbara region. Catch Per Unit Effort (CPUE) data presented in Gaughan, D.J 2018 indicates that the depth range with the highest CPUE for blue-spotted emperor is 50m – 75m, and declining in deeper waters to 110m (refer Figure 3-9). Figure 3-10 shows the spatial distribution based on catch effort data for 2001 (CAES) across north western Australia. Juveniles occupy nearshore reef habitats. Trawling and trap fishing is prohibited through this inshore zone and, hence, the juveniles are not subject to significant exploitation pressure.
Protracted spawning
period over 11 months of
year (Newman et
al.2014)
September in the Pilbara,
varies in timing among
the regions (Stephenson
and Mant 1999).
Red emperor (Lutjanus sebae)
There may be some movement of red emperor offshore with increasing age. Juveniles (<20 cm length) are common in nearshore turbid waters, such as mangroves, and also occur on coastal or offshore reefs (Kailola et al. 1993). The sub-adult fish (>20cm) are widely distributed across the continental shelf (Newman pers. obs.). Adults occur across the shelf up to depths of at least 180m and are associated with coral reef lagoons, reefs, epibenthic communities, limestone sand flats and gravel patches (Kailola et al. 1993).
September – March, peak in October
(Newman et al 2014).
September - December in the Pilbara
region (Stephenson
and Mant 1999).
Santos Ltd | Keraudren Seismic Survey EP Summary Page 76 of 248
Key fish species within North
Coast Bioregion
Adult Distribution spawning location and stock assessment Spawning times
Dianne J. Bray, Lutjanus sebae in Fishes of Australia, accessed 14 Jan 2019,
http://fishesofaustralia.net.au/home/species/567 Red emperor stocks occur across northern Australia and biological connectivity and homogeneity is maintained between the different stocks by dispersal of eggs and larvae throughout its range. This is further supported by Catch Per Unit Effort (CPUE) data presented in Gaughan et al 2018 which indicates that the depth range with the highest CPUE for red emperor is indicated as 50m – 60m, however is broadly the same across all depths (refer Figure 3-9). Figure 3-10 shows the spatial distribution based on catch effort data for 2001 (CAES) across north western Australia. The Pilbara and Kimberley stocks are considered separate for the purposes of fishery management (Newman et al 2014). Red emperor are broadcast multiple batch spawners that spawn throughout their range and release millions of eggs throughout their spawning periods. Known to spawn throughout the region.
Spanish mackerel (Scomberomorus commerson)
Spanish mackerel are distributed from near edge of continental shelf to shallow coastal waters, often of low salinity and high turbidity. They are also found in drop-offs, and shallow or gently sloping reef and lagoon water. Figure 3-10 shows the spatial distribution based on catch effort data for 2001 (CAES) across north western Australia. The Pilbara and Kimberley stocks are considered separate for the purposes of fishery management (Newman et al 2014). Mackerels are usually solitary hunters and often swim in shallow water along coastal slopes. They are known to undertake lengthy long-shore migrations, but permanent resident populations are thought to exist. They can also be found in small schools and feed primarily on small fishes such as anchovies, clupeids, carangids, also squids and penaeoid shrimps. Mackerel eggs and larvae are pelagic (Fishbase, Accessed 02/01/19)
Santos Ltd | Keraudren Seismic Survey EP Summary Page 77 of 248
Key fish species within North
Coast Bioregion
Adult Distribution spawning location and stock assessment Spawning times
Source: Dianne J. Bray & S. Schultz, Scomberomorus commerson in Fishes of
Australia, accessed 13 Jan 2019, http://fishesofaustralia.net.au/home/species/728
Mackerel species are not considered site attached due to excellent swimming ability and minimal reliance on reef structures for shelter. They preferred spawning habitat primarily includes hard rocky substrate and/ or shallow coastal waters. Mackerel eggs and larvae are pelagic. Adults ‘aggregate’ (form groups) to feed and ‘spawn’ (release sperm and eggs) in coastal areas.
Pearl oyster (Pinctada maxima)
In WA the silver-lip pearl oyster (P. maxima) lives in northern coastal waters. It has been recorded as far south as Shark Bay, but is not commercially fished south of North West Cape. It prefers areas of flat bottom with high water flow; adults can filter as much as one tonne (one cubic metre) of water per day. P.Maxima are mostly found in shallow waters (10-15m) and have been recorded at depths of 100m. Sperm and eggs are spawned into the water, where fertilisation occurs. Egg production by females is extremely high. The animals develop into a tiny planktonic veliger stage, where the larvae float in the water, allowing them to colonise new areas. Less than one per cent of fertilised eggs survive this stage. After 28 to 35 days the veliger settles to the bottom. If an appropriate area is found, it settles on it and metamorphoses into the juvenile stage (known as spat) – it starts growing a shell and becomes a sedentary bottom-dweller. If no suitable site is found, it will metamorphose and die. Spawning within the Eighty Mile Beach region is concentrated around broodstock that is located within 8 to 15m water depth, with potential for smaller contributions from the northeast (Condie et al 2016).
*Primary mid-October – December
Smaller secondary
February and March
(Rose et al.1990; Rose
and Baker 1994).
The following species have been included in this table based on DPIRD advice include their Guidance Statement on undertaking seismic surveys in Western Australian waters 2013 (refer Appendix 2 of the Guidance Statement).
Pink snapper (Pagrus auratus)
Rare to be found in this bioregion. In Western Australia, they are found in warm temperate to sub-tropical waters from north of Karratha southwards to the Great Australian Bight. Pink snapper typically live in waters 20-250 m deep. They are demersal (bottom-dwelling) but also spend some of their lives in the mid to upper water levels.
Santos Ltd | Keraudren Seismic Survey EP Summary Page 78 of 248
Key fish species within North
Coast Bioregion
Adult Distribution spawning location and stock assessment Spawning times
Bray, D.J. 2017, Chrysophrys auratus in Fishes of Australia, accessed 13 Jan
2019, http://fishesofaustralia.net.au/home/species/678 Adults live around reefs but also over muddy and sandy bottoms along the continental shelf and in more protected waters when spawning. Juveniles are common in bays, inlets and estuaries, which provide important nursery areas. Pink Snapper are pelagic spawners, with neutrally buoyant eggs.
Sandbar shark (Carcharhinus plumbeus)
Inhabits coastal waters, including shallow estuaries with sandy or muddy bottoms, bays, estuaries and harbours. It also occurs around offshore, around islands, banks and reef flats in depths to 280 m. Juveniles are usually found in warm temperate offshore waters. (Fishes of Australia, accessed 02/01/19). This stock exhibits a considerable degree of segregation between juvenile sharks, which are prevalent in deeper continental-shelf waters south of 26°S latitude and adults, which are more abundant in more northerly waters. Small numbers of neonates have been observed as far north as Broome, parturition apparently occurs throughout the species Western Australian range. To support the above conclusions adults must migrate into temperate waters to give birth.
October – January
(DoF 2013)
Australian Blacktip shark (Carcharhinus tilstoni) Common Blacktip shark (C.limbatus)
Inshore to offshore, pelagic. This species has been reported from the intertidal zone to a depth of 150 m (490 ft); larger sharks tend to occur in deeper water. Though it occupies the entire water column, it is most common close to the surface or in midwater. Common blacktip sharks inhabit inshore waters, making them highly vulnerable to capture in commercial and recreational fisheries.
Santos Ltd | Keraudren Seismic Survey EP Summary Page 79 of 248
Key fish species within North
Coast Bioregion
Adult Distribution spawning location and stock assessment Spawning times
Source: Dianne J. Bray, Carcharhinus tilstoni in Fishes of Australia, accessed 09 Jan 2019, http://fishesofaustralia.net.au/home/species/1957 There is uncertainty in the species composition and magnitude of historical catches of Blacktip Sharks from Western Australia, these species have not been harvested in this jurisdiction since April 2009, allowing the biomass to increase (Status of Australian Fishstocks, accessed 02/01/2018).
* Information provided on DPIRD website (DPIRD 2018), not obtained through consultation.
1 ‘Pers comms’ based on feedback from WAFIC and fishers in consultation.
3.5.2 Other Socio-economic Receptors
Other socio-economic considerations, such as shipping (Figure 3-11), recreational fishing, oil and gas industry, tourism, and cultural heritage, submarine cables and defence activities, in relation to the operational area and EMBA are summarised in Table 3-9.
Santos Ltd | Keraudren Seismic Survey EP Summary Page 80 of 248
Table 3-9: Socio-economic receptors within the EMBA
Value/Sensitivity Description Operational area Presence
Relevant events within the
operational area
Relevant events within the EMBA
Shipping The operational area overlaps two designated shipping routes (Figure 3-11) with two north-south oriented lanes servicing Port Hedland. Commercial shipping using NWS waters includes iron ore carriers, oil and LNG tankers and other vessels proceeding to or from the ports of Dampier, Port Walcott, Port Hedland, Barrow and Varanus islands, and Onslow. Large cargo vessels carrying freight bound or departing from Fremantle also transit along the WA coastline heading north and south in deeper waters.
Planned Interaction with marine users Spill response operations
Planned Spill response operations Unplanned Marine gas oil released from a vessel collision within the operational area
Recreational and charter boat fishing
In consultation (Table 4-2) it has been confirmed no charter boats operate out of Port Hedland. In consultation with Recfishwest (Table 4-2) it was identified recreational fishing often occurs around the Port Hedland port marker buoys. In consultation with the Port Hedland Game Fishing Club and Port Hedland Volunteer Marine Rescue (Table 4-2) it was identified recreational fishing activity may occur 50 nautical miles offshore, with some locals targeting game fish up to the 50 m water depth and the area surrounding Bedout Island. Therefore no interaction with recreational fishers is anticipated in the operational area, but may occur in EMBA. Within the North Coast bioregion recreational fishing is experiencing growth, with a distinct seasonal peak in winter when the local population increases significantly. Increased recreational fishing has also been attributed to those involved in the construction or operation of developments within the region.
x None Planned Spill response operations Noise emissions Unplanned Marine gas oil released from a vessel collision within the operational area
Indigenous, subsistence or customary fishing
Indigenous marine users or customary fishing could occur in the operational area. However, no interactions with traditional fishers has been recorded during previous activities conducted by Quadrant in the operational area. Consultation indicates customary fishing activities are highly unlikely in the operational area (Table 4-2).
x None None
Oil and gas infrastructure
The area of the NWS is a major oil and gas hub in Australia, with several companies operating on the NWS. The Activity occurs in a particularly isolated area of the NWS
x None None
Santos Ltd | Keraudren Seismic Survey EP Summary Page 81 of 248
Value/Sensitivity Description Operational area Presence
Relevant events within the
operational area
Relevant events within the EMBA
with respect to the main oil and gas operational and exploratory fields. There are currently no existing facilities in the operational area. The nearest operating facility is Woodside’s Angel oil field and associated infrastructure, located 191 km from the operational area respectively.
Tourism Santos WA has been advised in consultation (Table 4-2) that there is no offshore tourism industry that operates from Port Hedland, unlike other North West towns like Exmouth and Broome. A low level of recreational diving may occur in the waters surrounding Bedout Island.
x None Planned Spill response operations Noise emissions Unplanned Marine gas oil released from a vessel collision within the operational area
Cultural heritage No Registered Aboriginal Sites or Native Title Claims exist within the EMBA. One other Heritage Place exists within the EMBA, Bedout Island. Bedout Island is located 96 km north-east of Port Headland and is situated 16 km south of the operational area and within the EMBA. The Island is a nature reserve and an Important Bird Area (IBA) as classified by BirdLife International (2018), supporting significant breeding colonies of seabirds. Two historic shipwrecks (older than 75 years) are located within the EMBA:
• Leighton (1920). • Edith (1907).
x None None
Defence No designated defence areas overlap the operational area or EMBA. These areas comprise RAAF training areas located 201 km (Curtin RAAF Training Area) and 334 km (Learmonth RAAF Training Area) from the operational area. Although the defence areas do not overlap the EMBA, hydrocarbons may accumulate on shorelines within the Curtin RAAF Base and therefore spill response activities may
x None Planned Spill response operations Noise emissions Unplanned
Santos Ltd | Keraudren Seismic Survey EP Summary Page 82 of 248
Value/Sensitivity Description Operational area Presence
Relevant events within the
operational area
Relevant events within the EMBA
occur within the area. Consultation with the Department of Defence was undertaken and no concerns were raised (Table 4-2).
Marine gas oil released from a vessel collision within the operational area
Communications Two optical submarine telecommunication cables traverse the operational area, including the full power and ramp up zones, the JASURAUS system that connects Port Hedland to Jakarta, and the North West Cable System (NWCS) which connects offshore O&G facilities in the Browse, Bonaparte and Carnarvon Basins to onshore locations.
Planned Noise emissions
Planned Noise emissions
Santos Ltd | Keraudren Seismic Survey EP Summary Page 83 of 248
Figure 3-11: AMSA ship locations and shipping routes within and in close proximity to the EMBA
Santos Ltd | Keraudren Seismic Survey EP Summary Page 84 of 248
3.6 Periods of Peak Sensitivity or Activity Timing of peak sensitivity or activity for threatened species and other relevant, significant sensitivities is provided in Table 3-10.
Santos Ltd | Keraudren Seismic Survey EP Summary Page 85 of 248
Table 3-10: Periods of peak sensitivity or activity windows of sensitivity for the region that includes the EMBA
Categories Receptors (critical life cycle stages) JAN FEB MAR APR MAY JUN JUL AUG SEP OCT NOV DEC
Activity timing
Physical environment and habitats
Coral (spawning periods)
Macroalgae Growing Shedding fronds Growing
Other benthic habitats
All shoreline habitats
Protected / significant areas
Protected Areas
Commercial fish species
Goldband snapper peak spawning
Pink snapper peak spawning (Rare within North Coast Bioregion and overlap with this survey)
Rankin cod peak spawning
Red emperor peak spawning
Spanish mackerel peak spawning
Pearl oyster spawning
Dusky whaler pupping6 May occur throughout year
Whiskery shark pupping7
Blacktip shark pupping Peak pupping periods unknown
Sandbar shark pupping Peak pupping periods unknown
Gummy shark pupping Peak pupping periods unknown
Fish – other species Timing of spawning activity varies between species
Threatened and migratory Marine Fauna
Sharks
Whale shark – level of activity for the EMBA, not region
Aggregations at Ningaloo Coast Post-aggregation foraging and
migration
Santos Ltd | Keraudren Seismic Survey EP Summary Page 86 of 248
Categories Receptors (critical life cycle stages) JAN FEB MAR APR MAY JUN JUL AUG SEP OCT NOV DEC
Activity timing
Marine Mammals
Humpback whale (migration at Port Hedland - Broome)5
Pygmy blue whale migration
Northern
Southern
Marine Reptiles
Hawksbill turtles resident adult and juveniles1
Widespread throughout NW Shelf waters, highest density of adults and juveniles over hard bottom habitat (coral reef, rocky reef, pipelines etc.)
Hawksbill turtle (mating aggregations1)
Hawksbill turtle (nesting and internesting1)
Hawksbill turtle (hatching1)
Flatback turtles (resident adult and juveniles1)
Widespread throughout NW Shelf waters, increased density over soft bottom habitat 10 – 60m deep, post hatchling age classes and juveniles spread across shelf waters
Flatback turtle (mating aggregations1)
Flatback turtle (nesting and internesting1)
Flatback turtle (hatching1)
Flatback turtle (nesting1)
Green turtles (resident adult and juveniles1) Widespread throughout the NW Shelf waters, highest density associated with seagrass beds and macro algae communities, high density juveniles in shallow waters off beaches, amongst mangroves and in creeks
Green turtle (mating aggregations1)
Green turtle nesting and internesting1)
Green turtle (hatching1)
Loggerhead turtles (resident adult and juveniles1)
Widespread throughout the NW Shelf waters, increased density associated with soft bottom habitat supporting their bivalve food source, juveniles associated with nearshore reef habitat
Loggerhead turtle (mating aggregations1)
Santos Ltd | Keraudren Seismic Survey EP Summary Page 87 of 248
Categories Receptors (critical life cycle stages) JAN FEB MAR APR MAY JUN JUL AUG SEP OCT NOV DEC
Activity timing
Loggerhead turtle (nesting and internesting1)
Loggerhead turtle (hatching1)
Leatherback turtles
Seabirds
Lesser frigatebird breeding
Brown booby breeding
Tern breeding
Conservation Dependent Fauna
Southern Bluefin Tuna
Scalloped Hammerhead Shark (East Coast)
Socioeconomic receptors
Commonwealth Managed Fisheries
North West Slope Trawl Fishery
State Managed Fisheries
Pearl Oyster Managed Fishery
Mackerel Managed Fishery4
All other fisheries (including Pilbara Demersal Fisheries)
Oil and gas
Shipping
Tourism/recreational4
Communications NWCS and JASUARUS cable presence
Peak activity, presence reliable and predictable 1 Information provided by K. Pendoley
Santos Ltd | Keraudren Seismic Survey EP Summary Page 88 of 248
Categories Receptors (critical life cycle stages) JAN FEB MAR APR MAY JUN JUL AUG SEP OCT NOV DEC
Activity timing
Lower level of abundance/activity/presence 2 No activity in NW Marine Region
Activity not occurring 3 No recent activity in Australia
Activity can occur throughout year 5 Location and Estimated Period of Humpback Whale Activity in WA (DMP, 2003)
6 Last, P.R.; Stevens, J.D. (2009). Sharks and Rays of Australia (second ed.). Harvard University Press. pp. 269–270.
7 Simpfendorfer, C. & Unsworth P. (1998) Reproductive biology of the whiskery shark, Furgaleus macki, off south-western Australia. Marine and Freshwater Research 49(7) 687 - 793
Santos Ltd | Keraudren Seismic Survey EP Summary Page 89 of 248
4. Stakeholder Consultation
Santos WA understands retaining a broad licence to operate depends on the development and maintenance of positive and constructive relationships with a comprehensive set of stakeholders in the community, Government, non-government and other business sectors.
Santos WA began the stakeholder identification process with a review of Santos WA’s stakeholder database, including stakeholders consulted for other recent activities in the area. The list of stakeholders was then refined based on the operational area and the nature of the seismic survey activity. Currently identified relevant stakeholders for this activity are listed in Table 4-1.
More specifically, stakeholders were identified through the following mechanisms:
• Regular review of all legislation applicable to petroleum and marine activities.
• Identification of marine user groups and interest groups active in the area (e.g., recreational and commercial fisheries, other oil and gas producers, merchant shipping, etc.).
• The Department of Primary Industries and Regional Development (DPIRD) Fish Cube data was obtained for the last three to five full calendar years, identifying commercial fishing activity in the operational area. Fishing licence holder contact details, from these identified fisheries, were obtained from DPIRD as needed in September 2018.
• Discussions with relevant stakeholders to identify other potentially impacted persons and the level of information required to engage them.
• Active participation in industry bodies (e.g. APPEA and AMOSC).
• Records from previous consultation activities in the area, including previous Bedout Basin drilling activities.
For this activity, Santos WA prioritised stakeholders based on their level of interest or impact of the activity and sought to engage stakeholders based on their level of priority, either by phone, face-to-face, email or via post. Stakeholders were provided information on the activity tailored to their level of interest or impact. Such information included different maps, additional information in covering emails such as distances to key areas and (for some stakeholders) draft sections of the EP.
The consultation material was made available prior to the EP being submitted to NOPSEMA and well in advance of activity commencement to allow for an informed assessment by stakeholders of the potential impact of Santos WA’s activities. Stakeholder feedback was used in the development of the EP, particularly when developing the Environment Description (summarised in Section 3) and the Environmental Assessment for Planned Events Section (summarised in Section 5.3).
4.1 Summary Stakeholders were informed of activities covered in this EP via several engagement channels commencing in September 2018. A Keraudren Seismic Survey Consultation Package was developed based on early advice received by stakeholder and distributed to identified stakeholders throughout October 2018. The package was also made publicly available on Quadrant’s website from October 19 2018. Quadrant has been active in the Bedout Basin since exploration drilling activities commenced in 2014 and has drilled six wells in permits WA-435-P and WA-437-P, including the Phoenix South-3 and Dorado-1 wells in 2018, with a combined duration of 7.5 months. Santos WA considers that consultation with regulators and
Santos Ltd | Keraudren Seismic Survey EP Summary Page 90 of 248
key stakeholders has been adequate (refer to Table 4-2). Notwithstanding, Santos WA has identified the need for additional stakeholder consultation to ensure the effective implementation of identified control measures, as detailed in Section 4.2. Santos WA considered comments and issues raised by stakeholders within the EP, primarily in Section 5.3.1 and Section 5.3.3. Control measures were developed as a result of consultation.
Santos Ltd | Keraudren Seismic Survey EP Summary Page 91 of 248
Table 4-1: Identified stakeholders for Keraudren Seismic Survey
Group Stakeholder
Shipping safety, security and communications
• Australian Hydrographic Office (AHO) • Australian Maritime Safety Authority (AMSA) • Department of Defence (DoD) • Department of Transport (DoT) • Telstra • Vocus Communications
Commonwealth government departments
• Australian Fisheries Management Authority (AFMA) • Department of Agriculture and Water Resources – Biosecurity • Department of Agriculture and Water Resources – Fisheries • Department of Industry, Innovation and Science (DIIS) • Director of National Parks (DoNP)
State government departments
• Department of Primary Industries and Regional Development (DPIRD) • Department of Biodiversity, Conservation and Attractions (DBCA) • Department of Mines, Industry Regulation and Safety (DMIRS)
Neighbouring operators / exploration companies
• 3D Oil • Carnarvon Petroleum • Inpex • Pathfinder Energy • Finder Exploration • PGS
Fishing bodies • Commonwealth Fisheries Association (CFA) • Marine Tourism WA • Pearl Producers Association • Recfishwest • Western Australian Fishing Industry Council (WAFIC)
Community/Port Hedland Stakeholder Reference Group
• Town of Port Hedland • Pilbara Port Authority • Port Hedland Chamber of Commerce and Industry (PH CCI) • Port Hedland Game Fishing Club • Port Hedland Volunteer Marine Rescue • Port Hedland Yacht Club • BHP Corporate Affairs Port Hedland • Care for Hedland • De Grey Station • Pardoo Station • Shire of East Pilbara • 80 Mile Beach Caravan Park • WA Department of Aboriginal Affairs (Hedland) • GT Diving
Commercial fishers (identified based on DPIRD Fish Cube data and in consultation with WAFIC)
Santos Ltd | Keraudren Seismic Survey EP Summary Page 92 of 248
Table 4-2: Consultation summary for activity
Stakeholder Relevance / reasoning for engagement
Summary of stakeholder and titleholder correspondence, and any objections and claims made Assessment of stakeholder objections and claims
Shipping safety, security and communications
AHO The AHO is the part of the Commonwealth DoD responsible for maintaining and disseminating nautical charts, including the distribution of Notice to Mariners.
The AHO were provided the Keraudren Seismic Survey Consultation Package Revision 0 via email on October 3 2018, and responded via email on October 4 2018.
Objection or claim: No objection. No claim.
Request notification once activity commences.
AHO does not object to the Keraudren Seismic Survey and have made no claim.
Santos WA accepts the AHO’s request for notification prior to survey commencement. Santos WA commits to providing notification to the AHO.
Santos WA considers the level of consultation for this EP to be adequate.
AMSA AMSA is the statutory and control agency for vessel emergencies in Commonwealth Waters.
Santos WA has a signed MOU with AMSA as outlined in Table 4.3.
AMSA were provided the Keraudren Seismic Survey Consultation Package Revision 0 via email, along with maps indicating the survey and operational area against recent shipping data and shipping routes, on October 3 2018.
In the covering email AMSA were advised of planned management measures for navigational safety and to avoid interaction with other marine users.
AMSA responded to consultation on October 4 2018, with no comment on the activity, and requesting notifications to AMSA’s Rescue Coordination Centre (RCC) and for notice to mariners.
Objection or claim: No objection. No claim.
Request AMSA RCC notification and AHO notification prior to activity commencement.
AMSA does not object to the Keraudren Seismic Survey and have made no claim.
Santos WA accepts AMSA’s request to providing notification to the AMSA’s RCC.
Santos WA considers the level of consultation to be adequate.
DoD The Commonwealth DoD as an Australian Government Agency
The DoD were provided the Keraudren Seismic Survey Consultation Package Revision 0 via email on October 3 2018. The DoD responded via email on October 22 2018, advising no objection to proposed activities
DoD does not object to the Keraudren Seismic Survey and have made no claim.
Santos Ltd | Keraudren Seismic Survey EP Summary Page 93 of 248
Stakeholder Relevance / reasoning for engagement
Summary of stakeholder and titleholder correspondence, and any objections and claims made Assessment of stakeholder objections and claims
are identified as a relevant person under the OPGGS(E) Regulations 2009.
and requesting the AHO branch be provided notification three weeks prior to commencement.
Objection or claim: No objection. No claim.
Request AHO notification three weeks prior to activity commencement.
Santos WA accepts the DoD’s request to provide notification to the AHO.
Santos WA has reviewed key areas of interest for the DoD in Table 3-9.
Santos WA considers the level of consultation to be adequate.
DoT The West Australian DoT is the control agency for marine pollution emergencies in State waters.
The DoT were provided the Keraudren Seismic Survey Consultation Package Revision 0 via email on October 3 2018. In following emails between October 18 and 22 2018, Santos WA committed to providing the DoT the activity OPEP and details as per the DoT’s Offshore Petroleum Industry Guidance Note – Marine Oil Pollution: Response and Consultation Arrangements (Sep 2018).
Santos WA provided the activity OPEP with a summary document to DoT, via email on November 12 2018, DoT acknowledged receipt of document via email on November 22 2018.
The DoT responded with minor comments on the OPEP on December 17 2018, as follows:
Update referenced version of DoT Offshore Petroleum Industry Guidance Note – Marine Oil Pollution: Response and Consultation Arrangements (IGN) document
Update OPEP noting the Petroleum Titleholder nominated CMT Liaison Officer and the Deputy Incident Controller attend the Marine House ICC as soon as possible after the formal request has been made by the SMPC.
Santos WA updated the Keraudren Marine Seismic Survey OPEP as advised by DoT.
In an email response on December 17 2018, Santos WA advised DoT changes had been made, and upon approval by the offshore regulator the final OPEP would be provided to DoT.
At a company level, Santos WA commits to ongoing consultation with the DoT regarding their role as State marine pollution coordinator as per the DoT‘s Offshore Petroleum Industry Guidance Note – Marine Oil Pollution: Response and Consultation Arrangements (Sep 2018).
DoT have reviewed the Keraudren Marine Seismic Survey OPEP and provided minor comments, which Santos WA have included within Revision 1 of this OPEP. Santos WA commits to providing the DoT the final approved OPEP prior to activity commencement.
Santos WA considers consultation with the DoT is complete.
Santos Ltd | Keraudren Seismic Survey EP Summary Page 94 of 248
Stakeholder Relevance / reasoning for engagement
Summary of stakeholder and titleholder correspondence, and any objections and claims made Assessment of stakeholder objections and claims
DoT responded via email on December 21 2018, accepting this approach.
Telstra Telstra operate the Jasuarus Cable, a telecommunications table connecting Port Hedland to Jakarta. Santos WA understands this cable was decommissioned in 2012 and is no longer used, though remains in situ.
A preliminary email was sent to Telstra on November 13 2018, advising of the proposed seismic survey and providing details and a map showing intersection with the Jasausrus Cable. Santos WA advised engagement would occur as per the International Cable Protection Committee Recommendation No.8, Procedure to be following whilst offshore seismic work is undertaken in the vicinity of active submarine cable systems.
In phone consultation on November 28 2018, a Telstra representative advised there are no objections to this activity.
Telstra followed up by email on December 16 2018, advising no objection to the proposed seismic survey and updating relevant contact details. Santos WA thanked Telstra for their response.
Objection or claim: No objection. No claim.
Telstra does not object to the Keraudren Seismic Survey and have made no claim.
Consultation is complete for this EP.
Vocus Communications
Vocus Communications is the operator of the North West Cable System (NWCS) forms a key component to one of Australia’s largest nationwide fibre optic networks, originally developed by Nextgen Group to provide ultra-speed data networking to the northern and western regions of Australia.
A preliminary email was sent to Vocus Communications on November 13 2018, to request appropriate contact details to provide information as per the International Cable Protection Committee Recommendation No.8, Procedure to be following whilst offshore seismic work is undertaken in the vicinity of active submarine cable systems.
In initial follow up consultation on November 20 2018, Vocus Communication advised this activity was unlikely to be of concern. Santos WA and Vocus Communications both committed to ongoing consultation in the lead up to activity commencement outside the EP process.
Objection or claim: No objection. No claim.
Vocus Communications does not object to the Keraudren Seismic Survey and have made no claim.
As outlined in ICPC Recommendation No. 8, Santos WA must demonstrate the pressure waves of the survey are below 2.0 bar. Santos WA can demonstrate this, therefore, no adverse impacts to the NWCS will result from the Keraudren Seismic Survey.
Santos WA considers the level of consultation to be adequate.
Santos Ltd | Keraudren Seismic Survey EP Summary Page 95 of 248
Stakeholder Relevance / reasoning for engagement
Summary of stakeholder and titleholder correspondence, and any objections and claims made Assessment of stakeholder objections and claims
Commonwealth Government departments
AFMA AFMA is responsible for managing Commonwealth Fisheries and as an Australian Government Agency are identified as a relevant person under the OPGGS(E) Regulations 2009.
AFMA were engaged via phone on October 3 2018, where Santos WA introduced the proposed seismic survey and advised it would intersect the Western Tuna and Billfish Commonwealth Fishery. Santos WA’s understanding is Commonwealth tuna fisheries have not been active in the region for a number of years, AFMA confirmed this is true and referred Santos WA to the ABARES Fishery Status Report 2018.
Santos WA provided the Keraudren Seismic Survey Consultation Package Revision 0 via email as a follow up on October 3 2018.
AFMA were followed up via email on November 9 2018, to confirm if AFMA had any further comment on the activity prior to planned submission of the EP to NOPSEMA.
No further comment has been provided.
Objection or claim: No objection. No claim.
AFMA request Santos WA consider the ABARES Fishery Status Report 2018 in the development of this EP.
AFMA does not object to the Keraudren Seismic Survey and have made no claim.
Santos WA has considered the ABARES Fishery Status Report 2018, which is addressed by Santos WA in Table 3-7. This report indicates no fishing effort from Commonwealth fisheries over the Keraudren Seismic Survey area in recent years.
Santos WA considers the level of consultation to be adequate.
One key individual fisher from the Western Tuna and Billfish Commonwealth Fishery, Ocean Wild, has been provided consultation material (outlined below) and provided no response.
Department of Agriculture and Water Resources – Biosecurity
As an Australian Government Agency the DAWR are identified as a relevant person under the OPGGS(E) Regulations 2009.
The Department were provided the Keraudren Seismic Survey Consultation Package Revision 0 via email on October 3 2018.
No response has been received by the Department.
No response has been received by the Department.
Santos WA has engaged with relevant fishers and representative bodies.
Santos WA has addressed biosecurity for this activity in Section 5.4.6 based on previous offshore activities.
Santos WA considers the level of consultation with the Department to be adequate.
Department of Agriculture and Water
As an Australian Government Agency the DAWR are
The Department were provided the Keraudren Seismic Survey Consultation Package Revision 0 via email on October 3 2018.
The Department does not object to the Keraudren Seismic Survey and have made no claim.
Santos Ltd | Keraudren Seismic Survey EP Summary Page 96 of 248
Stakeholder Relevance / reasoning for engagement
Summary of stakeholder and titleholder correspondence, and any objections and claims made Assessment of stakeholder objections and claims
Resources – Fisheries
identified as a relevant person under the OPGGS(E) Regulations 2009.
The Department responded via email on October 26 2018, noting the activity would be assessed by NOPSEMA, and recommending Santos WA engage with AFMA, relevant fishing bodies and stakeholders on the activity. Santos WA responded via email with thanks and advising consultation was being undertaken with relevant fishers and representative bodies.
Objection or claim: No objection. No claim.
Consultation to be undertaken with AFMA, relevant fishing bodies and stakeholders on the activity.
Santos WA accepts the Department’s request and has engaged with relevant fishers and representative bodies as requested, and evidenced within this EP.
Santos WA considers consultation with the Department to be complete.
Department of Industry, Innovation and Science
The DIIS is a department of the Australian Government responsible for consolidating the Government’s efforts to drive economic growth, productivity and competitiveness by bringing together industry, energy, resources and science.
A DIIS representative was contacted by phone on October 15 2018, to introduce the proposed activity.
The Keraudren Seismic Survey Consultation Package Revision 2 was provided via email on October 15 2018, and DIIS responded via email with thanks on October 15 2018.
Objection or claim: No objection. No claim.
DIIS does not object to the Keraudren Seismic Survey and have made no claim.
DIIS was engaged on this activity for information only, the activity will be assessed by NOPSEMA as the offshore regulator.
Santos WA considers the level of consultation to be adequate.
Director of National Parks
As an Australian Government Agency the DoNP are identified as a relevant person under the OPGGS(E) Regulations 2009.
The DoNP were provided the Keraudren Seismic Survey Consultation Package Revision 2 via email on October 23 2018.
The DoNP responded via email on December 12 2018, providing standard advice which Santos WA have included in the Keraudren Seismic Survey OPEP.
While this activity does not intersect any Marine Parks, Santos WA understands this activity may be of interest to the DoNP given its location adjacent to the Eighty Mile Beach Australian Marine Park.
Santos WA has included the contact details for the Director of National Parks in the Keraudren Seismic Survey OPEP as requested.
Santos Ltd | Keraudren Seismic Survey EP Summary Page 97 of 248
Stakeholder Relevance / reasoning for engagement
Summary of stakeholder and titleholder correspondence, and any objections and claims made Assessment of stakeholder objections and claims
Santos WA considers the level of consultation to be adequate.
State Government Departments
DMIRS Consultation conducted as per the Department of Mines and Petroleum Consultation Guidance Note (now DMIRS), and as an adjacent regulator for activities in West Australian State waters.
DMIRS were provided the Keraudren Seismic Survey Consultation Package Revision 0 via email on October 3 2018, and responded via email on October 10 2018, with queries on the proposal.
In phone consultation on October 11 2018, DMIRS advised this activity falls outside DMIRS jurisdiction. Regardless, the Minister requests to be informed of activities of this nature.
Santos WA provided DMIRS additional details on the proposed survey, including a high-level summary of noise modelling, via email on December 17 2018. DMIRS responded via email on December 19 2018, advising no further information is required at this stage and requesting a commencement notification. No specific timeframe for this notification was requested.
Objection or claim: No objection. No claim.
DMIRS does not object to the Keraudren Seismic Survey and have made no claim. This activity falls outside of DMIRS jurisdiction.
As per Regulation 30(1) of the OPGGS(E)R and the Department of Mines and Petroleum Consultation Guidance Note, Santos WA commits to providing commencement and cessation notifications to DMIRS.
Santos WA considers the level of consultation to be adequate.
DPIRD DPIRD is responsible for managed West Australian State fisheries.
DPIRD Fish Cube data was requested in September 2018 to identify relevant commercial fishing stakeholders. DPIRD fishing licences holder data was
DPIRD were first contacted on September 18 2018, to obtain Fish Cube data relevant to the indicative operational area of the activity.
Santos WA provided the Keraudren Seismic Survey Consultation Package Revision 0 via email on October 3 2018, and met with DPIRD on October 10 2018, to discuss Fish Cube Data, key spawning periods and the proposed activity.
DPIRD was formally invited to Santos WA’s noise modelling workshop on October 24 2018, but was unable to attend. DPIRD requested information on the dual source method, and a noise modelling summary, when available.
DPIRD was provided the Keraudren Seismic Noise Modelling Summary and Assessment of Impact document via email on November 15 2018,
To address DPIRD comments on this activity received on 30 November 2018, Santos WA has updated or revised the following items within this EP:
Santos WA responded to DPIRD via email on December 6 2018, clarifying the noise modelling of dual source methods and advising DPIRD the dual source method would only be applied to the Development Area.
Santos WA has addressed the impacts to commercial fishing in Section 5.3.1 and Section 5.3.3.
Santos Ltd | Keraudren Seismic Survey EP Summary Page 98 of 248
Stakeholder Relevance / reasoning for engagement
Summary of stakeholder and titleholder correspondence, and any objections and claims made Assessment of stakeholder objections and claims
purchased in September 2018 to update contact lists for relevant fishing licence holders.
and the full JASCO Noise Modelling report for reference. In follow up phone consultation on November 16 2018, DPIRD confirmed this information was informative and addressed their current queries.
DPIRD provided formal response to Santos WA on November 30 2018, where a number of statements and concerns were raised based on the information provided.
Santos WA responded to these concerns and claims via email on December 6 2018.
DPIRD responded acknowledging email was received via email on December 11 2018.
DPIRD followed up on December 13 2018, advising while the Nickol Bay Prawn Fishery was open in the area, no fishing effort in the area has been recorded for the past five years. Santos WA replied with thanks, noting the correlated to FishCube data and was noted in the EP.
Objection or claim:
DPIRD claim concern with the use of two seismic sources at 3480 cubic inches each.
DPIRD claim concern regarding assessing Pilbara line, trap and trawl fisheries as combined fisheries.
DPIRD claim concern with the potential impact to the PFTIMF Area 4 and 5 as this is an effort controlled fishery, and effort allocation is not transferrable to other areas.
DPIRD claim concern with the impact to Area 4 and Area 5 of the PFTIMF, noting demersal fish do not move around as much as adults.
DPIRD claim this survey represents a risk to fish stocks which has not been defined in consultation material provided.
Santos WA will not restrict commercial fishing access to the Operational Area, including PFTIMF Area 4 and 5 (refer to Section 5.3.1), and is committed to concurrent operational planning with commercial fishers.
Santos WA has assessed impacts to fish in Section 5.3.3.
Details on fish spawning are provided in Section 3.5.1.
Details on activity timing are provide in Section 1.2. Survey timing depends on a number of factors, specifically business objectives (2019 survey data requirement), regulatory approval time frames (not expected before March 2019) and whale migration periods (no survey after July 2019). There is no known period during which fishing spawning does not occur. Hence, Santos WA would not be able to avoid commercial fishing or fish spawning activity.
Santos WA considers the level of consultation to be adequate.
Santos Ltd | Keraudren Seismic Survey EP Summary Page 99 of 248
Stakeholder Relevance / reasoning for engagement
Summary of stakeholder and titleholder correspondence, and any objections and claims made Assessment of stakeholder objections and claims
DPIRD request Santos WA develop strategies to minimise impacts to fish spawning.
Santos WA had continuing correspondence with DPIRD through December 2018 and January 2019 regarding obtaining fishing catch and effort data for the PFTIMF.
Santos has identified data from DPIRD containing indicative fishing effort/catch, see Figure 3-9 and Figure 3-10.
Santos notes PFTIMF catch and effort data may be relevant for future commercial claims, therefore will continue to engage with individual fishers and DPIRD to obtain this data.
Santos WA met with DPIRD fisheries’ scientist on 26 February 2019. The objectives of the meeting were to:
• Validate sources of data used for fish impact assessment • Update DPIRD on revised impact assessment, and assumptions
Santos WA provided the proposed response to the RFFWI to DPIRD fisheries’ scientist on 7/03/19 for review prior to submission to NOPSEMA. Minor edits and clarifications were provided and incorporated into the RFFWI response.
The objectives of the meeting were met.
DPIRD fisheries’ scientist did provide additional information regarding goldband snapper and did not suggest any additional data sources that may be relevant to the fish impact assessment.
For the impact assessment the following was confirmed:
•the approach to impact assessment i.e. impact to fish populations and species separate to impact to fishery is appropriate.
•Presentation of the areas impacted per fishery management area (based on 2013-2017 fish cube data representing fishery effort) are appropriate given that is how the fishery is managed.
•Inclusion of Areas 3 and 6 (not fished) as part of the fish “resource” is appropriate.
Santos Ltd | Keraudren Seismic Survey EP Summary Page 100 of 248
Stakeholder Relevance / reasoning for engagement
Summary of stakeholder and titleholder correspondence, and any objections and claims made Assessment of stakeholder objections and claims
Dr S.Newman provided additional information for goldband snapper (specifically habitat, biology, spawning and stock structure).
Dr S.Newman agreed that the information he provided during the meeting could be used by Santos WA to clarify questions raised by NOPSEMA in RFFWI, provided edits and further clarification to the meeting minutes.
Dr S.Newman’s feedback on the RFFWI response regarding goldband snapper was minor, and Santos WA have incorporated his comments.
DBCA DBCA is a relevant State agency responsible for the management of State marine parks and reserves.
Santos WA provided the Keraudren Seismic Survey Consultation Package Revision 0 via email on October 3 2018.
DBCA was contacted by phone on October 4 2018, and was provided details regarding the proposed seismic survey. DBCA advised there would be no comment from the Department on the proposal as the activity would be assessed by NOPSEMA. The Department requested the consultation package with map and distances to State Marine Parks. As a follow up, an email was sent on October 4 with an additional map and key distances as requested. DBCA responded via email on October 4 2018, noting no comment on the activity.
Objection or claim: No objection. No claim.
DBCA does not object to the Keraudren Seismic Survey and have made no claim.
Santos WA considers the level of consultation to be adequate.
Neighbouring operators / exploration companies
3D Oil 3D Oil is listed as the titleholder of an adjacent petroleum permit WA-527-P.
3D Oil was contacted by phone on October 25 2018, to introduce the Keraudren Seismic Survey and identify 3D Oil as the titleholder of an adjacent petroleum permit. Santos WA queried whether 3D Oil had seismic plans for 2019, 3D Oil confirmed seismic not currently proposed in 2019. Email correspondence on October 26 2018, confirmed this.
Objection or claim: No objection. No claim.
3D Oil does not object to the Keraudren Seismic Survey and have made no claim.
Santos WA considers the level of consultation to be adequate.
Santos Ltd | Keraudren Seismic Survey EP Summary Page 101 of 248
Stakeholder Relevance / reasoning for engagement
Summary of stakeholder and titleholder correspondence, and any objections and claims made Assessment of stakeholder objections and claims
Carnarvon Petroleum
Carnarvon Petroleum is listed as the titleholder of an adjacent petroleum permit WA-521-P.
Carnarvon Petroleum is Santos WA’s joint venture partner in Bedout Basin petroleum permits.
Carnarvon Petroleum was emailed the Keraudren Seismic Survey Consultation Package Revision 2 on November 2 2018.
Carnarvon confirmed they was aware of the activity as joint venture holder, and confirmed via email on November 7 2018, that Carnarvon has no plans for seismic in permit WA-521-P from March to August 2019.
Objection or claim: No objection. No claim.
Carnarvon Petroleum is kept informed of Santos WA’s proposed offshore activities as a joint venture partner.
Santos WA considers the level of consultation to be adequate.
Inpex Inpex is listed as the titleholder of a nearby petroleum permit WA-533-P.
Santos WA met with Inpex to discuss seismic on the North West Shelf. Santos WA and Inpex shared details of upcoming seismic activity, and Inpex was unlikely to have seismic planned for the window March - August 2019.
Objection or claim: No objection. No claim.
Inpex does not object to the Keraudren Seismic Survey and have made no claim.
At their closest point, Inpex’s permit WA-533-9 and Santos WA’s WA-436-P are approximately 120 km apart. Based on current information Inpex’s proposed seismic survey will not occur at the same time as Keraudren.
Santos WA considers the level of consultation to be adequate.
Pathfinder Energy
Pathfinder Energy is listed as the titleholder of nearby petroleum permits WA-487-P and WA-479-P.
Santos WA contacted Pathfinder Energy by phone on October 25 2018, and left a voice mail indicating an email would be sent outlining seismic in the Bedout Basin.
Santos WA emailed Pathfinder the Keraudren Seismic Survey Consultation Package Revision 2 on October 25 2018, querying if Pathfinder had any upcoming plans for seismic in WA-487-P.
In follow up phone correspondence on November 20 2018, Pathfinder confirmed they have an active seismic EP, Nightcap, over permit WA-487-P and WA-479-P, which expires at the end of 2018. Pathfinder note these permits are over 100 km from Santos WA permits.
Pathfinder does not object to the Keraudren Seismic Survey and have made no claim.
Pathfinder has non- confirmed exploration plans for permits WA-487-P and WA-479-P in 2019.
Santos WA considers the level of consultation to be adequate.
Santos Ltd | Keraudren Seismic Survey EP Summary Page 102 of 248
Stakeholder Relevance / reasoning for engagement
Summary of stakeholder and titleholder correspondence, and any objections and claims made Assessment of stakeholder objections and claims
Objection or claim: No objection. No claim.
Finder Exploration
Finder Exploration is listed as the titleholder of a nearby petroleum permit WA-468-P.
Finder Exploration was contacted by phone on October 25 2018, to introduce the Keraudren Seismic Survey and identify Finder as the titleholder of a nearby petroleum permit. Santos WA queried whether Finder had seismic plans for 2019. Santos WA followed this information up with an email on October 25 2018, including the Keraudren Seismic Survey Consultation Package Revision 2 and a map showing nearby permits.
Finder Exploration followed up with emails on November 12 2018, advising no seismic proposed for March – August 2019.
Objection or claim: No objection. No claim.
Finder does not object to the Keraudren Seismic Survey and have made no claim.
At their closest point Santos WA’s permit WA-437-P and Finder’s WA-468-P are over 50 km apart. Based on current information Finder’s seismic activities will not occur at the same time as Keraudren.
Santos WA considers the level of consultation to be adequate.
PGS As an offshore exploration company, this stakeholder was contacted to ascertain if they would be conducting any activities in nearby petroleum permits in 2019 given their active EP allowing seismic in the region.
In phone consultation on October 25 2018, PGS advised Santos WA there are plans to conduct seismic work under the Rollo EP. Permits expected to be surveyed are not directly adjacent to Santos WA’s planned survey area.
Objection or claim: No objection. No claim.
PGS does not object to the Keraudren Seismic Survey and have made no claim.
Santos WA considers the level of consultation to be adequate.
Fishing bodies
Commonwealth Fisheries Association (CFA)
The CFA was engaged as a representative body
CFA were contacted by phone on October 10 2018, and a voice mail was left outlining the proposal and providing return contact details.
No response from the CFA has been received.
Consultation with fishing industry bodies such as AFMA and WAFIC indicates no fishing effort from
Santos Ltd | Keraudren Seismic Survey EP Summary Page 103 of 248
Stakeholder Relevance / reasoning for engagement
Summary of stakeholder and titleholder correspondence, and any objections and claims made Assessment of stakeholder objections and claims
for Commonwealth fisheries.
As no Commonwealth fishing activity for the tuna industry has been identified in recent years, the level of interest from the CFA is expected to be low.
CFA was provided the Keraudren Seismic Survey Consultation Package Revision 1 via email on October 10 2018.
No response to consultation has been received.
Commonwealth fisheries over the Keraudren Seismic Survey area in recent years, this is supported by the ABARES Fishery Status Report 2018 and further addressed by Santos WA in Table 3-7. Given low intersection with Commonwealth fisheries for this operational area, Santos WA considers the level of consultation to be adequate.
Marine Tourism WA
Formerly the Charter Boat Association, the MTWA represents the charter sector in Western Australia.
MTWA were provided the Keraudren Seismic Survey Consultation Package Revision 0 via email on October 3 2018.
No response received.
Upon review of the MTWA website, members focus charters on areas such as the Kimberley, Exmouth, Dampier Archipelago and Carnarvon regions including the Abrolhos, Mackerel and Montebello Islands, or closer to Perth at Rottnest Island.
Santos WA has received feedback from the Port Hedland community, including the Port Hedland Game Fishing Club and Volunteer Marine Rescue, as well as Recfishwest, which further confirms there is no charter boat or tourism related industry in the region of the Keraudren Seismic Survey.
Based on this and other stakeholder feedback, Santos WA does not believe the charter boat industry will be impacted by the proposed Keraudren Seismic Survey.
Santos WA considers the level of consultation to be adequate.
Pearl Producers Association
The Pearl Producers Association has
The Pearl Producers Association CEO was contacted by phone on October 3 2018, and returned Santos WA’s call on October 4 2018. Santos WA
Santos WA has made a conscious effort to engage with the Pearl Producers Association early in the
Santos Ltd | Keraudren Seismic Survey EP Summary Page 104 of 248
Stakeholder Relevance / reasoning for engagement
Summary of stakeholder and titleholder correspondence, and any objections and claims made Assessment of stakeholder objections and claims
previously informed Santos WA the region nearby 80 Mile Beach is of high interest to the pearling industry.
Santos WA identified the Pearl Producers Association as a stakeholder for early engagement regarding the Keraudren Seismic Survey, based on this historic feedback.
introduced the proposal, acknowledging the Association’s interest in the area and proposing face-to-face meetings moving forward including potential pearl producers at an upcoming risk assessment workshop. The Pearl Producers Association advised, in phone consultation on October 4 2018, that the area deeper than 70 m was of no concern, however the shallower waters were of interest given the potential for pearl brood stock to exist at these depths. Santos WA offered to send a consultation package and updated map showing the 70 m water depth contour, the Pearl Producers Association CEO agreed and would distribute the consultation material to their own stakeholders.
Following the phone engagement Santos WA provided the Association CEO the Keraudren Consultation Package Revision 0, on October 4 2018. Santos WA also provided an additional map that showed the 70 m water depth contour.
Santos WA phoned the Pearl Producers Association CEO on October 11 2018, and left a voice mail extending an invitation to a noise modelling workshop and providing return contact details. Santos WA followed this voice mail with an email on October 16 2018, with an invitation to the noise modelling workshop or time with noise modellers at a more convenient date if necessary.
Phone message left for the Pearl Producers CEO with reception on October 23 2018, with return contact details to discuss ongoing engagement for proposed seismic activity.
Phone message left with the Pearl Producers Association CEO on November 9 2018. In phone consultation on November 13 2018, the Pearl Producers Association CEO indicated information has been received and no response has been provided due to last in timing.
In phone consultation on November 13 2018, the Pearl Producers Association CEO advised that at the 50-m water depth contour there may be presence of pearl oyster brood stock; however, these numbers are
development of the Keraudren Seismic Survey EP, and considers the level of consultation to be adequate.
In phone consultation for this activity, the Pearl Producers Association has raised no objection to the Keraudren Seismic Survey.
As identified in consultation (Pearl Producers Association, WAFIC and DPIRD Fish Cube data pearl diving activities will not occur within, or nearby to the operational area. Pearl diving activities are limited to shallower waters, below 35 m.
Potential impacts to diving activities outside of the operational area are addressed in Section 5.3.3.
In relation to the Pearl Producers Association’s claim about pearl oyster distribution, Santos WA commissioned a study to document the presence of pearl oysters and describe the habitats present within the operational area at 40 m to 60 m water depth. The study findings are consistent with the Pearl Producers Association’s claim that pearl oyster numbers at the 50-m contour are limited.
Potential impacts to pearl oysters are addressed in Section 5.3.3.
Santos Ltd | Keraudren Seismic Survey EP Summary Page 105 of 248
Stakeholder Relevance / reasoning for engagement
Summary of stakeholder and titleholder correspondence, and any objections and claims made Assessment of stakeholder objections and claims
expected to be limited. PPA advised diving season commences April (generally commencing closer to Eighty Mile Beach) and runs through to August/September. Santos WA advised modelling had been conducted to define a buffer for safe diving activities. Santos WA advised the Pearl Producers Association of intentions to submit the EP and requested an email response to confirm no concern with the activity. The Pearl Producers Association CEO raised no concern with the activity and time frame for EP submission in phone consultation, and committed to responded via email.
Santos WA followed this phone conversation with an email on November 13 2018, outlining points discussed on the phone and requesting confirmation these were true. Santos WA provided a map and advised the Pearl Producers Association part of the impact assessment for the Keraudren Seismic Survey considered potential impacts to divers. Santos WA advised the acoustic modelling undertaken for the survey identified that the human health assessment threshold could be reached out to a distance of 23.2 km from the seismic source, which does not reach the identified sites for diving Bedout Island, a pearl farm lease and pearl harvesting area.
Santos WA advised based on the noise modelling it is predicted that noise levels at these three locations will be below the human health assessment threshold. Santos WA requested an email confirming this information was received and that Santos WA had correctly understood the Pearl Producers Association CEO’s comments over the phone.
Santos WA followed this with an email on November 15 2018, advising EP submission time frames had been revised and offering time to meet face-to-face with the Pearl Producers Association if there were any concerns with the activity to discuss.
No response has been received at time of submission.
Objection or claim:
Santos Ltd | Keraudren Seismic Survey EP Summary Page 106 of 248
Stakeholder Relevance / reasoning for engagement
Summary of stakeholder and titleholder correspondence, and any objections and claims made Assessment of stakeholder objections and claims
No objection in phone correspondence.
The PPA CEO claimed that the survey area deeper than 70 m was of no concern, however, the shallower waters were of interest given the potential for pearl oyster brood stock to exist at these depths.
Additional, the PPA CEO claimed that at the 50-m water depth contour there may be presence of pearl oyster brood stock, however, these numbers are expected to be limited.
Recfishwest Recfishwest is the peak body representing recreational fishers in Western Australia.
Santos WA contacted Recfishwest by phone on October 3 2018, and introduced the proposed seismic survey and queried the level of recreational fishing in Port Hedland.
Recfishwest advised recreational fishing off Port Hedland is limited to shallower waters, and often focusses on port markers buoys where fish aggregate.
Recfishwest advised Santos WA there is no relevant charter boat companies in the area and no tourism industry based around recreational fishing, like in Exmouth.
Objection or claim: No objection. No claim.
Recfishwest does not object to the Keraudren Seismic Survey and have made no claim.
Recfishwest do not believe there is recreational fishing activity in the vicinity of the proposed Keraudren Seismic Survey, based on feedback from their members and believes the distance from shore is too great for recreational fishers to access.
Santos WA considers the level of consultation to be adequate.
Western Australian Fishing Industry Council (WAFIC)
WAFIC is the peak industry body representing the interests of the commercial fishing, pearling and aquaculture sector. WAFIC is a relevant stakeholder for this petroleum activity.
The information provided below is a summary of consultation with WAFIC, and some commercial fishers.
Santos WA contacted WAFIC by phone on October 1 2018, to introduce the activity and request WAFIC’s assistance early to identify relevant fishing stakeholders; and review the draft consultation package.
The Keraudren Seismic Survey Consultation Package Revision 0 was provided to WAFIC for review on October 3 2018.
Santos WA met with WAFIC to receive feedback on the draft document on October 5 2018. WAFIC provided advice on relevant fishers in the area, which Santos WA crosschecked with data received by DPIRD via Fish
WAFIC did not object to the Keraudren Seismic Survey and made no claim between 1 to 5 October. Santos WA’s Keraudren Seismic Survey Consultation Package and relevant stakeholder list were updated based on WAFIC feedback.
Identified relevant commercial fishers are described in Section 3.5 of this EP.
WAFIC endorsed Santos WA to commence engaging individual, relevant fishers for the activity.
Santos Ltd | Keraudren Seismic Survey EP Summary Page 107 of 248
Stakeholder Relevance / reasoning for engagement
Summary of stakeholder and titleholder correspondence, and any objections and claims made Assessment of stakeholder objections and claims
Cube. WAFIC advised no prawn trawling, specimen shell collecting or pearl diving would occur within the survey operational area. WAFIC advised there is limited fishing effort in the area, and recommended relevant fishers from four key fisheries be engaged:
• Mackerel Area 2. • Pilbara Fish Trawl. • Pilbara Trap. • Pilbara Line (minimal effort expected).
WAFIC was advised consultation with individual fishers would commence around October 9 2018.
A WAFIC representative was invited and participated in Santos WA’s acoustic risk assessment workshop held on October 24 2018. During the workshop WAFIC provided valuable feedback, and noted minimal fishing effort in the area, primarily centred around the Pilbara fisheries.
WAFIC followed up this workshop with email correspondence on November 2 2018. Santos WA tabulated and responded to each of WAFIC’s comments by email, as sent on November 9 2018. Santos WA informed WAFIC that the planned submission date for the EP was November 16 2018.
WAFIC’s feedback included:
General advice on recommended consultation methods and material, including a request for a minimum of eight weeks for commercial fishers to respond to consultation information.
General existing environment and impact assessment content relating to commercial fisheries that must be included in the EP.
Questions relating to Santos WA’s environmental impact assessment process, including an expectation that in the absence of science
Santos WA has incorporated WAFIC’s feedback in the following EP sections:
Relevant commercial fishers were provided the Keraudren Seismic Survey Consultation Package as earlier as October 9 2018. At the time of EP submission, this equates to eight weeks of consultation. Notwithstanding this, Santos WA is committed to ongoing consultation with commercial fishers.
Details on commercial fisheries, including fisheries not active over the operational area but within which fishery resources may be found, are provided in Table 3-7. Santos WA advised WAFIC that the North West Slope Trawl Fishery does not intersect the Operational Area.
Details on fish spawning are provided in Table 3-8.
Details on impacts to fish and commercial fishing are provided in Section 5.3.1 and Section 5.3.3, including a cumulative impact assessment.
Santos Ltd | Keraudren Seismic Survey EP Summary Page 108 of 248
Stakeholder Relevance / reasoning for engagement
Summary of stakeholder and titleholder correspondence, and any objections and claims made Assessment of stakeholder objections and claims
commercial fisher knowledge and locational history and understanding of the resource be used.
Request for a cumulative impact assessment of other seismic surveys conducted over the past ten years.
Statements on seismic survey timing, with a requirement for the survey to be undertaken at the “best possible time taking into account commercial fishing activity, spawning periods and other environmental considerations”… meaning “there is a narrow window of opportunity”.
Conformation that the commercial fisheries overlapping part or all of the proposed Keraudren Seismic Survey site which are active in this area:
Western Tuna and Billfish (Commonwealth managed – currently one active licence holder who requests all seismic information).
Conformation that the commercial fisheries overlapping part or all of the proposed Keraudren Seismic Survey site which are not active in this area (and therefore “do not require consultation”) but must be addressed regarding impact on spawning and key indicator species:
• West Coast Deep Sea Crustacean Managed Fishery. • Nickol Bay Prawn Managed Fishery. • Pilbara Crab Managed Fishery. • Pearl Oyster Managed Fishery. • Marine Aquarium Fish Managed Fishery. • Specimen Shell Managed Fishery. • WA North Coast Shark Fishery. • Southern Bluefin Tuna (Commonwealth managed). • Western Skipjack Tuna (Commonwealth managed).
Details on activity timing are provide in Section 1.2. Survey timing depends on a number of factors, specifically business objectives (2019 survey data requirement), regulatory approval time frames (not expected before March 2019) and whale migration periods (no survey after July 2019). In consultation with fishers in the Pilbara region, including trawl fishers, fishing occurs throughout the year. Further, there is no known period during which fishing spawning does not occur. Hence, Santos WA would not be able to avoid commercial fishing or fish spawning activity.
In relation to WAFIC’s objections and claims:
Santos WA is aiming to complete the survey between March and end of July, and is not intending on splitting the survey. However, if full survey objectives cannot be achieved in 2019 then Santos WA may consider additional seismic surveys in 2020 and beyond. This would require stakeholder re-engagement and preparation of a new EP for NOPSEMA acceptance.
Seismic and support vessels will be prohibited from recreational fishing within the Operational Area.
Importantly, Santos WA will not restrict commercial fishing access to the Operational Area and is committed to concurrent operational planning with commercial fishers. Santos WA confirms that support vessels outside of the range of the active seismic survey will avoid commercial vessels that are actively fishing.
Santos Ltd | Keraudren Seismic Survey EP Summary Page 109 of 248
Stakeholder Relevance / reasoning for engagement
Summary of stakeholder and titleholder correspondence, and any objections and claims made Assessment of stakeholder objections and claims
Objection or claim:
WAFIC objection to the survey being delayed, for whatever reason and including approval delay, to a time outside of the “window of opportunity”. [Note, specific timing of the window of opportunity was not defined in WAFIC’s feedback].
WAFIC objection to the survey being split into two surveys conducted over successive years, claiming this would result in “doubling the inconvenience, doubling the stress, doubling all impacts on the resource and commercial fishing activity”.
WAFIC objection to any recreational fishing from seismic survey vessels and support vessels.
WAFIC claim that the rights of active commercial fishers on the water must be protected during the survey, specifically that support vessels are to avoid any close and/or disruptive engagement with any commercial fishing activity.
WAFIC claim that a “no reply” from commercial fishing licence holders does not represent an “unspoken agreeance” to the survey. WAFIC stated that “stakeholder fatigue and the overall pressures of commercial fishing does not provide the ideal environment to respond to multiple, often concurrent, oil and gas consultations”.
Santos WA has made every effort to engage with WAFIC and has feedback from the key commercial fishing licence holder’s active in the Operational Area. Santos WA commits to ongoing consultation with commercial fishers.
WAFIC provided an email to Santos WA on November 12 2018. Santos WA responded via email on November 13 2018, tabulating and addressing each point.
Key WAFIC feedback included:
WAFIC advised that Santos WA had not provided information regarding key indicator species for other fisheries, which overlap part or all of the proposed Keraudren Seismic Survey, but where there is currently no
Santos WA has incorporated WAFIC’s feedback in the following EP sections:
Details on impacts to fish and commercial fishing are provided in Section 5.3.1 and Section 5.3.3.
Details on control measures (i.e., mitigation measures) relevant to commercial fishers are provided in Section Section 5.3.1 and Section 5.3.3. Santos WA has made an overarching commitment
Santos Ltd | Keraudren Seismic Survey EP Summary Page 110 of 248
Stakeholder Relevance / reasoning for engagement
Summary of stakeholder and titleholder correspondence, and any objections and claims made Assessment of stakeholder objections and claims
commercial fishing activity. Further, that assessment of potential impacts on fish resources is crucially important to the commercial fishing sector.
WAFIC questioned if Santos WA would make commercial fishing sections of the EP available for commercial fisher review prior to submission to NOPSEMA. WAFIC stated “This will go a long way to ensuring our stakeholders that all mitigations have been appropriately addressed by Santos WA to ALARP levels and areas where there are risks without any mediations have also been formally and clearly identified within the environment plan”.
WAFIC questioned how Santos WA proposes to meet its environmental obligations regarding risk management. Further, questioned if Santos WA had considered the following costs for the commercial fishing sector within the EP:
Relocation expenses: commercial fishers to fish away from the path / route of a seismic survey over and extended time period.
Loss of catch costs: impact of fish dispersants.
Engagement (consultation) costs: ongoing time / etc. for direct consultation.
Payment for future risks to the fishery: impact on key species with seismic activities taking place during key spawning times.
WAFIC requested that their feedback be included in the EP for NOPSEMA review.
Objection or claim:
WAFIC claim that there is science supporting fisher concerns, being impacts on fishing activity, fish dispersant and fish spawning.
WAFIC claim that the proposed survey will potentially directly impact some commercial fishing operations and the resource.
that commercial fishing licence holders will be no worse off as a result of the seismic survey. Santos WA confirms that it will assess the merits of evidence-based payment claims made by commercial fishers.
Santos WA offered to release additional details about the survey and its environmental assessment by making a draft environment plan summary publicly available a week after first submission of the EP to NOPSEMA. The proposed EP submission date was November 16 2018. Santos WA subsequently agreed to release parts of the draft EP to WAFIC and its members prior to submission to NOPSEMA, as described below.
In relation to WAFIC’s objections and claims:
Santos WA acknowledges commercial fishers concerns about seismic surveys.
Santos Ltd | Keraudren Seismic Survey EP Summary Page 111 of 248
Stakeholder Relevance / reasoning for engagement
Summary of stakeholder and titleholder correspondence, and any objections and claims made Assessment of stakeholder objections and claims
WAFIC provided an email to Santos WA on November 14 2018, expressing concerns about Santos WA’s approval time frames, environment plan content and proposed mitigation measures. Consequently, WAFIC requested that Santos WA:
Participate in a roundtable industry meeting with key commercial fishing operators.
Delay submitting the EP to NOPSEMA to ensure the discussions and outcomes of the roundtable industry meeting are included within in the EP.
Objection or claim:
Based on Santos WA’s interpretation of WAFIC’s email:
WAFIC objected to not being provided full access to the commercial fishing components of the environment plan prior to NOPSEMA submission.
WAFIC objected to any notion that the commercial fishing sector should have to mitigate potential impacts caused by Santos WA’s survey.
WAFIC objected to mitigation measures being limited to maritime notifications and commercial fishing vessel exclusion from the survey area.
WAFIC claimed that the lack of response from a commercial licence holder does not mean that they will not be potentially impacted by this activity, noting stakeholder fatigue as a significant issue.
Santos WA responded by phone on November 14 2018.
In response to WAFIC’s email, Santos WA:
Did not submit the EP to NOPSEMA on November 16 2018, as original planned.
Agreed to attend an industry roundtable meeting with WAFIC and relevant fishers, as facilitated by WAFIC.
Santos WA provided WAFIC relevant sections of the draft Keraudren Seismic Survey EP via email on November 21 2018. This included relevant parts of Section 2, Section 3, Section 4, Section 6.1, Section 6.3 and Table 8-3. Details of the EP were discussed at the industry roundtable meeting (refer to below).
In relation to WAFIC’s objections and claims:
Details on control measures (i.e. mitigation measures) relevant to commercial fishers are provided in Section 5.3.1 and Section 5.3.3.
Importantly, Santos WA will not restrict commercial fishing access to the Operational Area (refer to Section 5.3.1), and is committed to concurrent operational planning with commercial fishers.
Santos WA has made an overarching commitment that commercial fishing licence holders will be no worse off as a result of the seismic survey. Santos WA confirms that it will assess the merits of evidence-based payment claims made by commercial fishers.
Santos WA has made every effort to engage with WAFIC and its members, and has feedback from the
Santos Ltd | Keraudren Seismic Survey EP Summary Page 112 of 248
Stakeholder Relevance / reasoning for engagement
Summary of stakeholder and titleholder correspondence, and any objections and claims made Assessment of stakeholder objections and claims
key commercial fishing licence holders active in the Operational Area. Santos WA commits to ongoing consultation with commercial fishers.
Santos WA attended a commercial fishing industry roundtable meeting on November 22 2018. Hard copies of presentation slides were left with WAFIC and the individual fishers present at this meeting.
Meeting minutes were prepared by Santos WA and provided to WAFIC for review via email on November 26 2018. WAFIC confirmed via phone consultation on November 27 2018, that the minutes were received; and then via phone consultation on December 4 2018, that the minutes were acceptable to WAFIC. WAFIC circulated these minutes to fishers via email.
Objection or claim:
Based on Santos WA’s interpretation of the meeting and meeting minutes:
Commercial fishers claim substantial grounds for concerns because of the seismic survey. Prefer Santos WA do not shoot the survey.
A commercial fisher claimed that if being cynical, Santos WA is attempting to get the survey done before AIMS study results are released.
Commercial fishers claim the draft EP presented to fishers likely understates the impacts to fisheries.
Commercial fishers claimed concerns with combining the entire Pilbara demersal fishery to assess the impacts. Stating that ‘fish biomass’ is more important than ‘fishery area’, and that basing an impact assessment on total area does not make sense from a fish resources point of view – ‘area is not a proxy for biomass’. Fish are not evenly distributed over the entre fishery. Fish biomass is likely to be greater in active fishing zones and fish numbers are likely to be significantly over represented within active
In relation to WAFIC’s objections and claims:
Santos WA acknowledges WAFIC and commercial fishers concerns on the seismic survey. Further, acknowledges that both commercial fishers and petroleum operators (including seismic surveys) are legitimate co-users of the sea.
Santos WA is aware of the North West Shoals to Shore Research Program (NWSSRP), in which AIMS is investigating the impacts of marine noise from the petroleum industry on pearl oysters and fish. Santos WA understands that research on pearl oyster distribution and finfish seismic source exposure affects will not be publically available until at least Q2 to Q4 2019. Results from the pearl oyster seismic source exposure experiment will not be publicly available until 2021. Current survey objectives and approval timeframes mean that this research will not be available to inform the impact assessment of the proposed Keraudren Seismic Survey.
Details on impacts to commercial fisheries are provided in Section 5.3.1. Santos WA agrees that catch effort data are not a proxy for fish biomass. Therefore, the area of catch effort within the survey area as a percentage of the total area of the fishery has not been used to assess impact on fisheries stocks.
Santos Ltd | Keraudren Seismic Survey EP Summary Page 113 of 248
Stakeholder Relevance / reasoning for engagement
Summary of stakeholder and titleholder correspondence, and any objections and claims made Assessment of stakeholder objections and claims
fishing zones. Santos WA’s assessment of 4% impact to the total demersal fishery area is potentially an understatement of the total biomass impacted.
Commercial fishers claimed that basic aspects of fisheries management need to be considered in the EP and suggested additional engagement with DPIRD.
Commercial fishers claim that the fishing industry has reduced its fishing effort over the last nine years, in order to improve fish stocks. Now fishers claim they will ‘take the hit’ from the seismic survey, following their own responsible management of the fishery.
WAFIC claimed no industry wide process for ‘making good’ seismic survey impacts to commercial fishers. Claimed another petroleum company has successfully developed a make good model, which is evidenced-based. WAFIC, and commercial fishers, are prepared to draft a process for further discussion. Intent that fishing industry would develop a model, and then individual claims would be a confidential matter between petroleum operators and individual fishers.
WAFIC and commercial fishers confirmed that development of the ‘make good’ model could be run in parallel with the EP assessment, and would not need to delay Santos WA’s submission to the regulator.
As a WAFIC member at the roundtable meeting, MG Kailis claimed that their position is that they agree with Westmore’s written comments to Santos WA (refer to below), plus the issues raised by MG Kailis in the meeting.
A commercial fisher claimed that the impacts to sawfish described in the EP are incorrect. Pupping grounds are adjacent to the survey area and fish traverse the area. Suggested that Santos WA refer to the National Recovery Plan for Sawfish.
Santos WA has consulted with and received advice from DPIRD in regards to the Keraudren Seismic Survey (refer to section in this table above).
Santos WA has made an overarching commitment that commercial fishing licence holders will be no worse off as a result of the seismic survey. Santos WA confirms that it will assess the merits of evidence-based payment claims made by commercial fishers.
Santos WA acknowledges WAFIC’s offer to develop an industry ‘make good’ model and commits to assess the merits of the model when available. Santos WA commits to ongoing engagement with WAFIC and commercial fishers on this model.
As part of Santos WA’s commitment to concurrent operations planning, communication protocols will be drafted for individual fishing licence holders, if requested, and prior to seismic operations commencing.
Santos WA have reviewed the National Recovery Plan for Sawfish and confirm the following in relation to the pupping grounds of sawfish and proximity or overlap with the survey area:
Largetooth sawfish – nearest known pupping ground is in shallow waters adjacent to Broome
Green sawfish and Dwarf sawfish – pupping known to occur in shallow coastal waters adjacent to Eighty Mile Beach. This area abuts the EMBA not the operational area of the survey.
Santos Ltd | Keraudren Seismic Survey EP Summary Page 114 of 248
Stakeholder Relevance / reasoning for engagement
Summary of stakeholder and titleholder correspondence, and any objections and claims made Assessment of stakeholder objections and claims
Commercial fishers claim that mackerel spawn from September through to April, which does not correlate with the information in the EP provided by DPIRD.
Santos WA has updated data on mackerel spawning in the North Coast bioregion based on stakeholder feedback in Table 3-8 and Table 3-10.
In phone consultation on November 27 2018, WAFIC confirmed commercial fishers including Westmore Seafoods are pleased there is a ‘process moving forward’ in reference to Santos WA’s commitment to assess payment claims by fishers. WAFIC confirmed individual fishers did not require additional information on the Keraudren Seismic Survey at this stage.
In phone and email consultation on January 7 2018, WAFIC advised Santos WA MG Kailis had updated the Meeting Minutes from the commercial fishing industry roundtable meeting held on November 22 2018.
Santos WA accepted the additions to the meeting minutes.
In phone consultation on January 8 2019, WAFIC advised Santos WA that Westmore Seafoods had not yet requested the data from DPIRD and that WAFIC would follow up with Westmore Seafoods.
No further comment from WAFIC has been received regarding the Keraudren Seismic Survey and engagement with other fishing stakeholders.
Santos has made reasonable efforts to obtain fishing catch and effort data from MG Kailis and Westmore Seafoods, and has not received this data at time of EP submission.
Santos has identified data from DPIRD containing indicative fishing effort/catch, hence, less importance on the fishers data for the impact assessment. See Figure 3-9 and Figure 3-10.
Santos notes PFTIMF catch and effort data may be relevant for future commercial claims, therefore will continue to engage with fishers and DPIRD to obtain this data.
Santos WA emailed WAFIC on January 23, 2019, regarding next steps for ongoing engagement with fishers.
Santos WA commit to ongoing engagement with individual fishers regarding control measures and
Santos Ltd | Keraudren Seismic Survey EP Summary Page 115 of 248
Stakeholder Relevance / reasoning for engagement
Summary of stakeholder and titleholder correspondence, and any objections and claims made Assessment of stakeholder objections and claims
In phone consultation on January 29, 2019, Santos WA advised WAFIC of progress of the Keraudren Seismic Survey. Santos WA advised there had been changes made to control measures regarding ‘make good’ payments. WAFIC advised Santos WA conversations regarding commercial agreements are appropriate to be had directly with fishers.
Santos WA left voice mail for a WAFIC representative on February 18 and February 26, 2019, to follow up this conversation. No response has been received to date.
Objection or claim:
WAFIC claim it is appropriate for Santos WA to deal directly with fishers on commercial arrangements.
concurrent operations planning, as discussed with WAFIC.
Santos WA commit to ongoing engagement with WAFIC regarding progress of the Keraudren Seismic Survey Environment Plan. Santos will keep WAFIC informed specifically regarding EP approvals, and survey pre-start notifications.
Community/Port Hedland Stakeholder Reference Group
Town of Port Hedland
Port Hedland is the nearest community to Santos WA’s Bedout Basin petroleum permits. The Town of Port Hedland is the local government body for the region.
The Town of Port Hedland was contacted by phone on October 3 2018, to introduce the activity and request advice from the Town of Port Hedland regarding local stakeholders and those who would be relevant to this activity. The Town of Port Hedland has been engaged by Santos WA’s Corporate Affairs Team previously regarding exploration drilling activities in the region.
The Keraudren Seismic Survey Consultation Package Revision 0 was sent via email on October 3 2018.
The Town of Port Hedland responded to Santos WA via email on October 18 2018, and identified additional stakeholders.
Santos WA responded with thanks on October 18 2018.
Objection or claim: No objection. No claim.
The Town of Port Hedland does not object to the Keraudren Seismic Survey and have made no claim.
Based on consultation from the Town of Port Hedland, Santos WA has added additional stakeholders to the relevant stakeholder list.
Santos WA has updated the activity OPEP, noting the Town of Port Hedland is to be informed if Santos WA required access to any islands within the Town’s jurisdiction.
Santos WA considers the level of consultation to be adequate.
Pilbara Ports Authority
Pilbara Ports Authority manages port land at Dampier,
The Pilbara Ports Authority was provided the Keraudren Seismic Survey Consultation Package Revision 0 via email on October 3 2018.
The Pilbara Port Authority does not object to this activity and provided no claim or comment on the activity given is location outside port limits.
Santos Ltd | Keraudren Seismic Survey EP Summary Page 116 of 248
Stakeholder Relevance / reasoning for engagement
Summary of stakeholder and titleholder correspondence, and any objections and claims made Assessment of stakeholder objections and claims
Port Hedland, Ashburton and Cape
Preston East, and facilitates the development of land and leases to support port-related industries. Port Hedland is the nearest Port to the proposed Keraudren Seismic Survey.
In phone engagement the Port advised the activity was of no concern given is location out of Port limits. Santos WA committed to keeping the Port engaged on offshore activities.
Objection or claim: No objection. No claim.
Santos WA considers the level of consultation to be adequate.
Port Hedland Chamber of Commerce and Industry (CCI)
The Port Hedland CCI is a member driven organisation providing quality information, professional services and support for businesses in the local Port Hedland area. The Port Hedland CCI was approached for assistance in identifying local stakeholders.
The Port Hedland CCI was contacted by phone on October 12 2018, and the proposed seismic survey was outlined. Santos WAqueried the CCI on what stakeholders may be relevant to the offshore area.
Santos WA followed up providing the Keraudren Seismic Survey Consultation Package Revision 1 via email and gave details on which local stakeholders had already been identified and engaged regarding the activity.
The Port Hedland CCI responded via email on October 23 2018, advising of an additional stakeholder to add to the list.
Objection or claim: No objection. No claim.
The Port Hedland CCI does not object to the Keraudren Seismic Survey and have made no claim.
Santos WA has added additional stakeholders to the relevant stakeholder list.
Santos WA considers the level of consultation to be adequate.
Port Hedland Game Fishing Club (PHGFC)
The PHGFC was identified as a relevant stakeholder
Santos WA contacted the President of the PHGFC by phone on October 15 2018, and outlined the proposed seismic survey and its location in the relation to areas of interest to the PHGFC. Santos WA queried the PHGFC
PHGFC does not object to the Keraudren Seismic Survey and have made no claim.
Santos Ltd | Keraudren Seismic Survey EP Summary Page 117 of 248
Stakeholder Relevance / reasoning for engagement
Summary of stakeholder and titleholder correspondence, and any objections and claims made Assessment of stakeholder objections and claims
in engagement with Recfishwest.
The PHGFC also identified as being able to assist in reaching its membership to inform of survey timing.
on game fishing activity out of Port Hedland, locations of recreational fishing activities and any particular times of year of significance.
The PHGFC advised game fishers would fish due North of Port Hedland to a maximum depth of 50 m, or around Bedout Island.
Two tournaments the PHGFC host are in August to September and November and would focus on the area 50 nm (92.5 km) due North of Port Hedland.
PHGFC advised low fishing activity in March, more boats likely around Bedout Island in April and May.
PHGFC additionally provided insight into commercial fishing activity in the area.
PHGFC offered to circulate Santos WA’s consultation material to members via their website, advising if fishers were aware of the activity they would likely avoid the area. Santos WA commits to providing additional information, particularly when timing and vessel details are available.
Santos WA provided Keraudren Seismic Survey Consultation Package Revision 2 via email on October 23 2018.
No further response has been received.
Objection or claim: No objection. No claim.
Santos WA has incorporated the PHGFC’s advice into the development of this EP and used it to inform future community engagement.
Santos WA values the knowledge of the PHGFC and the reach the Club has within its membership. Santos WA will therefore continue to engage with the PHGFC prior to activity commencement, particularly with vessel details and timing when appropriate for wider distribution among PHGFC members for awareness.
Santos WA considers the level of consultation to be adequate.
Port Hedland Volunteer Marine Rescue (PHVMR)
The PHVMR was identified as a potentially relevant stakeholder in engagement with BHP Port Hedland office. PHVMR was identified as a
The PHVMR was contacted by phone on October 16 2018. Santos WA outlined the proposed seismic survey and its location offshore and queried the PHVMR on the level of offshore activity in this area.
PHVMR advised their operational area is typically 30 nm (55 km) out of Port Hedland and calls were to both commercial and recreational vessels for a variety of reasons.
PHVMR does not object to the Keraudren Seismic Survey and have made no claim.
Santos WA has incorporated the PHVMR’s advice into the development of this EP in Table 3-9.
Santos WA values the knowledge of the PHVMR and will continue to engage with the PHVMR prior to activity commencement.
Santos Ltd | Keraudren Seismic Survey EP Summary Page 118 of 248
Stakeholder Relevance / reasoning for engagement
Summary of stakeholder and titleholder correspondence, and any objections and claims made Assessment of stakeholder objections and claims
stakeholder with knowledge of the offshore activities in the area of the Keraudren Seismic Survey.
PHVMR provided insight into fishing activity in the area, suggested interaction in the Keraudren survey area would likely be commercial as recreational activity is focussed around Bedout Island, potentially to 50 m deep if chasing red emperor.
PHVMR offered to assist in contacting the key commercial fisher in Port Hedland, as only one local resident who fishes commercially.
Santos WA provided Keraudren Seismic Survey Consultation Package Revision 1 via email on October 16 2018.
Santos WA followed up with PHVMR by phone and email on October 29 2018, querying recreational diving activity in the region. PHVMR advised diving activity does occur around Bedout Island, is not tourism based rather typically locals who are spearfishing or free diving. May occur at depths up to 50 m when targeting pelagic fish. Provided details of local dive shop owner who is the best contact for diving in Port Hedland.
Objection or claim: No objection. No claim.
Santos WA considers the level of consultation to be adequate.
Port Hedland Yacht Club (PHYC)
The PHYC was identified as a relevant stakeholder in engagement with the Port Hedland CCI.
The PHYC also identified as being able to assist in reaching its membership to inform of survey timing.
The PHYC was contacted by phone on October 16 2018, and was given an outlined of the proposed seismic survey, its distance offshore and water depths. The PHYC advised this location would not encounter sailing activity and unlikely to impact members. Santos WA suggested providing updated information when vessel and timing is confirmed. The PHYC offered to distribute this via email to members.
Santos WA provided the Keraudren Seismic Survey Consultation Package Revision 2 via email on October 23 2018, noting the PHYC’s offer to distribute this information to their members.
No further response has been provided.
Objection or claim: No objection. No claim.
PHYC does not object to the Keraudren Seismic Survey and have made no claim.
PHYC advised that its members are unlikely to be impacted given the distance of the survey offshore.
Santos WA values the reach the PHYC has within its membership. Santos WA will therefore continue to engage with the PHYC prior to activity commencement, particularly with vessel details and timing when appropriate for wider distribution among PHYC members for awareness.
Santos WA considers the level of consultation to be adequate.
Santos Ltd | Keraudren Seismic Survey EP Summary Page 119 of 248
Stakeholder Relevance / reasoning for engagement
Summary of stakeholder and titleholder correspondence, and any objections and claims made Assessment of stakeholder objections and claims
BHP Corporate Affairs Port Hedland
BHP Corporate Affairs in Port Hedland was identified as a relevant stakeholder given their local knowledge and understanding of the local stakeholder groups.
BHP Corporate Affairs was contacted by phone on October 15 2018 and provided an update on exploration activities and Santos WA plans for 2019. Santos WA queried whether stakeholders identified for seismic was appropriate, BHP provided feedback, advising the identified stakeholder list should be sufficient, and provided details for additional stakeholders.
BHP advised Port Hedland is generally supportive of the oil and gas industry and would not expect objections to seismic in the town, especially given the distance offshore.
Objection or claim: No objection. No claim.
BHP does not object to the Keraudren Seismic Survey and have made no claim.
Santos WA has added additional stakeholders to the relevant stakeholder list as suggested by BHP.
Santos WA considers the level of consultation to be adequate.
Care for Hedland
Port Hedland based NGO.
Focus primarily turtle conservation, with an interest in whales. Identified as relevant given the location of the survey in relation to biologically important areas for turtles, and humpback whale migration pathways.
The Chairperson of Care for Hedland was contacted in phone consultation on October 12 2018 and advised of the proposed seismic survey. Santos WA advised impacts to turtles and whales would be assessed within the activity EP, to be submitted to the offshore regulator.
Care for Hedland was provided the Keraudren Seismic Survey Consultation Package Revision 1 via email on October 12 2018, with an additional map showing the survey area intersection with biologically important areas for turtles, timing in relation to humpback whale migration and turtle internesting, and distances to key areas.
Care for Hedland responded acknowledging receipt of information on October 18 2018 and advised the information would be distributed to members.
No further response has been received at the time of submission.
Objection or claim: No objection. No claim.
No comment or objection has been raised by Care for Hedland at time of EP submission.
Santos WA has assessed the impact of the Keraudren Seismic Survey on whales and turtles in Section 5.3.3. Importantly, peak humpback whale migration periods will be avoided and well-tested cetacean interaction management practices will be implemented (i.e. EPBC Act Policy Statement 2.1). Further, the survey area is not near any significant turtle nesting beaches.
Santos WA considers the level of consultation to be adequate.
De Grey Station Suggested as potentially relevant stakeholder in consultation with the
Santos WA provided the Keraudren Seismic Survey Consultation Package Revision 2 via email on November 15 2018, with a map outlining the Station and other onshore landmarks in relation to the survey operational area.
No response has been received at the time of submission.
Given the onshore location of De Grey Station, Santos WA does not anticipate impact to the operational activities of De Grey Station to result from the Keraudren Seismic Survey.
Santos Ltd | Keraudren Seismic Survey EP Summary Page 120 of 248
Stakeholder Relevance / reasoning for engagement
Summary of stakeholder and titleholder correspondence, and any objections and claims made Assessment of stakeholder objections and claims
Town of Port Hedland.
De Grey Station is a pastoral lease, now a cattle station approximately 80 km east of Port Hedland on the mouth of the De Grey River in the Pilbara.
Santos WA considers the level of consultation to be adequate.
Pardoo Station Suggested as potentially relevant stakeholder in consultation with the Town of Port Hedland.
Pardoo Station is a pastoral lease, formerly a sheep station, and now a cattle station approximately 120 kilometres east of Port Hedland and 121 kilometres north of Marble Bar.
Santos WA provided the Keraudren Seismic Survey Consultation Package Revision 2 via email on October 31 2018, with a map outlining the Station and other onshore landmarks in relation to the survey operational area.
A Pardoo Station representative responded via email on November 25 2018, requesting a pre-start notification.
Objection or claim: No objection. No claim.
Pardoo Station does not object to the Keraudren Seismic Survey and have made no claim.
Given the onshore location of Pardoo Station, Santos WA does not anticipate impact to the operational activities of Pardoo Station to result from the Keraudren Seismic Survey.
Santos WA considers the level of consultation to be adequate.
Shire of East Pilbara
Suggested as potentially relevant stakeholder in consultation with the
Santos WA provided the Keraudren Seismic Survey Consultation Package Revision 2 via email on October 31 2018, with a map outlining the Shire boundaries and other onshore landmarks in relation to the survey operational area.
The Shire does not object to the Keraudren Seismic Survey and have made no claim.
The Shire of East Pilbara North Ward includes shoreline adjacent to the Keraudren Seismic Survey.
Santos Ltd | Keraudren Seismic Survey EP Summary Page 121 of 248
Stakeholder Relevance / reasoning for engagement
Summary of stakeholder and titleholder correspondence, and any objections and claims made Assessment of stakeholder objections and claims
Town of Port Hedland.
The Shire of East Pilbara North West Ward covers a patch of shoreline between Port Hedland and 80 Mile Beach which includes Cape Keraudren.
In phone consultation a Shire of East Pilbara Councillor expressed interest in the activity and advised information would be presented to council on November 23 2018. The Councillor indicated information provided to date was sufficient. Santos WA offered to make additional information on the activity available upon first submission to the offshore regulator.
No further comment has been received at time of submission.
Objection or claim: No objection. No claim.
The survey area ramp up zone is approximately 85 km from Cape Keraudren, in the Shire of East Pilbara. Given this distance offshore, Santos WA considers it unlikely constituents would be impacted by the Seismic Survey.
Recreational vessels may travel from Cape Keraudren to Bedout Island.
Santos WA considers the level of consultation to be adequate.
80 Mile Beach Caravan Park
Suggested as potentially relevant stakeholder in consultation with the Town of Port Hedland.
The Keraudren Seismic Survey operational area is approximately 146 km offshore from the 80 Mile Beach Caravan Park.
Santos WA provided the Keraudren Seismic Survey Consultation Package Revision 2 via email on October 31 2018, with a map indicating the Caravan Park and other onshore landmarks in relation to the survey operational area.
No response has been received at the time of submission.
The Keraudren Seismic Survey operational area is approximately 146 km offshore from the 80 Mile Beach Caravan Park. Santos WA does not anticipate recreational boaters would travel this distance from 80 Mile Beach Caravan Park.
Santos WA considers the level of consultation to be adequate.
Port Hedland Seafarers Centre
Suggested as potentially relevant stakeholder in consultation with the Port Hedland CCI.
Port Hedland Seafarers Centre
Port Hedland Seafarers Centre were engaged by phone on November 21 2018, and advised impact to their business from the Keraudren Seismic Survey was not expected. The Port Hedland Seafarers Centre do not operate outside the Port.
Santos WA provided the Keraudren Seismic Survey Consultation Package Revision 2 via email to Port Hedland Seafarers Centre on November 21 2018, however does not anticipate a response.
The Port Hedland Seafarers does not object to the Keraudren Seismic Survey and have made no claim.
The Port Hedland Seafarers Launch Boat does not operate out of the Port, therefore does not anticipate any impact from the Keraudren Seismic Survey.
Santos Ltd | Keraudren Seismic Survey EP Summary Page 122 of 248
Stakeholder Relevance / reasoning for engagement
Summary of stakeholder and titleholder correspondence, and any objections and claims made Assessment of stakeholder objections and claims
operates Harbour Tours of the Port Hedland Port with members of the public, on a Seafarers Launch Service Boat.
Santos WA considers the level of consultation to be adequate.
GT Diving (Port Hedland)
Suggested as potentially relevant stakeholder with information regarding recreational diving activities offshore Port Hedland.
The owner of GT Diving has more than ten years’ experience diving offshore Port Hedland, and is a free diving and spearfishing specialist.
Santos WA left a voice mail with GT Diving on October 29 2018, introducing the activity and advised it would provide details via email.
Santos WA provided the Keraudren Seismic Survey Consultation Package Revision 2 via email on October 29 2018, and queried GT Diving on diving activities offshore Port Hedland.
No response has been received at the time of submission.
GT Diving is considered a relevant stakeholder for this activity, as a strong source of information for any offshore diving activities, which may occur nearby Bedout Island.
For an assessment on impacts to diving activities, refer to Section 5.3.3.
Santos WA considers the level of consultation to be adequate.
WA Department of Planning, Lands and Heritage (Hedland)
Suggested as potentially relevant stakeholder in consultation with the Port Hedland CCI. DPLH Hedland undertakes key activities relating to land use planning,
Phone consultation was undertaken on October 26 2018, where Santos WA was introduced and previous exploration activities explained. Santos WA queried DPLH Hedland on what, if any, cultural activities may occur in the offshore area, such as customary fishing or diving. DPLH advised Santos WA they would be able to overlay the area of interest and see what cultural claims there were to the area, requested a copy of the map. DPLH advised native title claims were for onshore activities, however there are some offshore areas of cultural significance but unlikely to be that far offshore.
DPLH does not object to the Keraudren Seismic Survey and have made no claim.
The Keraudren Seismic Survey OPEP states a heritage advisor would be contacted prior to conducting any onshore spill response activities.
Santos WA considers the level of consultation to be adequate.
Santos Ltd | Keraudren Seismic Survey EP Summary Page 123 of 248
Stakeholder Relevance / reasoning for engagement
Summary of stakeholder and titleholder correspondence, and any objections and claims made Assessment of stakeholder objections and claims
the land supply chain, land administration and asset management, all aspects of heritage, and Aboriginal lands and heritage.
Santos WA emailed the Keraudren Seismic Survey Consultation Package Revision 2, along with an additional map, and passed on return contact details for further discussion of the survey at any time.
Santos WA followed up the DPLH to query whether activity information was received and if there are any areas of cultural significance within the vicinity. A DPLH representative advised they have not previously come across any cultural sensitivities that far offshore. On land, if there is a protected heritage area it is clearly recorded. DPLH has internally circulated the Keraudren Seismic Survey Consultation Package Revision 2 for information only.
Objection or claim: No objection. No claim.
Commercial fishers (based on DPIRD Fish Cube data)
WA Professional Shell Fisherman's Association
DPIRD Fish Cube Data indicated Specimen Shell collection activities may occur nearby the activity operational area.
The Specimen Shell Fishery was identified by WAFIC as being an inshore fishery.
In consultation with WAFIC, Santos WA was advised engagement with individual fishers was
WAFIC introduced the Secretary of the WA Professional Shell Fisherman's Association to Santos WA via email. Santos WA followed up, providing the Keraudren Seismic Survey Consultation Package Revision 0 via email on October 6 2018, and querying whether specimen shell fishing activity would likely occur nearby the operational area, and how to engage licence holders if required.
Santos WA received response via email on October 6 2018, confirming the area is too deep for diving. The Secretary raised no concern with the activity.
Objection or claim: No objection. No claim.
WA Specimen Shell Fisherman’s Association does not object to the Keraudren Seismic Survey and have made no claim.
As advised by WAFIC and the Secretary of the WA Professional Shell Fisherman's Association, it is unlikely any specimen shell collecting would occur within the vicinity of the Keraudren Seismic Survey.
On WAFIC’s advice, and to combat stakeholder fatigue, Santos WA has not engaged individuals who hold licences in the Specimen Shell Fishery.
Specimen Shell collectors may use ROVs to collect shells, this could lead them to fish in deeper water as identified in Table 3-7. Therefore, Santos WA will be providing additional information on the survey dates to the Secretary of the WA Professional Shell Fisherman's Association.
Santos Ltd | Keraudren Seismic Survey EP Summary Page 124 of 248
Stakeholder Relevance / reasoning for engagement
Summary of stakeholder and titleholder correspondence, and any objections and claims made Assessment of stakeholder objections and claims
not required. WAFIC provided contact details for the industry association president and suggested engaging him on behalf of the industry.
Santos WA considers the level of consultation to be adequate.
Australian Southern Bluefin Tuna Industry Association (ASBTIA)
AFMA data shows intersection with the Southern Bluefin Tuna fishery and the operational area. Additionally identified as a relevant stakeholder by WAFIC.
In response to consultation on October 29 2018, ASBTIA confirmed this activity would not impact Southern Bluefin Tuna fishing activities and would be unlikely to impact on Southern Bluefin Tuna spawning grounds.
Objection or claim: No objection. No claim.
ASBTIA does not object to the Keraudren Seismic Survey and have made no claim.
ASBTIA responded noting no impact on fishing activities.
Santos WA has identified no intersection with known Southern Bluefin Tuna spawning grounds.
Santos WA considers the level of consultation to be adequate.
Western Tuna and Billfish Fishery
Based on data available on the AFMA website, this fishery is not currently active in waters on the NWS.
Consultation with AFMA and WAFIC has indicated one key commercial tuna fisherman in WA waters, as listed below.
Santos WA has assessed the impact to fish and commercial fisheries in Section 5.3.3.
Ocean Wild Santos WA has been advised in consultation with WAFIC, this individual is the only active commercial tuna fisherman in Western Australia.
Santos WA provided the Keraudren Seismic Survey Revision 1 via email on October 9 2018, outlining the intersection with relevant Tuna Commonwealth fisheries.
No response to consultation has been received at time of submission.
This fisher was invited to a round table meeting with Santos WA, to be held at WAFIC offices in Fremantle, but did not attend.
Santos WA provided consultation material to Ocean Wild as a courtesy and for information. No response was received.
AFMA and the ABARES Fishery Status Report 2018 indicate no Commonwealth tuna fishing activity in this region, refer to Table 3-7.
Santos WA considers the level of consultation to be adequate.
Santos Ltd | Keraudren Seismic Survey EP Summary Page 125 of 248
Stakeholder Relevance / reasoning for engagement
Summary of stakeholder and titleholder correspondence, and any objections and claims made Assessment of stakeholder objections and claims
Consultation with AFMA has identified this fisher as being active South West of WA only.
Mackerel Managed Fishery (Area 2)
Based on Fish Cube data retrieved from DPIRD, Santos WA understands the Mackerel Managed Fishery has operational activity in the southern end of the survey area, approximately surrounding the 60 m water depth contour.
Four key individuals, holding 13 licences, have been engaged using phone or email contacts as listed below.
All other individually listed licence holders in the Mackerel Managed Fishery Area 2 were provided the Keraudren Seismic Survey Revision 1 via post on October 9 2018.
No response to postal correspondence has been received at time of EP submission. If a response is received, this will be address as per Section 4.4 and Section 4.5.
Mackerel Managed Fishing Effort within Area 2 covers an area of 37,219 km2 from 2013-2017, refer to Table 3-7. The Keraudren Seismic operational area overlaps with 2,309 km2 of the area of recorded fishing effort (6.2% based on Fish Cube Data).
Impacts to target species in this fishery are considered in Section 5.3.3.
Santos WA has identified mackerel spawning times in Table 3-8 and Table 3-10.
Santos WA commits to ongoing engagement with identified individuals in the Mackerel Managed Fishery (Area 2) as required.
Individual licence holder (RNR Fisheries)
2 licences
This licence holder holds two Mackerel Area 2 Fishing Licences as evident in extract from the register obtained from DPIRD in September 2018.
This licence holder was provided the Keraudren Seismic Survey Revision 1 via email on October 9 2018.
This fisher was invited to a round table meeting with Santos WA to be held at WAFIC offices in Fremantle on November 22 2018 but did not attend.
No response has been received at time of EP submission.
Santos WA considers the level of consultation to be adequate and commits to ongoing consultation.
Santos Ltd | Keraudren Seismic Survey EP Summary Page 126 of 248
Stakeholder Relevance / reasoning for engagement
Summary of stakeholder and titleholder correspondence, and any objections and claims made Assessment of stakeholder objections and claims
Individual licence holder (Hadyn Webb)
3 licences
As identified in consultation with local Port Hedland stakeholders, one local commercial fisherman was identified as being active in the area.
This license holder holds three licenses in the Mackerel Managed Fishery Area 2 as evident in extract from the register obtained from DPIRD in September 2018.
This Mackerel Area 2 licence holder was contacted by phone on October 17 2018. Santos WA outlined the proposed activity via phone and the licence holder provided an explanation of his operational activities. He fishes up to the 60-m contour and identified an area intersecting with the Keraudren Seismic Survey as being of interest to his operations. Santos WA advised the area shallower than 70 m makes up approximately 10 percent of the survey area.
Santos WA provided this fisher a map of the survey area highlighting the 60 m contour via email, along with the Keraudren Seismic Survey Consultation Package Revision 2, as well as a summary of phone discussion to ensure both parties are aligned.
This licence holder responded via email on October 18 2018, acknowledging acceptance of this information, and advised this survey would intersect with important areas for his fishing operations, and he has concerns. Santos WA responded noting these concerns and committing to being in touch when additional information could be provided.
This fisher attended a round table meeting with Santos WA at WAFIC’s offices in Fremantle on November 22 2018.
Via WAFIC, this fisher received sections of the draft Keraudren Seismic Survey EP via email on November 21 2018. This included relevant parts of Section 2, Section 3, Section 4, Section 6.1, Section 6.3 and Table 8-3.
Objection or claim:
This fisher is concerned with seismic acquisition within water depth equal to or less than 60 m.
This fisher is concerned with the impact on mackerel from seismic activities.
This fisher requests ongoing engagement with Santos WA.
This individual licence holder has concerns with the Keraudren Seismic Survey where it will intersect with his fishing grounds (the portion of the survey shallower than the 60-m water depth contour).
In consultation this fisher raised concerns with:
Exclusion from fishing grounds.
Impact to mackerel species from seismic.
Santos WA has assessed these claims within this EP:
Santos WA has identified mackerel spawning times in Table 3-8 and Table 3-10.
Santos WA has addressed concerns relating to displacement from fishing zones in Section 5.3.1.
Potential impacts to fish (pelagic) and commercial fishers from seismic noise emissions are described in Section 5.3.3.
Importantly, Santos WA will not restrict commercial fishing access to the operational area and is committed to concurrent operational planning with commercial fishers.
Santos WA has made an overarching commitment that commercial fishing licence holders will be no worse off as a result of the seismic survey. Santos WA confirms that it will assess the merits of evidence-based payment claims made by commercial fishers.
Santos WA commits to ongoing engagement with this fisher.
Santos Ltd | Keraudren Seismic Survey EP Summary Page 127 of 248
Stakeholder Relevance / reasoning for engagement
Summary of stakeholder and titleholder correspondence, and any objections and claims made Assessment of stakeholder objections and claims
Santos WA followed up this phone call with an email on February 4, 2019, with the revised control measures from Keraudren Seismic Survey EP.
Santos WA followed up this correspondence with a proposed ‘Communications Protocol’ attached to an email sent on February 22, 2019.
The Licensee responded to this correspondence via email on February 25, 2019, advising he would provide vessel contact details following completion of work on his vessel. Santos WA responded noting this timeframe was no issue as survey commencement was dependant on seismic survey vessel availability and Santos WA would keep the licensee informed.
Objection or claim:
This fisher raised no objection or claim with the revision control measures and performance standards.
This fisher raised no objection or claim with the draft concurrent operations plan.
This licence holder raised no concern with the control measures and performance standards relating to compensation claims and concurrent operations planning.
Santos WA commits to ongoing engagement with this licence holder for all Santos WA activities in the Bedout Basin.
Mareterram Limited
This licence holder holds 11 Mackerel Area 2 Fishing Licences as evident in extract from the register obtained from DPIRD in September 2018.
Mareterram Limited received the Keraudren Seismic Survey Revision 1 via post on October 9 2018.
Via WAFIC, this fisher received sections of the draft Keraudren Seismic Survey EP via email on November 21 2018. This included relevant parts of Section 2, Section 3, Section 4, Section 6.1, Section 6.3 and Table 8-3.
A representative for Mareterram Limited attended the industry round table meeting at WAFIC offices on November 22 2018, and provided valuable feedback on the Mackerel Managed Fishery.
Objection or claim:
This fisher is concerned with the impact on mackerel from seismic activities.
In consultation this fisher raised concerns with:
Exclusion from fishing grounds.
Impact to mackerel species from seismic.
Santos WA has assessed these claims within this EP:
Santos WA has identified mackerel spawning times in Table 3-8 and Table 3-10.
Santos WA has addressed concerns relating to displacement from fishing zones in Section 5.3.1.
Santos Ltd | Keraudren Seismic Survey EP Summary Page 128 of 248
Stakeholder Relevance / reasoning for engagement
Summary of stakeholder and titleholder correspondence, and any objections and claims made Assessment of stakeholder objections and claims
This fisher requests ongoing engagement with Santos WA. Potential impacts to fish (pelagic) and commercial fishers from seismic noise emissions are described in Section 5.3.3.
Importantly, Santos WA will not restrict commercial fishing access to the operational area and is committed to concurrent operational planning with commercial fishers.
Santos WA has made an overarching commitment that commercial fishing licence holders will be no worse off as a result of the seismic survey. Santos WA confirms that it will assess the merits of evidence-based payment claims made by commercial fishers.
Santos WA commits to ongoing engagement with this fisher.
Santos WA followed up this phone call with an email on February 4, 2019, with the revised control measures from Keraudren Seismic Survey EP Revision 1.
Santos WA followed up this correspondence with a proposed ‘Communications Protocol’ attached to an email sent on February 22, 2019.
The Licensee responded to this correspondence via email on February 25, 2019, advising he would provide vessel contact details following completion of work on his vessel. Santos WA responded noting this timeframe was no issue as survey commencement was dependant on seismic survey vessel availability and Santos WA would keep the licensee informed.
Objection or claim:
Santos WA understand Mareterram have not previously fished in the operational area for the Keraudren Seismic Survey.
This licence holder raised no concern with the control measures and performance standards relating to compensation claims and concurrent operations planning.
Santos WA commits to ongoing engagement with this licence holder for all Santos WA activities in the Bedout Basin.
Santos Ltd | Keraudren Seismic Survey EP Summary Page 129 of 248
Stakeholder Relevance / reasoning for engagement
Summary of stakeholder and titleholder correspondence, and any objections and claims made Assessment of stakeholder objections and claims
This fisher raised no objection or claim with the revision control measures and performance standards.
This fisher raised no objection or claim with the draft concurrent operations plan.
Individual licence holder (Robert Cooper)
6 licences
This licence holder has been identified by Santos WA in relation to other offshore activities, and holds six Mackerel licences as evident in extract from the register obtained from DPIRD in September 2018.
This licence holder was provided the Keraudren Seismic Survey Revision 1 via email on October 9 2018.
This fisher was invited to a round table meeting with Santos WA to be held at WAFIC offices in Fremantle on November 22 2018 but did not attend.
No response has been received at time of EP submission.
Santos WA considers the level of consultation to be adequate and commits to ongoing consultation.
Individual licence holder (VM Filippou)
2 licences
This licence holder has been identified by Santos WA in relation to other offshore activities, and holds two Mackerel licences as evident in extract from the register obtained from DPIRD in September 2018.
This licence holder was provided the Keraudren Seismic Survey Revision 1 via email on October 9 2018.
This fisher was invited to a round table meeting with Santos WA to be held at WAFIC offices in Fremantle on November 22 2018 but did not attend.
No response has been received at time of EP submission.
Santos WA considers the level of consultation to be adequate and commits to ongoing consultation.
Nickol Bay Prawn Managed Fishery
Based on revised Fish Cube data retrieved from DPIRD, fishing effort in the Nickol Bay Prawn Managed Fishery does not intersect the operational area for this activity. Fourteen licences have been identified in an extract from the register obtained from DPIRD in September 2018.
The Keraudren Seismic Survey does not intersect the operational area for Nickol Bay Prawn, as outlined in data received from DPIRD and confirmed
Santos Ltd | Keraudren Seismic Survey EP Summary Page 130 of 248
Stakeholder Relevance / reasoning for engagement
Summary of stakeholder and titleholder correspondence, and any objections and claims made Assessment of stakeholder objections and claims
in consultation with WAFIC; therefore, engagement will not be required.
Santos WA has assessed the impact to crustaceans in Section 5.3.3.
Individual licence holder (Austfish)
11 licences
This licence holder holds 11 Nickol Bay Prawn Fishing Licences as evident in extract from the register obtained from DPIRD in September 2018.
This licence holder was provided the Keraudren Seismic Survey Revision 1 via email on October 9 2018.
No response has been received at time of EP submission.
The Keraudren Seismic Survey does not intersect the operational area for Nickol Bay Prawn, as outlined in data received from DPIRD and confirmed in consultation with WAFIC; therefore further engagement will not be required.
Individual licence holder (Simpson Seafoods)
1 license
This licence holder holds 1 Nickol Bay Prawn Fishing Licence as evident in extract from the register obtained from DPIRD in September 2018.
This licence holder was provided the Keraudren Seismic Survey Revision 1 via email on October 9 2018.
No response has been received at time of EP submission.
The Keraudren Seismic Survey does not intersect the operational area for Nickol Bay Prawn, as outlined in data received from DPIRD and confirmed in consultation with WAFIC; therefore further engagement will not be required.
Individual licence holder (Seafresh Holdings)
1 licences
This licence holder holds 1 Nickol Bay Prawn Fishing Licence as evident in extract from the register obtained from DPIRD in September 2018.
This licence holder was provided the Keraudren Seismic Survey Revision 1 via email on October 9 2018.
This stakeholder will be engaged via their PFTIMF licences.
Refer to above.
Santos WA is engaging Seafresh Holdings via their activities in the PFTIMF.
Individual licence holder
This licence holder holds 1 Nickol Bay
This licence holder was provided the Keraudren Seismic Survey Revision 1 via post on October 9 2018.
The Keraudren Seismic Survey does not intersect the operational area for Nickol Bay Prawn, as
Santos Ltd | Keraudren Seismic Survey EP Summary Page 131 of 248
Stakeholder Relevance / reasoning for engagement
Summary of stakeholder and titleholder correspondence, and any objections and claims made Assessment of stakeholder objections and claims
(EA Morrison and SD Bransby)
1 licences
Prawn Fishing Licence as evident in extract from the register obtained from DPIRD in September 2018.
No response has been received at time of EP submission. outlined in data received from DPIRD and confirmed in consultation with WAFIC; therefore further engagement will not be required.
Pilbara Fish Trawl Interim Managed Fishery (PFTIMF)
Based on Fish Cube data retrieved from DPIRD, Santos WA understands the PFTIMF has had one or two boats, only, active over the operational area since 2015, and one to three vessels over the area between 2013-2014.
Two key fishers hold or lease all 11 of the PFTIMF licences. All have been engaged by phone and email, and via WAFIC, as outlined below.
According to Fish Cube data the PFTIMF total fishing effort area over the West Australian coast was 23,012 km2 from 2013 to 2017. The Keraudren Seismic Survey operational area overlaps with 5,713 km2 or 24.8% of this total area of fishing effort.
Individual licence holder (Seafresh Holdings trading as Westmore Seafoods)
3 licences
Lease 1 license
This licence holder has been identified by Santos WA in relation to other offshore activities, and holds three PFTIMF licences and leases on additional license as evident in extract from the register obtained from DPIRD in September 2018.
This licence holder was provided the Keraudren Seismic Survey Revision 1 via email on October 9 2018.
Voice mails were left for a Westmore Seafood representative on October 12 and October 25 2018, and phone contact was made on October 31 2018.
A resultant meeting with Santos WA and Westmore Seafoods representatives was held on November 5 2018. Santos WA and Westmore both respectively provided an overview of their current and forward-looking operations to 2019. Westmore raised concern with:
Displacement/ disruption to operations from seismic.
Long-term impact on fishery.
Santos WA followed this meeting with an email on November 6 2018, noting key points raised in the meeting and requesting Westmore confirm Santos WA’s understanding.
Westmore Seafoods has raised concerns with the Keraudren Seismic Survey in consultation, which Santos WA has addressed as follows:
Santos WA has assessed Westmore’s concern regarding disruption or displacement of operations in Section 5.3.1.
Santos WA has assessed the impact to fish, including key demersal species targeted by the PFTIMF, in Section 5.3.3.
Santos WA has identified key spawning times of key indicator species for this fishery in Table 3-8 and Table 3-10.
Santos WA acknowledges Westmore’s concern with lack of research available on impacts to demersal fish. Santos WA has referenced available and relevant research in Section 5.3.3.
Santos Ltd | Keraudren Seismic Survey EP Summary Page 132 of 248
Stakeholder Relevance / reasoning for engagement
Summary of stakeholder and titleholder correspondence, and any objections and claims made Assessment of stakeholder objections and claims
Santos WA followed this email with a phone call and text message on November 8 2018. Westmore Seafoods responded via email on November 12 2018, advising Santos WA full response would be provided in the coming days.
Santos WA responded noting planned submission time for EP and advising consultation would be ongoing outside the EP process.
Westmore Seafoods responded on November 18 2018, adding to notes from the meeting held on November 6 2018. Key claims raised in this correspondence are listed below.
This fisher requested all future engagement on this activity occur through WAFIC.
This fisher was invited to a round table meeting with Santos WA at WAFIC offices in Fremantle on November 22 2018 but could not attend.
Via WAFIC, this fisher received sections of the draft Keraudren Seismic Survey EP via email on November 21 2018. This included relevant parts of Section 2, Section 3, Section 4, Section 6.1, Section 6.3 and Table 8-3.
Objection and claim:
Westmore Seafoods are concerned about disruption and displacement to operations.
Westmore Seafoods are concerned with the potential long-term impact on their fishery.
Westmore Seafoods are concerned about impacts of seismic surveys on demersal and semi-demersal schooling species, the fish resource and its biodiversity.
Westmore Seafoods are concerned about impacts on spawning of key indicator species.
Importantly, Santos WA will not restrict commercial fishing access to the operational area (refer to Section 5.3.1), and is committed to concurrent operational planning with commercial fishers.
Santos WA has made an overarching commitment that commercial fishing licence holders will be no worse off as a result of the seismic survey. Santos WA confirms that it will assess the merits of evidence-based payment claims made by commercial fishers.
Westmore Seafoods is receptive to ongoing consultation with Santos WA via WAFIC, and Santos WA is committed to ongoing stakeholder engagement.
Santos Ltd | Keraudren Seismic Survey EP Summary Page 133 of 248
Stakeholder Relevance / reasoning for engagement
Summary of stakeholder and titleholder correspondence, and any objections and claims made Assessment of stakeholder objections and claims
Westmore Seafoods are concerned about the lack of research on the impacts of seismic of demersal fish.
Westmore Seafoods are concerned about the timing of the survey, particularly ahead of the Easter period which is a productive time for their fishery.
Santos WA has continued to engage Westmore Seafoods via phone and email to obtain additional fishing catch and effort data. This commenced via email on November 27 2018, when Santos WA provided paperwork Westmore Seafoods were required to sign and provide to DPIRD allowing confidential fishing catch and effort data to be retrieved.
Westmore Seafoods provided signed paperwork on January 10 2019, which Santos WA forwarded to DPIRD. Santos WA confirmed with Westmore Seafoods via email on January 10 and 14 2019, DPIRD had received signed paperwork from Westmore Seafoods and would provide fishing catch and effort data directly to Westmore Seafoods to pass on to Santos WA at their discretion.
No further correspondence from Westmore Seafoods has been received.
No direct objection or claim on the seismic survey was received in this correspondence.
Santos has made reasonable efforts to obtain fishing catch and effort data from Westmore Seafoods and has not received this data at time of EP submission.
Santos has identified data from DPIRD containing indicative fishing effort/catch, hence, less importance on the fishers data for the impact assessment. See Figure 3-9 and Figure 3-10.
Santos notes PFTIMF catch and effort data may be relevant for future commercial claims, therefore will continue to engage with Westmore Seafoods to obtain this data.
Santos Ltd | Keraudren Seismic Survey EP Summary Page 134 of 248
Stakeholder Relevance / reasoning for engagement
Summary of stakeholder and titleholder correspondence, and any objections and claims made Assessment of stakeholder objections and claims
Santos WA attempted to contact this fisher by phone on February 5, 2019. Fisher indicated in SMS response email contact was preferred.
Santos WA emailed Westmore Seafoods on February 6, 2019, the revised control measures from Keraudren Seismic Survey EP.
Santos WA attempted to contact this fisher by phone on February 13, 2019. Santos WA followed up with Westmore Seafoods via email on February 13, 2019, to advise Santos WA was meeting MG Kailis on the topic.
Westmore Seafoods responded via email on February 13, 2019, advising Westmore Seafoods are in constant contact with MG Kailis on the matter and MG Kailis views are consistent with their own. Westmore advised available to meet with Santos WA representatives.
Santos WA responded via email on February 13, 2019, with proposed meeting time. No response received.
Santos WA sent a follow up email on February 22, 2019, with a proposed ‘Communications Protocol’. No comment has been received from this license holder to date.
Santos WA attempted to contact this license holder by phone on February 26, 2019, and sent an SMS referring to previous emails and offering to meet Westmore Seafoods anytime to discuss.
Objection and claim:
This fisher claimed Westmore Seafoods views are consistent with the views of MG Kailis.
This fisher raised no objection or claim with the revision control measures and performance standards.
This fisher raised no objection or claim with the draft concurrent operations plan.
As the licence holder (Westmore Seafoods) claims that their views are consistent with the views of MG Kailis, refer to MG Kailis engagement above.
This licence holder has raised no further concerns.
Santos WA commits to ongoing engagement with this licence holder for all Santos WA activities in the Bedout Basin.
Santos Ltd | Keraudren Seismic Survey EP Summary Page 135 of 248
Stakeholder Relevance / reasoning for engagement
Summary of stakeholder and titleholder correspondence, and any objections and claims made Assessment of stakeholder objections and claims
Individual licence holder (MG Kailis)
5 licences
Lease a further 2 licences
This licence holder has been identified by Santos WA in relation to other offshore activities, and holds five and leases two PFTIMF licences as evident in extract from the register obtained from DPIRD in September 2018.
This licence holder was provided the Keraudren Seismic Survey Revision 1 via email on October 9 2018.
Voice mails have been left for a Kailis representative on October 9 and October 12 2018.
Santos WA contacted an alternative Kailis contact via email on October 25 2018, and again on November 6 2018, where an Operational Manager requested the information via email and committed to passing the information on to relevant personnel. MG Kailis Operations Manager provided an overview of operations in the PFTIMF, noting Area 1 and Area 2 as key zones fished by MG Kailis within the PFTIMF given their proximity to port. Neither of these areas intersect the Keraudren Seismic Survey. Santos WA offered to meet at the MG Kailis offices to discuss the Keraduren Seismic Survey.
Santos WA followed up this conversation with a phone call on November 8 2018. MG Kailis confirmed information was received and that MG Kailis understood the proposal. MG Kailis wished to further discuss the information internally, with the relevant vessel skipper, before committing to meet with Santos WA. Santos WA accepted this strategy and committed to meet with Kailis whenever appropriate.
Santos WA followed this phone conversation with an email, on November 8 2018, advising MG Kailis on planned EP submission timing and advised consultation with MG Kailis would be ongoing until activity commencement, regardless of the EP submission and assessment process.
Via WAFIC, this fisher received sections of the draft Keraudren Seismic Survey EP via email on November 21 2018. This included relevant parts of Section 2, Section 3, Section 4, Section 6.1, Section 6.3 and Table 8-3.
This fisher attended a round table meeting with Santos WA at WAFIC offices on November 22 2018.
MG Kailis have raised concerns with the Keraudren Seismic Survey in consultation, which Santos WA has addressed in the above WAFIC and Westmore Seafoods sections.
Santos Ltd | Keraudren Seismic Survey EP Summary Page 136 of 248
Stakeholder Relevance / reasoning for engagement
Summary of stakeholder and titleholder correspondence, and any objections and claims made Assessment of stakeholder objections and claims
Objection or claim:
As a WAFIC member at the roundtable meeting, MG Kailis claimed that their position is that they agree with Westmore Seafood’s written comments to Santos WA, plus the issues raised by MG Kailis in the WAFIC meeting. Refer to WAFIC and Westmore objections and claims within this table.
Santos WA has continued to engage MG Kailis via phone and email to obtain additional fishing catch and effort data. This commenced via email on November 27 2018, when Santos WA provided paperwork MG Kailis were required to sign and provide to DPIRD allowing confidential fishing catch and effort data to be retrieved.
In phone consultation on December 17 2018, MG Kailis confirmed the fishing catch and effort data had been received from DPIRD however MG Kailis in house data did not align with that received from DPIRD. MG Kailis needed to conduct further analysis of the data prior to providing to Santos WA.
Santos WA has continued to engage MG Kailis via phone and email to obtain additional fishing catch and effort data. In phone engagement on January 15 2019, MG Kailis advised additional time was required to obtain the data from licenses leased, not owned, by MG Kailis.
No direct objection or claim on the seismic survey was received in this correspondence.
Santos has made reasonable efforts to obtain fishing catch and effort data from MG Kailis and has not received this data at time of EP submission.
Santos has identified data from DPIRD containing indicative fishing effort/catch, hence, less importance on the fishers data for the impact assessment. See Figure 3-9 and Figure 3-10.
Santos notes PFTIMF catch and effort data may be relevant for future commercial claims, therefore will continue to engage with MG Kailis to obtain this data.
An MG Kailis operations representative was contacted by phone on February 5, 2019, to discuss how the Keraudren Seismic Survey approval was progressing and preferred methods of ‘on-the-water’ communication.
A different MG Kailis representative was contacted by phone on February 6, 2019, to discuss how the Keraudren Seismic Survey approval was
Following on from meeting with and feedback from MG Kailis Santos acknowledge the points raised by G. Kailis.
Santos WA commit to providing MG Kailis a pre-commencement notification once dates are confirmed, as early as possible prior to survey commencement, recognising that changing dates can
Santos Ltd | Keraudren Seismic Survey EP Summary Page 137 of 248
Stakeholder Relevance / reasoning for engagement
Summary of stakeholder and titleholder correspondence, and any objections and claims made Assessment of stakeholder objections and claims
progressing and that some control measures, previously provided with the Environment Plan in November 2018, had been revised.
Santos WA followed up this phone call with an email on February 6, 2019, with the revised control measures from Keraudren Seismic Survey EP.
MG Kailis replied via email on February 11, 2019, noting the control measures cover physical displacement and temporary loss, however do not cover the potential for long term impact. Santos WA followed up with MG Kailis in a phone conversation on February 11, 2019, to arrange a meeting.
Santos WA EVP and other representatives met with MG Kailis on February 14, 2019, to discuss the Keraudren Seismic Survey. Meeting notes are attached and MG Kailis claims are outlined below. Santos WA provided these meeting notes to MG Kailis via email on February 21, 2019. MG Kailis responded with additional claims, via email on March 1, 2019. Santos WA responded to this email on 6/3/19.
Santos WA sent a follow up email to a MG Kailis operations representative on February 22, 2019, with a proposed ‘Communications Protocol’. MG Kailis operations representative followed this email up with a phone call on February 22, 2019, advising providing vessel contact details should not be a problem. Santos WA have not received a response to this email to date.
Objection or claim:
MG Kailis claim Santos WA have adequately addressed direct impacts (temporary loss) in their performance standards and control measures.
MG Kailis claim the administrative arrangements outlined (within the control measures) were overly complex and a more practical approach is needed.
be disruptive and have an impact on MG Kailis’ business.
Santos WA have reviewed the administrative arrangements outlined in the EP. The control measure and standards presented in the EP have been developed as a common framework to provide a reasonable level of detail to the Regulator and the fishers. The administrative arrangements are similar to those included in the accepted Santos’ Bethany Environment Plan, and peer reviewed by CSIRO.
Santos WA acknowledge that MG Kailis have concerns regarding longer term impact and Kailis may make a claim for potential future loss within 12 months of completion of the survey. Santos WA will assess the merit of all claims lodged, and honour agreements reached with individual commercial fishers.
The performance standards in the environment plan provide for agreements to be reached with individual commercial fishers, as communicated in meeting held on February 14, 2019 and verified via email on March 6, 2019. More practical arrangements with MG Kailis can be implemented through this mechanism.
Santos Ltd | Keraudren Seismic Survey EP Summary Page 138 of 248
Stakeholder Relevance / reasoning for engagement
Summary of stakeholder and titleholder correspondence, and any objections and claims made Assessment of stakeholder objections and claims
MG Kailis claim it is difficult for fishers to assess and advise of likely impacts well in advance, given titleholders do not typically advise of definite commencement dates well in advance of operations.
MG Kailis claim Santos should give notice of the survey only when dates are confirmed, to avoid unnecessary costs to the fisher.
MG Kailis claim impacts to operations vary depending on factors such as the fishing season, weather and licence limitations.
MG Kailis claim long term loss is not addressed adequately in the EP and MG Kailis are concerned MG Kailis would be forced to lodge a compensation claim in 12 months, even if it was uncertain whether a (future) loss had occurred or the extent of any (future) loss.
MG Kailis claim a long term loss to the fishery may not be apparent in the first 12 months. The recruitment times for the longer lived species are up to four years.
MG Kailis claim an appropriate agreement, should long term impacts to the fishery be identified, would lie outside the scope of the Environment Plan.
Pilbara Line Managed Fishery
Based on Fish Cube data retrieved from DPIRD, Santos WA understands the Pilbara Line Managed Fishery has had activity in the southern half of the survey area.
There are nine licenses in the Pilbara Line Fishery, held by seven individuals.
Santos WA has additional contact details on file for five of the seven Pilbara Line Fishery licence holders. Where possible fishers have been engaged by phone and/or email as listed below.
According to Fish Cube data the Pilbara Line Managed Fishery area of fishing effort was 134,318 km2 from 2013 to 2017. The Keraudren Seismic Survey operational area overlaps with 5,553 km2 or 4.1% of the total area of effort.
Individual licence holder (Fat Marine)
2 licences
This licence holder has been identified by Santos WA in relation to other
This licence holder was provided the Keraudren Seismic Survey Revision 1 via email on October 9 2018.
Voice mails were left for this fisher on October 9 and October 16 2018.
Fat Marine raised concerns with all offshore seismic proposals.
Fat Marine raised the following concerns with the Keraudren Seismic Survey:
Santos Ltd | Keraudren Seismic Survey EP Summary Page 139 of 248
Stakeholder Relevance / reasoning for engagement
Summary of stakeholder and titleholder correspondence, and any objections and claims made Assessment of stakeholder objections and claims
offshore activities, and holds two Pilbara Line licences.
Phone consultation was held on November 15 2018, and Fat Marine and Santos WA organised to meet next time Fat Marine were in Perth.
In phone consultation, Fat Marine raised concerns with displacement, noting while he has not fished in this area in the past he was hoping to fish there in 2019. Fat Marine also raised concern with the long-term impact of seismic on the fishery.
Santos WA queried what outcomes would suit Fat Marine in view of working toward concurrent operations if required. Fat Marine advised receiving daily updates from seismic vessel can help reduce impact.
This fisher was invited to a round table meeting with Santos WA at WAFIC offices in Fremantle on November 22 2018, but could not attend.
Santos WA has engaged Fat Marine by phone on November 28 2018, offering the Santos WA offices to meet while a representative was in Perth. Fat Marine did not take up this offer.
Objection and claim:
Fat Marine claims concern with all offshore seismic activities.
Fat Marine has concerns with long-term impacts of seismic activity on fisheries.
Fat Marine has concerns with potential displacement from the seismic survey area in 2019.
Fat Marine advised daily location updates from seismic vessel can assist in concurrent operations.
Potential displacement from fishing grounds in 2019.
Potential long-term impacts to the fishery.
Santos WA has assessed these claims within this EP as follows:
Santos WA has identified key spawning times of key indicator species for this fishery in Table 3-8 and Table 3-10.
While Fat Marine has not fished in the operational area to date, commercial fishing disruption and displacement is assessed in Section 5.3.1.
Santos WA has assessed the impact to fish, including key demersal species targeted by the line fishers, in Section 5.3.3.
Importantly, Santos WA will not restrict commercial fishing access to the operational area (refer to Section 5.3.1), and is committed to concurrent operational planning (including daily vessel location updates) with commercial fishers.
Santos WA has made an overarching commitment that commercial fishing licence holders will be no worse off as a result of the seismic survey. Santos WA confirms that it will assess the merits of evidence-based payment claims made by commercial fishers.
Santos WA commits to ongoing engagement with this fisher via phone or email to provide survey commencement timing.
Santos Ltd | Keraudren Seismic Survey EP Summary Page 140 of 248
Stakeholder Relevance / reasoning for engagement
Summary of stakeholder and titleholder correspondence, and any objections and claims made Assessment of stakeholder objections and claims
This licensee was contacted by SMS on February 5, 2019, to query if Fat Marine had plans to fish in the proposed operational area for the Keraudren Seismic Survey in 2019, and if Fat Marine wished to receive ongoing correspondence about the activity. Santos WA advised could phone or email Fat Marine anytime, and would be in Exmouth on a nominated date if a representative wished to meet.
No response has been received to date.
Santos WA note Fat Marine has not fished in the Keraudren Seismic Survey operational area to date.
This license holder has not requested additional information on this activity, however Santos WA commit to keeping this licence holder informed on the progress of this activity.
Individual licence holder (MG Kailis)
2 licences
This licence holder has been identified by Santos WA in relation to other offshore activities, and holds two Pilbara Line licences.
This licence holder was provided the Keraudren Seismic Survey Revision 1 via email on October 9 2018.
Santos WA is continuing to engage this fisher based on licenses held in the PFTIMF.
Refer to PFTIMF sections above.
Santos WA is continuing to engage this fisher based on licenses held in the PFTIMF.
This licence holder has been identified by Santos WA in relation to other offshore activities, and holds one Pilbara Line licences.
This licence holder was provided the Keraudren Seismic Survey Revision 1 via email on October 9 2018.
This fisher was invited to a round table meeting with Santos WA at WAFIC offices in Fremantle on November 22 2018. The fisher did not attend.
No response has been received at time of EP submission.
Santos WA considers the level of consultation to be adequate and commits to ongoing consultation.
Individual licence holder (Haydn Webb)
1 licence
This licence holder has been identified by Santos WA in relation to other offshore activities, and holds one Pilbara Line licences.
This licence holder was provided the Keraudren Seismic Survey Revision 1 via email on October 9 2018.
In phone consultation October 17 2018, this fisher indicated his active Mackerel Area 2 licences were his focus.
This fisher attended a round table meeting with Santos WA at WAFIC offices on November 22 2018.
Refer to Mackerel Managed Fishery (Area 2) sections above.
Santos Ltd | Keraudren Seismic Survey EP Summary Page 141 of 248
Stakeholder Relevance / reasoning for engagement
Summary of stakeholder and titleholder correspondence, and any objections and claims made Assessment of stakeholder objections and claims
Individual licence holder (VM Filippou)
1 licence
This licence holder has been identified by Santos WA in relation to other offshore activities, and holds one Pilbara Line licences.
This licence holder was provided the Keraudren Seismic Survey Revision 1 via email on October 9 2018.
This fisher was invited to a round table meeting with Santos WA at WAFIC offices in Fremantle on November 22 2018, but did not attend.
No response has been received at time of EP submission.
Santos WA considers the level of consultation to be adequate and commits to ongoing consultation.
Individual licence holder (Leigh Mitchell)
1 licence
This licence holder holds one Pilbara Line licence as evident in extract from the register obtained from DPIRD in September 2018.
As no additional contact details for this individual were available, this listed licence holders was provided the Keraudren Seismic Survey Revision 1 via post on October 9 2018.
This fisher was invited to a round table meeting with Santos WA at WAFIC offices in Fremantle on November 22 2018, but did not attend.
No response has been received at time of EP submission.
Santos WA considers the level of consultation to be adequate and commits to ongoing consultation.
Individual licence holder (David Dyson)
1 licence
This licence holder holds one Pilbara Line licence as evident in extract from the register obtained from DPIRD in September 2018.
As no additional contact details for this individual were available, this listed licence holders was provided the Keraudren Seismic Survey Revision 1 via post on October 9 2018.
No response has been received at time of EP submission.
Santos WA considers the level of consultation to be adequate and commits to ongoing consultation.
Pilbara Trap Managed Fishery
Based on Fish Cube data retrieved from DPIRD, Santos WA understands the Pilbara Trap Managed Fishery has had one or two boats, only, active over the operational area since 2013.
Six licenses in the Pilbara Trap Fishery are held by two individual companies, all have been engaged by phone and email as listed below.
Based on Fish Cube data the Pilbara Trap Fishery area of fishing effort, from 2013-2017, over the West Australian coast was 84,084 km2. The Keraudren Seismic Survey operational area overlaps with 10,690 km2 or 12.7% of this total area of effort.
Santos Ltd | Keraudren Seismic Survey EP Summary Page 142 of 248
Stakeholder Relevance / reasoning for engagement
Summary of stakeholder and titleholder correspondence, and any objections and claims made Assessment of stakeholder objections and claims
Individual licence holder (Old Brown Dog)
3 licences
This licence holder has been identified by Santos WA in relation to other offshore activities, and holds three PFTIMF licences and leases on additional license as evident in extract from the register obtained from DPIRD in September 2018.
This licence holder was provided the Keraudren Seismic Survey Revision 1 via email on October 9 2018.
In phone consultation on October 12 2018, this fisher indicated no comment on the activity would be provided and agreed to receiving updates on survey timing via email. This fisher does not support seismic activities offshore.
Via WAFIC, this fisher received sections of the draft Keraudren Seismic Survey EP via email on November 21 2018. This included relevant parts of Section 2, Section 3, Section 4, Section 6.1, Section 6.3 and Table 8-3.
This fisher attended a round table meeting with Santos WA at WAFIC offices on November 22 2018.
Objection or claim:
The stakeholder made no claim regarding the Keraudren Seismic Survey in phone consultation.
Refer to the above WAFIC round table meeting objections and claims.
Santos WA acknowledges that this fisher does not support offshore seismic activities.
WAFIC members at the round table meeting raised concerns with the Keraudren Seismic Survey, which Santos WA has addressed in the WAFIC section of this table.
Santos WA will continue to engage with this fisher through WAFIC.
This Pilbara Trap licence holder was contacted by phone SMS on February 4, 2019, and followed up with an email on February 4, 2019, with the revised control measures from Keraudren Seismic Survey EP.
The Pilbara Trap licence holder responded via email on February 6, 2019, and noted emailed was received and there were no issues at this time.
Santos WA followed up this correspondence with a proposed ‘Communications Protocol’ attached to an email sent on February 22, 2019. Santos WA followed this up with an SMS, to advise the licensee an email had been sent. No response has been received to date.
SMS has been identified at this licensees preferred method of communication.
This Pilbara Trap licence holder has confirmed information regarding control measures and performance standards, relating to compensation claims and concurrent operations planning, have been received and raised no concern.
Santos WA commits to ongoing engagement with this licence holder for all Santos WA activities in the Bedout Basin.
Santos Ltd | Keraudren Seismic Survey EP Summary Page 143 of 248
Stakeholder Relevance / reasoning for engagement
Summary of stakeholder and titleholder correspondence, and any objections and claims made Assessment of stakeholder objections and claims
Objection or claim:
This fisher raised no objection or claim with the revision control measures and performance standards.
This fisher raised no objection or claim with the draft concurrent operations plan.
Individual licence holder (Seafresh Holdings)
3 licences
This licence holder has been identified by Santos WA in relation to other offshore activities, and holds three PFTIMF licences and leases on additional license as evident in extract from the register obtained from DPIRD in September 2018.
This licence holder was provided the Keraudren Seismic Survey Revision 1 via email on October 9 2018.
The stakeholder has been engaged as license holder in the Pilbara Trawl Interim Managed Fishery.
Refer to PFTIMF sections above.
Refer to PFTIMF sections above. Refer to PFTIMF sections above.
Santos Ltd | Keraudren Seismic Survey EP Summary Page 144 of 248
4.2 Ongoing Consultation Stakeholder consultation for this activity will be ongoing and Santos WA will work with stakeholders to address any future concerns if they arise throughout the duration of the EP. Should any new stakeholders be identified, they will be added to the stakeholder database and included in all future correspondence as required, including specific activity notifications.
Santos WA, as a marine user, understands there will be the need to interact and communicate with other marine users to ensure mutual and individual stakeholder goals are met. Santos WA has identified the need for ongoing engagement with the fishing industry and has committed to this engagement.
Prior to mobilisation, Santos WA will provide a notification to relevant stakeholders. Stakeholders who receive this notification document will be based on Santos WA’s stakeholder list at the time (refer Table 4-1). The notification will include information on specific timing, vessel location and vessel details.
4.2.1 Stakeholder Notifications Prior to mobilisation, Santos WA will provide a notification to relevant stakeholders. Stakeholders who receive this notification document will be based on Santos WA’s stakeholder list at the time. The notification will include information on specific timing, vessel location and vessel details.
4.2.2 Quarterly Consultation Update Activities covered under this EP will be included in Santos WA’s Quarterly Consultation Updates until they can be listed as a ‘completed activity’, with updates scheduled for approximately March, June, September and December annually.
The Keraudren Seismic Survey was included in Santos WA’s Quarterly Consultation Update distributed on December 17 2018. No comments regarding the Keraudren Seismic Survey were received in response to this consultation. Note stakeholders listed in Table 4-1 who received a Quarterly Consultation Update did so as supplement to keep them informed on upcoming activities, as each of these stakeholders were also engaged on the Keraudren Seismic Survey.
4.3 OPEP Consultation In preparing the oil pollution emergency plan (OPEP), several parties are identified to provide spill response services and actions to support the implementation of the OPEP. These OPEP stakeholders are identified through evaluation of the activity and spill potential for all Santos WA OPEPs, including the Keraudren Seismic Survey Oil Pollution Emergency Plan (QE-91-RI-20012.02).
Consultation, agreements or contracts have been put into place with agencies and organisations throughout the development of Santos WA oil spill response strategies and tactics so that roles and responsibilities are understood and accepted as outlined in Table 3-3.
Table 4-3: OPEP consultation summary
Engaged with Assessment of consultation undertaken
Function Stakeholder
Australian Marine Oil Spill Centre (AMOSC)
Historically AMOSC reviewed Oil Spill Contingency Plans (OSCPs) and OPEPs and are satisfied with the description of their support. AMOSC now request to only view OPEPs once they are accepted by the regulator and before the activity commences. Roles and responsibilities defined in the OPEP reflect the arrangements established under contract conditions as a Participating Member of AMOSC under the AMOSCPlan.
Santos Ltd | Keraudren Seismic Survey EP Summary Page 145 of 248
Engaged with Assessment of consultation undertaken
Function Stakeholder
Australian Marine Safety Authority (AMSA)
Historically AMSA reviewed OPEPs and are satisfied with the description of their support. AMSA now request to only view OPEPs once they are accepted by the regulator and before the activity commences. Roles and responsibilities defined in the OPEP reflect the arrangements established within a Memorandum of Understanding (MOU) between AMSA and Santos WA. Santos WA continue to undertake an annual workshop with AMSA as required under Sections 22 and 24 of the Santos WA/AMSA MOU. This enables the open flow of information relevant to the oil spill response arrangements: Ongoing consultation and cooperation AMSA and the titleholder will nominate contact points for the ongoing management of this MOU. AMSA and the Titleholder agree to maintain a cooperative approach to preparing and responding to marine pollution incidents, including the open exchange of information and technical advice. AMSA will facilitate an annual workshop to provide an open forum to exchange information on best practice and review and update operational procedure.
Logistics provider CH Robinson CH Robinson provide a global freight forwarding service under contract conditions to Santos WA. All arrangements defined in the OPEP reflecting freight forwarding services reflect contracted services.
Toll Logistics Toll Logistics operate under contract conditions with Santos WA. All arrangements defined in the OPEP nominating Toll Logistics reflect contracted services.
Field support organisation
Exmouth Freight & Logistics Services (EF&LS)
EF&LS operate under contract conditions with Santos WA. All arrangements defined in the OPEP nominating EF&LS reflect contracted services.
Department of Environmental Regulation (DER) (Waste Management Branch)
The DER Waste Management Branch have reviewed and have had input in defining the Waste Management Plan contained in Santos WA OSCP/OPEPs. The waste management processes do not change between OPEPs, so the original consultation is sufficient for the OPEP.
Department of Biodiversity, Conservation and Attractions (DBCA)
DBCA contributed to development of the WA Oiled Wildlife Response Plan (OWRP) defined in the OPEP. Descriptions of the Santos WA interface with the WAOWRP contained within the OPEP are consistent with the intent of DBCA (and AMOSC) for oiled wildlife response. No further consultation is required.
Department of Transport (Hazard Management Authority)
All roles and responsibilities defined within the OPEP for DoT reflect the arrangements for the Westplan MOP as further defined by the DoT Offshore Petroleum Industry Guidance Note, Marine Oil Pollution: Response and Consultation Arrangements. Consultation was conducted with the DoT as per their Industry Guidance Note on November 12 2018, and Santos WA continues ongoing consultation with DoT on all Santos WA activities as per DoT’s Industry Guidance Note.
Santos Ltd | Keraudren Seismic Survey EP Summary Page 146 of 248
Engaged with Assessment of consultation undertaken
Function Stakeholder
Oil Spill Response Limited (OSRL) OSRL operate under contract conditions with Santos WA. All arrangements defined in the OPEP nominating OSRL reflect contracted services.
Vessel providers Go Marine Go Marine operate under contract conditions with Santos WA. All arrangements defined in the OPEP nominating Go Marine reflect contracted services.
Jet Wave Marine (JWM)
JWM operate under contract conditions with Santos WA. All arrangements defined in the OPEP nominating JWM reflect contracted services.
Bhagwan Marine Bhagwan Marine operate under contract conditions with Santos WA. All arrangements defined in the OPEP nominating Bhagwan Marine reflect contracted services.
Aircraft providers Aircraft providers operate under contract conditions with Santos WA. All arrangements defined in this OPEP nominating aircraft providers reflect contracted services.
Spill modelling provider
RPS APASA APASA operate under contract conditions with Santos WA. All arrangements defined in the OPEP nominating APASA reflect contracted services.
Waste contractor North West Alliance (NWA)
NWA operate under contract conditions with Santos WA. All arrangements defined in the OPEP nominating NWA reflect contracted services.
The OPEP will be revised and updated should a stakeholder’s position change after acceptance of the Keraudren Seismic Survey Oil Pollution Emergency Plan (QE-91-RI-20012.02).
Santos Ltd | Keraudren Seismic Survey EP Summary Page 147 of 248
5. Environmental Assessment
Santos WA operates under an overarching risk management policy (QE-91-IF-10050). The risk management framework (QE-91-IF-10051) underpins the risk management policy and is consistent with the requirements of AS/NZS ISO 31000 Risk Management – Guidelines (2018). The approach can be mapped to the requirements of the OPGGS (E) Regulations for an EP, as described by NOPSEMA (N4700-GN1074 Rev 1 2013). The key steps are illustrated in Figure 5-1.
Figure 5-1: Environmental impact and risk assessment process Environmental impact and risk assessment workshops were held on 26 September 2018 and 25 October 2018 which involved participants from the HSE and exploration departments, and specialist environmental consultants. The workshop actions were minuted and there was continual liaison with the business units to refine activity description, consequence assessments and determine suitable control measures and these were considered when preparing the EP. An assessment against the activity was undertaken and the environmental events identified. The risk assessment identified seven potential unplanned events and six planned events. The extent of actual or potential impacts from each planned or unplanned event is assessed using, where required, modelling (e.g. hydrocarbon spills) and scientific reports. The duration of the event is also described including the potential duration of any impacts should they occur. The consequence level of the impact is then determined for each planned and unplanned event based on the severity of the impact to relevant receptor. This process determines a consequence level based on set criteria for each receptor category and takes into consideration the duration and extent of the impact, receptor recovery time and the effect of the impact at a population, ecosystem or industry level. The consequence definitions are outlined in Table 5-1.
Santos Ltd | Keraudren Seismic Survey EP Summary Page 148 of 248
Table 5-1: Consequence level description
Consequence Level Consequence Level Description
A Negligible No impact or negligible impact. Environmental impact lasting days up to 1 week.
B Minor Detectable but insignificant change to local population, industry or ecosystem factors. Environmental impact lasting weeks up to 12 months.
C Moderate Significant impact to local population, industry or ecosystem factors. Environmental impact lasting 1 to 10 years.
D Major Major long-term effect on local population, industry or ecosystem factors. Environmental impact lasting 10 to 20 years.
E Critical Complete loss of local population, industry or ecosystem factors AND/ OR major wide-spread regional impacts with slow recovery to no full recovery. Environmental impact lasting more than 20 years to no recovery.
For unplanned events, a risk ranking is also determined using an assessment of the likelihood (likelihood ranking) of the event as well as the consequence level of the potential impact should that event occur. A description of the likelihood Risk Matrix used is shown in Table 5-2.
Table 5-2: Likelihood description
No. Matrix Description
5 Probable 1. Event has occurred frequently within the Company. 2. Between 1 and 10 incidents every 10 years (i.e. up to frequency 1/year).
4 Likely 1. Event has occurred frequently within the Industry. 2. Between 1 and 10 incidents every 100 years (i.e. up to frequency 10-1/year).
3 Unlikely 1. Event has occurred occasionally within the Company. 2. Between 1 and 10 incidents every 1000 years (i.e. up to frequency 10-2/year).
2 Very Unlikely
1. Has occasionally occurred within the Industry. 2. Between 1 and 10 incidents every 10,000 years (i.e. up to frequency 10-3/year).
1 Rare 1. Could happen under exceptional circumstances only. 2. Between 1 and 10 incidents every 100,000 years (i.e. up to frequency 10-4/year).
Risk rankings (consequence x likelihood) are assigned in accordance with the Risk Matrix as shown in Figure 5-2.
Santos Ltd | Keraudren Seismic Survey EP Summary Page 149 of 248
SEVERITY
Negligible Minor Moderate Major Critical
LIKE
LIHO
OD
5. Probable
4. Likely
3. Unlikely
2. Very Unlikely
1. Rare
Figure 5-2: Risk matrix
For each planned and unplanned event, a set of Environmental Performance Outcome(s), Environmental Performance Standards and Measurement Criteria are identified. The definitions of the performance outcomes, standards and measurement criteria are consistent with the OPGGS(E)R. For planned and unplanned events, an ALARP and Acceptability assessment is also undertaken.
5.1 Acceptability Evaluation Santos WA considers an impact or risk associated with the proposed activity to be acceptable if the following criteria are met:
• The consequence of a planned event is ranked as A or B; or a risk of impact from an unplanned event is ranked low to medium.
• An assessment has been completed to determine if further information/studies are required to support or validate the consequence assessment.
• Assessment and management of risks has addressed the principles of ecologically sustainable development (ESD).
• Demonstration that the acceptable levels of impact and risks have been informed by relevant species recovery plans, threat abatement plans and conservation advice.
• Performance standards are consistent with legal and regulatory requirements. • Performance standards are consistent with the Environmental Management Policy. • Performance standards are consistent with industry standards and best practice guidance (e.g.
National Biofouling Guidance for the Petroleum Industry). • Performance outcomes and standards are consistent with stakeholder expectations. • Performance standards have been demonstrated to reduce the impact or risk to ALARP.
High Risk - reduction of risk required
Medium Risk - reduction of risk required based on ALARP principle
Low Risk - deemed acceptable based on standard risk controls in place
Santos Ltd | Keraudren Seismic Survey EP Summary Page 150 of 248
5.2 ALARP Evaluation The ALARP principle is that the residual impacts and risk shall be ˋas low as reasonably practicable’. It has particular connotations as a route to reduce impacts and risks when considering law, regulation and standards. For an impact or risk to be ALARP it must be possible to demonstrate that the cost involved in reducing the impact or risk further would be grossly disproportionate to the benefit gained. The ALARP principle arises from the fact that infinite time, effort and money could be spent on the attempt of reducing a risk to zero. It should not be understood as simply a quantitative measure of benefit against detriment. It is more a best common practice of judgement of the balance of impact or risk and societal benefit. For planned and unplanned events, an ALARP assessment is undertaken to demonstrate that the standard control measures adopted reduce the impact (consequence level) or risk to as low as reasonably practicable (ALARP). This process relies on demonstrating that further potential control measures would require a disproportionate level of cost/effort to reduce the level of impact or risk. If this cannot be demonstrated further control measures are adopted. The level of detail included within the ALARP assessment is based upon the nature and scale of the potential impact or risk.
5.3 Environmental Assessment Summary for Planned Events
5.3.1 Interaction with Other Marine Users
Event: Interactions with Other Marine Users
Interactions with other marine users through undertaking the activity. The presence of vessels in the operational area could potentially inhibit or be an inconvenience to marine user groups such as commercial shipping and commercial fishing. For commercial fishing licence holders the level of interaction could lead to temporary displacement. The presence of vessels and the towed streamers could pose a collision risk.
Potential Receptors Marine user groups such as: commercial fishers, tourism, shipping traffic and other oil and gas activities
Potential Impacts Three Commonwealth fisheries and eleven state fisheries have zones that overlap the operational area. Potential impacts to commercial fisheries caused by seismic vessels in the operational area range from operational inconveniences (e.g. maneuvering around seismic vessels) to temporary loss of access to fishing areas (i.e. displacement). Displacement could result in reduced catches and income, or increased costs to operate elsewhere (i.e. relocation costs).
An analysis of the current fishery zones and closures, depth range of activity, historical fishing effort data, fishing methods and consultation feedback has revealed none of the Commonwealth fisheries identified in Section 3.5 are likely to be active in the operational area, and therefore fisher displacement is not expected.
For state-managed fisheries, there is evidence of fishing effort in the operational area for the Pilbara Trap Managed Fishery, Pilbara Fish Trawl Interim Managed Fishery (PFTIMF), Pilbara Line Managed Fishery and the Mackerel Managed Fishery (Area 2). For the Pilbara Trap Managed Fishery, consultation feedback has confirmed that at least one individual fisher is active in this region. For the Pilbara Fish Trawl Interim Managed Fishery, up to four vessels could be operational across the fishery at times in 2019. For the Pilbara Managed Line Fishery, Santos WA understands that for the 2018/2019 season there are nine licences, held by seven operators. For the Mackerel Managed Fishery, consultation with stakeholders has indicated that one licence holder is active in the area. Hence, temporary operational inconvenience or area displacement from part of the operational area may be experienced by several fishers.
While the boundaries of seven other state-managed fisheries overlap the operational area, no fishing effort in the operational area has been identified through consultation (Section 4) and review of historical fishing data. No pearl oyster licence holders are known or expected
Santos Ltd | Keraudren Seismic Survey EP Summary Page 151 of 248
to dive in the operational area due to the water depth (i.e. greater than 50 m) hence displacement is not expected.
Santos WA has not identified any charter boats operating out of Port Hedland and there is no identified offshore tourism industry within or near the operational area. Recreational activities such as boating, snorkelling, diving, and fishing activities are more likely to occur in shallower waters around Bedout Island (approximately 16 km from the operational area). Hence, the seismic vessels are not expected to encounter recreational boats within the deeper, offshore waters of the operational area.
Although indigenous marine users or subsistence/traditional fishing could occur in the operational area, no interactions have been recorded during previous Santos WA petroleum activities in this area or are known to Santos WA. Consultation was undertaken with the Port Hedland branch of the DPLH and no concerns have been raised with the offshore activity. Shipping traffic plots updated in August 2018, indicate cargo and local offshore support vessel traffic may be encountered within the operational area. Traffic is largely confined to two designated shipping fairways servicing Port Hedland. Shipping using NWS waters includes iron ore carriers, LNG and oil tankers and other vessels proceeding to or from the ports of Dampier, Port Walcott, Port Hedland, Barrow Island, Varanus Island and Onslow. Large cargo vessels carrying freight bound or departing from Fremantle, transit along the WA coastline heading north and south in deeper waters. Since the Primary seismic vessel will be towing the streamer array, manoeuvrability is limited and commercial vessels may be required to change course. Should commercial vessels need to deviate from planned routes to avoid seismic vessels, this may slightly increase transit times and fuel consumption. As the operational area is in open waters with no grounding or navigational hazards, it is not likely that any such deviation would increase the potential for vessel collision or grounding. There are no existing petroleum production facilities or infrastructure within or surrounding the operational area. The expected level of petroleum-related third party marine traffic during the seismic survey is negligible.
Impact Assessment
Receptors Consequence
Socio-economic Receptors
In accordance with the environmental assessment procedure and consequence ranking criteria (EA-91-IG-00004), the consequence of seismic survey vessels interfering with or displacing other marine users is considered to be ‘Minor’ (B ranking) – Detectable but insignificant short-term loss of value of the local industry. This assumes the implementation of all proposed control measures. The justification for this consequence assessment is:
• Marine users will still be permitted to enter the seismic survey operational area providing the requested exclusion (safety) zone around the seismic vessels is observed.
• Any interactions or displacements will be limited to up to 110 days between 1 March and 31 July 2019 (i.e. temporary and within a defined period).
• Santos WA is prepared to invest the time and resources to plan and manage concurrent operations with relevant commercial fishers who fish to continue fishing in the operational area during the seismic survey.
• Significant alternative fishing areas outside of the operational area are available for commercial fisheries who decide to fish elsewhere.
• Santos WA believes that commercial fishers should not be financially disadvantaged from its seismic operation. Hence is prepared to consider evidence-based payment claims should commercial fisherman be displaced from the operational area during the seismic survey.
• Santos WA commits to ongoing engagement with commercial fishers before, during and after the seismic survey.
Santos Ltd | Keraudren Seismic Survey EP Summary Page 152 of 248
The seismic survey has the potential to impact upon multiple commercial fisheries, being the Pilbara Demersal Scalefish Fisheries (Trap, Trawl and Line) and the Mackerel Managed Fishery (Area 2). As both are legitimate users of the marine environment, fishers will be able to access the operational area during the survey and Santos WA is prepared to operate concurrently with fishers. Santos WA has requested a 3 nm exclusion zone around the seismic vessel and streamers for safety reasons. An exclusion zone is standard practice for seismic vessels and no concerns about the size of the exclusion zone have been raised by fishers during consultation. Nonetheless, due to the physical presence of the seismic vessels and requested safety exclusion zone, fishers’ normal operations maybe temporarily disrupted. Fishers may be displaced or may choose to avoid parts of, or the entire, operational area. This maybe for the duration of the seismic survey or for a part of the survey. If alternative fishing grounds outside of the operational area are not available, then this may result in a loss of catch and financial income. If alternative fishing grounds are available but are more expensive to fish, then this may increase operating costs. Santos WA understands that all potentially affected fishers have access to alternative fishing areas. Santos WA recognizes that additional engagement with potentially affected fishers is necessary to determine effective ways of operating concurrently, and/or to determine and evidence any commercial impacts (e.g. relocation costs) of temporary displacement. Santos WA commits to continued engagement with relevant fishers (refer to Section 4) and to assessing the merits of all evidence-based displacement payment claims. Santos WA considers there to be sufficient information available to understand the nature and scale of potential impacts to commercial fishers, and to assess impact consequence. Ongoing engagement with commercial fishers will be used to validate the below impact assessment. Other marine users will not be restricted from entering the operational area. However, given the low manoeuvrability and slow speed of the seismic vessels, it is possible that third party commercial vessels may be required to deviate from planned routes to avoid the seismic vessels and trailing streamers. Since the seismic vessels will be continually moving, potential displacement from any one location within the operational area will be temporary and negligible. Santos WA has not identified through consultation any tourism activity in the operational area or surrounds. Recreational fishers and divers may be present at Bedout Island and surrounding waters; however, they will not be displaced by the seismic vessels. It is unlikely indigenous users of the marine environment or traditional fishers will be present within the operational area. AMSA require a high level of communication during the activity (Marine Notices, NTM, AUSCOAST warnings), therefore, reducing the likelihood of interaction with other sea users (e.g. private leisure craft, etc.).
Overall Consequence Ranking
B – Minor
Management Control
Effectiveness of Control
Notices to Mariners (NTM) and AUSCOAST warnings
Ensures other marine users are aware of the presence of seismic vessels and trailing streamers, and the relatively slow speed and restricted manoeuvrability of the seismic vessels.
Requested exclusion zone
Requested 3 nm (5.6 km) exclusion zones around the seismic vessels and trailing streamers prevents other vessels from getting too close and causing damage to equipment of either party.
Navigation Reduces the risk of interference and collisions with other marine users.
Santos Ltd | Keraudren Seismic Survey EP Summary Page 153 of 248
equipment and procedures
Support vessel Identifies and communicates with approaching third-party vessels to ensure exclusion (safety) zone is observed, preventing potential interaction or interference.
Constant bridge watch
Crew of support and seismic vessels will maintain constant bridge watch, including for third party vessels which may be approaching or enter the exclusion zone.
Seismic vessels fitted with AIS systems and radars
Reduces risk of impact from vessel collisions.
Concurrent operations planning with relevant commercial fishers
As legitimate users of the marine environment, concurrent operations planning (including establishment of communication protocols between the seismic vessels and the fishing vessels) will minimise fisher displacement while allowing Santos WA to meet its seismic survey objectives.
Commercial fishery payment claims
Should relevant commercial fishers be displaced from their normal fishing areas because of the physical presence of the seismic survey vessels then Santos WA is prepared to consider financial payments so that commercial fishers are not materially worse off as a result of the seismic survey. Evidenced-based compensation models are not new to seismic surveys in Australia.
5.3.2 Light Emissions
Event: Light Emissions
During the activity, safety and navigational lighting on the vessels will generate light emissions that may potentially affect marine fauna behaviour. Spot lighting may also be used on an as-needed basis e.g., streamer deployment and retrieval. Lighting will typically consist of bright white (i.e., metal halide, halogen, fluorescent) lights. The minimum level of lighting proposed is required for safety and navigational purposes on board vessels so it cannot be eliminated if the proposed activity is to proceed. The Navigation Act 2012 requires vessels to be well lit for safe navigation. Vessels are required to show lights when operating at night to indicate their position and seismic vessels must indicate their limited ability to manoeuvre. Spot lighting may also be used on an as-needed basis e.g., streamer deployment and retrieval. Lighting will typically consist of bright white (i.e., metal halide, halogen, fluorescent) lights.
Potential Impacts Continuous lighting may result in alterations to normal marine fauna behaviour, as discussed below for each fauna group. Potential impacts are more likely in instances when the light source is stationary, which is not the case during a MSS activity when the vessels are constantly moving. The combination of colour, intensity, closeness, direction and persistence of a light source are key factors in determining the magnitude of environmental impact (EPA 2010). Given the distance of the activity location and the closest turtle nesting site, i.e. 67 km to Eighty Mile beach, lights (and light glow) are not visible from the beaches or surrounding sea.
Fish
The response of fish to light emissions varies according to species and habitat. Experiments using light traps have found that some fish and zooplankton species are attracted to light sources (Meekan et al. 2001), with traps drawing catches from up to 90 m away (Milicich et al. 1992). Lindquist et al. (2005) concluded from a study that artificial lighting associated with
Santos Ltd | Keraudren Seismic Survey EP Summary Page 154 of 248
offshore oil and gas activities resulted in an increased abundance of clupeids (herring and sardines) and engraulids (anchovies); these species are known to be highly photopositive. Attraction of fish to light may increase predation from larger fish and sharks in the immediate vicinity.
Overall, a short-term localised increase in fish activity as a result of vessel lighting is expected to occur, however, with negligible impacts.
Marine turtles
Light pollution reaching turtle nesting beaches is widely considered detrimental owing to its ability to alter important nocturnal activities including choice of nesting sites and orientation/navigation to the sea by post-nesting females and hatchlings (Witherington and Martin 2003). The Recovery Plan for Marine Turtles in Australia: 2017-2027 (DotEE, Commonwealth of Australia 2017) highlights artificial light as one of several threats to marine turtles. Specifically, the plan indicates that artificial light may reduce the overall reproductive output of a stock, and therefore recovery of the species, by:
• inhibiting nesting by females; • creating pools of light that attract swimming hatchlings and increase their risk of
predation; and • disrupting hatchling orientation and sea finding behaviour. Once in the ocean, hatchlings
are thought to remain close to the surface, orient by wave fronts and swim into deep offshore waters for several days to escape the more predator-filled shallow inshore waters. During this period, light spill from coastal port infrastructure and ships may ‘entrap’ hatchling swimming behaviour, reducing the success of their seaward dispersion and potentially increasing their exposure to predation via silhouetting (Salmon et al.1992).
Several species of marine turtle may be present in the operational area. Hawksbill, green, leatherback and loggerhead turtles are unlikely to be encountered in larger numbers given the lack of known nesting, internesting or foraging habitat for these species. It is possible that individual flatback turtles may be encountered in the operational area, however, timing of the activity is after the peak of the nesting season for this species. This internesting area for flatbacks is defined as habitat critical and encompasses a 60 km radius around nesting beaches in the Recovery Plan for Marine Turtles in Australia: 2017-2027 (DotEE, 2 017). A BIA is also defined for flatbacks that does overlap the operational area and a separate BIA for greens, hawksbills and loggerheads is defined which does not overlap the operational area.
The Recovery Plan for Marine Turtles in Australia: 2017-2027 specifies the following priority actions for the Pilbara genetic stock of flatback turtles in relation to artificial light:
• manage artificial light from onshore and offshore sources to ensure biologically important behaviours of nesting adults and emerging/dispersing hatchlings can continue.
The operational area is located 52 km and 67 km from North Turtle Island and Eighty -Mile Beach respectively. The WA Environmental Protection Authority (EPA) conservatively estimates there is only a light influence on marine turtles if the light source is within 1.5 km of the nesting beach (EPA 2010). Therefore, at this distance and proximity, vessel light emissions will not be visible from turtle nesting beaches. Additionally, since the vessels will be continually moving while acquiring, and only a small proportion of the operational area overlaps with the BIA, the duration of the activity that could lead to potential impacts to flatback turtles will be reduced to a few days. Should hatchling turtles be attracted to vessel lights and be silhouetted, they may be exposed to increased predation in the operational area (Thums et al.2016), although this likelihood is reduced considering the constantly moving light source and the slow swimming speed of turtle hatchlings.
The potential impacts of light emissions to turtles, including flatback turtles, from the activities are expected to be restricted to localised attraction and temporary disorientation with no long term or residual impact due to the continual movement of the vessels continually moving, the activity’s short duration (110 days in total, but much less activity
Santos Ltd | Keraudren Seismic Survey EP Summary Page 155 of 248
within the flatback BIA); and the unlikely presence of hatchlings due to the distance from the nearest shorelines. It is considered that the activity will not compromise the objectives as set out in the Recovery Plan for Marine Turtles and impact of lighting associated with the activity to turtles is negligible
Seabirds
Studies conducted between 1992 and 2002 in the North Sea confirmed that artificial light was the reason that birds were attracted to and accumulated around illuminated offshore infrastructure (Marquenie et al. 2008). The light sources associated with the vessels may also provide enhanced capability for seabirds to forage at night. The vessels will be in the operational area for up to 110 days, however will be continually moving and therefore is unlikely attract large numbers of seabirds.
Other marine fauna There is no evidence to suggest that artificial light sources adversely affect the migratory, feeding or breeding behaviours of cetaceans. Cetaceans predominantly utilise acoustic senses to monitor their environment rather than visual cues (Simmonds et al. 2004), therefore, impacts are thought to be unlikely.
Impact Assessment
Receptors Consequence
Threatened / Migratory / Local Fauna
Continuous lighting in the same location for an extended period of time may result in alterations to normal marine fauna behaviour. Sensitive receptors that may be impacted include fish at surface, marine turtles and mammals, and seabirds. Given that the activity involved vessels that are continually moving, is for a limited duration, and is located 52 km from the nearest nesting beach (North Turtle Island), at these distances lighting is unlikely to be at a level that could impact nesting turtles or hatchlings. Given a small proportion of the operational area is located within the flatback turtles BIA individuals may occur in the operational area although large numbers are not expected. The nearest nesting beach is located 52 km from the operational area, therefore flatback hatchlings are not expected to be impacted by light emissions from the activities. Marine mammals are not known to be significantly attracted to light sources at sea and therefore disturbances to behaviour are unlikely to occur. Fish and birds have been shown to be attracted to artificial light sources, however, the low level of light emitted from vessels is unlikely to lead to large scale changes in species abundance or distribution. Impacts to transient fish and seabirds will therefore be limited to short-term behavioural effects with no decrease in local population size, area of occupancy of species or loss or disruption of habitat critical / disruption to the breeding cycle.
Overall Consequence Ranking
A – Negligible Given the considerable distance offshore from turtle and seabird nesting sites and associated nearshore waters, the disruption of critical juvenile dispersion processes could occur but would not be expected. Direct light impacts at nesting sites would not occur due to the distance from shore; however, there is a low probability that individual turtles and seabirds will be attracted by the moving light source at sea for a short period.
Management Control
Effectiveness of Control
None
5.3.3 Noise Emissions
Event: Noise Emissions
During the activity noise will be generated through operation of: • vessels
Santos Ltd | Keraudren Seismic Survey EP Summary Page 156 of 248
• helicopters • seismic sources.
Vessels The vessels will emit noise from propeller cavitation, thrusters, hydrodynamic flow around the hull, and operation of machinery and equipment. Typically, marine vessels produce low frequency sound (i.e. below 1 kHz) from the operation of machinery on-board; from hydrodynamic flow noise around the hull; and from propeller cavitation, which is typically the dominant source of noise (Ross 1987 1993; cited in Skjoldal et al. 2009). Most sounds associated with vessels are broadband, though tones are also associated with the harmonics of the propeller blades (Ross 1987; 1993 cited in Skjoldal et al. 2009). McCauley et al. (1998) examined the noise from a 64-m, 2,600-tonne rig tender vessel underway, which had a broadband source level of 177 dB re 1μPa. Usually, the larger the vessel, or the faster a vessel moves, results in more noise (Richardson et al. 1995). Depending on the vessel, source levels can range from less than 160 dB (trawlers) to over 200 dB re 1µPa @1m (super-tankers) (Simmonds et al. 2004). Based on these measurements, it is expected that the vessels in this activity will emit sounds that are less than that from the seismic source. Helicopters Strong underwater sounds are detectable for only brief periods when a helicopter is directly overhead (Richardson et al. 1995). Sound emitted from helicopter operations is typically below 500 Hz and sound pressure in the water directly below a helicopter is greatest at the sea surface but diminishes quickly with depth. Reports for a Bell 214 (regarded to be one of the noisiest), indicated that noise is audible in the air for four minutes before the helicopter passed over underwater hydrophones. The helicopter was audible underwater for only 38 seconds at 3-m depth and 11 seconds at 8-m depth (Greene 1985a; cited in Richardson et al. 1995). Noise levels reported for Bell 212 helicopter during fly-over is 162 dB re 1µPa and for Sikorsky-61 is 108 dB re 1µPa at 305 m (Simmonds et al. 2004). Helicopters will be used during the survey for crew change and in an emergency. It is expected that underwater sounds as a result of helicopter activity will only be detectable during landing and take-off. Seismic sources The aspect considered to have the greatest potential impact is noise emitted from the seismic source array, comprising a series of airguns discharged in a pre-determined order, described in detail in the following sections. The seismic sources will be fired at regular intervals, producing pulses of high-intensity low-frequency sound. Seismic pulses typically have ~98% of the signal power in dominant frequencies less than 200 Hz; predominantly in the 10 to 200 Hz range (McCauley 1994), the useful range for seismic data imaging.
Potential Receptors
Threatened / migratory fauna – cetaceans, marine turtles, fish, seabirds, benthic invertebrates and plankton; Socio-economic – shipping, commercial fishing, tourism and recreational fishing and diving, submarine cable networks
Potential Impacts – Seismic Source
Marine fauna use sound for a variety of functions, including social interactions, foraging, orientation, and responding to predators. Underwater noise can affect marine fauna in three main ways: • Injury to hearing or other organs. Hearing loss may be temporary (temporary threshold shift
(TTS)) or permanent (permanent threshold shift (PTS)). • Disturbance leading to behavioural changes or displacement of fauna. The occurrence and
intensity of disturbance is highly variable and depends on a range of factors relating to the animal and situation.
• Masking or interfering with other biologically important sounds (including vocal communication, echolocation, signals and sounds produced by predators or prey).
To understand the extent and magnitude of underwater acoustic noise that may result from the Keraudren seismic survey Santos WA commissioned JASCO Applied Sciences (JASCO) to model expected sound fields caused by the survey (Quijano et al. 2018). The assessment was conducted by comparing modelled received underwater sound levels to defined noise effect
Santos Ltd | Keraudren Seismic Survey EP Summary Page 157 of 248
criteria as determined by scientific research and academic papers for the identified environmental and social receptors. Sound levels emitted into the marine environment have were modelled and expressed using the following sound level metrics: • Source level (SL): The sound pressure level or sound exposure level measured 1 metre from
a theoretical point source that radiates the same total sound power as the actual source. It is a theoretical value for a seismic source, because a seismic source is not a point source, but rather is made up of individual elements covering a defined area. Source level can be expressed as an SPL, SEL or PK. Unit: dB re 1 μPa2m2 or dB 1 μPa2m2s.
• Impulse/pulse: The terms used to refer to the discharge of a seismic source are impulse and pulse, therefore the terms used to describe a single discharge are per-impulse or per-pulse.
• Peak pressure (PK) (Impulsive sounds): Zero-to-peak sound pressure (PK), the greatest magnitude of the sound pressure during a specified time interval, unit: dB re 1 μPa. PK levels are modelled to assess mortality and potential mortal injury to fish, turtles, fish eggs and larvae.
• Peak-to-peak pressure (PK-PK) (Impulsive sounds): Peak-to-peak sound pressure (PK-PK), is the sum of the peak compressional pressure (highest pressure variation) and the peak rarefactional (pressure lowest pressure variation) during a specified time interval, unit: dB re 1 μPa. PK-PK is the difference between the maximum and minimum instantaneous sound pressure levels in a stated frequency band attained by an impulsive sound.
• Sound exposure level (SEL) (Non-impulsive sounds): a measure related to the sound energy in one or more pulses, or the ratio of the time-integrated squared sound pressure to the specified reference value, unit: dB re 1 μPa2·s, and can be considered as a dose-type measurement. This measure recognises that the effects of sound are a function of exposure duration as well as maximum instantaneous peak pressure. The SEL metric integrates noise intensity over some period of exposure and is used as it allows exposure duration and the effect of exposure to multiple events to be considered. SEL is specified in terms of either per-impulse (per-pulse) or a defined accumulation period. The metrics determined for the defined accumulation period assume that a receptor remains stationary for the period. The accumulation period applied for this assessment is 24 hours, and therefore the SEL is referred to as either per-impulse SEL or SEL24h.
The noise thresholds (i.e. the level that must be exceeded for an effect to occur) for sound-induced effects on marine fauna are described below. Noise thresholds have been defined for both the per-pulse sound energy released, as well as the total sound energy (accumulated) that marine fauna is subjected to over a defined period of time. For recent regulatory assessments of seismic surveys, the period of total sound energy integration (i.e. accumulation) has been typically defined as 24 hours; hence, was the period used for modelling and in this assessment. For fish this period is based on available research (Popper et al. 2014) which found fish experiencing a temporary threshold shift (TTS) in hearing recovered to normal hearing levels within 18 to 24 hours, and for marine mammals the period is required to be either 24 hours or the length of the activity, whichever is shorter (NMFS 2018). Importantly, the 24 hour accumulated sound metric reflects the dosimetric impact of noise levels within 24 hours based on the assumption that an animal is consistently exposed to such noise levels at a fixed position. More realistically, marine mammals and many fish (pelagic and some demersal) would not stay in the same location or at the same range for 24 hours. Popper et al. (2014) discuss the complications in determining a relevant sound exposure period of mobile seismic surveys, as the levels received by the receptor change between impulses due to the mobile source. For marine mammals and many fish, sound exposures at the closest point to the seismic source are the primary exposures contributing to a receptor’s accumulated level (Gedamke et al. 2011). Hence, thresholds based on a 24 hour exposure period are considered to be a conservative measure of potential effect. Acoustic Modelling JASCO designed the modelling study to take into consideration key survey factors, such as: the location of key environmental and social receptors, the range of water depths across the survey area and the two survey scenarios (Section 2.3). Within the two survey scenarios, seven per-
Santos Ltd | Keraudren Seismic Survey EP Summary Page 158 of 248
pulse modelling sites were selected (four for Scenario 1 (Exploration) and three for Scenario 2 (Development)) (see figure below). The modelling considers single and dual seismic sources cases separately for the purpose of clearly comparing the added impact of the secondary source.
Location of modelling scenarios and sites with key receptors
For each of the Exploration and Development survey components a scenario was defined for assessing accumulated SEL over 24 hours of seismic operation along acquisition sail lines:
• For the Exploration survey component (Scenario 1), the 24-hour operational period includes the time taken to traverse two survey sail lines (~8.5 hours per sail line) plus the turn time required between the sail lines (~3 hours per turn). This equates to one complete ‘racetrack’ (or loop), plus a small section of the next racetrack (~14.8 km of next sail line); and
• For the Development survey component (Scenario 2), the 24-hour operational period includes the time taken to traverse almost three survey lines (~5 hours per sail line) plus the turn time required between the survey sail lines (~3 hours per sail line). This equates to almost one and half complete racetracks.
The underwater acoustic signatures of the seismic source array were predicted with JASCO’s specialised Airgun Array Source Model (AASM), which accounts for individual airgun volumes and array geometry criteria. Three complementary underwater acoustic propagation models were used in conjunction with the modelled array signature to estimate sound levels over a large area around the source. The modelling methodology considered source directivity and range-dependent environmental properties in each of the areas assessed. Estimated underwater acoustic levels are presented as SPL, PK, PK-PK), and either per-pulse or accumulated SEL as appropriate for different noise thresholds. Particle motion metrics were predicted at the two shallowest modelled locations (Exploration survey component – Scenario 1, Site 1 and 2). Contours of the modelled underwater sound fields have been computed, sampled either at the seafloor or as the maximum value over all modelled depths (MOD) for each location in the modelled region. The modelled distances for each of the defined noise thresholds are
Santos Ltd | Keraudren Seismic Survey EP Summary Page 159 of 248
computed from these contour maps. Two distances relative to the source are reported for each sound level:
1. Rmax, the maximum range to the given sound level over all azimuths. 2. R95%, the range to the given sound level after the 5% farthest points were excluded.
The difference between Rmax and R95% depends on the source directivity and the non-uniformity of the acoustic environment. In some environments a sound level contour might have small anomalous isolated fringes in which case the literal use of Rmax can misrepresent the area of the region exposed to such effects. In these instances R95% is considered more representative. In environments that have bathymetric features that affect sound propagation then the R95% neglects to account for these and therefore Rmax might better represent the region of effect in specific directions. Development (dual source) modelling A key component of the modelling study was to determine the potential difference in effects associated with the use of a dual seismic source configuration, instead of a conventional single source. The modelling was conducted on the basis that the Primary and Secondary sources were to be operated synchronously. That is, Primary and Secondary port sources were to be operated at the approximate same time, to be followed 12.5 m further along the sail line by the Primary and Secondary starboard sources at the approximate same time. On this basis, the modelling showed that the presence of the second source resulted in an enlarged sound field footprint compared to a single source. That is, the distance to a given sound field isopleth was larger in some locations for the dual source case when compared to the single source case. The temporal interaction between pulses from each of the sources was also analysed. In particular, the relative timing of the two sources was examined to determine the affect this has on the per-pulse sound metrics. This analysis was used to assess several of the potential effects on marine fauna. The primary conclusion is that the two sources can be considered largely independent. That is, for the majority of the time for which the pulses interact, they do not additively combine to produce a pulse that is greater in amplitude than the maximum amplitude of one pulse on its own.
Dugongs Receptors Although the PMST report stated that dugong, or dugong habitat, may occur in the operational area, the water depth range (~50 to 150 m) and lack of seagrass habitat within the operational area suggests that presence is highly unlikely. The closest dugong habitat is expected to occur in inshore areas close to the mainland coast (note, no seagrass habitat has been reported around Bedout Island). At the closest point, the ramp-up/ full-power zone is located 67 km from the shore. Thresholds Based on the limited data regarding noise levels that elicit a behavioural response in sirenians, the lower threshold level of SPL 160 dB re 1 μPa level from NMFS (2013) is typically applied, both in Australia and by NMFS. Summary Noise modelling at the closest point to land (Quijano et al. 2018) suggests noise levels equalling this threshold could occur up to 6.02 km from the seismic source. Dugong habitat (i.e. seagrasses) is not known to occur within this area.
Seabirds Receptors Acoustic noise from seismic surveys is not anticipated to have a direct effect on seabird or shorebird species, due to the method of the activity, and that birds and vessels are transient. Only bird species that plunge dive (such as tropicbirds, boobies, shearwaters and tern species) could potentially be exposed to underwater noise, although little or no impact is expected. Stemp (1985; as cited in LGL 2012) conducted observations on the effects of seismic exploration on seabirds and did not observe any negative effects. Lacroix et al. (2003; as cited in LGL 2012) investigated the effect of near shore seismic surveys on moulting long-tailed ducks in the Beaufort Sea, Alaska, and also failed to detect any negative effects. Furthermore, they noted that seismic activity did not appear to change the diving intensity of the ducks significantly.
Santos Ltd | Keraudren Seismic Survey EP Summary Page 160 of 248
Thresholds There are no thresholds or assessment criteria for noise impacts to seabirds from seismic surveys. The EPBC Act Policy Statement 3.21 – Industry guidelines for avoiding, assessing and mitigating impacts on EPBC Act listed migratory shorebird species (Commonwealth of Australia 2017) does not identify any impacts and risks to shorebirds from offshore seismic activities. However, some species may be affected indirectly as identified below. Summary Seabirds may be displaced physically by vessels or because of increased noise at the sea surface only. However, as a result of acoustic source directivity being focussed downwards towards the seabed and reducing levels with distance from the source, the area of displacement is anticipated to be minimal. Pelagic seabirds (e.g. terns, shearwaters and frigate birds) cover large areas when foraging (over 100 km). Therefore, as displacement from survey activities would be limited to the area close to the vessel, any impact is anticipated to be temporary and no more than slight behavioural changes. Prey abundance could either increase or decrease because of the seismic activity. If the seismic activity disorients, injures, or kills prey species, or otherwise increases the availability of prey species to marine birds, the seismic survey may attract birds. Birds drawn too close to the source array may be at risk of injury. Alternatively, if prey species do exhibit avoidance of the seismic vessels or source arrays, it is expected to be transitory and limited to a very small portion of a bird’s foraging range. Seismic effects on prey species such as fish and invertebrates are expected to be limited to short-term impacts (refer to the relevant sections below). Therefore, it is unlikely that seabird prey species will be affected significantly by the seismic activity, particularly to a degree that affects the foraging success of birds and at the population level. A vessel (seismic or otherwise) that approaches too close to a breeding colony could potentially disturb nesting birds in response to either acoustic or visual stimuli. There is little potential for this during the proposed survey, as the closest nesting site is Bedout Island, which is located 16.5 km from the operational area (the ramp-up/full-power zone are within this). As nests are located onshore, the underwater noise from the acoustic source will not impact nesting birds. Species such as the white-tailed tropicbird, roseate tern, streaked shearwater, Abbott’s booby and brown booby forage by plunge-diving to depths. It is possible that during the course of normal feeding or escape behaviour, some birds could be near enough to an acoustic source to be injured. Although no records of this circumstance could be found, a bird would have to be very close to an acoustic source to receive a discharge with sufficient energy to cause injury, and as such is very unlikely to occur. The approach of the vessel serves as a “ramp-up” in that the received noise levels at a fixed point along a survey line will gradually increase. As such, birds will be alerted to the approaching seismic vessel (and source array) and could move away from the acoustic source. Birds may be temporarily displaced from the area surrounding the source, but the impacts are not expected to be significant at the individual or population level.
Marine Turtles Receptors The PMST report identified five species of marine turtle that may occur within the operational area: flatback, hawksbill, green, loggerhead and leatherback. In addition, the marine turtle BIAs and critical habitats described in Section 3.4.3, indicate an overlap with the flatback turtle BIA but not the critical habitat designated for internesting of flatbacks (Figure 3-6). In terms of protected marine turtle habitats defined in the Recovery Plan for Marine Turtles in Australia (DotEE 2017), the BIA for flatback turtles is considered of most relevance to the assessment of impacts from noise emissions from the Keraudren survey due to the spatial overlap. For conservatism, the BIA for green, loggerhead and hawksbill turtles and the habitat critical for internesting flatback turtles have also been considered noting that there is no spatial overlap of these areas with the seismic survey area and that most flatback turtles have completed nesting activity by the end of January. All species of transiting or migratory turtles are also considered.
Santos Ltd | Keraudren Seismic Survey EP Summary Page 161 of 248
Studies of the internesting behaviour of flatback turtles using satellite telemetry provide evidence that flatback turtle internesting movements do not overlap the Keraudren seismic survey area either in space or time, based on the following: • Whittock et al. (2014) describes the internesting movements from 4 flatback rookeries
(Barrow Island, Thevenard Island, Mundabullangana and Port Hedland (Cemetery Beach)). The distance travelled between nesting events ranged from 3.4 to 62.1 km for 56 monitored flatback turtles representing 112 internesting events in December and January over a 6 year period. For Cemetry Beach, the closest rookery in the study to the Keraudren operational area, the greatest internesting distance travelled was to the south of North Turtle Island which is at least 60 km from the ramp-up zone of the Keraudren survey at its closest point.
• Further analysis, modelling and interpretation of satellite tracks by flatback turtles by Whittock et al. (2016) led to defining suitable internesting habitat as water depths of 0 to 16 m located within 5 to 10 km of the nesting coastline with sea surface temperatures between 27o and 29.9o. No areas of high suitable habitat occurred in water depths of > 5 m water deep and >27 km from the coastline.
• A study of internesting distances travelled by flatbacks from the Lacepede Islands (approximately 400 km to the north of the Keraudren survey) reported a median distance from the deployment location of 12.51 km with all transmissions within 48.28 km of the deployment location. Tracked flatback turtles commenced their post-nesting migration by mid January.
• Waayers and Stubbs (2016) summarise a decade of monitoring flatback turtles in Port Hedland and indicate that nesting begins in mid-October and ends in late January with the peak in late November.
• Thums et al.(2017) reported that internesting movements of 11 flatback turtles tagged on the Lacepede Islands remained at an average distance of 15.75 +/-12.25 km from West Lacepede Island, in water depths of 16 +/- 3 m.
• Pendoley et al. (2014) reported that post-nesting migration for flatbacks from 4 rookeries on the north west shelf commenced between end of November and end of January.
With regards to post-internesting movements of flatback turtles, less is known and been studied. Thums et al.(2017) used satellite telemetry to follow the movements of 11 flatback turtles after nesting on islands in the waters off the coast of the Kimberley region of northern Australia. The turtles migrated along the coast in water depths of 63 +/- 5m to foraging grounds on the mid-Sahul Shelf in the Timor Sea in average water depths of 74 +/- 12m and 135 +/- 35 km from shore. Pendoley et al.(2014) report a range of depths for post-nesting migration of flatbacks from 4 rookeries on the North West Shelf from 50 to 127 m water depth and a maximum track distance from shore of 125 km (+/-35 km, range of 36 to 125 km). On the basis of these studies, it can be concluded that it is possible for post-nesting flatback turtles to migrate through the Keraudren operational area.
Thresholds
The threshold criteria in Table 5-3 have been adopted for the assessment of noise impacts to turtles. Table 5-3 provides the modelled distances for the threshold criteria.
Popper et al. (2014) provides exposure guidelines to set threshold criteria for marine turtles exposed to seismic noise as detailed in Table 5-4. Though mortality or potential mortality impacts to turtles from seismic noise exposure has not be reported, Popper et al. (2014) provides exposure guidelines of >207 dB PK or >210 dB SELcum. There are no defined quantitative threshold criteria for impairment effects (PTS, recoverable injury and TTS) in turtles. Based on the application of the Popper et al. (2014) semi-quantitative exposure criteria (Table 5-4) there is a high risk of potential impairment (recoverable injury and TTS) effects to turtles within tens of metres of the array.
There is no scientific evidence implying that turtles actively avoid or are attracted to operating seismic sources (i.e., <500m). Testing by Moein et al 1994 on caged loggerhead turtles suggested that acoustic impacts were not significant, temporary and turtles recovered within 2 weeks.
Santos Ltd | Keraudren Seismic Survey EP Summary Page 162 of 248
Based on the limited data regarding noise levels that illicit a behavioural response in turtles, the lower level of 166 dB re 1 μPa level, derived from NSF (2011), is typically applied, both in Australia and by NMFS.
Summary
From the noise modelling study the furthest distance to the mortality or potential mortality threshold criteria using the dual criteria of >207 dB PK or >210 dB SELcum was the PK guideline at 152 m. The furthest distance to the behavioural threshold was 3.16 km. Potential impacts to turtles are considered to be within an acceptable level based on the following assessment:
• Noise levels above the mortality/potential mortal injury or behavioural exposure guideline will not be reached at the nearest habitat critical to the survival of the species for internesting flatbacks, being 24 km distant to the ramp-up zone at the closest point. Thus, the priority action in relation to flatback turtles, stated in the Recovery Plan for Marine Turtles in Australia (DotEE 2017), to manage anthropogenic activities to ensure marine turtles are not displaced from identified habitat critical to the survival has been met. In addition, the Recovery Plan also states that a precautionary approach should be applied to seismic work, such that surveys planned to occur inside important internesting habitat should be scheduled outside the nesting season. This is not applicable to the Keraudren seismic survey as the survey area is at least 24 km from the closest identified internesting critical habitat and furthermore is outside of peak flatback nesting period.
• Noise levels above the mortality/potential mortal injury or behavioural exposure guideline will not be reached at the BIA for loggerhead, hawksbill and green turtles, being 30 km distant to the ramp-up zone at the closest point (Figure 3-6).
• Noise levels above the mortality/potential mortal injury and the behavioural exposure guideline will be reached within the BIA for flatbacks. The area of overlap is 991 km2 within the full-power zone and 427 km2 within the ramp-up zone, however, only a small proportion of this area will be exposed at any one time to noise emissions above the exposure guidelines. Given this entire area is very small relative to the BIA for flatbacks and the migratory patterns of flatbacks are not well defined by a corridor, the number of turtles encountered is likely to be small such that mortal injury to individuals is highly unlikely whilst temporary behavioural responses such as avoidance may occur to a few transiting individuals.
• The implementation of soft starts as recommended by the Recovery Plan for Marine Turtles in Australia (DotEE 2017) will provide time for turtles to move away from the approaching seismic source. The area of potential impact assumes that the area will receive the same sound levels at the same time for the period of a survey, which is not the case. The received sound levels at a location will reduce and increase as the seismic vessel moves through the area during a survey.
• Mortality/potential mortality impacts are highly unlikely and have not been reported to have occurred in turtles as a result of noise emissions during seismic surveys.
• Individual turtles may traverse through the ramp-up and full-power zone while the seismic survey is being undertaken, however, impacts would be expected to be limited to behavioural disturbance such as moving further away from the primary and secondary source vessels.
Cetaceans Receptors The Protected Matters Search Tool (PMST) report indicated that nine cetacean species may occur in the operational area; six whales and three dolphins. Four endangered species, which are also migratory (humpback, pygmy blue, sei and fin whale) may occur in the operational area. A further five ‘migratory only’ (but not endangered) cetacean species may also occur: Bryde’s whale, killer whale, Indo-Pacific humpback dolphin, spotted dolphin and sperm whale.
Santos Ltd | Keraudren Seismic Survey EP Summary Page 163 of 248
The operational area does not overlap any known resting, breeding or foraging habitats for any of the above species. The operational area overlaps with a distribution BIA for pygmy blue whales and migration BIA for humpback whales. Based on the available information on potential habitat use of these species, individuals in the operational area are expected to be transitory. Based on presence of BIAs, the following environmental assessment focuses on humpback and pygmy blue whales. Current data and predictions show that marine mammal species differ in their hearing capabilities, in absolute hearing sensitivity, as well as frequency band of hearing (Richardson et al. 1995; Wartzok and Ketten 1999; Southall et al. 2007). To better reflect the auditory similarities between phylogenetically closely related species, but also significant differences between species groups among the marine mammals, Southall et al. (2007) assigned the extant marine mammal species to functional hearing groups based on their hearing capabilities and sound production: • Low-frequency (LF) cetaceans: This functional hearing group comprises all baleen whale
species (mysticetes) including humpback and pygmy blue whales. There has been no direct measurement of hearing sensitivity in any of these species. The audible frequency range of mysticetes – collectively treated as a single functional hearing group – is approximately between 10 Hz to 30 kHz (based on anatomical data and functional models of the hearing system). Generalized hearing range: 7 Hz to 35 kHz.
• Mid-frequency (MF) cetaceans: Based on the frequency range of their vocal emissions as well as the known hearing ranges, most dolphin species, all beaked and killer whale species and the sperm whale belong to this functional hearing group. The frequency range of their sounds excluding echolocation clicks are mostly <20 kHz with most of the energy typically around 10 kHz, although some calls may be as low as 100 to 900 Hz, ranging from 100 to 180 dB re 1 µPa (Richardson et al. 1995). Generalized hearing range: 150 Hz to 160 kHz.
• High-frequency (HF) cetaceans: Porpoises, dwarf and pygmy sperm whales (Kogia spp.), river dolphins, as well as hourglass dolphins and Peale’s dolphin produce narrow-band high-frequency echolocation signals. This group of species have been collectively classified as high-frequency cetaceans. Generalized hearing range: 275 Hz to 160 kHz.
Potential impact pathways and sensitivities for cetaceans are summarised as follows: • Mortality and mortal injury: There is no conclusive evidence of a link between noise
produced from seismic surveys and mortality of cetaceans (Gotz et al.2009). • TTS: Exposure to sufficiently intense sound may lead to an increased hearing threshold in
any living animal capable of perceiving acoustic stimuli. If this shift is reversed and the hearing threshold returns to normal, the effect is called a TTS. The onset of TTS is often defined as threshold shift of 6 dB above the normal hearing threshold (Southall et al. 2007). If the threshold shift does not return to normal, the residual shift is called a PTS. Threshold shifts can be caused by acoustic trauma from a very intense sound of short duration, as well as from exposure to lower level sounds over longer time periods (Houser et al. 2017). Injury to the hearing apparatus of a marine animal may result from a fatiguing stimulus measured in terms of SEL, which considers the sound level and duration of the exposure signal. Intense sounds may also damage the hearing apparatus independent of duration, so an additional metric of PK is needed to assess acoustic exposure injury risk. In marine mammals, the onset level and growth of TTS is frequency specific, and depends on the temporal pattern, duty cycle and the hearing test frequency of the fatiguing stimuli. Sounds generated by seismic airguns, pile-driving and mid-frequency sonars have been tested directly and proven to cause noise-induced threshold shifts in marine mammals at high received levels. There is, however, considerable individual difference in all TTS-related parameters between subjects and species tested so far.
• PTS: PTS is hearing loss form which marine fauna do not recover (permanent hair cell or receptor damage). PTS is considered injurious in marine mammals, but there are no published data on the sound levels that cause PTS in marine mammals. The NMFS (2018) criteria incorporate the best available science to estimate PTS onset in marine mammals from sound energy (SEL24h), or very loud, instantaneous peak sound pressure levels.
Santos Ltd | Keraudren Seismic Survey EP Summary Page 164 of 248
• Masking: Masking is the process by which the threshold of hearing for one sound is raised by the presence of another (masking) sound (Erbe & Farmer 1998; Erbe 2008; Erbe et al. 2016). This describes the reduction in audibility for one sound (termed ‘signal’) caused by the simultaneous presence of another sound (termed ‘noise’). Auditory masking can lead to disruption of a behaviour, lack of appropriate behavioural reactions, increased vulnerability to predators, reduced access to prey, reduced communication, changes in vocal behaviour, disruption of spawning activities and stress. While masking can be detrimental to the fitness, reproduction, and survival of individuals, it ends immediately after the masking sound ceases. Both anthropogenic and natural marine sound can affect hearing and partially or completely reduce an individual’s ability to effectively communicate; detect important predator, prey, and/or conspecific signals; and detect important environmental features associated with spatial orientation (Clark et al. 2009). This is true for all marine fauna; however, masking is most frequently associated with marine mammals. Masking reduces the communication space of marine mammals (Clark et al. 2009; Hatch et al. 2012).
• Behavioural effects: Numerous studies on marine mammal behavioural responses to sound exposure have not resulted in consensus in the scientific community regarding the appropriate sound exposure metric for assessing behavioural reactions. It is considered that avoidance behaviour represents a temporary and minor effect, unless avoidance results in displacement of whales from breeding, resting or feeding areas. There are no such known areas within the operational area. The intensity of behavioural responses of marine mammals to sound exposure ranges from subtle responses, which may be difficult to observe and have little implications for the affected animal, to obvious responses, such as avoidance or panic reactions. The context in which the sound is received by an animal affects the nature and extent of responses to a stimulus. The threshold for elicitation of behavioural responses depends on received sound level, as well as multiple contextual factors such as the activity state of animals exposed to different sounds, the nature and novelty of a sound, spatial relations between a sound source and receiving animals, and the gender, age and reproductive status of the receiving animal.
Thresholds The threshold criteria in Table 5-3 have been adopted for the assessment of potential noise impacts to cetaceans. Threshold criteria are presented as dual metric thresholds using weighted cumulative sound exposure level (SELcum,) and PK metrics for impulsive sounds. NMFS 2018 considers onset of PTS to have occurred when either one of the two is exceeded. For non-impulsive sounds, threshold criteria are provided using the weighted SELcum metric. Table 5-3 provides the modelled distances for the criteria. There are no defined noise exposure criteria for mortality and potential mortal injury impacts for cetaceans. These effects are extremely unlikely to occur as received sound levels of sufficient magnitude to cause mortality/ potential mortal injury are only likely to occur at extremely close range (i.e. <10 m) to an operating seismic source. This scenario is extremely unlikely to occur given the control and mitigation measures that are implemented for marine seismic surveys in Australian waters, in compliance with EPBC Policy Statement 2.1 (i.e. use of MFOs; observation, low-power and shutdown zones; soft starts etc.). Summary Based on the modelled results, the areas of potential impact are predicted for humpback whales based on the overlap of the seismic survey with the humpback whale migration BIA (refer to table below). As the seismic survey does not overlap the pygmy blue whale BIA, the potential areas of impact have not been calculated.
Potential area of impact for humpback whales
Total area of overlap
% of BIA Comments
Humpback whale migration BIA NWMR component
Total area: 195,115 km2
Santos Ltd | Keraudren Seismic Survey EP Summary Page 165 of 248
Humpback whale migration BIA overlap with operational area
2507 km2 1.3% Area of operational area as % overlap of the NMWR component of the humpback whale migration BIA.
Humpback whale migration BIA overlap with Ramp-up/ Full power Zone
721 km2 0.4% Area of operational area as % overlap of the NMWR component of the humpback whale migration BIA.
Modelled Distance
Total area of
potential impact
% of BIA Comments
TTS LF: SEL24h is adopted as it is the greater distance 26.29 km (D) 20.09 km (E)
4,298 km2 2.2% 26.29 km used as the potential worse case. The area is calculated as ramp-up / full-power zone plus the modelled distance for TTS impacts that overlaps with the humpback whale migration BIA.
PTS LF: SEL24h is adopted as it is the greater distance 1.35 km (E), 4.22 km (D)
1,111 km2 0.6% 4.22 km is used as the potential worse case. The area is calculated as ramp-up / full-power zone plus the modelled distance for PTS impacts overlap with the humpback whale migration BIA.
Behavioural LF: per pulse metric is adopted. 7.3 km
1,448 km2 0.7% 7.3 km is used as the potential worse case. The area is calculated as ramp-up / full-power zone plus the modelled distance for behavioural impacts overlap with the humpback whale migration BIA.
Seismic acquisition will not occur within the migration BIA for pygmy blue whales or within a known migration corridor. Although the timing of the survey may overlap with the pygmy blue whale migratory period, the survey area is located >58 km from the boundary of the blue whale migration BIA at the closest point. This exceeds the maximum modelled distance for TTS (26.3 km) and behavioural response thresholds for LF cetaceans (7.3 km). Pygmy blue whales may still traverse the operational area infrequently, however, large numbers of migrating individuals are not expected. Humpback whales have not been observed to be significantly displaced from their migratory pathways as a result of seismic sound, with the most consistent response to seismic activity being an alteration of course and swimming speed (McCauley et al. 2000). The southern portion of the survey area overlaps the deepest part of the humpback whale migration BIA. The migratory BIA North West Marine Region component covers an area of 119,115 km2 of which the ramp-up/ full-power zone overlaps by 721 km2. The area of overlap and maximum distance at which the behavioural response threshold may be exceeded (and thereby humpback whales altering their course or swimming speed) does not significantly reduce or narrow the migration BIA. Only sail lines associated with the Exploration survey component overlap the humpback whale BIA (Quijano et al. 2018). The seismic survey will not occur during peak humpback whale migration. The seismic survey will be terminated either by 31 July or earlier based on humpback whale instigated shutdowns indicating peak migration. It is likely that a small number of migrating individuals will traverse the survey area prior to seismic survey termination. Santos WA have increased the power down (low power) precaution zone from 2km to 3km when two sources are operating. If a whale is sighted within the 3km power down (low power) zone of either operating seismic vessel during dual source acquisition, then the second source will power down, so that the activity is then a single source survey. PTS through cumulative sound exposure is considered unlikely because of
Santos Ltd | Keraudren Seismic Survey EP Summary Page 166 of 248
the behavioural response of the individual whales (e.g. moving away from the source) and the application of the EPBC Act Policy Statement 2.1 (pre-start visual observations, soft start, lower-power zone (increased from 2 to 3km during dual source operations) and shut down zone).
Fish Receptors The following fish types have been identified for this assessment: • Site-attached species including syngnathid species such as pipefishes, pipehorses and
seahorses • Demersal fish species including commercial fish species such as tropical snappers and
emperors (Lutjanus spp. and Pristipomoides spp.) • Pelagic fish species including commercial fish species such as mackerel.
The following receptors associated with the above fish types have been identified: • Pilbara trap, line and trawl fisheries that target goldband snapper, bluespotted emperor,
and crimson snapper • Mackerel Managed Fishery (MMF) that targets mackerel species • Ancient coastline at 125 m depth contour KEF.
Fishes have developed two sensory mechanisms for detecting, localising, and interpreting underwater sounds and vibrations: the inner ear, which is tuned to sound detection, and the lateral line system, which allows a fish to detect vibration and water flow. Inter-specific variations in hearing range and sensitivity result from the different adaptations in these systems for perceiving sound pressure and particle motion information (Popper and Fay 2011). Based on their morphology, Popper et al. (2014) classified fishes into three categories comprising:
• Fishes with swim bladders whose hearing does not involve the swim bladder or other gas volumes (e.g., tuna, Thunnus sp. or Atlantic salmon, Salmo salar).
• Fishes whose hearing does involve a swim bladder or other gas volume (e.g., snapper and emperor Pristipomoides spp., Lethrinus spp. and Lutjanus spp.).
• Fishes without a swim bladder (e.g., mackerel, Scomberomorus spp.) that can sink and settle on the substrate when inactive (Popper et al. 2014, Carroll et al. 2017).
The most relevant metric for perceiving underwater sound for most fish species is particle motion but, with the exception of few species (Popper and Fay 2011; Popper et al. 2014), there is an almost complete lack of relevant data on particle motion sensitivity in fishes (Popper and Hawkins 2018). The majority of fish species detect sounds from below 50 Hz up to 500-1500 Hz. A smaller number of species can detect sounds to over 3 kHz, while a very few species can detect sounds to well over 100 kHz. The critical issue for understanding whether an anthropogenic sound affects hearing is whether it is within the hearing frequency range of a fish and loud enough to be detectable above threshold. For this impact assessment, it is assumed that all fishes can detect signals below 500 Hz and so can ’hear’ the seismic source. The potential impacts and sensitivities are summarised as follows: • Mortality and mortal injury: immediate or delayed death. • Recoverable injury: injuries, including hair cell damage, minor internal or external
hematoma, etc. None of these injuries are likely to result in mortality • TTS: a temporary reduction in hearing sensitivity caused by exposure to intense sound.
TTS has been demonstrated in some fishes, and its extent is of variable duration and magnitude. Short or long term changes in hearing sensitivity that may or may not reduce fitness. TTS is defined as any change in hearing of 6 dB or greater that persists. From Popper et al. (2014): “Temporary threshold shift (TTS) is a temporary reduction in hearing sensitivity caused by exposure to intense sound. TTS has been demonstrated in some fishes, and its extent is of variable duration and magnitude. TTS results from temporary changes in sensory hair cells of the inner ear and/or damage to auditory nerves innervating the ear (Smith et al. 2006; Liberman 2015). However, sensory hair cells are constantly added in fishes (e.g., Corwin 1981 1983; Popper and Hoxter 1984; Lombarte and Popper 1994) and also replaced when damaged (Lombarte et al. 1993; Smith et al. 2006; Schuck
Santos Ltd | Keraudren Seismic Survey EP Summary Page 167 of 248
and Smith 2009), unlike in the auditory receptors of mammals. When sound-induced hair cell death occurs in fishes, its effects may be mitigated over time by the addition of new hair cells (Smith et al. 2006 2011; Smith 2012 2015). After termination of a sound that causes TTS, normal hearing ability returns over a period that is variable, depending on many factors, including the intensity and duration of sound exposure (e.g., Popper and Clarke 1976; Scholik and Yan2001 2002a, b; Amoser and Ladich 2003; Smith et al. 2004a, b 2006 2011; Popper et al. 2005 2007). While experiencing TTS, fishes may have a decrease in fitness in terms of communication, detecting predators or prey, and/or assessing their environment.”
• Masking: the impairment of hearing sensitivity by greater than 6 dB, including all components of the auditory scene, in the presence of noise. Masking impairs an animal’s hearing with respect to the relevant biological sounds normally detected within the environment and can have long lasting effects on survival, reproduction and population dynamics of fishes. Acoustic masking only occurs while the interfering sound is present, and therefore, masking resulting from a single pulse of sound (such as an airgun impulses) or widely separated pulses would be infrequent and not likely affect an individual’s overall fitness and survival. In the absence of any qualitative scientific information, acoustic masking of signals caused by the reception of seismic sounds are assessed qualitatively, by assessing relative risk rather than by specific sound level thresholds.
• Behavioural effects: substantial change in behaviour for the marine fauna exposed to a sound. This may include long-term changes in behaviour and distribution, such as moving from preferred sites for feeding and reproduction, or alteration of migration patterns. This behavioural criterion does not include effects on single animals, or where animals become habituated to the stimulus, or small changes in behaviour such as a startle response or small movements. It is currently impossible to determine single value thresholds for the onset of behavioural reactions. Popper et al. (2014) propose broad response and effect categories. In the absence of any qualitative scientific information, behavioural effects caused by the reception of seismic sounds are assessed qualitatively, by assessing relative risk rather than by specific sound level thresholds. The transient nature of a seismic survey and the soft-start ramp up practices mean that for all fishes that have a large home range and are mobile the possible effects are predicted to commence with a behavioural effect. As the proximity to the sound source increases the effect is anticipated to increase.
The Working Group on the Effects of Sound on Fish and Turtles undertook a review of experimental findings of sound on fishes. In their American National Standards Institute (ANSI) accredited report (Popper et al. 2014) they presented sound exposure guidelines for different levels of effects for different groups of species), for mortality, recoverable injury and TTS. Santos WA has taken into consideration DPIRD’s risk assessment on the impacts of seismic to finfish stocks in the assessment of impacts from the seismic survey (Webster et al 2018), taking into consideration aquatic resource type, water column depth and seismic sound intensity. Thresholds For the assessment of impact to fish from seismic sound it is industry practice to use the exposure guidelines proposed by Popper et al. (2014). The presence or absence of a swim bladder and ancillary structures determines the level of susceptibility of fishes to injurious effects from exposure to intense sound. Accordingly, different exposure guidelines were developed for fishes without a swim bladder, fishes with a swim bladder not involved in perception of acoustic signals and fishes that use their swim bladders for hearing. The fish receptors identified for this assessment, such as site-attached species (including syngnathids) and demersal fish species, are included in the category of fish having a swim bladder while mackerel, a pelagic fish species, do not have a swim bladder. The fish receptors identified for this operational area and impact assessment such as red emperor, rankin cod and other demersal fish species have a swim bladder, whilst the mackerel species are a pelagic fish, and do not have a swim bladder. The guidelines set out criteria for injury due to different sources of noise. The criteria include a mixture of indices including SEL, peak sound pressure levels and where insufficient data exists
Santos Ltd | Keraudren Seismic Survey EP Summary Page 168 of 248
to determine a quantitative guideline value the risk is categorised in relative terms as “high”, “moderate” or “low” at three distances from the source. There are currently no quantitative guidelines or criteria for fish behaviour as Popper et al. (2014) found that there was insufficient data available with which to establish sound level thresholds for behaviour. In their review the expert working group of Popper et al. (2014) did not find sufficient trends to recommend behavioural thresholds. Instead, they assessed masking and behavioural effects qualitatively by assessing relative risk, being the distance of a fish from the seismic source, rather than by a specific threshold. Based on the application of the Popper et al. (2014) semi-quantitative exposure criteria, there could be a high risk of behavioural impacts in fish species near (tens of metres) from the seismic source with the level of risk declining to low at thousands of metres from the seismic source. Threshold criteria in Table 5-5 have been adopted for the assessment of potential noise impacts to fish. Table 5-5 provides the modelled distances for the criteria.
For this impact assessment the Popper et al. (2014) sound exposure guideline for TTS of 186 dB SELcum is applied with period of time applied to the SEL metric of 24 hrs. There have recently been some concerns raised by stakeholders on other titleholders’ seismic programs in regard to the appropriateness of using a 24-hour period to assess SELcum and the potential for TTS and other effects associated with SELcum. An independent, expert peer review in relation to this issue was conducted by Professor Arthur Popper (Popper 2018). The review considered the potential impacts of cumulative seismic noise from the proposed Santos Bethany 3D seismic survey on fish, including TTS effects, and length of time for recovery and the applicability of an SEL24h metric. Though this information was based on another survey it is applicable to the Keraudren seismic survey as pelagic and demersal fish species within the areas are similar and the premise for the modelling was a racetrack that bought the vessel back to a similar starting point within 24 hrs, thus receiving the closest shots within a 24-hour period. The review noted:
• It is highly unlikely that there would be physical damage to fishes as a result of the survey unless the animals are very close to the source (perhaps within a few meters).
• Most fishes in the Bethany region (and given the similarity in fish species, therefore can be applied for the Bedout Sub-basin), being species that do not have hearing specialisations, are not likely to have much (if any) TTS as a result of the Bethany 3D survey.
• If TTS takes place, its level is likely to be sufficiently low that it will not be possible to easily differentiate it from normal variations in hearing sensitivity. Even if fishes do show some TTS, recovery will start as soon as the most intense sounds end, and recovery is likely to even occur, to a limited degree, between seismic pulses. Based on very limited data, recovery within 24 hours (or less) is very likely.
• Nothing is known about the behavioural implications of TTS in fishes in the wild. However, since the TTS is likely very transitory, the likelihood of it having a significant impact on fish fitness is very low.
Summary Based on the modelled results the potential areas of impact are predicted for indicator fish species, based on the total area of ramp-up/ full-power zone plus the modelled distances for the relevant threshold criteria (see below).
Potential area of impact for fish
Modelled Distance Area Comments
Behavioural Tens of metres from the seismic source
TTS (ensoni-fication
within the water
Demersal fish (eg . snapper, emperor and cod) 7.64 km (Maximum Over Depth - MOD)
8,022 km2
Potential area of impact is the area of ramp-up/ full power zone plus worst case modelled distance for TTS (MOD - as fish swim within water column) threshold criteria for demersal fish (fish with swim
Santos Ltd | Keraudren Seismic Survey EP Summary Page 169 of 248
column or at the
seafloor over 24 hours)
Pelagic fish (eg mackerel) 7.64 km (MOD)
bladder) and pelagic fish (mackerel does not have swim bladder).
Demersal fish associated with the Ancient Coastline at 125 m KEF 7.24 km (at the seafloor)
7,883 km2
Potential area of impact is the area of ramp-up/ full power zone plus worst case modelled distance for TTS (at the seafloor within the Development component as this is where the KEF is located) threshold criteria for demersal fish (fish with swim bladder).
Mortality or potential
mortal injury
Demersal fish (eg . snapper, emperor and cod) 230 m (MOD)
5,609 km2
Potential area of impact is the area of ramp-up/ full power zone plus worst case modelled distance for mortality (MOD - as fish swim within water column) threshold criteria for demersal fish (fish with swim bladder).
Pelagic fish (eg mackerel) 100 m (MOD)
5,569 km2
Potential area of impact is the area of ramp-up/ full power zone plus worst case modelled distance for mortality (MOD - as fish swim within water column) threshold criteria for pelagic fish (mackerel - fish without swim bladder).
Demersal fish associated with the Ancient Coastline at 125 m KEF 152 m (at the seafloor)
5,585 km2
Potential area of impact is the area of ramp-up/ full power zone plus worst case modelled distance for mortality (at the seafloor within the Development component as this is where the KEF is located) threshold criteria for demersal fish (fish with swim bladder).
Recoverable injury
Demersal fish (eg . snapper, emperor and cod) 260 m MOD
5,618 km2
Potential area of impact is the area of ramp-up/ full power zone plus worst case modelled distance for recoverable injury (MOD - as fish swim within water column) threshold criteria for demersal fish (fish with swim bladder).
Pelagic fish (eg mackerel) 260 m MOD
5,618 km2
Potential area of impact is the area of ramp-up/ full power zone plus worst case modelled distance for recoverable injury (MOD - as fish swim within water column) threshold criteria for pelagic fish (mackerel - fish without swim bladder).
Demersal fish associated with the Ancient Coastline at 125 m KEF 250 m (at the seafloor)
5,615 km2
Potential area of impact is the area of ramp-up/ full power zone plus worst case modelled distance for recoverable injury (at the seafloor within the Development component as this is where the KEF is located) threshold criteria for demersal fish (fish with swim bladder).
Fish populations may be further impacted if behavioural responses result in deflection from migration paths, feeding grounds or disturbance of spawning, potentially affecting recruitment of fish stocks. Considering the distribution range of key species that overlap with the seismic survey area, adequate spawning biomass levels and that migratory routes are not restricted, the potential impact on fish populations due to behavioural responses is considered to be low. Available evidence suggests that behavioural changes for some fish species may be no more than a nuisance factor, and that within a few seconds they continue their previous activity. The temporary, short range displacement of pelagic or migratory fish populations may have insignificant repercussions at a population level (McCauley 1994).
Potential impacts to fish are within an acceptable level based on:
The assessment criteria applied is highly conservative (based on the review of the research and scientific papers), the most conservative threshold was adopted and the furthest
Santos Ltd | Keraudren Seismic Survey EP Summary Page 170 of 248
distance to the criteria (across all of the modelled sites) has been utilised providing further conservatism in the impact assessment.
In relation to the Fisheries Research Report No. 288, Risk Assessment of potential impacts of seismic air gun surveys on marine finfish and invertebrates in Western Australia (Webster et al.2018), the risk assessment outcomes for individuals of finfish, based on water depth and volume of air guns categories, returned the maximum risk scores ranging from high for demersal finfish to negligible for pelagic finfish. This applies to mortality of individual fish only.
Mortality of fish (both immediate and delayed) is considered highly unlikely based on no documented cases of fish mortality upon exposure to seismic airgun sound under experimental or field operating conditions (ERM 2017).
Seismic surveys have been undertaken overlapping with the operational area historically and based on the annual State of the Fisheries reports the spawning biomass and breeding stock of spatially overlapping fisheries with the operational area has remained assessed as sustainable-adequate (Fletcher et al. 2017).
13% of the PFTIMF area (closed and open areas to fishing) will be exposed above the TTS threshold. Given this is a temporary state and that demersal fish move, are not evenly distributed within the PFTIMF and beyond and are not all exposed at the one time, overall the number of fish exposed is not at a level that would lead to an impact on the population.
The area of potential impact for the assessed species is a low proportion of the area they are likely to inhabit. Thus, population effects are not likely as there is a significant proportion of the population that remains unaffected.
The are no identified or known spawning aggregation areas within the operating area, thus spawning is assumed possible in all areas where fishing occurs and spawning individuals may be accessed by commercial fishers as spawning fish may form aggregations and are therefore productive areas to fish.
Popper et al. (2005) reports that fish that showed TTS recovered to normal hearing levels within 18-24 hours, the potential area of impact for fish TTS is assessed as being acceptable based on hearing loss (and subsequent decrease in fitness) being temporary and recovery taking place in a relatively short timeframe after the source array has moved away from the exposed fish, and the sound levels are reduced.
Any behavioural impacts are likely to be short-lived and fish would return to normal behaviours once the vessel has moved away based on research by Woodside (2011a 2011b), Miller and Cripps (2013) and Wardle et al. (2001). Based on Popper et al. 2014 behavioural effects are assessed as high within tens of metres of the seismic source. Pelagic and demersal fish can avoid this impact area and site-attached species do not occur within this effect range. Behavioural impacts to demersal and pelagic fish species are possible but would be temporary, localised and unlikely to impact at a population level.
Pelagic fish such as mackerel are strong swimmers swimming up to 100 km along the coast (DPIRD 2018). Thus, potential mortality injury, recoverable injury and TTS are unlikely as they can swim away from a seismic source. Impacts are more likely to be behavioural including avoiding or moving away from the area for the period of the survey.
Demersal fish species such as snapper, emperor and cod though not as strong swimmers as pelagic fish species are able to move away from an approaching seismic source. Thus, potential mortality, potential mortality injury, recoverable injury and TTS are unlikely with behavioural impacts more likely.
The area of overlap of the ramp-up/ full-power zone with the Ancient Coastline at 125 m KEF is small (404 km2 - 2.5%). The SPRAT profile for the Ancient Coastline at 125 m KEF states “Little is known about fauna associated with the hard substrate of the escarpment,
Santos Ltd | Keraudren Seismic Survey EP Summary Page 171 of 248
but it is likely to include sponges, corals, crinoids, molluscs, echinoderms and other benthic invertebrates”. There is little published information on the fish communities associated with the Ancient Coastline at 125 m KEF but due to the presence of epibenthic communities associated with hard substrate, it was considered that more demersal and site-attached fish species may also be present. A recent study of the ancient coastline KEF within the Keraudren seismic survey area has indicated that a consistent structurally complex seabed feature that may provide unique habitat for demersal and site-attached fish was not evident (RPS 2019). However, an area of high relief and greater demersal fish abundance and diversity was described in the 95 to 115 m depth range outside of the Keraudren survey area. Broadly, this feature (95 to 115 m water depth range with steeper gradient interpreted from bathymetry contours) also appears to occur in a small area of the Keraudren ramp-up/full-power zone (coarsely estimated as 60 km2;
Adult fish not in the immediate vicinity of the noise generating activity are generally able to vacate the area and avoid physical injury. However, larvae and spawn are not highly mobile and are therefore more likely to incur injuries from the sound energy, including damage to their hearing, kidneys, hearts and swim bladders. Such effects are unlikely to happen outside of the immediate vicinity (230 m) of the highest energy sound sources using threshold criteria in Popper et al. (2014).
The ecological significance of the physiological and behavioural effects is expected to be low based on the following factors:
The short distances from the sound source associated with injury and mortality of fish and larvae are unlikely to affect their predators, including fauna such as dolphins, and whales due to the vast expanse of similar habitat and prey available in the region. Like the fish, their predators are also likely to exhibit avoidance behaviour around the seismic source. This means that both fish and their predators are not likely to be present around the operating seismic source, resulting in no net loss of feeding opportunities; and
− The seismic survey will not result in destruction or modification of habitat.
Commercial Fisheries
Receptors Effects on fishing from seismic surveys are potentially from physical displacement of fishers from their licence areas if operating simultaneously or from reducing the catchability of the fish. Section 5.3.1 assesses impacts from physical displacement of fishers. Section 5.3.3 assesses the potential impacts to fish species. The following key fisheries that have historic fishing effort (based on 2013-2017 Fish Cube data received from DPIRD October 2018) within the operational area for the seismic survey have been identified for this assessment:
Pilbara Trap Managed Fishery Pilbara Fish Trawl Interim Managed Fishery Pilbara Line Fishery Mackerel Managed Fishery (Area 2).
In addition to finfish commercial fisheries, the seismic survey overlaps with the Pearl Oyster Fishery Area 2. There are no specific areas within the Keraudren operational area that have been identified as fish spawning areas. Consultation with DPIRD and review of relevant fishery management plans (DPIRD 2017; Mackie et al. (2010); Gaughan et al. (2018); Newman, S.J., et al. 2000; Newman, S.J., et al.2014; DEH 2004), advise that spawning grounds for most commercial species occurs throughout their distribution. The fishers typically target areas of higher fish densities (pers comm H. Webb, G. Kailis, fishers roundtable meeting, 22 November 2018), which will likely include spawning individuals/ aggregations, especially given there are no restrictions on fishing timing for the fisheries with historic fishing effort in the operational area. Scientific evidence of acoustic impacts on fish catches are somewhat equivocal because of the lack of determination between natural movements and changes in fish abundance. Based on studies presented in Engås et al. 1996 and Slotte et al. (2004) where fish were observed to return to the survey areas within 3-5 days following completion of the seismic surveys, any
Santos Ltd | Keraudren Seismic Survey EP Summary Page 172 of 248
disruptions would likely be short-term and during the survey, with conditions returning to ‘normal’ levels soon after. Not all studies have resulted in behavioural alteration. Feeding Atlantic herring (Clupea harengus) schools off northern Norway showed no changes in swimming speed, direction or school size in response to a transmitting seismic vessel as it approached from a distance of 27 km to 2 km, over a 6-hour period (Peña et al. 2013). As fishing areas are large and commercial fish species are free-swimming, if fish are ‘scared’ temporarily from an area, based on evidence presented, it is likely they will be displaced temporarily to another area still within the fishing zone and so able to be caught. Effects will be temporary as the seismic vessel traverses each survey line, and fish are expected to move away as the airgun array approaches. Localised effects on the catchability of commercially important finfish species within the survey area (pelagic or demersal) will be limited to a radius (up to 260 m) around the location of the airgun. There is little research undertaken on what effect seismic surveys have on fish catchability. Salgado Kent et al. (2016) “The issue of changes in commercial fisheries catch rates due to seismic surveys is almost always contentious in Australia”. They acknowledge that there has been some effort to relate fisheries catch data to seismic survey effort, but to date none of the Australian efforts to relate fin-fish catch rates with seismic surveys have yielded results of any meaning. The GMEM project provided no clear evidence of adverse effects on scallops, fish, or commercial catch rates due to the 2015 seismic survey (Przeslawski et al. 2016b): “Catch rates in the six months following the seismic survey were different than predicted in nine out of the 15 species examined across both Danish Seine and Demersal Gillnet sectors. Across both fishing gear types, six species (tiger flathead, goatfish, elephantfish, boarfish, broadnose shark and school shark) indicated increases in catch subsequent to the seismic survey, and three species (gummy shark, red gurnard, sawshark) indicated decreases in catch. These results support previous work in which the effects of seismic surveys on catch seem transitory and vary among studies, species, and gear types.” Research to date has identified effects and no effects from seismic surveys on catch rates and abundance. This is likely due to the importance of the context of exposure. In many instances, fish may move away from an area when a seismic survey is being undertaken. This could impact on the catchability and catch rates for the target species of any commercial fisheries occurring in the same area at the same time. Consultation with the Timor Reef Fishery (TRF) referenced in Santos’s Bethany 3D Seismic Survey Environment Plan (2018) indicates that the fishery experienced reduced catches of up to 50% following the Caldita-Barossa 3D survey, consultation in April 2017 indicated that catch rates had not returned to normal after 9 months. Based on the information from TRF, it is possible that that there could be potential impacts on catchability of commercial species which is likely to be localised (within the operational area) and based on anecdotal evidence recovery to pre-seismic levels may take up to a year.” Bruce et al. 2018 used a 2-D seismic survey in the Gippsland Basin, Bass Strait, Australia in April 2015 as an opportunity to quantify fish behaviour (field-based) and commercial fisheries catch desktop study) across the region before and after airgun operations. The catch rates in the six months following the survey indicated that six species (tiger flathead, goatfish, elephantfish, boarfish, broadnose shark and school shark) showing increases in catch following the seismic survey, and three species (gummy shark, red gurnard, and sawshark) showing reductions. A critical review of the potential impacts of marine seismic surveys on fish and invertebrates (Carroll et al. 2017) found that other studies on fish have positive, inconsistent, or no effects from seismic surveys on catch rates or abundance. A desktop study of four species (gummy shark, tiger flathead, silver warehou, school whiting) in Bass Strait, Australia, found no consistent relationships between catch rates and seismic survey activity in the area, although the large historical window of the seismic data may have masked immediate or short-term effects which cannot therefore be excluded (Przeslawki et al. 2016). Przeslawki et al. (2016) concluded that “These results support previous work in which the effects of seismic surveys on catch seem transitory and vary among studies, species, and gear types”. The body of peer-reviewed literature does not indicate any long-term abandonment of fishing grounds by commercial species, with several studies indicating that catch levels returned to pre-survey
Santos Ltd | Keraudren Seismic Survey EP Summary Page 173 of 248
levels after seismic activity had ceased (Carroll et al. 2017). As noted by Przeslawski et al. (2016), it is possible that fish may be displaced from a survey footprint to adjacent areas, however the total number of fish within the fishery stock remains unchanged. Summary Based on the modelled results, the potential areas of impact are predicted for each of the fisheries (adopting criteria for key indicator species for each fishery). For the purpose of this impact assessment, utilising the data made available to Santos WA, the area of the fishery for these calculations has been assumed as the “catch effort” area determined from Fish Cube (2013 – 2017 data). Based on feedback from fishers and the DPIRD, Santos WA has assessed the areas of impact are based on the overlap of the ramp-up/full-power zone plus the modelled distances for the required threshold criteria with the “catch effort” areas. The assumption was made that demersal fish species such as snapper, emperor and cod are in larger numbers in areas where there is catch effort data recorded within the Pilbara line, trap and trawl fisheries. Thus, Santos WA has assumed that fishing activity (based on catch effort data) is representative of fish presence. In determining the % impacts that are included in Table 5-6, the calculation is based on the catch effort area of the fishery and excludes Area 3 for the PLF and Areas 3 and 6 for the PFTIMF as these areas are not able to be fished by the fisheries. Table 5-6 includes the potential percentage of impact for demersal and pelagic fish species, conservatively assuming that each fishery is represented by the area of catch effort. It is important to note that the catch effort data represents the annual catch for the fishery per fishing grid block (cube). It has been communicated Santos WA (by fishers and DPIRD) that the fishers may target areas of higher fish density (based on stakeholder feedback, however based on CPUE data from 2004 – 2008 presented in Newman et al 2018 the fishing effort within the operational area for key indicator species appears to be evenly distributed. The Santos WA commissioned study (RPS 2019) identified within the operational area a few areas where there may be increased density or diversity of demersal fish, however, this is not reflected in the CPUE data but may coincide with stakeholder feedback that there are areas that are more productive than others. There are no specific fishery management controls for the pelagic and demersal fisheries overlapping with this survey and potentially impacted by this activity based on timing/ seasonality, or spatial controls within the specific managed areas (exclusion from Areas 3 and 6 for the Pilbara trawl fishery and Area 3 for the Pilbara Trap fishery are taken into consideration when assessing impacts to fishery catch effort areas). Santos WA consider that the use of the 2013-2017 annual fishing effort data provided by DPIRD to undertake the impact assessment is appropriate based on the wide use of the fishing areas, and no specific identified fisher management constraints based on the time of year.
Potential impacts to catch rates are within an acceptable level based on:
Mortality of fish (both immediate and delayed) is considered highly unlikely based on no documented cases of fish mortality upon exposure to seismic airgun sound under experimental or field operating conditions (ERM 2017).
Santos WA notes that in DPIRD’s risk assessment of impacts from seismic surveys (Webster et al.2018), consequence on individual fish only considers mortality and that the risk assessment is not for application to larger scale impacts such as regional aggregations, fisheries, management units and populations.
Santos WA have applied all the relevant mitigation strategies listed in Table 1 of the Fisheries Occasional Publication No. 112, Guidance Statement on undertaking seismic surveys in Western Australian waters (Department of Fisheries 2013).
Large areas of catch effort area (83% or more) are out of range of the predicted impact thresholds of the by the seismic survey; given the presence of fish in previously surveyed areas following cessation of the acoustic disturbance, if there was an impact to catchability because of the activity, catch rates post-survey return to typical catch levels relative to fishing effort.
Santos Ltd | Keraudren Seismic Survey EP Summary Page 174 of 248
The stock assessment for all target species (mackerel, red emperor, bluespotted emperor and rankin cod) indicates adequate stock status, breeding stock and fishery catch levels (Gaughan and Santoro 2018).
It is Santos WA’s assessment that this survey will not impact stocks at a population level. This assessment is based on acoustic modelling, available academic research, the size and duration of the survey (110 days), and anecdotal evidence that previous seismic surveys (in 2011 2012 and 2015) over and immediately surrounding the Keraudren seismic survey area have not resulted in detectable population level effects on fish stocks (based on no changes to fish catch, or fishery management reported in annual State of the Fisheries reports over the same period).
Based on Popper et al 2014, fish recovery from behavioural effects or TTS would be expected in days to weeks. No population level effects are predicted to commercial fish species hence no lasting effects on their catchability and consequently to fishers catch rates are expected;
Only two vessels fish for mackerel within the Keraudren seismic survey operational area indicating that though mackerel are present they would not be in significant numbers compared to other areas within the fishery where more vessels fish. Thus, impacts if they did occur would not be at a population level;
The shallowest part of the Keraudren ramp-up/ full power zone is 43m. Harvesting of pearl oyster occurs in 10 to 35 m water depths; as the collection of pearl oysters for the Pearl Oyster Managed Fishery is restricted to shallow diving depths below 35 m) with the closest potential harvesting area 34 km (water depth of 35m) from the ramp-up/full power zone and the nearest pearl farm 63 km. Thus, no direct impacts to commercial pearling harvesting grounds, farms or leases are predicted.
The survey avoids some of the key spawning periods (i.e. planktonic phase) of target species of commercial and recreational fishers (refer Section 5.3.3).
Sharks Receptors The operational area overlaps a whale shark foraging and migration BIA. Other shark species (e.g. sandbar shark, Carcharhinus plumbeus) are likely to transit the operational area, but potential impacts to whale sharks within a known migratory path has been used as a worst-case scenario for this environmental assessment. Limited research has been conducted on shark responses to marine seismic surveys. Myrberg (2001) stated that sharks differ from bony fish in that they have no accessory organs of hearing such as a swim bladder and therefore are unlikely to respond to acoustical pressure. The study also suggested that the lateral line system does not respond to normal acoustical stimuli and is unable to detect sound-induced water displacements beyond a few body lengths, even with large sound intensities (Myrberg 2001). Other reports indicate that sharks are highly sensitive to sound between approximately 40 and 800 Hz, which overlaps with seismic sound frequencies. Klimley and Myrberg (1979) established that an individual shark will suddenly turn and withdraw from a sound source of high intensity (more than 20 dB re 1 µPa above broadband ambient SPL) when approaching within 10 m of the sound source. Thresholds No threshold criteria currently exist for acoustic impacts from seismic exposure to sharks. As a conservative and precautionary approach, the Popper et al. (2014) exposure guideline for fish with no swim bladder for potential mortality, mortal injury and recoverable injury peak pressure level threshold of >213 dB re 1 μPa (PK) has been used for this assessment. Summary
The threshold criteria of >213 dB re 1 μPa (PK) was reached at a maximum distance of 100 m for maximum-over-depth, which is relevant for sharks that reside within the water column. It is expected that the potential effects to whale sharks associated with acoustic noise will be the same as for other pelagic fish species, resulting in minor and temporary behavioural change such as avoidance. This aligns with Popper et al. (2014) guidelines, which detail that there is the potential for high risk of behavioural impacts in fish species near (tens of metres) the seismic source with the level of risk declining to low at thousands of metres from the seismic source.
Santos Ltd | Keraudren Seismic Survey EP Summary Page 175 of 248
Potential impacts to whale sharks are considered to be within an acceptable level based on the following:
• Acoustic modelling indicating sound levels with potential harmful effects limited to within 100 m of the seismic sources.
• EPBC Act Policy Statement 2.1 – Interaction between Offshore seismic exploration: Part A will be applied to whale sharks. By implementing soft start and shutdown procedures, whale sharks are unlikely to be exposed to potentially harmful peak sound levels.
• The ramp-up/ full-power zone overlaps <3% of the total whale shark foraging and migration BIA (220,505 km2).
• Whale sharks spend majority of their lives in the open ocean, however, they also form predictable seasonal aggregations of mostly juvenile males on the coastal shelves of tropical regions e.g. Ningaloo. (Andrzejaczek 2016) from March to July. Thus, transiting whale sharks from Ningaloo Reef may occur within the Keraudren seismic survey area. These whale sharks then migrate north along the 200 m isobath mainly between July and November (TSSC 2015). The whale shark foraging and migration BIA is not restricted by the location of the seismic activity, with sufficiently deep open water around the entire operational area for whale sharks to traverse.
• As the seismic survey will be acquired in water depths <150m and because the survey will be completed before 31 July, there is only a small period in time where potentially a low number of migrating whale sharks may be encountered within the operational area, given that whale sharks migrate mainly along the 200m isobath (39 km north of the seismic survey).
• Seismic noise has not been identified as a threat to whale sharks (or other shark species identified that may be in the area in either the Approved Conservation Advice (TSCC 2015) or previous in force Whale Shark Recovery Plan 2005 – 2010 (DEH 2005a). Noise pollution is not identified as a pressure to whale sharks in the Marine Bioregional Plan for the North-west Marine Region (DSEWPaC 2012).
• The area of potential impact assumes that the area will receive the same sound levels at the same time for the period of a survey, which is not the case. The received sound levels at a location will reduce and increase as the seismic vessel moves through the area during a survey.
• Mortality, potential mortal injury and recoverable injury to sharks are unlikely with impacts more likely to be behavioural including avoiding or moving away from the area for the period of the survey.
Invertebrates Receptors The following invertebrates have been considered for this assessment:
• crustaceans • bivalves including pearl oyster brood stock up to a maximum 70 m water depth • corals • invertebrates associated with the Ancient Coastline at 125 m KEF depth contour.
Invertebrates are less sensitive to noise impacts than fish species and marine mammals due to their lack of air filled internal organs. Exposure to anthropogenic sound sources could have a direct consequence on the functionality and sensitivity of the sensory systems of marine invertebrates. Budelmann (1992b) classifies the sensory organs involved in receiving underwater sound in this taxonomic group into three categories: superficial receptor systems, internal statocyst receptor systems and chordotonal organs. Many marine invertebrates are permanently in contact with sediment on the seabed. The sediment, however, does not follow the movement of the surrounding water. Therefore, exposure to underwater sound will result relative to the movement between the body of these animals and the oscillating water column. Accordingly, it is important to also consider the propagation of vibration through the ground. For benthic organisms, this type of vibration is likely of similar or greater importance than the water-borne vibration or even the compressional component of a sound (Roberts and Elliott 2017). The published scientific information on vibration sensitivity in marine invertebrates is scarce (Roberts et al. 2015;
Santos Ltd | Keraudren Seismic Survey EP Summary Page 176 of 248
Roberts et al. 2016; Popper and Hawkins 2018). To date, there is no convincing evidence for any significant effects induced by non-impulsive noise in benthic invertebrates. Given the rapid attenuation of vibrational signals beyond the near-field of a sound source (Morley et al. 2014), it is unlikely that these stimuli are causing more than behavioural effects (e.g. flight or retraction) or physiological (e.g. stress) responses in marine invertebrates. The potential sensitivities are summarised below for each of the key groups of invertebrates likely to be present within the operational area. Crustaceans There have been several recent reviews of seismic noise impacts to invertebrates— Carroll et al. (2017), Edmonds et al. (2016), Salgado Kent et al. (2016) and Webster et al. (2018). Several studies have been undertaken on decapods (crabs, lobsters, prawns) with a range of effects to no effects identified, though none have found any evidence of increased mortality due to acoustic impacts from seismic exposure. A range of physiological responses have been identified in some studies, however, the received sound levels are typically at levels that would be received within a few hundred metres from the sound source or have been from repeated exposure at the same sound levels, which is not realistic in an actual seismic survey. From 2013 to 2015, a long-term study evaluated the acoustic impacts from seismic exposure on southern rock lobsters (Jasus edwardsii) (Day et al. 2016a). The study found that sub-lethal effects, relating to impairment of reflexes, damage to the statocysts and reduction in numbers of haemocytes (possibly indicative of decreased immune response function), were observed after exposure to measured received sound levels of 209-212 dB re 1 μPa (PK-PK). Payne et al. (2007) in a study on seismic impacts to the American lobster (Homarus americanus) did not detect any differences in righting time in the 9, 65, or 142 days after exposure to received noise levels of 202 dB re 1 μPa (PK-PK). Payne et al. (2007) also found no effects on American lobster haemolymph biochemistry but possible reduction in calcium. The ecological consequences of alterations in physiology and behavioural responses have not been documented. Molluscs A number of studies have been undertaken on commercially important scallops (Pecten fumatus) with conflicting results. Typically, impacts can be induced in laboratory experiments or have been seen in field studies where there has been repeated exposures that are not necessarily reflective of an actual seismic survey. From studies undertaken on the impacts to scallops exposed to repeated seismic sound, the scallops suffered physiological damage with no signs of recovery over a four-month period; suggesting potentially reduced tolerance to subsequent stressors. In addition, changes in behaviour and reflexes during and following seismic exposure were observed. Day et al. (2016a 2016b), however, cautioned that it was unclear from the study whether the observed physiological and behavioural impairments would result in mortality beyond the timeframes considered in their study. Przeslawski et al. (2018) concluded that there was no evidence of increased scallop mortality, or effects on scallop shell size, adductor muscle diameter, gonad size, or gonad stage due to the seismic sound from an actual seismic survey. The authors concluded that the study provided no clear evidence of adverse effects on scallops, fish, or commercial catch rates due to the 2015 seismic survey undertaken in the Gippsland Basin. Przeslawski et al. (2018) further concluded that the study provided a robust and evidence-based assessment of the potential effects of a seismic survey on some fish and scallops. However these results should be interpreted in the context of other studies such as Day et al. (2016a 2016b), and should not be generalised to include other animals due to the vast range of different physiology and sensory systems. No specific studies have focussed on the effects of seismic sources on pearl oysters (Pecten maxima), however, studies on the impacts of underwater explosions on several species of bivalve, including two pearl oyster species, indicated strong resilience to the shock waves created by the detonation of explosives underwater. LeProvost et al. (1986) found that no mortality occurred in the exposed animals over a 13-week period and at a minimum exposure
Santos Ltd | Keraudren Seismic Survey EP Summary Page 177 of 248
range of 1 m from the blast centre. Extrapolating this finding to seismic sources would suggest even less impact on bivalves than explosives, that is, it is likely that bivalves would have to be within a very close range of a seismic source to experience pathological damage or mortality – available evidence would suggest ~1 to 2 m. These studies do not offer any insights as to the distances at which sub-lethal effects (such as morphological, biochemical and physiological changes being indicators of some level of stress in an animal) could occur. Corals There is limited published literature on the potential impacts of seismic noise on hard and soft corals, and unlike other faunal groups, currently there are no peer-reviewed criteria against which potential noise impacts to coral can be assessed. Scleractinian corals, primarily plate corals in families Agaracidae and Acroporidae, and soft corals were monitored in situ before, during and after a 3D seismic survey (Heyward et al.2018). There were no detectable impacts on scleractinian coral mortality, skeletal damage or visible signs of stress immediately after and up to four months following the 3D marine seismic survey. Similarly, there was no evidence of a behavioural response, such as polyp withdrawal or flaccidity in soft corals such as Lobophytum spp. Thresholds There has recently been several comprehensive reviews of seismic noise impacts to invertebrates—e.g. Carroll et al. (2017), Edmonds et al. (2016) and Salgado Kent et al. (2016). There are significant differences between seismic studies regarding sound exposure and the environment in which studies were conducted (Carroll et al. 2017). No exposure criteria currently exist to enable an evaluation of potential mortality/potential mortal injury effects in crustaceans. However, based on the research findings to date these effects are likely to be confined to extremely close ranges (i.e. <10 m) from the source. The threshold criteria in Table 5-7 have been adopted for the assessment of noise impacts to invertebrates. Table 5-7 provides the modelled distances for the criteria. Summary Crustaceans
Crustaceans are likely to be present throughout the survey area with patchy distribution based on seabed habitat. Commercial invertebrate species, such as scampi and crabs, are not likely in the survey area as they prefer deeper waters and prawn species are caught closer to the coast. To inform the assessment of potential impacts on crustaceans the PK-PK sound level at the seafloor was estimated at all modelled sites and compared to the assessment criteria of 202 dB re 1 μPa (PK-PK). The assessment criteria of 202 dB re 1 μPa (PK-PK) was reached at ranges between 320 m and 411 m depending on the modelled site with range increasing with water depth to the seafloor.
Potential impacts to crustaceans are considered to be within an acceptable level based on:
• Lethal effects in studies have not been observed (Payne et al.2007, Day et al.2016a). • Sub-lethal effects, relating to impairment of reflexes, damage to the statocysts and
reduction in numbers of haemocytes are documented at received levels of 209 dB re 1 μPa (PK-PK) (Day et al. 2016 a). Based on the distances from the seismic source that these levels would be reached, it is possible that some individuals will incur a reduction in fitness. However, it is unlikely that this would occur to the majority of individuals within the survey area, therefore, impacts at a population level due to reduced fitness would be unlikely as there would be sufficient unaffected crustaceans to maintain the population.
• At higher received noise levels of 209 dB re μPa (PK-PK) (Day et al. 2016 a) impacts to embryonic development were not observed with hatched larvae found to be unaffected in terms of egg development, the number of hatch larvae, larval dry mass and energy content and larval competency (i.e. survival in adverse conditions) thus recruitment should be unaffected. (Day et al. 2016a). Therefore, impacts at a population level due to reduced recruitment would be unlikely as impacts to larvae and eggs were not observed.
Santos Ltd | Keraudren Seismic Survey EP Summary Page 178 of 248
• The survey area does not overlap commercial crustacean fishery activity.
Molluscs
Bivalves are likely to be present throughout the survey area with patchy distribution based on seabed habitat. Commercial bivalve species are not harvested within the survey area, though the waters out to 70 m have been anecdotally identified as where pearl oyster broodstock may be present (Aaron Irving, PPA, pers comm). Using the conservative threshold value for impacts to molluscs of 37.6 m/s2 for particle motion maximum (presented by Day et al. (2016)), a radial distance of 80 m is reached at Scenario 1, Site 1 and therefore considered the worst case based on the shallowest water depth.
Potential impacts to bivalves are considered within an acceptable level based on:
• If mortality impacts did occur to bivalves, it would be within natural mortality rates and unlikely to have long term or population effects based on the findings of the study by Day et al. (2016a).
• If physiological and behavioural impairments did occur to bivalves it would not occur to all bivalves thus, impacts at a population level would be unlikely as there would be sufficient unaffected bivalves to maintain the population.
• The shallowest part of the Keraudren ramp-up/ full power zone is 43 m. Harvesting of pearl oysters occurs in 10 to 35 m water depths, with the closest potential harvesting area 34 km (water depth of 35m) from the ramp-up/ full power zone and the nearest pearl farm 63 km. Thus, no direct impacts to commercial pearling harvesting grounds, farms or leases are predicted.
• Feedback from the Pearl Producers Association (PPA) is that pearl oyster broodstock may be present out to 70 m water depths. The area of the seismic survey ramp-up and full-power zones that overlaps water depths up to 70 m is 557 km2. This is a small proportion of the seabed within 70 m water depth contour that is adjacent to inshore pearl oyster harvesting areas.
• Preliminary findings from the Santos WA commissioned survey (RPS 2019) found limited evidence of pearl oysters within the survey area, with approximately 50% of the surveyed transects (44 to 60 m water depths) to classified as ‘garden’ habitat that potentially support pearl oysters; and
• Impacts to the ecosystem functioning and integrity of habitat where pearl oysters may be present are not predicted.
Coral There are no documented areas of corals or exposed hard substrate that could support corals in the shallower water depths of the ramp-up/ full-power zone, however, such habitat may occur. Recently, RPS (2019) reported the presence of soft corals in video transects in less than 60 m water depth. Using the threshold value of 226 dB re 1 μPa PK, corals would only be impacted if they were within 10 m of the seismic source. This will not occur in the Keraudren seismic survey ramp-up/ full power zone. Invertebrates associated with the Ancient Coastline KEF
Mobile (e.g. crustaceans) and sessile (e.g. molluscs and coral) invertebrates may be associated with the emergent high relief habitat thought to be a characteristic of the Ancient Coastline at 125 m depth contour KEF. The Keraudren ramp-up/ full-power zone overlaps the Ancient Coastline KEF by 404 km2, equivalent to 2.5% of the KEF total area (16,190 km2).
Potential impacts to invertebrates associated with the Ancient Coastline KEF are considered within an acceptable level based on:
• The threshold value for particle motion was reached at 80 m from the modelled site located in 52 m water depth. Given that modelling was not undertaken for the deeper sites located within the KEF, conservatively adopting an 80m radius for potential impacts
Santos Ltd | Keraudren Seismic Survey EP Summary Page 179 of 248
results in a predicted area of impact of 406 km2, which represent 2.5% of the Ancient coastline at 125 m depth contour KEF.
• At the water depth of 125 m the assessment criteria of 226 dB re 1 μPa PK for corals is not reached and hence impacts to soft and hard coral, if present at the Ancient coastline at 125 m depth contour KEF are not predicted to occur.
• RPS (2019) used BRUVS to assess fish assemblages at 125m water depths within and outside of the Keraudren seismic survey area and noted that the seabed was characterised by mobile flat sandy gravel with little conspicuous epibiota and signs of bioturbation and that there was no consistent structurally complex seabed feature that ‘site-attached’ fish would normally be associated with. Thus, if present, the distribution and abundance of invertebrates on this feature are sparse.
• RPS (2019) described a high relief emergent reef habitat in shallower waters (95 to 115 m water depth) to the west of the Keraudren seismic survey area that may be represented within the ramp-up and full-power zones on the basis of similar depth and slope. If such a feature exists, it is likely to have an increase in diversity of invertebrates compared to featureless sandy bottoms including the seabed along the Ancient Coastline KEF.
• Impacts to the ecosystem functioning and integrity of the Ancient coastline at 125 m depth contour KEF are not predicted.
Plankton Receptors The following have been identified as areas where plankton may be of higher value:
• Whale shark foraging and migration BIA. • Pearl oyster brood stock area conservatively estimated to be out to 70 m water depth
(based on consultation with Pearl Producers Association). • Commercial fish spawning areas.
Plankton is a collective term for all marine organisms that are unable to swim against a current. This group is diverse and includes phytoplankton (plants) and zooplankton (animals), as well as fish and invertebrate eggs and larvae. There is no scientific information on the potential for noise-induced effect in phytoplankton and no functional cause-effect relationship has been established. Noise-induced effects on zooplankton, such as copepods, cladocerans, chaetognaths and euphausiids, have been investigated in a number of sound exposure experiments. Parry et al. (2002) studied the abundance of plankton after exposure to airgun sounds but found no evidence of mortality or changes in catch-rate on a population-level. The effects of impulsive sound on fish eggs and larvae were investigated in the context of offshore pile driving. Bolle et al. (2012) investigated the risk of mortality in common sole larvae by exposing them to impulsive stimuli in an acoustically well-controlled study. Even at the highest exposure level tested, at an SEL of 206 dB re 1 µPa2·s (corresponding to 100 strikes at a distance of 100 m) no statistically significant differences in mortality was found between exposure and control groups. Contrary to these results, McCauley et al. (2017) found that after exposure to airgun sounds generated with a single airgun (150 in3) zooplankton abundance decreased and mortality in adult and larval zooplankton increased two- to three-fold when compared with controls. In this first, large-scale field experiment on the impact of seismic activity on zooplankton, a sonar and net tows were used to measure the effects on plankton. A maximum effect-range of horizontal 1.2 km was determined. The findings contradicted the conventional idea of limited and very localised impact of intense sound in general, and seismic airgun signals in particular, on zooplankton, with the results indicating that there may be noise-induced effects on these taxa and that these effects may even be negatively affecting ocean ecosystem function and productivity. The study was compromised by methodological design (small sample sizes, large daily variability in the baseline and experimental data) and the statistical robustness of the data and conclusions (large number of speculative conclusions that appear inconsistent with the data collected over a two-day period). The lead author stressed that even though their conclusions were based on numerous assumptions, the combined likelihood of all measured parameters occurring without being correlated to the airgun survey is extremely low (McCauley, pers. comm.).
Santos Ltd | Keraudren Seismic Survey EP Summary Page 180 of 248
CSIRO (Richardson et al. 2017) simulated the large-scale impact of a seismic survey on zooplankton using the mortality rate found by McCauley et al. (2017). The aim of the CSIRO study was to estimate the spatial and temporal impact of seismic activity on zooplankton on the North west Shelf of Western Australian. The major findings of the CSIRO study were that there was substantial impact of seismic activity on zooplankton populations on a local scale within or close to the survey area, however, on a regional scale the impacts were minimal and were not discernible over the entire North west Shelf Bioregion. The study found that the time for the zooplankton biomass to recover to pre-seismic levels inside the survey area, and within 15 km of the area, was only three days following the completion of the survey. This relatively quick recovery was due to the fast growth rates of zooplankton, and the dispersal and mixing of zooplankton from both inside and outside of the impacted region (Richardson et al. 2017). Though the CSIRO model was based on a hypothetical 3D survey of 2,900 km2 in size and over a 35-day period it is seen as being applicable for this impact assessment based on the following: • The CSIRO model was designed to model potential impacts to plankton on the North west
Shelf where the Keraudren seismic survey will take place. • Richardson et al. (2017) showed that zooplankton communities can begin to recover
during the seismic survey, during periods of good oceanic circulation, or “bottom out” at a maximum impact level (presumably where growth rates and/or zooplankton entering the survey area roughly approximate mortality rates) after 23 - 30 days of commencement of survey operations.
Day et al. 2016 found that “seismic exposure did not result in a decrease in fecundity, either through a reduction in the average number of hatched larvae or as a result of high larval mortality; compromised larvae or morphological abnormalities. These results support the suggestion that early life stage crustaceans may be more resilient to seismic air gun exposure than other marine organisms (Pearson et al. 1994 as cited in Day et al. 2016)”. Received levels were ~211 dB re 1 μPa (PK-PK; approximately 205 dB re 1 μPa PK) and similar to those proposed by Popper et al. (2014). Thresholds Popper et al. (2014) has published exposure guidelines for fish eggs and larvae which are based on pile driving. The thresholds in Table 5-8 have been considered in the assessment of noise impacts to plankton. Also considered are the recent results from McCauley et al. (2017) of 178 dB re 1 μPa PK-PK to assess impacts on plankton more broadly. As a precautionary approach, the 178 dB re 1 μPa PK-PK has also been applied in this impact assessment for zooplankton, which equates to a modelled minimum distance of 8.1 km and a maximum distance of 10.3 km (depending on the site). These are considered conservative. Summary Potential impacts to plankton are considered to be within an acceptable level based on:
• Any mortality or mortal injury effects to fish eggs and larvae resulting from seismic noise emissions are likely to be inconsequential compared to natural mortality rates of fish eggs and larvae, which are very high (exceeding 50% per day in some species and commonly exceeding 10% per day) (Tang et al. 2014). For example, in a review of mortality estimates (Houde and Zastrow 1993), the mean mortality rate for marine fish larvae was M = 0.24, a rate equivalent to a loss of 21.3% per day.
• In the experiment undertaken by McCauley et al. (2017) zooplankton mortality rate background levels were 19%, thus predicted impacts to zooplankton from the seismic survey are likely to be within natural mortality rates.
• Estimated distances for mortality of fish eggs and larvae (maximum 230 m from the source) and low risk to incur a recoverable injury, TTS or behavioural response (derived from applying the threshold values provided by Popper (2014)), would impact fish eggs and larvae at a local rather than a regional scale with sufficient time for recovery to local populations. For this survey, it is considered that the potential impacts and risks to fish eggs and larvae in the water column will be localised and temporary.
• As described in Richardson et al. (2017) zooplankton communities can begin to recover during the seismic survey such that a continuous decline in zooplankton throughout the
Santos Ltd | Keraudren Seismic Survey EP Summary Page 181 of 248
duration of the seismic survey is not anticipated and parts of the survey area would be replenished as the survey progressed.
Fish
• There are no identified areas for spawning within the survey area for species that have spawning windows overlapping the timing of the survey, therefore, the assessment of impact on fish eggs of these species assumes that they could be present at any location within the survey area during the time of spawning. If the thresholds for mortality and mortal injury (worse case) for eggs and larvae are applied then the area of exposure over the duration of the survey for these 3 species of fish could be up to 5,609 km2. Note, however, that this area will be exposed progressively over a 110 day period and the spawning period for each of these species does not occur exclusively within the timing of the seismic survey. Given that only a small proportion of the potential area for spawning would be exposed at any one time, the spawning success of these 3 species of fish is unlikely to be impacted.
• For the Mackerel Managed Fishery, the three indicator species for assessment and stock status are Spanish mackerel, grey mackerel and samson fish. The spawning biomass and breeding stock for these species has been assessed as adequate (Fletcher et al. 2017) for the past 5 years, in which time there has been both ongoing commercial fishing, and seismic surveys undertaken.
• For the Pilbara line, trap and trawl fisheries the three indicator species for assessment and stock status are red emperor, bluespotted emperor and Rankin cod. A 2016 assessment of the three indicator species estimated the spawning biomass of red emperor stock to be currently above the threshold level and the stocks of bluespotted emperor and Rankin cod are well above the target spawning biomass levels (Fletcher et al. 2017) for the past 5 years, in which time there has been both ongoing commercial fishing, and seismic surveys undertaken.
Potential impacts to other fauna reliant on plankton as a food or recruitment source are considered to be within acceptable level based on:
Whale sharks
• Whale sharks seasonally aggregates in coastal waters off Ningaloo Reef between March and July, at Christmas Island between December and January, and in the Coral Sea between November and December.
• These seasonal aggregations are thought to be linked to localised seasonal ‘pulses’ of food productivity (TSS 2015). If whale sharks are moving between these areas to feed it could be assumed that they are not reliant on feeding while migrating and that feeding is opportunistic.
• Mortality or mortal injury effects to plankton, fish eggs and larvae do not impact on whale sharks being able to feed on them as the plankton will still be available within the water column.
• Though northern migration can occur during July it would be expected that numbers would be low as it is the start of the migration period. There will be no seismic activity within the whale shark migration / foraging BIA from 31 July onwards further reducing potential impacts.
Pearl Oysters
• Spawning of pearl oysters occurs all year round, with a peak in September to November (Southgate and Lucas 2008) or October to December (Condie et al. (2006). The Keraudren survey is proposed outside of the peak spawning period.
• Following spawning the pearl oysters then metamorphose, settling into a benthic, filter feeder within 3 to 4 weeks. Pearl oysters are therefore less likely to be impacted by seismic surveys once they have settled on the seabed. Losses in the water column during the
Santos Ltd | Keraudren Seismic Survey EP Summary Page 182 of 248
planktonic stage are extremely high under natural conditions, and <1% of the fertilised eggs actually survive the veliger stage (Southgate and Lucas 2008).
• Published information on pearl oyster broodstock by Daume et al. (2016) and Condie et al. 2006, indicates that:
− Pearl oyster distribution in the Eighty Mile Beach region is concentrated around the 8 m to 15 m water depths
− Brood stock responsible for stock recruitment into the fishery is located in water depths less than 20 m
− Pearl oyster inshore stock appears to be self-sustaining and may even be providing larvae to deeper stock in irregular recruitment events.
• Towed video footage of the Keraudren survey area in less than 60 m water depth indicated that significant numbers of pearl oysters do not occur within the operational area at these depths (RPS 2019).
Socio-economic Receptors A number of potential socioeconomic receptors are present in the operational area including: • Shipping • Commercial fishing • Tourism and recreational fishing and diving • Submarine cable networks.
Discharge of acoustic emissions will not have any impacts to commercial shipping. Impacts to the commercial fisheries are discussed in Section 5.3.3. Given the anticipated level of recreational fishing likely to occur within the operational area, the impacts discussed in the commercial fisheries and fish sections are likely to be greater than the level of potential impact of the seismic survey on recreational fishing activity. The Eighty Mile Beach AMP does not overlap with the operational area. The ramp-up/ full-power zone is located 16 km from the marine park boundary. At this distance, the received noise levels within the AMP may exceed biological impact thresholds for LF cetaceans. The values and sensitivities of the park, which may be impacted by noise, are: part of the migratory pathway of the protected humpback whale. It is likely that a small number of migrating individuals will traverse the survey area prior to seismic survey termination and that the seismic survey will not occur during peak humpback whale migration. Two subsea communications cables cross the ramp-up zone, the North West Cable System and the JASURAUS telecommunication cable (which was decommissioned in 2012 and no longer used). As per ICPC Recommendation No. 8 Procedure to be Followed whilst Offshore Seismic Survey Work is undertaken in the Vicinity of Active Submarine Cable Systems (ICPC 2014) if the internal components of these electro-optic devices (OED) are subjected to acceleration greater than specification there is a risk of serious damage. The procedure details that where a planned survey would result in pressure waves of 2.0 bar and above arriving at the seabed in the location of an OED the seismic survey is required to be adjusted in order to reduce the pressure to the OED. Recreational and commercial divers may operate within the EMBA. The following areas have been identified as locations where diving may occur in waters adjacent to the ramp-up zone: • Bedout Island – 26 km from the ramp-up zone • Pearl farm lease – 63 km from the ramp-up zone • Pearl harvesting area – 34 km from ramp-up zone.
As the only socio-economic receptor that could credibly be impacted by the acoustic emissions, the following impact assessment considers the impacts to divers. Interaction with divers includes a variety of different types of diving activities, for example (but not limited to) commercial, recreational, scientific, and fisheries (e.g., pearl oyster divers). Divers exposed to high levels of underwater sound can suffer from dizziness, hearing damage or other injuries to other sensitive (mainly air-filled) organs, depending on the frequency and
Santos Ltd | Keraudren Seismic Survey EP Summary Page 183 of 248
intensity of the sound. The human auditory system is significantly less sensitive underwater than in air and is further degraded if diving equipment obstructs the ears or face (e.g. diving with a hood or full facemask). Thresholds Subsea Cables Based on the ICPC (2014) a +2 bar overpressure is not to be exceeded. Overpressure is the positive peak pressure, or what is modelled as peak pressure (PK). Based on the conversion of PK to Bar (10^((PK -220)/20)) a + 2 bar overpressure is equivalent to ~ 226 dB re 1 μPa PK. Divers Under water, the human ear is about 20 dB less sensitive than it is in air at low frequencies (20 Hz), increasing to 40 dB at mid-frequencies (less than 1 kHz), and increasing to 70–80 dB less sensitive at higher frequencies (Parvin 1998). Divers who wear neoprene hoods have even higher hearing thresholds (lower sensitivity) above 500 Hz because the hood material absorbs high-frequency sounds (Sims et al. 1999). Exposure studies related to divers have typically focused on military sonar exposure, with little information on seismic survey operations, and as such care is required when considering thresholds for non-military divers, particularly for impulsive sounds such as seismic source impulses (Ainslie 2008). Underwater auditory threshold curves indicate that the human auditory system is most sensitive to waterborne sound at frequencies between 400 Hz to 1 kHz (Parvin et al. 1994); cited in Anthony et al. 2009), and these frequencies have the greatest potential for damage. Within the literature (all as cited in Ainslie 2008), there is some variation in acceptable SPLs for divers. The auditory threshold of hearing under-water was lowest at 1 kHz (70 dB re 1 μPa SPL) and increased for lower and higher frequencies to around 120 dB re 1 μPa at 20 Hz and at 20 kHz (Parvin 1998). Fothergill et al. (2000) and Fothergill et al. (2001) conducted controlled acoustic exposure experiments on military divers under fully controlled conditions at a US Ocean Simulation Facility and an US Open water test facility. The following exposure limit for both military and recreational divers was suggested as a conservative measure: For frequencies between 100 and 500 Hz, the maximum SPL should be 145 dB re 1 μPa over a maximum continuous exposure of 100 seconds or with a maximum duty cycle of 20 per cent and a maximum daily cumulative total of three hours. The trading relation between the maximum SPL and duration was 4 dB per doubling of duration (e.g., 141 dB SPL for a 200 second exposure) (Pestorius et al. 2009). In alignment with these studies, and considering only frequencies between 100 and 500 Hz, Parvin (2005) suggested 145 dB re 1 μPa as a safety criterion for recreational divers and swimmers. Seismic airgun sources are broadband sources, and therefore, for this assessment the most precautionary and conservative diver acoustic impact threshold is the 145 dB re 1 μPa SPL suggested by Parvin (2005). This does not imply that this level is associated with the onset of injury. Summary Subsea Cables The area where the subsea cables overlap the ramp-up/ full-power zone aligns with the acoustic modelling Scenario 2 Site 1. At this location 226 dB re 1 μPa PK was not reached at the seafloor (Quijano et al. 2018). Thus, no impacts to the subsea cables are predicted. Divers From the acoustic modelling the maximum distance where received levels exceed 145 dB re 1 µPa SPL is 23.2 km. Guidance note (DMAC 12) issued by the UK Diving Medical Advisory Committee (DMAC) “Safe Diving Distance from Seismic Surveying Operations” (DMAC 2011) recommends that where diving and seismic activity occur within 10 km of each other, a joint risk assessment should be conducted. This guidance is currently being reviewed as IMCA reported that on several occasions diving had to be halted at around 30 km of separation. The reports strongly suggest that the 10 km distance as being an appropriate distance for the initiation of a joint risk assessment between all parties is “far too short.”
Santos Ltd | Keraudren Seismic Survey EP Summary Page 184 of 248
A workgroup comprising of IMCA, the International Association of Oil & Gas Producers, DMAC and seismic survey representatives was formed to consider the matter and the draft updated guidance will recommend: • Where diving and seismic activity are scheduled to occur within 60 km, all parties should
be made aware of the planned activity. As a minimum, this should include clients/operators, diving and seismic contractors;
• Where seismic survey/diving SIMOPS are proposed within 30 km, a joint risk assessment should be undertaken. The risk assessment should consider ramp-up trials as well as other risk control measures;
• If the risk assessment generates a requirement for a ramp-up trial, the starting point for the trial will also need to be determined by the risk assessment; and
• Should any member of the diving team in the water suddenly experience discomfort, the seismic source should be turned off immediately if a request is made to do so.
Recreational diving is common along the mainland coast and inshore islands of WA and is generally restricted to water depths less than 40 m, which is the prescribed depth limit for recreational divers (World Recreational Scuba Training Council). Charter boat operators do not offer bluewater diving tours (i.e. depths >40 m) and the maximum dive depths of >40 m is limited to exceptionally experienced divers. Recreational diving is therefore usually conducted in shallow waters of 40 m or less, as this is the depth limit that standard recreational dive certification allows. The draft DMAC guidance of 60 km for consultation has been used to identify areas where there are features in water depths up to 40 m that may be of interest to divers or where there are pearl leases. There are no known diving areas within the Keraudren operational area. Areas where diving may up occur in water depths up to 40 m within 60 km of the ramp-up zone are: • Bedout Island - 26 km from the ramp-up zone • Pearl farm lease – 63 km from the ramp-up zone • Pearl harvesting area – 34 km from ramp-up zone.
Based on the acoustic impact threshold of SPL 145 dB re 1 µPa SPL being reached at a maximum of 23.2 km this would not be reached at the nearest pearl farm lease nor the pearl harvesting area. However, it may be reached within water depths to 40 m from Bedout Island where people may dive. Consultation has been undertaken with the PPA and they have been informed of the distances between the survey area, pearling lease and harvesting area and provided information in relation to the distances to the diving noise impact criteria. No further action has been required. There are no known tour operators that go to Bedout Island, which is 96 km from the nearest town of Port Hedland thus it is not a likely destination for diving. If diving does occur there it is by private boat thus stakeholders are not able to be identified. Consultation with the only recreational dive shop in Port Hedland identified that free diving is mostly undertaken around Bedout Island’s offshore reef and coral bombies. Blue water diving does occur deeper chasing pelagic fish but no more than 1 – 5 nm (1.8 – 9.3 km) from the island. As the safety threshold for divers will potentially be reached within waters offshore from Bedout Island (known recreational dive location) and it is not known who and when recreational diving may occur, a scout vessel will be at Bedout Island when the seismic vessel is within 24 km of Bedout Island. The scout vessel will engage with any vessels present that maybe involved in diving activities. If an agreed protocol cannot be obtained and hence divers are in the water the seismic source will not be active within the area until the all clear that no divers are in the water is given from the scout vessel. Considering the above, Santos WA believes that with these management controls and stakeholder engagement, potential interactions with divers from proposed survey activities are considered ALARP and will be managed to acceptable levels.
Cumulative Impacts
Simultaneous operations of the seismic vessels, seismic source, MODU and MODU support vessels
Santos Ltd | Keraudren Seismic Survey EP Summary Page 185 of 248
Santos WA is planning to undertake drilling activities within the Keraudren ramp-up/ full-power zone from March 2019 onwards, which overlaps with the defined period during which the seismic survey will occur. The MODU and activities to support drilling will generate additional noise during the activity. As assessed in the Bedout Basin Exploration & Appraisal Drilling Environment Plan (A-00-RI-10076.01), an elevation in noise levels is not expected more than 3 km from the MODU. The MODU will have in place a 500 m petroleum safety zone. It is unlikely that additional noise from the MODU and support vessels will result in large increase in cumulative noise to the marine environment due to low level of noise emitted by the vessels in comparison to the seismic sources. Simultaneous operations of the seismic source and VSP Santos WA is planning to undertake VSP on the wells that will be drilled within the ramp-up zone. It is anticipated that only one well will be drilled to the stage where VSP could occur within the defined period of the seismic survey. This could lead to an increase in elevated noise levels for the period that VSP is undertaken, which is estimated to be 24 hours for a well. Santos WA and its VSP/ wireline contractor have previously calculated (for the Driftwood-1 well VSP activities), that the maximum sound exposure level (SEL) from VSP activities is ~221 dB re 1μPa2.s @ 1 m (from the source). At 350 m, 500 m and 1,200 m from the source, the SEL would decrease to 172, 167.5 and 160 dB re 1μPa2.s, respectively. For both the VSP and seismic survey to achieve their objectives a separation distance of 10 km will be applied to ensure there is no interference between each activity. It would be expected that the VSP sound exposure levels would further reduce such that at 10 km the seismic source would be the dominant sound and VSP sound levels would not significantly increase the sound exposure to any receptors within the area. Thus, cumulative impacts to receptors from the seismic survey and VSP activities over 24 hours are not predicted. Concurrent operations with other seismic surveys For seismic surveys that occur at the same time the Bureau of Ocean Energy Management (BOEM 2014) recommends a 40 km geographic separation distance (based on worst case scenarios) between the sources of simultaneous seismic surveys to minimise the impacts to marine life by providing a ‘corridor’ between vessels. The maximum impact range for the seismic survey is 20.09 km for TTS for low-frequency cetaceans. A conservative distance of 50 km (40 km BOEM recommendation plus 10 km) from the ramp-up zone was used to identify any seismic surveys that may be undertaken in 2019. There are no seismic surveys are planned within 50 km of the ramp-up zone and at the same time in 2019, thus cumulative impacts form simultaneous seismic surveys are not predicted. Cumulative impacts from previous surveys Cumulative impacts can occur when the timing between surveys is less than the recovery rate of any potential impacts. A review of previous seismic surveys over or near the operational area identified three 3D seismic surveys and one 2D seismic survey. The most recent survey that overlaps the operational area was completed in November 2015 giving a period of over 4 years for recovery. Based on the noise impact assessment undertaken for the Keraudren survey the recovery for any impacts to receptors would be: • Immediately after the completion of the seismic survey for migratory or transient species
that may avoid the area e.g. whales, whale sharks, turtles and pelagic fish. • Days or weeks after the completion of the seismic survey for demersal fish species
including commercial fish that may show avoidance or behavioural reactions during the survey.
• Days to months after the completion of the seismic survey for plankton based on Richardson et al. (2017) identified that the time to recovery (to 95% of the original level) for the Survey Region and Survey Region + 15 km recovery was 39 days (38-42 days) after the start of the survey and three days (2-6 days) after the end of the survey.
• Up to a year after the completion of the seismic survey for site-attached fish species based on Planes et al. (2005), which identified that if the structural and biological integrity of the habitat is maintained, and there are neighbouring un-impacted areas that can supply recruits, coral reef fish assemblages appear able to respond rapidly to large-scale natural
Santos Ltd | Keraudren Seismic Survey EP Summary Page 186 of 248
and anthropogenic change. Planes et al. (2005) identified that after nuclear testing removed all fish over on area of 12 km2 but left the benthic habitat untouched fish assemblages recovered to pre-test assemblages within 1 – 5 years. One year is used for this assessment based on the fact that not all fish will be impacted, as was the case for the nuclear test.
• Up to a year after the completion of the seismic survey for invertebrates, as only sublethal impacts where identified that would not reduce reproductive potential or inhibit annual spawning.
Based on the fishing effort reported in the annual State of the Fisheries reports (2013 to 2017) for key indicator species, there has been no decline in the tonnages of fish caught for the allocated licenses and seismic surveys have been undertaken within this period overlapping the area of catch effort for these fisheries. Thus, using a recovery time of one year cumulative impacts to receptors from previous seismic surveys are not predicted. Cumulative impacts from overlap of the exploration and development survey components The Keraudren seismic survey consists of an Exploration and Development survey component which overlap spatially. Each component will be acquired separately and there will be no simultaneous operations. The acquisition plan is to acquire the development survey area first, followed by the exploration survey area. Based on this plan the temporal separation between completing the last line within the development component and commencing with the first line within the exploration component will be dependant on the sail time between the lines, expected to be less than 12 hours. This is the shortest temporal separation between completing the development survey and commencing the exploration survey. As each subsequent exploration survey line is undertaken the time difference between when the development survey line was acquired over a specific area and then overlapped by the exploration line is getting greater. This implies that receptors in the overlap area could theoretically experience repeated exposure to seismic source impulses that could aggravate any noise-induced effects. Highly mobile species, such as fishes that are not site-attached, turtles and cetaceans, are not likely to remain within the area of potential overlap during the seismic survey; consequently, these species are not at risk of cumulative effects. Some demersal species could be subject to a second overpass of the seismic source on this occasion and may experience cumulative effects. Site-attached species occurring on the Ancient coastline at 125 m depth KEF, however, could be subject to a second overpass of the seismic source on this occasion and may experience cumulative effects. Modelling of the sound propagation from the two seismic sound sources predicts that the largest effect range for mortality/potential mortal injury in the most sensitive fish group (site-attached) can be expected to occur at a distance of 152 m at the seafloor, based on the PK metric for Scenario 2, Site 3. A secondary overpass would not increase this range to the mortality/potential mortal injury exposure threshold and hence would not result in an aggravation of the initial noise-induced effect in site-attached fishes. With regard to the acoustic energy accumulated over a 24-hr period, a second overpass would lead to an increase in SEL. The SEL24h metric, predicted to potentially cause mortality/potential mortal injury within a range of 150 m for a single overpass would therefore be the relevant metric to assess with regard to cumulative effects for site-attached fishes inhabiting the KEF. The modelling of the effect range using the SEL24h metric, however, was based on survey operations covering lines at a minimum spacing of 225 m within a 24-hr period. The transition from the development survey component to the exploration survey component, upon completion of the development survey, is the only possible scenario that could theoretically result in the overpass of the exact same location within a 24-hr period. For crustaceans, behavioural and physiological effects have been documented after exposure to seismic source impulses but Day et al. (2016a) did not find any increase in mortality in these animals from repeat exposure. The documented effects are temporary, and animals are likely to recover between successive overpasses of the seismic sound source. Natural mortality levels in bivalves in the study by Day et al. (2016b) were 5%; after a single overpass of a seismic sound
Santos Ltd | Keraudren Seismic Survey EP Summary Page 187 of 248
source mortality increased to 9 – 11 % and to 11 - 16% after a secondary overpass. These data provide the baseline for assessing the potential cumulative effect of a repeated overpass of the seismic source on bivalves.
Potential Impacts – Helicopter and Vessel Noise
Reactions of cetaceans to circling aircraft (fixed wing or helicopter) are sometimes conspicuous if the aircraft is below an altitude of 300 m, uncommon at 460 m and generally undetectable at 600m (NMFS 2001). Baleen whales sometimes dive or turn away during over-flights, but sensitivity seems to vary depending on the activity of the animals. The effects on cetaceans seem transient, and occasional over-flights probably have no long-term consequences on cetaceans. Observations by Richardson and Malme (1993) indicate that, for bowhead whales, most individuals are unlikely to react significantly to occasional single-pass low-flying helicopters transporting personnel and equipment at altitudes above 150 m. Leatherwood et al. (1982) observed that minke whales responded to helicopters at an altitude of 230 m by changing course or slowly diving. Marine fauna including cetaceans, marine turtles and fish are expected to show behavioural responses to the in response to vessel operating noise levels greater than behavioural response thresholds described in Section 5.3.1. Any potential marine fauna behavioural impacts due to vessel or helicopter noise are expected to be temporary and short ranged.
Impact Assessment
Receptors Consequence
Noise from operation of seismic source
Threatened / Migratory / Protected Fauna
Acoustic emissions generated by the seismic source(s) may result in impacts to receptors including; behavioural response, TTS, PTS or injury and mortality. Noise levels at which these effects have been recorded differs between species, as such receptor-specific thresholds have been applied, as support by the scientific literature. Cetaceans PTS through cumulative sound exposure is considered unlikely because of the behavioural response of the individual whales (e.g. moving away from the source) and the application of the EPBC Act Policy Statement 2.1 (pre-start visual observations, soft start, lower-power zone (increased from 2 to 3km during dual source operations) and shut down zone). Due to control measures in place (soft starts and application of the EPBC Policy Statement 2.1 – Part A), physical injury or PTTS is unlikely to occur. Impacts will be restricted to temporary impacts to hearing (TTS) or behavioural responses, such as avoidance. No foraging, calving or resting areas are within an area where noise levels could be elevated above impact threshold levels. Although the ramp-up/ full-power zone overlaps with the humpback whale migration BIA, there will only be a short period of potential overlap with the peak migration period nominally being from mid-July. During this period of overlap it is expected that migrating humpback whales numbers would be low and an adaptive management procedure will be in place to mitigate impacts if humpback whales numbers are greater than expected. Additionally, the timing of the survey overlaps with the pygmy blue whale migration period, but noise levels in the migration BIA do not exceed impact thresholds. Impacts are expected to be temporary behavioural response (lasting days) or TSS (lasting 24 hrs) to transient individuals only. As such, the consequence has been assessed as minor. Marine turtles Impacts to marine turtle may include mortality/potential mortal injury or behavioural response. The survey timing does not overlap with the critical habitat for flatback internesting nor the peak internesting period for flatback turtles. The ramp-up/ full-power zone does overlap the flatback BIA. Thresholds for mortality/mortal injury or behaviour are not exceeded within the 60 km buffer applied to the critical habitat for internesting flatbacks therefore, internesting females will not be exposed to noise levels exceeding impact thresholds and therefore impacts to nesting or internesting behaviour is not expected. The implementation of soft starts will prevent discharge of the seismic source at full capacity in close proximity to marine turtles, and
Santos Ltd | Keraudren Seismic Survey EP Summary Page 188 of 248
therefore impacts will be limited to behavioural disturbance to transient individuals. As such, the consequence level has been assessed as minor. Seabirds Diving seabirds may be exposed to underwater noise during foraging, particularly plunge-divers, although incidence of injury is absent. Due to the scale of scale of impacts to prey species (fish and invertebrates) indirect effects due to displacement of prey species is unlikely. Temporary displacement may occur around the vessels, however, given the areas over which pelagic seabirds forage, this is unlikely to be of significant impact to individuals or populations. The consequence level is assessed as negligible. Sharks There is limited research on the effects of seismic surveys on sharks, however, due to the lack of swim bladders it is expected that the potential effects will be the same as for other pelagic fish species without swim bladders, resulting in minor and temporary behavioural change such as avoidance. The survey area overlaps the migration/foraging BIA for whale sharks. The survey timing overlaps with the start of the expected peak occurrence in the area and therefore large numbers are not expected to be encountered over the survey period. An adaptive management procedure will be in place to mitigate impacts if whale shark numbers are greater than expected. No long-term or population impacts to whale sharks, or other transient shark species, are predicted thus the consequence level is assessed as minor. Fishes Hearing ranges and sensitivities vary substantially between species depending on anatomy (e.g. presence of swim bladder) and behaviour (e.g. mobile or site attached). Fish species may be exposed to noise levels exceeding thresholds for mortality/ mortal injury, recoverable injury, TTS and behavioural responses. Mortality/ mortal injury is not expected to occur to fishes that have the ability to move away from the source array, and to date such have been documented. TTS and recoverable injury may occur to a small proportion of the overall population and recovery is expected. Behavioural effects are assessed as high within tens of metres of the seismic source, which pelagic and demersal fish can avoid. Behavioural impacts to site attached species that may be associated with the Ancient coastline at 125 m depth contour KEF, and demersal and pelagic fish including commercial species are possible but would be temporary, localised and unlikely to impact at a population level. As such, the consequence level is assessed as minor. Crustaceans Crustaceans, including commercial species, are likely to be present throughout the survey area with patchy distribution based on seabed habitat, with potential increased presence on the Ancient coastline at 125 m depth contour KEF. A relatively small area of the KEF is overlapped by the ramp-up/ full-power zone. Thresholds for lethal effects were not exceeded, although sublethal effects could occur to a proportion of the population. At received noise levels comparable to those predicted in the noise modelling, studies found no evidence of impacts to embryonic development or the factors effecting recruitment. Although effects at the population level are not expected, due to conflicting results reported in the scientific literature, the consequence has been assessed as minor. Molluscs Changes in behaviour and risk of mortality to molluscs (scallops) from multiple exposures to seismic sources have been reported. Molluscs are likely to be present throughout the survey area with patchy distribution based on seabed habitat, with presence more likely in the Ancient coastline at 125 m depth contour KEF. Pearl oysters are not harvested within the survey area though the waters out to 70 m have been identified anecdotally as where pearl oyster broodstock may be present. It is expected that if mortality impacts did occur, it would be within natural mortality rates and a very small proportion of the local population. If physiological and behavioural impairments did occur effects would be seen at the individual rather than population level. The RPS survey (RPS 2019) indicates limited pearl oysters within the transects surveyed overlapping the seismic area. Impacts at a population level are not expected so the
Santos Ltd | Keraudren Seismic Survey EP Summary Page 189 of 248
consequence was assessed as negligible, however, due to the conflicting results reported in the scientific literature, the consequence has been assessed as minor. Plankton By applying conservative thresholds from McCauley et al. (2017) and using these as the basis to model impacts to plankton populations (Richardson et al. 2017), 14% of the plankton biomass may be potentially removed up to 10.3 km from the seismic source(s). Given the length of sail lines and the currents in the area aiding natural replenishment, this level of plankton depletion is not expected to have ecosystem-wide impacts, including on the seasonal migration of whale sharks through the area, or have population level effects to species with planktonic life stages, including commercial fish and invertebrate species. Impacts at a population level is not expected so the consequence was assessed as negligible. However based on the limited number of studies and data available conservatively the consequence has been assessed as minor.
Physical Environment/ Habitat
Impacts to the physical attributes of the Ancient coastline at 125 m depth contour KEF are not expected. The consequence of potential impacts to the values and sensitivities are discussed above.
Threatened ecological communities
Not applicable – no threatened ecological communities identified in the area over which noise emissions are expected.
Protected Areas Noise levels may exceed impact thresholds within the Eighty Mile Beach AMP for humpback whales and turtles which are included as values and sensitivities for the AMP. The consequence of potential impacts to these receptors is discussed above.
Socio-economic Receptors
Potential impacts to fish from noise levels exceeding exposure thresholds may have direct effects on commercial fisheries. Population level impacts to fish are not expected, with potential impacts being restricted to behavioural responses at the individual level. Behavioural responses may displace fish from known fishing grounds, however, such responses are expected to be temporary. No long-term changes to benthic habitats, including invertebrate populations or plankton populations are expected and therefore there is no compelling reason to suggest that temporary behavioural responses will result in long term avoidance of key fishing grounds. Behavioural responses may temporarily disrupt spawning of some commercial fish species, however, given the size of the survey area in context of the broader region, and the length of fish spawning periods, is unlikely to lead to complete recruitment failure of future cohorts. Santos WA commit to ensure that Commercial fishing licence holders are no worse off as a result of the seismic survey. The consequence to commercial fisheries has been assessed as minor. The pearl oyster fishery uses diving as a method of harvesting. Additionally, recreational divers, while not as common compared to elsewhere in WA (e.g. Ningaloo Reef) may be present around Bedout Island or along the mainland coast. Control measures, implemented based on locations where noise levels are expected to exceed the safety criterion, will prevent physiological impacts to divers. However, this may result in temporary displacement if it is agreed that diving will not be undertaken. As such, the consequence has been assessed as minor.
Overall Consequence Ranking
B - Minor Consequence rankings were provided for receptor groups due to the variation in receptor sensitivity. Impact assessments were based on worst case scenarios for received noise levels and receptor sensitivity (e.g. behaviour in BIAs). Where evidence is lacking or contradictory, a conservative approach was taken.
Noise from operation of vessels and helicopters
Santos Ltd | Keraudren Seismic Survey EP Summary Page 190 of 248
Threatened / Migratory / Protected Fauna
Noise generated from vessels and helicopters may result in physiological or behavioural impacts to marine fauna. However, acoustic emissions from vessels and helicopters will be less than that of the seismic sources.
Physical Environment/ Habitat
Likely habitats to be impacted from noise in the area are benthic habitats, which have non-coral invertebrates (such as sea fans and gorgonians) which are not known to be significantly impacted by noise emissions. No decrease in local population size / area of occupancy of species / loss or disruption of critical habitat / disruption to the breeding cycle / introduction of disease is expected.
Threatened ecological communities
Not applicable – no threatened ecological communities identified in the area over which noise emissions are expected.
Protected Areas Not applicable – noise emissions form vessels and helicopters in the operational area are will not result in noise levels exceeding impact thresholds in protected areas.
Socio-economic Receptors
Due to the lower noise emissions form vessels and helicopters compared to the seismic source, the consequence of impacts to fish, and therefore fisheries, will be less than that of the seismic sources.
Overall Consequence Ranking
A – Negligible Considering the levels of received noise from operating vessels and helicopters, impact thresholds are unlikely to exceeded more than a few metres around the vessel. Potential impacts will be restricted to temporary behavioural responses such as avoidance and are expected to have negligible consequence on populations or ecosystem function.
Management Control Effectiveness of Control
EPBC Regulations (Part 8) for interacting with cetaceans
Reduces risk of physical and behavioural impacts to cetaceans from support vessels, helicopters and seismic vessel (when not operating)
Implementation of EPBC Policy Statement 2.1 (Part A):
• Pre start-up visual observation • Soft start procedures • Start-up delay procedure • Operations procedure • Stop work procedure • Night time and low visibility procedures
Minimise acoustic impacts to cetaceans and whale sharks transiting through the survey area.
Marine fauna observations undertaken to minimise the disturbance to fauna caused by the activity
Reduces risk of physical and behavioural impacts to cetaceans, whale sharks, dugongs and turtles from vessels, and close proximity to seismic source
Implementation of EPBC Policy Statement 2.1 (partial part B):
Use of 2 MFOs (MMOs) on board each seismic vessel (4 in total). At least one MFO per vessel will have >12 months experience in Australian waters (Part B.1)
Reduces risk of physical and behavioural impacts to cetaceans, whale sharks, dugongs and turtles from vessels, and close proximity to seismic source
EPBC Act Policy Statement 2.1 - Interaction between Offshore Seismic exploration: Part B. B.4 Increased observation, precaution and buffer zones
May minimise TTS and behavioural impacts to cetaceans and whale sharks transiting through the survey area.
Santos Ltd | Keraudren Seismic Survey EP Summary Page 191 of 248
Implementation of EPBC Policy Statement 2.1 (partial part B.6 – adaptive management): • Ceasing seismic acquisition for 24 hours if
there are 3 or more humpback whale induced shutdowns/ powerdowns within the previous 24 hour period.
• Seismic acquisition may re-commence after 24 hours if there have been no further sightings of humpback whales and in accordance with CM-10, CM-11, CM-12.
The survey will be terminated if there are 3 consecutive days of no seismic acquisition due to the presence of migrating humpback whales.
Survey acquisition will not occur during the peak humpback whale migration period. Adaptive management of shutdowns based on sightings of humpback whales rather than a fixed date optimises the time for seismic acquisition without increasing the risk to migrating humpback whales. Based on industry experience, it is highly unlikely for more than three power-downs/ shut-downs to occur within 24 hours. The key indicator of an increase in the density of whales in the survey area is an increase in the number of sightings within the power-down or shut-down zone. Ceasing survey operations after a 24-hour duration of higher than 3 or more sightings within the power-down/ shut-down zone is a conservative approach to ensure no impacts to humpback whales.
10 km distance between simultaneous operating seismic vessel and VSP operations
A geographic separation distance between the sources of simultaneous seismic surveys minimises the impacts to marine life by providing a ‘corridor’ between acoustic sources (seismic and VSP). Behavioural response thresholds for any fauna may be exceeded up to 7.3 km, so conservatively 10km has been adopted.
Acquisition parameters will be equal to or less than those included in the numerical acoustic modelling and impact assessment:
• Two seismic sources equal to or less than 3,480 in3 will be used.
Line spacing between primary and secondary seismic vessels will not be less than 225 m.
Provides confidence in the impact assessment conducted which was based on modelling results.
No discharge of the acoustic source outside of the ramp-up zone
Impact assessment accounts for discharge of the seismic source within the full power zone, and within the ramp-up zone accounting for incrementally building the power of the sources from non-operation to full capacity (within full power zone), for the purpose of soft starts. Additionally, this zone also may be used for occasional source testing at, or below, full capacity.
No acquisition during peak humpback migration. Avoidance of peak humpback whale migration periods would eliminate any potential impact to humpback whales during these times.
Shutdown procedures for turtles Minimise potential for acoustic impacts to turtles.
Shutdown procedures for whale sharks Minimise potential for acoustic impacts to whale sharks.
UK Diving Medical Advisory Committee (DMAC 12) Identification of presence of divers, concurrent operations with divers. Identification of presence of divers, Concurrent Operations with divers.
Reduce potential health and safety risks to commercial and recreational divers
Commercial fishery payment claims Should relevant commercial fishers experience interruption to their fishing activities or a temporary loss of catch because of the seismic survey then Santos WA is prepared to consider financial payments so that commercial fishers are not materially worse off as a result of the seismic survey.
Santos Ltd | Keraudren Seismic Survey EP Summary Page 192 of 248
Payments to commercial fishing licence holders will be assessed for loss of catch and/or relocation expenses should concurrent fishing and seismic vessel operations not be practicable. Evidenced-based compensation models are not new to seismic surveys in Australia.
Santos Ltd | Keraudren Seismic Survey EP Summary Page 193 of 248
Table 5-3: Sound level threshold criteria and values for mortality and impairment in cetaceans
Potential Impacts
Impairment - PTS Impairment - TTS Behavioural
Threshold Criteria PTS is considered injurious in marine mammals, but there are no published data on the sound levels that cause PTS in marine mammals. Impact assessment evaluates dual metric criterion requiring consideration of both PK and accumulated SEL. PTS onset thresholds for marine mammals have not been directly measured, the NMFS (2018) criteria incorporate the best available science to estimate PTS onset in marine mammals from sound energy (SEL24h), or very loud, instantaneous peak sound pressure levels (PK) through extrapolation from available TTS onset measurements.
The onset of TTS is often defined as threshold shift of 6 dB above the normal hearing threshold (Southall et al. 2007). In marine mammals, the onset level and growth of TTS is frequency specific, and depends on the temporal pattern, duty cycle, and the hearing test frequency of the fatiguing stimuli. There is considerable individual difference in all TTS-related parameters between subjects and species tested so far.
NMFS currently uses a step function with a 50% probability of inducing behavioural responses at an SPL of 160 dB re 1 µPa to assess behavioural impact. This threshold value was derived from the HESS (1999) report, which, in turn, was based on the responses of migrating mysticete whales to an airgun sounds (Malme et al. 1983 1984). An extensive review of behavioural responses to sound was undertaken by Southall et al. (2007, their Appendix B). They found varying responses for most marine mammals between an SPL of 140 and 180 dB re 1 µPa, consistent with the HESS (1999) report. There is no SEL24h metric for behavioural responses in HF cetaceans, so per pulse SPL of 160 dB re 1 µPa criterion is used to assess these impacts. Note – the same behavioural response criteria is used for all cetaceans.
Relevance of thresholds adopted
The PTS and TTS thresholds are from NMFS (2018) which is the most current technical guidance for assessing the effect of anthropogenic sound on marine mammal hearing has been adopted for this activity. For the PTS and TTS assessment the threshold which results in the largest isopleth has been applied as per the NMFS (2018) guidance. Given that it is difficult to determine thresholds for behavioural response in individual cetaceans as often the way they respond varies (Nowacek et al. 2004, Gomez et al. 2016, and Southall et al. 2016) and is influenced by both biological and environmental factors such as age, sex, activity at the time etc. The behavioural disturbance threshold criteria applied is from NMFS (2013) which is the current interim U.S. National Marine Fisheries Service (NMFS) criterion (NMFS 2013) for marine mammals and which summates the most recent scientific literature on the impacts of sound on marine mammal hearing so considered the most relevant to this activity.
Potential Impacts : High-Frequency (HF) cetaceans
Sound Metric Per pulse Over 24 hours Per pulse Over 24 hours Per pulse Over 24 hours
Threshold Values 202 dB PK1 155 dB SEL24h1 196 dB PK2 140 dB SEL24h2 160 dB SPL3 NMFS 2013 does not define an SEL exposure criteria for behaviour for cetaceans. Modelled Distance
(Dev) 380 m 90 m 710 m 6.88 km 7.3 km
Modelled Distance (Exp)
430 m 70 m 680 m 4.27 km
Santos Ltd | Keraudren Seismic Survey EP Summary Page 194 of 248
Potential Impacts : Mid-Frequency (MF) cetaceans
Impairment - PTS Impairment - TTS Behavioural
Sound Metric Per pulse Over 24 hours Per pulse Over 24 hours Per pulse Over 24 hours
Threshold Criteria 230 dB PK1 185 dB SEL24h1 224 dB PK2 170 dB SEL24h2 160 dB SPL3 NMFS (2013) does not define an SEL exposure criteria for behaviour for cetaceans.
Modelled Distance (Dev)
<20 m 40 m 20 m 50 m 7.3 km
Modelled Distance (Exp)
<20 m <40 m 20 m 40 m
Potential Impacts: Low-Frequency (LF) cetaceans
Impairment - PTS Impairment - TTS Behavioural
Sound Metric Per pulse Over 24 hours Per pulse Over 24 hours Per pulse Over 24 hours
Threshold Criteria 219 dB PK1 183 dB SEL24h1 213 dB PK2 168 dB SEL24h2 160 dB SPL3 NMFS (2013) does not define an SEL exposure criteria for behaviour for cetaceans.
Modelled Distance (Dev)
30 m 4.22 km 60 m 26.29 km 7.3 km
Modelled Distance (Exp)
38 m
1.35 km 100 m 20.09 km
1: NMFS (2018) – Table 4
2: NMFS (2018) – Table AE-1
3: NMFS (2013)
Santos Ltd | Keraudren Seismic Survey EP Summary Page 195 of 248
Table 5-4: Sound level threshold criteria and values for mortality, impairment and behaviour in turtles
Turtles
Mortality/Potential Mortal Injury Recoverable Injury and TTS Behavioural
Threshold Criteria Few studies to base criteria on, however, Popper et al. (2014) provides acoustic criteria for mortality and potential mortal injury.
There are currently no acoustic criteria for sea turtles, however, a scale of relative risk is provided in Popper et al. (2014). The scale assumes that recoverable injury and TTS are possible.
There are currently no acoustic criteria for sea turtles, however, a scale of relative risk is provided below from Popper et al. (2014). The scale assumes that a behavioural response is possible. One study, McCauley et al. (2000), observed behavioural response in caged sea turtles at 166 dB SPL, which equates to a modelled distance of 3.16 km for the Keraudren seismic survey.
Relevance of thresholds adopted
There is limited information on sea turtle hearing. Most studies looking at the effect of seismic noise on marine turtles have focussed on behavioural responses given that physiological impacts are more difficult to observe in living animals. Exposure criteria developed by Popper at al (2014) based on results from the Working Group on the Effects of Sound on Fish and Turtles has been adopted. These thresholds are typically applied by NMFS, and within Australia as relevant threshold levels.
Sound Metric Per pulse Over 24 hours Proximity to airgun Relative Risk Proximity to airgun Relative Risk
Threshold Value 207 dB PK1 210 dB SEL24h1 Near (tens of metres) High1 Near (tens of metres) High1
Modelled Distance (Dev)
190 m MOD 152 m seafloor
110 m MOD 110 m seafloor
Intermediate (hundreds of metres)
Low1 Intermediate (hundreds of metres)
Low1
Modelled Distance (Exp)
230 m MOD 141 m seafloor
70 m MOD 70 m seafloor
Far (thousands of metres) Low1 Far (thousands of metres) Low1
1: Popper et al. (2014)
Santos Ltd | Keraudren Seismic Survey EP Summary Page 196 of 248
Table 5-5: Sound level threshold criteria and values for mortality and impairment in fish
Fish with no swim bladder (including sharks) [Group I in JASCO report]3
Threshold Criteria No studies to date have demonstrated direct mortality of adult fish in response to airgun emissions, even when fired at close proximity (within 1–7 m; DFO 2004; Boeger et al. 2006 as cited in NSW DPI 2014; Popper et al. 2014). Carroll et al. (2017) conclude that “For fish, there are few data on the physical effects of seismic airguns (e.g. mortality, barotrauma), and of these none have shown mortality.” Though mortality or mortal injury of fish from seismic sources has not been demonstrated it is industry practice to apply the Popper et al. (2014) exposure guidelines as part of the impact assessment process.
The effects of change in pressure (barotrauma – resulting in tissue injury) can result in injury. Recoverable injuries include fin hematomas, capillary dilation, and loss of sensory hair cells. Full recovery from these injuries is possible (Popper et al.2014).
Temporary threshold shift (TTS) is a temporary reduction in hearing sensitivity caused by exposure to intense sound. After termination of a sound that causes TTS, normal hearing ability returns over a period that is variable, depending on many factors, including the intensity and duration of sound exposure (Popper 2014). Sound exposure guidelines proposed in Popper et al. (2014), which indicated that TTS may occur at SELcum levels >186 dB re 1 μPa2·s. Popper et al.(2014) summarises that in all TTS studies considered, fish that showed TTS recovered to normal hearing levels within 18–24 hours. Due to this, a period of accumulation of 24 hours has been applied in this study for SEL, which is similar to that applied for marine mammals in Southall et al.(2007) and NMFS (2016).
Popper et al. (2014) proposes a dual criteria of PK and SELcum for mortality or potential mortal injury and recoverable injury. For the impact assessment the furthest distance to the criteria is be used. For this impact assessment, the time period of 24 hrs is applied to the SELcum metric. Behavioural - It is currently impossible to determine single value thresholds for the onset of behavioural reactions. Popper et al. (2014) propose broad response and effect categories. For all 3 groups of fish (Group I,II and III) the behavioural criteria is described as a relative risk qualitatively.
• For Group I fish the risk is High within tens of metres, Moderate within hundreds of metres, and Low within thousands of metres. • For Group II fish the risk is High within tens of metres, Moderate within hundreds of metres, and Low within thousands of metres. • For Group III fish the risk is High within tens of metres, High within hundreds of metres, and moderate within thousands of metres.
Relevance of thresholds adopted
Based on the literature review and indicator commercial species that are present within the operational area (pelagic and demersal fish), Popper et al. (2014) has been adopted as relevant to set the threshold criteria. This American National Standards Institute (ANSI) accredited report by the Working Group on the Effects of Sound on Fish and Turtles undertook a review of experimental findings of sound on fishes, presenting thresholds for mortality, recoverable injury and TTS in 2014, and is adopted by industry in Australia for the basis of impact assessment.
Sound Metric Per pulse Over 24 hours Per pulse Over 24 hours Per pulse Over 24 hours
Threshold Values 213 dB PK1 219 dB SEL24h1 213 dB PK1 216 dB SEL24h1 Popper et al 2014 does not define a per pulse criteria for TTS for fish.
186 dB SEL24h1
Modelled Distance (Dev)
60 m MOD 71 m seafloor
40 m MOD <40 m seafloor
60 m MOD 71 m seafloor
40 m MOD <40 m seafloor
7.64 km MOD 7.24 km seafloor
Santos Ltd | Keraudren Seismic Survey EP Summary Page 197 of 248
Modelled Distance (Exp)
100 m MOD 82 m seafloor
40 m MOD <40 m seafloor
100 m MOD 82 m seafloor
40 m MOD <40 m seafloor
4.73 km MOD 4.15 km seafloor
Fish with swim bladder (not involved in hearing) [Group II in JASCO report includes turtles, fish eggs and larvae]
Sound Metric Per pulse Over 24 hours Per pulse Over 24 hours Per pulse Over 24 hours
Threshold Criteria 207 dB PK1 207 dB SEL24h1 207 dB PK1 203 dB SEL24h1 Popper et al 2014 does not define a per pulse criteria for TTS for fish.
186 dB SEL24h1
Modelled Distance (Dev)
190 m MOD 152 m seafloor
110 m MOD 110 m seafloor
190 m MOD 152 m seafloor
260 m MOD 250 m seafloor
7.64 km MOD 7.24 km seafloor
Modelled Distance (Exp)
230 m MOD 141 m seafloor
70 m MOD 70 m seafloor
230 m MOD 141 m seafloor
230 m MOD 230 m seafloor5
4.73 km MOD 4.15 km seafloor
The distance to sound levels associated with mortality and potential mortal injury on fish based on Popper et al. (2014), using the SEL24h metric, are smaller than those estimated using the PK-based metric. Therefore, in line with the conditions of the criteria as per Popper et al.(2014)2, the PK metric should be used to assess these impacts to fish.
The distance to sound levels associated with recoverable injury on fish based on Popper et al. (2014), using the SEL24h metric, are bigger than those estimated using the PK-based metric. Therefore, in line with the conditions of the criteria as per Popper et al.(2014)2, the SEL24h metric should be used to assess these impacts to fish.
There is no per pulse criteria for TTS, as such the SEL24h metric is used to assess these impacts to fish.
1: Popper et al. (2014)
2: Given that dual criteria are defined the largest distance resulting from either SEL or PK are applied for the impact assessment, Popper et al 2014.
3: Pelagic fish (mackerel): For PK thresholds, the modelling results for maximum-over-depth have been used for pelagic fish as they reside within the water column.
Santos Ltd | Keraudren Seismic Survey EP Summary Page 198 of 248
4: Demersal fish (snapper, emperor and cod): For PK thresholds, the modelling results with the maximum distance has been used as demersal fish reside in both the water column or close to the seafloor.
5: Site-attached fish: The Ancient Coastline at 125 m KEF is the only recognised feature within the ramp-up/ full-power zone where site-attached fish may occur due to the association with epibenthic communities that may develop on exposed hard substrate. For PK thresholds, the modelling results for the seafloor have been used as site-attached fish species reside close to the seafloor.
Santos Ltd | Keraudren Seismic Survey EP Summary Page 199 of 248
Table 5-6: Potential area of impact for fisheries based on 2013 – 2017 catch effort data supplied by DPIRD
Modelled Distance Area Comments
Mackerel Managed Fishery (Area 2) - MMF
MMF area of catch effort within MMF Zone 2
37,219 km2 Based on the catch effort data from DPIRD (2013 – 2017), this is the area of the “blocks” that had recorded catch effort, and have been assumed to represent the fishery activity.
Overlap of operational area for seismic survey
2,309 km2 Overlap of seismic survey operational area with area of catch effort for MMF.
Overlap of ramp-up/ full power zone areas for seismic survey
848 km2 Overlap of seismic survey ramp-up/ full power zone area with area of catch effort for MMF.
Area of impact – TTS ensonification over 24 hours (7.64 km)
1,404 km2 Overlap of seismic survey ramp-up/ full power zone area plus modelled distance for TTS ensonification impact (7.64 km used as the most representative being the MOD within the exploration component of the survey that overlaps the catch effort for this fishery) with area of catch effort for MMF. This represents 4% of the 2013- 2017 representative catch effort area for the MMF.
Area of impact – recoverable injury (100 m)
856 km2 Overlap of seismic survey ramp-up/ full power zone area plus modelled distance for recoverable injury impact (100m used as worst case for fish with no bladder (mackerel). This is the per pulse SEL within the exploration component of the survey) with area of catch effort for MMF. This represents 2% of the 2013- 2017 representative catch effort area for the MMF.
Area of impact – mortality (100 m)
854 km2 Overlap of seismic survey ramp-up/ full power zone area plus modelled distance for mortality impacts (100 m used as the worst case for fish with no bladder (mackerel). This is the per pulse SEL within the exploration component of the survey) with area of catch effort for MMF. This represents 2% of the 2013- 2017 representative catch effort area for the MMF.
Pilbara Line Fishery (PLF)
PLF area of catch effort 134,318 km2 Based on the catch effort data from DPIRD (2013 – 2017), this is the area of the “blocks” that had recorded catch effort, and have been assumed to represent the fishery activity.
Overlap of operational area for seismic survey
5,553 km2 Overlap of seismic survey operational area with area of catch effort for PLF.
Overlap of ramp-up/ full power zone areas for seismic survey
2,960 km2 Overlap of seismic survey ramp-up/ full power zone area with area of catch effort for PLF.
Area of impact – TTS ensonification over 24 hours (7.64 km)
4,236 km2 Overlap of seismic survey ramp-up/ full power zone area plus modelled distance for TTS ensonification impact (7.64 km modelled for within development component of the survey and is the worst case, fishery overlaps the whole survey area) with area of catch effort for PLF. This represents 3% of the 2013- 2017 representative catch effort area for the PLF.
Area of impact – recoverable injury (260 m)
2,998 km2 Overlap of seismic survey ramp-up/ full power zone area plus modelled distance for recoverable injury impact (260m used as the worst case, and represents the SEL for
Santos Ltd | Keraudren Seismic Survey EP Summary Page 200 of 248
Modelled Distance Area Comments
recoverable injury and is from the development component of the survey) with area of catch effort for PLF. This represents 2% of the 2013- 2017 representative catch effort area for the PLF.
Area of impact – mortality (230 m)
2,993 km2 Overlap of seismic survey ramp-up/ full power zone area plus modelled distance for mortality impacts (230 m used as the worst case, and represents the peak mortality impact and is from the exploration component of the survey) with area of catch effort for PLF. This represents 2% of the 2013- 2017 representative catch effort area for the PLF.
Pilbara Fish Trawl Interim Managed Fishery (PFTIMF)
PFTIMF area of catch effort 23,012 km2 Based on the catch effort data from DPIRD (2013 – 2017), this is the area of the “blocks” that had recorded catch effort, and have been assumed to represent the fishery activity.
Overlap of operational area for seismic survey
5,713 km2 Overlap of seismic survey operational area with area of catch effort for PFTIMF.
Overlap of ramp-up/ full power zone areas for seismic survey
4,050 km2 Overlap of seismic survey ramp-up/ full power zone area with area of catch effort for PFTIMF.
PFTIMF area for Area 6 (not fished).
25,580 km2 Based on total area of Area 6 of the PFTIMF – which is not fished.
Overlap of operational area for seismic survey with Area 6 (not fished)
2514 km2 Overlap of the seismic survey operational area with Area 6.
Overlap of ramp-up/ full power zone areas for seismic survey with Area 6 (not fished)
814 km2 Overlap of the seismic survey ramp-up/ full power zone area with Area 6.
Area of impact – TTS ensonification over 24 hours (7.64 km) for PFTIMF Area 6 only (not fished)
1521 km2 Overlap of seismic survey ramp-up/ full power zone area plus modelled distance for TTS ensonification impact (7.64 km modelled for within development component of the survey and is the worst case, fishery overlaps the both components of the survey) with area of catch effort for PFTIMF Area 6 only.
Area of impact – recoverable injury (260 m) for PFTIMF Area 6 (not fished) only
835 km2 Overlap of seismic survey ramp-up/ full power zone area plus modelled distance for recoverable injury impact (260m used as the worst case, and represents the SEL for recoverable injury within development component of the survey and is the worst case, fishery overlaps the both components of the survey) with area of catch effort for PFTIMF Area 6 only.
Area of impact – mortality (plus 230 m) for PFTIMF Area 6 (not fished) only
832 km2 Overlap of seismic survey ramp-up/ full power zone area plus modelled distance for mortality impacts (230 m used as the worst case, and represents the peak mortality impact and is from the exploration component of the survey) with area of catch effort for PFTIMF Area 6 only.
PFTIMF area of catch effort for Area 4
4,952 km2 Based on the catch effort data from DPIRD (2013 – 2017), this is the area of the Area 4 within the PFTIMF that had recorded catch effort, and represents the fishery activity within this area.
Santos Ltd | Keraudren Seismic Survey EP Summary Page 201 of 248
Modelled Distance Area Comments
Overlap of operational area for seismic survey with Area 4
1,482 km2 Overlap of seismic survey operational area with area of catch effort for PFTIMF.
Overlap of ramp-up/ full power zone areas for seismic survey with Area 4
725 km2 Overlap of seismic survey ramp-up/ full power zone area with area of catch effort for PFTIMF.
PFTIMF area of catch effort for Area 5
7,495 km2 Based on the catch effort data from DPIRD (2013 – 2017), this is the area of the Area 5 within the PFTIMF that had recorded catch effort, and represents the fishery activity within this area.
Overlap of operational area for seismic survey with Area 5
4,232 km2 Overlap of seismic survey operational area with area of catch effort for PFTIMF.
Overlap of ramp-up/ full power zone areas for seismic survey for Area 5
3,325 km2 Overlap of seismic survey ramp-up/ full power zone area with area of catch effort for PFTIMF.
Area of impact – TTS ensonification over 24 hours (7.64 km) for PFTIMF (overlap with fish effort area only)
5,074 km2 Overlap of seismic survey ramp-up/ full power zone area plus modelled distance for TTS ensonification impact (7.64 km modelled for within development component of the survey and is the worst case, fishery overlaps the both components of the survey) with area of catch effort for PFTIMF. This represents 22% of the 2013- 2017 representative catch effort area for the PFTIMF.
Area of impact – TTS ensonification over 24 hours (7.64 km) for PFTIMF Area 4 only
1,168 km2 Overlap of seismic survey ramp-up/ full power zone area plus modelled distance for TTS ensonification impact (7.64 km modelled for within development component of the survey and is the worst case, fishery overlaps the both components of the survey) with area of catch effort for PFTIMF Area 4 only.
Area of impact – TTS ensonification over 24 hours (7.64 km) for PFTIMF Area 5 only
3,906 km2 Overlap of seismic survey ramp-up/ full power zone area plus modelled distance for TTS ensonification impact (7.64 km modelled for within development component of the survey and is the worst case, fishery overlaps the both components of the survey) with area of catch effort for PFTIMF Area 5 only.
Area of impact – recoverable injury (260 m) for PFTIMF (overlap with fish effort area only)
4,088 km2 Overlap of seismic survey ramp-up/ full power zone area plus modelled distance for recoverable injury impact (260m used as the worst case, and represents the SEL for recoverable injury within development component of the survey and is the worst case, fishery overlaps the both components of the survey) with area of catch effort for PFTIMF. This represents 18% of the 2013- 2017 representative catch effort area for the PFTIMF.
Area of impact – recoverable injury (260 m) for PFTIMF Area 4 only
740 km2 Overlap of seismic survey ramp-up/ full power zone area plus modelled distance for recoverable injury impact (260m used as the worst case, and represents the SEL for recoverable injury within development component of the survey and is the worst case, fishery overlaps the both components of the survey) with area of catch effort for PFTIMF Area 4 only.
Santos Ltd | Keraudren Seismic Survey EP Summary Page 202 of 248
Modelled Distance Area Comments
Area of impact – recoverable injury (260 m) for PFTIMF Area 5 only
3,348 km2 Overlap of seismic survey ramp-up/ full power zone area plus modelled distance for recoverable injury impact (260m used as the worst case, and represents the SEL for recoverable injury within development component of the survey and is the worst case, fishery overlaps the both components of the survey) with area of catch effort for PFTIMF Area 5 only.
Area of impact – mortality (230 m) for PFTIMF (overlap with fish effort area only)
4,084 km2 Overlap of seismic survey ramp-up/ full power zone area plus modelled distance for mortality impacts (230 m used as the worst case, and represents the peak mortality impact and is from the exploration component of the survey) with area of catch effort for PFTIMF. This represents 18% of the 2013- 2017 representative catch effort area for the PFTIMF.
Area of impact – mortality (230 m) for PFTIMF Area 4 only
738 km2 Overlap of seismic survey ramp-up/ full power zone area plus modelled distance for mortality impacts (230 m used as the worst case, and represents the peak mortality impact and is from the exploration component of the survey) with area of catch effort for PFTIMF Area 4 only.
Area of impact – mortality (230 m) for PFTIMF Area 5 only
3,346 km2 Overlap of seismic survey ramp-up/ full power zone area plus modelled distance for mortality impacts (230 m used as the worst case, and represents the peak mortality impact and is from the exploration component of the survey) with area of catch effort for PFTIMF Area 5 only.
Pilbara Trap Managed Fishery (PTMF)
PTMF area of catch effort 84,084 km2 Based on the catch effort data from DPIRD (2013 – 2017), this is the area of the “blocks” that had recorded catch effort, and have been assumed to represent the fishery activity.
Overlap of operational area for seismic survey
10,690 km2 Overlap of seismic survey operational area with area of catch effort for PTMF.
Overlap of ramp-up/ full power zone areas for seismic survey
5,539 km2 Overlap of seismic survey ramp-up/ full power zone area with area of catch effort for PTMF.
Area of impact – TTS ensonification over 24 hours (7.24 km)
7,783 km2 Overlap of seismic survey ramp-up/ full power zone area plus modelled distance for TTS ensonification impact (7.64 km modelled for within development component of the survey and is the worst case that overlaps with the fishery catch effort) with area of catch effort for PTMF.
Area of impact – recoverable injury (250 m)
5,615 km2 Overlap of seismic survey ramp-up/ full power zone area plus modelled distance for recoverable injury impact (250m used as the worst case, and represents the SEL for recoverable injury and is from the development component of the survey) with area of catch effort for PTMF.
Area of impact – mortality (230 m)
5,609 km2 Overlap of seismic survey ramp-up/ full power zone area plus modelled distance for mortality impacts (230 m used as the worst case, and represents the peak mortality impact and is from the exploration component of the survey) with area of catch effort for PTMF.
Santos Ltd | Keraudren Seismic Survey EP Summary Page 203 of 248
Modelled Distance Area Comments
Pearl Oyster Fishery Area 2
Pearl Oyster Fishery Area 2 out to 70m
41,820 km2 Area of the Pearl Oyster Fishery that overlaps with 70 m water depth or less, based on advice from Aaron Irving re distribution of pearl oysters.
Pearl Oyster fishery Area 2 overlap with Ramp-up / full power zone out to 70m.
557 km2 Area of the Pearl Oyster Fishery (70 m water depth or less) that overlaps with the ramp-up/ full power zone.
Threshold criteria 80m 562 km2 Pearl Oyster fishery Area 2 overlap with Ramp-up / full power zone out to 70m plus the modelled distance for threshold criteria of 80m.
Santos Ltd | Keraudren Seismic Survey EP Summary Page 204 of 248
Table 5-7: Sound level threshold criteria and values for invertebrates
Acoustic Criteria Crustaceans were the most studied group in terms of the range of metrics investigated, including catch rates and physical, behavioural, and physiological effects (Carroll et al. 2017). No threshold criteria currently exist for acoustic impacts from seismic exposure to crustaceans. Though particle motion is likely the mechanism of impacts for invertebrates rather than sound pressure it is not clear what level of particle motion relate to an effect. Thus, for this assessment sound pressure metrics are used to be able to compare to published study results that use the sound pressure metrics of PK-PK. As Payne et al. (2007) identified no effects on righting time in lobster at 202 dB re 1 μPa (PK-PK), and Day et al. (2016a) found effects at 209 dB re 1 μPa (PK-PK), the level of 202 dB re 1 μPa (PK-PK) has been applied in this assessment as a precautionary threshold to determine potential impacts. To inform the assessment of potential effects on crustaceans the PK-PK sound level at the seafloor was estimated at all modelled sites and compared to assessment criteria of 202 dB re 1 μPa (PK-PK).
No threshold criteria currently exist for acoustic impacts from seismic exposure to bivalves. Particle motion is likely the mechanism of impacts for bivalves rather than sound pressure though it is not clear what level of particle motion relate to an effect. Particle motion is seen as a more relevant criteria for assessment of bivalves as they spend the majority of the time in the seabed sediments rather than the water column. To assess the potential impacts associated with the seismic survey, particle motion has been assessed, specifically particle acceleration and velocity, and the results compared to those presented in Day et al. (2016b). The maximum particle acceleration assessed for scallops was 37.57 ms-2 (2)
Only threshold criteria is mortality/ mortal injury, as at all other depths criteria are not reached To inform the assessment of potential effects on coral, the PK sound level at the seafloor directly underneath the seismic source was estimated at all modelled sites and compared to the level of 226 dB re 1 μPa PK at which no impacts to coral were identified (Heyward et al. 2018).
Sound Metric Per pulse Particle Motion Maximum Per pulse
Threshold Criteria 202 dB PK-PK1 37.57 ms-2 (2) >226 dB PK3
Modelled Distance (Dev)
411 m 80 m <10 m
Modelled Distance (Exp)
367 m 80 m <10 m
1. Payne et al. (2008) 2. Day et al. (2016) 3. Heyward et al. (2018)
Santos Ltd | Keraudren Seismic Survey EP Summary Page 205 of 248
Table 5-8: Sound level threshold criteria and values for mortality, TTS and behavioural impacts to plankton
Plankton (eggs and larvae)
Mortality/Potential Mortal Injury Recoverable Injury and TTS Behavioural
Threshold Criteria Few studies to base criteria on, however, Popper et al. (2014) provides acoustic criteria extrapolated from simulated pile driving signals.
There are currently no acoustic criteria for fish eggs and larvae, however, a scale of relative risk is provided in Popper et al. (2014). The scale assumes that recoverable injury and TTS are possible.
There are currently no acoustic criteria for fish eggs and larvae, however, a scale of relative risk is provided in Popper et al. (2014). The scale assumes that a behavioural response is possible.
Relevance of thresholds adopted
Popper et al 2014 has been used as this cites many of the current references and studies on potential impacts of noise emissions on fish eggs and larvae, and when compared to other studies the threshold levels are similar to those proposed, e.g Day et al. (2016).
Sound Metric Per pulse Over 24 hours Proximity to airgun Relative Risk Proximity to airgun Relative Risk
Threshold Value 207 dB PK1 210 dB SEL24h1 Near (tens of metres) Moderate1 Near (tens of metres) Moderate1
Modelled Distance (Dev)
190 m MOD 152 m seafloor
110 m MOD 110 m seafloor
Intermediate (hundreds of metres)
Low1 Intermediate (hundreds of metres)
Low1
Modelled Distance (Exp)
230 m MOD 141 m seafloor
70 m MOD 70 m seafloor
Far (thousands of metres) Low1 Far (thousands of metres) Low1
Santos Ltd | Keraudren Seismic Survey EP Summary Page 206 of 248
5.3.4 Planned Discharges
Event: Planned Discharges
During the seismic survey the vessels will routinely discharge non-toxic substances to the marine environment as described below. The vessels will not be stationary during the activity, so the discharge location will be constantly changing.
Sewage
The volume of sewage is directly proportional to the number of persons on-aboard the vessels. Approximately 170 L of sewage/greywater will be generated per person per day. Treated sewage will be disposed in accordance with MARPOL Annex IV.
Food waste
Putrescible waste will consist of approximately 1 L of food waste per person per day. Food waste will be disposed of in accordance with MARPOL Annex V.
Brine
Brine generated from the water supply systems on-board the vessels will be discharged to the ocean at a salinity of approximately 10% higher than seawater. The volume of the discharge is dependent on the requirement for fresh (or potable) water and would vary between vessels and the number of people on-board.
Cooling water
Seawater is used as a heat exchange medium for the cooling of machinery engines. Seawater is drawn from the ocean and flows counter-current through closed-circuit heat exchangers, transferring heat from the vessel engines and machinery to the seawater. The seawater is then discharged to the ocean (i.e. it is a once-through system). Cooling water temperatures vary depending upon the vessels engine work load and activity.
Deck drainage
Deck drainage from sea spray, rainfall or wash-down operations would discharge to the marine environment. The deck drainage would contain particulate matter and residual chemicals such as cleaning chemicals, oil and grease. Assessment of an unplanned spillage of other environmentally hazardous chemicals and liquid waste are discussed in Section 5.4.3.
Oily water (i.e. bilge water) discharges
While in the operational area, the vessels may discharge oily water after treatment to <15 ppm oil-in-water content in a MARPOL approved oily water filter system separator.
Potential Receptors Water quality, fish (pelagic) & sharks, marine mammals, marine turtles and seabirds
Potential Impacts Planned discharges associated with the activity will be small and intermittent, with volumes dependent on a range of variables. The discharge point will be “moving”, as the vessels are not stationary. The discharge of non-hazardous wastes to the marine environment may result in a localised reduction in water quality in the vicinity of the release location. This would be expected to be temporary (minutes to hours) and localised. The discharges are expected to be dispersed and diluted rapidly, with concentrations of discharges significantly dropping within a short distance from the discharge point. Changes to ambient water quality outside of the operational area are considered unlikely to occur.
The discharges of treated sewage and grey water result in localised increases in nutrient concentrations, exert Biological Oxygen Demand (BOD) on the receiving waters and may promote localised elevated levels of phytoplankton and bacteria activity due to nutrient inputs. However, dispersion and dilution of discharges is expected to be rapid as the discharges are of low volume (based on a duration of approximately 110 days), and the operational area is located water depths of between 50 to 150 m dominated by swift currents, resulting in short-term changes to the surface water quality within the operational area.
Santos Ltd | Keraudren Seismic Survey EP Summary Page 207 of 248
The desalination of seawater results in a discharge of brine with a slightly elevated salinity (around 10% higher than seawater). Once discharged to the marine environment, the desalination brine, being of greater density than seawater, will sink and disperse in the currents. On average, seawater has a salt concentration of 35,000 ppm. The volume of the discharge is dependent on the requirement for fresh (or potable) water and the number of people on board the vessel. Most marine species are able to tolerate short-term fluctuations in salinity in the order of 20–30% (Walker and McComb 1990), and it is expected that most pelagic species would be able to tolerate short-term exposure to the slight increase in salinity caused by the discharged brine. Given the relatively low volume of discharge, low salinity increase and, open water surrounding the vessels, impact on the water quality in the operational area is expected to be negligible, temporary and localised.
Cooling water will be discharged at a temperature above ambient seawater temperature. Upon discharge, it will be subjected to turbulent mixing and transfer of heat to the surrounding waters. Temperature dispersion modelling shows that the water temperature of discharged water will decrease rapidly as it mixes with the receiving waters, with discharge waters being less than 1°C above background levels within less than 100 m (horizontally) of the discharge point. Vertically, the discharge will be within background levels within 10 m (Woodside 2008). Given the relatively short duration of the activity, low volume of cooling water, temperature differential, the deep, open water surrounding the vessels, impact on water quality is expected to be low and short-term and within the immediate vicinity of the discharge.
Oily water discharged from vessels will be treated to a concentration (<15 ppm of oil-in-water content) that will is unlikely lead to lead to any impacts to the receiving environment. Given the very low concentrations of any oil and grease residues in deck drainage and bilge water that is discharged to the marine environment where it will rapidly dilute and assimilate the potential for toxicity from hydrocarbon residues is considered low.
Impact assessment
Receptors Consequence
Threatened / Migratory / Local Fauna
Operational discharges may result in localised water quality perturbations and alteration to marine fauna behaviour, however, given that vessels will be continually moving within the operational area, any effect will be temporary in nature. Sensitive receptors that may be impacted include pelagic fish and sharks at surface, marine turtles, and marine mammals, and seabirds. Given that the activity will be for a limited duration (110 days) from a moving discharge point, in offshore waters, impacts will be limited to short-term water quality impacts and temporary behavioural effects observed in fish and seabirds. Impacts to water quality will be experienced in the discharge mixing zone which will be localised and will occur only as long as the discharges occur (i.e. no sustained impacts), therefore, recovery will be measured in hours to days. Only short- term behavioural impacts are expected with no decrease in local population size / area of occupancy of species / loss or disruption of habitat critical / disruption to the breeding cycle / introduction of disease. Planned operational discharges are therefore not expected to significantly impact marine fauna within the receiving environment nor compromise the objectives of Recovery Plans for threatened and migratory marine fauna.
Physical Environment/ Habitat
Overall Consequence Ranking
A – Negligible Given the distance offshore, the small volumes, the moving discharge point and well-mixed waters of the operational area.
Management Control
Effectiveness of Control
General chemical management procedures
Potential impacts to the environment are reduced through following correct procedures for the safe handling and storage of chemicals
Santos Ltd | Keraudren Seismic Survey EP Summary Page 208 of 248
Hazardous chemical management procedures
Reduces the risk of spills and leaks (discharges) of hazardous chemicals to the sea by controlling the storage, handling and clean up
Sewage treatment system
Reduces potential impacts of inappropriate discharge of sewage.
Waste (garbage) management procedure
Ensure compliance with Marine Order 96 and MARPOL requirements as appropriate for vessel class
Oily water treatment system
Reduces probability of garbage being discharged to sea, reducing potential impacts to marine fauna. Stipulates putrescible waste disposal conditions and limitations.
Deck cleaning product selection procedure
Ensure compliance with Marine Order 95 and MARPOL requirements as appropriate for vessel class
Clean up of oil/ lubricant spills to deck in accordance with vessel SOPEP
Improves water quality discharge (reduces toxicity) to the marine environment.
5.3.5 Atmospheric Emissions
Event: Atmospheric Emissions
The use of fuel (specifically MDO/MGO) to power vessel engines, generators, mobile and fixed plant and equipment will result in emissions of greenhouse gases (GHG) such as carbon dioxide (CO2), methane (CH4) and nitrous oxide (N2O), along with non-GHG such as sulphur oxides (SOx) and nitrous nitrogen oxides (NOx). Vessels may also use an incinerator for waste combustion during the activity. Vessels may utilise ozone-depleting substances (ODS) in closed-system rechargeable refrigeration systems.
Potential Receptors
Seabirds and Humans
Potential Impacts Hydrocarbon combustion may result in a temporary, localised reduction of air quality in the environment immediately surrounding the discharge point during the activity which could affect seabirds and humans in the immediate vicinity.
Non-GHG emissions, such as NOX and SOX, and GHG emissions can lead to a reduction in local air quality which that can impact humans and seabirds in the immediate vicinity and add to the national GHG loadings. Seabirds may traverse the operational area, however, are not expected in large numbers. Given the potential reduction in air quality will be very localised, should seabirds avoid the area in response to changes in air quality, impacts to individuals or populations are not expected.
As the activities will occur in offshore waters, the combustion of fuels and incineration in such remote locations will not impact on air quality in coastal towns, the nearest being Port Hedland (95 km south). The quantities of gaseous emissions are relatively small and will quickly dissipate into the surrounding atmosphere. Accidental release and fugitive emissions of ODS has the potential to contribute to ozone layer depletion. Air emissions will be similar to other vessels operating in the region for both petroleum and non-petroleum activities. Maintenance of refrigeration systems containing ODS is on a routine, but infrequent basis, and with controls implemented, the likelihood of an accidental ODS release of material volume is considered rare.
Impact Assessment
Santos Ltd | Keraudren Seismic Survey EP Summary Page 209 of 248
Receptors Consequence
Threatened / Migratory Fauna
Short term behavioural impacts to seabirds could be expected if they overfly the vessels; they may avoid the area. No decrease in local population size / area of occupancy of species / loss or disruption of habitat critical / disruption to the breeding cycle / introduction of disease.
Physical Environment / Habitat
No or negligible reduction in physical environment/ habitat area/ function.
Threatened ecological communities
Not applicable – these receptors will not be impacted by air emissions.
Protected Areas
Socio-economic receptors
As the activities occur in offshore waters, the combustion of fuels and ODS releases in such remote locations will not impact on air quality in coastal towns. The quantities of gaseous emissions are relatively small and will under normal circumstances, quickly dissipate into the surrounding atmosphere. The highly dispersive nature of local winds (i.e. strong and consistent) is expected to reduce potentially harmful or ‘noticeable’ gaseous concentrations within a short distance from the vessels.
Overall Consequence Ranking
A – Negligible Given the short duration of the survey, and constant movement of the vessel, emissions from the combustion of fuel on board the vessels will be localised and rapidly disperse and not affect sensitive receptors in the vicinity of the survey area (including the health or amenity of the nearest towns).
Management Control
Effectiveness of Control
Waste incineration managed in accordance MARPOL
Reduces potential impacts due to inappropriate incineration (e.g. wastes not burning correctly), inadequately maintained machinery
Fuel use Use of MDO/MGO reduces the potential impacts to marine environment in the event of unplanned hydrocarbon spills or leaks during bunkering
Air pollution prevention certification
Reduces probability of potential impacts to air quality due to ODS emissions, high NOx, SOx and incineration emissions.
Ozone-depleting substance handling procedures
Reduces probability of potential impacts to air quality due to ODS emissions
All engines to be well maintained in accordance with manufacturers specifications
Ensures engines are operating efficiently to design specifications
Santos Ltd | Keraudren Seismic Survey EP Summary Page 210 of 248
5.3.6 Concurrent Activities
Event: Concurrent Activities
Concurrent operations include situations where two or more activities occur nearby but continuously remain at a ‘safe’ level of separation for the duration of the activities.
Santos WA will undertake further appraisal drilling in 2019 within the seismic survey operational area. This activity will be undertaken under a separate NOPSEMA accepted EP. The wells are currently scheduled to be drilled in 2019 (from March onwards, but exact schedule is to be confirmed) and the exact location of the wells is still to be finalised, although they are within permit area WA-437-P. Other seismic survey activities could be undertaken adjacent to the seismic survey operational area. To date stakeholder consultation (Section 4) has identified that there are no seismic surveys planned within 50 km of the ramp-up zone/ full power zone in 2019, thus cumulative impacts from simultaneous seismic surveys are not predicted.
Potential Impacts Note that drilling activities occurring in the operational area are out of scope of this EP. Impacts and risks of the drilling activity will be managed in accordance with the accepted Bedout Basin Exploration & Appraisal Drilling Environment Plan (EA-00-RI-10076.01). Potential impacts and risks to relevant receptors for events identified are described in Section 5.3 and Section 5.4 for planned and unplanned events respectively. The impacts and risks of each event were reassessed following assessment of cumulative impacts associated with the concurrent activities.
Impact Assessment
Event Section Consequence / Risk Ranking
Cumulative considerations MODU
Interactions with other marine users
5.3.1 B Potential receptors and the nature and scale of impact are discussed in Section 5.3.1. A 500 m exclusion zone will be requested around the MODU during drilling, and at least one support vessel will be near the MODU at all times. This will increase the area from which other marine users may be displaced and may present an additional obstacle for commercial shipping vessels to deviate around. However, given that the survey vessel will be continually moving and the MODU exclusion zone is relatively small, the combined presence is not expected to result in consequences greater than presented in Section 5.3.1. Delaying either of the activities (seismic or drilling) would result in a significant increase in costs for each campaign and delays to long term field development schedules. Given the insignificance of additional impacts, the evaluation of ALARP and acceptability presented in Section 5.3.1 remains valid.
Light Emissions 5.3.2 A Potential receptors and the nature and scale of impact are discussed in Section 5.3.2. The presence of the MODU and support vessels in the operational area increase the number of light sources. Potential impacts of light on receptors in the operational area is negligible, due to the distance to turtle nesting beaches and the low-level impacts expected to other fauna. The MODU will be stationary, unlike the survey vessels, meaning that the distance between light sources will vary over time, influencing the potential for cumulative
Santos Ltd | Keraudren Seismic Survey EP Summary Page 211 of 248
impacts to occur. However, considering the location and the low levels of light expected to be emitted from vessels, including the MODU, no potential for cumulative impacts was identified and the consequence ranking and evaluation of ALARP and acceptability presented in Section 5.3.2 remains valid.
Noise Emissions (vessel, helicopter and seismic discharges)
5.3.3 B Potential receptors and the nature and scale of impact are discussed in Section 5.3.3. The MODU and activities to support drilling will generate additional noise during the activity. As assessed in the accepted Bedout Basin Exploration & Appraisal Drilling Environment Plan (A-00-RI-10076.01), an elevation in noise levels is not expected more than 3 km from the MODU. Cumulative impacts associated with acoustic noise are assessed in Section 5.3.3. Considering the above, and that delaying either of the activities (seismic or drilling) would result in a significant increase in costs for each campaign and delays to long term field development schedules. Cumulative impacts to receptors from the seismic survey and VSP activities over 24 hours are not predicted.
Planned Operational Discharges
5.3.4 A Potential receptors and the nature and scale of impact are discussed in Section 5.3.4. Additional vessels (including a MODU) will increase the volume of discharges to sea described in Section 5.3.4. Other types of operational discharges may occur during drilling activities and drilling and chemical discharges, but these are out of the scope of this EP. Given the volumes discharged, the negligible consequence of the discharges and their rapid dispersion in the water column, no potential for cumulative impacts were identified and the consequence ranking and evaluation of ALARP and acceptability presented in Section 5.3.4 remains valid. Delaying either of the activities (seismic or drilling) would result in a significant increase in costs for each campaign and delays to long term field development schedules.
Atmospheric Emissions
5.3.5 A Additional vessels (including a MODU) will increase the volume of atmospheric emissions released in the operational area. Given the negligible consequence of emissions, and the rapid dissipation into the surrounding atmosphere, no potential for cumulative impacts were identified and the consequence ranking and evaluation of ALARP and acceptability presented in Section 5.3.5 remains valid. Delaying either of the activities (seismic or drilling) would result in a significant increase in costs for each campaign and delays to long term field development schedules.
Spill response operations
5.3.7 B N/A - Spill response operations will only be implemented in the event of a hydrocarbon spill.
MDO/MGO release from vessel collision (surface)
5.4.1 Low The presence of the MODU and support vessels can potentially increase the risk of a vessel collision occurring. To mitigate this, the additional control measure of implementing concurrent operations planning with relevant commercial fishers will be implemented to ensure fishers are aware of the seismic vessel movements. Santos WA’s ongoing consultation also ensures other users are aware of activities in the area. Delaying either of the activities (seismic or drilling) would result in a significant increase
Minor Hydrocarbon Release
5.4.2 Low
Santos Ltd | Keraudren Seismic Survey EP Summary Page 212 of 248
in costs for each campaign and delays to long term field development schedules. The consequence ranking and evaluation of ALARP and acceptability presented in Section 5.4.1 and 5.4.2 remains valid.
Hazardous and non-hazardous release –liquid
5.4.3 Low Additional vessels (including a MODU) may increase the likelihood of an unplanned release of hazardous or non-hazardous liquids or solids in the operational area (e.g. through collision or distraction). Delaying either of the activities (seismic or drilling) would result in a significant increase in costs for each campaign and delays to long term field development schedules. Given the negligible consequence and very unlikely likelihood of such a discharge occurring, no potential for cumulative impacts were identified. The consequence ranking and evaluation of ALARP and acceptability presented in Sections 5.4.3 and 5.4.4 remains valid.
Hazardous and non-hazardous release - Solid
5.4.4 Low
Marine fauna collisions
5.4.5 Low Presence of the MODU and other support vessels in the operational area, may result in a non-proportional increase in likelihood of a vessel collision with marine fauna in the operational area overall. However, the drilling activity has no influence over the likelihood of a vessel-fauna interaction during the seismic activity, and vice versa. Marine fauna collision will be prevented, mitigated and managed as outlined in the Bedout Basin Exploration & Appraisal Drilling Environment Plan (EA-00-RI-10076.01) for the seismic survey and drilling activities respectively. Considering the above, and that delaying either of the activities (seismic or drilling) would result in a significant increase in costs for each campaign and delays to long term field development schedules, no potential for cumulative impacts was identified. The consequence ranking and evaluation of ALARP and acceptability presented in Section 5.4.5 remains valid.
Introduction of Invasive Marine Species
5.4.6 Medium Increasing the number of vessels (including a MODU) in the operational area may result in a non-proportional increase in risk of IMS introduction, although the consequence would be unchanged. Delaying either of the activities (seismic or drilling) would result in a significant increase in costs for each campaign and delays to long term field development schedules. Control measures in place for the seismic survey and drilling activities outlined in the Bedout Basin Exploration & Appraisal Drilling Environment Plan (EA-00-RI-10076.01) manage the risk of IMS to ALARP. No additional control measures could be practicably implemented to further reduce risk. Although additional vessels may increase the likelihood, given the control measures in place, it is not expected to change the risk ranking overall. Considering the above, no potential for cumulative impacts was identified. The consequence ranking and evaluation of ALARP and acceptability presented in Section 5.4.6 remains valid.
Overall Consequence Ranking
As cumulative impacts were not identified for each of the events, the consequence rankings for each event remain unchanged.
Management Control
Effectiveness of Control
No additional control measures were identified for concurrent activities that had not already been included within the relevant event sections.
Santos Ltd | Keraudren Seismic Survey EP Summary Page 213 of 248
5.3.7 Spill Response Operations
Event: Spill Response Operations
In the event of a hydrocarbon spill, response strategies will be implemented where possible to reduce environmental impacts to ALARP. The selection of strategies will be undertaken through the Net Environmental Benefit Analysis (NEBA) process, outlined in Section 6.2 of the OPEP. Spill response will be under the direction of the relevant Control Agency, as defined within the OPEP (Section 2.2). The response strategies and supporting activities deemed appropriate for the worst-case oil spill scenarios identified for the activity are detailed in Section 13 of the OPEP and comprise:
While response strategies are intended to reduce the environmental consequences of a hydrocarbon spill, poorly planned and coordinated response activities can result in a lack of, or inadequate, information being available upon which poor decisions can be made, exacerbating or causing further environmental harm. An inadequate level of training and guidance during the implementation of spill response strategies can also result in environmental harm over and above that already caused by the spill. Hydrocarbon response operations will be within offshore and inshore waters using vessels, aircraft, and personnel. Offshore impacts are consistent with vessel and aircraft operations described within this EP for the routine operations. The greatest potential for impacts additional to those described for routine operations are from oiled wildlife response, nearshore protection and deflection and shoreline clean-up operations where disturbance to the environment may occur through intentional strategy implementation.
Potential Receptors Fauna (including threatened/ migratory/ local fauna), protected areas, socio-economic receptors and physical environment/habitat
Potential Impacts Light emissions Lighting may cause behavioural changes to fish (including sharks), birds and marine turtles which can have a heightened consequence during key life-cycle activities, for example turtle nesting and hatching. Turtles and birds, which includes threatened and migratory fauna, have been identified as key fauna susceptible to lighting impacts. Refer to Section 5.3.2 for further detail on the impacts of light to fish, birds and marine turtles. Spill response activities which require lighting may take place in protected areas in open ocean and shorelines through response strategy implementation. Environmental values and sensitivities potentially impacted by light from response strategy implementation, including BIAs for turtles and birds have been identified in Section 3.4. However, given the scale of the response any impacts are expected to be short term, geographically confined and minor. Given that shoreline operations will only be conducted in day time hours and light impacts would be considered when sighting any shoreline camps. Additionally light impacts would be considered in the operational NEBA process. Noise emissions Underwater noise from the use of vessels may impact marine fauna, such as fish (including commercial species), marine reptiles and marine mammals, in the worst instance causing physical injury to hearing organs, but more likely causing short term behavioural changes, e.g. temporary avoidance of the area, which may impact key life-cycle process (e.g. spawning, breeding, calving). Underwater noise can also mask communication or echolocation used by
Santos Ltd | Keraudren Seismic Survey EP Summary Page 214 of 248
cetaceans. Refer to Section 5.3.3 for further detail on the environmental impact of noise attributed to vessel operations. Cetaceans have been identified as the key concern for vessel noise associated with response strategy implementation, with the humpback and pygmy blue whale migration and distribution BIAs within the spill EMBA. Spill response activities using vessels have the potential to impact fauna in protected areas further. Noise and vibration from terrestrial activities on shorelines has the potential to cause behavioural disturbance to coastal fauna including protected seabirds and turtles. Shoreline activities involving the use of noise generating equipment may take place in important nesting areas for turtles and/or roosting/feeding areas for shorebirds. As a consequence of impacts to fauna (including shorebirds, marine mammals and fish), noise has the potential to impact supported industries such as tourism and commercial fishing. Atmospheric emissions Atmospheric emissions from spill response equipment will be localised and while there is potential for fauna and flora impacts, the use of mobile equipment, vessels and vehicles is not considered to create emissions on a scale where noticeable impacts would be predicted. Emissions may occur in protected areas, however, the scale of the impact relative to potential oil spill impacts is not considered great. Operational discharges Operational discharges from vessels may create a localised and temporary reduction in marine water quality. Effects include nutrient enrichment, toxicity, turbidity, temperature and salinity increases, as detailed in Section 5.3.4. Sensitive receptors potentially impacted are likely to be different to those described in Section 5.3.4 given vessel use is likely to occur in shallower coastal waters during spill response activities. Discharge could potentially occur adjacent to marine habitats such as corals, seagrass, macroalgae, and in protected areas (i.e. receptors anywhere within the EMBA), which support a more diverse faunal community. Discharges are expected to be very localised and temporary. Cleaning of oil contaminated equipment, vehicles and vessels, has the potential to spread oil from contaminated areas to those areas not impacted by a spill, potentially spreading the impact area and moving oil into a more sensitive environment. Flushing of oil from shoreline habitats is a clean-up technique designed to remove oil from the receptor that has been oiled and remobilise back into the marine environment and result in further dispersion of the oil. The process of flushing has the potential to physically damage shoreline receptors such as mangroves and rocky shoreline communities, increase levels of erosion, and create an additional, and potentially higher, level of impact than if the habitat was left to bio-remediate. Sewage, putrescible and municipal waste will be generated from onshore activities at temporary camps which may include toilet and washing facilities. These wastes have the potential to attract fauna, impact habitats, flora and fauna and reduce the aesthetic value of the environment, which may be within protected areas. The creation, storage and transport of oily waste and contaminated organics has the potential to spread impacts of oil to areas, habitats and fauna not previously contaminated. Physical presence and disturbance The use of vessels may disturb benthic habitats in coastal waters including corals, seagrass, macroalgae and mangroves. Impacts to habitats from vessels include damage through the deployment of anchor/chain, nearshore booms and grounding. Vessel use in shallow coastal waters also increases the chance of contact or physical disturbance with marine megafauna such as turtles and dugongs. Booms create a physical barrier on the surface waters that has the potential to injure or entangle passing marine fauna that are either surface breathing or feeding. Vehicles, equipment, personnel used and cleaning activities during shoreline response activities have the potential to damage coastal habitats such as dune vegetation, mangroves
Santos Ltd | Keraudren Seismic Survey EP Summary Page 215 of 248
and habitats important to threatened and migratory fauna including nests of turtles and birds and bird roosting/feeding areas. Shoreline clean-up may involve the physical removal of substrates that could cause impact to habitats and coastal hydrodynamics and alter erosion/accretion rates. The presence of camp areas, although relatively short-term, may disrupt normal behaviour of coastal species such as shorebirds and turtles, and could potentially interfere with nesting and feeding behaviours. Oiled wildlife response may include the hazing, capture, handling, transportation, cleaning and release of wildlife susceptible to oiling such as birds and marine turtles. While oiled wildlife response is aimed at having a net benefit, poor responses can potentially create additional stress and exacerbate impacts from oiling, interfering with life-cycle processes, hampering recovery and in the worst instance increasing levels of mortality. Impacts from invasive marine species released from vessel biofouling include out-competition, predation and interference with other ecosystem processes. The ability for a non-native species to establish is generally mitigated in deeper offshore waters where the depth, temperature, light availability and habitat diversity is not generally conducive to supporting reproduction and persistence of the invasive species. However, in shallow coastal areas, such as areas where vessel based spill response activities may take place, conditions are likely to be more favourable. Impacts from invasive terrestrial species are similar in that the invasive species can out-compete local species (e.g. weeds) and interfere with ecosystem processes. Non-native species may be transported attached to equipment, vehicles and clothing. Such an introduction would be especially detrimental to wilderness areas or protected terrestrial reserves which may have a relatively undisturbed flora and fauna community. The disturbance to marine and coastal natural habitat, as well as the potential for disruption to culturally sensitive areas, which may occur in specially protected areas, may have flow on impacts to socio-economic values and industry (e.g. tourism, fisheries). Disruption to other users of marine and coastal areas and townships The use of vessels in the nearshore and offshore environment and the undertaking of spill response activities at shoreline locations may exclude the general public and industry use of the affected environment. As well as impacting leisure activities of the general public, this may impact on revenue with respect to industries such as tourism and commercial fishing. The mobilisation of personnel to small communities has the potential to affect the local community through demands on local accommodation and business, reducing the availability of services to members of the public.
Impact Assessment
Receptors Consequence
Fauna (including threatened/ migratory/ local fauna), protected areas, socio-economic receptors and physical environment /habitat
Light emissions The receptors considered most sensitive to lighting from vessel and shoreline operations (in event of shoreline cleanup operations) are seabirds and marine turtles, particularly over spring/summer months with respect to marine turtles where emerging hatchlings are sensitive to light spill onto beaches. Following restrictions on night time operations by spill response vessels, which will demobilise to mooring areas offshore with safety lighting only, impacts from vessels are considered to be Negligible. The positioning of temporary camps will be done at the direction of Town of Port Hedland/DoT/ DBCA and following control measures on lighting colour and direction the consequence of shoreline lighting is considered Negligible. These species are likely to be values of the protected areas in which they occur (e.g. Eighty Mile Beach), and the impact to the protected area from light is also considered Negligible.
Santos Ltd | Keraudren Seismic Survey EP Summary Page 216 of 248
As a consequence of impacts to fauna, lighting has the potential to impact supported industries such as tourism however as impacts to fauna are considered negligible any indirect impacts on tourism will also be Negligible. Noise emissions Receptors considered most sensitive to vessel noise disturbance are populations of humpback whales and pygmy blue whales during migration season. A temporary behavioural disturbance is expected only with a consequence of Negligible. With respect to noise from onshore operations (mobile equipment and vehicles), nesting, roosting or feeding birds are considered to be the most sensitive to noise. The equipment used is not considered to have excessive sound levels and following direction by DoT and DBCA on the location of temporary camp areas, the consequence to birds from noise is expected to be Negligible. As a consequence of impacts to fauna, noise has the potential to impact supported industries such as tourism and commercial fishing however as impacts to fauna are considered negligible any indirect impacts on socio-economic receptors will also be Negligible. Atmospheric emissions Atmospheric emissions from spill response equipment will be localised and impacts to even the most sensitive fauna, such as birds, are expected to be Negligible. Because of the localised and low level of emissions, impacts to protected area values and the physical environment are predicted to be Negligible. Operational discharges Operational discharges from vessels may create a localised and temporary reduction in marine water quality, which has the potential to impact shallow coastal habitats in particular, however, following the adoption of regulatory requirements for vessel discharges, which prevent discharges close to shorelines, discharges will have a Negligible impact to habitats, fauna or protected area values. Furthermore, washing of vessels and equipment will take place only in defined offshore hot zones preventing impacts to shallow coastal habitats. As a consequence of impacts to fauna, operational discharges from vessels has the potential to impact supported industries such as tourism and commercial fishing however as impacts to fauna are considered negligible any indirect impacts on socio-economic receptors will also be Negligible. Onshore, the use of flushing water has the potential to damage sensitive shoreline and intertidal habitats, e.g. mangroves, however, low pressure flushing only will be used, preventing further damage to habitats or erosion of sediments. For sensitive habitats the deployment of booms will be considered to retain flushed hydrocarbons, if this presents a net benefit. Following these control measures the use of flushing to clean shorelines and intertidal habitats is seen to have a Negligible additional impact to habitats, fauna or protected area values. The cleaning of contaminated vehicles and equipment onshore has the potential to spread oily waste and damage habitats if not contained. Decontamination units will be in use during the spill response thus containing waste and preventing any secondary contamination. The consequence of cleaning discharges is therefore ranked as Negligible in terms of impacts to habitats, fauna or protected area values. Sewage, putrescible and municipal waste generated onshore will be stored and disposed of at approved locations. Physical presence and disturbance The use of vessels and nearshore booms has the potential to disturb benthic habitats including sensitive habitats in coastal waters such as corals, seagrass, macroalgae and mangroves. A review of shoreline and shallow water habitats, and bathymetry, utilising existing moorings and the establishment of demarcated areas for access and anchoring will reduce the level of impact to Negligible. The use and movement of vehicles, equipment and personnel during shoreline response activities has the potential to disturb coastal habitats such as dune vegetation, samphire and
Santos Ltd | Keraudren Seismic Survey EP Summary Page 217 of 248
mangroves, and important habitats of threatened and migratory fauna including nests of turtles and birds and bird roosting areas. Furthermore, clean-up can involve physical removal of substrates that could cause impact habitats, fauna and alter coastal hydrodynamics. As with vessel use, an assessment of appropriate vehicles and equipment to reduce habitat damage, along with the establishment of access routes/demarcation zones, and operational restrictions on equipment/vehicles use will limit sensitive habitat damage and damage to important fauna areas. The establishment of temporary camp areas will be done under direction of Town of Port Hedland, DoT and DBCA with suitable advice sought if access is needed to culturally significant areas. Following these and other control measures the resultant consequence to the physical environment and habitat is assessed as Minor, indicating that there may be a detectable reduction in habitat area from response activities (as separate from spill impacts), but recovery will be relatively rapid, once spill response activities cease. As with all spill response activities, this disturbance will only occur if there is a net benefit to accessing and cleaning shoreline areas. The main direct disturbance to fauna would be the hazing, capture, handling, transportation, cleaning and release of wildlife susceptible to oiling impacts, such as birds and marine turtles. This would only be done if this intervention were to deliver a net benefit to the species but may result in a Minor consequence following compliance with the WA Oiled Wildlife Response Plan and the Pilbara Region Oiled Wildlife Response Plan. These habitats/environments are likely to be values of the protected area they occur in, and the impact to the protected area from physical disturbance is also considered Minor. The disturbance to marine and coastal natural habitat, as well as the potential for disruption to culturally sensitive areas, which may occur in specially protected areas, may have flow on impacts to socio-economic values and industry (e.g. tourism, fisheries). This impact is considered Minor. Disruption to other users of marine and coastal areas and townships The use of vessels in the nearshore and offshore environment and spill response activities at shoreline locations/close to townships, may exclude general public and industry use. It should be noted that this is distinct from the socio-economic impact of a spill itself which would have a far greater detrimental impact to industry and recreation. Following the application of control measures it is considered that the additional impact of spill response activities on affected industries would be Minor.
Overall Consequence Ranking
A – Negligible (Light, noise and atmospheric emissions; Operational discharges and wastes)
B – Minor (Physical presence and disturbance; Disruption to other users of marine and coastal areas and townships)
Management Control
Effectiveness of Control
Competent IMT and Oil Spill Responder personnel
Ensures that spill response strategy selection and operational activities consider the potential for additional environmental impacts
Use of competent vessel crew/personnel
Reduces potential for environmental impacts from vessel usage
Spill response activities selected on basis of a Net Environmental Benefit Analysis (NEBA)
Provides a systematic and repeatable process for evaluating strategies with net least environmental impact
Santos Ltd | Keraudren Seismic Survey EP Summary Page 218 of 248
Noise and atmospheric emissions
Vessels and aircraft compliant with the Protected Marine Fauna Interaction and Sighting Procedure (EA-91-11-00003)
Reduces potential for behavioural disturbance to cetaceans
If required under MARPOL, Vessels will maintain a current International Air Pollution Prevention (IAPP) Certificate.
Reduces level of air quality impacts
Operational discharges and waste
Vessels meet applicable MARPOL sewage disposal requirements as appropriate for vessel class
Reduces potential for water quality impacts
Vessels meet applicable MARPOL requirements for oily water (bilge) discharges as appropriate for vessel class
Reduces potential for water quality impacts
Ballast water management plan for international vessels
Improve water quality discharge to marine environment to ALARP Reduce risk of introduced marine species
Compliance with controlled waste, unauthorised discharge and landfill regulations
Ensures correct handling and disposal of oily wastes
Physical presence and disturbance
Vessels and aircraft compliant with the Protected Marine Fauna Interaction and Sighting
Reduces potential for behavioural disturbance to cetaceans
Santos Ltd | Keraudren Seismic Survey EP Summary Page 219 of 248
Procedure (EA-91-11-00003)
DPIRD vessel check tool applied to all spill response vessels on basis of the outcome of a Net Environmental Benefit Analysis (NEBA)
Reduce risk for introduction of invasive marine species as part of vessel biofouling
Use of shallow draft vessels for shoreline and nearshore operations
Reduce seabed and shoreline disturbance
Oil Spill Response Team (OSRT) Team Leader assessment/selection of vehicle appropriate to shoreline conditions
Establish demarcation zones for vehicle and personnel movement considering sensitive vegetation, bird nesting/roosting areas and turtle nesting habitat
Reduce coastal habitat and fauna disturbance
Operational restriction of vehicle and personnel movement to limit erosion and compaction
Reduce coastal habitat erosion and compactions
Prioritise use of existing roads and tracts
Reduce coastal habitat and fauna disturbance
Soil profile assessment prior to earthworks
Reduce habitat disruption and erosion
Pre-cleaning and inspection of
Prevent introduction of invasive species
Santos Ltd | Keraudren Seismic Survey EP Summary Page 220 of 248
equipment (quarantine)
Use of Heritage Adviser if spill response activities overlap with potential areas of cultural significance
Reduce disturbance to culturally significant sites
Adhere to WA Oiled Wildlife Response Plan (WAOWRP) and Pilbara Regional Oiled Wildlife Response Plan (PROWRP)
Oiled wildlife hazing, capture, handling and rehabilitation meet minimum standards as outlined within the WA Oiled Wildlife Response Plan
Use existing moorings or anchor locations where possible or available
Reduce seabed disturbance from anchoring operations
Boom will be monitored and maintained to ensure trapped fauna are released as early as possible
Reduce fauna disturbance from nearshore protection and deflection activities
Disruption to other users of marine and coastal area and townships
Stakeholder consultation
Early awareness of spill response activities which reduces potential disruption
Accommodation assessment
Reduces strain on accommodation
Security Management Plan
Reduces potential for security treat causing disruptions in the response activities
Transport Management Plan
Reduces potential for traffic disruptions
5.4 Environmental Assessment of Unplanned Events Six potential sources of environmental risks associated with the unplanned events were identified for this activity as described in the sections below.
Santos Ltd | Keraudren Seismic Survey EP Summary Page 221 of 248
5.4.1 Marine Diesel Oil/Marine Gas Oil (MDO/MGO) Release from Vessel Collision (Surface)
Event: Hydrocarbon spills from a ruptured vessel fuel tank as result of a collision, a refuelling incident and other minor MDO/MGO spills
MDO/MGO spills have the potential to impact on the marine environment through reduction in water quality and exposure to fauna and habitats. Worst-Credible MGO Spill There is a possibility of a vessel collision occurring within the operational area between the seismic survey vessels, or between a passing third party vessel and the seismic survey vessels. The worst-case environmental incident resulting from a vessel collision is the rupturing of a vessel fuel tank resulting in the release of MDO/MGO to the environment. Vessel collision could occur due to factors such as human error, poor navigation, vessel equipment failure or poor weather. The maximum credible spill from a collision can be determined from the volume of the largest single fuel tank. A maximum credible spill volume has been determined, with the largest fuel tank of any seismic survey vessel used during the activity being 600 m3. A tank rupture as a result of vessel grounding is not considered a credible scenario as the water depths are approximately 50 – 150 m and there are no emergent features within the operational area.
Potential Receptors Fish, sharks, cetaceans, marine reptiles, seabirds and shorebirds. Shorelines habitats and associated fauna and flora.
Potential Impacts A loss of MDO/MGO to the marine environment would result in a localised reduction in water quality in the upper surface waters (5 m) of the water column. A spill of 600 m3
MDO/MGO has been modelled by GHD (2018) at two release locations, one at the northern extent of the operational area and one at the southern extent of the operational area.
• The potential extent of floating MDO/MGO at or above the environmental impact threshold of 10 g/m2, is a maximum of 161 km from the release site in any season for both the northern and southern release location scenarios.
• Total water accommodated fraction (WAF) in the water column above an impact threshold of 500 ppb is predicted to occur up to 85 km from release site in any season for both the northern and southern release location. Dissolved WAF in the water column above an impact threshold of 100 ppb is predicted to occur up to 114 km from the release site in any season for both the northern and southern release location.
• Accumulation of hydrocarbons on shorelines at or above the environmental impact threshold of 10 g/m2 is predicted on Bedout Island, Port Hedland, Eighty Mile Beach from the southern release location, and Clerke Reef (Rowley Shoals) from the northern release location.
General impacts Potential impacts to the environment will be greatest in the immediate vicinity of the spill when the toxic aromatic components of the fuel will be at their greatest concentration and when the hydrocarbon is at its thickest on the surface of the receiving waters. The potential sensitive receptors in the immediate areas of the spill will include fish, cetaceans, marine reptiles and seabirds at the sea surface, which may ingest the MDO/MGO or become coated. Entrained MDO/MGO may pose different risks to habitats and fauna compared to a surface slick. However, as a result of the dilution of entrained oil in the water column, toxic impacts of entrained MDO/MGO are likely to be less than that of a surface slick. As the entrained hydrocarbons will be in the surface waters only, the extent of entrained hydrocarbons is predicted to be the same as that as the surface hydrocarbon spread. Toxic effects The short exposure times likely to be experienced by potential receptors, minimal impacts from exposure to toxic hydrocarbons are anticipated and the rapid evaporation and loss of
Santos Ltd | Keraudren Seismic Survey EP Summary Page 222 of 248
the more toxic aromatic components of the MDO/MGO results in a reducing toxicity threat to marine fauna with time. Passive / low mobility fauna such as plankton and small fish in the surface water are most likely to be affected by the MDO/MGO. Significant impacts to larger marine fauna species such as marine mammals, fish (sharks), marine reptiles and seabirds are unlikely (but possible) given the relatively small area of impact anticipated and the short duration of the spill. Physical effects In the immediate spill area, marine fauna interacting with surface waters may be exposed to hydrocarbons on the surface at concentrations about the threshold of 10 g/m2 used for oiling impacts to sensitive receptors, but given the low adhesive potential of the hydrocarbon, significant impacts are not anticipated. Impacts are not expected to be significant at the sea surface with the high volatility and low adhesive potential of the hydrocarbon resulting in low persistence in the environment. Details of environmental impacts of entrained and surface MGO/MDO on sensitive receptors found within the EMBA are presented in Table 5-9. A summary of the environmental impacts of entrained and surface MGO/MDO on Protected Areas which may be contacted is provided below. Eighty Mile Beach Marine Park Eighty Mile Beach management plan recognises oil spills as a potential pressure on both emergent features: mangroves and saltmarsh, intertidal sand and mudflats and submerged features: water and sediment quality, filter feeding communities, macroalgae and seagrasses and coral reef communities (DPaW 2014). Contact from floating oil is likely to impact the shoreline and result in accumulated stranded oil at discrete locations. Mangroves and intertidal areas may be impacted by being smothered, although continuous tidal movements will mobilise oil and add to dispersion. Contact from entrained oil may impact shoreline through accumulation, although constant tidal and current motions will re-mobilise oil and create further dilution. Contact from floating oil is likely to impact marine fauna by smothering (causing skin/eye irritation and affect ability to thermo-regulate) and oil contact from movement across the shoreline. In addition, ingestion may occur from preening/cleaning body and/or eating oil covered food resulting in internal toxicity. Contact from entrained oil may impact marine fauna by causing skin irritation/toxicity as fauna move through water, or internal toxicity from ingesting oil tainted food. Although constant tidal and current motions will re-mobilise oil and create further dilution and fauna are mobile. Oil unlikely to contact Mandora Salt Marsh, however ‘the beach’ area consists of sandy beach, mangroves and intertidal mudflats which may be contacted by oil impacting upon the Ramsar values. Bedout Island Contact from floating oil is likely to impact sandy beaches resulting in smothering of coral and stranded oil on beaches, although tidal movements will mobilise oil and add to dispersion of oil. Bedout Island includes foraging and nesting areas for marine turtles and feeding/resting/breeding areas for seabirds and migratory shorebirds, potentially impacting habitat. Clerke Reef – Rowley Shoals and Rowley Shoals Surrounds Rowley Shoals Marine Park (State Waters) management plan recognises oil spills as potential pressure on water quality (DoE 2007). Contact from floating oil is likely to impact emergent coral and sandy beaches resulting in smothering of coral and stranded oil on beaches, although tidal movements will mobilise oil and add to dispersion of oil. Contact from entrained and dissolved oil may impact submerged corals/seagrasses/macroalgae resulting in smothering and/or contact toxic impacts; although constant tidal and current motions will re-mobilise oil and create further dilution. Clerke Reef is a recognised migratory bird resting area. Contact from floating oil is likely to impact marine fauna by smothering (causing skin/eye irritation and affect ability to thermo-regulate), oil coating from movement across shorelines and inhalation of oil if surfacing to breathe. In addition, ingestion may occur from preening/cleaning body and/or eating tainted food resulting in internal toxicity. Contact from
Santos Ltd | Keraudren Seismic Survey EP Summary Page 223 of 248
entrained and dissolved oil may impact marine fauna by causing skin or eye irritation/toxicity as fauna move through water, or internal toxicity from ingesting oil tainted food or breathing oil entrained water (fish).
In the event of a vessel collision, the volume of hydrocarbons released would be a finite amount limited to the maximum credible spill of a full tank inventory release. Given the nature of the MDO/MGO and the distance from most shorelines, dilution and dispersion from natural weathering processes such as ocean currents indicate that the extent of exposure will be limited in area and duration.
The susceptibility of marine fauna to hydrocarbons is dependent on hydrocarbon type and exposure duration however given that exposures would be limited in extent and duration, exposure to marine fauna from this hazard is not expected to result in a fatality.
Habitat modification/degradation/disruption/loss, deteriorating water quality and marine pollution are identified as potential threats to a number of marine fauna species in relevant their respective Recovery Plans and Conservation Advice. With the controls in place, the Activity will be conducted in a manner that reduces potential impacts to ALARP and of acceptable level.
In addition, the Management Plan for the Eighty Mile Beach Marine Park (State Waters, including Ramsar site) states that DBCA should ensure the water and sediment quality, intertidal sand and mudflat communities, subtidal filter-feeding communities, macroalgal and seagrass communities, coral reef communities, mangrove communities and saltmarshes are not significantly impacted by human activities including oil spills. The potential impacts of a hydrocarbon release on seabird breeding and feeding areas are discussed in Table 5-9.
In the unlikely event that a vessel collision did occur within the operational area, the potential impacts to the environment would be greatest within several kilometres from the spill when the toxic aromatic components of the fuel will be at their highest concentration and when the hydrocarbon is at its thickest on the surface of the receiving waters. The MDO/MGO will also rapidly lose toxicity with time and spread thinner as evaporation continues. The potential sensitive receptors in the surrounding areas of the spill will include fish and sharks, marine mammals, marine reptiles and seabirds at the sea surface, as discussed in Table 5-9.
Marine habitats may also be impacted, A maximum of 53 tonnes of MDO/MGO may accumulate on Bedout Island’s shorelines, with much lower volumes (~13 tonnes) at other shorelines including Eighty Mile Beach and Port Hedland. Indigenous users may be impacted in the event that a land-based response is required, however consultation will ensure potential impacts are reduced to acceptable levels.
An overall consequence ranking of moderate was assigned to this scenario based on the potential impacts to protection priorities as described above. In summary there is potential for:
• Surface impact and loading to Ramsar wetlands within the Eighty Mile Beach AMP (emergent).
• Entrained oil impacts on the AMP values (foraging and habitats) within the Eighty Mile Beach AMP (submerged).
• Hydrocarbon impact on the migratory shorebirds at Bedout Island. • Surface impacts on MP values (Corals and seabirds) at Clerke Reef and Rowley Shoals
surrounds in Rowley Shoals MP.
Likelihood A hydrocarbon release resulting from a vessel collision is unlikely to have widespread ecological effects given the nature of the hydrocarbons on-board, the finite volumes that could be released, the depth and transient nature of marine fauna in this area.
Santos Ltd | Keraudren Seismic Survey EP Summary Page 224 of 248
The likelihood of a hydrocarbon release occurring due to a vessel collision is limited given the set of mitigation and management controls in place for this program.
Consequently, the likelihood of a vessel collision releasing hydrocarbons to the environment that results in a moderate consequence is considered to be rare.
Likelihood Ranking 1- Rare Consequence ranking C - Moderate
Residual risk Low
Management Control
Effectiveness of Control
Maritime notices (Notice to Mariners and AUSCOAST warnings)
Ensure other marine users are aware of the presence of the vessels and the relative low mobility of vessels to suddenly change course or avoid other vessels.
Stakeholder Consultation
Exclusion zone Exclusion zones around the vessels prevent other vessels from getting too close and causing damage to equipment of either party.
Navigation equipment and procedures
Reduces risk of environmental impact from vessel collisions due to ensuring safety requirements are fulfilled.
Support vessels Identifies and communicates with approaching third-party vessels to ensure exclusion zone is observed, preventing potential interaction or interference
Constant bridge watch
Crew of support and seismic vessels will maintain constant bridge watch, including for third party vessels which may enter the exclusion zone
Develop concurrent operations plans if other Santos WA activity is being undertaken within the operational area at the same time as the seismic survey.
Reduce likelihood of a collision between seismic vessel and other vessel/MODUs
No acquisition during peak humpback migration
Avoidance of humpback whale migration periods would minimise impacts to this species
Fuel oil use Use of MDO/MGO reduces the potential impacts to marine environment in the event of unplanned hydrocarbon spills or leaks during bunkering
Oil pollution emergency plan (OPEP)
Implements response plans to deal with an unplanned hydrocarbon release quickly and efficiently in order to reduce impacts to the marine environment.
Vessel spill response plans (SOPEP/SMPEP)
Implements response plans to deal with an unplanned release quickly and efficiently in order to reduce impacts to the marine environment.
The largest volume of fuel stored in a
Reduces the volume of MGO/MDO that can be lost to the marine environment in event of a vessel collision.
Santos Ltd | Keraudren Seismic Survey EP Summary Page 225 of 248
single tank of vessels used for the activity will not exceed 600 m3
Santos Ltd | Keraudren Seismic Survey EP Summary Page 226 of 248
Table 5-9: Impacts of water column and surface MGO on sensitive receptors found within the EMBA
Receptor Impacts of MGO/MDO
Total WAF and dissolved WAF in the water column Surface hydrocarbons
Marine fauna
Plankton (including zooplankton; fish and coral larvae)
There is potential for localised mortality of plankton due to reduced water quality and toxicity. Effects will be greatest in the upper 10 m of the water column and areas close to the spill source where hydrocarbon concentrations are likely to be highest.
Surface MDO/MGO will have no impact on plankton.
The hydrocarbon spill EMBA has the potential to overlap with spawning of some fish species, given the year-round spawning of some species, and overlap in peak spawning periods of others. Coral spawning in the region occurs during the proposed activity, however, no significant coral reef habitat exists in the EMBA. In the unlikely event of a spill occurring, fish larvae may be impacted by MDO/MGO entrained in the water column. However, following release, the MDO/MGO will rapidly evaporate and disperse in the offshore environment, reducing the concentration and toxicity of the spill. Given duration of fish spawning periods, lack of suitable habitat for aggregating fish populations near the surface, combined with the quick evaporation and dispersion of MDO/MGO, impacts to overall fish populations are not expected to be significant.
Marine mammals
Lethal or sub-lethal physical and toxic effects such as irritation of eyes/mouth and potential illness.
At risk of direct contact with MDO/MGO due to chance of surfacing within slick. Effects include irritation of eyes/mouth and potential illness. Surface respiration could lead to accidental ingestion of hydrocarbons or result in the coating of sensitive epidermal surfaces.
Eleven migratory cetacean species were identified by the EPBC Protected Matters search (Section 3.4) (the Irawaddy dolphin was identified but will not occur in habitat where hydrocarbon accumulation could occur). Of these, one is listed as endangered (blue whale) and three as vulnerable (humpback whale, fin whale and sei whale). The hydrocarbon spill EMBA overlaps with the pygmy blue whale distribution and migration BIA and humpback migration BIA. Large number of individuals of either species are not expected to pass through the area, since the activity will not overlap spatially with the blue whale migration BIA and the activity will not take place within peak humpback whale migration. Other migratory cetaceans may encounter either surface or water column MDO/MGO, however, the absence of any known feeding, resting or breeding areas means significant numbers are unlikely to be impacted.
Marine reptiles
Lethal or sub-lethal physical and toxic effects such as irritation of eyes/mouth and potential illness. The Recovery Plan for Marine Turtles in Australia: 2017-2027 (Commonwealth of Australia 2017) highlights acute chemical discharge as one of several threats to marine turtles.
At risk of direct contact with MDO/MGO due to chance of surfacing within slick. Effects include irritation of eyes/mouth and potential illness. Surface respiration could lead to accidental ingestion of hydrocarbons or result in the coating of sensitive epidermal surfaces.
Seven species of threatened marine reptile were identified as possibly being impacted by a spill. Short-nosed seasnake, flatback, hawksbill, leatherback, green and loggerhead turtles are widely dispersed at low densities across the NWS and in the unlikely event of a MDO/MGO spill occurring, individuals traversing open water may come into contact with water column or surface MDO/MGO. The presence of salt water crocodile is restricted to the shoreline locations close to Broome, where they may come into contact with small volumes (up to 0.2 tonnes at 10g/m2) of accumulated hydrocarbons. The hydrocarbon spill EMBA overlaps with the flatback, green, loggerhead and hawksbill BIAs as well as the critical habitat designated for internesting flatbacks such as that adjacent to Eighty Mile Beach. Modelling results indicate a shoreline loading of approximately 13.9 tonnes (GHD 2018) in the worst case scenario with (probability of 4%), as such there is a risk of transient adults encountering MDO/MGO.
Santos Ltd | Keraudren Seismic Survey EP Summary Page 227 of 248
Receptor Impacts of MGO/MDO
Total WAF and dissolved WAF in the water column Surface hydrocarbons
Seabirds and shorebirds
Lethal or sub-lethal physical and toxic effects such as irritation of eyes/mouth and potential illness. May encounter entrained MDO/MGO while diving and foraging.
Particularly vulnerable to surface MDO/MGO. As most fish survive beneath floating slicks, they will continue to attract foraging seabirds, which typically do not exhibit avoidance behaviour. Smothering can lead to reduced water proofing of feathers and ingestion while preening. In addition, MDO/MGO can erode feathers causing chemical damage to the feather structure that subsequently affects ability to thermoregulate and maintain buoyancy on water.
Seventeen threatened species, as identified by the EPBC Protected Matters database search, may be encountered during the Activity, of which seven of these have a BIA for breeding within the hydrocarbon spill EMBA. The lesser frigatebird and the brown booby have foraging habitat in the area, and therefore may be impacted by surface and entrained MDO/MGO while foraging (dive and skim feeding). Higher numbers would be expected during the breeding period of May to December which overlaps the planned activity timeframe. Other seabird BIAs include lesser crested tern, white-tailed tropicbird, roseate tern, little tern and wedge- tailed shearwater breeding, with either egg laying or chick provisioning possibly occurring during the activity. Surface and entrained MDO/MGO is unlikely to impact nesting or egg laying individuals in colonies, however, it is possible that breeding individuals could come into contact with surface or entrained MDO/MGO while foraging. Given the rapid evaporation and dispersion of MDO/MGO (99% of the hydrocarbon expected to evaporate or disperse after 3 days under moderate winds), significant impacts at the population level are not anticipated and therefore the risk of surface and entrained MDO/MGO to seabirds is considered low.
Fish and sharks
Hydrocarbon droplets can physically affect fish and sharks exposed for an extended duration (weeks to months). Smothering through coating of gills can lead to the lethal and sub-lethal effects of reduced oxygen exchange, and coating of body surfaces may lead to increased incidence of irritation and infection. Fish may also ingest hydrocarbon droplets or contaminated food leading to reduced growth. The activity operational area overlaps with the whale shark foraging BIA and the whale shark peak post-aggregation migrating presence in the EMBA (May – June). However, given the distance to the nearest whale shark aggregation location (Ningaloo Marine Park, 490 km southwest of the operational area) and due to the nature of the hydrocarbon release (99% of the hydrocarbon expected to evaporate or disperse after 3 days under moderate winds) significant impacts to whale sharks are not expected There is potential for localised mortality of fish eggs and larva due to reduced water quality and toxicity. Effects will be greatest in the upper 10 m of the water column and areas close to the spill source where hydrocarbon concentrations are likely to be highest and therefore demersal fish communities are not expected to be impacted.
While fish and sharks do not generally break the sea surface, individuals may feed at the surface. However, since the MDO/MGO is expected to quickly disperse and evaporate (modelling results indicate approximately 99% of hydrocarbons evaporate and disperse after 3 days at moderate wind speeds), the probability of prolonged exposure to a surface slick by fish and shark species is low.
Santos Ltd | Keraudren Seismic Survey EP Summary Page 228 of 248
Receptor Impacts of MGO/MDO
Total WAF and dissolved WAF in the water column Surface hydrocarbons
The NWS supports a diverse assemblage of fish, including 456 species of finfish, particularly in shallower water near the mainland and islands. Threatened species identified by the EPBC Protected Matters search include the white shark, whale shark, grey nurse shark and green and dwarf sawfish; and two conservation dependent species (scalloped hammerhead shark and bluefin tuna) which may be present in the affected area. However, given the absence of critical habitat for most of these species, significant numbers are not expected to be impacted. The only BIA overlapping the operational area and EMBA is for the whale shark. While this is for foraging, it is not for high density prey where congregations are expected so impacts would be limited to transient migrating individuals. White sharks and sawfish could be present at low densities all year round within the operational area and EMBA, however, the absence of any known feeding, resting or breeding areas means significant numbers are unlikely to be impacted if an unplanned release were to occur.
Socio-economic
Fisheries MDO/MGO in the water column can have toxic effects on fish (as outlined above) reducing catch rates and rendering fish unsafe for consumption.
In addition to the effects of total WAF and dissolved WAF, exclusion zones surrounding a spill can directly affect fisheries by restricting access for fishermen.
Both water column and surface MDO/MGO have the potential to lead to temporary financial losses.
Tourism
Aquatic recreational activities such as boating, diving and fishing occur around Bedout Island or Eighty Mile Beach but are concentrated in the vicinity of the population centres such as Exmouth, Dampier and Onslow. Tourism in Port Hedland is less prolific and given the small volumes potentially accumulated, any impacts are likely to be temporary and localised. In the waters within and immediately surrounding the operational area, tourism activities are expected to be low, however exclusion zones surrounding a spill will reduce access for vessels for the duration of the response undertaken for spill clean-up (if applicable).
Shipping
Hydrocarbons in the water column will have no effect on shipping. The operational area overlaps two designated shipping routes, and is adjacent to another (Figure 3-11) with two north-south oriented lanes servicing Port Hedland and one north-south lane servicing Port Walcott. Exclusion zones surrounding a spill will reduce access for shipping vessels for the duration of the response undertaken for spill clean-up (if applicable); vessel may have to take large detours leading to potential delays and increased costs.
Defence The level of defence activities carried out in the vicinity of operational area is low, if any, and therefore interference of defence activities due to a MDO/MGO spill are likely to be minimal.
Shipwrecks Surface hydrocarbons will have no impact on shipwrecks. Hydrocarbons in the water column from a vessel collision will remain in the surface waters and is therefore unlikely to have an impact on shipwrecks.
Indigenous The level of activities undertaken by indigenous users is expected to be low, if any, therefore interference due to an MDO/MGO spill are likely to be minimal, however in event there is a requirement for land based response activities/ disturbance, relevant representatives will be contacted as outlined in Section 5 of the Oil Pollution Emergency Plan.
Existing oil and gas activity
Exclusion zones surrounding spills will reduce access potentially leading to delays to work schedules with subsequent financial implications. Although other Santos WA activities may occur in the operational area, no operating facilities occur in the operational area or EMBA, therefore impacts to other oil and gas operators is unlikely.
Santos Ltd | Keraudren Seismic Survey EP Summary Page 229 of 248
Receptor Impacts of MGO/MDO
Total WAF and dissolved WAF in the water column Surface hydrocarbons
Protected areas
Protected areas are described in Section 3.3 but are summarised below. Eighty Mile Beach Includes habitat for foraging and breeding for seabirds and marine turtles, RAMSAR wetlands and mangrove habitats. Bedout Island Includes foraging and nesting areas for marine turtles, and feeding/resting/breeding areas for seabirds and migratory shorebirds Rowley Shoals Marine Park (State Waters) Includes habitat for foraging and migratory seabirds and foraging/breeding area for marine turtles
As discussed above, marine mammals, seabirds, sharks and reptiles are at risk of direct contact with MDO/MGO due to chance of surfacing within slick. Effects include irritation of eyes/mouth and potential illness, as discussed in more detail above.
KEFs
KEFs overlapping the EMBA are described in Section 3.3.3 but are summarised below. Ancient Coastline at 125 m Depth Contour Contributes to higher diversity and enhanced species richness relative to soft sediment habitat Attracts opportunistic feeding by larger marine life including humpback whales, whale sharks and large pelagic fish
A loss of MDO/MGO to the marine environment would result in a localised reduction in water quality in the upper surface waters of the water column and therefore impacts to the habitats of the KEF is not considered likely. Impacts to sensitivities within the above KEF are outlined above.
Santos Ltd | Keraudren Seismic Survey EP Summary Page 230 of 248
5.4.2 Minor Hydrocarbon Release
Event: Hydrocarbon release at sea surface
A minor spill (~37.5 m3) of MDO/MGO could occur during vessel refuelling resulting in a loss of hydrocarbons to the marine environment at sea surface. There will be no helicopter refuelling on the seismic vessels. Spills of MDO/MGO during refuelling events have the potential to cause impacts to the marine environment through a reduction in water quality and marine fauna exposure. Spills during refuelling can occur through several pathways, including fuel hose breaks, coupling failure or tank overfilling. Spills resulting from overfilling will be contained within the vessel drains and slops tank system. In the event that the refuelling hose is ruptured, the fuel bunkering activity will cease by turning off the pump; the fuel remaining in the transfer line will escape to the environment as well as fuel released prior to the transfer operation being stopped. The AMSA (2015) Technical Guidelines for Preparing Contingency Plans for Marine and Coastal Facilities provides guidance for calculating a maximum credible spill volume for a refuelling spill. The guidance provided by AMSA (2015) for a refuelling spill under continuous supervision is considered appropriate given refuelling will be constantly supervised. The maximum credible spill volume during refuelling is calculated as: transfer rate (150 m3/ hr) x 15 minutes of flow. The detection time of 15 minutes is seen as conservative but applicable following failure of multiple barriers followed by manual detection and isolation of the fuel supply. Other, minor accidental loss of other hydrocarbon based liquids (e.g. used lubricating oils, cooking oil, and hydraulic oil) to the marine environment could also occur via tank pipework failure or rupture, hydraulic hose failure, inadequate bunding and/or storage, insufficient fastening or inadequate handling. Seal oil could potentially leak from the vessel thruster/propeller stern tube directly to sea as a result of leaking seals or mechanical damage. The header tank for stern tube oil is approximately 1 m3 and is equipped with limit switches in the event of a leak, thus preventing complete loss (the release of <1 m3 of stern tube oil (non-hydrocarbon based lube oil) event is discussed further in Section 5.4.3).
Potential Receptors
Marine fauna – Fish and sharks, cetaceans, marine mammals, marine reptiles
Potential Impacts
The nature and scale of a 37.5 m3 MDO/MGO release during refuelling fits well within the expected impact and extent for the MGO/MDO release associated with a vessel collision detailed in Section 5.4.1. Therefore, no further modelling of the 37.5 m3 was required. General impacts, toxic effects and physical effects of an MDO/MGO release are described in Section 5.4.1 and sensitive receptors found within the EMBA are presented in Table 5-9.
Impact Assessment
Receptors Consequence
Marine fauna – Fish and sharks, cetaceans, marine mammals, marine reptiles
In the event of a minor hydrocarbon spill, the quantities would be limited to approximately 37.5 m3. The small volumes and dilution and dispersion from natural weathering processes such as ocean currents indicate that the extent of exposure will be limited in area and duration (5 km over 6 hours). The number of receptors present at the activity location is expected to be limited to a small number of transient individuals. No shoreline receptors are expected to be impacted.
The susceptibility of marine fauna to hydrocarbons is dependent on hydrocarbon type and exposure duration however given that exposures would be limited in extent and duration, exposure to marine fauna from this hazard is considered to be low. As the MDO/MGO is a moderately volatile substance, the impacts to receptors will decline rapidly with time and distance at the sea surface. Rapid dilution at depth would also result in the impacts to receptors declining rapidly with time and distance.
Deteriorating water quality and marine pollution are identified as potential threats to a number of marine fauna species in relevant Recovery Plans and Approved Conservation Advice. With
Santos Ltd | Keraudren Seismic Survey EP Summary Page 231 of 248
the controls in place, the activity will be conducted in a manner that reduces potential impacts to ALARP and of acceptable level.
For marine mammals that may be exposed to the more toxic aromatic components of the MDO/MGO, chemical effects are considered unlikely since these species are mobile and therefore not be constantly exposed for extended durations that would be required to cause any major toxic effects.
Although humpback and pygmy blue whales may be exposed, this event is not expected to interfere with their migration activity. Toxic impacts are not expected to the benthic community due to the water depths.
Near the sea surface, fish are able to detect and avoid contact with surface slicks and as a result, fish mortalities rarely occur in open waters from surface spills (Kennish 1997; Scholz et al.1992). Pelagic fish species are therefore generally not highly susceptible to impacts from hydrocarbon spills. In offshore waters near to the release point, pelagic fish are at risk of exposure to the more toxic aromatic components of the MDO/MGO. Pelagic fish in offshore waters are highly mobile and comprise species such as tunas, sharks and mackerel. Due to their mobility, it is unlikely that pelagic fish would be exposed to toxic components for long periods in this spill scenario. The more toxic components would also rapidly evaporate and concentrations would significantly diminish with distance from the spill site, limiting the potential area of impact.
Given that a small hydrocarbon spill would not result in a decreased population size at a local or regional scale, it is expected that a spill of this nature would result in a negligible consequence.
Likelihood The likelihood of a small hydrocarbon release occurring is limited given the set of management controls in place for this activity. The likelihood of a refuelling incident with subsequent release to the marine environment is considered to be unlikely.
Likelihood Ranking
3 - Unlikely Consequence ranking 1 – Negligible
Residual risk Low
Management Control
Effectiveness of Control
General chemical management procedures
Potential impacts to the environment are reduced through following correct procedures for the safe handling and storage of chemicals
Hazardous chemical management procedures
Reduces the risk of spills and leaks (discharges) of hazardous chemicals to the sea by controlling the storage, handling and clean up
Oil pollution emergency plan (OPEP)
Implements response plans to deal with an unplanned hydrocarbon release quickly and efficiently in order to reduce impacts to the marine environment.
Vessel spill response plan (SOPEP/SMPEP)
Maritime dangerous goods code
Dangerous goods managed in accordance with International Maritime Dangerous Goods Code (IMDG Code) to reduce the risk of an environmental incident, such as an accidental release to sea or unintended chemical reaction
Deck drainage Reduces potential for hydrocarbon release to the marine environment
Santos Ltd | Keraudren Seismic Survey EP Summary Page 232 of 248
Bulk refuelling transfer procedures
Prevents probability of unplanned hydrocarbon spills or leaks occurring during bunkering leading to negative impacts to the marine environment.
Fuel oil use Use of MDO/MGO reduces the potential impacts to marine environment in the event of unplanned hydrocarbon spills or leaks during bunkering
Bunkering drill prior to commencing activity.
Ensures the controls can be implemented and there is familiarity with the process.
5.4.3 Hazardous and Non-Hazardous Unplanned Discharges – Liquid
Event: Hazardous and non-hazardous (liquid) release to the marine environment
Hazardous liquids, including miscellaneous chemicals and waste streams (cleaning and cooling agents, stored or spent chemicals and leftover paint materials), are used or stored on board the vessel during the activity. The main engines and equipment such as pumps, cranes, winches, power packs and generators require MDO/MGO for fuel and a variety of hydraulic fluids and lubricating oils for efficient operation and maintenance of moving parts. These products are present within the equipment and also held in storage containers and tanks on the vessels, small hydrocarbon leaks could occur and potential impacts are covered under Section 5.4.2, chemical leaks are discussed further here. Outside the vessel, the largest credible spill would be release of <1 m3 of stern tube oil (non-hydrocarbon based lube oil) from the vessel thruster/propeller stern tube.
Accidental loss of liquid wastes to the marine environment could occur via tank pipework failure or rupture, inadequate bunding and/or storage, insufficient fastening or inadequate handling may result in impacts to water quality and hence sensitive environmental receptors.
Potential Receptors Fish, Sharks, Marine Mammals, Marine Reptiles and Seabirds
Potential Impacts Environmentally hazardous chemicals and liquid wastes (hazardous/non-hazardous liquids) lost to the marine environment may lead to contamination of the water column in the vicinity of the vessel. The potential impacts would most likely be highly localised and restricted to the immediate area surrounding the spill, with rapid dispersal to concentrations below impact thresholds likely to occur in the open area of ocean (high energy environment that facilitates rapid dispersion and dilution to non-toxic concentrations). The changes to water quality that may result could potentially lead to short-term impacts on marine fauna (e.g. pelagic/benthic fish, epifauna, marine mammals, marine reptiles and seabirds), with chronic impacts not expected owing to the short exposure times likely.
The area that may be affected by this risk for the majority of spilt material would most likely be restricted to a small area within the operational area.
Spills of hazardous liquids are unlikely to have widespread ecological effects given the nature of the chemicals on-board, the small volumes that could be released, and the depth and exposure of the location.
There is no emergent or inter-tidal habitat that could be impacted by a surface spill of this nature and any spilled material is unlikely to reach any of the demersal species or benthic habitats at the seabed. Sub-lethal or lethal effects from toxic hazardous/ non-hazardous liquids on marine fauna, is considered unlikely given the expected low concentrations and short exposure times.
Impact Assessment
Santos Ltd | Keraudren Seismic Survey EP Summary Page 233 of 248
In the event of a hazardous/ non-hazardous liquid spill, the quantities would be limited to approximately 1m3 of stern tube oil. The small volumes, dilution and dispersion from natural weathering processes such as ocean currents indicate that the extent of exposure will be limited in area and duration.
The susceptibility of marine fauna to hazardous/ non-hazardous liquids is dependent on the type and exposure duration however given that exposures would be limited in extent and duration, exposure to marine fauna from this hazard is not expected to result in a fatality. Potential impacts from small volumes (1 m3) discharged to the marine environment to water quality would be short-term and localised, due to the nature and behaviour of the hazardous/ non-hazardous liquids identified as being at risk of spilling; only pelagic fauna present in the immediate vicinity of the spill would likely be at risk of impact.
Deteriorating water quality and marine pollution are identified as potential threats to a number of marine fauna species in relevant Recovery Plans and Conservation Advice. However, the potential release of hazardous/ non-hazardous liquids is not expected to significantly impact the receiving environment with management controls proposed to prevent releases and therefore the activity will be conducted in a manner that is considered acceptable.
Given that a small spill of hazardous/ non-hazardous liquids would not result in a decreased population size at a local or regional scale, it is expected that a spill of this nature would result in a negligible consequence.
Likelihood A small liquid release is unlikely to have widespread ecological effects given the nature of the chemicals on-board, the small volumes that could be released, the water depth, transient nature of marine fauna in this area and the prevention and management procedures in place to clean up a spill. Santos WA records indicate that although spills and leaks from equipment and machinery (due to split hoses, small leaks, or handling errors) have occurred, most of the spills and leaks reported occurred within bunded areas, were all less than 100 L and cleaned up immediately and therefore did not reach the marine environment. The likelihood of a small non-hydrocarbon release occurring is limited given the mitigation and management controls in place for this activity. Consequently, the likelihood of releasing non-hydrocarbon liquids to the environment which results in a negligible consequence is considered to be very unlikely.
Likelihood Ranking 2- Very Unlikely Consequence ranking A – Negligible
Residual Risk Low
Management Control Effectiveness of Control
General chemical management procedures
Potential impacts to the environment are reduced through following correct procedures for the safe handling and storage of chemicals, including requirements of MARPOL Annex III and Marine Orders 94 as appropriate for vessel class
Hazardous chemical management procedures
Reduces the risk of spills and leaks (discharges) to the sea by controlling the storage, handling and clean-up of hazardous chemicals
Vessel spill response plans (SOPEP/SMPEP)
Implements response plans to deal with an unplanned release quickly and efficiently in order to reduce impacts to the marine environment.
Maritime Dangerous Goods Dangerous goods managed in accordance with International Maritime Dangerous Goods Code (IMDG Code) to reduce the risk of an environmental incident, such as
Santos Ltd | Keraudren Seismic Survey EP Summary Page 234 of 248
Code an accidental release to sea or unintended chemical reaction
Dropped object prevention Minimises dropped object risk during vessel lifting operations that may cause secondary spill (discharges) resulting in reduction in water quality
Equipment maintenance in accordance with PMS
Ensures that lifting equipment is maintained and certified, and that lifting procedures are followed reducing probability of dropped objects occurring with the potential to result in hydrocarbon spills.
5.4.4 Hazardous and Non-Hazardous Unplanned Discharges – Solid
Event: Hazardous and non-hazardous (solid) release to the marine environment
Non-hazardous solid wastes including paper, plastics and packaging, and hazardous solid wastes such as batteries, fluorescent tubes, medical wastes, and aerosol cans may be dropped unintentionally to the marine environment, potentially impacting on sensitive receptors. Release of these waste streams may occur as a result of overfull and/or uncovered bins, incorrectly disposed items or spills during transfers of waste. Dropped objects/lost equipment such as a streamer could also result in seabed disturbance or floating obstacles. The largest potential dropped object would be a crate of supplies being transferred from a support vessel to a seismic vessel.
Up to 12 seismic streamers of 9,100 m length will be used during the activity. The streamers are gel-filled, which has the characteristics of a ‘flexible’ solid and will not flow into the marine environment if the streamer skin is punctured, however if the streamer is lost, it will remain buoyant (due to floatation devices) and potentially be a floating obstacle.
Other potential dropped objects could include the fenders that are on vessels, should this detach, it will remain buoyant, and potentially be a floating obstacle.
Non-hazardous solids such as plastics have the potential to smother benthic environments and harm marine fauna through entanglement or ingestion. Marine turtles and seabirds are particularly at risk from entanglement. Marine turtles may mistake plastics for food; once ingested, plastics can damage internal tissues and inhibit physiological processes, which can both potentially result in fatality. Marine debris has been highlighted as threat to marine turtles, humpback whales and whale sharks in the Recovery Plan for Marine Turtles in Australia (Commonwealth of Australia 2017), Conservation Management Plan for the Blue Whale (Recovery Plan) (DotE 2015), Approved Conservation Advice for Megaptera novaeangliae (humpback whale) and Approved Conservation Advice for Rhincodon typus (whale shark). The Recovery Plans and Approved Conservation Advice have specified a number of recovery actions to help combat this threat. Of relevance to this activity is the legislation for the prevention of garbage disposal from vessels, which Santos WA implements through adherence to MARPOL.
Release of hazardous solids (e.g. wastes such as batteries) may result in the pollution of the immediate receiving environment, leading to detrimental health impacts to marine flora and fauna. Physiological damage can be through ingestion or absorption may occur to individual fish, sharks, cetaceans, marine reptiles or seabirds. Impacts to socioeconomic receptors could occur should the debris cause a safety hazard to other marine users or potentially damage their equipment (e.g. fishing nets).
The area of potential disturbance due to a non-buoyant dropped object would be restricted to the operational area. The seabed within the operational area is primarily soft sediments with little epifauna; this habitat type is widely distributed and well represented in the NWS region. The operational area overlaps with the Ancient Coastline at the 125 m depth contour KEF, which may comprise harder substrate and associated fauna. Damage to hard substrates, and associated fauna, may occur, however such impact is expected to be restricted to the size of the dropped object, and when compared to the size of the KEF overall impacts will be negligible. While soft sediment benthic habits will not be destroyed, disturbance of the communities on and within
Santos Ltd | Keraudren Seismic Survey EP Summary Page 235 of 248
them (i.e. the epifauna) will occur in the event of a dropped object and depressions may remain on the seabed for some time after removal of the dropped object as it gradually infills over time.
In the unlikely event of damage to or loss of the seismic streamer, potential environmental effects could be limited to physical impacts on benthic communities arising from the streamer and associated equipment sinking to the seabed. Seismic streamers are fitted with floatation devices (pressure-activated, self-inflating buoys) that are designed to bring the equipment to the surface if lost accidentally during a seismic survey. As the equipment sinks it passes a certain water depth at which point the buoys inflate (compressed CO2 gas cartridge) and bring the equipment back to the surface where it can be retrieved by the seismic or support vessel. Given the water depths of the operational area, benthic impacts from loss of a streamer are not considered credible. Buoyant objects may cause interference with other sea marine users depending on the size of the object(s). Loss of a streamer (or part of) could create marine debris potentially interfering with other sea users by snagging equipment
Impact Assessment
Receptors Consequence
Physical Environment – Seabed disturbance
In the event of lost equipment/ dropped object, it is expected that it may result in localised damage to the seabed. The extent of the impact is limited to the size of the dropped object and given the size of standard materials transferred, any impact is expected to be very small.
Surveys of previous seabed disturbances following drilling activities indicate that recovery of benthic fauna in soft sediment substrates occurs between 6-12 months after the activity ceases (URS 2001), suggesting any impacts are short term in duration, and result in a negligible reduction in habitat area/function.
Marine Fauna- cetaceans, marine turtles, seabirds and fish
In the event of a non-hazardous or hazardous solid waste loss, the quantities would be limited. This waste stream could cause localised impacts to water quality and the benthic environment if the solid can degrade, leading to impacts on localised flora and fauna species. Ingestion of solid wastes could occur in small quantities. Only small volumes of the solid waste stream would be generated during the activity, as a result, any accidental loss to the environment would be small in size. Any impacts would be restricted to a small number of individuals in the close proximity to the unplanned discharge, if any. As such, there is the potential for short- term behavioural impacts only to a small proportion of a local population and not during critical lifecycle activity for cetaceans, marine turtles or fish.
Marine debris is identified as a potential threat to a number of marine fauna species in relevant Recovery Plans and Conservation Advice. The controls implemented demonstrate that the activity will be conducted in a manner that reduces marine debris and therefore potential impacts are reduced to ALARP and of acceptable level.
The limited quantities associated with this event indicate that even in a worst-case release of solid waste, fatalities would be limited to individuals and is not expected to result in a decrease of the local population size and the consequence level is therefore, negligible.
Socio-economic – Interference from a buoyant object
In the event of a release of a buoyant object that cannot be recovered, it could present an obstacle to other sea users or have aesthetic impacts to tourism. Eventually the buoyant object may become non-buoyant and sink to the seabed where it may degrade over time. The time taken for this is dependent on the material released and any impacts to marine fauna and the seabed are described above. This may present a risk to commercial trawling activities and damage their equipment, so fishers may be required to avoid a highly localised area to avoid interaction. Given the likely size of buoyant equipment and it will drift with the currents, it is considered unlikely to present a significant hazard to other sea users or significant aesthetic impact and the consequence level is therefore negligible.
Likelihood A set of control measures and checks have been proposed to ensure that the risks of dropped objects, lost equipment or release of solid waste to the environment has been minimised. The likelihood of transient marine fauna occurring in the operational area is limited and given the
Santos Ltd | Keraudren Seismic Survey EP Summary Page 236 of 248
controls in place, the likelihood of releasing hazardous and non-hazardous solids to the environment resulting in a negligible consequence is considered very unlikely (assumes potential for a single loss of solid waste incident during the activity).
Likelihood Ranking
2 – Very Unlikely Consequence Ranking A – Negligible
Residual Risk Low
Management Control
Effectiveness of Control
Waste (garbage) management plan
Reduces probability of waste being discharged to sea, reducing potential impacts to marine fauna. Ensures food waste is discharged in manner that does not pose risk to the environment. Ensures compliance with Marine Orders (94 and 95) and MARPOL (Annex III and V) requirements as appropriate for vessel class
Dropped object prevention
Impacts to environment are reduced by preventing dropped object and by retrieving dropped objects where possible
Equipment maintenance in accordance with PMS
Ensures that lifting equipment is maintained and certified, and that lifting procedures are followed reducing probability of dropped objects occurring with the potential to result in hydrocarbon spills.
Streamers are fitted with floatation devices
Reduced potential impacts to the marine environment due to streamer loss or damage
Streamer deployment / retrieval procedure
Reduced potential impacts to the marine environment due to streamer loss or damage
5.4.5 Marine Fauna Collisions
Event: Vessel equipment collision with marine fauna
There is the potential for vessels/ equipment involved in the activity to collide with marine fauna including cetaceans, fish, sharks, marine reptiles and seabirds. The main collision risk associated with the activity is through vessel collision or equipment collision with large, slow moving cetaceans; or turtle entrapment in tail buoys, potentially resulting in severe injury or mortality.
Potential Receptors
Fish, Sharks, Rays, Marine Mammals, Marine Reptiles and Seabirds
Potential Impacts
Cetaceans are naturally inquisitive marine mammals that are often attracted to vessels underway; for example, dolphins commonly ‘bow ride’ with vessels.
Marine fauna in surface waters that would be most at risk from vessel collision include marine mammals, marine turtles and whale sharks. As summarised in Table 3-6, the operational area overlaps with flatback turtles buffer BIA, whale shark foraging BIA, humpback whale migration BIA and pygmy blue whale distribution BIA. The worst potential impact from vessel collision would be mortality or serious injury of an individual.
Collisions between vessels and cetaceans are most frequent on continental shelf areas where high vessel traffic and cetacean habitat occur simultaneously (WDCS 2006). There have been recorded instances of cetacean deaths as a result of vessel collisions in Australian waters (e.g. a Bryde’s whale in the Bass Strait in 1992) (WDCS 2006), though the data indicates this is likely to be associated with container ships and fast ferries. Whale and Dolphin Conservation Society (WDCS) (2006) also indicates that some cetacean species, such as humpback whales, can detect
Santos Ltd | Keraudren Seismic Survey EP Summary Page 237 of 248
and change course in order to avoid a vessel. A recent review of vessel whale strike data identified up to 109 potential strikes in Australian waters from 1840 to 2015 (Peel et al. 2016).
The most commonly sighted whale in continental shelf waters of the region is the humpback whale. Approved Conservation Advice for Megaptera novaeangliae (humpback whale) indicates that humpback whales are one of the most frequently reported whale species involved in vessel strikes worldwide (Laist et al.2001). The increase in vessel numbers (Silber & and Bettridge 2012) is not only a threat to humpback whales in relation to vessel strikes but also in disturbance and displacement from key habitats. Similarly, boat strike is also recognised by the Approved Conservation Advice for whale sharks as one of the threats to their recovery, as well as the Conservation Management Plan (Recovery Plan) for the blue whale (DotE 2015).
The humpback whale migrates between calving grounds in the Kimberley region of WA to feeding grounds in Antarctica; with the northbound migration from early June to early August (BHPB 2005), and the peak of the northbound migration between Exmouth Gulf and the Dampier Archipelago occurring around July, concentrated inshore of the 200 m depth contour (Jenner et al.2001). The southern migration, which peaks around early September, with pods travelling in shallower waters, typically at 30 - 100 m and passing to the west of Barrow Island and north of the Montebello islands. Migrating individuals may traverse the operational area, however, the timing will avoid humpback whale migration season.
Pygmy blue whales may also be encountered in the operational area. The National Conservation Values Atlas has identified the pygmy whale migration pathway on the continental shelf edge at depth of 500 to 1,000 m (McCauley & Jenner 2010) deeper than the water depths of the operational area. Migrating individuals are not expected to traverse the operational area in large numbers. Breeding areas have not yet been identified; however, it is likely that pygmy blue whales calve in tropical areas of high localised production such as deep offshore waters of the Banda and Molucca seas in Indonesia (Double et al. 2014). There are no known breeding areas of significance to pygmy blue whales in waters from Busselton to the Northern Territory border.
Control measures will prevent the activity occurring in the peak humpback whale migration season, however individual humpback and pygmy blue whales may pass through the operational area. The reaction of whales to the approach of a vessel is quite variable. Some species remain motionless when in the vicinity of a vessel while others are known to be curious and often approach vessels that have stopped or are slow moving, although they generally do not approach, and sometimes avoid, faster moving ships (Richardson et al.1995).
Given the operational area overlaps with whale shark foraging BIA (Table 3-6), individuals may be encountered during the activities following peak aggregation (May-June) at Ningaloo Reef. However, given the distance from the operational area to Ningaloo Reef (490 km), post aggregating individuals are likely to have widely dispersed reducing the expectation of large numbers of whale shark encounters in the operational area.
Dugongs are prone to vessel collision since they spend a large proportion of time at the sea surface. However, dugong distribution is correlated with presence of seagrass habitat, which is highly unlikely to occur in the operational area due to the water depths. As such, dugong-vessel encounters are expected to be a rare occurrence.
Marine turtle mortality due to boat strike has been identified as an issue in Queensland waters in the Recovery Plan for Marine Turtles in Australia (Commonwealth of Australia 2017). However, turtles appear to be more vulnerable to boat strike in areas of high urban population where incidents of pleasure crafts are higher. WA turtle populations have not been highlighted as those most affected by boat strike, possibly due to the relatively low human population density of the NWS Pilbara coast line. It is possible that individual flatback turtles may be encountered in the operational area. However, given the timing of the survey at the tail end of flatback internesting, the depth of water, lack of suitable habitat and distance to the shorelines, large numbers of turtle encounters are not expected.
Santos Ltd | Keraudren Seismic Survey EP Summary Page 238 of 248
Vessels will be moving at slow speeds in the operational area, reducing the likelihood that a collision between a seismic or support vessel and marine fauna will occur, and, should a collision occur, that it would result in serious injury.
Impact Assessment
Receptors Consequence
Marine fauna – Fish and sharks, cetaceans, marine reptiles
In the event of a collision with marine fauna, there is the potential for injury or death to an individual. The receptors present in the operational area are expected to be limited to a small number of transient individuals.
Boat strike and vessel disturbance are identified as potential threats to a number of marine fauna species in relevant Recovery Plans and Approved Conservation Advice. The above information above demonstrates that the activity will be conducted in a manner that reduces potential impacts to ALARP and of acceptable level. In addition, all vessel strikes will be reported by Santos WA in the National Ship Strike Database.
There is the potential for death or injury of EPBC listed individual species, however as they would represent a small proportion of the local population it is not expected that it would result in a decreased population size over what would usually occur due to natural variation, at a local or regional scale. In addition, given the vessels will be moving slowly during the activity, it is expected that a collision with an individual would result in a minor injury only.
Overall, the consequence of a striking an individual is not expected to decrease the local population size and therefore is assessed as negligible.
Likelihood The Australian National Marine Safety Committee (NMSC) reports that during 2009, there was one report of a vessel collision with a marine animal (species not defined) (NMSC 2010).
Water depths of within the operational area are shallower than known pygmy blue whale migration routes, reducing the likelihood of migrating blue whales occurring during the Activity. The operational area overlaps the humpback whale migration route. The Activity will not occur during peak migration season reducing the likelihood that significant interactions with humpback whales during the Activity will occur.
Whale sharks may be encountered in the operational area given the overlap with the foraging BIA. However, large numbers of whale shark encounters are not expected given the distance between the operational area and key aggregation sites at Ningaloo Reef (490 km).
Given that the timing of the activity (i.e. end of nesting/ internesting) the nearest nesting beaches for flatback turtles are located 52 km (North Turtle Island) from the operational area it is unlikely that large numbers of aggregating turtles will be encountered during the activity.
Vessels will be moving slowly whilst inside the operational area, posing a low risk of collision with marine fauna.
Consequently, the likelihood of a collision with marine fauna resulting in a minor consequence is considered to be rare.
Likelihood Ranking
2 - Very Unlikely Consequence Ranking A - Negligible
Residual Risk Low
Management Control
Effectiveness of Control
EPBC Regulations (Part 8) for interacting with cetaceans
Reduces risk of physical and behavioural impacts to cetaceans from support vessels, helicopters and seismic vessel (when not operating)
Santos Ltd | Keraudren Seismic Survey EP Summary Page 239 of 248
Constant bridge watch
Crew of support and seismic vessels will maintain constant bridge watch, including for third party vessels which may enter the exclusion zone
Marine fauna observations from support vessels in place to reduce potential for collisions
Eliminate / reduce impact potential for collision or unwanted interactions
Marine Fauna Observers on primary and secondary seismic vessels
Two trained MFO will be on board each source vessel at all times. At least 1 will be experienced (>12 months in an MFO role in Australian waters)
Reduce likelihood of collision occurring through identification of megafauna at sea surface
No acquisition during peak humpback migration
Avoidance of humpback whale migration periods would minimise impacts to this species
5.4.6 Introduction of Invasive Marine Species
Event: Introduction of Invasive Marine Species
Invasive marine species (IMS) have been introduced and translocated around Australia by a variety of natural and human means including biofouling and ballast water. IMS can be introduced into the operational area and surrounds by vessels carrying IMS on external biological fouling, internal systems (sea chests, seawater systems etc.), on marine equipment such as seismic streamers, or through ballast water exchange.
Potential Receptors
Marine ecosystem as a whole and Commercial / Recreational Users of the Marine Environment
Potential Impacts
IMS are marine plants, animals and algae that have been introduced into a region that is beyond their natural range but have the ability to survive, and possibly thrive (DAFF 2011). The majority of climatically compatible IMS to the NWS are found in south-east Asian countries.
Some IMS pose a significant risk to environmental values, biodiversity, ecosystem health, human health, fisheries, aquaculture, shipping, ports and tourism (Wells et al. 2009). IMSs can cause a variety of adverse effects in a receiving environment, including:
• over-predation of native flora and fauna • out-competing of native flora and fauna for food • human illness through released toxins • depletion of viable fishing areas and aquaculture stock • reduction of coastal aesthetics • damage to marine and industrial equipment and infrastructure.
Santos Ltd | Keraudren Seismic Survey EP Summary Page 240 of 248
Species of concern are those that are not native to the region; are likely to survive and establish in the region; and are able to spread by human mediated or natural means. Species of concern vary from one region to another depending on various environmental factors such as water temperature, salinity, nutrient levels and habitat type. These factors dictate their survival and invasive capabilities.
It is recognised that artificial, disturbed and/or polluted habitats in tropical regions are susceptible to introductions which is why ports are often areas of higher IMS risk (Neil et al. 2005).
Following their establishment, eradication of IMS populations is difficult, limiting management options to ongoing control or impact minimisation. Case studies in Australia indicate that from detection to eradication can take approximately four weeks (Bax 1999). However, this is dependent on the environmental conditions and species. For this reason, increased management requirements have been implemented in recent years by Commonwealth and State regulatory agencies.
Biofouling on vessel hulls and other external niche areas, biofouling on internal niches, biofouling on equipment routinely immersed in water and ballast water exchange all pose a potential risk of introducing IMS into Australia. The potential biofouling risk presented by the vessels will relate to the length of time that the vessel has already been operating in Australian waters or, if they have been operating outside Australian waters, the location/s of the operations it has been undertaking, the length of time spent at these location/s, and whether the vessel has undergone hull inspections, cleaning and application of new anti-foulant coating prior to returning to operate in Australia.
Impact Assessment
Receptors Consequence
Threatened, migratory, and local fauna; Physical environment and habitats and Socio-economic receptors.
Ballast water is responsible for up to 30% of all IMS incursions into Australian waters, however, research indicates that biofouling (the accumulation of aquatic micro-organisms, algae, plants and animals on vessel hulls and submerged surfaces) has been responsible for more foreign marine introductions than ballast water (DAWR 2017). IMS, if they successfully establish, can out-compete native species for food or space, preying on native species or changing the nature of the environment and can subsequently impact on fisheries or aquaculture.
If an IMS is introduced, they have been known to colonise areas outside of the areas they are introduced to. In the event that an IMS is introduced into the operational area, given the lack of diversity and extensiveness of similar benthic habitat in the region, there would only be a minor reduction in the physical environment.
The overall consequence level was assessed as moderate.
Likelihood The pathways for IMS introduction are well known, and consequently standard preventative measures are proposed. The ability for invasive marine species to colonise a habitat is dependent on a number of environmental conditions. It has been found that highly disturbed environments (such as marinas) are more susceptible to colonisation than open water environments where the number of dilutions and the degree of dispersal are high (Paulay et al. 2002). Given the water depths of in the operational area (50 – 150 m), the likelihood that an IMS would be able to successfully translocate from the operational area to surrounding shallower habitats is reduced. With controls in place to reduce the risk of introduction of IMS the likelihood of introducing an IMS is considered rare.
Likelihood Ranking
1 - Rare Consequence Ranking C – Moderate
Residual Risk Low
Management Control
Effectiveness of Control
Santos Ltd | Keraudren Seismic Survey EP Summary Page 241 of 248
DPIRD vessel check tool applied to vessels. Immersible equipment cleaned to low risk
The risk of introducing IMS are reduced through implementation of the vessel check tool and requirement for immersible equipment to be cleaned.
Anti-foulant system
The risk of introducing IMS are reduced due to anti-foulant systems
Ballast water management plan
Reduces the risk of introducing IMS through procedures managing ballast water exchange and identifying high risk ballast water
6. Management Approach The activity will be managed in compliance with all measures and controls detailed within the EP accepted by NOPSEMA under the OPGGS (E) Regulations, other environmental legislation and Quadrant’s Health, Safety and Environmental Management System (HSEMS).
The objective of the EP is to ensure that potential adverse environmental impacts from planned and unplanned events associated with the activity are identified and assessed, and to stipulate mitigation measures to avoid and/or reduce any adverse impacts to the environment to ALARP and acceptable levels.
The EP details specific performance outcomes, standards and procedures, and identifies the range of controls to be implemented (consistent with the standards) to achieve the performance outcomes. The EP also identifies the specific measurement criteria and records to be kept to demonstrate achievement of each performance outcome.
As described in the EP, the implementation strategy includes the relevant details of the following:
• Environmental Management System • Environmental Management Policy • Leadership, accountability and responsibility • Workforce training and competency • Hazard identification, risk and impact assessment and controls • Environmental performance outcomes, control measures and performance standards • Workforce involvement and stakeholder communication • Information management and document control • Operations management.
During the period that activities described in the EP are undertaken, Santos WA will ensure environmental performance is monitored and managed through an inspection and monitoring regime undertaken by Santos WA representatives or delegates.
Environmental compliance of an activity with the EP (and the EPOs) is measured using planned and systematic audits or inspections to identify weaknesses and non-conformances in the system and processes so that they can be identified. Continuous improvement opportunities identified through monitoring, audits and incident investigations are implemented in a controlled manner and communicated to all relevant workforce, contractors and relevant third parties. Audits and inspections are in place to identify possible incidents and actions taken to prevent them from happening.
Non-conformances found are addressed and resolved by a systematic corrective action process and are reported to NOPSEMA where relevant.
Santos Ltd | Keraudren Seismic Survey EP Summary Page 242 of 248
Senior Santos WA and vessel contractor personnel will be accountable for ensuring conformance with environmental performance outcomes and standards and all personnel will be empowered to ‘stop-the-job’ to ensure the activity is being implemented in an environmentally responsible manner. The EP identifies specific responsibilities for each role during the activity.
Incident notification and reporting to NOPSEMA and other regulators will be conducted as per the OPGGS (E) Regulations, as detailed within the EP. Reported HSE incidents and hazards will be communicated to personnel during daily operational meetings, and HSE incidents and hazards will be documented in the incident management systems as appropriate. Significant HSE incidents will be investigated using root cause analysis.
6.1 Management of Change The Environmental Management of Change Procedure (EA-91-IQ-10001) (MoC) process provides a systematic approach to initiate, assess, document, approve, communicate and implement changes to EPs and OPEPs (currently in force) whilst meeting the requirements of the OPGGS (E) Regulations.
The MoC process considers Regulation 7, 8 and 17 of the OPGGS(E) Regulations, and determines if a proposed change can proceed and the manner in which it can proceed. The MoC procedure will determine whether a revision of the EP is required and whether that revision is to be submitted to NOPSEMA. For a change to proceed, the associated environmental impacts and risks must be demonstrated to be acceptable and ALARP. Additional stakeholder consultation may be required depending on the nature and scale of the change.
The MoC procedure also allows for the assessment of new information that may become available post EP acceptance. For example, new Management Plans for marine reserves/parks, Recovery Plans or Conservation Advice for species and changes to the EPBC Protected Matters Search results. If new information is identified, this is treated as “Change that has an impact on Environment Plan” and the MoC process is followed accordingly.
Accepted MoCs become part of the in force EP or OPEP, will be tracked on a register and made available on Santos WA’s intranet. Where appropriate, Santos WA’s environmental compliance register will be updated to ensure control measure or environmental performance standard changes are communicated to the workforce and implemented. Any MoC will be distributed to the relevant persons, and the most relevant management position (e.g. geophysical manager, vessel masters) will ensure the MoC is communicated and implemented, which may include crew meetings/ briefings/ communications as appropriate for the change.
7. Hydrocarbon Spill Response Arrangements
7.1 Emergency Preparedness and Response The vessels are required to have and implement incident response plans, such as an emergency response plan and SMPEP/ SOPEP. Regular incident response drills and exercises (e.g. as defined in emergency response plan, SMPEP/ SOPEP etc.) will be carried out on activity vessels to refresh the crew in using equipment and implementing incident response procedures. The vessel SOPEP is the key response document for vessel and crew in the event of a marine oil spill, providing specific management response provisions to mitigate oil spills originating from vessels. Specific emergency procedures include steps to control discharges for bunkering spills, hull damage, fire and explosions, collisions, tank failure, sinking and vapour release.
Initial actions will be undertaken by the survey vessel in accordance with the vessel SOPEP, with subsequent actions determined in consultation with AMSA (under NATPLAN). Once the vessel and crew are safe, the Vessel Master (or delegate) will monitor the spill and notify AMSA of the situation status. AMSA will monitor and continue to assess this level of spill.
For larger spills AMSA will assume control of the incident (AMSA 2014) and lead the response, Santos WA will act as the Controlling Agency as per the OPEP until AMSA takes over, and then support the response as
Santos Ltd | Keraudren Seismic Survey EP Summary Page 243 of 248
required. The OPEP provides response strategies to be implemented dependent on the protection priorities at risk, the location, the prevailing weather conditions, the available vessel responses and the volume released. Response strategies described in the OPEP include stop the spill, monitor and evaluate, mechanical dispersion, shoreline protection, shoreline clean-up, operational monitoring and scientific monitoring. Recognising that there is potential for impacts associated with spill response activities, these risks will also be assessed as part of a Net Environment Benefit Analysis (NEBA).
Santos WA will implement the Keraudren Seismic Survey Oil Pollution Emergency Plan (QE-91-RI-20012.02) in the event of a significant hydrocarbon spill (level 2 or 3) and encompasses multiple levels of planning and response capability.
Following acceptance of an OPEP, the arrangements of the plan are tested by the Emergency & Oil Spill Coordinator through a communications test to all external agencies and companies with roles defined within the plan. To maintain a state of oil spill preparedness, personnel with OPEP responsibilities will be made aware of their obligations, oil spill response equipment will be maintained, contracts with critical equipment and personnel suppliers will be managed, and agreements will be in place with national regulatory agencies for support in oil spill response. Santos WA will also implement its oil spill response exercise and training schedule. Further information on oil spill response is provided in the OPEP.
A communications test for the activity is completed prior to commencement of the activities (refer to Section 20 of the OPEP).
8. Contact Details Further information about the Keraudren Seismic Survey activity can be obtained from:
Santos Ltd | Keraudren Seismic Survey EP Summary Page 244 of 248
9. References Ainslie MA. 2008. Review of published safety thresholds for human divers exposed to underwater sound. TNO Defence, Security and Safety Report. TNO-DV 2007 A598.
Andrzejaczek, S, J. Meeuwig, D. Rowat, S. Pierce, T. Davies, R. Fisher and M. Meekan. 2016. The ecological connectivity of whale shark aggregations in the Indian Ocean: a photo-identification approach. R. Soc. open sci. 3:160455. (http://dx.doi.org/10.1098/rsos.160455)
Bolle LJ, de Jong CAF, Bierman SM, van Beek PJG, van Keeken OA, et al. 2012. Common Sole Larvae Survive High Levels of Pile-Driving Sound in Controlled Exposure Experiments. PLoS ONE 7(3): e33052. doi:10.1371/journal.pone.0033052.
Barry Bruce, Russ Bradford, Scott Foster, Kate Lee, Matt Lansdell, Scott Cooper, Rachel Przeslawski (2018), Quantifying fish behaviour and commercial catch rates in relation to a marine seismic survey
Burbidge et al. (1986)
Carroll AG, Przeslawski R, Duncan A, Gunning M and Bruce B. 2017. A critical review of the potential impacts of marine seismic surveys on fish and invertebrates. Marine Pollution Bulletin 114: 9-24.
Clark, C.W., W.T. Ellison, B.L. Southall, L. Hatch, S.M. Van Parijs, A. Frankel, and D. Ponirakis. 2009. Acoustic masking in marine ecosystems: Intuitions, analysis, and implication. Marine Ecology Progress Series 395: 201-222. http://www.int-res.com/abstracts/meps/v395/p201-222/.
Condie SA, Mansbridge JV, Hart AM and Andrewartha JR (2006) Transport and recruitment of silver-lip pearl oyster larvae on Australia’s North West shelf. Journal of Shellfish Research, Vol. 25, No. 1, 179–185. 8pp.
Day RD, McCauley RD, Fitzgibbon QP and Semmens JM. 2016a. ‘Seismic Air Gun Exposure during Early-Stage Embryonic Development Does Not Negatively Affect Spiny Lobster Jasus Edwardsii Larvae (Decapoda:Palinuridae)’. Scientific Reports 6 (7 March 2016): 22723. doi:10.1038/srep22723.
Day RD, McCauley RD, Fitzgibbon QP, Hartman K and Semmens JM. 2016b. Exposure to seismic air gun signals causes physiological harm and alters behavior in the scallop Pecten fumatus. Fisheries and Aquaculture Centre, Institute for Marine and Antarctic Studies, University of Tasmania, Hobart, TAS 7001, Australia; and Centre for Marine Science and Technology, Curtin University, Perth, WA 6845, Australia.
Department of Fisheries (DOF). 2004. Final Application to the Australian Government Department of Environment and Heritage on the Pilbara Trap Managed Fishery,
DSEWPaC. 2012. Marine bioregional plan for the North-west Marine Region. Department of Sustainability Environment, Water, Population and Communities. Commonwealth of Australia. Canberra.
Dunlop RA, Noad MJ, McCauley RD, Kniest E, Slade R, Paton D, Cato DH. 2017 The behavioural response of migrating humpback whales to a full seismic airgun array. Proc. R. Soc. B 284: 20171901.
http://dx.doi.org/10.1098/rspb.2017.1901
Edmonds NJ, Firmin CJ, Goldsmith D, Faulkner RC and Wood DT. 2016. A review of crustacean sensitivity to high amplitude underwater noise: Data needs for effective risk assessment in relation to UK commercial species. Marine Pollution Bulletin 108(1–2): 5-11.
Engås A, Løkkeborg S, Ona E, Soldal AV. 1996. Effects of seismic shooting on local abundance and catch rates of cod (Gadus morhua) and haddock (Melanogrammus aeglefinus). Canadian Journal of Fisheries and Aquatic Sciences 53, 2238-2249.
ERM. 2017. Bethany 3D Survey Environment Plan - Seismic Airguns & Fish Mortality Literature Review. Final Report to Santos, Reference No. 0436696. 1 December 2017. 39 pp.
Fletcher WJ, Mumme MD and Webster FJ. (eds). 2017. Status Reports of the Fisheries and Aquatic Resources of Western Australia 2015/16: The State of the Fisheries. Department of Fisheries, Western Australia.
Santos Ltd | Keraudren Seismic Survey EP Summary Page 245 of 248
Fujioka, K., A.J. Hobday, R. Kawabe, K. Miyashita, K. Honda, T. Itoh & Y. Takao. 2010. Interannual variation in summer habitat utilization by juvenile southern bluefin tuna (Thunnus maccoyii) in southern Western Australia. Fisheries Oceanography. 19(3):183-195.
Gaughan DJ and Santoro K (eds). 2018. Status Reports of the Fisheries and Aquatic Resources of Western Australia 2016/17: The State of the Fisheries. Department of Primary Industries and Regional Development, Western Australia.
Gaughan, D.J., Newman, S.J, and Wakefield, C.B. 2018. Western Australian Marine Stewardship Council Report Series No. 11: Summary of the stock structure information used for determining spatial management of the index species for the scalefish resources of northern Western Australia. Department of Primary Industries and Regional Development, Western Australia. 32pp.
Gedamke, J., McCauley, R.D. 2010. Initial quantification of low-frequency masking potential of a seismic survey, SC/60/E12. Paper presented at the International Whaling.
Harry, A.V., Macbeth, W.G., Gutteridge, A.N. & Simpfendorfer, C.A. 2011. The life histories of endangered hammerhead sharks (Carcharhiniformes, Sphyrnidae) from the east coast of Australia. Journal of Fish Biology 78: 2026-2051.
Hatch, L.T., C.W. Clark, S.M. Van Parijs, A.S. Frankel, and D.W. Ponirakis. 2012. Quantifying loss of acoustic communication space for right whales in and around a U.S. National Marine Sanctuary. Conservation Biology 26(5): 983-994.
Heyward A, Colquhoun J, Cripps E, McCorry D, Stowar M, Radford B, Miller K, Miller I and Battershill C. 2018. No evidence of damage to the soft tissue or skeletal integrity of mesophotic corals exposed to a 3D marine seismic survey. Marine Pollution Bulletin 129 (2018) 8-13 pp.
Honda, K., A.J. Hobday, R. Kawabe, N. Tojo, K. Fujioka, Y. Takao & K. Miyashita. 2010. Age-dependent distribution of juvenile southern bluefin tuna (Thunnus maccoyii) on the continental shelf off southwest Australia determined by acoustic monitoring. Fisheries Oceanography. 19(2):151-158.
Houde ED and Zastrow CE. 1993. Ecosystem- and taxon-specific dynamic and energetics properties of larval fish assemblages. Bulletin of Marine Science 53 (2): 290-335.
Kennish, M.J. 1997. Practical handbook of Estuarine and Marine Pollution. Boca Raton, FL: CRC Press.
Klimley AP and Myrberg Jr AA. 1979. Acoustic stimuli underlying withdrawal from a sound source by adult lemon sharks, Negaprion brevirostris (Poey). Bulletin of Marine Science, 29: 447–458.
Laist, DW, Knowlton, AR, Mead, JG, Collet, AS and Podesta, M. 2001. Collision between ships and whales. Marine Mammal Science, 17: 35-75.
LeProvost, Semeniuk and Chalmers. 1986. Harriet Field - The Effect of Underwater Seismic Explosions on Pearl Oysters. Report to Apache Energy Ltd; ref: no. H62; document no. EAA-60-RU-002.
LGL. 2012. Environmental Assessment of Marine Geophysical Surveys by the R/V Marcus G. Langseth in the Northeastern Pacific Ocean, June–July 2012. LGL Ltd., environmental research associates. 225 pp.
Mackie, M.C., Lewis P.D., Saville K., Crowe F., Newman S.J. and Smith K.A. 2010. ESD Reports Series No. 7 – Western Australian Mackerel Fishery
Marquenie, J., Donners, M., Poot, H., Steckel, W. and de Wit, B. 2008. Adapting the spectral composition of artificial lighting to safeguard the environment. pp 1-6.
Marriott, R.J., O’Neill, M.F., Newman, S.J., Skepper, C.L. (2013) Abundance indices for long-lived tropical snapper: estimating standardised catch rates from spatially and temporally coarse logbook data.
McCauley R. D., Fewtrell, J., Duncan, A., Jenner, C., Jenner M-N., Penrose, J. D., Prince, R. T., Adhitya, A., Murdoch, J. and McCabe, A. K. 2000a. Marine seismic surveys: analysis and propagation of air-gun signals; and effects of air-gun exposure on humpback whales, sea turtles, fishes and squid. Curtin University Centre for Marine Science and Technology (CMST). Report R99-15 for the Australian Petroleum Production and Exploration Association (APPEA).
McCauley RD, Day RD, Swadling KM, Fitzgibbon QP, Watson RA and Semmens JM. 2017. Widely used marine seismic survey air gun operations negatively impact zooplankton. Nature Ecology & Evolution 1: 1-8. http://dx.doi.org/10.1038/s41559-017-0195.
Santos Ltd | Keraudren Seismic Survey EP Summary Page 246 of 248
McCauley, R.D., Jenner, M-N., Jenner, C., McCabe, K.A. and Murdoch, J. 1998. The response of humpback whales (Megaptera novaeangliae) to offshore seismic survey noise: preliminary results of observations about a working vessel and experimental exposures. APPEA Journal. Vol. 38(1), pp. 692-707.
Miller IR and Cripps E. 2013. Three dimensional marine seismic survey has no measurable effect on species richness or abundance of a coral reef associated fish community. Marine Pollution Bulletin, 77(1-2), 63-70. 10.1016/j.marpolbul.2013.10.031.
Moein SE, Musick JA, Keinath JA, Barnard DE, Lenhardt ML and George R. 1994. Evaluation of Seismic Sources for Repelling Sea Turtles from Hopper Dredges, in Sea Turtle Research Program: Summary Report. In: Hales LZ (ed.). Report from U.S. Army Engineer Division, South Atlantic, Atlanta GA, and U.S. Naval Submarine Base, Kings Bay GA. Technical Report CERC-95. 90 pp.
Morley EL, Jones G and Radford AN. 2014. The importance of invertebrates when considering the impacts of anthropogenic noise. Proceedings of the Royal Society of London B: Biological Sciences 281(1776). http://rspb.royalsocietypublishing.org/content/royprsb/281/1776/20132683.full.pdf.
Myrberg Jr AA. 2001. The acoustical biology of elasmobranchs. Environmental Biology of Fishes, 60: 31-45.
Neil et al. 2005
Newman S.J., Steckis R.A., Edmonds J.S., Lloyd, J. 2000. Stock Structure of the goldband snapper Pristipomoides multidens (Pisces: Lutjanidae) from the waters of northern and Western Australia by stable isotope ratio analysis of sagittal otolith carbonate.
Newman, S. Evans, D, Ashworth, R. May. 2000. Assessment of the outer-shelf fishery resources off the Pilbara coast of tropical Western Australia, Project No. 97/138
Newman, S.J., Hyndes, G.A., Penn, J.W., Mackie, M.C. Stephenson, P.C. (2014) Review of generic no take areas and conventional fishery closure systems and their application to the management of tropical fishery resources along north-western Australia.
NMFS. 2013. Marine Mammals: Interim Sound Threshold Guidance (webpage). National Marine Fisheries Service, National Oceanic and Atmospheric Administration, U.S. Department of Commerce.
NMFS. 2018. Revision to: Technical Guidance for Assessing the Effects of Anthropogenic Sound on Marine Mammal Hearing (Version 2.0): Underwater Thresholds for Onset of Permanent and Temporary Threshold Shifts. National Marine Fisheries Service. U.S. Department of Commerce, NOAA. NOAA Technical Memorandum NMFS-OPR-59. 167 pp. https://www.fisheries.noaa.gov/webdam/download/75962998
Nowacek, DP; Clark, CW; Mann, D; Miller, PJO; Rosenbaum, HC; Golden, JS; Jasny, M; Kraska, J; Southall, BL. 2015. Marine seismic surveys and ocean noise: Time for coordinated and prudent planning. Frontiers in Ecology & Environment 3(7), 378-386. DOI: 10.1890/130286.
NSF. 2011. National Science Foundation (U.S.), U.S. Geological Survey, and [NOAA] National Oceanic and Atmospheric Administration (U.S.). 2011. Final Programmatic Environmental Impact Statement/Overseas. Environmental Impact Statement for Marine Seismic Research Funded by the National Science Foundation or Conducted by the U.S. Geological Survey. National Science Foundation, Arlington, VA.
Ovenden, J.R., Lloyd, J., Newman,S., Keenan,C., Slater, L. (2001) Spatial genetic subdivision between northern Australian and southeast populations of Pristipomoides multidens: a tropical marine reef fish species.
Parry GD, Heislers S, Werner GF, Asplin MD, Gason A. 2002. Assessment of Environmental Effects of Seismic Testing on Scallop Fisheries in Bass Strait. Marine and Freshwater Resources Institute Report No. 50. Marine and Freshwater Resources Institute, Queenscliff, Victoria.
Parvin S. 2005. Limits for underwater noise exposure of human divers and swimmers. Subacoustech. Presented at the National Physics Laboratory Seminar on Underwater Acoustics, Teddington, UK. http://www.subacoustech.com/wp-content/uploads/NPLDiverNoisePresentation.pdf.
Parvin SJ. 1998. ‘The effects of low frequency underwater sound on divers‘. Proceedings of Undersea Defence Technology 1998, pp227-232, Nexus Media Ltd., Nice, France, June 1998.
Paulay G., Kirkendale L., Lambert G. and C. Meyer. 2002. Anthropogenic biotic interchange in a coral reef ecosystem: a case study from Guam. Pacific Science 56: 403-422.
Santos Ltd | Keraudren Seismic Survey EP Summary Page 247 of 248
Payne JF, Andrews CA, Fancey LL, Cook AL, Christian J R, and others. 2007. Pilot study on the effects of seismic air gun noise on lobster (Homarus americanus). Citeseer. (Accessed July 2017).
Peña H, Handegard NO and Ona E. 2013. Feeding herring schools do not react to seismic air gun surveys. ICES Journal of Marine Science 70: 1174–1180.
Pestorius FM, Cudahy E and Fothergill DM. 2009. Evolution of navy diver exposure standards for deterministic underwater sound in the 100-500 Hz band. Meetings on Acoustics. Volume 8. 070002.
Phillips, K., G. Begg & R. Curtotti. 2009. Southern Bluefin Tuna Fishery. Wilson D., R. Curtotti, G. Begg & K. Phillips, eds. Fishery Status Reports 2008: status of fish stocks and fisheries managed by the Australian Government. Page(s) 314-323. Canberra: Bureau of Rural Sciences & Australian Bureau of Agricultural and Resource Economics.
Popper A, Hawkins A, Fay R, Mann D, Bartol S, Carlson T, Coombs S, Ellison W, Gentry R, Halvorsen M, Løkkeborg S, Rogers P, Southall B, Zeddies D, Tavolga W. 2014. ASA S3/SC1.4 TR-2014 Sound Exposure Guidelines for Fishes and Sea Turtles: A Technical Report prepared by ANSI-Accredited Standards Committee S3/SC1 and registered with ANSI. Part of the series SpringerBriefs in Oceanography pp 15-16.
Popper AN. 2018. Potential for Impact of Cumulative Sound Exposure on Fishes During a Seismic Survey. Produced for Santos Ltd. Bethany 3D Seismic Survey Environment Plan Summary.
Popper AN and Fay RR. 2011. Rethinking sound detection by fishes. Hearing Research 273, 25-36.
Przeslawski R, Brooke B, Carroll AG and Fellows M. 2018. An integrated approach to assessing marine seismic impacts: Lessons learnt from the Gippsland Marine Environmental Monitoring project. Ocean & Coastal Management. Volume 160, 15 June 2018, pp 117 – 123.
Przeslawski R, Bruce B, Carroll A, Anderson J, Bradford R, Durrant A, Edmunds M, Foster S, Huang Z, Hurt L, Lansdell M, Lee K, Lees C, Nichols P and Williams S. 2016. Marine Seismic Survey Impacts on Fish and Invertebrates: Final Report for the Gippsland Marine Environmental Monitoring Project. Record 2016/35. Geoscience Australia, Canberra. 63 pp.
Quijano, J., Racca, R., and McPherson, C. 2018. Keraudren 3-D Marine Seismic Survey: Acoustic Modelling for Assessing Marine Fauna Sound Exposures. Document 01678. Technical report by JASCO Applied Sciences for Quadrant Energy Limited.
Richardson AJ, Matear RJ and Lenton A. 2017. Potential impacts on zooplankton of seismic surveys. CSIRO, Australia. 34 pp.
Richardson, W. J., and C. I. Malme. "Man-made noise and behavioral responses." The bowhead whale 2. 1993. 631-700.
Richardson, W.J., Greene, C.R., Malme, C.I. and Thomson, D.H. 1995. Marine Mammals and Noise. Academic Press, San Diego, 576p
Roberts L and Elliott M. 2017. Good or bad vibrations? Impacts of anthropogenic vibration on the marine epibenthos. Science of the Total Environment 595: 255-268. https://doi.org/10.1016/j.scitotenv.2017.03.117.
Roberts L, Cheesman S, Breithaupt T and Elliott M. 2015. Sensitivity of the mussel Mytilus edulis to substrate-borne vibration in relation to anthropogenically generated noise. Marine Ecology Progress Series 538: 185-195. http://www.int-res.com/abstracts/meps/v538/p185-195/.
Roberts L, Cheesman S, Elliott M and Breithaupt T. 2016. Sensitivity of Pagurus bernhardus (L.) to substrate-borne vibration and anthropogenic noise. Journal of Experimental Marine Biology and Ecology 474: 185-194. http://www.sciencedirect.com/science/article/pii/S0022098115300277.
Ross D. 1987. Mechanics of Underwater Noise. Península Publishing, Los Altos, CA
RPS. 2019. Ancient coastline KEF fish and pearl oyster habitat survey report. Study commissioned by Santos WA.
Salgado Kent C, McCauley RD, Duncan A, Erbe C, Gavrilov A, Lucke K and Parnum I. 2016. Underwater Sound and Vibration from Offshore Petroleum Activities and their Potential Effects on Marine Fauna: An Australian Perspective. Centre for Marine Science and Technology (CMST), Curtin University. April 2016. Project CMST 1218; Report 2015-13. 184 pp.
Silber, GK, Adams, JD, Bettridge, S. 2012. Vessel operator response to a voluntary vessel/whale collision reduction measure. Endangered Species Research 17:245–254.
Santos Ltd | Keraudren Seismic Survey EP Summary Page 248 of 248
Simmonds, M.P., Dolman, S.J. and Weilgart, L. (eds). 2004. Oceans of Noise [Online]. http://www.wdcs.org/submissions_bin/OceansofNoise.pdf. A WDCS Science Report Published by the Whale and Dolphin Conservation Society. Available from: https://uk.whales.org/sites/default/files/oceans-of-noise.pdf. [Accessed 30/11/2017].
Skjoldal, Hein Rune, et al. 2009. Arctic Marine Shipping Assessment. Background Research Report on Potential Environmental Impacts from Shipping in the Arctic. Draft Version July.
Slotte A, Hansen K, Dalen J and Ona E. 2004. Acoustic mapping of pelagic fish distribution and abundance in relation to a seismic shooting area off the Norwegian west coast. Fisheries Research 67: 143-150.
Southgate PC and Lucas JS. 2008. eds. The Pearl Oyster, England. 598 pp.
Tang KW, Gladyshev MI, Dubovskaya OP, Kirillin G & Grossart H-P. 2014. Zooplankton carcasses and non-predatory mortality in freshwater and inland sea environments. Journal of Plankton Research 36: 597-612.
Thums M, Jenner C, Waples K, Salgado Kent C, Meekan M. (2018) Humpback whale use of the Kimberley; understanding and monitoring spatial distribution. Report of Project 1.2.1 prepared for the Kimberley Marine Research Program, Western Australian Marine Science Institution, Perth, Western Australia, 78pp
Thums, M., Waayers, D., Huang, Z., Pattiaratchi, C., Bernus, J and M.Meekan. 2017. Environmental predictors of foraging and transit behaviour in flatback turtles Natator depressus. Endangered Species Research 32: 333-349.
Waayers, D and J. Stubbs. 2016. A decade of monitoring flatback turtles in Port Hedland, Western Australia 2004/05 – 2013/14. Report prepared for Care for Hedland Environmental Association.
Walker D.I. and McComb A.J. 1990. Salinity response of the seagrass Amphibolus Antartica: an experimental validation of field results. Aquatic Botany 36: 359–366.
Wardle, CS, Carter TJ, Urquhart, GG, Johnstone, ADF, Ziolkowski, AM, Hampson, G and Mackie, D. 2001. Effects of seismic air guns on marine fish. Continental Shelf Research 21: 1005-1027.
Wartzok, D; Ketten, D. 1999. Marine mammal sensory systems. In: Reynolds, JE; Rommel, SA (eds.) The Biology of Marine Mammals. Smithsonian Institution Press, Washington, DC.
Webster FJ, Wise BS, Fletcher WJ and Kemps H. 2018. Risk Assessment of the potential impacts of seismic air gun surveys on marine finfish and invertebrates in Western Australia. Fisheries Research Report No. 288 Department of Primary Industries and Regional Development, Western Australia. 42pp.
Wells FE, McDonald JI and Huisman JM. 2009. Introduced marine species in WA. Published by the Department of Fisheries, Perth, WA.
Whittock, P.A., Pendoley, K.L. and M. Hamann. 2014. Inter-nesting distribution of flatback turtles Natator depressus and industrial development in Western Australia. Endangered Species Research 26:25-38.
Whittock, P.A., Pendoley, K.L and M. Hamann. 2016. Using habitat suitability models in an industrial setting: the case for internesting flatback turtles. Ecosphere 7(11):e01551.
Witherington and Martin 2003
Woodside. 2008. Torosa South-1 Pilot Appraisal Well Environment Plan. Woodside Energy, Perth
Woodside. 2007. Environmental Protection Statement - Maxima 3D Marine Seismic Survey, Scott Reef. Woodside Energy Ltd, April 2007. Unpublished report, 418 pp.
Woodside. 2011a. Impacts of Seismic Airgun Noise on Fish Behaviour: A Coral Reef Case Study. Maxima 3D MSS Monitoring Program Information Sheet 1. 12 pp.