Quantitative 1H NMR. Development and Potential of an AnalyticalMethod: An UpdateGuido F. Pauli,*,†,‡ Tanja Godecke,† Birgit U. Jaki,†,‡ and David C. Lankin†
†Department of Medicinal Chemistry and Pharmacognosy and ‡Institute for Tuberculosis Research, College of Pharmacy, Universityof Illinois at Chicago, Chicago, Illinois 60612, United States
*S Supporting Information
ABSTRACT: Covering the literature from mid-2004 until the end of 2011, this reviewcontinues a previous literature overview on quantitative 1H NMR (qHNMR) methodologyand its applications in the analysis of natural products. Among the foremost advantages ofqHNMR is its accurate function with external calibration, the lack of any requirement foridentical reference materials, a high precision and accuracy when properly validated, and anability to quantitate multiple analytes simultaneously. As a result of the inclusion of over 170new references, this updated review summarizes a wealth of detailed experiential evidence andnewly developed methodology that supports qHNMR as a valuable and unbiased analyticaltool for natural product and other areas of research.
■ INTRODUCTIONIn the past seven years since the publication of our earlierreview on quantitative 1H NMR (qHNMR) for natural product(NP) analysis,1 the usefulness of NMR spectroscopy as aquantitative tool (qNMR) has received considerable additionalattention. This is documented not only by a steady increase inthe volume of literature reports that employ qHNMR but alsofrom numerous communications with colleagues who utilizeqHNMR or are interested in this methodology. Whilecontinuously updating our literature collection on the topic,we have also become progressively aware of a coherence thatappears to be characteristic of the field of qNMR. Thus,representing long-standing research and practice, q(H)NMRhas produced a wealth of knowledge in industrial settings, e.g.,the pharmaceutical, chemical, and food sectors. One plausibleinterpretation of this phenomenon is that proprietary qNMRmethodology provides a competitive advantage for industrialproducts. This would attest to the superiority of the capabilitiesof qNMR in terms of work-flow effectiveness, accuracy,precision, and cost−benefit relationships, when comparedwith other established methods. From a scientific perspective,one unfortunate occurrence is that much of the proprietaryknowledge remains undisclosed, such as trade secrets orinternal standard operating procedures, and does not usuallyfind its way into the scientific literature. Similar considerationsapply for patents involving qHNMR methodology. While thereare more than 200 patents on the subject, many of these do notlead to a corresponding peer-reviewed publication. The presentcontribution covers only peer-reviewed literature.The current review seeks to update the global picture of
qHNMR with respect to recent developments of qNMRmethodology, the qNMR work-flow (Figure 1), and advancesmade in the understanding of metabolomic complexity, whichaffects NPs at all levels, from crude extracts to bioactivefractions to “pure” compounds (see Residual Complexity of NP
Reference Materials section). The organization of the presentreview generally follows that of the previous work1 andemphasizes areas of new experimental developments andapplications. As high- and ultra-high-field NMR instrumenta-tion (400−1000 MHz) becomes increasingly more available,qHNMR can be considered as a universal method for NPanalysis,2 particularly bioactive NPs,3 which covers all smallmolecules (<2000 amu) but also macromolecular systems. Asthe section on new qHNMR applications shows, there areessentially no restrictions in compound class, as long as theanalytes contain protons and provided the dispersion (magneticfield strength) has sufficient resolving power for the complexityresulting from the combination of the 1H NMR spectra of theanalytes and the composition of the sample (pure compounds,mixtures of compounds, chromatographic fractions, crudeextracts).
■ BACKGROUNDThe Basics of qHNMR. A working definition of qNMR, its
historic and physicochemical background, the commonly usednomenclature, and an overview of experimental design (dataacquisition, postacquisition processing) to establish quantitativeconditions for qHNMR can be found in our previous review.1
While the previous report included relevant literature publisheduntil mid-2004, the present contribution continues from thatpoint and covers the literature published until the end of 2011.Following cross references in recent publications, previously
unnoticed qHNMR reports were discovered while preparingthis review and shall be given credit as very early reports onqNMR applications. This includes work from the period 1963−1976 on the use of an internal standard such as caffeine (1) forcalibration (see definition of calibration standards below, in the
Received: December 21, 2011Published: April 6, 2012
Reference and Calibration Standards section) in pharmaceuticalanalysis,4−7 as well as two reviews on the topic by Rackham,8,9
which covered the literature until 1975. An early report ofqNMR in pharmacognosy research by Hiltunen et al. describedthe use of this method for atropine (2) and scopolamine (3)analysis in Solanaceous leaves at a field strength equivalent to200 MHz for 1H and noted that the magnetic field strengthemployed was insufficient for the quantitation of anthraqui-nones [e.g., sennoside (4)] in Senna extracts.10
A relatively underexplored field in qNMR is the use of homo-and heteronuclear 2D-NMR experiments. The latter includethe inverse-detected sequences such as HSQC. Since theseexperiments detect 1H nuclei, they fall within the scope of thisreview and are addressed in a newly added section on two-dimensional qHNMR methodologies. Another new sectionprovides an overview of some of the software tools available topractitioners of qHNMR.
Updated Literature Background of qNMR. In the periodsince mid-2004, several excellent review articles have appearedthat cover various aspects of qHNMR: application inpharmaceutical analysis11,12 and the quality control of tradi-tional Chinese medicines;13 metabolomic profiling of plantextracts;14 an overview of quantitative metabolomics;15 and anoverview of the theoretical foundation of quantitation byNMR.16 The (semi)quantitative capabilities of NMR in theanalysis of carbohydrate mixtures by means of an artificialneural network are addressed in a contribution by Duus et al.17
In the context of metabolomic analysis, which seeks tocharacterize multiple individual metabolites both quantitativelyand qualitatively, the NMR-based protocol recently publishedby Kim, Choi, and Verpoorte is a valuable resource for plantmetabolomic studies.18
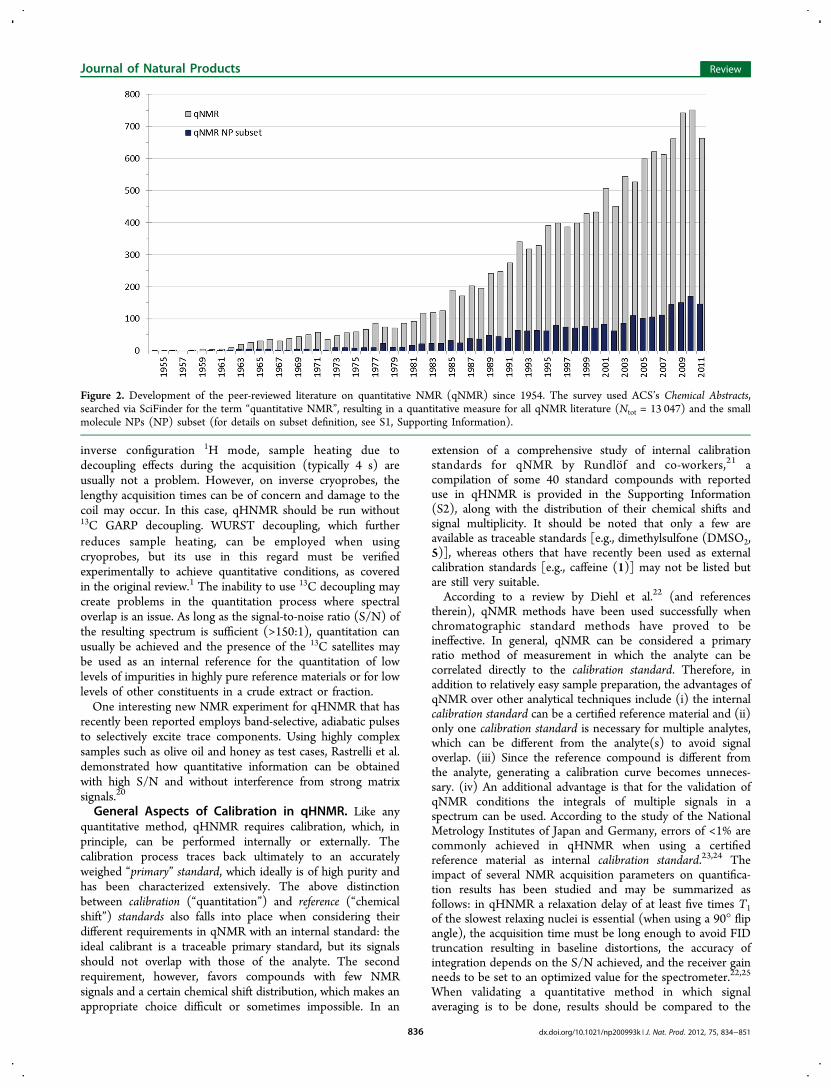
An updated statistical picture of the development of the peer-reviewed qNMR literature is given in Figure 2. As the presentwork focuses on small-molecule NPs, the published literaturewas analyzed for the NP subset using SciFinder in section titles(see S1, Supporting Information, for details). In recent years,the NP literature has maintained a consistent 10−20% share ofall qNMR publications. From a total of ∼13 000 hits on“quantitative NMR”, ∼2400 were related to representative NP
subsets. Expressing the growth reflected in Figure 2 in numbers,when comparing the seven-year periods of 1998−2004(covering one-third of the entire qNMR literature from 1954to 2004) with 2005−2011, the former saw about 81publications per year, while more recently 133 papers werepublished annually. Within all of the NP qNMR literature, 16%focus on specific plants or plant parts, as assessed usingSciFinder index terms. Of NP-related qNMR publications, 91%were published in English, followed by 3% in Chinese, and 2%in Japanese. The following six NP journals have each publishedsix or more qNMR reports and, thereby, contributed 8% of theNP-related qNMR literature: Journal of Agricultural and FoodChemistry, Journal of Pharmaceutical and Biomedical Analysis,Phytochemical Analysis, Journal of Natural Products, Chemical &Pharmaceutical Bulletin, and Phytochemistry.In order to gain insights into the nature of the most recent
qNMR publications, i.e., whether they report on applications orexplore new qNMR methodology, all the publications includingthe NP subset were analyzed for research topics, using thefollowing three representative terms: “acquisition parameters”,revealing 25 publications (0.2%) on new qNMR methodology;152 publications (1.2%) reporting research on “processingparameters”; and 142 (1.1%) found using the term “peak area”.On the basis of these data and the authors’ general assessment,it is reasonable to conclude that only a very small number(<2%) of publications on “quantitative NMR” have beenexploring new qNMR methodology such as experimentalparameters, pulse sequences, and experiments, while the vastmajority reported on applications of qNMR, with severalstudies including method validation.
■ THE QHNMR EXPERIMENTReference and Calibration Standards. All qNMR
experiments require two forms of quantitative adjustment:one concerns the chemical shifts (δ in ppm) of the resonances,for which the terms referencing and reference standard are used inthe following sections. The other adjustment relates to thequantitation of the NMR signals, and the terms calibration andcalibration standards (syn. calibrant) are used herein for thispurpose. While TMS and DSS are the IUPAC-approved NMRstandards for referencing, in practice chemical shift calibration isoften done externally and/or via the residual solvent signal. As aresult, the literature is nonhomogeneous with regard to NMRreferencing, and qHNMR reports should define how bothreferencing and calibration were performed.However, both operations require a well-defined standard
material, which is often termed a “reference standard” or“reference compound”. While these ambivalent terms wereused in the last review,1 the crucial role of calibration andcalibration standards in qNMR has now become more clearlydefined. Thus, we propose to distinguish the different roles andrequirements for the two types of standards in qHNMR, i.e.,the reference standard and the calibration standard (syn.calibrant). These terms also set them apart from referencematerials, the term used in this review to designate highlycharacterized samples (“standards”) of a single chemical entitysuch as a NP.
Carbon Decoupling and New Experiments in qHNMR.A routine qHNMR protocol illustrated for paclitaxel, whichdemonstrates the advantages of 13C GARP decoupling of theproton NMR spectrum to suppress the 13C satellites, has beenpublished.19 When using this protocol on instrumentationequipped with room-temperature probes, in either direct or
Figure 1. Graphical representation of the qHNMR concept and work-flow. Using 1H signals for universal detection, qHNMR is amenable toa broad range of pure to crude natural products (NPs). The qHNMRmethod consists of three main components: (i) ACQU, theacquisition, comprised of a suitable 1H NMR experiment (expt) thatestablishes quantitative conditions (qCond); (ii) CAL, quantitativecalibration using a suitable external calibrant and method or an internalcalibrant; (iii) PROC, postacquisition processing of the raw NMR data(i.e., FIDs), using a standard operation protocol (SOP) and softwaretool (soft). Major strengths of the qHNMR work-flow include theability to simultaneously yield concentration (conc) and identity (ID)information and to perform the analysis for several target analytes at atime and without the need for identical calibration standards.
Journal of Natural Products Review
dx.doi.org/10.1021/np200993k | J. Nat. Prod. 2012, 75, 834−851835
inverse configuration 1H mode, sample heating due todecoupling effects during the acquisition (typically 4 s) areusually not a problem. However, on inverse cryoprobes, thelengthy acquisition times can be of concern and damage to thecoil may occur. In this case, qHNMR should be run without13C GARP decoupling. WURST decoupling, which furtherreduces sample heating, can be employed when usingcryoprobes, but its use in this regard must be verifiedexperimentally to achieve quantitative conditions, as coveredin the original review.1 The inability to use 13C decoupling maycreate problems in the quantitation process where spectraloverlap is an issue. As long as the signal-to-noise ratio (S/N) ofthe resulting spectrum is sufficient (>150:1), quantitation canusually be achieved and the presence of the 13C satellites maybe used as an internal reference for the quantitation of lowlevels of impurities in highly pure reference materials or for lowlevels of other constituents in a crude extract or fraction.One interesting new NMR experiment for qHNMR that has
recently been reported employs band-selective, adiabatic pulsesto selectively excite trace components. Using highly complexsamples such as olive oil and honey as test cases, Rastrelli et al.demonstrated how quantitative information can be obtainedwith high S/N and without interference from strong matrixsignals.20
General Aspects of Calibration in qHNMR. Like anyquantitative method, qHNMR requires calibration, which, inprinciple, can be performed internally or externally. Thecalibration process traces back ultimately to an accuratelyweighed “primary” standard, which ideally is of high purity andhas been characterized extensively. The above distinctionbetween calibration (“quantitation”) and reference (“chemicalshift”) standards also falls into place when considering theirdifferent requirements in qNMR with an internal standard: theideal calibrant is a traceable primary standard, but its signalsshould not overlap with those of the analyte. The secondrequirement, however, favors compounds with few NMRsignals and a certain chemical shift distribution, which makes anappropriate choice difficult or sometimes impossible. In an
extension of a comprehensive study of internal calibrationstandards for qNMR by Rundlof and co-workers,21 acompilation of some 40 standard compounds with reporteduse in qHNMR is provided in the Supporting Information(S2), along with the distribution of their chemical shifts andsignal multiplicity. It should be noted that only a few areavailable as traceable standards [e.g., dimethylsulfone (DMSO2,5)], whereas others that have recently been used as externalcalibration standards [e.g., caffeine (1)] may not be listed butare still very suitable.According to a review by Diehl et al.22 (and references
therein), qNMR methods have been used successfully whenchromatographic standard methods have proved to beineffective. In general, qNMR can be considered a primaryratio method of measurement in which the analyte can becorrelated directly to the calibration standard. Therefore, inaddition to relatively easy sample preparation, the advantages ofqNMR over other analytical techniques include (i) the internalcalibration standard can be a certified reference material and (ii)only one calibration standard is necessary for multiple analytes,which can be different from the analyte(s) to avoid signaloverlap. (iii) Since the reference compound is different fromthe analyte, generating a calibration curve becomes unneces-sary. (iv) An additional advantage is that for the validation ofqNMR conditions the integrals of multiple signals in aspectrum can be used. According to the study of the NationalMetrology Institutes of Japan and Germany, errors of <1% arecommonly achieved in qHNMR when using a certifiedreference material as internal calibration standard.23,24 Theimpact of several NMR acquisition parameters on quantifica-tion results has been studied and may be summarized asfollows: in qHNMR a relaxation delay of at least five times T1of the slowest relaxing nuclei is essential (when using a 90° flipangle), the acquisition time must be long enough to avoid FIDtruncation resulting in baseline distortions, the accuracy ofintegration depends on the S/N achieved, and the receiver gainneeds to be set to an optimized value for the spectrometer.22,25
When validating a quantitative method in which signalaveraging is to be done, results should be compared to the
Figure 2. Development of the peer-reviewed literature on quantitative NMR (qNMR) since 1954. The survey used ACS’s Chemical Abstracts,searched via SciFinder for the term “quantitative NMR”, resulting in a quantitative measure for all qNMR literature (Ntot = 13 047) and the smallmolecule NPs (NP) subset (for details on subset definition, see S1, Supporting Information).
Journal of Natural Products Review
dx.doi.org/10.1021/np200993k | J. Nat. Prod. 2012, 75, 834−851836
single-pulse experiment using an internal calibration standard,which is considered as the most accurate procedure.Calibration Methods in qHNMR. As qNMR is considered
a primary analytical method, reference materials do not need tobe identical or even chemically related with the analyte(identical reference standard, or more distinctively identicalcalibrant). Accordingly, a wide range of pure chemicals havebeen employed as internal calibration standards for qNMR.21
Some studies focus on the discovery of a new internal calibrantfor qNMR analysis with properties that allow for the mostgeneral application. Pinciroli et al. compared an LC-UV-MSmethod with a qHNMR method using a novel silane standard,1,4-bis(trimethylsilyl)benzene (BTMSB) in DMSO-d6 solution,to build a generic method for the quantitation of small organicmolecules. The present authors have found BTMSB to be aneasily weighable solid that is stable for at least one month inDMSO solution and which produces a strong singlet in a signal-free region of the 1H NMR spectrum. Quantitative determi-nations led to ∼2% precision and accuracy, which was verifiedusing a set of certified standards and with fully automatedsample preparation.26
A study by Wells et al. emphasizes the advantages of usingone universal reference material (URM) for qNMR. Theauthors propose DMSO2 (5) for this purpose, as it is widelyavailable and of high purity, inexpensive, chemically stable,soluble in a wide range of aqueous and nonaqueous solvents,chemically inert, and nonhygroscopic. In addition, due to itssingle 1H NMR signal, it shows minimum interference withother analytes and is, therefore, proposed as a URM for thecertification of secondary reference materials.27
The residual solvent signal in 1H NMR spectra can be usedas the “internal standard signal” for the calibration of thequantitative method with external calibrants.28 Use of thesolvent signal is beneficial when the analyte needs to berecovered after analysis in pure form. A calibration curve relatesthe solvent signal to another external reference material such ashigh-purity caffeine (1). The first report of the utilization of theresidual solvent signal for calibration was by Letot et al.,29 whoestablished a qHNMR-based quality control (QC) protocol fora combinatorial chemistry library, also a new approach in thefield that otherwise is dominated by LC(-MS). Interestingly,they observed an average sample purity of 52%.29 Later, Pierenset al. compared the qNMR method using the residual solventsignal as internal calibration standard with balance concen-trations of 18 NPs.30 A calibration curve with nineconcentrations of 1 showed a linear relationship in theconcentration range 0.1−60 mM. Many solvents havecomparatively long T1 values. Therefore, when using thesolvent signal as internal calibration standard, the acquisitionduty cycle needs to be chosen carefully. The authors also foundthat the amount of residual solvent varied from batch to batchof NMR solvent, but for DMSO-d6 was stable over time andreliable within the same batch. However, the stability of thesolvent with respect to deuterium exchange will be dependenton the chemical nature of the dissolved analyte(s) and mayrequire separate stability validation, particularly for stronglyacidic or basic analytes. The qNMR concentrations for fivecrystalline NPs were in good agreement with the balanceconcentrations, while 18 other NPs differed greatly from theirbalance concentrations, suggesting again that qNMR is asharper and more universal method for the purity assessment ofNPs.30
One key conclusion of the 2005 study by Burton et al.28 isthat the external calibration of an internal (solvent) signal ispossible but not necessary: provided precise measurements ofthe 360-degree pulse length are performed for each sample andsingle-coil excitation and detection is used, quantitation of theNMR signal is straightforward following the Lorentz principleof reciprocity.31 Accordingly, a correction factor for variationsin probe-Q can be calculated that allows direct comparison ofsignal intensity across samples, even in different and non-deuterated solvents.28 Using a series of standards of algal toxinsas samples, the authors demonstrated the validity of qHNMRconcentration measurements, with excellent validation param-eters and errors and without the need for internal calibrationstandards.28 This principle was implemented subsequently inthe method of “pulse length-based concentration measure-ment”, developed for the determination of protein concen-trations by Wider and Dreier.32 One advantage of calibrationmethods that utilize the principle of reciprocity to correlatemeasurements of absolute NMR intensity over methods thatutilize electronic reference signals (“ERETIC”) in qNMR isthat they avoid challenges associated with the practicalimplementation of the latter. Seeking to combine the best ofboth approaches, Farrant et al. have developed, very recently,software that integrates the calculation of probe-Q correctionfactors with the addition of an artificial NMR signal forautomated quantitation.33 A similar method was alsoimplemented by Walker et al. for the validation of metabolitereference materials.34
Sensitivity and qHNMR Calibration of Low-LevelAnalytes. Often quoted disadvantages of NMR are its “low”sensitivity and dynamic range, especially when compared to LCmethods with selective ion detection. With regard to signaldynamic range, recent developments in the design andmanufacturing of NMR instrumentation, specifically fasterdigitizers for oversampling, can be expected to lead tosignificant improvements in the detection of trace componentsand residual complexity in NPs (see section on “ResidualComplexity of NP Reference Materials”). From the perspectiveof the NPs researcher, NMR has recently experienced majorgains in sensitivity due to the development of microcryoprobetechnology. Martin and co-workers35,36 (and references there-in) are among the leaders in this field and have demonstratedthe feasibility of acquiring a 2D-gHSQC spectrum of 540 ng ofstrychnine (6) at 600 MHz utilizing a weekend of spectrometertime. Along the lines of low-level/high-sensitivity qHNMR,Weljie et al. described a method for the detection andquantitation of low-intensity unknown peaks (LIUPs) in spikedurine samples.37 The method uses database spectra of purecompounds to identify known metabolites in the sample,principal component analysis (PCA) for the identification ofthe spectral regions responsible for differences betweensamples, and a subsequent peak fitting method to identify theLIUPs from the spectral regions of interest. The study used 2,2-dimethyl-2-silapentane-5-sulfonate sodium salt (DSS) asinternal calibration standard to relate the analyte spectrumand reference spectrum. It was shown that major influencesstem from baseline effects, especially on low-concentrationmetabolites, as well as from parameters in performing the PCAanalysis (binning method, weighting functions). In addition,13C satellite signals need to be identified in spectra to ensurelegitimacy of low-level metabolites. As a result of the study, anumber of metabolites in spiked samples were determined tobe correctly and reproducibly quantified in the <10 μM range.37
Journal of Natural Products Review
dx.doi.org/10.1021/np200993k | J. Nat. Prod. 2012, 75, 834−851837
When isolating NPs with biological activities, initial sampleamounts are often limited. Reports by Claridge et al.38 andDalisay et al.39 addressed the accurate qHNMR determinationof low-level amounts of impurities and isolates, respectively.Both studies are based on the concept that an internalcalibration standard signal of similar integral value as theanalyte, such as the natural 13C satellites, yields more accuratequantitative results.2 In the latter study, the 13C satellite signalsof the solvent (CDCl3) serve as internal calibrants. In addition,the authors used 1.7 mm microprobe technology to reach lowerlimits of quantitation: when calibrating against cholesterol, alinear correlation was observed over the concentration range28.5 μM to 1.42 mM. The study also used a 30° pulse angle forfaster relaxation to achieve better S/N in a given time. Toensure sufficient relaxation of the observed nuclei, tworelaxation delays were compared, resulting in only a minordifference between the integral ratio of a cholesterol signal andthe 13C satellite internal calibration signal.39
For the quantification of slightly overlapped NMR signals ofcompounds at the lower concentration limit, a strategy toobtain a higher signal resolution and subsequently accuratequantitation results is the use of peak height instead of integralvalues.40 The peak height in a spectrum is not directlyproportional to the number of nuclei at that frequency. Toobtain accurate results using the peak height method, the peakwidths at half-height of both the standard and the analyte signalhave to be equal, which can be achieved by applyingpostacquisition processing. The method can be applied toany qHNMR spectrum, and the results from peak heightquantitation and peak area quantitation should be used inconjunction as a way to ensure correct results. Poor phasing,baseline correction, and shimming were shown to influenceeither qNMR method differently. Therefore, a large variancebetween the integral and peak height results can give clues topotential errors in data acquisition or processing. This methodreadily lends itself to automation. Maleic acid, dimethylfumarate, or 1 was used as internal calibrant.40
Another strategy for the quantitation of overlapped or low-concentration signals is peak fitting or deconvolution instead ofsimple integration of such signal groups. Soininen et al. havedescribed a method for organic impurity determination byqHNMR employing line fitting.41 The study uses the PERCHsoftware suite for off-line processing, which includes a programfor total line shape (TLS) fitting. Upon comparison of variousline-fitting methods, one key result is that the ability to entersome constraints into the fitting model, such as assumptionsabout the multiplicity of the impurity peak or equivalences ofcertain signal areas, allows impurities to be quantified correctlyat levels as low as 0.1 mol %. Results obtained by using theconstrained TLS fitting method in determining signal areasremove the problems arising from baseline artifacts in normalintegration. This results in higher accuracy, especially for thequantitation of compounds at low concentrations or withoverlapped signals. An improvement to the GARP decouplingmethod for baseline improvement and 13C satellite removal alsohas been described.41
Summary of Calibration Strategies in qHNMR.Measurement of an internal calibrant added to the analyteand use of a single-pulse experiment are widely considered themost accurate approach to qHNMR and can well be used forcalibration purposes. However, an internal standard added tothe sample must be carefully selected, and possible chemicalinteractions with the analyte need to be precluded prior to
qHNMR analysis. Alternatively, using the residual solvent or(its) 13C satellites as internal calibrant evades the consequencesof adding an internal standard. This approach has been shownto give accurate results in combination with external calibrationand allows absolute quantitation in qHNMR. For thequantitation of low-concentration samples, multiple transientsneed to be collected and acquisition parameters must be chosenwith particular care to establish quantitative conditions (see ref1 for an overview). While 13C satellites and residual solventsignals can be very useful in high-throughput applications, itshould be noted that this form of calibration is specific to theisotopic labeling of the calibrant, e.g., the solvent used.External calibration is available as a very flexible and highly
precise qHNMR concept28 that has been shown to be suitablefor the establishment of traceable NP reference standards. It isbased on the Lorentz principle of reciprocity31 and reliesprimarily on precise pulse length measurements and theestablishment of a correction factor. Moreover, it allows directqHNMR quantitation across samples and (non)deuteratedsolvents. Finally, methods such as total line fitting and peakheight quantitation are very useful for both calibration andsubsequent quantitation. They are advantageous especially incrowded spectra of NPs, do not increase demand on NMRspectrometer time, and require only a more elaboratepostacquisition processing work-flow.
Relationship between qHNMR and Other Quantita-tion Methods. A review by Gilard et al. describes severalexamples of the application of 1H NMR to the quality controlof herbal materials and highlights besides the above statedadvantages of qNMR ways to deal with its limitations whenanalyzing complex samples such as plant preparations. For thispurpose, when screening herbal medicines for adulteration, thediffusion ordered spectroscopy 1H NMR method (DOSY) hasbeen found to be particularly useful and is regarded as a “virtualchromatography”.42 Numerous studies have reported on theuse of 1H NMR spectroscopy for quantitation of constituents inplant preparations,43−47 and many reports have compared themore customary method with a new qHNMR technique that isless time-consuming and more economical,47−49 yields thesame or better accuracy,50−58 and supplies more qualitativeinformation about impurity identities as well as impurity countsin a test sample.59−62 For these reasons, qHNMR purity levelsare often found to be lower than those determined by othermethods. One example is a study on macrolide antibiotics. AqHNMR procedure was compared with a mass balancemethod, which represents the gold standard for determiningpurity of a primary chemical reference material. Both methodsyielded similar results for the five kinds of macrolide antibioticsused. 1,4-Dinitrobenzene was selected as internal calibrationstandard over anthracene. The COSY and NOESY spectra of1,4-dinitrobenzene and clarithromycin (7) indicated nointeraction between standard and analyte. The uncertainty ofthe qNMR method was smaller in four of five cases whencompared with the mass balance method. Moreover, theadvantages of qNMR include simple sample preparation and aquick and easy analysis. The uncertainty involved with theqNMR method was found to be derived mainly from thesample weight and accurate integration of the monitor signalsof analyte and reference. To minimize the integration error, it isbest to use similar concentrations for the analyte andstandard.63
For the determination of oxyethylene group (EO) content ofpolysorbates used as food additives, qNMR was compared with
Journal of Natural Products Review
dx.doi.org/10.1021/np200993k | J. Nat. Prod. 2012, 75, 834−851838
a classical titration method. It was demonstrated that the EOcontents of commercial polysorbates 20, 60, 65, and 80 (8)could be rapidly and simply determined using qNMR with aninternal calibrant. Potassium hydrogen phthalate was used asthe internal calibrant, and the EO signals were identifiedthrough comparison with sorbitan monolaurate and poly-(ethylene glycol) distearate prior to quantitation.64
LC-MS methods are considered indispensable tools tomeasure complex analytes at trace levels and for routineanalysis. When authentic samples of such complex analytes(and corresponding internal calibration standards) are difficultto obtain, especially in greater amounts where the absolutepurity can be established more readily, qNMR experiments arebeing recognized64 and employed as the primary analyticalmethod65−67 or for calibration purposes. A study by Mohn et al.used qNMR for the purity determination of authentic NPreference materials to be used for LC-MS analysis ofglucosinolates in cruciferous plants. The purity of nineglucosinolate (e.g., 9) reference compounds (HPLC purity>99%) was determined by qNMR using 1,3,5-trimethoxyben-zene as internal calibrant. The qHNMR data revealedsignificant differences in purity levels when compared toHPLC values. The purity of the reference materials was foundto be in the range 60−90%, showing NMR to be the moreuniversal detector and qNMR a superior method for puritydetermination of NP reference materials.68
Another study by Shao et al. described the use of p-toluenesulfonic acid as a reference compound in aqueoussolution. Using quantitative NMR, p-toluenesulfonic acid wasfirst used to determine the purity of compounds that serve asauthentic or internal calibrant in other chemical analyses andwas removed from the sample successfully after the analysis.69
Chemical Shift Variations of qHNMR Reference andCalibration Standards. A qNMR assay is almost always usedsimultaneously as a qualitative tool, evaluating the characteristiccoupling patterns and chemical shifts for analyte identification.Noncovalent weak forces that stabilize molecular assembliesthrough intermolecular hydrogen bonds, aromatic π−πstacking, and electrostatic interactions lead to “head-to-head”and/or “head-to-tail” dimer formation. In such assemblies, thenumber of molecules, the orientations in the aggregate, andtheir mutual interactions and “tightness” of association shouldvary as a function of concentration, which in turn shouldmanifest in the altered chemical shifts.70 Working on thequantitation of mebeverine (10) HCl from tablets, Blagbroughet al. have studied effects of concentration, pH, andtemperature on the chemical shifts of the mebeverineprotons.71 The authors found that concentration differenceshad the highest influence on chemical shits in D2O, withincreasing concentrations resulting in an upfield shift. InCDCl3, DMSO-d6, MeCN-d3, and CD3OD, chemical shiftsremained stable. Moreover, changes in pH did not result inmajor differences, whereas a temperature change from 20 °C to75 °C resulted in a general downfield shift of the protonresonances. Pulsed-field gradient spin echo (PGSE) experi-ments were conducted in D2O, CDCl3, and CD3OD,suggesting that the concentration influence on chemical shiftsis due to aggregation effects in aqueous media. The amountsdetermined of mebeverine HCl were in the range of 5−50 mg/mL, as recovered from tablets analyzed. The qHNMR resultswere close to the label value (100 mg; qNMR mean 99.3 ± 0.92mg) with a relative standard deviation of 0.84%, whichdemonstrated the credibility of the qNMR methodology.71
Taking these findings into account, any added internalcalibrant potentially may influence the weak solute−soluteinteractions and result in chemical shift changes of the internalcalibrant or the analytes. A reliable method for comparingchemical shifts under varying conditions is required forstudying the effects of solvent, temperature, and concentration.Especially for an automated identification of known analytes,accurate shift referencing seems crucial. Thus, a study byHoffmann describing effects on the chemical shift oftetramethylsilane (TMS) gives valuable insights into measuringabsolute chemical shifts using a conventional NMR spectrom-eter.72 The findings are important because TMS is consideredto be the global reference compound for zero-point referencingof the NMR ppm scale. However, the chemical shift of theTMS signal in dilute solutions was found to vary in differentsolvents and to be dependent on the temperature in the samesolvent. The exact chemical shift of TMS was found to dependmostly on solvent anisotropy and polarizability, and it issuggested that the chemical shift be referenced to TMS protonsat 0.000 ppm in the same solvent, unless comparison isrequired with other solvents. IUPAC does not refer to astandard temperature for the chemical shift of the TMS signal.Therefore, temperatures need to be compared carefully beforecomparing chemical shifts.72 In addition, it is important to notethat temperature precision and stability require carefulevaluation when validating qHNMR methods.
Software for qNMR Analysis. Software specifically createdfor analyzing primarily 1D quantitative NMR spectra (1D 1Hand 13C) has appeared. In addition to analysis softwareprovided by the respective NMR instrument manufacturers(Agilent [vnmr], Bruker [Topspin], and JEOL [Delta]),commercial software packages are available from third partysoftware providers (e.g., ACD, AcornNMR [Nuts], Mestrelab[MNova for Windows, iNNMR for OsX], PERCH Solutions[PERCH], NMRTec [NMR Notebook]) and have appeared inaddition to open-source software (e.g., Frank Delaglio’sNMRpipe [http://spin.niddk.nih.gov/NMRPipe/], OneMoon Sc i en t ifi c Inc . ’ s NMR View J [h t t p : //onemoonscientific.com], and Kirk Marat’s SpinWorks [ftp://davinci.chem.umanitoba.ca/pub/marat/SpinWorks/]). Most ofthe software is designed to handle one spectrum at a time, butat least two open-source packages, the statistical softwarepackage rNMR73 and ImatraNMR,74 are capable of batchintegration and analysis of qNMR spectra, while not providingprocessing capabilities. So far, these software solutions havebeen applied to the metabolomics problems for which theywere developed. They are, however, capable of addressing otherproblems in qNMR analysis unrelated to metabolomics.Spectral “binning” and parallel signal alignment have been amain approach in making NMR data available to externalstatistics analysis, using software packages such as Umetrics’SIMCA, Matlab, and Microsoft Excel/XLStat. For example,Bruker’s AMIX software and rNMR73 allow the use of multiple,specifically selected peaks or regions of interest in 1D- and 2D-NMR spectra for further statistical analysis, either within thesoftware (AMIX) or after export (rNMR). Both allow a manualpeak alignment, however, only for the entire spectrum. Workby Forshed et al. addresses 1H NMR peak alignment based onmultiple points in the spectra by self-written Matlab code,validated by subsequent PCA and PLS-DA analysis.75,76
Journal of Natural Products Review
dx.doi.org/10.1021/np200993k | J. Nat. Prod. 2012, 75, 834−851839
One-dimensional qHNMR techniques have been demonstratedto work very well for performing purity analysis on referencematerials or isolated NPs, fractions, or crude extracts. Ingeneral, using 1H NMR spectra, with isolated signals associatedwith a specific component or components in a mixture clearlypresent and “out in the open”, a clean integration of theseproton resonances can lead to a quantitative determination ofeach of the chemical components in the sample. However, inNP research, samples are encountered that are clearly indicativeof very complex mixtures of chemical components and mayresult in significant difficulties in the quantitation of thecomponents in these mixtures. Since the publication of our2005 review,1 focusing principally on 1D-qHNMR techniques,there has been considerable interest and activity in studying theapplication of 2D-NMR techniques for the quantitation ofproton NMR spectra of complex mixtures. Complex mixturesexhibit extensive spectral overlap because of the large numberof components present in the mixture. This is especially true forcrude extracts of plant material and also for the fractionsderived from these crude extracts. The use of 2D-NMRtechniques for quantitation (2D-qHNMR) is in part designedto bring about a simplification of the chemical informationpresent in a mixture (not a new concept), which may beaccomplished by different mechanisms depending on the natureof the 2D-NMR pulse sequence as well as the experimentemployed and the chemical information being revealed. Asummary of some of the 2D-NMR techniques that are currentlybeing explored for quantitation purposes has appeared in anexcellent review published recently by Koskela et al.,77 andadditional papers describing a variety of 2D-NMR method-ologies and applications have appeared. Presently, there are aconsiderable number of 2D experiments that are also activelybeing exploited for the purposes of quantitation and that havebeen demonstrated to provide reliable results when comparedto the corresponding 1D-qNMR spectral data or quantitationresults obtained by chromatographic means, e.g., HPLC.The 2D J-Resolved NMR Experiment. The 2D J-resolved
experiment has been used traditionally in a qualitative contextto provide a separation of proton chemical shift informationfrom the highly digitally resolved multiplicities of protonspectra for the purposes of extracting J-coupling constantinformation for structural analysis or to assist full-spin analysisof proton NMR spectra. The 2D-spectra of each of themultiplicities appear as slices parallel to the f1 axis (afterrotation and symmetrization) and may be plotted and analyzedaccordingly. Along the f2 axis, suitable appropriate postacqui-sition processing of the 2D-NMR data can render a summedprojection of the 1H data to create a 1D proton NMR spectrumdevoid of proton−proton couplings (effectively a 1D “proton-decoupled proton spectrum”). This spectrum will retain therelative quantitative information and can be used therefore forquantitation. While this pulse sequence is conceptually wellunderstood (see ref 78, in particular, Chapter 7), it suffers fromthe fact that the peaks in the spectrum have a characteristicphase-twist line shape, and therefore the spectra are generallydisplayed in the absolute value mode. This will affect theaccuracy of the quantitative information. Improvements in thebasic pulse sequence have been reported,79−81 which eliminatethe phase-twist line shape problem in both dimensions andprovide absorption-mode phase-sensitive spectra, thus improv-ing the quality of the projection data while improving both the
qualitative and especially the quantitative information byretaining their natural absorption integrated intensities. Theadvantage of this particular 2D-qHNMR experiment is thateach proton in the f2 dimension of the summed projection ofthe mixture will appear as a singlet. Even though resonanceoverlap in the projection may still be a problem in some cases,spectral deconvolution techniques may be more robust whenapplied rigorously to extract quantitative information. A recentreview by Ludwig and Viant on the 2D J-resolved experiment82
summarizes the quantitative potential of this experiment tometabolomic analysis. In continuation of the long-standingwork on hop constituents by Verpoorte et al., the 2D J-resolvedexperiment has also been used for metabolomic quantitationand differentiation of beer.83
The Homonuclear 2D-COSY Experiment. The homo-nuclear 2D-COSY experiment and several of its variations (e.g.,TOCSY or 2D-1H-INADEQUATE),84 all of which aredesigned to provide qualitative identification of 1H,1H spin-coupling networks, have been explored for quantitative 2D-NMR analysis. In heavily overlapped and crowded spectra, theoff-diagonal cross-peaks associated with the variety of spin-coupled networks that might be present can provide a way ofquantifying the components of very complex mixtures. Sincethe integrated intensities of the cross-peaks may showvariations due to differences in the magnitude of J-couplingsbetween the protons giving rise to the cross-peak, the use ofcalibrations is recommended if accurate quantitative results areto be obtained. Improvements in the pulse sequences directedtoward improving quantitative accuracy and speed have beenreported. For example, ultrafast 2D-TOCSY and 2D J-resolveddata have been reported.85 Both experiments have been shownto result in excellent linearity and reproducibility of thequantitative information. A detailed 1D study describing theqHNMR analysis of the ginkgolides A, B, C, and J (11−14,respectively), mixtures of ginkgolides, and crude Ginkgo bilobaextracts has now been completed.86
The Heteronuclear HSQC Experiment. The standardcontemporary qualitative proton-detected 1H,13C-correlationexperiment is the 2D gradient HSQC (2D-HSQC) experimentand its variations. This produces a correlation map of protonchemical shifts vs the chemical shifts of directly bonded carbonsvia 1JC,H. The correlation information is spread out into boththe carbon dimension (f1) and the proton dimension (f2). Forquantitative purposes, in essence, the f2 dimension, which maybe crowded and highly overlapped in a complex mixture, isbeing separated and resolved by the increased chemical shiftdispersion of f1. Cross-peak overlap is in many cases reducedsignificantly or eliminated, and clean integration of the 1H,13Ccross-peaks is possible. Quantitation of this experiment can betricky, and independent calibrations may be necessary. This isin part due to (a) the variation/distribution of 1JC,H; (b) theefficiency of polarization transfer from protons to carbons andback during the pulse sequence; (c) the nature of the carbonmultiplicity (C, CH, CH2, CH3); and (d) differences inobserved relaxation times (T1 and T2). All of these parameterscontribute to the observed 1H,13C cross-peak intensity.Studies concerned with the optimization of quantitative
conditions for HSQC have appeared,87,88 including thedevelopment of the Q-HSQC pulse sequence modification toascertain good quantitative cross-peak areas.87,89 A comparison,for quantitative purposes, of similar kinds of protons (andcarbons) should afford useful quantitation results, but the use ofcalibrations for the quantitation may still be necessary.
Journal of Natural Products Review
dx.doi.org/10.1021/np200993k | J. Nat. Prod. 2012, 75, 834−851840
The 2D-Q-HSQC pulse sequence has been employed fornumerous quantitative applications. For example, 2D-HSQChas been applied to the quantitation of urinary metabolites.90,91
Both qualitative and quantitative discrimination of oleanolicacid (15) and ursolic acid (16) in plant extracts has beenachieved with the use of 2D-HSQC in combination with 2D-HMBC.92 The quantitative HSQC results were, in this instance,in excellent agreement with the results of HPLC analysis. Rapidlipid profiling of mycobacteria including Mycobacterium tuber-culosis has been reported using quantitative 2D-HSQC.93 Arecent study by Markley and co-workers94 demonstrated thatdata from a series of HSQC spectra acquired with incrementedrepetition times can be extrapolated back to zero time to yield atime-zero HSQC spectrum (termed HSQC0). In these spectra,cross-peak intensities are proportional to relative concen-trations of the analytes and can afford absolute quantitation bythe use of internal calibrants. The same group has also reportedan application of the HSQC0 technique to the quantitation ofthiocoraline (17), present at low levels of 1% (w/w) in anextract from a Verrucosispora sp. isolated from the spongeChondrilla caribensis f. caribensis.95
Quantitative 1H,15N-HSQC has been applied for the analysisof a labeled protein from Xenopus laevis egg extracts.96
Quantitative 1H,13C-HSQC has also been used for determiningthe concentration of metabolites in biological fluids.97
Quantitative 2D-HSQC has been applied to the analysis ofpolysaccharide polymers.98 The latter study outlines a protocol
for (i) specifically analyzing this kind of polymer system, (ii)determining the appropriate 2D-HSQC experiment to employ,and (iii) selecting an appropriate internal calibrant tocircumvent the T2 problem that is associated with polymers.
The DOSY Experiment. The DOSY, or diffusion-orderedspectroscopy, experiment is a 2D experiment in which theindividual proton 1D-NMR spectra of each of the componentsof a complex mixture are separated according to the relativediffusion constant for each component dissolved in the NMRsolvent (see ref 78, Chapter 9). This represents a “virtualseparation” of the components of the mixture without engagingin a physical separation scheme for the purification of each ofthe components. Information pertaining to the qualitativeidentification of each component as well as the quantitativecompositional information may be obtained. Studies involvingthe combined use of 1D-qNMR with 2D-1H-DOSY have beenreported. For example, qualitative identification and quantita-tion of fluoxetine (18) and fluvoxamine (19) in pharmaceuticalformulations have been reported using 1D-qFNMR and2D-1H-DOSY.99 The 2D-DOSY experiment permitted thequalitative characterization of the active ingredients as well asexcipients in the formulation. A study involving the applicationof 1D-qHNMR and 2D-DOSY in the analysis of extracts ofLigusticum porteri has also been reported.100
Chart 1
Journal of Natural Products Review
dx.doi.org/10.1021/np200993k | J. Nat. Prod. 2012, 75, 834−851841
■ APPLICATIONS OF QHNMR
The following section provides an overview of new qHNMRapplications reported since mid-2004 with particular relevanceto NPs. According to these studies, NMR is becoming a capablequantitative tool for metabolic profiling and for the monitoringof metabolic changes from natural sources, especially in thefood industry, the analysis of plant constituents, and clinicaldiagnostics.Primary Metabolic Studies of Plants by qHNMR.
Pereira et al. utilized qHNMR in order to establish themetabolic fingerprints of grapes growing on different soil typesin Bordeaux, France. NMR analysis of sugars and amino acidsin grape skin extracts was more efficient in discriminatinggrapes from different locations than classical biochemicalanalyses based on sugar, acidity, and nitrogen measurements.101
A similar study on Vermentino grapes was carried out by Mulaset al., who investigated the variability in metabolite concen-tration as a function of the clone and the position of grapes onthe bunch or growing area within the vineyard.102 Thefermentation process of Rioja red wine was monitored withqHNMR by Lopez-Rituerto et al.103 Avenoza et al. usedqHNMR to analyze the transformation of the must in winegrapes, specifically the malic and lactic acid levels during thealcoholic and malolactic fermentation process.104 Schievano etal.105,106 determined the content of histamine (20) in differenttypes of cheeses by qHNMR of acid extracts and were also ableto discriminate Asiago D’Allevo cheese samples on the basis oftheir content of unsaturated fatty acids. As part of the qualitycontrol of cod liver oil, qHNMR was employed to determinethe content of unsaturated fats, which differ in their triglyceridecontent and composition.107
A global approach to the characterization of changes inmetabolic profiles in independent tissues from the same fruitswas developed by Mounet et al. for tomato flesh and seedsduring fruit development.108 Quantitation of compounds inboth tissues at different time points post-anthesis was obtainedthrough qHNMR, along with liquid chromatography with
diode-array detection or gas chromatography with flameionization detection. The data were analyzed chemometrically,and the compositional changes related to physiologicalprocesses occurring in each tissue. Deborde et al. appliedqHNMR for the quality assessment of greenhouse-growntomato fruits through quantitation of 32 major metabolites.109
This study demonstrated that qHNMR can complementcolorimetric analysis and provide a diagnostic tool to assessthe changes in organoleptic and nutritional quality of tomatoes.The changing content of sugars and organic acids on 11
strawberry traits was monitored by Lerceteau-Kohler et al. forup to three years, and qHNMR was found to be a powerful toolto assist efforts to improve fruit quality. The progeny showed alarge range variation for most of the traits, with strong positivecorrelations between the content of fructose and glucose as wellas citrate and the sum of organic acids.110 Del Campo et al.applied qHNMR to the assessment of malic and lactic acid inapple, apricot, kiwi fruit, orange, pear, pineapple, andstrawberry juices. The results obtained when applying NMRprocedures were compared to those obtained using enzymaticmethods, and both were in close agreement.111 Formic acidcontent in apple juices of five different cider varieties wasassessed using qHNMR by Berregi et al.112
Using qHNMR, Wagner et al. determined the ethanolcontent in several brands of gin and vodka and found significantdifferences between the analytical results and declared alcoholcontent.113 Shripsema has reported the comprehensiveqHNMR-based analysis of polar constituents such as thepreservatives benzoic acid and sorbic acid (21), the organicacids citric acid, butyric acid, and formic acid, and thecarbohydrate lactose as well as nonpolar constituents of butterand margarine, such as linoleic acid (22) and rumenic acid(23), as well as diglycerides.114
A new approach to metabolomic qHNMR of biofluidstermed “targeted profiling” established by Weljie et al. utilizesmathematically modeled spectra of pure primary metabolitesand principal component analysis pattern recognition.115
Validation against the commonly used approach of spectral
Chart 2
Journal of Natural Products Review
dx.doi.org/10.1021/np200993k | J. Nat. Prod. 2012, 75, 834−851842
binning determined the method to be stable, scalable,applicable to physiologically relevant low levels (>9 μM) ofthe metabolites, and tolerant to solvent suppression schemesincluding the commonly used WET-CPMG and NOESYpresaturation experiments. In a similar approach, Moin et al.used pure reference materials to quantitate 14−17 metabolitesin 25 min or less acquisition time, down to low-microgramlevels of the compounds.116
Secondary Metabolic Studies of Plants by qHNMR.The metabolic profiling of the glutamine concentration ofginseng hairy root cell lines with qHNMR by Jung et al.117
revealed that the inhibition of root growth and lateral rootformation depends on glutamine accumulation. Lubbe et al.applied qHNMR for the quantitation of galanthamine (24), abenzazepine alkaloid used in Alzheimer’s therapy, in the bulbsof some Amaryllidaceaeous plants.118 Differences in the overallmetabolic profiles of bulbs in the two most importantcultivation regions were assessed. Very recently, the use ofqHNMR spectroscopy for the characterization of Steviarebaudiana extracts was presented by Pieri, Stuppner, andassociates.119 The method allows quantitation of the majorsteviol glycosides (25) in purified extracts and fractionsobtained at various stages of the purification process. Moreover,qHNMR proved to be a powerful method to differentiatebetween Stevia glycosides occurring naturally in the plant oforigin and artifacts formed in the course of the manufacturingprocess.119 Using qHNMR, Tardieu et al. identified andquantified taste compounds in raw onions (Allium cepa) andcompared mono- and disaccharide release in aqueous solutionby raw or fried cubes of onion bulbs.120,121 Craigie et al. foundthat qHNMR analysis calibrated with a certified referencematerial such as 1 is an excellent tool to profile commercialseaweed extracts from Ascophyllum nodosum and other brownseaweeds.122 In their study, the authors also identified seasonalvariations in order to standardize the commercially availableproduct.Employing qHNMR as a key component of a functional
genomics platform, Papaver somniferum was investigated for theinterplay between primary and secondary metabolism withrespect to alkaloid biosynthesis in cultured poppy cells treatedwith a fungal elicitor.123,124
Ex Vivo Metabolic Studies by qHNMR. MetabolicqHNMR has been applied successfully as a diagnostic tool toanalyze metabolomic data in clinical settings. The increase inresolution and sensitivity of NMR instruments has opened upnew opportunities for the use of NMR spectroscopy in thequantitative analysis of the most important biological fluids,including urine, blood plasma, cerebrospinal fluid, saliva, andbile.125 Kline et al. monitored citrate concentrations in humanseminal and expressed prostatic fluid from prostatic cancer vsnon-cancer-bearing samples. The mean citrate concentration ofthe cancer patients proved to be reduced by 2.7-fold.126 Serumcitrate content, along with lysine, glycine, suberate, and acetateconcentrations, was also assessed by qHNMR in a metabolicprofiling effort on serum of high-fed C57BL/6J mice in order tobetter comprehend the biochemical signature of insulinresistance.127
A study carried out by Mochel et al. applied qHNMRanalysis on human plasma and developed a method todistinguish Huntington’s disease patients at different stages ofthe condition and presymptomatic carriers from controls. Adistinction was attributable to low levels of the branched chainamino acids valine, leucine, and isoleucine.128 Another study
used qHNMR to quantify and identify metabolites present incultured 3T6 mouse fibroblast cells in their native state andafter treatment with an inhibitor of the fibroblast growth factorreceptor tyrosine kinase.129 A recent investigation that utilizedqHNMR as the analytical tool showed that blood and red bloodcells mediated the transport of hepatotoxic plant pyrrolizidinealkaloids and their reactive metabolites in humans.130
Clinical studies of high potential significance were carried outby Ala-Korpela and colleagues on modeled lipoproteinsubclasses to assess the eligibility and accuracy of NMR toanalyze human plasma in general.131,132 The subclass modelswere used to simulate biochemically representative sets ofspectra with known subclass concentrations. The spectroscopicanalyses revealed 10-fold differences in the quantitationaccuracy of different subclasses by 1H NMR and questionedthe usefulness of qHNMR in serum diagnosis. On the contrary,a study by Oostendorp et al. investigated the potential use ofqHNMR to simultaneously identify and quantify the unusuallipids present in the blood of patients with different inbornerrors of lipid metabolism.133 The authors not only found agood correlation between conventional methods and qHNMRanalyses for cholesterol and triglyceride concentrations butcould also correctly diagnose four inborn errors of lipidmetabolism. The study concluded that qHNMR can be appliedsuccessfully in clinical diagnoses.In reproductive medicine, qHNMR is suggested as an option
to quickly and noninvasively identify the best embryos inassisted reproduction cycles for transfer.134 This assessmenttakes into account a report by Bromer et al., who appliedqHNMR for the measurement of the glutamate levels in anembryo culture medium and related these data to thereproductive potential of embryos in women undergoing invitro fertilization.135 Gupta et al. proposed qHNMR-basedmetabolic screening of human seminal plasma as a rapid andnoninvasive approach for probing infertility, with sensitivity andspecificity similar to the more elaborate traditional methods.136
Aimed at monitoring the urinary metabolites of patients withinflammatory bowel disease, Crohn’s disease, and ulcerativecolitis, a qHNMR method was established to distinguishbetween these diseases based on the differences of gastro-intestinal flora, which in turn influences urinary metabolites.137
The major metabolite of the cholesterol-lowering sesame oillignan sesamin (26) was quantified by qHNMR in the urine ofsix volunteers after the intake of sesame oil.60
qHNMR for the Analysis of Drug Metabolism,Toxicology, and Forensic Samples. Recent applicationshave applied qHNMR frequently as an analytical tool in drugmetabolism and toxicology studies. Several reports havedescribed recent guidance on Safety of Drug Metabolitesissued by the U.S. Food and Drug Administration, Center forDrug Evaluation and Research (CDER). The regulatoryguidance stresses the importance in drug discovery anddevelopment of identifying, characterizing, and quantifyingdrug metabolites as early as possible and suggests qHNMRcombined with chromatography, mass spectrometry, andplasma pooling methods to obtain reliable quantitations ofmetabolites present in plasma of preclinical species from short-term safety studies.67,138,139 A study by Hays has reported onthe use of qHNMR for purity determination of drug standardsand the routine analysis of illicit drugs such as heroin (27),methamphetamine (28), 4-methylenedioxymethamphetamine(MDMA, 29), and cocaine (30) as well as adulterants.140 Lesaret al. have shown that qHNMR can meet the challenge of
Journal of Natural Products Review
dx.doi.org/10.1021/np200993k | J. Nat. Prod. 2012, 75, 834−851843
simultaneously identifying and quantitating γ-hydroxybutyricacid and γ-butyrolactone in spiked alcoholic beverages.141
Using a capillary internal calibration standard, qHNMR provedto be fast, nondestructive, and sensitive and required no samplepreparation that would disrupt the equilibrium between γ-hydroxybutyric and γ-butyrolactone.By utilizing a qHNMR method to quantify toxins such as
anatoxin-A (31), Dagnino et al. overcame the very limitedavailability of toxin reference materials for calibration, while stillbeing able to work in very dilute solutions.142 Aimed at thesimultaneous identification and quantitation of the psychedelicindole N,N-dimethyltryptamine in a Psychotria viridis prepara-tion, Moura et al. developed a qHNMR method with 2,5-dimethoxybenzaldehyde as internal calibrant that was fast (<30s), required minimal sample preparation, and exhibited anLLOQ of 12.5 μg/mL and a better than 5% precision, whichwas interpreted as a limitation of the solvent extraction protocolrather than that of the qHNMR method.143
qHNMR in the Quality Control of Complex SecondaryMetabolite Mixtures from Plants. Quality control ofpharmaceutical products is essential for consumer safety andefficacy. Quantitative 1H NMR fingerprints have beenfrequently employed in the analysis of botanical products,including dietary supplements. A review article of Yap et al.compares major analytical techniques including qHNMR in thequantitative analysis of ginseng preparations.144 A method todetect medicinal yeast and keratin content in pharmaceuticalpreparations on the basis of qHNMR was developed byJankevics et al.145 The quality of Aloe vera products wasassessed with qHNMR by quantitation of the acetylatedpolysaccharides, glucose, malic acid, lactic acid, and aceticacid present.46
A qHNMR method to quantify the biological activeprotoberberine alkaloids [e.g., jatrorrhizine (32)] of “Huang-bai”, the cortex of the dried bark of Phellodendron chinense or P.amurense, important traditional Chinese medicine products, aswell as for Rhizoma Coptidis (Coptis chinensis) was developedby Li et al., in order to ensure product quality andauthenticity.54,146
The composition of the spasmolytic essential oil of themedicinal plant Brickellia veronicaefolia was established by NMRspectroscopy together with GC-MS and HPLC studies, andqHNMR was used for quantitation of the major compounds.147
Components of the essential oil of Lindera neesiana fruits werequantified by Comai et al.148 using qHNMR, with 1 as aninternal calibration standard.Staneva et al. have used qHNMR for the quantitative analysis
of sesquiterpene lactones present in a crude lactone fraction ofArnica montana.149 Cannabis sativa water extracts and tinctureswere directly analyzed with a combination of diffusion-edited1H NMR (DOSY) and qHNMR spectroscopy in order toquantify Δ9-THC (33), its acid, and other metabolites.150
Nazari et al. quantified capsaicin (34) from a microwave-assisted acetone extract of Capsicum f rutescens.151 Theantimalarial compound artemisinin (35) was quantified inArtemisia annua acetone extracts by qHNMR.50 Using qHNMRapproaches, the artemisinin content was also determined inextracts of Artemisia annua from Argentina152 and eightdifferent Artemisia samples collected from around theworld.153 A study by Tatsis et al. used the strongly deshieldedhydroxy groups of hypericin (36) and pseudohypericin (37) inthe region of 14−15 ppm to identify and quantify bothcompounds in Hypericum perforatum extracts by qHNMR, prior
to HPLC separation.154 The photosynthetic chlorophyll andcarotenoid pigments of Phaseolus vulgaris have also beenevaluated quantitatively by qHNMR.155 Ritter et al. usedqHNMR to quantify the stachydrine (38) content in Leonoruscardiaca refined and crude extracts.156 Hasada et al. successfullyapplied qHNMR to the quantitative detection of atractylon(39) in extracts of rhizomes of Atractylodes ovata, A. japonica, A.lancea, and A. chinensis without prior purification.66 Finally,Parys et al. proved that qHNMR along with the use of Folin-Ciocalteu’s phenol reagent is among the most reliable andprecise methods for the quantitation of polyphenols accumu-lated in marine brown algae, such as Ascophyllum nodosum andFucus vesiculosus.157
Two recent reports have explored impurities and degradationof phytochemicals and plant fractions from botanical productsby qHNMR (see also the Dynamic Residual Complexity(Dynamic RC) section). Thus, time-resolved studies of thedynamic changes of desmethylxanthohumol (40)158 and Z-ligustilide (41)159 were conducted and gave rise to biologicallyactive degradation products. These two reports, as well as thestudies mentioned below, demonstrate the potential ofqHNMR as a validation tool for the characterization ofbioactive NPs.3 A review on forced degradation studies forpharmaceutical drug candidates and the identification andquantitation of degradation products with qHNMR waspublished by Alsante et al.160 A report by Mohn et al. describedthe purity evaluation of glucosinolates (e.g., 9) isolated fromIsatis tinctoria with qHNMR.68 A publication on Angelicasinensis used a combination of 1D- and 2D-NMR methods todetermine the absolute amounts of 41 and six of its derivatives,in addition to establishing relative quantitative relationshipswithin a series of phenylpropanoids, falcarindiol (42)polyacetylene derivatives, and unsaturated fatty acids presentin a bioactive fraction of hydroalcoholic Angelica preparation.161
Another publication described a new concept of qHNMRanalysis aimed at the determination of multiple components inherbal extracts. This approach combines the use ofcomprehensive 1H NMR profiles (fingerprints) of markercompounds generated by 1H iterative full spin analysis (usingthe PERCH software tool) with 1D-QHNMR quantitationusing extracts of Ginkgo biloba leaves as a model.86
qHNMR of Complex Natural Mixtures from Marineand Microorganisms. To date, relatively few applications ofqHNMR for NPs from marine and microorganisms have beenreported. Carballo et al. have cultured explants from the spongeMycale cecilia to produce pyrrole-2-carbaldehyde derivatives.These growth inhibitors of the LNCaP human prostate cancercell line are known to be minor metabolites of the wild forms ofthe marine sponge. The pyrrole-2-carbaldehyde derivativecontent of the cultured sponge was detected by qHNMR,and it was demonstrated that marine aquaculture of M. cecilia isa viable method for supplying the amount of metabolite neededfor advanced bioactivity studies.Xu et al. described the quantitative analysis by qHNMR of
the Haemophilus inf luenza type b polysaccharide, an inter-mediate of the H. inf luenza (Hib) vaccine PedvaxHIB.162 Theaforementioned report on macrolide antibiotics (see theCalibration Methods in qHNMR section) exemplifies howthe purities of five common reference materials of macrolideantibiotics could be measured by qHNMR.63 The relativelyhigh molecular weight and resulting complexity of the 1H NMRspectrum do not preclude qHNMR analysis at 500 MHz, which
Journal of Natural Products Review
dx.doi.org/10.1021/np200993k | J. Nat. Prod. 2012, 75, 834−851844
demonstrated the applicability of qHNMR concepts for theanalysis of NPs with complex spectra.
■ QHNMR FOR THE ASSESSMENT OF RESIDUALCOMPLEXITY AND PURITY
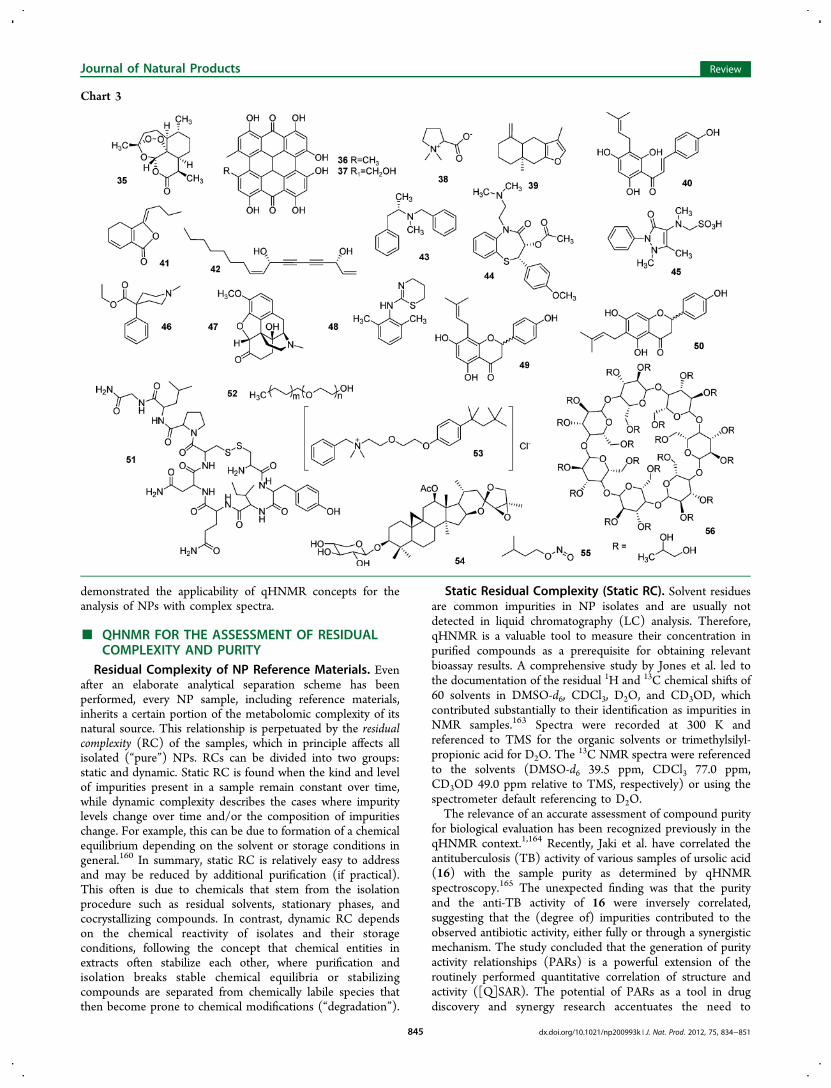
Residual Complexity of NP Reference Materials. Evenafter an elaborate analytical separation scheme has beenperformed, every NP sample, including reference materials,inherits a certain portion of the metabolomic complexity of itsnatural source. This relationship is perpetuated by the residualcomplexity (RC) of the samples, which in principle affects allisolated (“pure”) NPs. RCs can be divided into two groups:static and dynamic. Static RC is found when the kind and levelof impurities present in a sample remain constant over time,while dynamic complexity describes the cases where impuritylevels change over time and/or the composition of impuritieschange. For example, this can be due to formation of a chemicalequilibrium depending on the solvent or storage conditions ingeneral.160 In summary, static RC is relatively easy to addressand may be reduced by additional purification (if practical).This often is due to chemicals that stem from the isolationprocedure such as residual solvents, stationary phases, andcocrystallizing compounds. In contrast, dynamic RC dependson the chemical reactivity of isolates and their storageconditions, following the concept that chemical entities inextracts often stabilize each other, where purification andisolation breaks stable chemical equilibria or stabilizingcompounds are separated from chemically labile species thatthen become prone to chemical modifications (“degradation”).
Static Residual Complexity (Static RC). Solvent residuesare common impurities in NP isolates and are usually notdetected in liquid chromatography (LC) analysis. Therefore,qHNMR is a valuable tool to measure their concentration inpurified compounds as a prerequisite for obtaining relevantbioassay results. A comprehensive study by Jones et al. led tothe documentation of the residual 1H and 13C chemical shifts of60 solvents in DMSO-d6, CDCl3, D2O, and CD3OD, whichcontributed substantially to their identification as impurities inNMR samples.163 Spectra were recorded at 300 K andreferenced to TMS for the organic solvents or trimethylsilyl-propionic acid for D2O. The
13C NMR spectra were referencedto the solvents (DMSO-d6 39.5 ppm, CDCl3 77.0 ppm,CD3OD 49.0 ppm relative to TMS, respectively) or using thespectrometer default referencing to D2O.The relevance of an accurate assessment of compound purity
for biological evaluation has been recognized previously in theqHNMR context.1,164 Recently, Jaki et al. have correlated theantituberculosis (TB) activity of various samples of ursolic acid(16) with the sample purity as determined by qHNMRspectroscopy.165 The unexpected finding was that the purityand the anti-TB activity of 16 were inversely correlated,suggesting that the (degree of) impurities contributed to theobserved antibiotic activity, either fully or through a synergisticmechanism. The study concluded that the generation of purityactivity relationships (PARs) is a powerful extension of theroutinely performed quantitative correlation of structure andactivity ([Q]SAR). The potential of PARs as a tool in drugdiscovery and synergy research accentuates the need to
Chart 3
Journal of Natural Products Review
dx.doi.org/10.1021/np200993k | J. Nat. Prod. 2012, 75, 834−851845
routinely combine biological testing with purity assessment inorder to correlate biological activity of NP isolates with theirinherent RCs.165
Another example for residual complexity of natural product-derived samples was published by Hays,140 who quantifiedheroin and its common residual opium alkaloids as well astypical adulterants of 196 samples of illicit materials. The studypointed out that the water-soluble hydrochloride (HCl) formsof all morphine/codeine-type compounds as well as benzphet-amine (43), diltiazem (44), dipyrone (45), meperidine (46),oxycodone (47), and xylazine (48) form two different ion pairswith maleic acid, which was used as internal calibrant. For someanalytes, this led to minor signals next to major resonances. Incontrast, the qHNMR spectra of free bases of these alkaloidsshowed only one species and, thus, are not affected by thisvariant of RC that can affect the analysis. These observationsserve as a good example that the extent of RC depends on theNMR solvent.A comprehensive publication by Xu et al. has established an
approach for the quantification and identification of small-molecule analytes in complex biological samples with over-lapped signals.166 Their work touches upon the topic ofmacromolecular components present in biological samples,such as proteins in serum or urine, which further increase theRC of the target analyte and can impact negatively the accuracyof the concentration measurements of small molecules. Theapproach utilizes a quantification method based on linear least-squares fitting using singular value decomposition (SVD) and adatabase of reference spectra to identify analytes on the basis offitted coefficients or concentration values, and at the same timeit quantifies them by linear deconvolution. The results obtainedindicate that the SVD calculation is efficient, accurate, andreproducible over a wide concentration range; however, peakalignment is important for the success of SVD deconvolution.An increase in line broadening value may help accommodateslight peak misalignment. This method provides a direct andpractical approach that might be applicable routinely tocomplement various existing chemometrics approaches. Withregard to RC stemming from the presence of macromolecules,the publication demonstrated that the approach is applicable tothe quantitation and identification of small-molecule analytes incomplex biological samples utilizing a mixture of smallmolecule analytes in the presence of macromolecules (e.g.,proteins).166 Another example of the challenges resulting frompeak overlap in qNMR applications is the analysis of glycerideoils, which was the subject of a heteronuclear NMR study byHatzakis et al.167
Dynamic Residual Complexity (Dynamic RC). A studyby Chen et al. has shown the beneficial use of qHNMR for theexploration of the dynamic chemical equilibrium of the potentphytoestrogen 8-prenylnaringenin (49), found in hops.158 Thestudy was initiated because of unexplained variability ofestrogenic bioactivity in samples of desmethylxanthohumol(40), the chemical precursor of 49, and the biologically muchless active regioisomer 6-prenylnaringenin (50). The ratios ofthe two isomers (49, 50) were measured quantitatively byNMR spectroscopy, and it was shown that they are formed as afunction of time through a Michael addition isomerizationreaction from 40. The study also exemplifies that despite itshigh purity (98.5% by qHNMR), the 40 study material can bepredicted to exhibit estrogenicity both in vitro and in vivo as aresult of dynamic residual complexity. This underscores the
importance of an awareness of potential dynamic complexity inpure NPs, especially those with reactive sites.158
As a continuation of a previous study involving qHNMRspectroscopy in process engineering of multicomponentmixtures,168 Maiwald et al. reported on the use of this methodto study reaction equilibria and kinetics in technical mixtures offormaldehyde, water, trioxane, and sulfuric acid, usingpressurized sample tubes and an online technique. Theirstudies showed that reliable quantitative results may beachieved with both procedures, even under difficult exper-imental conditions such as high temperature and high sulfuricacid concentrations. As most internal calibrant decompose inhot sulfuric acid, a new procedure was applied for thequantitation of the small trioxane signals, in which electroni-cally generated NMR signals were used as highly stable virtualreferences (VRs). The VR method was shown to be a valuabletool that can be used to circumvent problems with classicalinternal or external calibration standards.169
Especially in complex samples, observing dynamic changes ofRC requires a combination of a multicomponent detectionprocedure such as NMR with a statistical evaluation method, inorder to make multiple but small changes visible andmeasurable.170 A method developed by Ohno et al. combines1H NMR and principal component analysis to obtain thequality evaluation of biopharmaceuticals, with regard to theirquality, consistency, and differences in protein modificationpatterns.171 The feasibility of the method was assessed bycollecting three 1H NMR spectra of oxytocin (51) at days 0, 7,and 14. Although the three spectra of 51 seemed similar bysimple visual inspection, time-dependent differences among thethree spectra were clearly distinguished by a PCA score plot.Peak changes indicating both the decomposition of 51 and theemergence of new decomposition products within the 14-daytime frame were also observed by a PCA loading plot. Theresults demonstrate that PCA in combination with 1H NMR isa powerful tool for the evaluation of dynamic RC, especiallywhen differences between spectra cannot be determinedvisually.171
Purity Assessment and Reference Materials. Applica-tions of qHNMR for the establishment of commercial andcompendial reference materials have started to emerge.Recently, Tan et al. presented a qHNMR method to assessthe average polymer length for polyoxyl ether (52) referencematerials.172 The superior metrological quality of qHNMR as arelative primary analytical method (see refs 1, 24, 173, 174 andcitations therein) has altered the QC of reference materials inpharmaceutical good manufacturing practices (GMP).175,176
This is also in line with the recent development of qNMR-validated phytochemical standards for botanical analysis (www.qreference.com). A quantitative NMR method for thedetermination of benzethonium chloride (53) in grapefruitseed extracts was validated by Bekiroglu et al.43 Their methodvalidation addresses specificity, linearity, range, and precision,as well as accuracy, limit of quantitation, and robustness of theqHNMR assay. The structurally complex group of >150 knownActaea cycloartane triterpenes such as the major binoxoside ofActaea racemosa (syn. Cimicifuga racemosa, black cohosh),(12R)-12-acetoxy-(24R,25R)-24,25-epoxy-3-O-β-D-xylopyrano-sylacta-(16S,23R-16,23;23,26)-binoxoside (54, syn. 23-epi-26-deoxyactein),177 has been associated with numerous biologicalactivities of this popular botanical dietary supplement. In a veryrecent study, Qiu et al. used NMR spectroscopy for thesimultaneous structural dereplication and quantitative analysis
Journal of Natural Products Review
dx.doi.org/10.1021/np200993k | J. Nat. Prod. 2012, 75, 834−851846
of purified Actaea triterpenes and their development intoreference materials.177 The approach utilizes the predictivecomputational model of classification binary trees for the insilico determination of the aglycone and qHNMR for thequantitation of 10−20 μg amounts of triterpenes in residuallycomplex samples, using 700 MHz 1.7 mm cryo-microprobeinstrumentation.Reference materials for drug metabolism studies represent
another area of qHNMR applications. As metabolite standardsare very precious samples, the ability of qHNMR to validatesuch materials is invaluable for the quantitative studies, as hasbeen demonstrated by Walker et al.,34 who also implementedartificial signals for the concentration measurements (see alsoabove). Reduced cost, efficiency, and suitability for theassessment of early GMP materials of active pharmaceuticalingredients (APIs) for toxicological studies have made qNMR asingle-point replacement for early pharmaceutical developmentwork. Webster et al. also noted178 that, although traditionalvalidation requirements applied in regulated industries to liquidchromatography methods challenge qNMR method validation,qNMR is fully equivalent to LC for early phase potencydeterminations of APIs, metabolites, and related substances.Another example of the beneficial application of qNMR is in
the quality control of Angelica sinensis extracts and fractions. Itsmain bioactive constituent is Z-ligustilide (41), whichrepresents an example for dynamic RC and, thus, a challengeas far as the provision of reference materials is concerned. In anearlier publication, qNMR in combination with GC-MS wasemployed successfully to describe the degradation of 41qualitatively and quantitatively,159 including the influence ofthe solvent on the degradation time course. As 41 appears to bestabilized while being part of a (crude) A. sinensis extract, arecent qNMR study explored methods to measure its amountin the bioactive fraction directly, without the need for theidentical calibrant.161 A combination of absolute (externalcalibration) and relative (modified 100% method) qNMR ledto the establishment of quality control parameters with respectto the content of 41 as well as the content of nine minorconstituents present in commercial hydroalcoholic extracts.The United States Pharmacopeia (USP34/NF29)179 lists
NMR and quantitative 1H NMR as analytical methods for theassessment of pharmaceutical and dietary supplement stand-ards. Two quantitative methodologies are distinguished: (i) theabsolute quantitation method, which relies on the use of“internal standards” (equivalent to calibration standards usedherein), and (ii) the relative quantitation method, whichcompares integral ratios of signal groups within one molecule.The two monographs on amyl nitrite (55) exemplify absolutequantitation methods and use benzyl benzoate as calibrant.Several monographs use the relative quantitation method todetermine the content of hydroxypropyl groups in themolecules of hydroxypropyl starches (pea, corn, and potato),to determine the average polymer length of polyoxyl ethers (52,polyoxyl 10 oleyl ether, polyoxyl 20 cetostearyl ether), or todetermine the molar substitution of hydroxypropyl betadex(56), based on integral ratios of protons of the substituents vsprotons of the molecular backbone. Finally, the monograph onheparin sodium employs qHNMR as identity test and alsoincludes a semiquantitative purity assay. The United StatesPharmacopeia is considering an extension of the use of qNMRto future monographs for dietary supplements (Giancaspro, G.I.; Sharaf, M. H. M., private communication), in particular formaterials where qNMR protocols have shown advantages such
as those containing polysaccharides (e.g., heparin, chitosan, β-glucans, Aloe vera [see above]).
■ CONCLUDING REMARKS
From the perspective of NPs research, qHNMR has gainedsubstantial popularity as an analytical tool. This is reflected bythe predominance of new literature on qHNMR applications.The increasingly abundant use of qNMR as an alternative toLC-based quantitation is also reflected by the citation statisticsof the qNMR literature since 2000: the eight most citedpublications (SciFinder, >50 citations) relevant to the reviewtopic1,2,14,15,24,87,116 received 607 citations, and five of theseeight including the top three most cited publications (>100citations) have appeared only since the last review in 2005.1
One major driving force is the gain in sensitivity of cryoprobeNMR technology, including the most recent development ofmicrocryoprobes (1.7 mm i.d. and smaller). Their improvedmass sensitivity allow for practically feasible qHNMR experi-ments with limits of detection and quantitation (LODs andLOQs, resp.) from the nanogram to low microgram range and,thus, enable low-level quantitation by qHNMR. While signaldispersion and sample complexity are, and likely will remain,limiting factors for qHNMR analysis, some of the workaddressed in this review shows clearly the much enhancedcapabilities of 1D-qHNMR for the quantitation of minormetabolites, even in complex mixtures. At the same time,considering the inherent limitation of the engineering ofsuperconducting NMR magnets, dramatic improvements ofsignal dispersion are unlikely to occur in the near future. Whilethis review focused on qNMR in the 1H domain, it should bepointed out that interesting non-1H qNMR methods withrelevance to NPs have been published (S4, SupportingInformation).From the perspective of experimental methodology for NP
analysis, the authors consider qNMR to still be in a relativelyearly stage of development. Whereas in qualitative/structuralNMR the intrinsic limitation of 1H signal dispersion isovercome by 2D/nD, selective pulse, and/or heteronuclearexperiments, corresponding qHNMR methods are onlybeginning to emerge. The design of many 2D experimentsalso provides challenges as far as the establishment ofquantitative conditions is concerned. Thus, while theirexperimental parameters are well understood and documentedfor 1D-qHNMR,1,24 2D approaches require additional andmore elaborate steps to establish quantitative correlationsbetween the signals (integral, volume, intensity) and themolarity of the analytes.From the viewpoint of the NPs researcher, one striking
advantage of qHNMR is the ability of this method to functionaccurately with external calibration, e.g., against a primarystandard, only requiring nonidentical calibrants. In addition, theuse of 1H NMR fingerprints obtained through iterative full spinanalysis in combination with multisignal quantitation86 providesa means of optimizing specificity, primarily in 1D-qHNMR.Another remarkable quality of qNMR is that externalcalibration is straightforward following the principle ofreciprocity,28,31 even in multiuser settings. Moreover, evennoncalibrated 1H NMR spectra, which can be run routinelyunder quantitative conditions, can yield meaningful resultsusing the 100% method2 or the modified 100% method161 ofevaluation. While the lack of knowledge of molecular weights ofcertain (unknown) components of the sample introduces
Journal of Natural Products Review
dx.doi.org/10.1021/np200993k | J. Nat. Prod. 2012, 75, 834−851847
potential errors, the advantages of 1H NMR spectroscopy as auniversal detector often outweigh this limitation.The insights from numerous qHNMR reports involving
method validation, including metrological studies, indicate thatqHNMR is generally a highly precise and accurate method,which is to be expected from any predominantly primaryanalytical method. Interesting unresolved questions in thiscontext are the (potential) errors of the non-qNMR methodsused to validate qHNMR studies. They include, but are notlimited to, considerations on extraction procedures for crudeNPs (accuracy, reproducibility), volumetric operations duringNMR sample preparation (precision and accuracy in the μLrange), weighing of NPs (noncrystalline materials, precision,calibration in the sub-mg range), and operations of the NMRpostacquisition work-flow (operator influence, hardwarestability, repeatability). An ongoing multilaboratory studyinvolving the authors of this review is seeking to addresssome of these parameters. However, independently from theseconsiderations of potential sources of error, one value ofqHNMR can be seen in its ability to quantitate multipleanalytes simultaneously, with the same calibration. This offers aunique potential for NPs analysis for two reasons: samples inthis field are often (residually) complex, and there is growingevidence that bioactivity results from the (inter)action ofmultiple chemical entities, which in some cases may even act insynergy. To this end, qHNMR is available as an unbiasedanalytical tool, which, at the time of writing of this review, isbacked up by a wealth of experimental evidence and usefulmethodology.
■ ASSOCIATED CONTENT*S Supporting InformationAdditional details pertaining to the statistical analysis, potentialqNMR reference materials, 2D-qHNMR pulse sequences, andinformation about non-1H qNMR applications with particularrelevance to NP research are available free of charge via theInternet at http://pubs.acs.org.
NotesThe authors declare no competing financial interest.
■ ACKNOWLEDGMENTSThe authors kindly acknowledge the following individuals forhelpful discussions, encouraging feedback, and collegial supportof our qNMR-related activities: Drs. K. Colson and J. Hicks,and Ms. S. Luchsinger, Bruker Biospin (Billerica, MA, USA);Drs. C. Peng and C. Cobas of Mestrelab Research SL, Santiagode Compostela (Spain); Mr. M. Niemitz and Dr. S.-P.Korhonen of PERCH Solutions Ltd. (Kuopio, Finland); Dr.R. Laatikainen, Department of Chemistry, University of Kuopio(Kuopio, Finland); Mr. I. Burton and Drs. T. Karakach and J.Walter, IMB, NRC (Halifax, Canada); and Dr. M. Ritzau,Novartis (Basel, Switzerland). Furthermore, we are grateful tothe following members of our group for helpful discussions onvarious aspects of qNMR spectroscopy and help withmanuscript preparation: Drs. S.-N. Chen, J. McAlpine, J.Napolitano, and M. Florencia Rodriguez Brasco. The authorsalso thank an anonymous reviewer for helpful comments and
suggestions regarding qHNMR calibration and validation. Theauthors acknowledge support by grant RC2 AT005899 fromthe National Center for Complementary and AlternativeMedicine (NCCAM), as well as by grant P50 AT000155from the Office of Dietary Supplements and NCCAM, both ofthe National Institutes of Health (NIH). During thepreparation of this work, T.G. was partially supported by afellowship from the United States Pharmacopeial Convention,Inc.
■ REFERENCES(1) Pauli, G. F.; Jaki, B. U.; Lankin, D. C. J. Nat. Prod. 2005, 68, 133−149.(2) Pauli, G. F. Phytochem. Anal. 2001, 12, 28−42.(3) Pauli, G. F.; Jaki, B. U.; Lankin, D. C.; Walter, J. A.; Burton, I. W.In Bioactive Natural Products: Detection, Isolation and StructuralDetermination, 2nd ed.; Colegate, S. M.; Molyneux, R. J., Eds.; Taylor& Francis/CRC Press: New York, 2008; pp 113−142.(4) O’Neill, I. K.; Pringuer, M. A.; Prosser, H. J. J. Pharm. Pharmacol.1975, 27, 222−225.(5) Anhoury, M. L.; Crooy, P.; De Neys, R.; Laridant, A. J. Pharm. Sci.1976, 65, 590−592.(6) Bowen, M. H.; O’Neill, I. K.; Pringuer, M. A. Proc. Soc. Anal.Chem. 1974, 11, 294−297.(7) Hollis, D. P. Anal. Chem. 1963, 35, 1682−1684.(8) Rackham, D. M. Talanta 1970, 17, 895−906.(9) Rackham, D. M. Talanta 1976, 23, 269−274.(10) Hiltunen, R.; Rautio, M.; Rahkamaa, R. Planta Med. 1982, 45,162.(11) Holzgrabe, U. Prog. Nucl. Magn. Reson. Spectrosc. 2010, 57, 229−240.(12) Holzgrabe, U.; Deubner, R.; Schollmayer, C.; Waibel, B. J.Pharm. Biomed. Anal. 2005, 38, 806−812.(13) Jiang, Y.; David, B.; Tu, P.; Barbin, Y. Anal. Chim. Acta 2010,657, 9−18.(14) Krishnan, P.; Kruger, N. J.; Ratcliffe, R. G. J. Exp. Bot. 2005, 56,255−265.(15) Wishart, D. S. Trends Anal. Chem. 2008, 27, 228−237.(16) Malz, F. In NMR Spectroscopy in Pharmaceutical Analysis;Holzgrabe, U.; Wawer, I.; Diehl, B., Eds.; Elsevier Ltd.: Oxford, UK,2008; pp 43−62.(17) Duus, J.; Gotfredsen, C. H.; Bock, K. Chem. Rev. 2000, 100,4589−4614.(18) Kim, H. K.; Choi, Y. H.; Verpoorte, R. Nat. Protoc. 2010, 5,536−549.(19) Pauli, G. F.; Jaki, B. U.; Lankin, D. C. J. Nat. Prod. 2007, 70,589−595.(20) Rastrelli, F.; Schievano, E.; Bagno, A.; Mammi, S. Magn. Reson.Chem. 2009, 47, 868−872.(21) Rundlof, T.; Mathiasson, M.; Bekiroglu, S.; Hakkarainen, B.;Bowden, T.; Arvidsson, T. J. Pharm. Biomed. Anal. 2010, 52, 645−651.(22) Diehl, B.; Malz, F.; Holzgrabe, U. Spectrosc. Eur. 2007, 19, 15−19.(23) Saito, T.; Ihara, T.; Koike, M.; Kinugasa, S.; Fujimine, Y.; Nose,K.; Hirai, T. Accredit. Qual. Assur. 2009, 14, 79−86.(24) Malz, F.; Jancke, H. J. Pharm. Biomed. Anal. 2005, 38, 813−823.(25) Mo, H.; Harwood, J. S.; Raftery, D. Magn. Reson. Chem. 2010,48, 235−238.(26) Pinciroli, V.; Biancardi, R.; Colombo, N.; Colombo, M.; Rizzo,V. J. Comb. Chem. 2001, 3, 434−440.(27) Wells, R. J.; Cheung, J.; Hook, J. M. In NMR Spectroscopy inPharmaceutical Analysis; Holzgrabe, U.; Wawer, I.; Diehl, B., Eds.;Elsevier: Amsterdam/Boston, 2008; pp 291−315.(28) Burton, I. W.; Quilliam, M. A.; Walter, J. A. Anal. Chem. 2005,77, 3123−3131.(29) Letot, E.; Koch, G.; Falchetto, R.; Bovermann, G.; Oberer, L.;Roth, H. J. J. Comb. Chem. 2005, 7, 364−371.
Journal of Natural Products Review
dx.doi.org/10.1021/np200993k | J. Nat. Prod. 2012, 75, 834−851848
(30) Pierens, G. K.; Carroll, A. R.; Davis, R. A.; Palframan, M. E.;Quinn, R. J. J. Nat. Prod. 2008, 71, 810−813.(31) Hoult, D. I. J. Magn. Reson. 2011, 213, 344−346.(32) Wider, G.; Dreier, L. J. Am. Chem. Soc. 2006, 128, 2571−2576.(33) Farrant, R. D.; Hollerton, J. C.; Lynn, S. M.; Provera, S.;Sidebottom, P. J.; Upton, R. J. Magn. Reson. Chem. 2010, 48, 753−762.(34) Walker, G. S.; Ryder, T. F.; Sharma, R.; Smith, E. B.; Freund, A.Drug Metab. Dispos. 2011, 39, 433−440.(35) Hilton, B. D.; Martin, G. E. J. Nat. Prod. 2010, 73, 1456−1469.(36) Martin, G. E.; Hilton, B. D.; Blinov, K. A. J. Nat. Prod. 2011, 74,2400−2407.(37) Weljie, A. M.; Newton, J.; Jirik, F. R.; Vogel, H. J. Anal. Chem.2008, 80, 8956−8965.(38) Claridge, T. D.; Davies, S. G.; Polywka, M. E.; Roberts, P. M.;Russell, A. J.; Savory, E. D.; Smith, A. D. Org. Lett. 2008, 10, 5433−5436.(39) Dalisay, D. S.; Molinski, T. F. J. Nat. Prod. 2009, 72, 739−744.(40) Hays, P. A.; Thompson, R. A. Magn. Reson. Chem. 2009, 47,819−824.(41) Soininen, P.; Haarala, J.; Vepsaelaeinen, J.; Niemitz, M.;Laatikainen, R. Anal. Chim. Acta 2005, 542, 178−185.(42) Gilard, V.; Balavssac, S.; Malet-Martino, M.; Martino, R. Curr.Pharm. Anal. 2010, 6, 234−245.(43) Bekiroglu, S.; Myrberg, O.; Oestman, K.; Ek, M.; Arvidsson, T.;Rundloef, T.; Hakkarainen, B. J. Pharm. Biomed. Anal. 2008, 47, 958−961.(44) del Campo, G.; Berregi, I.; Caracena, R.; Zuriarrain, J. Talanta2010, 81, 367−371.(45) Jiang, N.; Pu, Y.; Ragauskas, A. J. ChemSusChem 2010, 3, 1285−1289.(46) Jiao, P.; Jia, Q.; Randel, G.; Diehl, B.; Weaver, S.; Milligan, G. J.AOAC Int. 2010, 93, 842−848.(47) Yoo, J.-S.; Ahn, E.-M.; Song, M.-C.; Bang, M.-H.; Kim, D.-H.;Han, M.-W.; Kwak, H.-Y.; Lee, D.-Y.; Lyu, H.-N.; Baek, N.-I. Food Sci.Technol. Int. 2008, 17, 573−577.(48) Uestuen, B.; Sanders, K. B.; Dani, P.; Kellenbach, E. R. Anal.Bioanal. Chem. 2011, 399, 629−634.(49) Weberskirch, L.; Luna, A.; Skoglund, S.; This, H. Anal. Bioanal.Chem. 2011, 399, 483−487.(50) Castilho, P. C.; Gouveia, S. C.; Rodrigues, A. I. Phytochem. Anal.2008, 19, 329−334.(51) Donarski, J. A.; Roberts, D. P. T; Charlton, A. J. Anal. Meth.2010, 2, 1479−1483.(52) Hatzakis, E.; Dagounakis, G.; Agiomyrgianaki, A.; Dais, P. FoodChem. 2010, 122, 346−352.(53) Li, C.-Y.; Lin, C.-H.; Wu, T.-S. Chem. Pharm. Bull. 2005, 53,347−349.(54) Li, C.-Y.; Lu, H.-J.; Lin, C.-H.; Wu, T.-S. J. Pharm. Biomed. Anal.2006, 40, 173−178.(55) Li, C.-Y.; Tsai, S.-I.; Damu, A. G.; Wu, T.-S. J. Pharm. Biomed.Anal. 2009, 49, 1272−1276.(56) Li, C.-Y.; Xu, H.-X.; Han, Q.-B.; Wu, T.-S. J. Chromatogr., A2009, 1216, 2124−2129.(57) Salem, A. A.; Mossa, H. A.; Barsoum, B. N. Spectrochim. Acta,Part A 2005, 62, 466−472.(58) Sedman, J.; Gao, L.; Garcia-Gonzalez, D.; Ehsan, S.; van deVoort, F. R. Eur. J. Lipid Sci. Technol. 2010, 112, 439−451.(59) Larsen, F. H.; van den Berg, F.; Engelsen, S. B. J. Chemom. 2007,20, 198−208.(60) Moazzami, A. A.; Andersson, R. E.; Kamal-Eldin, A. J. Nutr.2007, 137, 940−944.(61) Sharma, R.; Gupta, P. K.; Mazumder, A.; Dubey, D. K.;Ganesan, K.; Vijayaraghavan, R. J. Pharm. Biomed. Anal. 2009, 49,1092−1096.(62) Watanabe, R.; Suzuki, T.; Oshima, Y. Toxicon 2010, 56, 589−595(63) Liu, S.-Y.; Hu, C.-Q. Anal. Chim. Acta 2007, 602, 114−121.
(64) Sugimoto, N.; Koike, R.; Furusho, N.; Tanno, M.; Yomota, C.;Sato, K.; Yamazaki, T.; Tanamoto, K. Food Addit. Contam. 2007, 24,799−806.(65) Chatterjee, S.; Srivastava, S.; Khalid, A.; Singh, N.; Sangwan, R.S.; Sidhu, O. P.; Roy, R.; Khetrapal, C. L.; Tuli, R. Phytochemistry2010, 71, 1085−1094.(66) Hasada, K.; Yoshida, T.; Yamazaki, T.; Sugimoto, N.;Nishimura, T.; Nagatsu, A.; Mizukami, H. J. Nat. Med. 2010, 64,161−166.(67) Vishwanathan, K.; Babalola, K.; Wang, J.; Espina, R.; Yu, L.;Adedoyin, A.; Talaat, R.; Mutlib, A.; Scatina, J. Chem. Res. Toxicol.2009, 22, 311−322.(68) Mohn, T.; Cutting, B.; Ernst, B.; Hamburger, M. J. Chromatogr.A 2007, 1166, 142−151.(69) Shao, G.; Kautz, R.; Peng, S.; Cui, G.; Giese, R. W. J.Chromatogr. A 2007, 1138, 305−308.(70) Michaleas, S.; Antoniadou-Vyza, E. J. Pharm. Biomed. Anal.2006, 42, 405−410.(71) Blagbrough, I. S.; Elmasry, M. S.; Woodman, T. J.; Saleh, H. M.;Kheir, A. A. Tetrahedron 2009, 65, 4930−4936.(72) Hoffman, R. E. J. Magn. Reson. 2003, 163, 325−331.(73) Lewis, I. A.; Schommer, S. C.; Markley, J. L. Magn. Reson. Chem.2009, 47, S123−S126.(74) Makela, A. V.; Heikkila, O.; Kilpelainen, I.; Heikkinen, S. J.Magn. Reson. 2011, 211, 186−194.(75) Forshed, J.; Schuppe-Koistinen, I.; Jacobsson, S. P. Anal. Chim.Acta 2003, 487, 189−199.(76) Forshed, J.; Erlandsson, B.; Jacobsson, S. P. Anal. Chim. Acta2005, 552, 160−165.(77) Koskela, H. Annu. Rep. NMR Spectrosc. 2009, 66, 1−31.(78) Claridge, T. D. W. High-Resolution NMR Techniques in OrganicChemistry, 2nd ed.; Elsevier: Amsterdam/Boston, 2009.(79) Mutzenhardt, P.; Guenneau, F.; Canet, D. J. Magn. Reson. 1999,141, 312−321.(80) Woodley, M.; Freeman, R. J. Magn. Reson., Ser. A 1994, 109,103−112.(81) Pell, A. J.; Keeler, J. J. Magn. Reson. 2007, 189, 293−299.(82) Ludwig, C.; Viant, M. R. Phytochem. Anal. 2010, 21, 22−32.(83) Khatib, A.; Wilson, E. G.; Kim, H. K.; Lefeber, A. W. M.;Erkelens, C.; Choi, Y. H.; Verpoorte, R. Anal. Chim. Acta 2006, 559,264−270.(84) Martineau, E.; Giraudeau, P.; Tea, I.; Akoka, S. J. Pharm. Biomed.Anal. 2011, 54, 252−257.(85) Giraudeau, P.; Massou, S.; Robin, Y.; Cahoreau, E.; Portais, J.-C.; Akoka, S. Anal. Chem. 2011, 83, 3112−3119.(86) Napolitano, J. G.; Godecke, T.; Rodriguez Brasco, M. F.; Jaki, B.U.; Chen, S.-N.; Lankin, D. C.; Pauli, G. F. J. Nat. Prod. 2012, 75,238−248.(87) Heikkinen, S.; Toikka, M. M.; Karhunen, P. T.; Kilpelaeinen, I.A. J. Am. Chem. Soc. 2003, 125, 4362−4367.(88) Koskela, H.; Heikkila, O.; Kilpelainen, I.; Heikkinen, S. J. Magn.Reson. 2010, 202, 24−33.(89) Peterson, D. J.; Loening, N. M. Magn. Reson. Chem. 2007, 45,937−941.(90) Gronwald, W.; Klein, M. S.; Kaspar, H.; Fagerer, S. R.;Nurnberger, N.; Dettmer, K.; Bertsch, T.; Oefner, P. J. Anal. Chem.2008, 80, 9288−9297.(91) Rai, R. K.; Tripathi, P.; Sinha, N. Anal. Chem. 2009, 81, 10232−10238.(92) Kontogianni, V. G.; Exarchou, V.; Troganis, A.; Gerothanassis, I.P. Anal. Chim. Acta 2009, 635, 188−195.(93) Mahrous, E. A.; Lee, R. B.; Lee, R. E. J. Lipid Res. 2008, 49,455−463.(94) Hu, K.; Westler, W. M.; Markley, J. L. J. Am. Chem. Soc. 2011,133, 1662−1665.(95) Hu, K.; Wyche, T. P.; Bugni, T. S.; Markley, J. L. J. Nat. Prod.2011, 74, 2295−2298.(96) Selenko, P.; Serber, Z.; Gadea, B.; Ruderman, J.; Wagner, G.Proc. Natl. Acad. Sci. U. S. A. 2006, 103, 11904−11909.
Journal of Natural Products Review
dx.doi.org/10.1021/np200993k | J. Nat. Prod. 2012, 75, 834−851849
(97) Lewis, I. A.; Schommer, S. C.; Hodis, B.; Robb, K. A.; Tonelli,M.; Westler, W. M.; Sussman, M. R.; Markley, J. L. Anal. Chem. 2007,79, 9385−9390.(98) Zhang, L.; Gellerstedt, G. Magn. Reson. Chem. 2007, 45, 37−45.(99) Trefi, S.; Gilard, V.; Balayssac, S.; Malet-Martino, M.; Martino,R. J. Pharm. Biomed. Anal. 2008, 46, 707−722.(100) Leon, A.; Chavez, M. I.; Delgado, G. Magn. Reson. Chem. 2011,49, 469−476.(101) Pereira, G. E.; Hilbert, G.; Gaudillere, J. P.; Soyer, J. P.; Van, L.,C.; Moing, A.; Deborde, C.; Maucourt, M.; Rolin, D.; Laviale, O. ActaHort. 2005, 689, 257−263.(102) Mulas, G.; Galaffu, M. G.; Pretti, L.; Nieddu, G.; Mercenaro,L.; Tonelli, R.; Anedda, R. J. Agric. Food Chem. 2011, 59, 793−802.(103) Lopez-Rituerto, E.; Cabredo, S.; Lopez, M.; Avenoza, A.;Busto, J. H.; Peregrina, J. M. J. Agric. Food Chem. 2009, 57, 2112−2118.(104) Avenoza, A.; Busto, J. H.; Canal, N.; Peregrina, J. M. J. Agric.Food Chem. 2006, 54, 4715−4720.(105) Schievano, E.; Pasini, G.; Cozzi, G.; Mammi, S. J. Agric. FoodChem. 2008, 56, 7208−7214.(106) Schievano, E.; Guardini, K.; Mammi, S. J. Agric. Food Chem.2009, 57, 2647−2652.(107) Guillen, M. D.; Carton, I.; Goicoechea, E.; Uriarte, P. S. J.Agric. Food Chem. 2008, 56, 9072−9079.(108) Mounet, F.; Lemaire-Chamley, M.; Maucourt, M.; Cabasson,C.; Giraudel, J.-L.; Deborde, C.; Lessire, R.; Gallusci, P.; Bertrand, A.;Gaudillere, M.; Rothan, C.; Rolin, D.; Moing, A. Metabolomics 2007, 3,273−288.(109) Deborde, C.; Maucourt, M.; Baldet, P.; Bernillon, S.; Biais, B.;Talon, G.; Ferrand, C.; Jacob, D.; Ferry-Dumazet, H.; Daruvar, A.;Rolin, D.; Moing, A. Metabolomics 2009, 5, 183−198.(110) Lerceteau-Kohler, E.; Moing, A.; Guerin, G.; Renaud, C.;Maucourt, M.; Rolin, D.; Roudeillac, P.; Denoyes-Rothan, B. ActaHort. 2006, 708, 573−577.(111) del Campo, G.; Berregi, I.; Caracena, R.; Santos, J. I. Anal.Chim. Acta 2006, 556, 462−468.(112) Berregi, I.; del Campo, G.; Caracena, R.; Miranda, J. I. Talanta2007, 72, 1049−1053.(113) Wagner, J.; Mencer, D. E.; Green, K. L.; Macri, L.; Beaver, B.;Wydra, F.; Butler, A. Abstract presented at the 235th AmericanChemical Society National Meeting, New Orleans, LA, April 6−10,2008, CHED-288.(114) Schripsema, J. J. Agric. Food Chem. 2008, 56, 2547−2552.(115) Weljie, A. M.; Newton, J.; Mercier, P.; Carlson, E.; Slupsky, C.M. Anal. Chem. 2006, 78, 4430−4442.(116) Moing, A.; Maucourt, M.; Renaud, C.; Gaudillere, M.;Brouquisse, R.; Lebouteiller, B.; Gousset-Dupont, A.; Vidal, J.;Granot, D.; Denoyes-Rothan, B.; Lerceteau-Kohler, E.; Rolin, D.Funct. Plant Biol. 2004, 31, 889−902.(117) Jung, S.-M.; Kim, S. W.; Ban, S. H.; In, D. S.; Jung, J. D.;Chung, H. J.; Liu, J. R.; Lim, Y. P.; Choi, D.-W. Plant Sci. 2006, 170,801−807.(118) Lubbe, A.; Pomahacova, B.; Choi, Y. H.; Verpoorte, R.Phytochem. Anal. 2010, 21, 66−72.(119) Pieri, V.; Belancic, A.; Morales, S.; Stuppner, H. J. Agric. FoodChem. 2011, 59, 4378−4384.(120) Tardieu, A.; De Man, W.; This, H. Anal. Bioanal. Chem. 2010,398, 3139−3153.(121) Tardieu, A.; Guerez, A.; Phana, S.; De Man, W.; This, H. J.Food Sci. 2009, 74, C319−C325.(122) Craigie, J. S.; MacKinnon, S. L.; Walter, J. A. J. Appl. Phycol.2008, 20, 665−671.(123) Zulak, K. G.; Weljie, A. M.; Vogel, H. J.; Facchini, P. J. BMCPlant Biol. 2008, 8, 5.(124) Hagel, J. M.; Weljie, A. M.; Vogel, H. J.; Facchini, P. J. PlantPhysiol. 2008, 147, 1805−1821.(125) Kolokolova, T. N.; Savel’ev, O. Y.; Sergeev, N. M. J. Anal.Chem. 2008, 63, 104−120.
(126) Kline, E. E.; Treat, E. G.; Averna, T. A.; Davis, M. S.; Smith, A.Y.; Sillerud, L. O. J. Urology 2006, 176, 2274−2279.(127) Shearer, J.; Duggan, G.; Weljie, A.; Hittel, D. S.; Wasserman,D. H.; Vogel, H. J. Diabet. Obes. Metabol. 2008, 10, 950−958.(128) Mochel, F.; Charles, P.; Seguin, F.; Barritault, J.; Coussieu, C.;Perin, L.; Le, B.; Yves; Gervais, C.; Carcelain, G.; Vassault, A.;Feingold, J.; Rabier, D.; Durr, A. PLoS One 2007, 2, e647.(129) Piccioni, F.; Borioni, A.; Delfini, M.; Del Giudice, M. R.;Mustazza, C.; Rodomonte, A.; Risuleo, G. Anal. Biochem. 2007, 367,111−121.(130) Yang, Y.-C.; Crowder, J.; Wardle, N. J.; Yang, L.; White, K. N.;Wang, Z.-T.; Bligh, A. S. W. Food Chem. Toxicol. 2011, 49, 2793−2799.(131) Ala-Korpela, M. Exp. Rev. Mol. Diagnost. 2007, 7, 761−773.(132) Ala-Korpela, M.; Lankinen, N.; Salminen, A.; Suna, T.;Soininen, P.; Laatikainen, R.; Ingman, P.; Jauhiainen, M.; Taskinen,M.-R.; Heberger, K.; Kaski, K. Atherosclerosis 2007, 190, 352−358.(133) Oostendorp, M.; Engelke, U. F. H.; Willemsen, M. A. A. P.;Wevers, R. A. Clin. Chem. 2006, 52, 1395−1405.(134) Botros, L.; Sakkas, D.; Seli, E. Mol. Hum. Reprod. 2008, 14,679−690.(135) Bromer, J. G.; Sakkas, D.; Seli, E. Exp. Rev. Obstet. Gynecol.2008, 3, 441−447.(136) Gupta, A.; Mahdi, A. A.; Ahmad, M. K.; Shukla, K. K.; Jaiswer,S. P.; Shankhwar, S. N. J. Pharm. Biomed. Anal. 2011, 54, 106−113.(137) Williams, H. R. T.; Cox, I. J.; Walker, D. G.; North, B. V.; Patel,V. M.; Marshall, S. E.; Jewell, D. P.; Ghosh, S.; Thomas, H. J. W.;Teare, J. P.; Jakobovits, S.; Zeki, S.; Welsh, K. I.; Taylor-Robinson, S.D.; Orchard, T. R. Am. J. Gastroenterol. 2009, 104, 1435−1444.(138) Espina, R.; Yu, L.; Wang, J.; Tong, Z.; Vashishtha, S.; Talaat,R.; Scatina, J.; Mutlib, A. Chem. Res. Toxicol. 2009, 22, 299−310.(139) Mutlib, A.; Vishwanathan, K.; Babalola, K.; Wang, J.; Espina,R.; Yu, L.; Adedoyin, A.; Talaat, R.; Scatina, J. Abstract presented atthe 238th American Chemical Soceiety National Meeting, Wash-ington, DC, August 16−20, 2009, TOXI-041.(140) Hays, P. A. J. Forens. Sci. 2005, 50, 1342−1360.(141) Lesar, C. T.; Decatur, J.; Lukasiewicz, E.; Champeil, E. For. Sci.Int. 2011, 212, e40−e45.(142) Dagnino, D.; Schripsema, J. Toxicon 2005, 46, 236−240.(143) Moura, S.; Carvalho, F. G.; de Oliveira, C. D. R.; Pinto, E.;Yonamine, M. Phytochem. Lett. 2010, 3, 79−83.(144) Yap, K. Y.-L.; Chan, S.-Y.; Weng, C. Y.; Sing, L. C. Assay DrugDev. Technol. 2005, 3, 683−699.(145) Jankevics, A.; Liepinsh, E. Rigas Teh. Univ. Zinat. Raksti, Ser. 12006, 13, 42−48.(146) Li, C. Y.; Tsai, S. I.; Damu, A. G.; Wu, T. S. J. Pharm. Biomed.Anal. 2009, 49, 1272−1276.(147) Rivero-Cruz, B.; Rivero-Cruz, I.; Rodriguez-Sotres, J.; Cerda-Garcia-Rojas, C. M.; Mata, R. J. Nat. Prod. 2006, 69, 1172−1176.(148) Comai, S.; Dall’Acqua, S.; Grillo, A.; Castagliuolo, I.; Gurung,K.; Innocenti, G. Fitoterapia 2009, 81, 11−16.(149) Staneva, J.; Denkova, P.; Todorova, M.; Evstatieva, L. J. Pharm.Biomed. Anal. 2011, 54, 94−99.(150) Politi, M.; Peschel, W.; Wilson, N.; Zloh, M.; Prieto, J. M.;Heinrich, M. Phytochemistry 2007, 69, 562−570.(151) Nazari, F.; Ebrahimi, S. N.; Talebi, M.; Rassouli, A.;Bijanzadeh, H. R. Phytochem. Anal. 2007, 18, 333−340.(152) Rimada, R. S.; Gatti, W. O.; Jeandupeux, R.; Cafferata, L. F. R.Bol. Latinoam. Caribe. Plant. Med. Aromat. 2009, 8, 275−281.(153) Liu, N. Q.; Choi, Y. H.; Verpoorte, R.; van der Kooy, F.Phytochem. Anal. 2010, 21, 451−456.(154) Tatsis, E. C.; Exarchou, V.; Troganis, A. N.; Gerothanassis, I. P.Anal. Chim. Acta 2008, 607, 219−226.(155) Valverde, J.; This, H. J. Agric. Food Chem. 2008, 56, 314−320.(156) Ritter, M.; Melichar, K.; Strahler, S.; Kuchta, K.; Schulte, J.;Sartiani, L.; Cerbai, E.; Mugelli, A.; Mohr, F.-W.; Rauwald, H. W.;Dhein, S. Planta Med. 2010, 76, 572−582.(157) Parys, S.; Rosenbaum, A.; Kehraus, S.; Reher, G.; Glombitza,K.-W.; Konig, G. M. J. Nat. Prod. 2007, 70, 1865−1870.
Journal of Natural Products Review
dx.doi.org/10.1021/np200993k | J. Nat. Prod. 2012, 75, 834−851850
(158) Chen, S.-N.; Lankin, D.; Chadwick, L. R.; Jaki, B. U.; Pauli, G.F. Planta Med. 2009, 75, 757−762.(159) Schinkovitz, A.; Pro, S. M.; Main, M.; Chen, S. N.; Jaki, B. U.;Lankin, D. C.; Pauli, G. F. J. Nat. Prod. 2008, 71, 1604−1611.(160) Alsante, K. M.; Baertschi, S. W.; Coutant, M.; Marquez, B. L.;Sharp, T. R.; Zelesky, T. C. Sep. Sci. Technol. 2011, 10, 59−169.(161) Godecke, T.; Yao, P.; Napolitano, J. G.; Nikolic, D.; Dietz, B.M.; Bolton, J. L.; van Breemen, R. B.; Farnsworth, N. R.; Chen, S.-N.;Lankin, D. C.; Pauli, G. F. Fitoterapia 2012, 83, 18−32.(162) Xu, Q.; Klees, J.; Teyral, J.; Capen, R.; Huang, M.; Sturgess, A.W.; Hennessey, J. P., Jr.; Washabaugh, M.; Sitrin, R.;Abeygunawardana, C. Anal. Biochem. 2005, 337, 235−245.(163) Jones, I. C.; Sharman, G. J.; Pidgeon, J. Magn. Reson. Chem.2005, 43, 497−509.(164) Malz, F.; Jancke, H. Anal. Bioanal. Chem. 2006, 385, 760−765.(165) Jaki, B. U.; Franzblau, S. G.; Chadwick, L.; Lankin, D. C.;Wang, Y.; Zhang, F.; Pauli, G. F. J. Nat. Prod. 2008, 71, 1742−1748.(166) Xu, Q.; Sachs, J. R.; Wang, T. C.; Schaefer, W. H. Anal. Chem.2006, 78, 7175−7185.(167) Hatzakis, E.; Agiomyrgianaki, A.; Kostidis, S.; Dais, P. J. Am.Oil Chem. Soc. 2011, 88, 1695−1708.(168) Maiwald, M.; Fischer, H. H.; Kim, Y.-K.; Hasse, H. Anal.Bioanal. Chem. 2003, 375, 1111−1115.(169) Maiwald, M.; Gruetzner, T.; Stroefer, E.; Hasse, H. Anal.Bioanal. Chem. 2006, 385, 910−917.(170) Neily, M. H.; Matsukura, C.; Maucourt, M.; Bernillon, S.;Deborde, C.; Moing, A.; Yin, Y.-G.; Saito, T.; Mori, K.; Asamizu, E.;Rolin, D.; Moriguchi, T.; Ezura, H. J. Plant Physiol. 2011, 168, 242−252.(171) Ohno, A.; Kawasaki, N.; Fukuhara, K.; Okuda, H.; Yamaguchi,T. Chem. Pharm. Bull. 2009, 57, 1396−1399.(172) Tan, S. X.; Kassymbek, Z. K.; White, P. A.; Wahab, S. Z.Abstract presented at the 231st American Chemical Society NationalMeeting, Atlanta, GA, March 26−30, 2006, ANYL-132.(173) Jancke, H.; Malz, F.; Haesselbarth, W. Accredit. Qual. Assur.2005, 10, 421−429.(174) Saito, T.; Ihara, T.; Sato, H.; Jancke, H.; Kinugasa, S. BunsekiKagaku 2003, 52, 1029−1036.(175) Veit, M.; Wissel, S. Pharm. Ind. 2007, 69, 1475−1480.(176) Veit, M.; Wissel, S. Pharm. Ind. 2008, 70, 135−138.(177) Qiu, F.; Imai, A.; McAlpine, J.; Lankin, D. C.; Burton, I. W.;Karakach, T. K.; Farnsworth, N. R.; Pauli, G. F. J. Nat. Prod. 2012, 75,432−443.(178) Webster, G. K.; Marsden, I.; Pommerening, C. A.; Tyrakowski,C. M. Appl. Spectrosc. 2010, 64, 537−542.(179) United States Pharmacopeial Convention Inc. The UnitedStates Pharmacopeia, The National Formulary, USP34/NF29; NationalPublishing for the United States Pharmacopeial Convention, Inc.:Philadelphia, PA, 2011.
Journal of Natural Products Review
dx.doi.org/10.1021/np200993k | J. Nat. Prod. 2012, 75, 834−851851