Qualitative Simulation of the Carbon Starvation Response in Escherichia coli Delphine Ropers INRIA Rhône-Alpes 655 avenue de l’Europe Montbonnot, 38334 Saint Ismier CEDEX, France Email: [email protected]Web: http://www-helix.inrialpes.fr/article593.html
Transcript
Qualitative Simulation of the Carbon Starvation Response in Escherichia coli
1. Introduction: nutritional stress response in E. coli
2. Qualitative modeling and simulation of genetic regulatory
networks
3. Modeling of carbon starvation response in E. coli
4. Experimental validation of model predictions
5. Work in progress
3
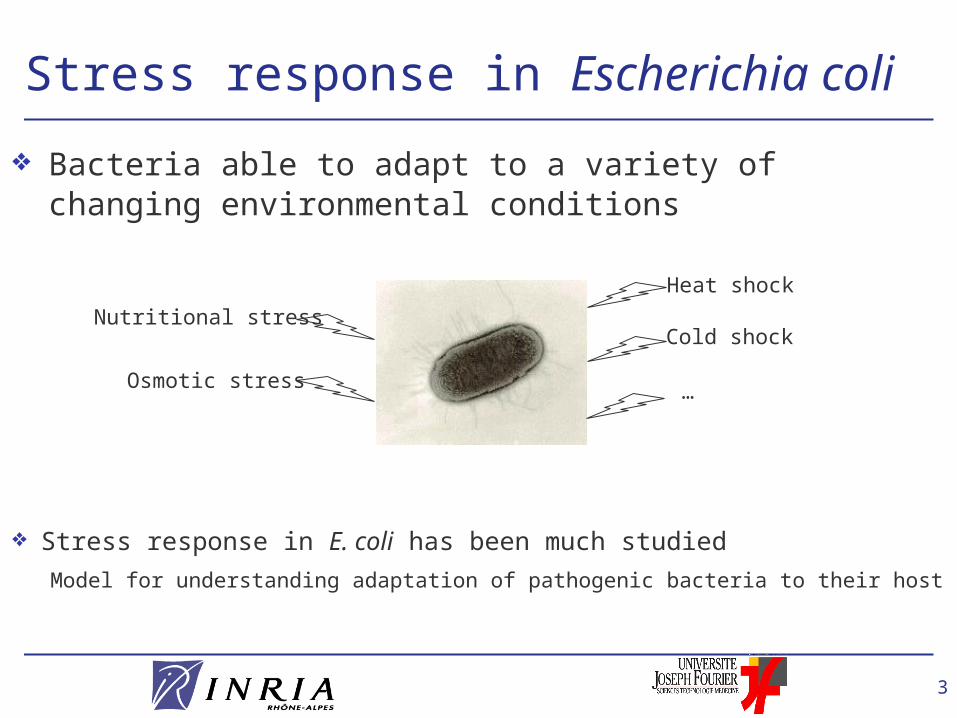
Stress response in Escherichia coli
Bacteria able to adapt to a variety of changing environmental conditions
Nutritional stress
Osmotic stress
Heat shock
Cold shock
…
Stress response in E. coli has been much studied
Model for understanding adaptation of pathogenic bacteria to their host
4
Nutritional stress response in E. coli
Response of E. coli to nutritional stress conditions: transition from exponential phase to stationary phase
Changes in morphology, metabolism, gene expression, …
log (pop. size)
time
> 4 h
5
Network controlling stress response Response of E. coli to nutritional stress conditions controlled by
large and complex genetic regulatory network
Cases et de Lorenzo (2005),
Nat. Microbiol. Rev., 3(2):105-118
No global view of functioning of network available, despite abundant knowledge on network components
6
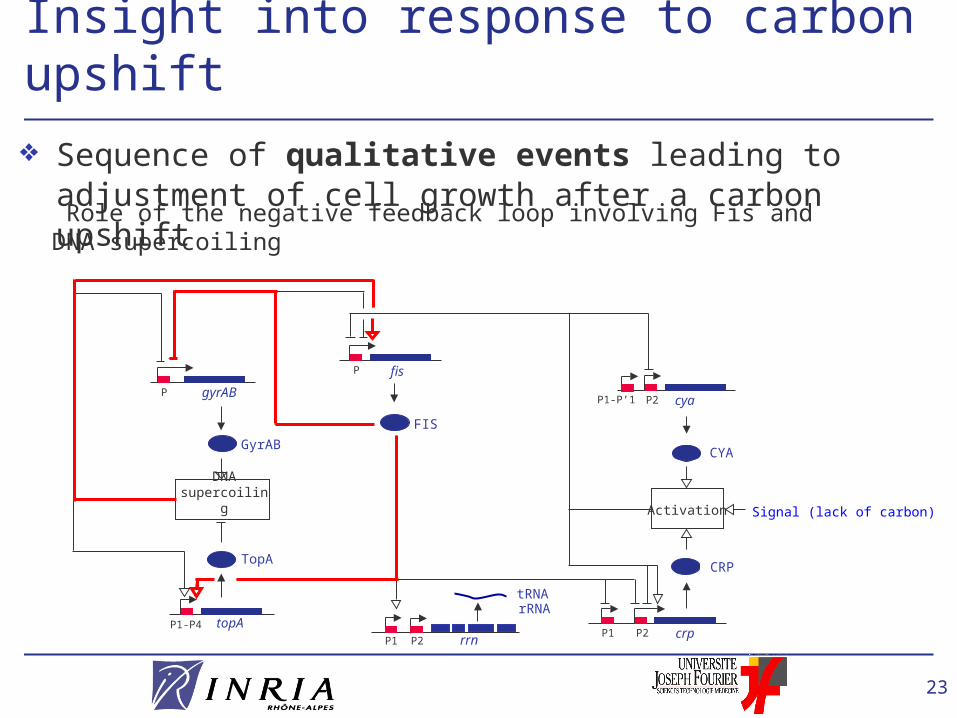
Analysis of carbon starvation response Objective: modeling and experimental studies directed at
understanding how network controls nutritional stress response
First step: analysis of the carbon starvation response in E. coli
rrnP1 P2
CRP
crp
cya
CYA
cAMP•CRP
FIS
TopA
topA
GyrAB
P1-P4P1 P2
P2P1-P’1
P
gyrABP
Signal (lack of carbon source)
DNA supercoiling
fis
tRNArRNA Ropers et al. (2006),
Biosystems, in press
protein
gene
promoter
7
Qualitative modeling and simulation
Current constraints on modeling and simulation: Knowledge on molecular mechanisms rare
Quantitative information on kinetic parameters and molecular
concentrations absent
Method for qualitative simulation of large and complex genetic regulatory networks using coarse-grained models
de Jong, Gouzé et al. (2004), Bull. Math. Biol., 66(2):301-340
Batt G. et al. (2005), Hybrid Systems: Computation and Control, LNCS 3414, 134-150.
Method used to simulate initiation of sporulation in Bacillus subtilis and quorum sensing of Pseudomonas aeruginosa
de Jong et al. (2004), Bull. Math. Biol., 66(2):261-300
Viretta and Fussenegger (2004), Biotechnol. Prog., 20(3):670-8
8
PL differential equation models
Genetic networks modeled by class of differential equations using step functions to describe regulatory interactions
xa a s-(xa , a2) s-(xb , b ) – a xa .
xb b s-(xa , a1) – b xb .
x : protein concentration
, : rate constants : threshold concentration
x
s-(x, θ)
0
1
Differential equation models of regulatory networks are piecewise-linear (PL)
Glass and Kauffman (1973), J. Theor. Biol., 39(1): 103-129
b
B
a
A
9
Analysis of the dynamics in phase space
Phase space partition: unique derivative sign pattern in domains
Qualitative abstraction yields state transition graph
Abstraction preserves unicity of derivative sign pattern
a10
maxb
a2
b
maxa
Qualitative analysis of network dynamics
xa a s-(xa , a2) s-(xb , b ) – a xa.
xb b s-(xa , a1) – b xb .xa a – a xa .
xb b – b xb .
.
.xa > 0xb < 0D5:
0 < a1 < a2 < a/a < maxa
0 < b < b/b < maxb
.
. ...
.xa > 0xb > 0
xa > 0xb < 0
xa = 0xb < 0D1: D5: D7:
a10
maxb
a2
b
maxaaa
bbbb
D12 D22 D23 D24
D17 D18
D21 D20
D1 D3 D5 D7 D9
D15
D27 D26 D25
D11 D13 D14
D2 D4 D6 D8
D10 D16
D19
D1 D3 D5 D7 D9
D15
D27D26D25
D11 D12 D13 D14
D2 D4 D6
D8
D10
D16D17
D18
D20
D19
D21
D22
D23
D24
10
Predictions well adapted to comparison with available experimental data: changes of derivative sign patterns
Model validation: comparison of derivative sign patterns in observed and predicted behavior
D1 D3 D5 D7 D9
D15
D27D26D25
D11 D12 D13 D14
D2 D4 D6
D8
D10
D16D17
D18
D20
D19
D21
D22
D23
D24
Validation of qualitative models
. .xa < 0xb > 0
xa > 0xb > 0
xa= 0xb= 0
.
. ..D1: D17: D18:
Concistency?
Yes0
xb
time
time0
xa
xa > 0.xb > 0.
xb > 0.xa < 0.
11
Genetic Network Analyzer (GNA)
de Jong et al. (2003) Bioinformatics
Batt et al. (2005), Bioinformatics
Page et al. (2006)
http://www-helix.inrialpes.fr/gna
Integration into environmentfor explorative genomics by Genostar Technologies SA
Qualitative simulation method implemented in Java: Genetic Network Analyzer (GNA)
12
Initiation of sporulation in Bacillus subtilis
Validation of method by analysis of well-understood network
Control of initiation of sporulation in Bacillus subtilis
?division cycle
sporulation-germination
cycle
metabolic and environmental signals
13
Model of sporulation network Piecewise-linear model of network controlling sporulation
11 differential equations, with 59 inequality constraints
kinA
-
+
HKinA
+ phospho- relay
Spo0A˜P
+
Spo0A
H A
A H
spo0A-
sinR sinI
SinISinR
SinR/SinI
-
sigF H
+
+
hpr (scoR)A
A AabrB
-
-
HprAbrB
spo0E A
sigH(spo0H)
A
-
-
-Spo0E
H
F
-
+
+Signal
-
-
de Jong, Geiselmann et al. (2004), Bull. Math. Biol., 66(2): 261-300
14
Model of carbon starvation network E. coli Carbon starvation network modeled by PL model
7 differential equations, with 36 inequality constraints
Superhelical density of DNA
rrnP1 P2
Activation
CRP
crp
cya
CYA
CRP•cAMP
FIS
TopA
topA
GyrAB
P1-P4P1 P2
P2P1-P’1
P
gyrABP
Signal (lack of carbon source)Supercoiling
fis
tRNArRNA
Ropers et al. (2006),BioSystems, in press
15
( xFIS )n + Kon
( xFIS )n
frrnP1( xFIS ) =
Hill rate law:
FIS
frrnP1 ( xFIS ) s+( xFIS , FIS )
Step-function approximation:
Modeling of rrn module
FIS
rrnP1 P2
stable RNAs
Regulatory mechanism of control by FIS at promoter rrn P1• FIS binds to multiple sites in promoter region• FIS forms a cooperative complex with RNA polymerase
.xrrn rrn1 s+( xFIS , FIS ) + rrn
2 – rrn xrrn
Schneider et al. (2003), Curr. Opin. Microbiol., 6:151-156
16
ATP + CYA*K1
CYA*•ATP CYA* + cAMP
cAMP + CRPK4
k2
CRP•cAMP
k3degradation/export
Modeling of CRP activation
CRP•cAMP Activation
CRP
CYA
Signal
crpP1 P2
CRP activation in presence of carbon starvation signal
Modeling of CRP activation using mass-action law
Quasi steady-state assumption simplifies model
k2 xCYA + k3 K4
k2 xCYA xCRP
xCRP•cAMP =
17
Regulatory mechanism of control by CRP•cAMP at crp P2 • CRP•cAMP binds to a single site• CRP•cAMP forms a cooperative complex with RNA polymerase
Modeling of crp activation by CRP·cAMP
Barnard et al. (2004), Curr. Opin. Microbiol., 7:102-108