19
Quality Assessment and Improvement Harvard – PEPFAR Tanzania, Nigeria and Botswana
| Date post: | 29-Dec-2015 |
| Category: |
Documents |
| Upload: | louisa-payne |
| View: | 220 times |
| Download: | 1 times |

Quality Assessment and Improvement
Harvard – PEPFAR
Tanzania, Nigeria and Botswana
Overview
• Quality improvement framework
• Quality management infrastructure
• QI methodology– Supportive supervision and capacity building– Operations research activities
• Lessons learnt and future plans
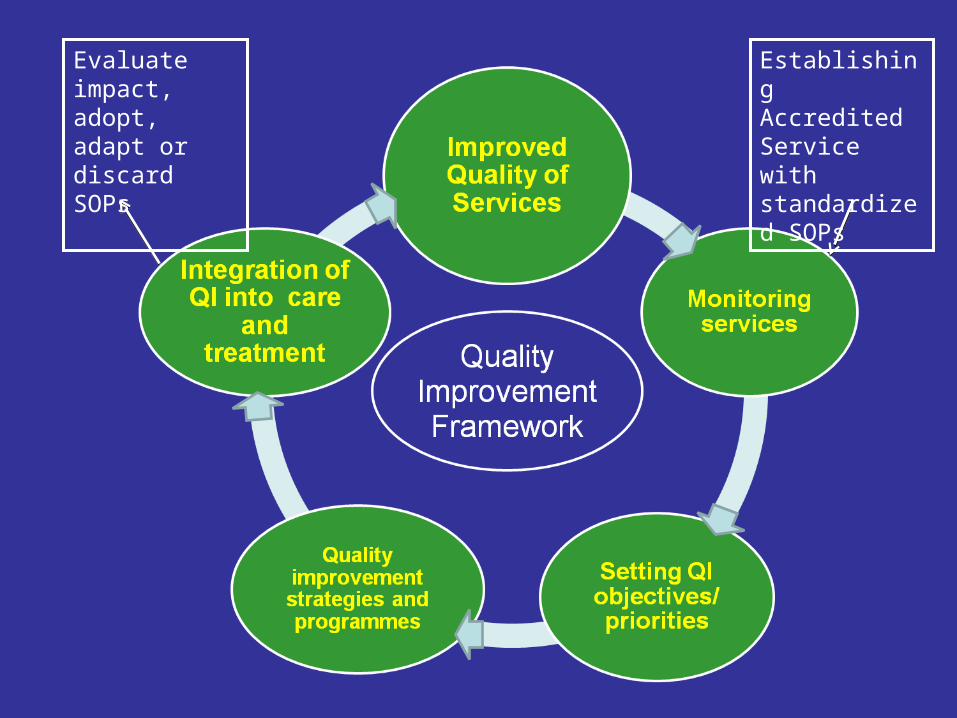
Evaluate impact, adopt, adapt or discard SOPs
Establishing Accredited Service with standardized SOPs
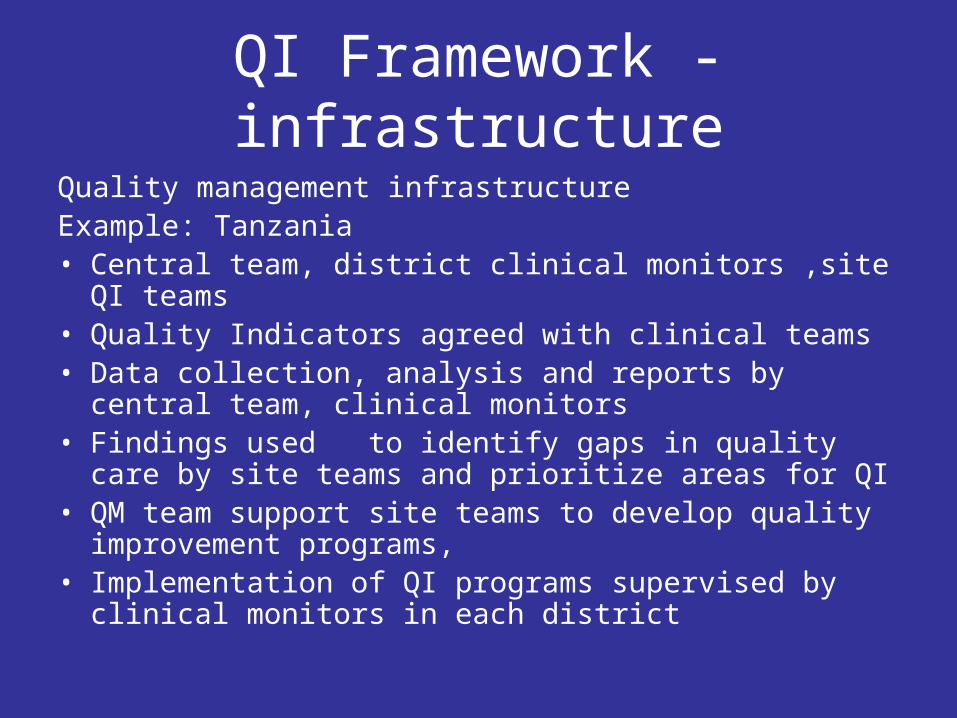
QI Framework - infrastructure
Quality management infrastructureExample: Tanzania• Central team, district clinical monitors ,site QI teams• Quality Indicators agreed with clinical teams• Data collection, analysis and reports by central team,
clinical monitors• Findings used to identify gaps in quality care by site
teams and prioritize areas for QI• QM team support site teams to develop quality
improvement programs, • Implementation of QI programs supervised by clinical
monitors in each district
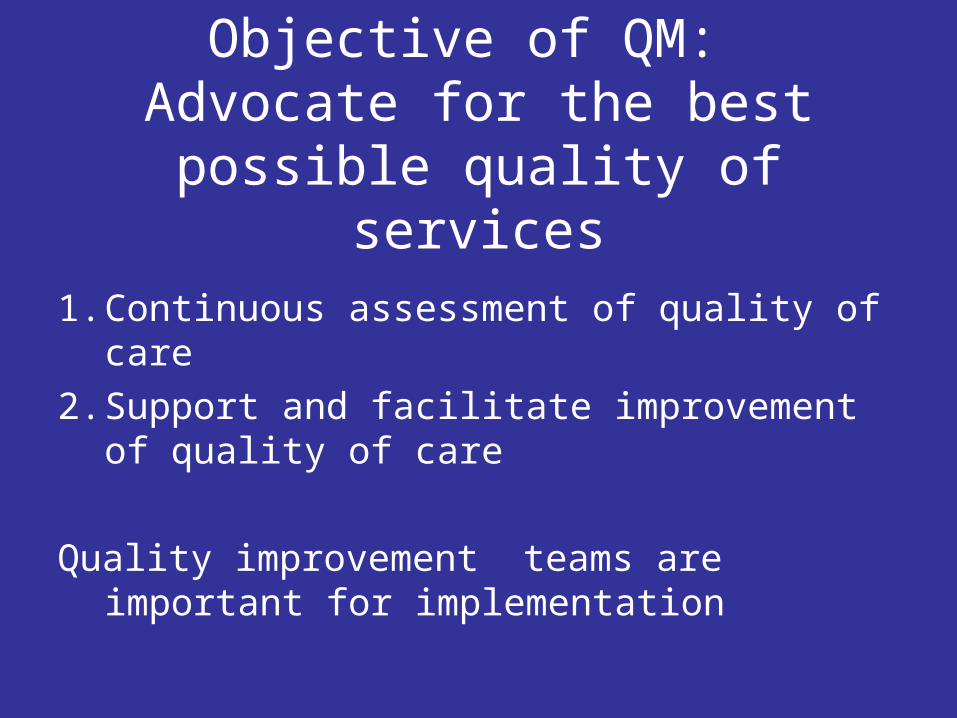
Objective of QM: Advocate for the best possible
quality of services
1. Continuous assessment of quality of care
2. Support and facilitate improvement of quality of care
Quality improvement teams are important for implementation

Methods used for QICapacity building and technical support• Basic training• Mentorship/Preceptor ship (daily) and focused Clinical meetings
(CME) • Analysis of monitoring data for QI indictors• Pre-planned quarterly site feed back• Supportive supervision
Operations research programmes • Patients chart reviews (semi-annually)• Using monitoring data for analysis of selected quality indicators
(quarterly)• Patient time flow assessments (annually)• Patient satisfaction exit interviews (annually)• Providers competence assessment (annually)• Assessment of quality of MDH technical support (quarterly)
-
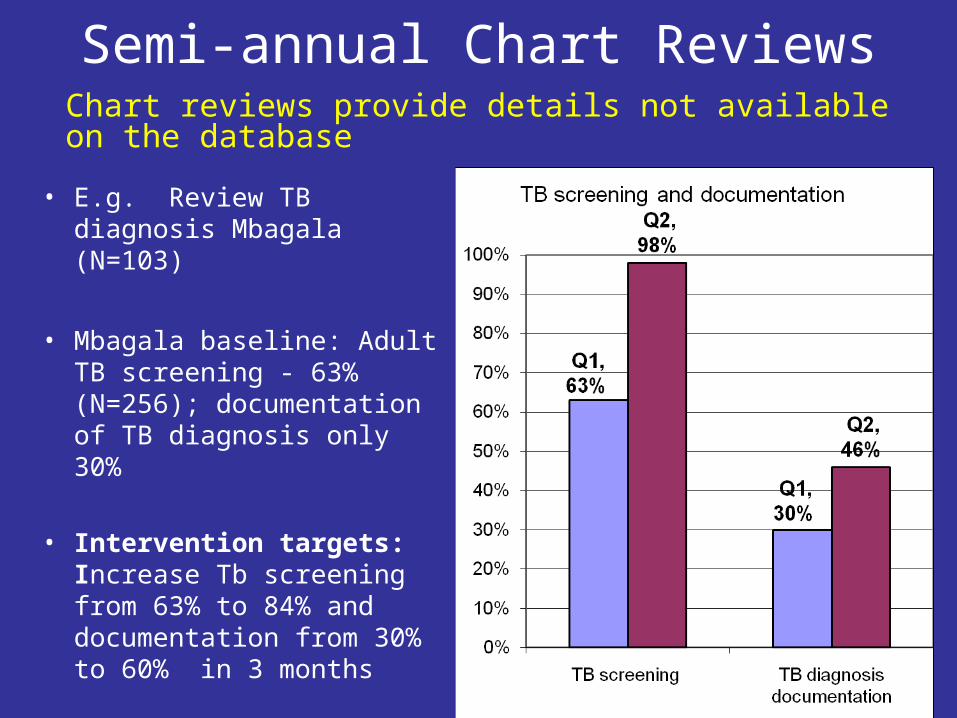
Semi-annual Chart Reviews
• E.g. Review TB diagnosis Mbagala (N=103)
• Mbagala baseline: Adult TB screening - 63% (N=256); documentation of TB diagnosis only 30%
• Intervention targets: Increase Tb screening from 63% to 84% and documentation from 30% to 60% in 3 months
Chart reviews provide details not available on the database
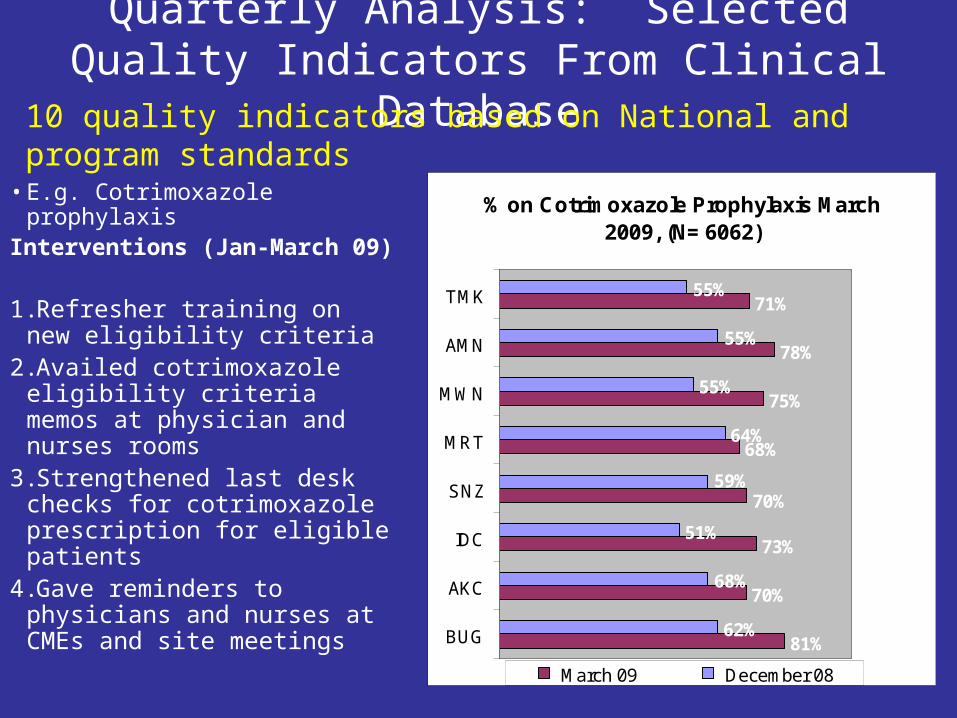
Quarterly Analysis: Selected Quality Indicators From Clinical Database
• E.g. Cotrimoxazole prophylaxisInterventions (Jan-March 09)
1.Refresher training on new eligibility criteria
2.Availed cotrimoxazole eligibility criteria memos at physician and nurses rooms
3.Strengthened last desk checks for cotrimoxazole prescription for eligible patients
4.Gave reminders to physicians and nurses at CMEs and site meetings
10 quality indicators based on National and program standards
% on Cotrimoxazole Prophylaxis March 2009, (N= 6062)
81%
70%
73%
68%
75%
78%
71%
62%
51%
64%
55%
70%
55%
55%
59%
68%
BUG
AKC
IDC
SNZ
MRT
MWN
AMN
TMK
March 09 December 08
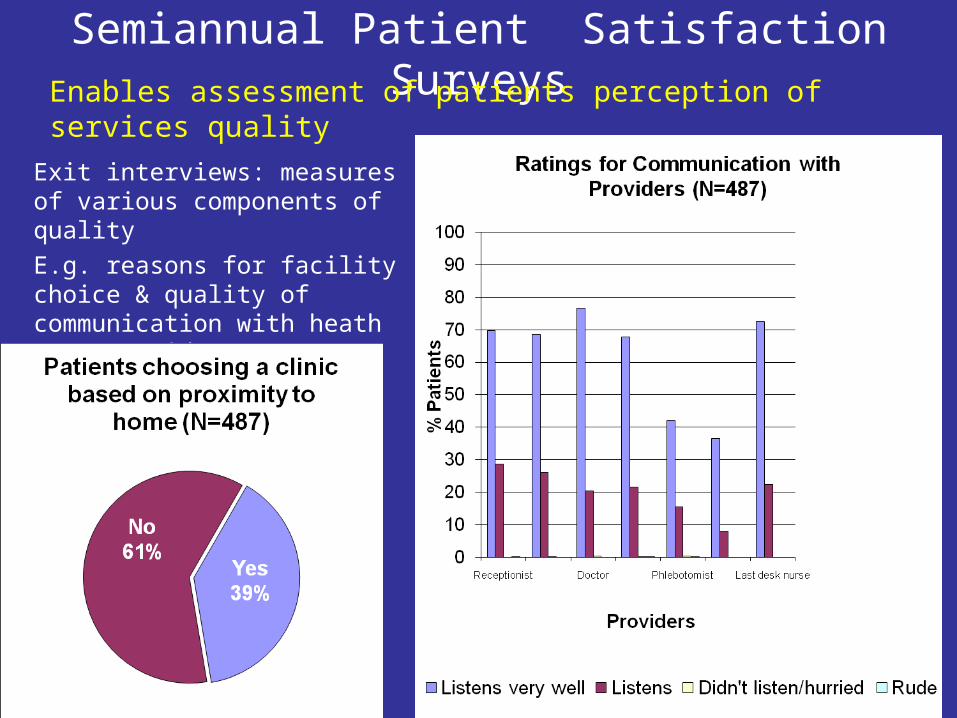
Semiannual Patient Satisfaction Surveys
Exit interviews: measures of various components of quality
E.g. reasons for facility choice & quality of communication with heath care providers
Enables assessment of patients perception of services quality
Providers Competence & Assessment
Addressed/ assessed in various ways– Tanzania
• Pre and post test exams during basic HIV and ART management training. Post test scores <75% are referred to clinical monitors for further onsite training
• Heath care worker survey (annually). Identifies health workers attitudes & obstacles to providing quality health care to patients
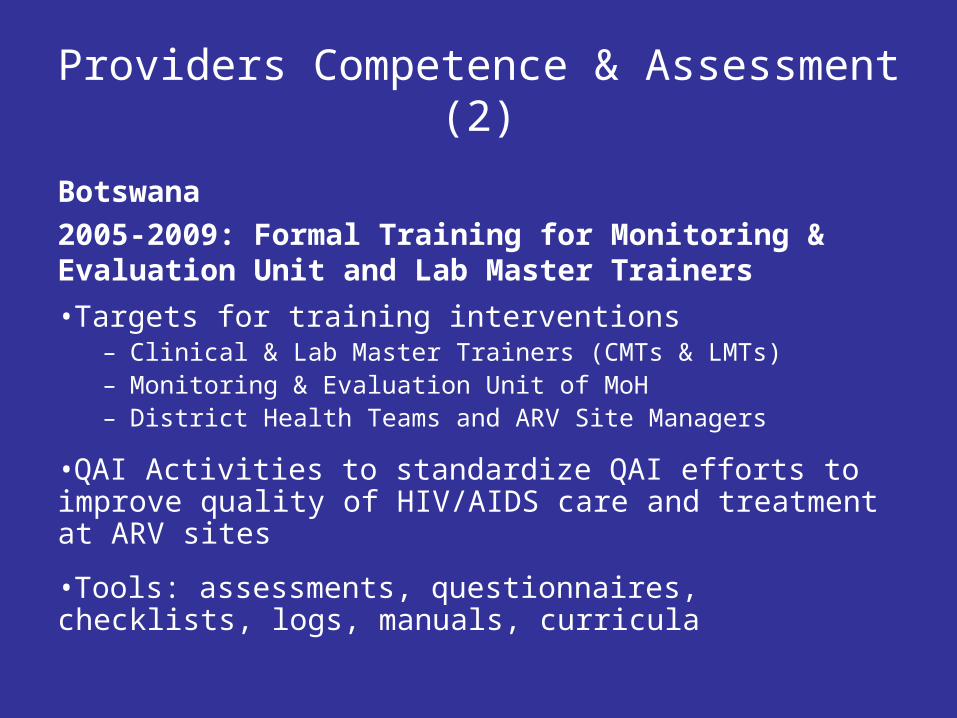
Providers Competence & Assessment (2)
Botswana
2005-2009: Formal Training for Monitoring & Evaluation Unit and Lab Master Trainers
•Targets for training interventions– Clinical & Lab Master Trainers (CMTs & LMTs)– Monitoring & Evaluation Unit of MoH– District Health Teams and ARV Site Managers
•QAI Activities to standardize QAI efforts to improve quality of HIV/AIDS care and treatment at ARV sites
•Tools: assessments, questionnaires, checklists, logs, manuals, curricula

Providers Competence & Assessment (3)
Botswana 2007-2008 activities– Two training sessions for CMTs and LMTS
– QAI training for ARV leadership for District Health Teams and ARV Site Master Trainers
– QAI Sensitization Workshop for District Health Teams and Hospital ARV Site Managers
– DEC trainings –2006 x 2 and September 2009
– PIMS II training – 4 trainings in 2009
– QlikView training – 2 trainings in 2009
– National Lab Training Manual training 2 trainings in 2008 & 3 trainings to date in 2009
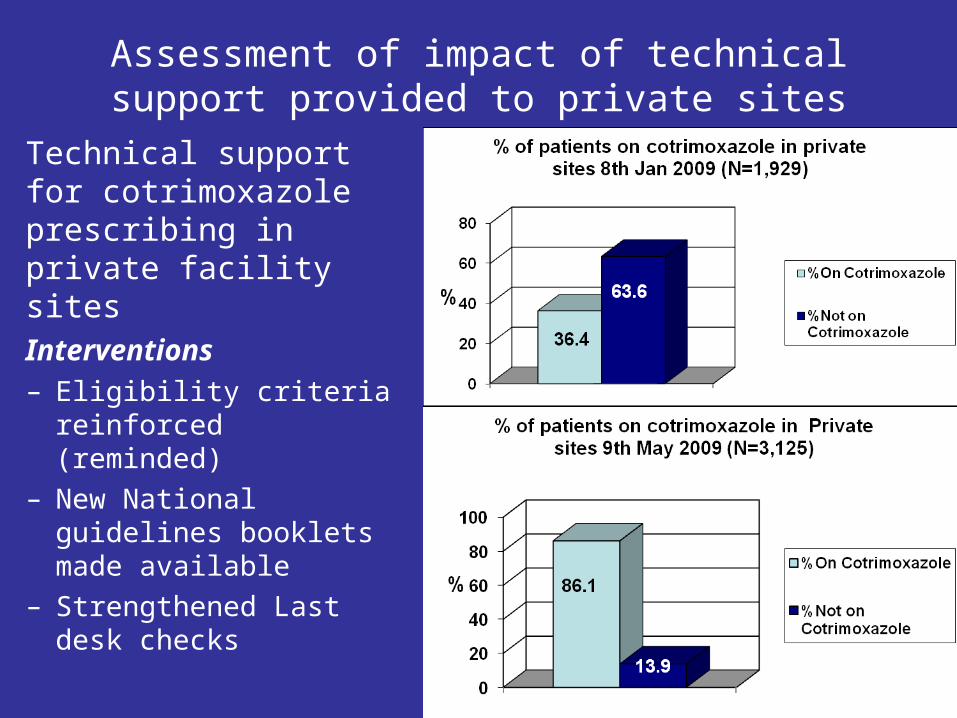
Assessment of impact of technical support provided to private sites
Technical support for cotrimoxazole prescribing in private facility sitesInterventions– Eligibility criteria reinforced
(reminded) – New National guidelines
booklets made available– Strengthened Last desk
checks
New findings with implications for quality improvement

Gender influences on ART adherence and outcomes (1)
• Of 48,754 adults placed on ART 64% were women.
• Number of patients on treatment for ≥12 months: 11,924 , Males 4,270 (36%))
• Following 1 year of treatment, slightly more women than men had an undetectable viral load (64% vs. 60%; p = 0001)
Females more likely to have VL≤400 c/mL at month 12
Evidence from Nigeria indicates women are more ART adherent than men
Meloni, S. et al. 2009

Co-infections/ Co-morbidities and Treatment Outcomes (1)
AIDS-related KS• Remains a significant cause of morbidity and mortality• One year mortality in Jos University Teaching Hospital was
23% for AIDS-KS.
• Case control study with 48 patients with AIDS-related KS• AIDS-KS more tuberculosis (p<.02)• Lower CD4+ cell counts (p<.002)• Higher mortality (p<.002)
Intl J. of STD & AIDS 20:413-9 (2009)
How can challenges be addressed for quality improvements and better clinical outcomes?

Co-infections/ Co-morbidities and Treatment Outcomes (2)
Hepatitis B virus• High co-infection with HBV shown in Jos, Nigeria. 262
(16.7%)
• HIV-HBV co-infected participants had: – Significantly lower CD4+ T-cell counts (107 Vs 130 cells/mL;
p<0.001) and – Higher HIV viral loads (4.96 Vs 4.75 log copies/mL, p<0.01)
prior to the initiation of ART than the HIV mono-infected subjects.
Perc
ent
Vir
al lo
ad
<400
co
pie
s
Statistically Significant
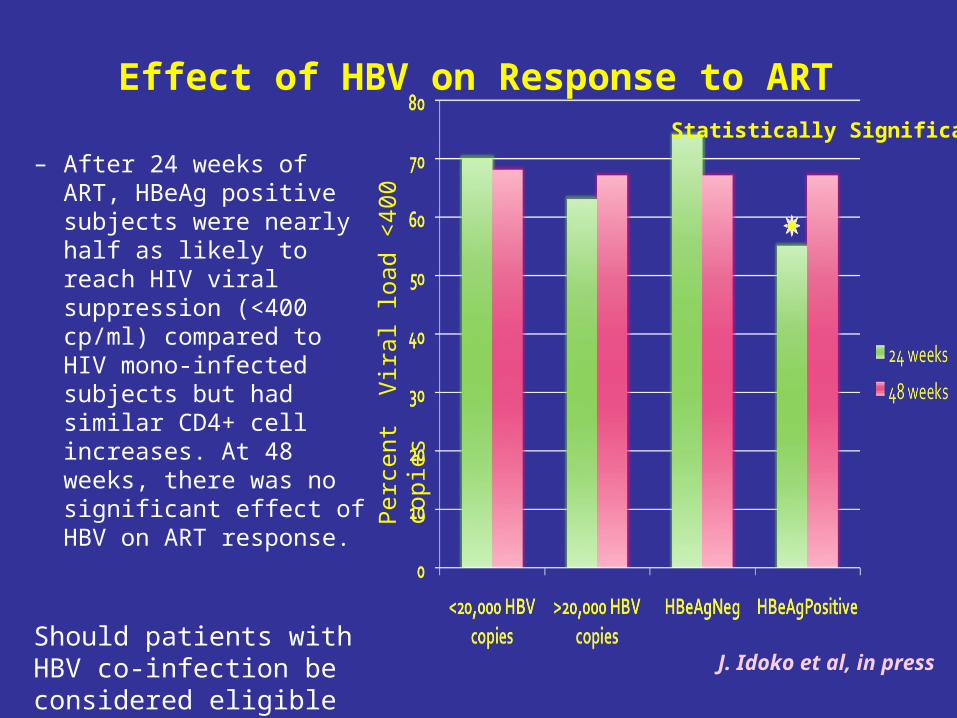
Effect of HBV on Response to ART
J. Idoko et al, in press
– After 24 weeks of ART, HBeAg positive subjects were nearly half as likely to reach HIV viral suppression (<400 cp/ml) compared to HIV mono-infected subjects but had similar CD4+ cell increases. At 48 weeks, there was no significant effect of HBV on ART response.
Should patients with HBV co-infection be considered eligible for ARVs?
Lessons learnt and way forwards
• Inexpensive strategies can be used to identify gaps and intervene for quality health care delivery
• Such research findings should be used in decisions for improved quality of care
• Way forwards
– Expand strategies for utility of clinical data bases to improve quality of HIV care and treatment
– Increase site capacity for analysis/reporting for QI
– Share feedback reports
– Link quality indicators with clinical outcome measures
– Provide technical support to more municipal hospitals to strengthen quality improvement programs


