To Accompany Russell and Taylor, Operations Management, 4th Edition, 2003 Prentice-Hall, Inc. All rights reserved. Chapter 14 Quality Management To Accompany Russell and Taylor, Operations Management, 4th Edition , 2003 Prentice-Hall, Inc. All rights reserved.
Transcript
7/29/2019 Quality Mgt.
http://slidepdf.com/reader/full/quality-mgt 1/56
To Accompany Russell and Taylor, Operations Management, 4th Edition, 2003 Prentice-Hall, Inc. All rights reserved.
Chapter 14
QualityManagement
To Accompany Russell and Taylor, Operations Management, 4th Edition, 2003 Prentice-Hall, Inc. All rights reserved.
7/29/2019 Quality Mgt.
http://slidepdf.com/reader/full/quality-mgt 2/56
To Accompany Russell and Taylor, Operations Management, 4th Edition, 2003 Prentice-Hall, Inc. All rights reserved.
“The degree of excellence of a
thing” (Webster’s Dictionary)
“The totality of features and characteristics that satisfy needs”
(ASQ)
Fitness for use
Quality of design
What Is Quality?
7/29/2019 Quality Mgt.
http://slidepdf.com/reader/full/quality-mgt 3/56
To Accompany Russell and Taylor, Operations Management, 4th Edition, 2003 Prentice-Hall, Inc. All rights reserved.
Dimensions of Quality (Garvin)
1. Performance
Basic operating characteristics
2. Features
“Extra” items added to basic features
3. Reliability
Probability product will operate overtime
7/29/2019 Quality Mgt.
http://slidepdf.com/reader/full/quality-mgt 4/56
To Accompany Russell and Taylor, Operations Management, 4th Edition, 2003 Prentice-Hall, Inc. All rights reserved.
Dimensions of Quality (Garvin)
4. Conformance
Meeting pre-established standards
5. Durability
Life span before replacement
6. Serviceability
Ease of getting repairs, speed &competence of repairs
7/29/2019 Quality Mgt.
http://slidepdf.com/reader/full/quality-mgt 5/56
To Accompany Russell and Taylor, Operations Management, 4th Edition, 2003 Prentice-Hall, Inc. All rights reserved.
Dimensions of Quality (Garvin)
7. Aesthetics
Look, feel, sound, smell or taste
8. Safety
Freedom from injury or harm
9. Other perceptions
Subjective perceptions based onbrand name, advertising, etc
7/29/2019 Quality Mgt.
http://slidepdf.com/reader/full/quality-mgt 6/56
To Accompany Russell and Taylor, Operations Management, 4th Edition, 2003 Prentice-Hall, Inc. All rights reserved.
1. Time & Timeliness
Customer waiting time, completed
on time2. Completeness
Customer gets all they asked for
3. Courtesy Treatment by employees
Service Quality
7/29/2019 Quality Mgt.
http://slidepdf.com/reader/full/quality-mgt 7/56To Accompany Russell and Taylor, Operations Management, 4th Edition, 2003 Prentice-Hall, Inc. All rights reserved.
4. Consistency
Same level of service for all customers
5. Accessibility & Convenience Ease of obtaining service
6. Accuracy
Performed right every time
7. Responsiveness
Reactions to unusual situations
Service Quality
7/29/2019 Quality Mgt.
http://slidepdf.com/reader/full/quality-mgt 8/56To Accompany Russell and Taylor, Operations Management, 4th Edition, 2003 Prentice-Hall, Inc. All rights reserved.
Quality of
ConformanceEnsuring product or service
produced according to designDepends on
Design of production process
Performance of machinery
Materials
Training
7/29/2019 Quality Mgt.
http://slidepdf.com/reader/full/quality-mgt 9/56To Accompany Russell and Taylor, Operations Management, 4th Edition, 2003 Prentice-Hall, Inc. All rights reserved.
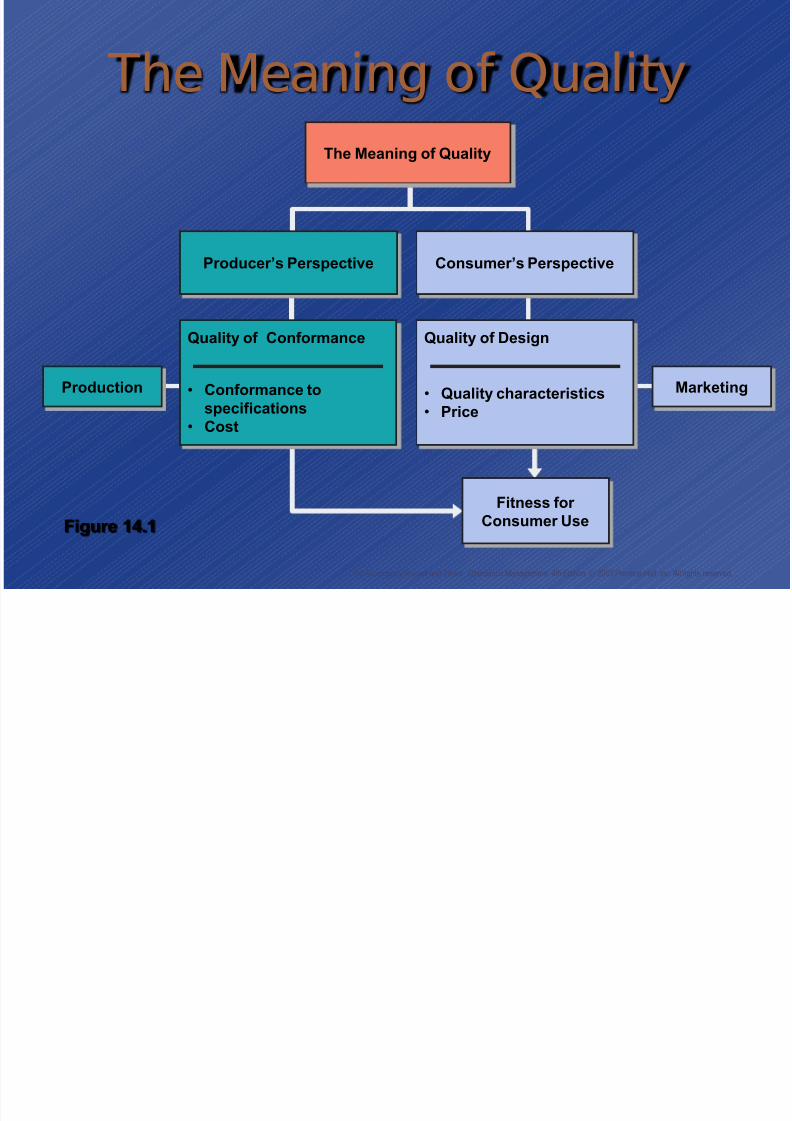
Fitness for Consumer Use
Producer’s Perspective Consumer’s Perspective
Quality of Conformance
• Conformance to
specifications• Cost
Quality of Design
• Quality characteristics•
Price
MarketingProduction
The Meaning of Quality
Figure 14.1
The Meaning of Quality
7/29/2019 Quality Mgt.
http://slidepdf.com/reader/full/quality-mgt 10/56To Accompany Russell and Taylor, Operations Management, 4th Edition, 2003 Prentice-Hall, Inc. All rights reserved.
Quality Philosophers
Walter Shewhart
W. Edwards Deming
J oseph J uran
Philip Crosby
Armand Feigenbaum
7/29/2019 Quality Mgt.
http://slidepdf.com/reader/full/quality-mgt 11/56To Accompany Russell and Taylor, Operations Management, 4th Edition, 2003 Prentice-Hall, Inc. All rights reserved.
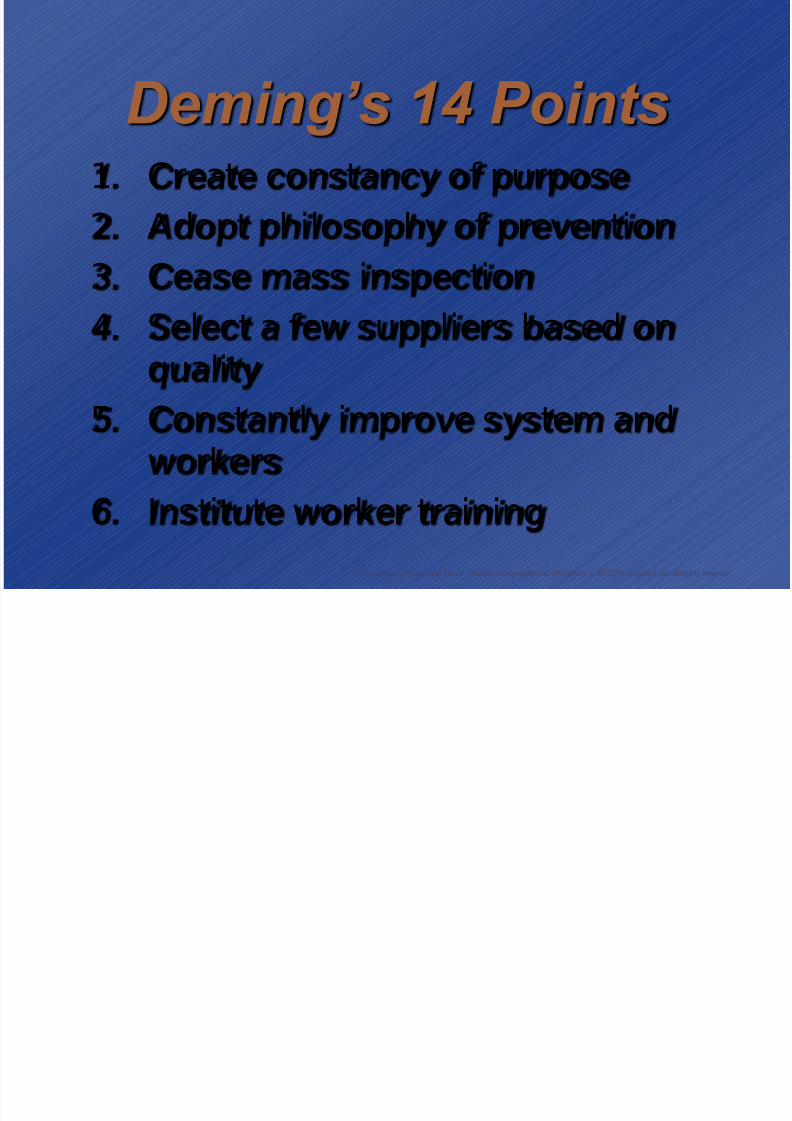
Deming’s 14 Points 1. Create constancy of purpose
2. Adopt philosophy of prevention
3. Cease mass inspection4. Select a few suppliers based on
quality
5. Constantly improve system andworkers
6. Institute worker training
7/29/2019 Quality Mgt.
http://slidepdf.com/reader/full/quality-mgt 12/56To Accompany Russell and Taylor, Operations Management, 4th Edition, 2003 Prentice-Hall, Inc. All rights reserved.
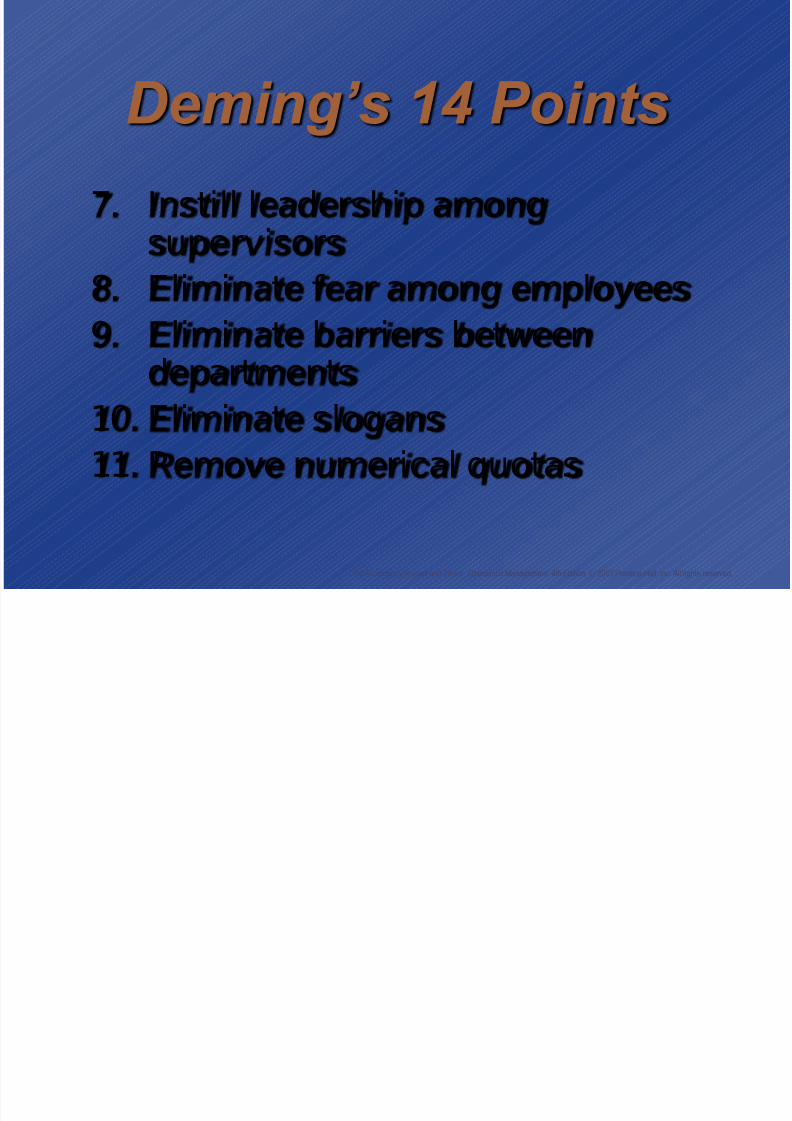
Deming’s 14 Points
7. Instill leadership amongsupervisors
8. Eliminate fear among employees
9. Eliminate barriers betweendepartments
10. Eliminate slogans11. Remove numerical quotas
7/29/2019 Quality Mgt.
http://slidepdf.com/reader/full/quality-mgt 13/56To Accompany Russell and Taylor, Operations Management, 4th Edition, 2003 Prentice-Hall, Inc. All rights reserved.
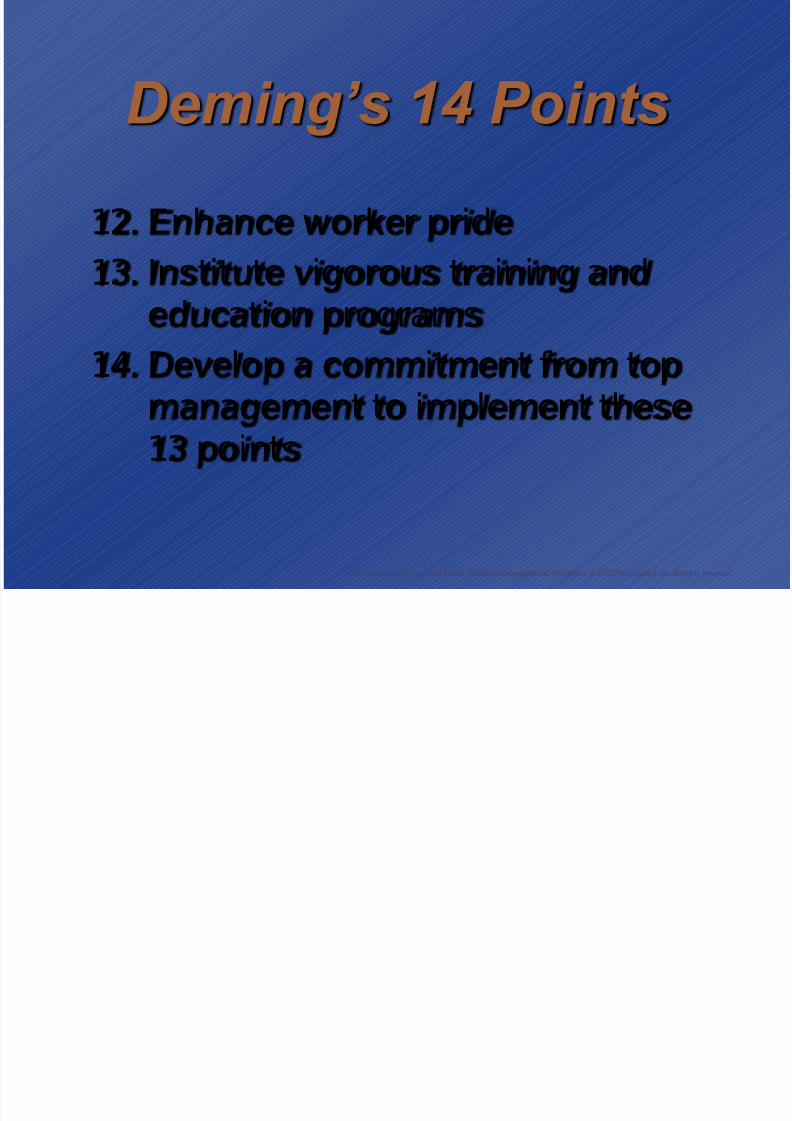
Deming’s 14 Points
12. Enhance worker pride
13. Institute vigorous training andeducation programs
14. Develop a commitment from top
management to implement these13 points
7/29/2019 Quality Mgt.
http://slidepdf.com/reader/full/quality-mgt 14/56
To Accompany Russell and Taylor, Operations Management, 4th Edition, 2003 Prentice-Hall, Inc. All rights reserved.
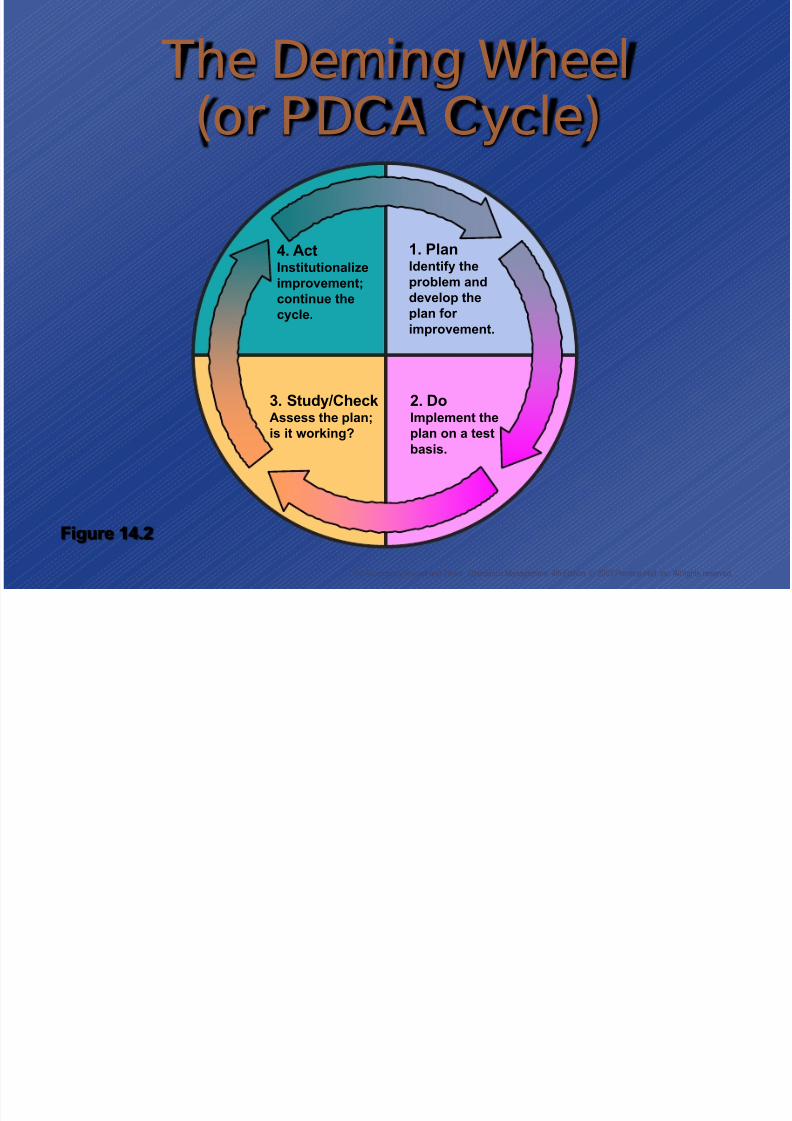
The Deming Wheel
(or PDCA Cycle)
1. PlanIdentify the
problem anddevelop theplan for improvement.
2. Do
Implement theplan on a testbasis.
3. Study/Check
Assess the plan;is it working?
4. ActInstitutionalize
improvement;continue thecycle.
Figure 14.2
7/29/2019 Quality Mgt.
http://slidepdf.com/reader/full/quality-mgt 15/56
To Accompany Russell and Taylor, Operations Management, 4th Edition, 2003 Prentice-Hall, Inc. All rights reserved.
Total Quality Management
1. Customer defined quality
2. Top management leadership
3. Quality as a strategic issue4. All employees responsible for quality
5. Continuous improvement
6. Shared problem solving7. Statistical quality control
8. Training & education for all employees
7/29/2019 Quality Mgt.
http://slidepdf.com/reader/full/quality-mgt 16/56
To Accompany Russell and Taylor, Operations Management, 4th Edition, 2003 Prentice-Hall, Inc. All rights reserved.
TQM Throughout the
OrganizationMarketing, sales, research
Engineering
Purchasing
Human resources
Management
Packing, storing, shipping
After-sale support
7/29/2019 Quality Mgt.
http://slidepdf.com/reader/full/quality-mgt 17/56
To Accompany Russell and Taylor, Operations Management, 4th Edition, 2003 Prentice-Hall, Inc. All rights reserved.
TQM and External
SuppliersSupport of suppliers required to
satisfy customer expectations
Single-sourcing
Partnering
Suppliers may be required toadopt quality programs or meetspecific standards
7/29/2019 Quality Mgt.
http://slidepdf.com/reader/full/quality-mgt 18/56
To Accompany Russell and Taylor, Operations Management, 4th Edition, 2003 Prentice-Hall, Inc. All rights reserved.
TQM and Customer
Satisfaction
Requires some form of
measurement systemCustomer surveys widely used
Total customer satisfaction is
often an organization’soverriding objective
7/29/2019 Quality Mgt.
http://slidepdf.com/reader/full/quality-mgt 19/56
To Accompany Russell and Taylor, Operations Management, 4th Edition, 2003 Prentice-Hall, Inc. All rights reserved.
TQM and Information
Technology Critical to monitoring and controlling
quality in an organization
IT systems must be structured to satisfythe requirements of TQM systems
IT systems tie together all theorganization's functions and processes
IT systems must be able to applyappropriate tools to drive improvement
It systems must be able to store andaccess relevant data for analysis
7/29/2019 Quality Mgt.
http://slidepdf.com/reader/full/quality-mgt 20/56
To Accompany Russell and Taylor, Operations Management, 4th Edition, 2003 Prentice-Hall, Inc. All rights reserved.