Quantitative Analysis of artificial sweeteners in soft drink samples A DISSERTATION SUBMITTED TO BRAC UNIVERSITY IN PARTIAL FULLFILLMENT OF THE REQUIREMENTS FOR THE DEGREE OF BACHELOR OF SCIENCE IN BIOTECHNOLOGY Submitted by: Yashna Tahjib Meghla Student Id: 13136004 February 2018 Biotechnology Program Department of Mathematics and Natural Sciences BRAC University
Transcript
Quantitative Analysis of artificial sweeteners in
soft drink samples
A DISSERTATION SUBMITTED TO BRAC UNIVERSITY IN PARTIAL
FULLFILLMENT OF THE REQUIREMENTS FOR THE DEGREE OF
BACHELOR OF SCIENCE IN BIOTECHNOLOGY
Submitted by:
Yashna Tahjib Meghla
Student Id: 13136004
February 2018
Biotechnology Program
Department of Mathematics and Natural Sciences
BRAC University
DECLARATION
I declare that the thesis work titled “Quantitative analysis of artificial sweeteners in soft drinks.”
has been written and submitted by me, Yashna Tahjib Meghla, without the use of other sources
than those mentioned. It is further asserted that this Bachelor’s Thesis has never been submitted
in the same or substantially similar version to any other examinations office. All explanations
that have been adopted literally or analogously are marked as such. Any reference to work done
by any other person or institution or any material obtained from other sources has been duly cited
and referenced.
(Yashna Tahjib Meghla)
Candidate
CERTIFIED BY
Dr. Mahboob Hossain
Supervisor
Professor
Microbiology Program
Department of Mathematics and Natural Sciences
BRAC University, Dhaka.
(i)
Acknowledgement
This thesis becomes a reality with the kind support and help of many individuals; I would like to
extend my sincere thanks to all of them.
Foremost, I want to offer my gratitude to Allah for the strength, wisdom, peace of mind and
good health He bestowed upon me in order to finish this research.
I offer my sincere gratitude to Professor A F M Yusuf Haider, Ph.D., Chairperson, Department
of Mathematics and Natural Sciences, BRAC University, and late Professor A. A. Ziauddin
Ahmad, former Chairperson, Department of Mathematics and Natural Sciences, BRAC
University for their inspiration, prudent advice and encouragement in conducting this
experiment.
My regards, gratitude, indebtedness, and appreciation goes to my respected supervisor Dr.
Mahboob Hossain, Professor, Microbiology Program, Department of Mathematics and Natural
Sciences, BRAC University for providing me the opportunity to explore and pursue a new idea
which has not been investigated before in our laboratory. His abundant assistance, support, and
guidance have enabled me to get exposed to a new workplace and work with different people.
Without his supervision, cooperation and valuable suggestions it would be very difficult to
complete the research.
I would like to express my special gratitude and thanks to Dr.Abu Shara Shamsur Rouf,
Professor, Department of Pharmaceutical Chemistry, Dhaka University, for giving me the
permission to work in his laboratory.
I would like to express my heartiest gratitude to Dr. Md. Akhtaruzzaman, Professor, Institute
of Nutrition and Food Science, Dhaka University, for adding new directions to my thinking and
acted as a continual stimulus for refinement and depth in the presentation of this work.
I am highly indebted to Md. Shahadat Hossain, Assistant Professor, Department of
Pharmaceutical Chemistry, Dhaka University, for impairing his knowledge, technical know-how
and expertise in this study.
(ii)
I extend my gratitude to Kabirul Islam Kanon, my lab partner throughout the course of this
study. The completion of my dissertation would have been impossible without his support.
Yashna Tahjib Meghla
(iii)
Abstract
Carbonated drinks are the biggest soft drinks sector around the globe and have grown
significantly over the last few decades. It has become part of the urban lifestyle and is consumed
by people regardless of age, religion, gender, race or culture. With this increasing popularity
came the use of synthetic sweeteners, also known as Non-nutritive sweeteners (NAS), which are
low caloric substances used to replace sugar or corn syrup and other caloric ones. Higher
concentration of some of these sweeteners leads to various side-effects such as physical
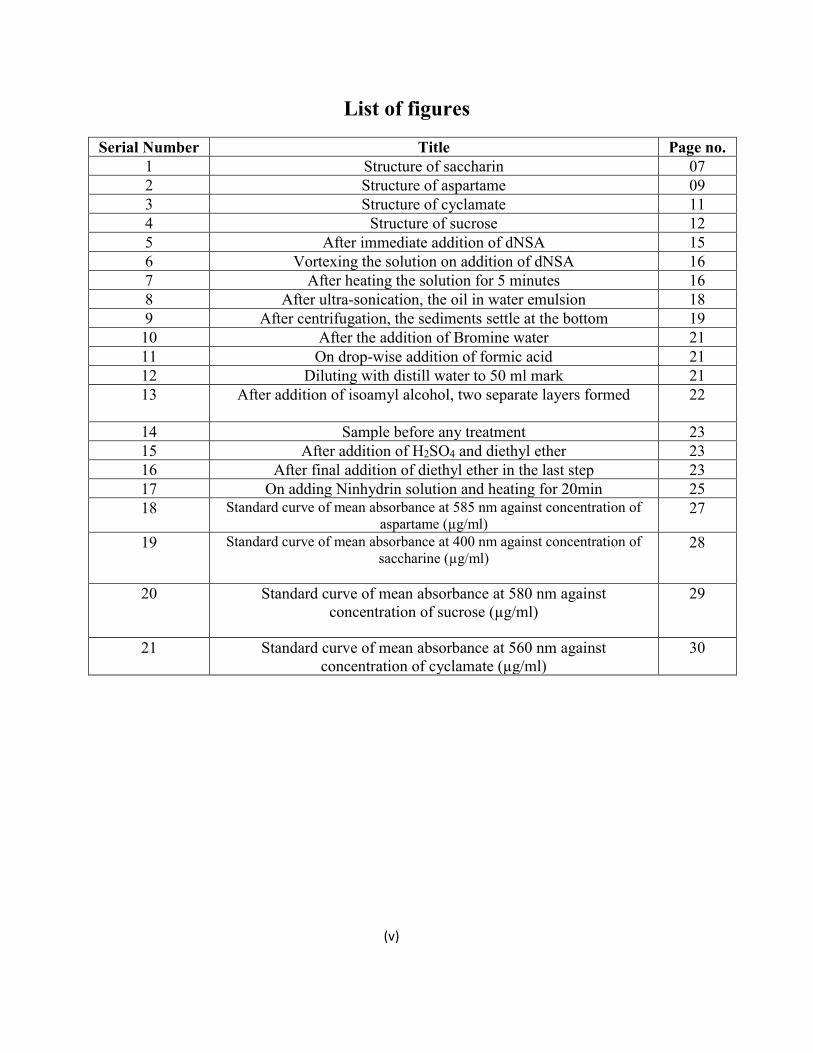
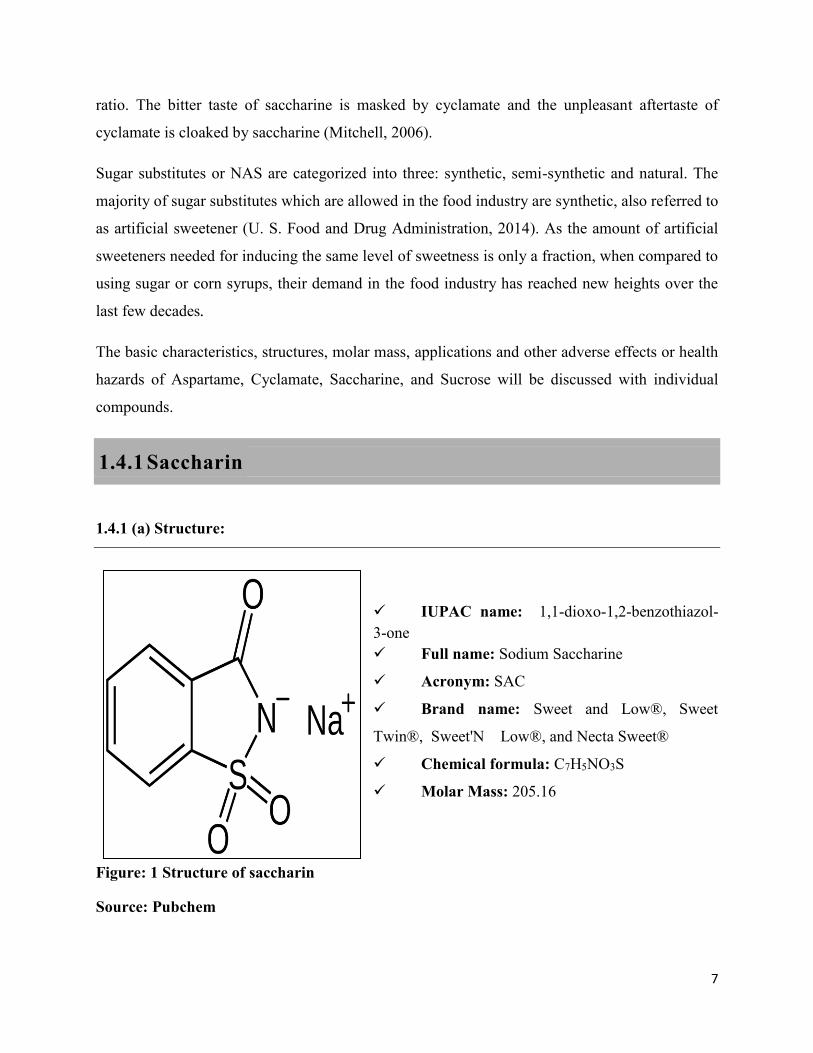
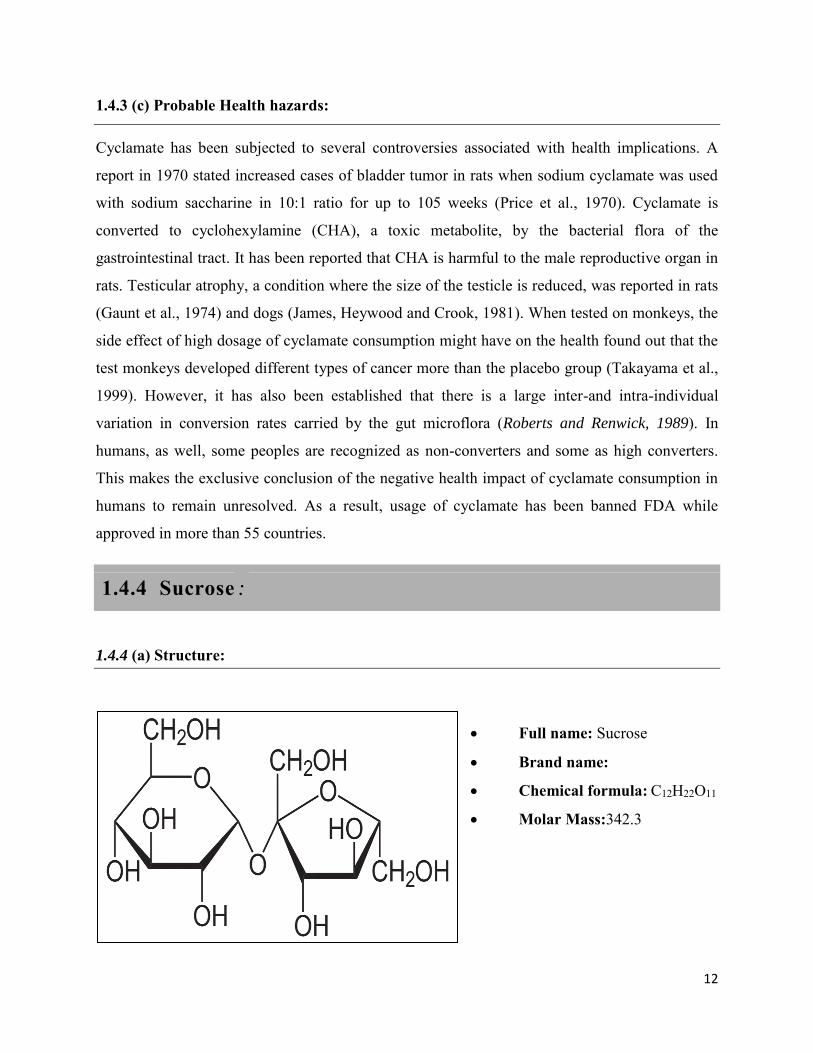
Serial Number Title Page no. 1 Structure of saccharin 07 2 Structure of aspartame 09 3 Structure of cyclamate 11 4 Structure of sucrose 12 5 After immediate addition of dNSA 15 6 Vortexing the solution on addition of dNSA 16 7 After heating the solution for 5 minutes 16 8 After ultra-sonication, the oil in water emulsion 18 9 After centrifugation, the sediments settle at the bottom 19 10 After the addition of Bromine water 21 11 On drop-wise addition of formic acid 21 12 Diluting with distill water to 50 ml mark 21 13 After addition of isoamyl alcohol, two separate layers formed
22
14 Sample before any treatment 23 15 After addition of H2SO4 and diethyl ether 23 16 After final addition of diethyl ether in the last step 23 17 On adding Ninhydrin solution and heating for 20min 25 18 Standard curve of mean absorbance at 585 nm against concentration of
aspartame (µg/ml) 27
19 Standard curve of mean absorbance at 400 nm against concentration of saccharine (µg/ml)
28
20 Standard curve of mean absorbance at 580 nm against concentration of sucrose (µg/ml)
29
21 Standard curve of mean absorbance at 560 nm against concentration of cyclamate (µg/ml)
30
(v)
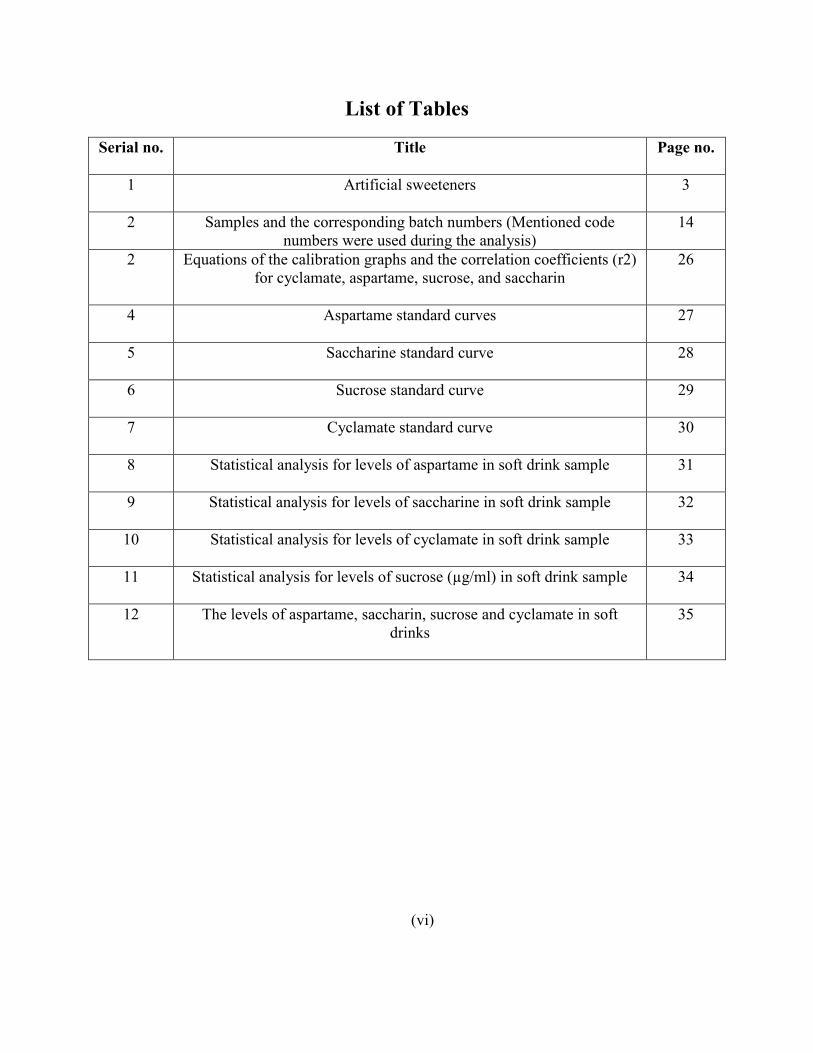
List of Tables
Serial no. Title Page no.
1 Artificial sweeteners 3
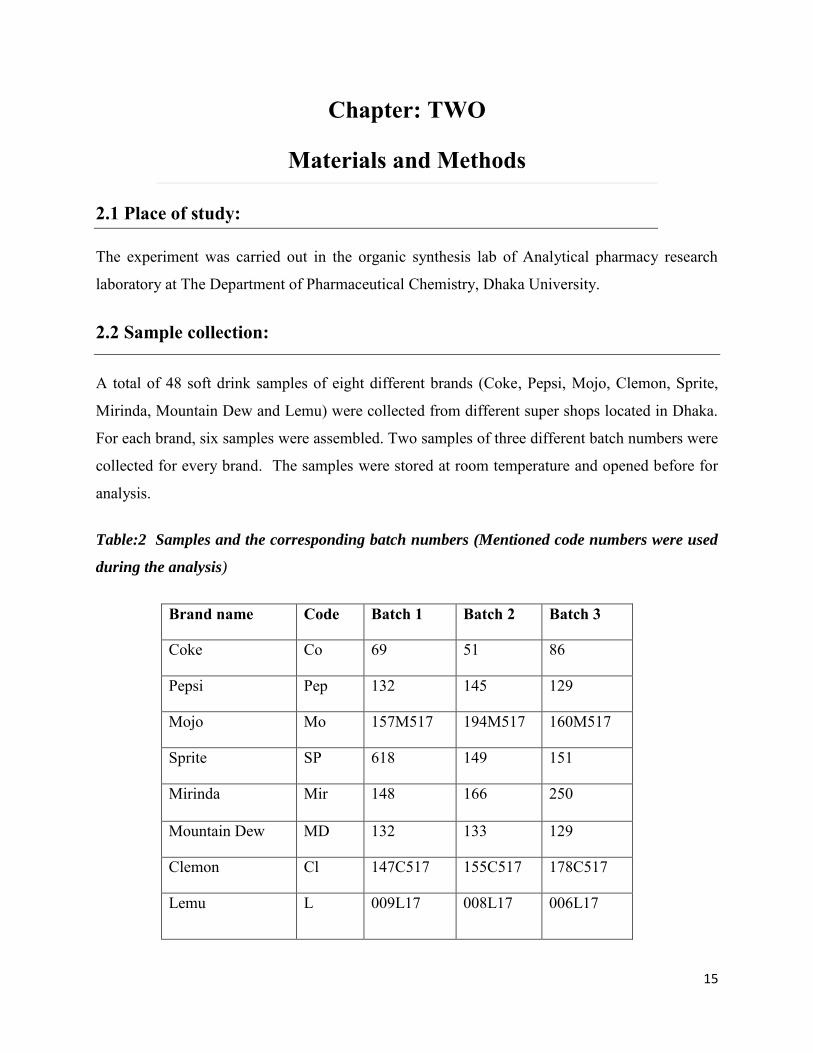
2 Samples and the corresponding batch numbers (Mentioned code numbers were used during the analysis)
14
2 Equations of the calibration graphs and the correlation coefficients (r2) for cyclamate, aspartame, sucrose, and saccharin
26
4 Aspartame standard curves 27
5 Saccharine standard curve 28
6 Sucrose standard curve 29
7 Cyclamate standard curve 30
8 Statistical analysis for levels of aspartame in soft drink sample 31
9 Statistical analysis for levels of saccharine in soft drink sample 32
10 Statistical analysis for levels of cyclamate in soft drink sample 33
11 Statistical analysis for levels of sucrose (µg/ml) in soft drink sample 34
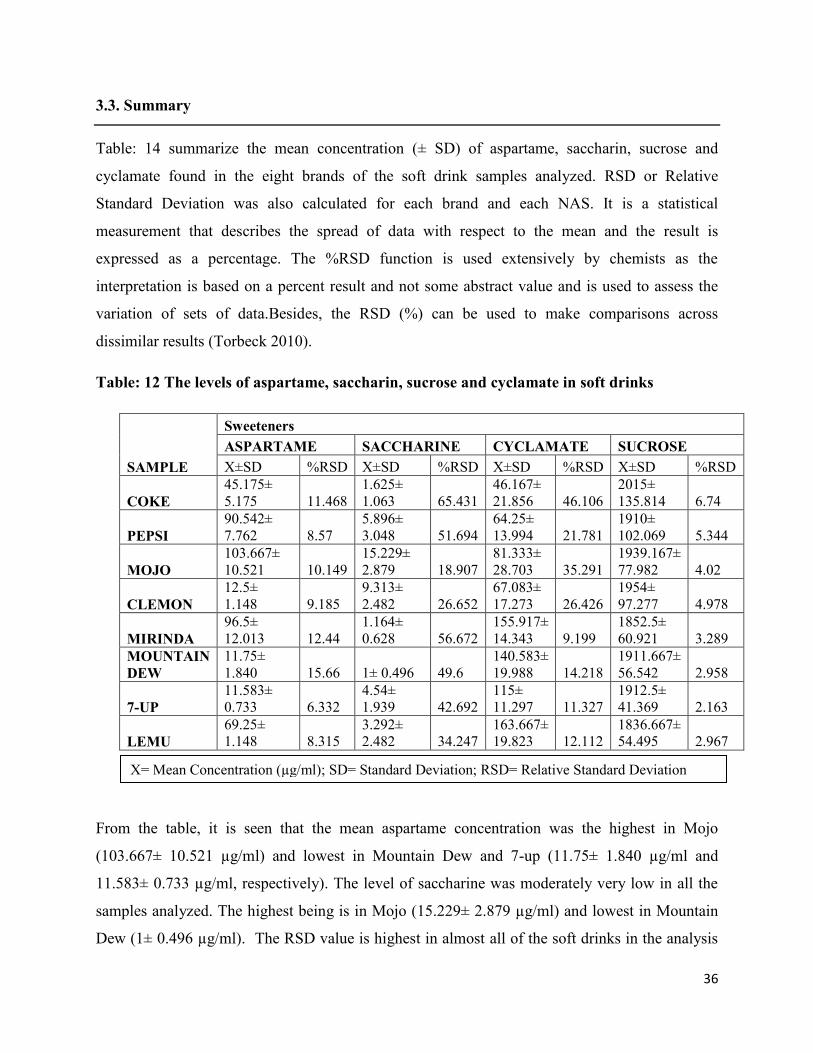
12 The levels of aspartame, saccharin, sucrose and cyclamate in soft drinks
35
(vi)
1
Chapter: ONE
Introduction
Artificial sweeteners are non-caloric food additives which enhance the sweetness of food without
the same calories as sugar. As a result, they are also known as non-nutritive sweeteners (NAS).
They are many times sweeter than sugar, almost 30 to 8000 times. Thus they have fewer calories
than table sugar (Chang and Yeh, 2014). Being cheaper and beneficial to people having problems
with sugar metabolism, their consumption has amplified significantly over the last few decades.
Health conscious people rely on the use of synthetic sugars as they have higher intense sweetness
per gram than natural, caloric sugars which include sucrose, corn syrups or fruit concentrates
(Tandel, 2011). Many consumers, obese or lean, are inclined to use NAS based foods, drinks or
finished products containing these man-made sugars (Johnson et al., 2009). Looking at our
current food supply, it is very much visible. NAS is being used in thousands of food products
like soft drinks, chocolates, sweets, desserts, yogurts, gums etc.
With the increase in popularity of the use of artificial sweeteners, controversies have also arisen
related to the ill effects of its consumption in adults and young children. They have been
considered as non-toxic, but different research made recently proved their oncogenic potential,
leading to bladder cancer by mechanisms that have not been cleared up, which led to a restraint
of their usage (James, Heywood and Crook, 1981). Their usage has been repeatedly associated
with obesity and obesity-related diseases which include diabetes, cardiovascular diseases,
hypertension, a metabolic syndrome which include increased blood cholesterol level (Johnson et
al., 2009). Hence, people have mixed feeling when using artificial sweeteners today. Although
several studies have been made and are being researched thoroughly, yet one of them cleared the
fear of the onsets of their side-effects. Most of them, even the ones published in reliable medical
publications lack the strong scientific background and did not maintain statistical analysis and in
consequence, were abandoned.
Despite all the controversy related to artificial sugars and products containing them, one of the
most popular and widely consumed is a soft drink, also known as soda in some countries. These
2
carbonated drinks are inexpensive, refreshing, convenient, a drink with “feel good” factor,
tasting good and easily accessible to all people in the world. They are non-alcoholic water-based
flavored drinks that are optionally sweetened, acidulated and carbonated (Abdullah and Asngari,
2011). Some carbonated soft drinks also contain caffeine; mainly the brown-colored cola drinks.
It has become a regular part of the diet of urban people, regardless of the age group.
After independence, the food habit of Bangladeshi people has been changed a lot. Besides our
traditional food, consumers of Bangladesh developed an inclination towards western food.
Different foreign food companies were established in Bangladesh. The beverage industry is one
of them. Carbonated beverage entered our market in the latter part of 1980. At that
time there were a few companies in Bangladesh. But by the change of time and western culture
influences, it has become very popular in Bangladesh. By the year 2000, more than 12 Beverage
company operating business in Bangladesh and most of them are foreign companies (Islam and
Fatema, 2014). Interestingly we don’t know that beverage is also our cultural food because
beverage doesn’t mean only carbonated drinks. Yoghurt, soup, and lacchi are also beverage of
our own tradition which has been consumed for the last 100 years in Bangladesh.
With the advancement of food technology, food additives have been widely used in the beverage
productions. Food manufacturers often use a blend of NAS to improve the flavor acceptability of
NAS. Hence food additives are utilized in the food industry in order to maintain quality, texture,
consistency, appearance, taste, alkalinity and acidity of food products. Thus, the large-scale
production of good wholesome food and beverage at economical prices can be made possible
with the use of food additives (Brown, 2014). In the case of sweetener blends manufacturing, the
control of sweeteners proportion in blends is essential to precisely reproduce the texture,
sweetness profile and also reduce the adverse health effects (Schiffman et al., 2007).
In spite of all the claims cited over the past few decades, studies have suggested alternately that
sugar-substitutes may be 'potentially helpful,' 'potentially harmful,' or have 'unclear effects' with
regard to human health. The negative effects associated with the regular consumption of artificial
sweeteners is yet unidentified but some of the side-effects reported repeatedly by consumers
remained constant. Thus, an acceptable daily intake (ADI) has been established by Food and
Drug Administrative (FDA) which is considered safe. However, some sweeteners like cyclamate
3
are banned by FDA in the USA while its consumption is considered safe within ADI level of 11
mg/kg body weight by JECFA1 and at 7 mg/kg body weight by the SCF.2
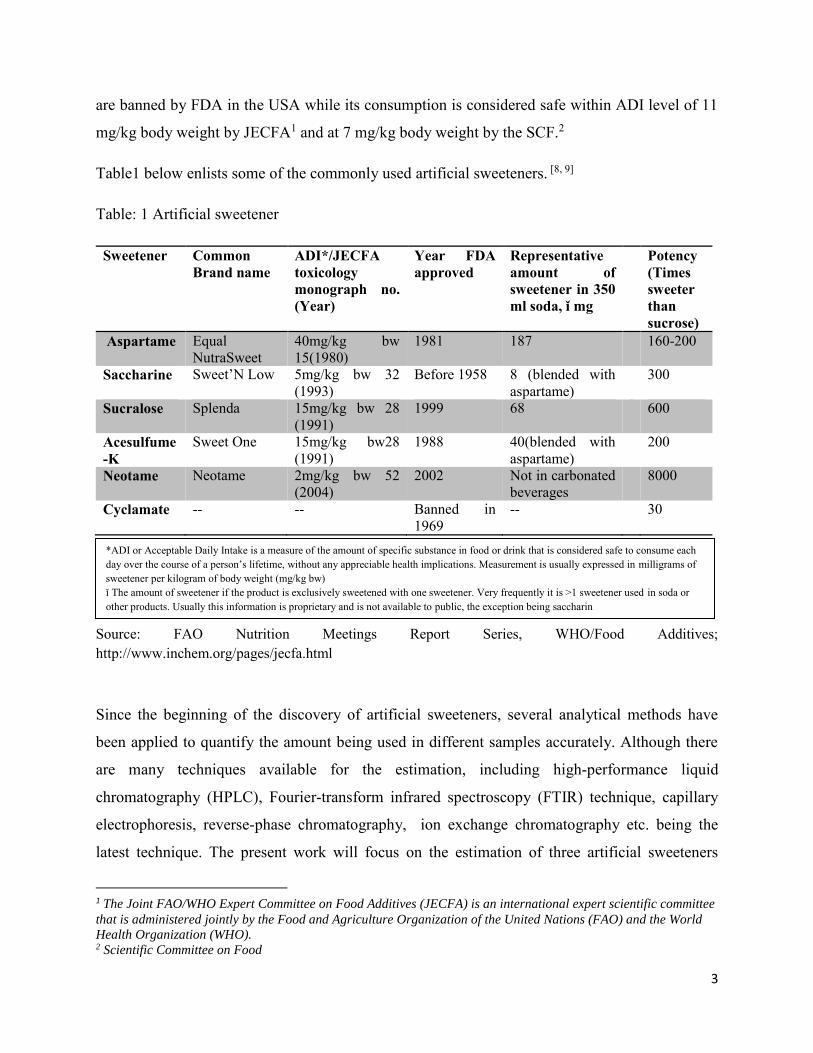
Table1 below enlists some of the commonly used artificial sweeteners. [8, 9]
Table: 1 Artificial sweetener
Sweetener
Common Brand name
ADI*/JECFA toxicology monograph no. (Year)
Year FDA approved
Representative amount of sweetener in 350 ml soda, ǐ mg
electrophoresis, reverse-phase chromatography, ion exchange chromatography etc. being the
latest technique. The present work will focus on the estimation of three artificial sweeteners
1 The Joint FAO/WHO Expert Committee on Food Additives (JECFA) is an international expert scientific committee
that is administered jointly by the Food and Agriculture Organization of the United Nations (FAO) and the World
Health Organization (WHO). 2 Scientific Committee on Food
*ADI or Acceptable Daily Intake is a measure of the amount of specific substance in food or drink that is considered safe to consume each day over the course of a person’s lifetime, without any appreciable health implications. Measurement is usually expressed in milligrams of sweetener per kilogram of body weight (mg/kg bw) ǐ The amount of sweetener if the product is exclusively sweetened with one sweetener. Very frequently it is >1 sweetener used in soda or other products. Usually this information is proprietary and is not available to public, the exception being saccharin
4
(aspartame, saccharine and cyclamate) and one natural sugar (sucrose) which are commonly used
in soft drinks available in the markets of Bangladesh. UV-Vis spectrophotometry has been used
for the assessment of these sugars in eight different brands of soft drinks. This method has the
advantages of significant accuracy, precision, low cost, easy handling and most importantly, its
availability in most laboratories. However, there are some implications for the analysis of
different real samples which are limited to poor sensitivity and selectivity. The combination of
spectrophotometry with some microextraction procedure, using chemicals for maximum
extraction of sugars from samples and keeping other parameters constant, depending on the sugar
being analyzed, to overcome these problems. Different reference papers were used as a
guideline for the analysis procedure.
1.1The Market
Sugar-sweetened beverages (SSBs) include all non-diet soft drinks, fruit drinks, sports drinks,
energy drinks, low-calorie drinks and other beverages that contain added caloric sweeteners,
such as sweetened tea, rice drinks, bean beverages, sugar cane beverages, and non-alcoholic
wines/malt beverages (Green, 2016).
Globally, carbonated soft drinks are third most consumed beverages. Thirsty people take
beverage for refreshment and entertainment. Because of hot weather, at present Bangladesh has a
very competitive market of beverage, even though soft drinks entered the market in the 1980s. At
that time two or three soft drinks companies were available in the market. Now lots of soft drinks
companies (both domestic and global) are operating in Bangladesh though some of them are very
popular (Islam and Fatema, 2014). The mix of consumers in soft drinks market encompasses
with 79% urban consumers and 21% semi-urban consumers. And the demand for soft drinks
according to areas and age in semi-urban areas is 65% of total consumers and in urban areas, it is
100%. About 58% of total consumers are the age of below 15 years, 15% of them are 15 to 25
years, whereas 5% of them are 26 to 35 years and 13% of them are the age of above 35 years. So
the age of below 15 years is the most targeted segment of people in the market, covering 64% of
total demand of soft drinks, then the age of 15 to 25 years, 26 to 35 years, and above 35 years
5
cover 16.5%, 5%, and 14% of the total demand for soft drinks respectively. Then it is a noticing
factor that 91% of consumers take the soft drinks and 9% doesn’t (Islam and Farha, 2014).
1.2 Aim and objectives:
Interest in the analysis of soft drinks arises for the following reasons:
The analysis of the sugar content in soft drinks using spectrophotometer or any other
methodology has not been undertaken before. Any literature review which has been carried
out by local researcher in this regard was not obtained, to my best knowledge.
To estimate quantitatively the level of different widely used sugars in each sample of these
soft drinks available in the market.
From a nutritional point of view, consumption of SSB’s has been linked to several adverse
health effects. An ADI level has been established for each variety of artificial sugar and this
work aims to find out if it is being maintained.
This work also aims to advise the public about their intake. Reports on the level of these
substances in soft drinks are scanty. Moreover, new drinks are being released into the market
daily and the need for continuous monitoring of these substances in energy drinks is a
necessity.
This study aimed to determine the level of cyclamate, aspartame, saccharine and sucrose in soft
drinks.
1.3. History of soft drinks:
Soft drinks can trace their history back to the mineral water found in natural springs. The first
marketed soft drinks (non-carbonated) appeared in the 17th century. They were made from water
and lemon juice sweetened with honey (Pietka and Korab, 2017). In 1767, the first drinkable
man-made glass of carbonated water was created by Englishmen Doctor Joseph Priestley. Three
years later, Swedish chemist Torbern Bergman invented a generating apparatus that made
6
carbonated water from chalk by the use of sulfuric acid. These first carbonated waters were
meant to imitate the mineral waters found in nature.
In 1810, the first United States patent was issued for the "means of mass manufacture of
imitation mineral waters" to Simons and Rundell of Charleston, South Carolina. However,
carbonated beverages did not achieve great popularity in America until 1832, when John
Mathews invented his apparatus for the making carbonated water (Tchudi, 1986). The American
pharmacists selling mineral waters, which were believed to be a healthy practice, began to add
medicinal and flavorful herbs to unflavored mineral water. They used birch bark, dandelion,
sarsaparilla, and fruit extracts. Some historians consider that the first flavored carbonated soft
drink was that made in 1807 by Doctor Philip Syng Physick of Philadelphia (Pendergrast, 1993).
The customers soon wanted to take their "health" drinks home with them and a soft drink
bottling industry grew from consumer demand.
By about 1820, improvements in manufacturing processes allowed a much greater output, and
bottled water became popular. Mineral salts and flavors were added—ginger about 1820, lemon
in the 1830s, tonic in 1858. In 1886 John Pemberton, a pharmacist in Atlanta, Georgia, invented
Coca-Cola, the first cola drink (Pietka et al., 2017)
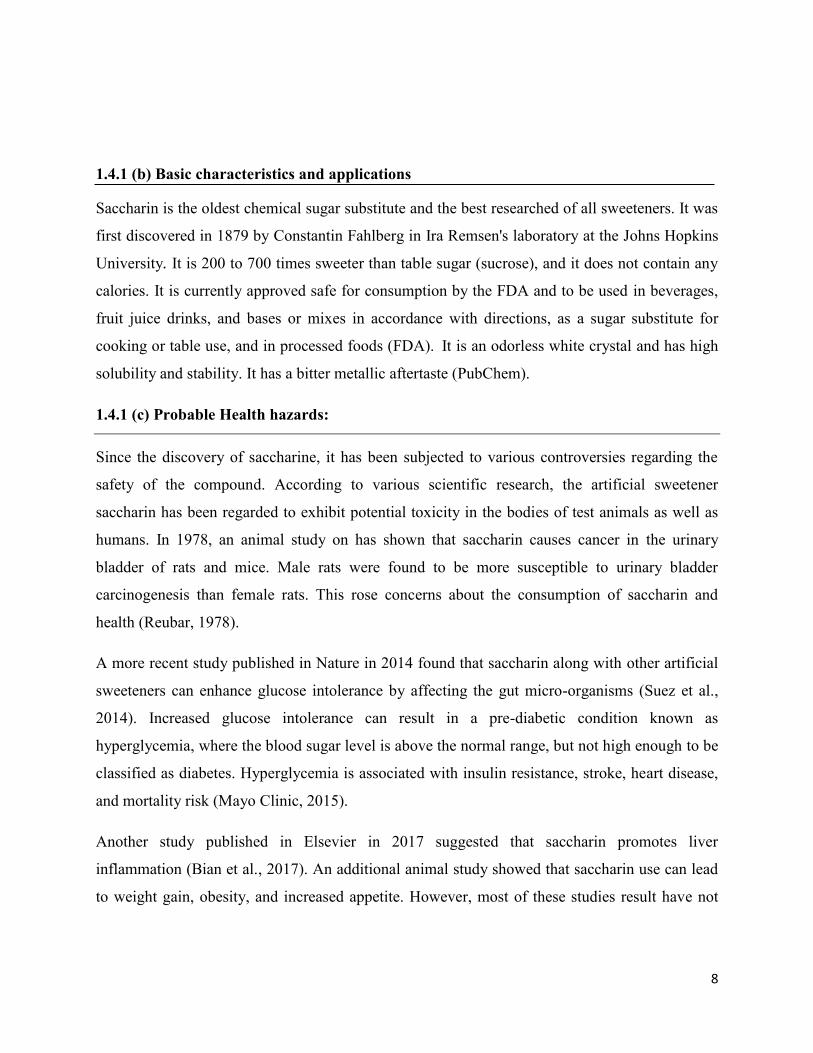
1.4 Artificial Sweeteners
The fondness of humans for sweet foods is congenital: studies have proved a preference for
sweet-tasting nutrition in newborns. Therefore, mankind has always added sweet substances to
their food. The first recorded sweetener was honey, which was used in the ancient cultures of
Greece and China (Maone et al., 1990). Honey was later replaced by saccharose, the common
sugar, which was originally obtained from sugar cane (Bright, 1999).
Artificial high-intensity sweeteners form an important class of food additives which are
commonly used in the food, beverage, confectionery and pharmaceutical industry. They provide
the sensation of sweetness but a common trend is to use sweetener blends because some
disseminate after tastes which is not desirable. As a result, the food and beverage industry uses a
blend to overcome this. A common example of such a mixture is saccharine: cyclamate (1:10)
A cyclamate stock solution (1 mg/ml) was prepared by weighing exactly 20 mg of the powdered
cyclamate in a conical flask and mixed it thoroughly by adding 20 ml of distilled water. 0.1M of
sulphuric acid was prepared by adding 5 ml of 98% sulphuric acid to 45 ml of distilled water.
Rhodamine B solution was prepared, at the beginning of each working week, by dissolving 10
mg of RhB in 104.2 ml of chlorofom as an extraction solvent. Emulsification and extraction of
cyclamate was carried out in a 40 kHz ultrasonic water bath for about 20 seconds and then
allowing it to reach equilibrium. After an equilibrium time of 3 minutes, the emulsion was
disrupted by centrifugation at 3500 rpm for 5 minutes. This made the formation of colored
organic phase at the bottom of the falcon tube. One hundred microliter of the settled sediment
was pipetted out with a micropipette and simultaneously, 3 ml of chloroform was added to the
quartz microcell. It was sealed with the cap and readings were taken immediately at 560 nm.
The determination was carried out in duplicate for each dilution.
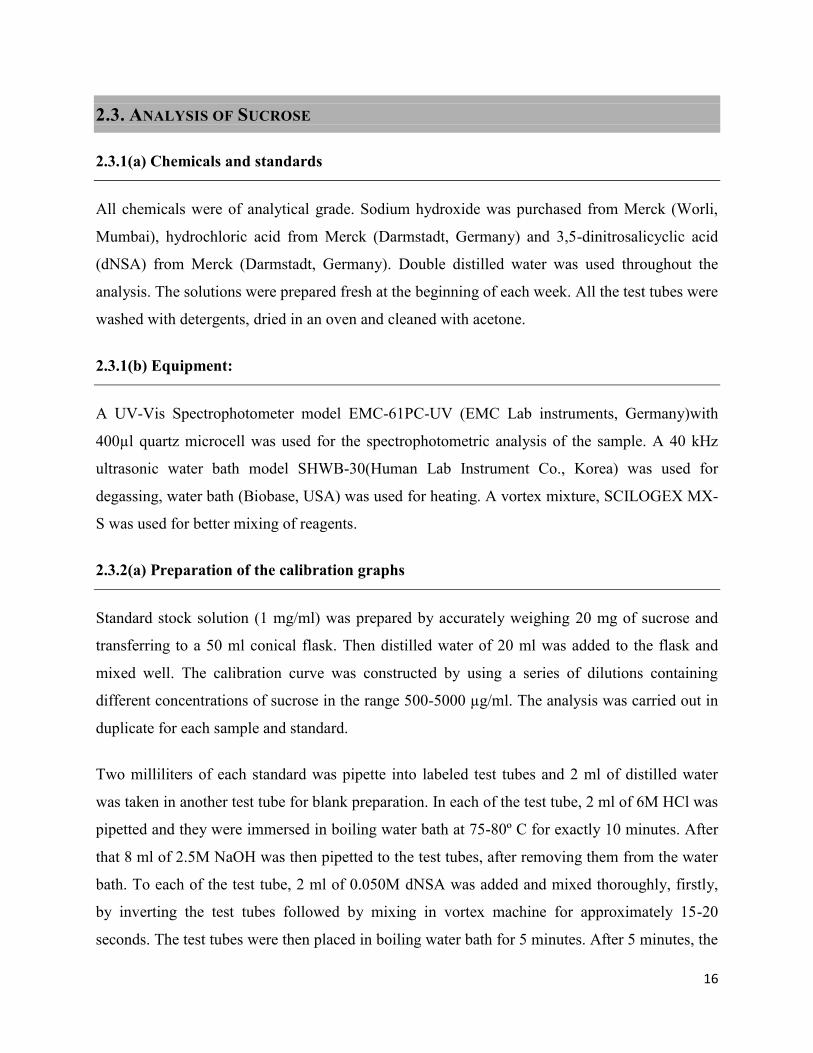
Figure 8: After ultrasonication, the oil in water emulsion
After ultrasonication, an oil-in-water
emulsion is seen
20
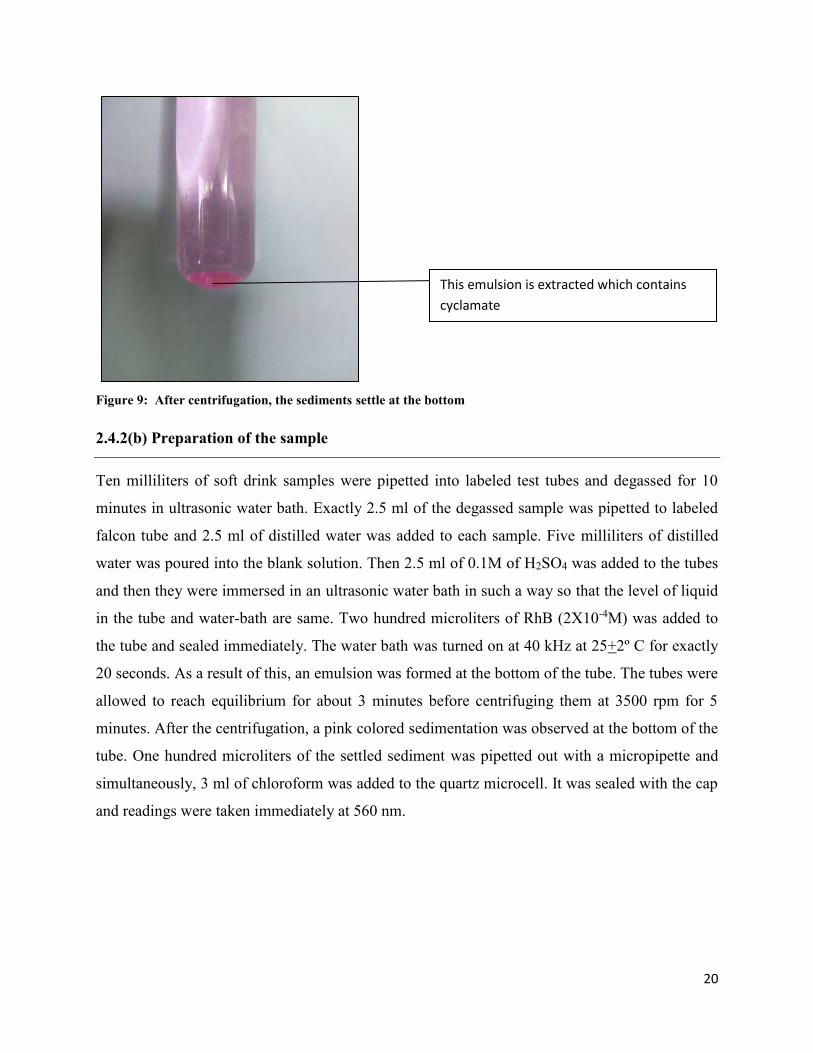
Figure 9: After centrifugation, the sediments settle at the bottom
2.4.2(b) Preparation of the sample
Ten milliliters of soft drink samples were pipetted into labeled test tubes and degassed for 10
minutes in ultrasonic water bath. Exactly 2.5 ml of the degassed sample was pipetted to labeled
falcon tube and 2.5 ml of distilled water was added to each sample. Five milliliters of distilled
water was poured into the blank solution. Then 2.5 ml of 0.1M of H2SO4 was added to the tubes
and then they were immersed in an ultrasonic water bath in such a way so that the level of liquid
in the tube and water-bath are same. Two hundred microliters of RhB (2X10⁻⁴M) was added to
the tube and sealed immediately. The water bath was turned on at 40 kHz at 25+2º C for exactly
20 seconds. As a result of this, an emulsion was formed at the bottom of the tube. The tubes were
allowed to reach equilibrium for about 3 minutes before centrifuging them at 3500 rpm for 5
minutes. After the centrifugation, a pink colored sedimentation was observed at the bottom of the
tube. One hundred microliters of the settled sediment was pipetted out with a micropipette and
simultaneously, 3 ml of chloroform was added to the quartz microcell. It was sealed with the cap
and readings were taken immediately at 560 nm.
This emulsion is extracted which contains
cyclamate
21
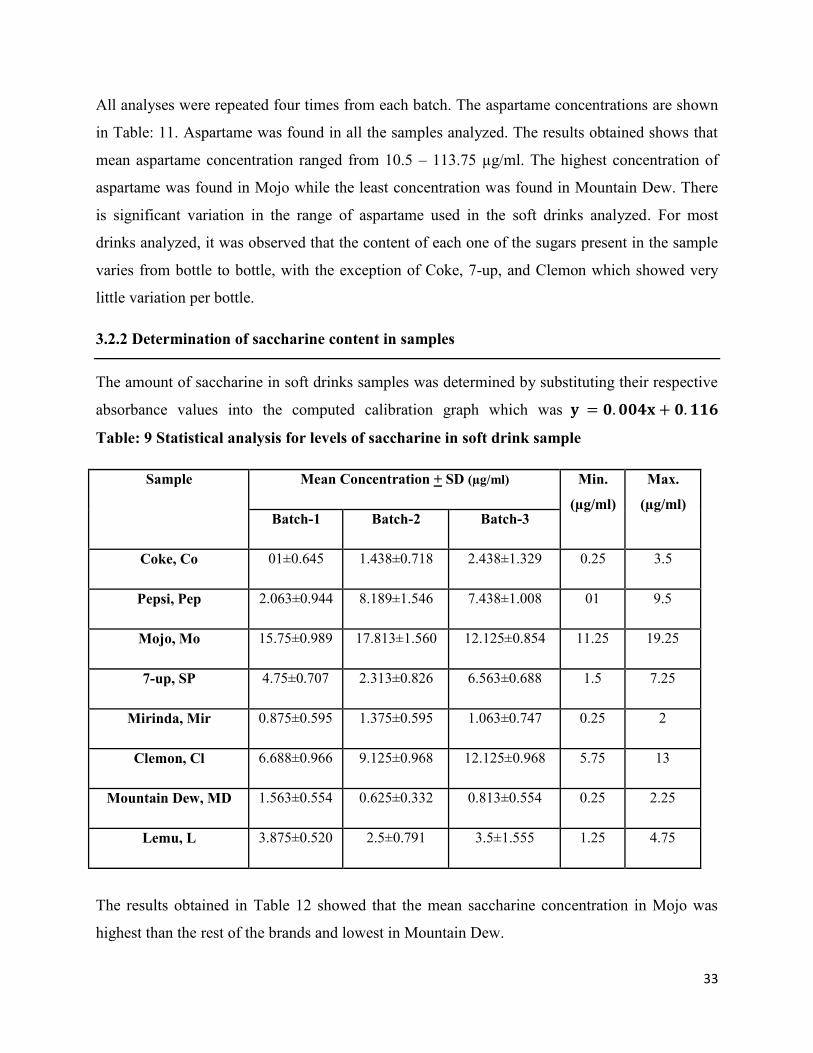
2.5 Analysis of Saccharin
The analysis procedure for saccharin and its determination in the sample and to plot standard
curve was based on the method described by Sunita B. Mathew, A.K.Pillai and V.K.Gupta
(2006).
2.5.1(a) Chemicals and standards
All the chemicals used for the determination was of analytical grade and distilled water was used
throughout the procedure. The chemicals were prepared freshly at the beginning of the working
week. The analysis of the samples were carried out in duplicate for each standard and sample.
For the analysis of the sample, the chemicals H2SO4, sodium hydrogen carbonate, HCl were
purchased from Merck (Darmstadt, Germany). Diethyl ether, potassium bromide, and Bromine
water were purchased from Merck (Worli, Mumbai). Isoamyl alcohol which was used as the
extraction solvent was purchased from aMRESCO® (Solon, Ohio). Formic acid and cetyl
trimethyl ammonium bromide was purchased. Saccharin standard was purchased from Benzo
Chemical Industries (Mumbai)
2.5.1(b) Equipment:
A UV-Vis Spectrophotometer model EMC-61PC-UV (EMC Lab instruments, Germany) with
400 µl quartz microcell was used for the spectrophotometric analysis. A 40 kHz ultrasonic water
bath model SHWB-30(Human Lab Instrument Co., Korea) was used for degassing. The addition
of bromine water and rest of the steps associated with the preparation of sample and standard
was carried out in a fume hood from LabTech (Calhoun Road, New Berlin).
2.5.2(a) Preparation of standard curve:
Saccharin stock solution was prepared by measuring 50 mg of saccharin powder and mixing it in
50 ml of distilled water and a 1 mg/ml of solution was obtained. The calibration curve was
produced by using a series of dilutions containing different levels (2-34 µl/ml) of saccharin.
Five milliliters of the prepared solution was pipetted into the labeled conical flask and 0.5 ml of
the saturated solution of bromine water was added to it and the flask was swirled continuously
22
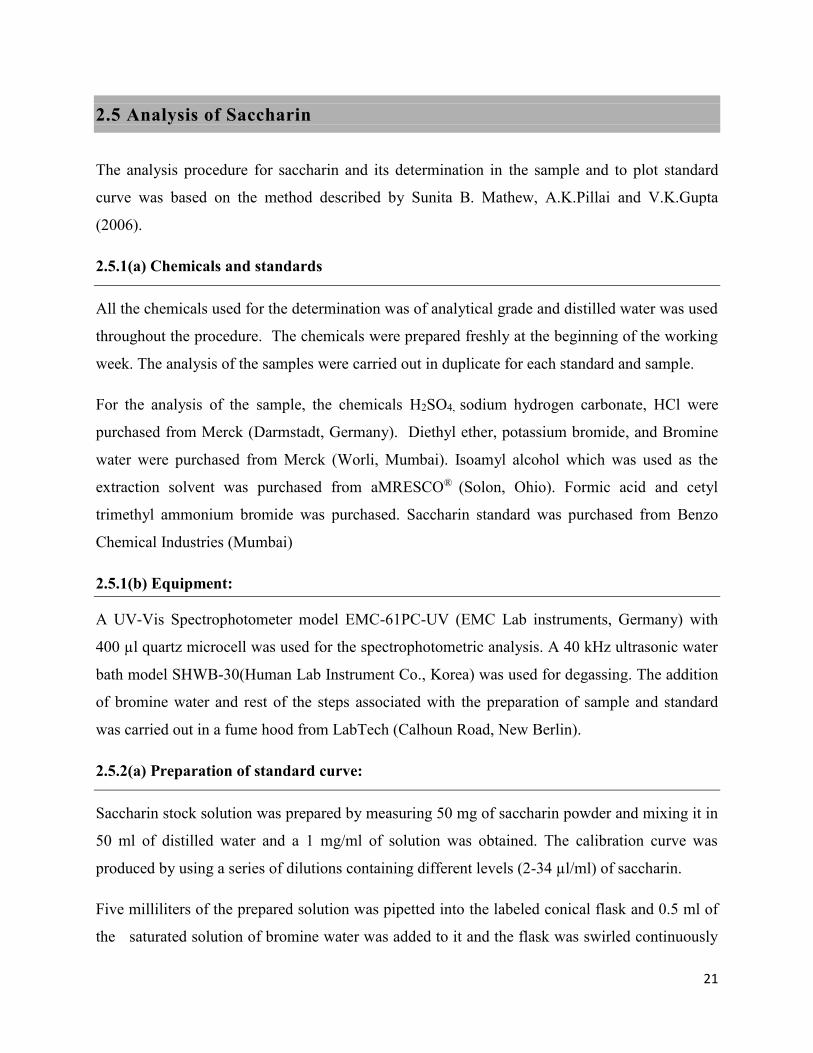
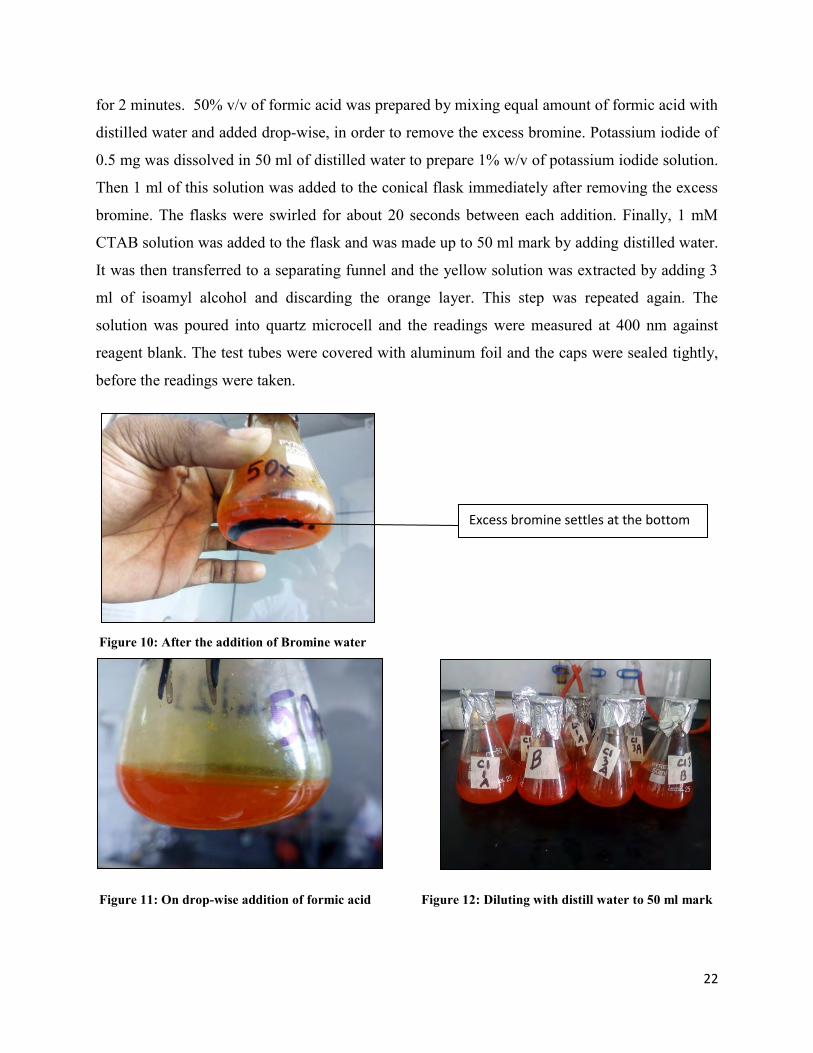
for 2 minutes. 50% v/v of formic acid was prepared by mixing equal amount of formic acid with
distilled water and added drop-wise, in order to remove the excess bromine. Potassium iodide of
0.5 mg was dissolved in 50 ml of distilled water to prepare 1% w/v of potassium iodide solution.
Then 1 ml of this solution was added to the conical flask immediately after removing the excess
bromine. The flasks were swirled for about 20 seconds between each addition. Finally, 1 mM
CTAB solution was added to the flask and was made up to 50 ml mark by adding distilled water.
It was then transferred to a separating funnel and the yellow solution was extracted by adding 3
ml of isoamyl alcohol and discarding the orange layer. This step was repeated again. The
solution was poured into quartz microcell and the readings were measured at 400 nm against
reagent blank. The test tubes were covered with aluminum foil and the caps were sealed tightly,
before the readings were taken.
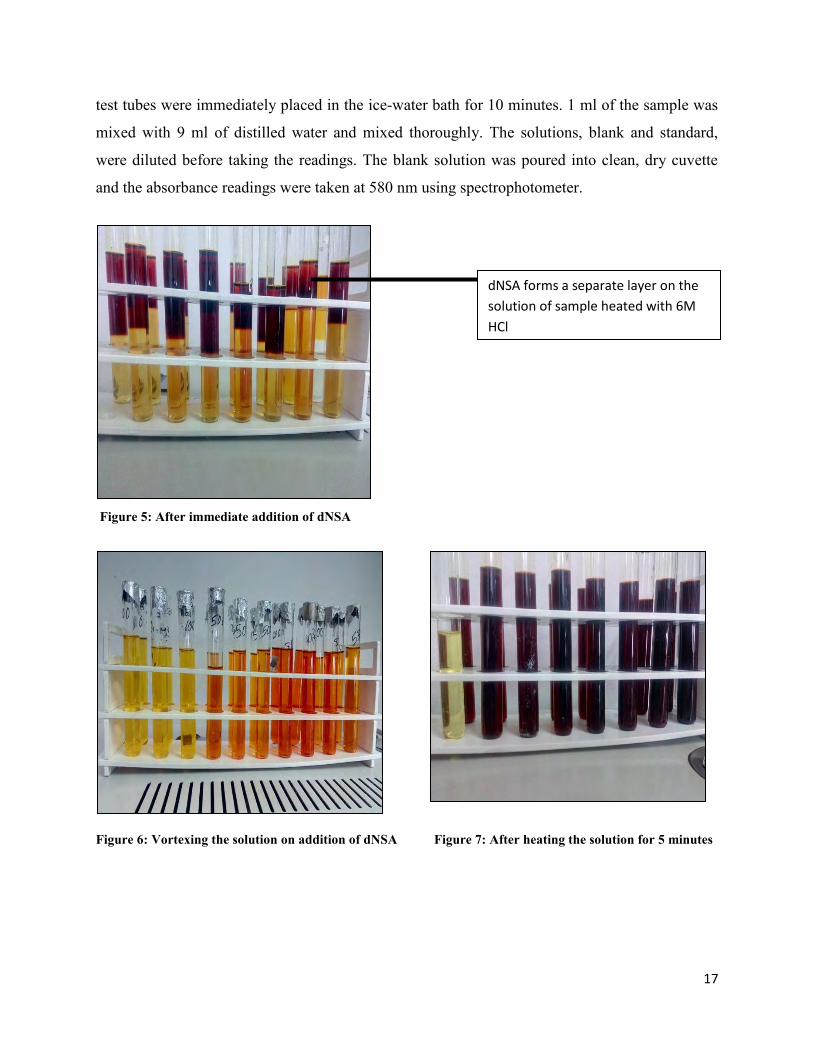
Figure 10: After the addition of Bromine water
Figure 11: On drop-wise addition of formic acid Figure 12: Diluting with distill water to 50 ml mark
Excess bromine settles at the bottom
23
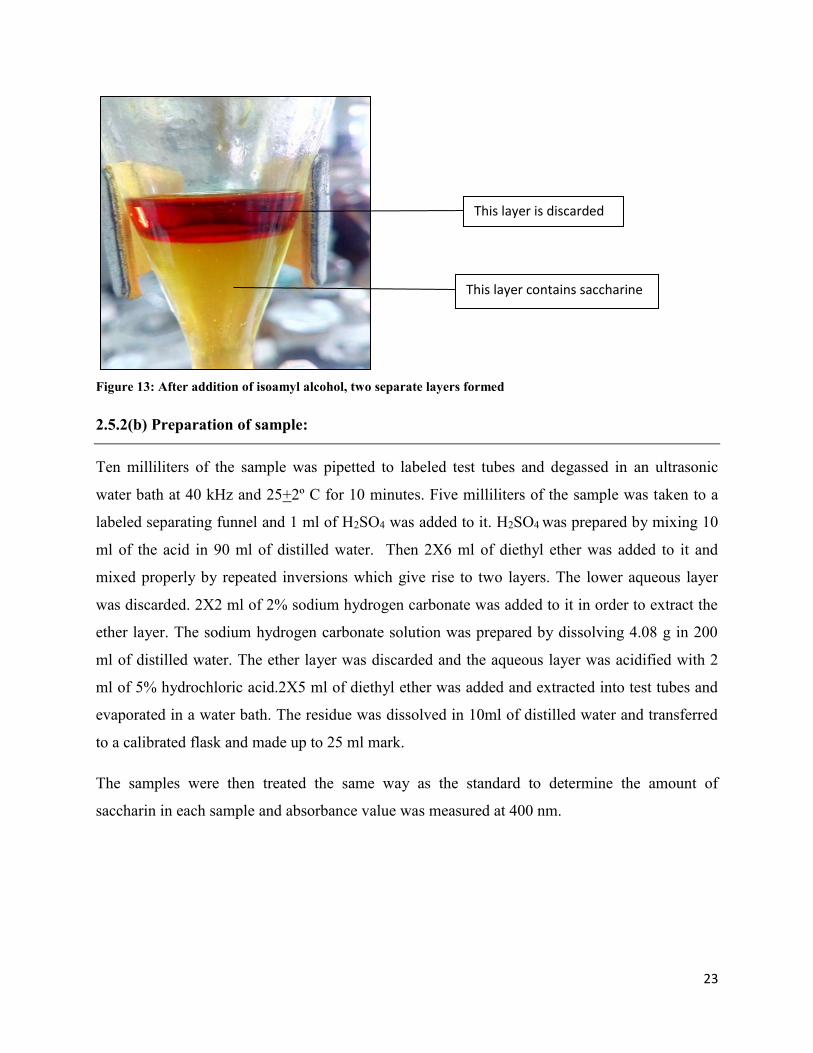
Figure 13: After addition of isoamyl alcohol, two separate layers formed
2.5.2(b) Preparation of sample:
Ten milliliters of the sample was pipetted to labeled test tubes and degassed in an ultrasonic
water bath at 40 kHz and 25+2º C for 10 minutes. Five milliliters of the sample was taken to a
labeled separating funnel and 1 ml of H2SO4 was added to it. H2SO4 was prepared by mixing 10
ml of the acid in 90 ml of distilled water. Then 2X6 ml of diethyl ether was added to it and
mixed properly by repeated inversions which give rise to two layers. The lower aqueous layer
was discarded. 2X2 ml of 2% sodium hydrogen carbonate was added to it in order to extract the
ether layer. The sodium hydrogen carbonate solution was prepared by dissolving 4.08 g in 200
ml of distilled water. The ether layer was discarded and the aqueous layer was acidified with 2
ml of 5% hydrochloric acid.2X5 ml of diethyl ether was added and extracted into test tubes and
evaporated in a water bath. The residue was dissolved in 10ml of distilled water and transferred
to a calibrated flask and made up to 25 ml mark.
The samples were then treated the same way as the standard to determine the amount of
saccharin in each sample and absorbance value was measured at 400 nm.
This layer is discarded
This layer contains saccharine
24
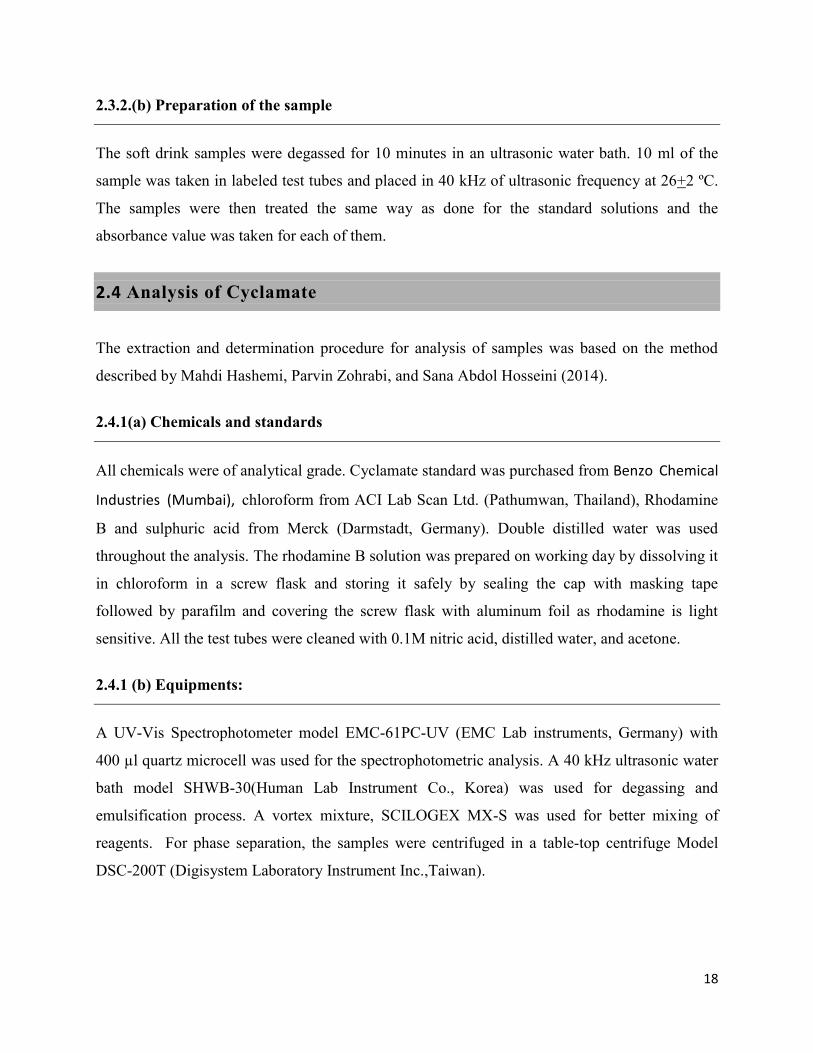
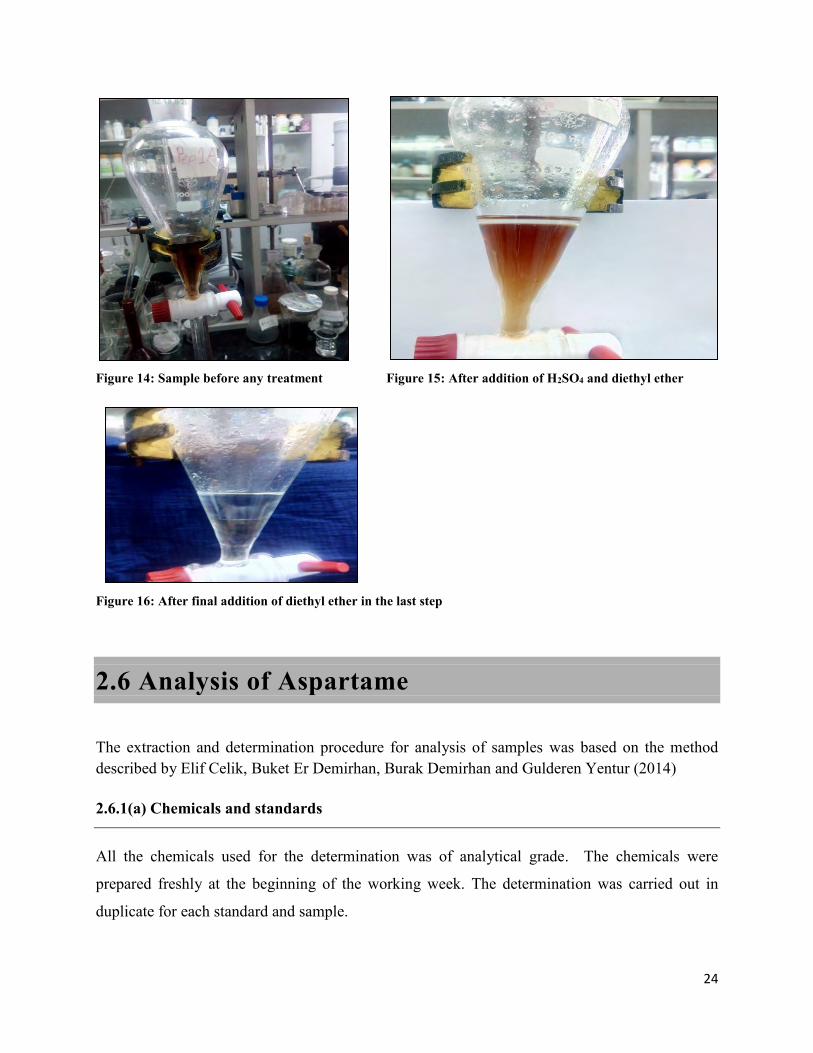
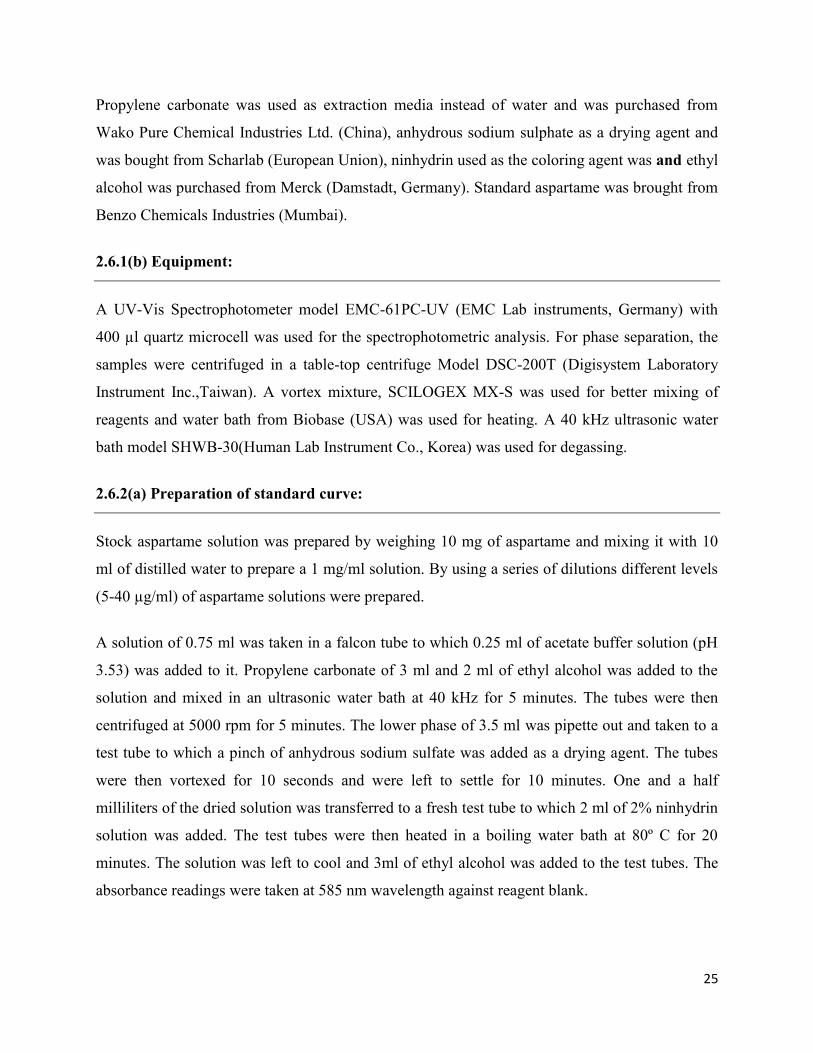
Figure 14: Sample before any treatment Figure 15: After addition of H2SO4 and diethyl ether
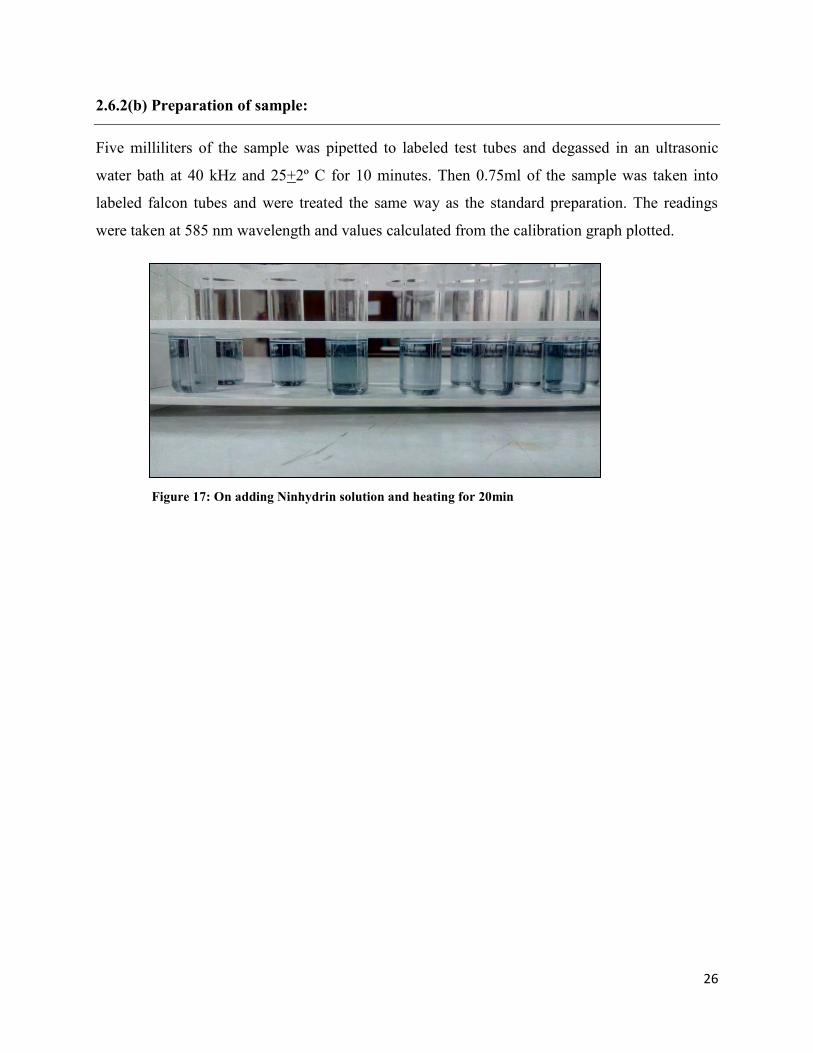
Figure 16: After final addition of diethyl ether in the last step
2.6 Analysis of Aspartame
The extraction and determination procedure for analysis of samples was based on the method described by Elif Celik, Buket Er Demirhan, Burak Demirhan and Gulderen Yentur (2014)
2.6.1(a) Chemicals and standards
All the chemicals used for the determination was of analytical grade. The chemicals were
prepared freshly at the beginning of the working week. The determination was carried out in
duplicate for each standard and sample.
25
Propylene carbonate was used as extraction media instead of water and was purchased from
Wako Pure Chemical Industries Ltd. (China), anhydrous sodium sulphate as a drying agent and
was bought from Scharlab (European Union), ninhydrin used as the coloring agent was and ethyl
alcohol was purchased from Merck (Damstadt, Germany). Standard aspartame was brought from
Benzo Chemicals Industries (Mumbai).
2.6.1(b) Equipment:
A UV-Vis Spectrophotometer model EMC-61PC-UV (EMC Lab instruments, Germany) with
400 µl quartz microcell was used for the spectrophotometric analysis. For phase separation, the
samples were centrifuged in a table-top centrifuge Model DSC-200T (Digisystem Laboratory
Instrument Inc.,Taiwan). A vortex mixture, SCILOGEX MX-S was used for better mixing of
reagents and water bath from Biobase (USA) was used for heating. A 40 kHz ultrasonic water
bath model SHWB-30(Human Lab Instrument Co., Korea) was used for degassing.
2.6.2(a) Preparation of standard curve:
Stock aspartame solution was prepared by weighing 10 mg of aspartame and mixing it with 10
ml of distilled water to prepare a 1 mg/ml solution. By using a series of dilutions different levels
(5-40 µg/ml) of aspartame solutions were prepared.
A solution of 0.75 ml was taken in a falcon tube to which 0.25 ml of acetate buffer solution (pH
3.53) was added to it. Propylene carbonate of 3 ml and 2 ml of ethyl alcohol was added to the
solution and mixed in an ultrasonic water bath at 40 kHz for 5 minutes. The tubes were then
centrifuged at 5000 rpm for 5 minutes. The lower phase of 3.5 ml was pipette out and taken to a
test tube to which a pinch of anhydrous sodium sulfate was added as a drying agent. The tubes
were then vortexed for 10 seconds and were left to settle for 10 minutes. One and a half
milliliters of the dried solution was transferred to a fresh test tube to which 2 ml of 2% ninhydrin
solution was added. The test tubes were then heated in a boiling water bath at 80º C for 20
minutes. The solution was left to cool and 3ml of ethyl alcohol was added to the test tubes. The
absorbance readings were taken at 585 nm wavelength against reagent blank.
26
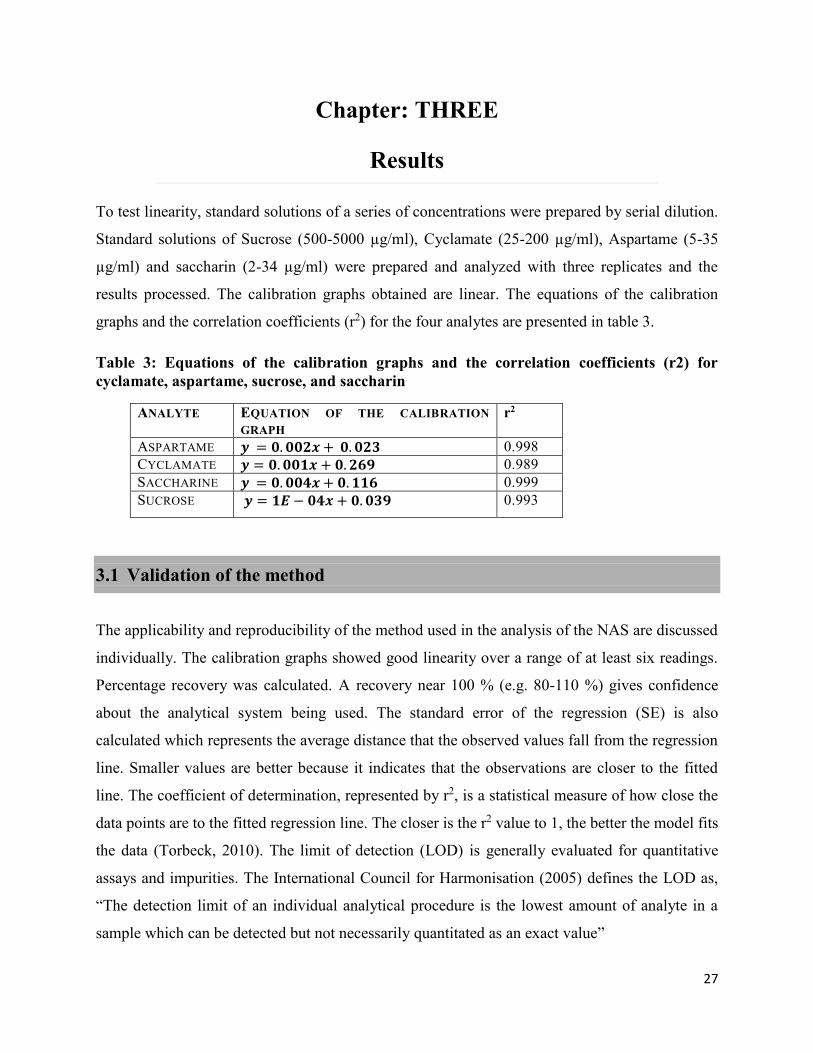
2.6.2(b) Preparation of sample:
Five milliliters of the sample was pipetted to labeled test tubes and degassed in an ultrasonic
water bath at 40 kHz and 25+2º C for 10 minutes. Then 0.75ml of the sample was taken into
labeled falcon tubes and were treated the same way as the standard preparation. The readings
were taken at 585 nm wavelength and values calculated from the calibration graph plotted.
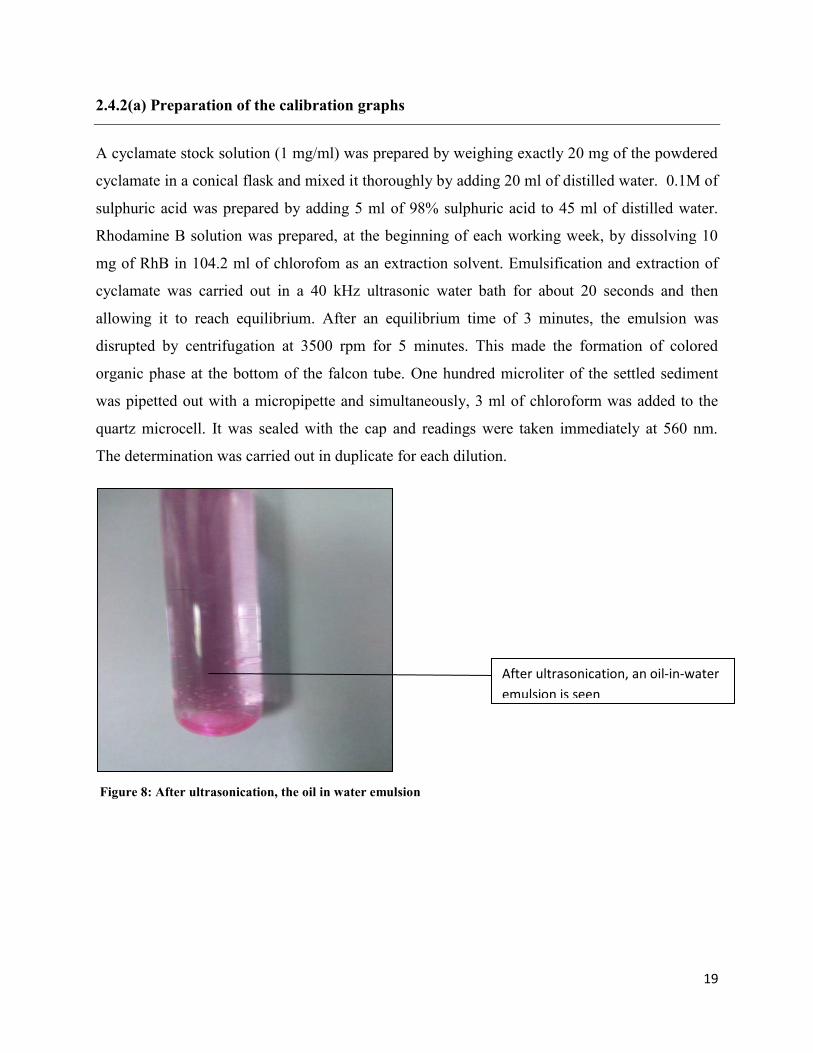
Figure 17: On adding Ninhydrin solution and heating for 20min
27
Chapter: THREE
Results
To test linearity, standard solutions of a series of concentrations were prepared by serial dilution.
Standard solutions of Sucrose (500-5000 µg/ml), Cyclamate (25-200 µg/ml), Aspartame (5-35
µg/ml) and saccharin (2-34 µg/ml) were prepared and analyzed with three replicates and the
results processed. The calibration graphs obtained are linear. The equations of the calibration
graphs and the correlation coefficients (r2) for the four analytes are presented in table 3.
Table 3: Equations of the calibration graphs and the correlation coefficients (r2) for cyclamate, aspartame, sucrose, and saccharin
The applicability and reproducibility of the method used in the analysis of the NAS are discussed
individually. The calibration graphs showed good linearity over a range of at least six readings.
Percentage recovery was calculated. A recovery near 100 % (e.g. 80-110 %) gives confidence
about the analytical system being used. The standard error of the regression (SE) is also
calculated which represents the average distance that the observed values fall from the regression
line. Smaller values are better because it indicates that the observations are closer to the fitted
line. The coefficient of determination, represented by r2, is a statistical measure of how close the
data points are to the fitted regression line. The closer is the r2 value to 1, the better the model fits
the data (Torbeck, 2010). The limit of detection (LOD) is generally evaluated for quantitative
assays and impurities. The International Council for Harmonisation (2005) defines the LOD as,
“The detection limit of an individual analytical procedure is the lowest amount of analyte in a
sample which can be detected but not necessarily quantitated as an exact value”
28
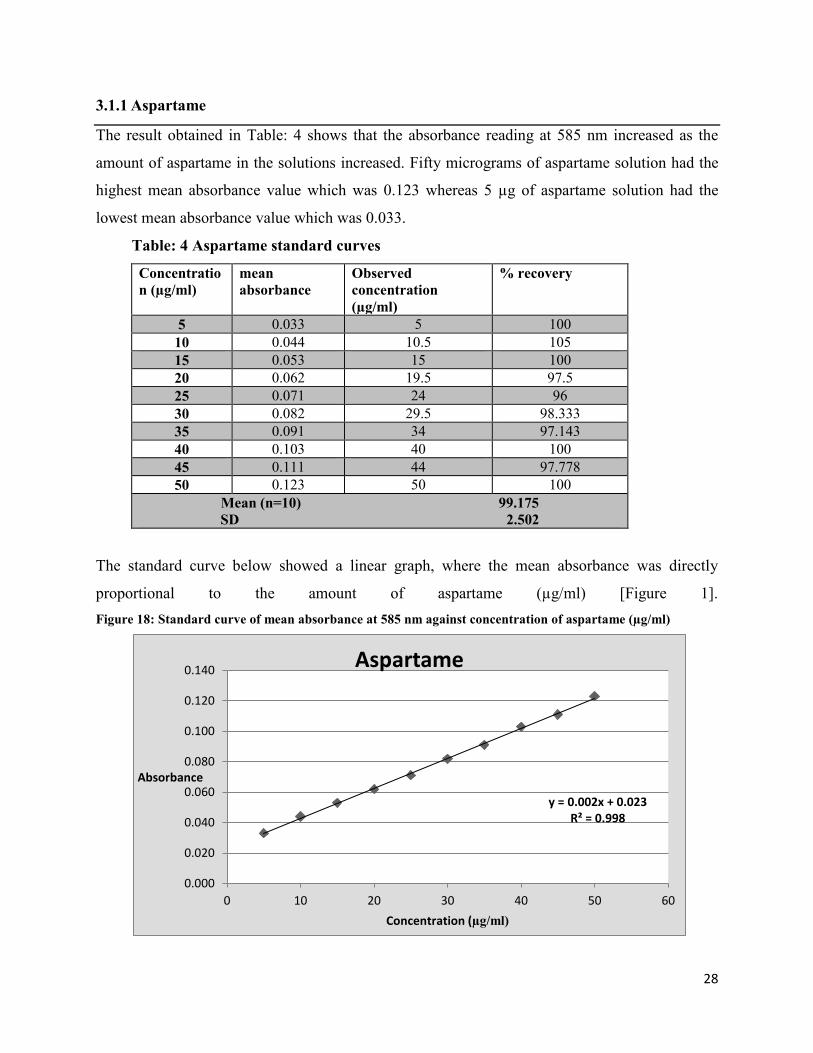
3.1.1 Aspartame
The result obtained in Table: 4 shows that the absorbance reading at 585 nm increased as the
amount of aspartame in the solutions increased. Fifty micrograms of aspartame solution had the
highest mean absorbance value which was 0.123 whereas 5 µg of aspartame solution had the
lowest mean absorbance value which was 0.033.
Table: 4 Aspartame standard curves
Concentration (µg/ml)
mean absorbance
Observed concentration (µg/ml)
% recovery
5 0.033 5 100
10 0.044 10.5 105
15 0.053 15 100
20 0.062 19.5 97.5
25 0.071 24 96
30 0.082 29.5 98.333
35 0.091 34 97.143
40 0.103 40 100
45 0.111 44 97.778
50 0.123 50 100
Mean (n=10) 99.175
SD 2.502
The standard curve below showed a linear graph, where the mean absorbance was directly
proportional to the amount of aspartame (µg/ml) [Figure 1]. Figure 18: Standard curve of mean absorbance at 585 nm against concentration of aspartame (µg/ml)
y = 0.002x + 0.023R² = 0.998
0.000
0.020
0.040
0.060
0.080
0.100
0.120
0.140
0 10 20 30 40 50 60
Absorbance
Concentration (µg/ml)
Aspartame
29
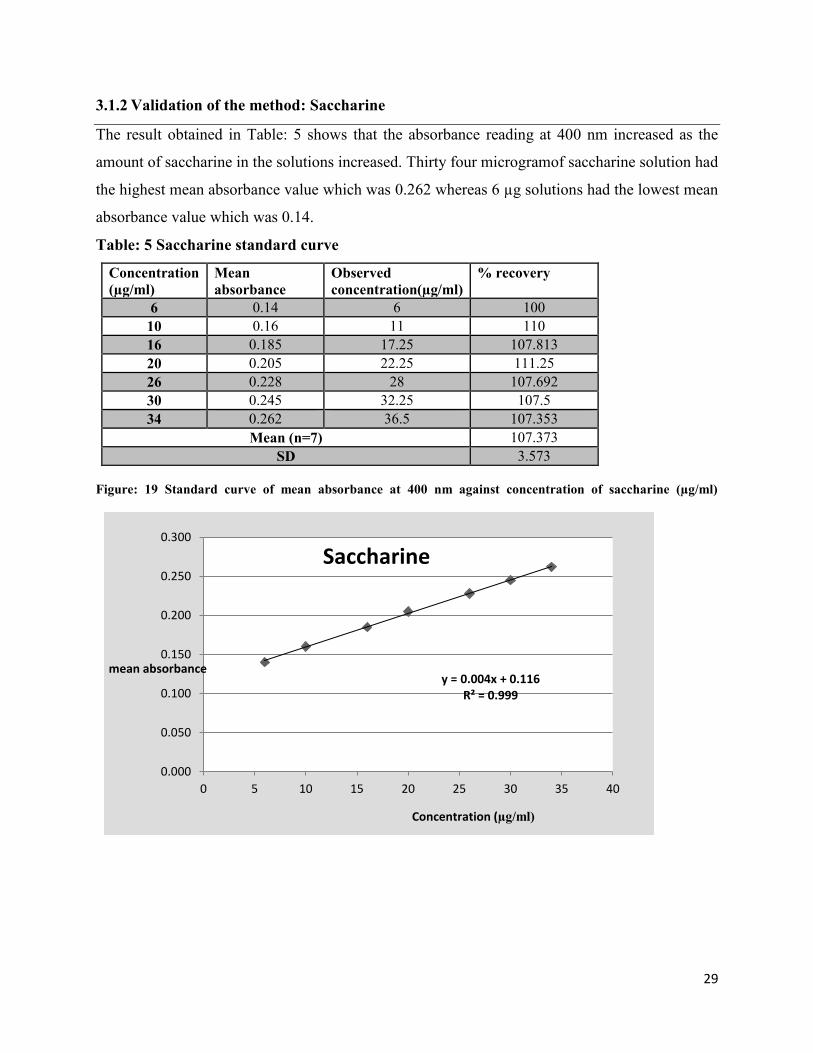
3.1.2 Validation of the method: Saccharine
The result obtained in Table: 5 shows that the absorbance reading at 400 nm increased as the
amount of saccharine in the solutions increased. Thirty four microgramof saccharine solution had
the highest mean absorbance value which was 0.262 whereas 6 µg solutions had the lowest mean
absorbance value which was 0.14.
Table: 5 Saccharine standard curve
Concentration (µg/ml)
Mean absorbance
Observed concentration(µg/ml)
% recovery
6 0.14 6 100
10 0.16 11 110
16 0.185 17.25 107.813
20 0.205 22.25 111.25
26 0.228 28 107.692
30 0.245 32.25 107.5
34 0.262 36.5 107.353
Mean (n=7) 107.373
SD 3.573
Figure: 19 Standard curve of mean absorbance at 400 nm against concentration of saccharine (µg/ml)
y = 0.004x + 0.116R² = 0.999
0.000
0.050
0.100
0.150
0.200
0.250
0.300
0 5 10 15 20 25 30 35 40
mean absorbance
Concentration (µg/ml)
Saccharine
30
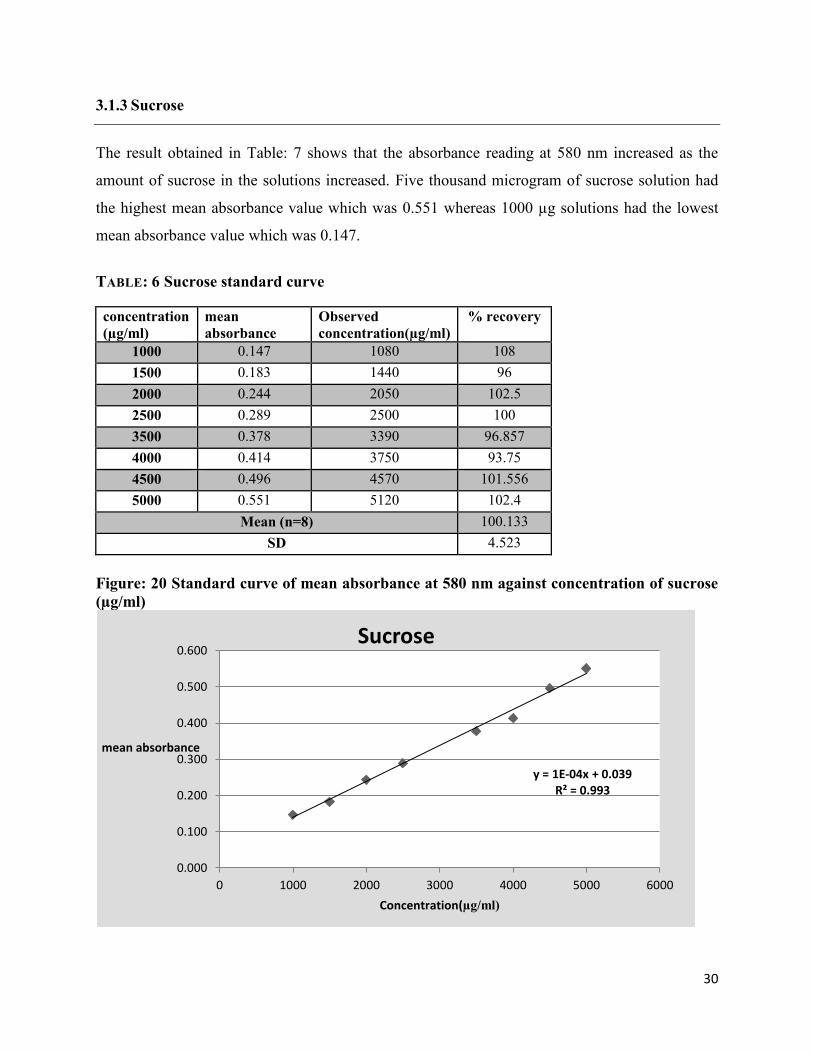
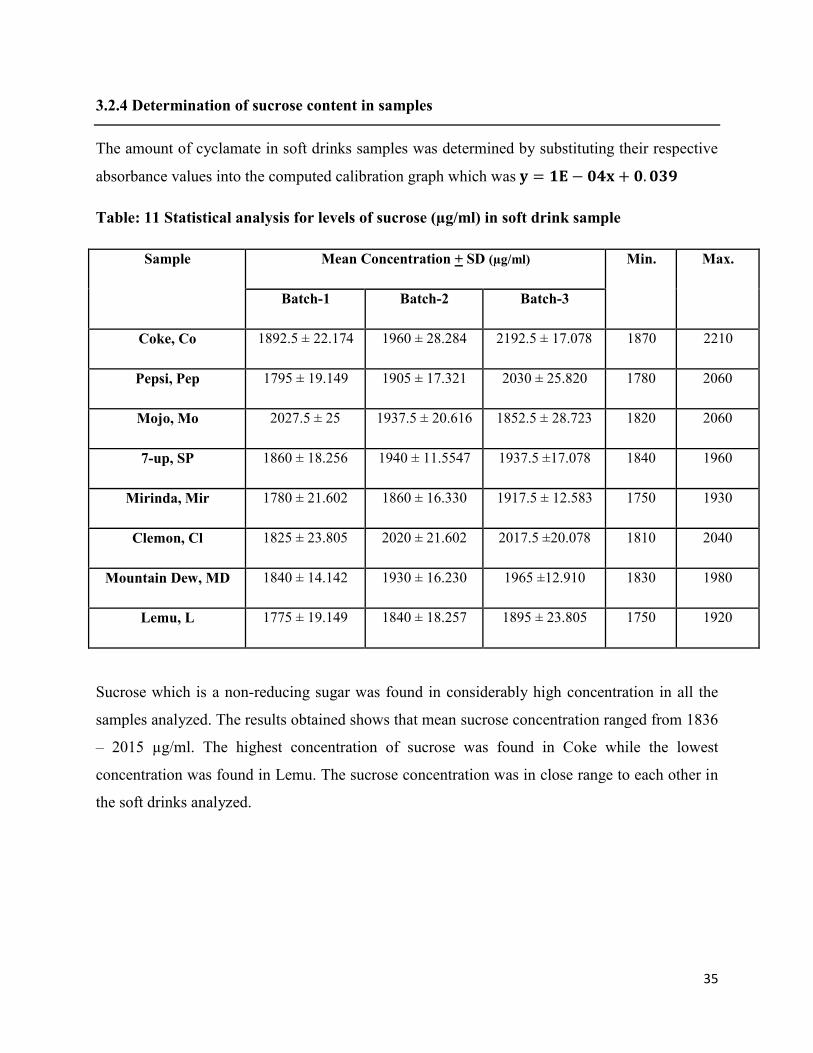
3.1.3 Sucrose
The result obtained in Table: 7 shows that the absorbance reading at 580 nm increased as the
amount of sucrose in the solutions increased. Five thousand microgram of sucrose solution had
the highest mean absorbance value which was 0.551 whereas 1000 µg solutions had the lowest
mean absorbance value which was 0.147.
TABLE: 6 Sucrose standard curve
concentration (µg/ml)
mean absorbance
Observed concentration(µg/ml)
% recovery
1000 0.147 1080 108
1500 0.183 1440 96
2000 0.244 2050 102.5
2500 0.289 2500 100
3500 0.378 3390 96.857
4000 0.414 3750 93.75
4500 0.496 4570 101.556
5000 0.551 5120 102.4
Mean (n=8) 100.133
SD 4.523
Figure: 20 Standard curve of mean absorbance at 580 nm against concentration of sucrose (µg/ml)
y = 1E-04x + 0.039R² = 0.993
0.000
0.100
0.200
0.300
0.400
0.500
0.600
0 1000 2000 3000 4000 5000 6000
mean absorbance
Concentration(µg/ml)
Sucrose
31
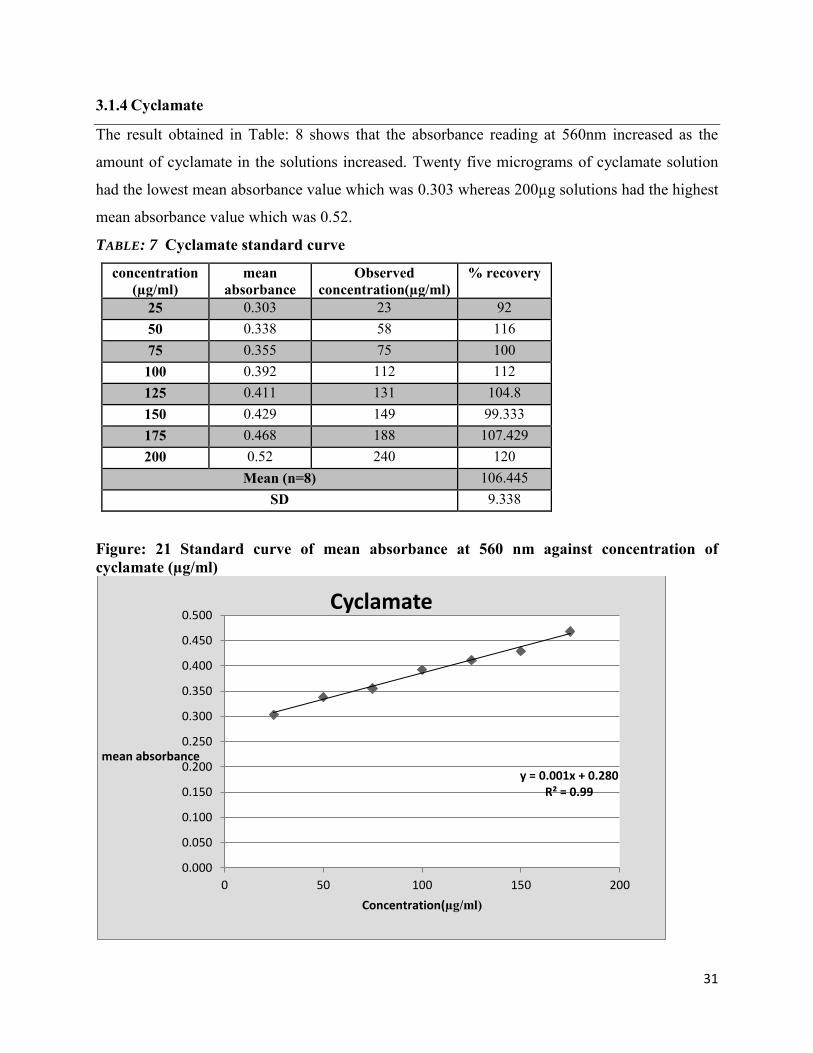
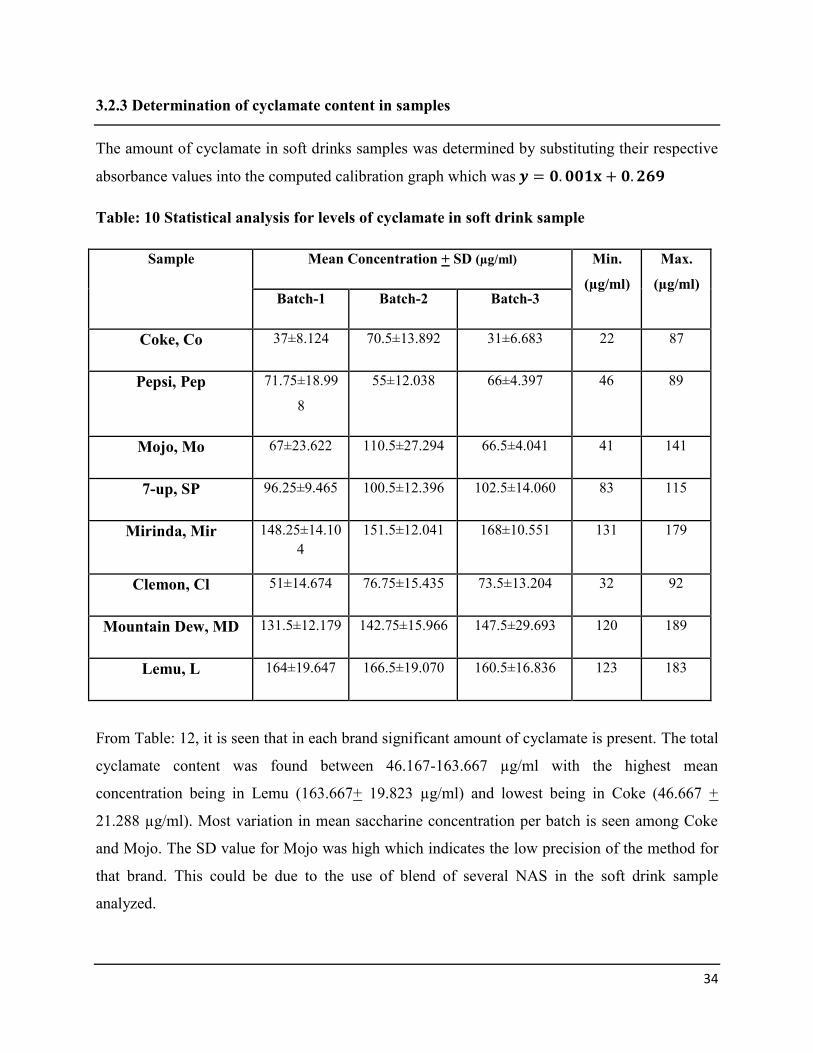
3.1.4 Cyclamate
The result obtained in Table: 8 shows that the absorbance reading at 560nm increased as the
amount of cyclamate in the solutions increased. Twenty five micrograms of cyclamate solution
had the lowest mean absorbance value which was 0.303 whereas 200µg solutions had the highest
mean absorbance value which was 0.52.
TABLE: 7 Cyclamate standard curve
concentration (µg/ml)
mean absorbance
Observed concentration(µg/ml)
% recovery
25 0.303 23 92
50 0.338 58 116
75 0.355 75 100
100 0.392 112 112
125 0.411 131 104.8
150 0.429 149 99.333
175 0.468 188 107.429
200 0.52 240 120
Mean (n=8) 106.445
SD 9.338
Figure: 21 Standard curve of mean absorbance at 560 nm against concentration of cyclamate (µg/ml)
y = 0.001x + 0.280R² = 0.99
0.000
0.050
0.100
0.150
0.200
0.250
0.300
0.350
0.400
0.450
0.500
0 50 100 150 200
mean absorbance
Concentration(µg/ml)
Cyclamate
32
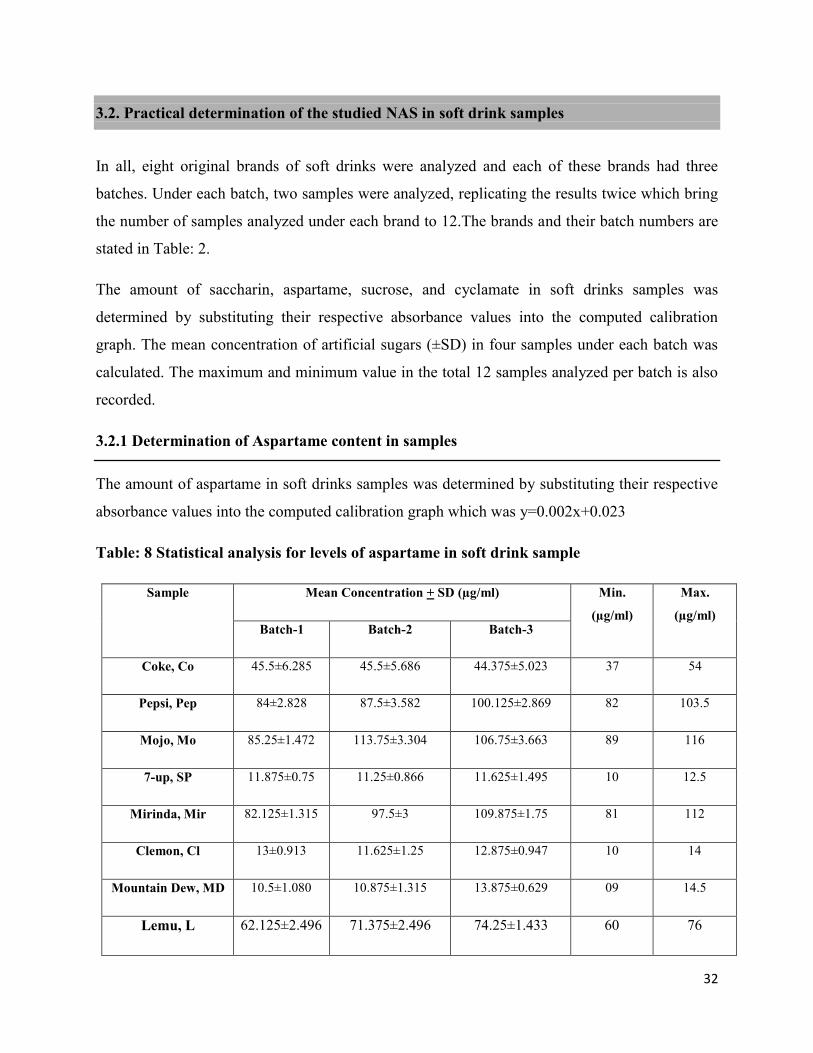
3.2. Practical determination of the studied NAS in soft drink samples
In all, eight original brands of soft drinks were analyzed and each of these brands had three
batches. Under each batch, two samples were analyzed, replicating the results twice which bring
the number of samples analyzed under each brand to 12.The brands and their batch numbers are
stated in Table: 2.
The amount of saccharin, aspartame, sucrose, and cyclamate in soft drinks samples was
determined by substituting their respective absorbance values into the computed calibration
graph. The mean concentration of artificial sugars (±SD) in four samples under each batch was
calculated. The maximum and minimum value in the total 12 samples analyzed per batch is also
recorded.
3.2.1 Determination of Aspartame content in samples
The amount of aspartame in soft drinks samples was determined by substituting their respective
absorbance values into the computed calibration graph which was y=0.002x+0.023
Table: 8 Statistical analysis for levels of aspartame in soft drink sample
Sample Mean Concentration + SD (µg/ml) Min.
(µg/ml)
Max.
(µg/ml) Batch-1 Batch-2 Batch-3
Coke, Co 45.5±6.285 45.5±5.686 44.375±5.023 37 54
Pepsi, Pep 84±2.828 87.5±3.582 100.125±2.869 82 103.5
Mojo, Mo 85.25±1.472 113.75±3.304 106.75±3.663 89 116