Quantitative determination of the absorption spectra of chromophores in strongly scattering media: a light-emitting-diode based technique Sergio Fantini, Maria and Enrico Gratton Angela Franceschini, Joshua B. Fishkin, Beniamino Barbieri, The absorption and scattering coefficient of a macroscopicallyhomogeneous strongly scattering medium (lipid emulsion) containing Methylene Blue is quantitatively measured in the spectral range from 620 to 700 nm. We conduct the measurements in the frequency domain by using a light-emitting diode (LED) whose intensity is modulated at a frequency of 60 MHz. We derive an analytical expression for the absorption and scattering coefficients that is based on a two-distance measurement technique. A comparison with other measurement protocols such as measurement at two modulation frequencies shows that the two-distance method gives a better determination of the scattering and absorption coefficients. This study highlights the efficiency and ease of use of the LED technique, which lends itself to in vivo spectroscopy of biological tissues. Key Words: Frequency domain, absorption and scattering coefficients, diffusion approximation, strongly scattering medium, biologicaltissue, photon migration. 1. Introduction The quantitative determination of the absorption spectrum of a substance dissolved in a highly scatter- ing medium is not a trivial problem and is of particu- lar interest in a number of medical applications. For example, a quantitative measurement of the absorp- tion coefficient in tissues can detect the presence and concentration of certain exogenous or endogenous chromophores. The former may be drugs whose distribution and metabolism in tissues can then be dynamically monitored; examples include chemical markers for tumors such as Indocyanine Green and hematoporphyrin derivative,' or photosensitizing agents for photodynamic therapy. 2 In the near- infrared region the endogenous chromophores are When this research was performed, B. Barbieri was with ISS, Inc., 2604 North Mattis Avenue, Champaign, Illinois 61821, and S. Fantini and M. A. Franceschini were with the Istituto di Elettronica Quantistica, Consiglio Nazionale delle Ricerche, Via Panciatichi 56/30, 50127 Firenze, Italy. The other authors were with the Laboratory for Fluorescence Dynamics, Department of Physics, University of Illinois at Urbana-Champaign, 1110 West Green Street, Urbana, Illinois 61801-3080. Received 6 July 1993; revised manuscript received 3 January 1994. 0003-6935/94/225204-10$06.00/0. 3 1994 Optical Society of America. typically heme proteins such as hemoglobin, whose absorption characteristics depend on the oxygenation state that is affected by metabolic processes, 3 cyto- chrome aa 3 in both reduced and oxidized form, mela- nin, and bilirubin. Furthermore, knowledge of the optical properties of tissues can provide real-time information on the fluence distribution of light dur- ing therapeutic procedures such as photodynamic therapy 4 or laser surgery. 5 In a steady-state transmission experiment, the absorption coefficient (a) is related to the incident (IO) and transmitted (I) light intensity by the Beer- Lambert law: Ila = L ln( -I = E[C], (1) where L is the photon path length (centimeters), e is the extinction coefficient (inverse centimeters times inverse micromolars) and [c] is the concentration of the absorber (micromolars). In the absence of scat- tering processes, path length L corresponds to the thickness of the sample, and from a measurement of I and Io one directly determines pa. By contrast, the presence of scattering particles in the medium gives rise to a distribution in path length whose mean value (L) can be substantially greater than the geometrical thickness of the sample. Furthermore, the two physi- 5204 APPLIED OPTICS / Vol. 33, No. 22 / 1 August 1994
Transcript
Quantitative determination of the absorptionspectra of chromophores in strongly scatteringmedia: a light-emitting-diode based technique
Sergio Fantini, Mariaand Enrico Gratton
Angela Franceschini, Joshua B. Fishkin, Beniamino Barbieri,
The absorption and scattering coefficient of a macroscopically homogeneous strongly scattering medium(lipid emulsion) containing Methylene Blue is quantitatively measured in the spectral range from 620 to700 nm. We conduct the measurements in the frequency domain by using a light-emitting diode (LED)whose intensity is modulated at a frequency of 60 MHz. We derive an analytical expression for theabsorption and scattering coefficients that is based on a two-distance measurement technique. Acomparison with other measurement protocols such as measurement at two modulation frequenciesshows that the two-distance method gives a better determination of the scattering and absorptioncoefficients. This study highlights the efficiency and ease of use of the LED technique, which lends itselfto in vivo spectroscopy of biological tissues.
Key Words: Frequency domain, absorption and scattering coefficients, diffusion approximation,strongly scattering medium, biological tissue, photon migration.
1. Introduction
The quantitative determination of the absorptionspectrum of a substance dissolved in a highly scatter-ing medium is not a trivial problem and is of particu-lar interest in a number of medical applications. Forexample, a quantitative measurement of the absorp-tion coefficient in tissues can detect the presence andconcentration of certain exogenous or endogenouschromophores. The former may be drugs whosedistribution and metabolism in tissues can then bedynamically monitored; examples include chemicalmarkers for tumors such as Indocyanine Green andhematoporphyrin derivative,' or photosensitizingagents for photodynamic therapy.2 In the near-infrared region the endogenous chromophores are
When this research was performed, B. Barbieri was with ISS,Inc., 2604 North Mattis Avenue, Champaign, Illinois 61821, and S.Fantini and M. A. Franceschini were with the Istituto di ElettronicaQuantistica, Consiglio Nazionale delle Ricerche, Via Panciatichi56/30, 50127 Firenze, Italy. The other authors were with theLaboratory for Fluorescence Dynamics, Department of Physics,University of Illinois at Urbana-Champaign, 1110 West GreenStreet, Urbana, Illinois 61801-3080.
Received 6 July 1993; revised manuscript received 3 January1994.
0003-6935/94/225204-10$06.00/0.3 1994 Optical Society of America.
typically heme proteins such as hemoglobin, whoseabsorption characteristics depend on the oxygenationstate that is affected by metabolic processes, 3 cyto-chrome aa3 in both reduced and oxidized form, mela-nin, and bilirubin. Furthermore, knowledge of theoptical properties of tissues can provide real-timeinformation on the fluence distribution of light dur-ing therapeutic procedures such as photodynamictherapy4 or laser surgery.5
In a steady-state transmission experiment, theabsorption coefficient (a) is related to the incident(IO) and transmitted (I) light intensity by the Beer-Lambert law:
Ila = L ln( -I = E[C], (1)
where L is the photon path length (centimeters), e isthe extinction coefficient (inverse centimeters timesinverse micromolars) and [c] is the concentration ofthe absorber (micromolars). In the absence of scat-tering processes, path length L corresponds to thethickness of the sample, and from a measurement of Iand Io one directly determines pa. By contrast, thepresence of scattering particles in the medium givesrise to a distribution in path length whose mean value(L) can be substantially greater than the geometricalthickness of the sample. Furthermore, the two physi-
cal processes experienced by photons in a scatteringmedium, i.e., absorption and elastic scattering, causeattenuation in the transmitted light intensity as aresult of both the annihilation of photons (absorp-tion) and the deflection of photons out of the solidangle of detection (scattering), so Eq. (1) is no longervalid. These two physical processes are described interms of the linear coefficients [La and ,st both in unitsof inverse centimeters, which are, respectively, theinverse of the mean-free path for absorption andscattering. We then observe that Eq. (1) holds onlywhen s << pa. In this paper we always refer to thetransport scattering coefficient, A' = [L(l - g), whereg is the anisotropy factor defined as the average of thecosine of the scattering angle. For soft tissues in thenear-infrared spectral region, the value of anisotropyfactor g is typically in the range 0.7-0.95 (Ref. 6),which means that the scattering is mainly forwarddirected.
Average photon path length (L) depends on both [La
and A'; it decreases as [La increases, and it increasesas [L' increases. A complication arises in biologicaltissues in the spectral region where light penetrationis adequate, because ' is typically much larger than[La and relationship (1) breaks down. The problem ofone separating the effects of absorption and scatter-ing, thus measuring [a and [L' independently, hasbeen treated in two frameworks: steady-state andtime-resolved spectroscopy. In steady-state spectros-copy, several methods have been developed. Theseinclude the measurement of the ratio of the reflec-tance at two wavelengths,7 an integrating spheremethod,8-10 a diffusion model for optically homoge-neous and semi-infinite media,"1 the detection ofcoherent backscatter,12 and an image-refocusing tech-nique.13 A general limitation of these techniques istheir nontrivial application to in vivo diagnostics.The specific complications in the various cases arerelated to sensitivity to boundary conditions, thenecessity of acquiring a large data set, insensitivity tosmall changes in the optical coefficient, and incompat-ibility with fiber-optic instrumentation. In contrast,time-resolved spectroscopy, which can be accom-plished in the time or frequency domain, is a morepromising method for medical applications. In time-domain measurements the optical response of thesystem to a narrow incident light pulse (<50 ps)provides the time-of-flight distribution, which is re-lated to the average photon path length. By fittingthe measured pulse shape to a theoretical expression,one obtains [La and ,L' in turbid media.'4 In fre-quency-domain measurements the intensity of thelight source is modulated at high frequency (107-109 Hz), and the signal is detected by a phase-sensitive detector. The measured quantities are thephase shift of the detected light relative to theexciting signal (), the average intensity (dc compo-nent), and the amplitude of the intensity oscillation(ac component). The measurement of these quanti-ties permits one to determine the absorption andscattering coefficients of the medium (see Subsection
2.D). Frequency-domain measurements provide cer-tain advantages over the time-domain measure-ments'5 ; the chief advantages are the faster data-acquisition times, which permit a study of dynamicprocesses, and the relatively inexpensive equipment.
This paper describes a general procedure for thequantitative measurement of the absorption spec-trum of a substance dissolved in a macroscopicallyhomogeneous strongly scattering medium. The pro-cedure operates in the frequency domain with amodulated light-emitting diode (LED) light source.The choice of a LED as the light source, instead ofother typical sources such as lasers or arc lamps,results from several considerations.
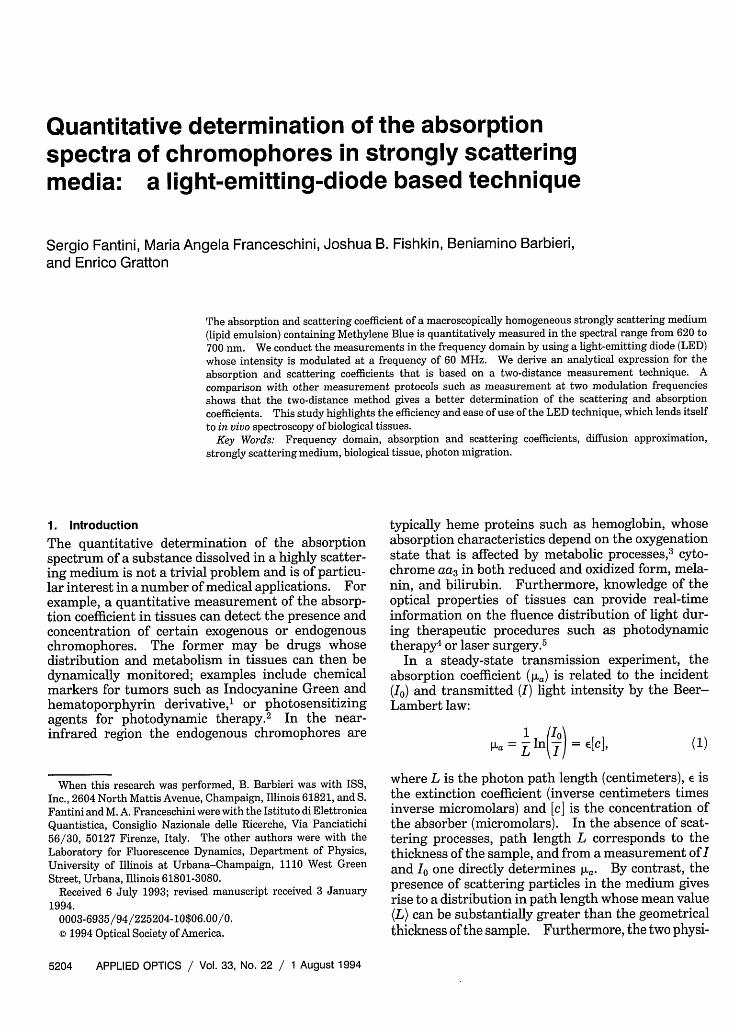
(i) Spectral distribution: The wide spectral widthof LED's (- 40 nm FWHM) allows one to investigate acontinuous spectral range of 80 nm. Currentlyavailable LED's emit at different wavelengths thatare sufficient to cover the spectral range from 550 to900 nm, which is the region of interest in medicalapplications (Fig. 1 shows the spectral distributionobtained from a variety of LED's).
(ii) Ease of modulation: A LED is easily inten-sity modulated by being driven with a radio-fre-quency oscillating signal. The efficiency of modula-tion is limited by the electrical response time of theLED.
(iii) Stable output: The intensity emitted by aLED is stable with respect to that of lasers and arclamps.
(iv) Safety: The low optical power emitted, typi-cally no more than a few milliwatts, and the wideangular distribution make LED's safe for in vivostudies.
(v) Cost effectiveness: The low cost and the rela-tively simple instrumentation required in the LEDtechnique render it an attractive technology for spec-troscopy.
In Subsection 2.B we discuss the characteristic ofthe LED's that make them suitable devices for appli-cations in frequency-domain spectroscopy.
In addition to the quantitative aspects of spectralacquisition in a scattering medium by the relativelystraightforward LED technique, we have developed asimple experimental protocol that allows one to col-lect data amenable to an analytical solution for [La and[Ls'. We derived the algorithm from a previous theo-retical development'6 that provided an analyticalsolution to the Boltzmann transport equation in thediffusion approximation.
2. Experimental Methods
The experimental arrangement is shown in Fig. 2.In this section we discuss the various components ofthe system, with emphasis on the description of theLED used as the light source. We describe themeasurement method and discuss how the solution tothe transport equation dictates the choice we made.
Fig. 1. Spectral emission of nine LED's whose peak wavelengthsrange from 570 to 870 nm. The superposition of these spectrayields a white-light source in the optical window from 550 to 900nm. Normalizing the spectra obscures the fact that long-wavelength LED's typically have higher power. The spectra ofthe LED's were measured with an optical multichannel analyzer(Princeton Instruments, ST-120), while the LED's were modulatedat 20 MHz (curves 1-3) and 60 MHz (curves 4-9); the green, yellow,and orange LED's (LED's 1, 2, and 3, respectively) could not beefficiently modulated at frequencies higher than 20 MHz. Thenumbered spectra refer to the following devices (we list manufac-turer, part number, and approximate integrated power emissionunder the given modulating condition): 1, Hewlett-Packard (H-P)HLMP-3502, 0.002 mW; 2, H-P HLMP-3400, 0.006 mW; 3, H-PHLMP-D401, 0.009 mW; 4, H-P HLMP-4101, 0.2 mW; 5, H-PHEMT-6000, 0.3 mW; 6, Asea Brown Bover; HAFO 1A330, 0.5mW; 7, H-P HFBR-1402, 0.7 mW; 8, Motorola MFOE1203, 1.5mW; 9, Asea Brown Bover; HAFO 1A277A, 1 mW.
A. Absorbing Material and Scattering Medium
As a test absorbing material we selected MethyleneBlue (MB). It has a molar extinction coefficient,defined by Eq. (1), of 0.182 + 0.001 cm-' [M-' (Ref.17) at 664 nm, and the maximum absorbance wave-length is 656 nm. Using a standard spectrophotom-eter (Perkin-Elmer Lambda 5), we measured itsabsorption spectrum in water between 620 and 700nm. This spectrum is the control for quantitativecomparison with the MB absorption spectra mea-sured in the strongly scattering solution. We havestudied different concentrations of MB in the highlyscattering medium to obtain the values typical of [La
in biological tissues, i.e., 10-1-10-2 cm-1 (Ref. 6).The scattering medium is an aqueous solution of
Liposyn III 20% (intravenous fat emulsion) fromAbbott Laboratories. The Liposyn concentration is
9c LED
Liued 7.7 ynt-LED Synt-PMT60MWz +80Hz
Solids ctent = 1.54%
18 cm
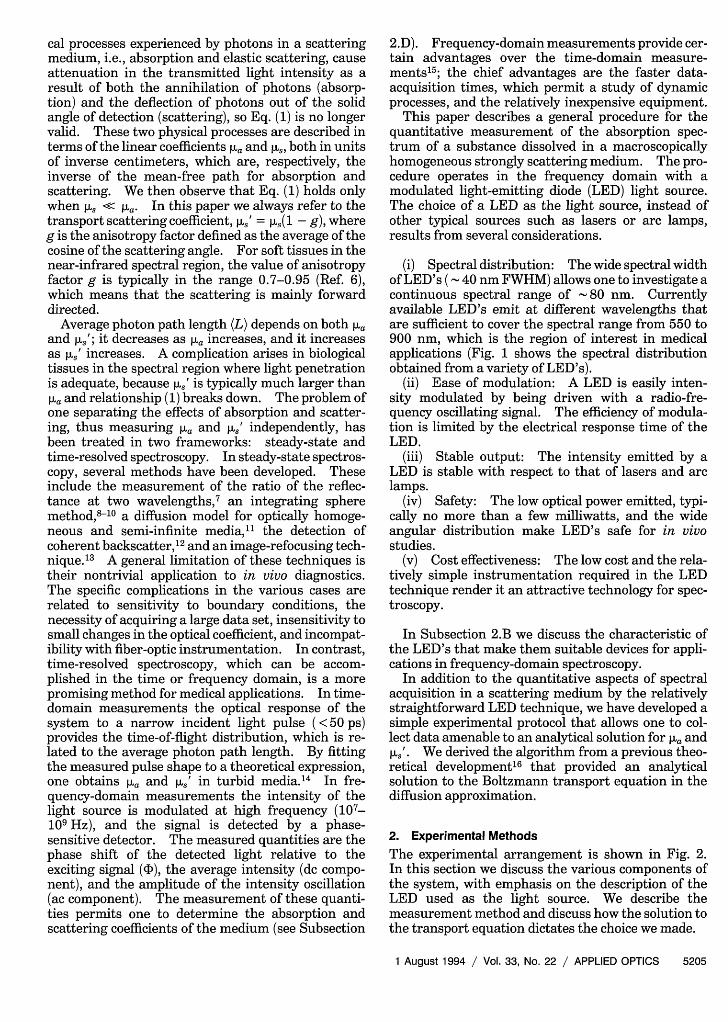
Fig. 2. Experimental arrangement showing the LED immersed inthe scattering medium, the source-detector fiber geometry, andthe other instrumentation. We used two frequency-locked synthe-sizers (Synt's) and two amplifiers (Ampl's) to modulate both theLED and the gain function of the photomultiplier tubes (PMT's).PMTr, source light collected by reference optical fiber, provides areference signal against which the phase lag of the measured light,collected by PMTs by the detector optical fiber and through themonochromator (Mon), is calculated. The reference channel alsocompensates for variations in LED intensity by a ratioing method.
7.7% by volume, matching the medium scatteringcoefficient of 20 cm-' that is typical for soft tissues.6
The solids content of the Liposyn emulsion is 1.54%(i.e., 7.7% of 20%). All the measurements are con-ducted in a 2.3-L cylindrical container whose dimen-sions, as shown in Fig. 2, are 9 cm x 18 cm.
B. Light Source
Figure 1 provides a spectral chart for the selection ofan appropriate LED source for a particular application.The absorption spectra of MB overlaps with LED 4.This LED is a double-heterojunction AlGaAs-GaAsred LED manufactured by Hewlett-Packard (HLMP-4101). Among all the red LED's we tested, thisdevice was the most efficiently modulated. We foundthat the GaAsP red LED's were not suitable devicesfor our purposes: even those with a fast response(10 ns) were not sufficiently intense when modulatedat tens of megahertz. In contrast, almost all theLED's in the infrared region (Fig. 1, LED's 5-9)showed both fast response times and good intensitycharacteristics, with efficient modulation up to 100-150 MHz. Modulation of the LED's intensity isaccomplished by the application of a sinusoidal voltage.We use a Marconi Instruments 2022A signal genera-tor output amplified by an Electronic NavigationIndustries 403LA rf amplifier. No dc offset is addedto the sinusoidal exciting signal sent to the LED sothat the LED has enough time to turn off during thenegative front. We did not utilize a clamping diodeto cut the negative front of the sinusoidal voltage,because the reverse breakdown voltage of the LED weused (15 V) is greater than the maximum peak voltagewe employed. We studied the dc and ac light-intensity behavior at different modulation frequen-cies and peak excitation voltages. We did this to findthe best compromise between the requirements of
high modulation frequency (a frequency-domain mea-surement is more accurate at higher modulationfrequencies) and high ac signal (which improves thesignal-to-noise ratio). We found that the best work-ing point for our LED is a 60-MHz modulationfrequency with a 5-V peak excitation. In these work-ing conditions, the modulation ratio (ac to dc light-intensity component) is 60% in air, the total emittedlight power is 0.2 mW, the peak wavelength is 665nm, and the spectral line full width is 30 nm. Thetails of the spectral distribution allow us to accom-plish measurements in the broader range of 620 to700 nm, which is an appropriate wavelength regionfor the measurement of the absorption spectrum ofMB (max = 656 nm).
C. Fiber-Optics and Detectors
The detector fiber optics consists of a bundle of glassoptical fibers with an overall diameter of 3 mm, whoseoutput was dispersed with a monochromator (10-cmISA Instruments SA) and detected by a HamamatsuR928 photomultiplier tube (PMTs). A second photo-multiplier tube (PMTr) collects a reference signalfrom a 1-mm-diameter plastic optical fiber in closecontact with the LED (Fig. 2). We used this PMTrsignal both as a reference for the phase measure-ments and for compensating variations in LED inten-sity that might occur during the measurement (lessthan 5%). A cross-correlation electronics systemprocessed the photomultiplier signals by using adigital acquisition method.' 8 In our measurementthe cross-correlation frequency was set to 80 Hz.The geometrical configuration of the detector opticalfiber with respect to the LED source (see Fig. 2) wassuch that only scattered (not ballistic) photons weredetected, and the walls of the container, as well as thesurface of the liquid solution, were far enough fromthe LED and the detector fiber tip to ensure thevalidity of an infinite medium approximation.
D. Measurement Technique
To discuss our measurement technique, we recall thestarting equations from which [La and A' can bedetermined.' 6 The theoretical background is thediffusion approximation to the Boltzmann transportequation, which is valid as long as [a << [La andpoints far from sources and boundaries (where farmeans at distances much greater than the photonmean-free path). An analytical solution has beenobtained in the frequency domain for a homogeneousinfinite medium under the assumption that the modu-lation frequency (/2ir) is much smaller than thetypical frequency of the scattering processes (i.e., v[L,where v is the speed of light in the medium). Fishkinand Gratton obtained the following expressions forthe experimentally measured quantities from thissolution, and they are valid at source-detector separa-
tions r much greater than the photon mean-freepath 6 :
v1 2 + ()2)1/'
4>=r v2D2
ln(rUdc) = -r + ln( 4 D) (3)
ln(rUac) = -r[ + ) cos ar[tan )J
SA+ ln(4D), (4)
where is the phase shift of the detected signalrelative to the exciting signal, Udc is the dc componentof the photon density, Uac is the amplitude of the accomponent of the photon density, r is the distancebetween source and detector, v is the speed of light inthe medium (given by c/n with n index of refractionof the medium), o is 2r times the modulation fre-quency, D is the diffusion coefficient defined as 1/(3 [La + 3,'), S is the source strength (in photons persecond), and A is the modulation of the source (themodulation of an intensity-modulated light source isdefined as the ratio of the ac to the dc component ofthe intensity). The conditions under which theseequations are valid (a << [Lsj 0/27r << v[L,') are wellsatisfied by most biological tissues in the red-near-infrared spectral region for modulation frequenciesup to 1 GHz.
The linearity of (D, ln(rUdc), and ln(rUac) withrespect to r have already been experimentally veri-fied,'6 and the slope of the straight lines (let us callthem SD, Sdc, Sac, respectively) can be measured withgood precision, the uncertainty being of the order of afew percent. Furthermore, these slopes are sensi-tive with respect to [La and [ts' as we can estimate fromtheir derivatives with respect to [La and p,-L'. Fortypical values of v (2.26 x 1010 cm/s), X (2,Tr x 60MHz), [La (0.05 cm-'), and Ls' (20 cm-'), we havedetermined that S, Sdc and Sac vary by 5% as aconsequence of a 10% variation in [La or in [L'. Weanalyzed the dependence of such a sensitivity on themodulation frequency, w)/2,r. The percentage varia-tion of the slopes is essentially unaffected by o, buttheir absolute variations show a different behavior.Although Sdc/,[L (where indicates a or [L') isobviously not dependent on to and Sac/a is onlyslightly affected by the value of o, aSD/aL is moresensitive to changes in modulation frequency; itsvalue is nearly doubled by the increase of to/27r from60 to 150 MHz. This dependence means that forhigher modulation frequencies the phase slope ismore sensitive to changes in La and Ls', but becausethe sensitivities of Sdc and Sac are essentially thesame, the overall sensitivity of the measurement isnot drastically improved. The modulation frequencyof 60 MHz, used in our experiment, can then beconsidered a good compromise between modulationefficiency and sensitivity to [La and is' variations.
To determine the slopes in Eqs. (2)-(4) (SD, Sdc, andSac), we collect data at different separation distances,which we call r, and r2 with r, < r2. If we define thequantities p = r2 - rl, p = cD(r2) - 1D(rj), =ln[r2 Udc(r2)] - ln[rjUdc(r1)], and a = ln[r2 Uac(r2)] -ln[r, Uac(rl)], we can derive the following expressions:
|V2Ila2 + 2 1/4Y = (P 2 1/'
v2D
= -P D)
sin[2 arctan(-)X
For a, a measurement (using dc and ac), we have
t a2
Ila = 2v F
A [La 2ax2 - 2 (A8)2
[La a2 -5
2 82
(12)
(13)(Aa)2 1/2+ 2
(5) The corresponding equations for the transportscattering coefficient and for its relative error are asfollows.
(6) For 5, p measurement (using dc and phase) and a, ameasurement (using dc and ac), we have
which are the phase factor, the intensity exponentiafactor, and the ac exponential factor, respectivelywhich display several useful characteristics.
(i) The quantities related to the excitation lighsource (A, S) have disappeared.
(ii) Experimentally measured quantities in spec.troscopy are multiplied by an instrument responsefactor, which in general is a function of X. Such factor cancels in a and a because they contain th(ratio of Udc and Uac measured at different source-detector separations but at the same wavelength.
(iii) An analytical solution for [La, [Ls' and theiierrors can be obtained so that the data analysis i!streamlined.
The determination of the analytical expressions fo:[la and [Ps' can be obtained in three different waysbecause Eqs. (5)-(7) contain two unknowns (V[La an(vD) and therefore are not independent. One caithen choose to obtain [La and Ps' from three differensets of measurements: p and a, p and 5, and a and aFrom a physical viewpoint this is due to the fact thap, 5, and a have a different dependence on [La and P.'
The analytical expressions for the absorption coefficient and for the relative error in the three casesobtained after some algebraic passages, are as followsFor a, 9 measurement (using dc and phase), we have
toS (p2
[a~7 =-v( a -1/2+ 1
ALa_ 2(p2 + 2 (A8)2 (Ap) 2]1/ 2
- -~~ + .(9Ila (p2 + 82 [ 8 2 p 2
For o, (p measurement (using ac and phase), we have
[La tp a(P , (10[L= \a (p
ALa af2 + p2 (Ap) 2
- 2 - 2 2 Ila a2 -p 2 2
(AIa)2 1/2
at2
A_=2 [(A8)2= 2 [ + (Ap)2p2
(14)
(a2 + 3g02 p2 2 (ALa) 2 11/2
+ 282 [la2 J(15)
For a, p measurement (using ac and phase), we have
a 2 2
is- 3LP 2- la, (16)
3 R~a p (16
S I fa-2(Aao)2 + p2(A&(p)
2(Ap)
2
APs (aO2 -Y2)2 p2
[et2 -P2 + 3[la2p2l (A[La )211/ 2
2(a 2- p2) [a2
. (17)
The choice of the coupled quantities among a, a, and pfrom which we determine [La is based on the evalua-
r tion of the uncertainties Ala/[a, which also affect theuncertainties A[L'/Ps' as shown by Eqs. (15) and (17).In our measurement, Aa/ax, A8/8, and Ap/p were ofthe same order of magnitude (a few percent), so we
t chose the measurement scheme that has the smallestfactor multiplying the quantity of the square roots in
t Eqs. (9); (11); and (13). Under our experimentalconditions these factors are approximately 1 for the(a, p) and (8, p) measurement (because p << a, ),
whereas in the (a, 8) measurement the multiplyingfactor is almost an order of magnitude larger, 8-10(because a = ). Furthermore, the fact that theerror on dc quantities is somewhat smaller than thaton ac quantities, and the fact that the dc signal ishigher than the ac signal, prompted us to choose the(8, p) scheme and Eqs. (8) and (9) for obtaining [La andits relative error. The use of dc and phase in fre-quency-domain measurements was also suggested asan alternative to a phase and modulation measure-ment.' 5 We observe that from Eqs. (6) and (7) it canbe shown that a a I > I I holds as a general result, i.e.,the ac component of light attenuates more than thedc component. In fact, the ac attenuation is largerat higher modulation frequencies, whereas the dcattenuation is independent of t.
In principle, one could also apply the scheme of adouble measurement to a two-frequency method, but
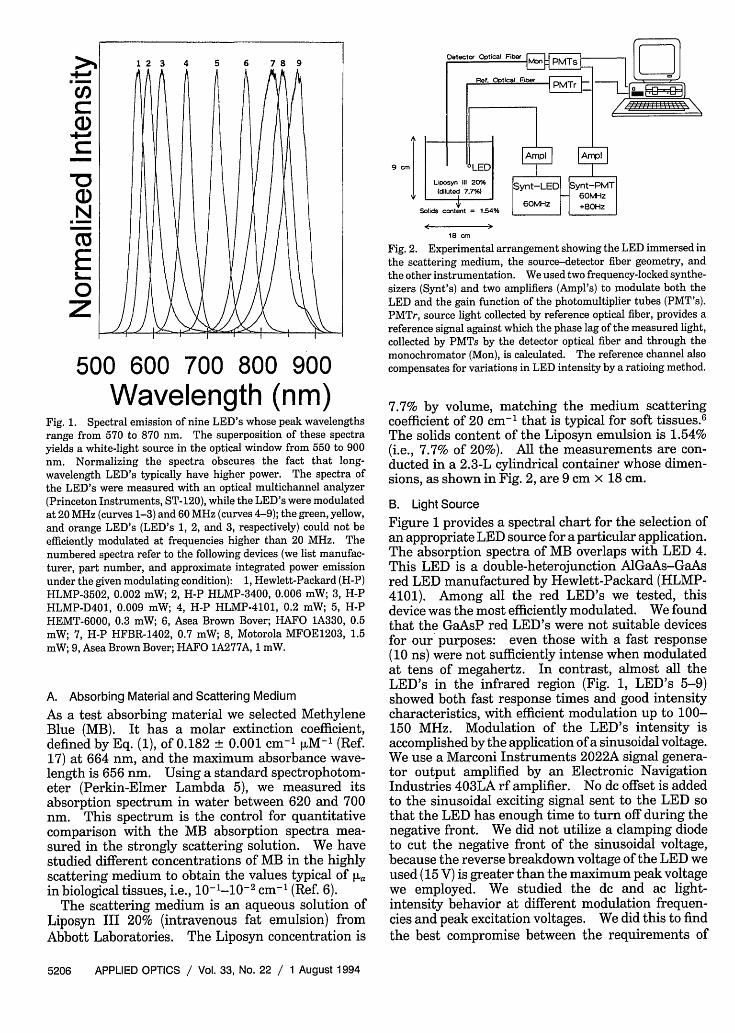
this approach would not yield a superior result be-cause the measured quantities are less sensitive tochanges in o than to changes in r. This contention isshown quantitatively by the fact that, for practicalvalues of Ar and Ato (let us say Ar 2 cm and At 2 Tr X 100 MHz), and neglecting the dependence of Aand S on o, we obtain
ac I i d)- Ar 2Ž - d'.r J___ Oato
Iln(rUac) r > aOln(rUa r A r Aj _ O t o d o '
(18)
(19)
The ratios between the two sides of inequalities (18)and (19) are shown in Figs. 3(a) and 3(b) for differentvalues of La as a function of to/2,r. Actually, ingeneral, the modulation (A) and the dc component (S)of the excitation light source do depend on o. Thisdependence implies that in a two-frequency measure-ment the quantities related to the excitationlight source do not disappear. Introducing a,, =ln[rUac(t 2)] - ln[rUac(oj)], from Eq. (4) we obtain
o2 2 1/2 1/2
\ V[La 1
-_ 1+ [ + (_,a) 1/2 1/2)S(W2)A( 2 )1
and the last term must be taken into account. HereS and A are unknown and a general procedure for atwo-frequency measurement should somehow elimi-nate them, e.g., if we reference 0,, to a direct measure-ment of the dc and ac components of the source. Ofcourse, this procedure is affected by an error and itcannot be successfully accomplished if the term con-taining S and A is much greater than the onecontaining [Mu and [L,'. Such was the case for theLED we used; in our case, the two-frequency schemeturned out to be inapplicable. The preceding discus-sion based on inequalities (18) and (19) is generalbecause the independence of S and A on t is the bestcondition for a two-frequency measurement.
We based our measurements of [La and [La' on atwo-distance technique. In practice we collect thedata at two source-detector distances (rl, r2) andcalculate p and 8. From Eqs. (8) and (14) we thenobtain the values of the absorption and scatteringcoefficients. From Eqs. (9) and (15) we calculate therelative errors in these quantities. This procedure,applied wavelength by wavelength within the wholespectral region covered by the LED (620-700 nm),allows us to get the spectra of [la and [L'. Recallingthat in our protocol r < r2 , we choose the twosource-detector separations r, and r2 on the followingbasis: the difference r2 - r, is required to be as largeas possible because the precision of the measurementis improved for large values of r2 - r. The con-straints on the value of r2 - r, arise from the fact that
10
7K
3
- I
-.
0 200 400 600 800 1000
w1/2a (MHz)40
SI
I
43
I
Ki,
35.
30-
25-
20-
15-
10-
5-
00 200 400 600 800 1000
w/2/T (MHz)Fig. 3. Dependence on w/27r for three different values of ILa of (a)[cF(r, o) - CF(r - r, w)]/[F(r, o) - CF(r, X - Ao)], (b) [ln(rUac) Ir,. -
(rUac) Ir-Ar~w]/[ln(rUac) Ir - ln(rUac) Ir-t-Ao], where r = 4 cm,Ar = 2 cm, Ao/27r = 100 MHz. We indicate ln(rUac) with A on they axis of(b). We note that the quantities on they axis in (a) and (b)are the ratio of the right-hand to the left-hand sides of inequalities(18) and (19), respectively. The horizontal line in each plotcorresponds to the equivalence of the variations of CD and ln(rUac)relative to changes in r and . The two-distance technique ismore sensitive than the two-frequency method in the region wherethe curves are above the horizontal line.
r, must be much greater than the photon mean-freepath [in order for Eqs. (5)-(7) to be valid], and r2 mustallow for the detection of an adequate light signal(both dc and ac intensities decay exponentially with
varies from 4.0 to 2.5 cm, depending on the amount ofabsorber in the medium.
3. Results
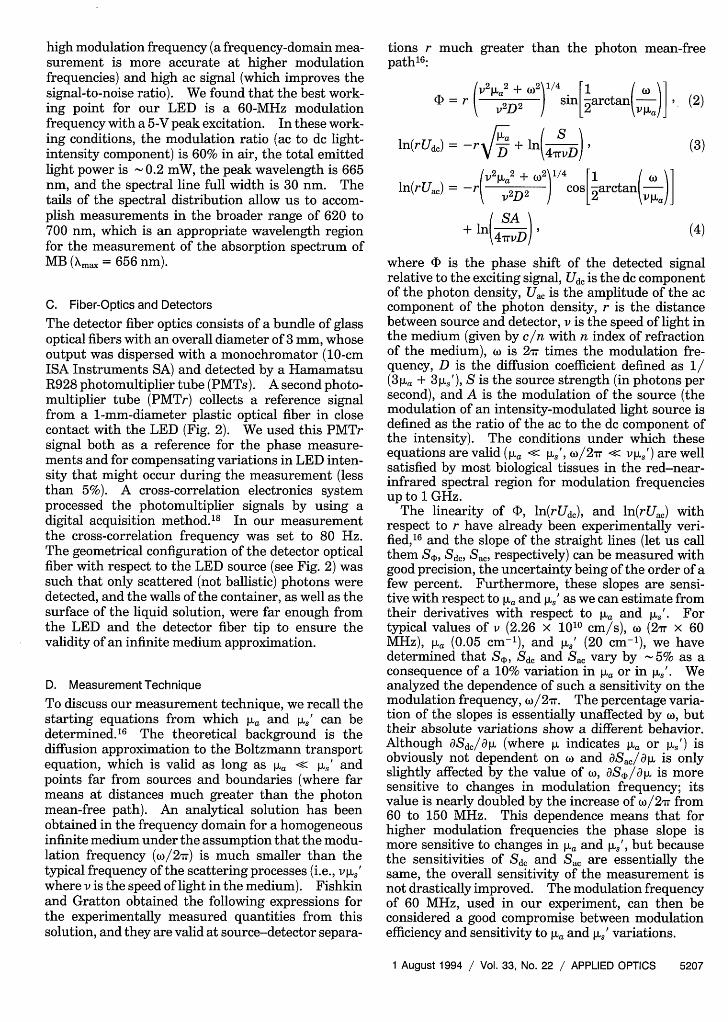
First we measured the absorption and scatteringcoefficient spectra of the Liposyn solution containingno MB absorber (a blank). The results are shown inFig. 4, in which [La is essentially the absorptioncoefficient of water and Ly' is the scattering coefficientcaused by the particles suspended in the solution.The former is in good agreement with both the orderof magnitude of water absorbance and with its knownspectral dependence.19 We subtract this spectrum of[La from the spectrum of the MB solution to obtain thecorrected absorption spectra for MB alone. Themeasured value of Ui' at 630 nm (20.2 + 1.2 cm-') isclose to the value predicted by van Staveren et al.2 0 forthe transport scattering coefficient of 1.54% In-tralipid at 632.8 nm (20.6 cm-'). Even if they consid-ered a different scattering material, this agreementsuggests that the value we measured is of the correctorder of magnitude. Furthermore, the spectral de-pendence of [L' that they calculated by using Mietheory is similar to the one we measured. Theyfound d[L,'/dX = -0.03 cm-1/nm at 660 nm, which iscomparable with our value of -0.040 0.006cm- 1/nm.
The quantitative absorption spectra of MB dis-solved in the Liposyn solution are measured forconcentrations up to 0.450 [LM in increments of 0.045[LM. The spectra obtained are shown in Figs. 5(a)and 5(b), whereas in Fig. 6 the spectra measured forMB concentrations of 0.090, 0.225, and 0.450 [LM arecompared with those obtained with the spectropho-
21.000 -
E( 1 9.000-
t 17.000 -
I
EC.
0.007
0.006
0.005 '-620 640 660 680 700
Wavelength (nm)Fig. 4. Scattering and absorption coefficients of the Liposynsolution containing no MB.
E(a
0.04
0.03
0.02
0.01
0.00 -
620 640 660 680 700
Wavelength
0.08
0.06
-
0.04
0.02
0.00 1
620
(nm)
640 660 680 700
Wavelength (nm)Fig. 5. Spectra of MB absorption coefficients at different MBconcentrations in the Liposyn solution. The various spectra referto MB concentrations of (a) 0.045, 0.090, 0.135, 0.180, and 0.225IM; (b) 0.270, 0.315, 0.360, and 0.450 puM. The spectrum relativeto 0.405 ,M is not shown for clarity.
tometer for the same concentrations of MB diluted inwater instead of in a strongly scattering medium.The good quantitative agreement is evident. Westudied the behavior of [La and la' as a function ofabsorber concentration at various wavelengths. Wefound that [L' is unaffected by MB concentrations atall the wavelengths we considered [the results at 620,640, 660, 680, and 700 nm are shown in Fig. 7(a)].
Wavelength (nm)Fig. 6. Quantitative comparison between MB absorption coeffi-cient spectra measured in the strongly scattering medium by theLED technique (filled circles) and in a nonscattering regime by aspectrophotometer (curves). The spectra correspond to MB con-centrations of 0.090, 0.225, and 0.450 ,iM as labeled. Errors barsfor the experimental data relative to the strongly scatteringmedium are shown every 20 nm.
In contrast, [La shows a linear dependence on MBconcentration as predicted by the Beer-Lambert law,Eq. (1), and as we also expected in a multiple scatter-ing regime. The experimental points and the beststraight lines among them are shown in Fig. 7(b) forthe absorption coefficient values measured at 620,640, 660, 680, and 700 nm. These results, O,[L'/a[c] = 0 and O[La/O[c] = K(X), where K is a functiononly of X, are in agreement with what Patterson etal.15 found in a similar experiment at a single wave-length.
4. Discussion
The quantitative measurement of absorption spectrain strongly scattering media is of great interest inbiomedical applications. Studies of this kind havebeen conducted on rat liver10 and on a number ofsubstances (potatoes, bovine muscle and liver, calfbrain, and various aqueous suspensions containingabsorbers such as MB and Photofrin II)21 with anintegrated transmittance and reflectance measure-ment technique. However, one cannot apply thistechnique to in vivo measurements. A method thathas been applied in vivo is time-dependent reflectancespectroscopy, which led researchers to the quantita-tive determination of [La at several wavelengths forthe normal tissue of a cat in which phthalocyaninephotosensitizer was injected.22 The disadvantagesof this technique are its inability to monitor dynamic
processes in real time and the complexity of theinstrumentation.
The LED method we describe here is promisingboth from a general viewpoint (the possibility ofhaving a white efficiently modulated light source inthe region from 600 to 900 nm with excellent stability
E
-)
60-
50:
40
30.
20
-1 n
0.0 0.1
* 620 n
* 640 rn
A 660 n
* 680 rn
T 700 n
0.2 0.3 0.4 0.5
MB Concentr
0.06
0.05
0.04E
0.035
0.02
0.01
0.00C
(AM)
0.08
0.06 IFEU
0.04 S
0.02
I r=;= t , , . _ _ 0.00
).0 0.1 0.2 0.3 0.4 0.5
MB Concentr. (M)Fig. 7. Dependence of the optical coefficients on MB concentra-tion at five wavelengths. (a) scattering coefficient (a progressiveoffset of 10, 20, 30, and 40 cm-' has been added to the pointsrelative to 640, 660, 680, and 700 nm, respectively); (b) absorptioncoefficient (the left scale refers only to the points relative to 640nm). Straight lines were obtained by a weighted least-squaresmethod. When the error bars are not displayed they are of theorder of the symbol dimensions.
characteristics) and from a practical viewpoint (therelatively low cost, light and compact instrumenta-tion, and the safe and almost straightforward applica-tion to in vivo spectroscopy of biological tissues).In addition, the fast acquisition times of the frequency-domain measurement, which can be as short as 10ms, permit one to monitor changes dynamically inoptical properties of tissues that, for in vivo measure-ments, can be related to metabolic processes.
The calculations and experimental protocol pre-sented here are based on an infinite medium geom-etry, and hence they are not directly applicable tononinvasive in vivo optical spectroscopy. The methodfor obtaining spectra in vivo is, however, almostidentical to the measurement technique described inSubsection 2.D. The only difference is that for invivo measurements the LED and the tip of thedetector optical fiber are held against the surface ofthe medium rather than being immersed in themedium, and hence it is convenient for us to assumethat the geometry of the tissue sample under investi-gation in vivo is a uniform semi-infinite medium.This may be a reasonable assumption if the tissuevolume under investigation is relatively uniform withdimensions much larger than the source-detectorseparation. One may employ a method of images,described by Patterson et al., 14 to obtain frequency-domain expressions from the diffusion approximationfor the phase shift (F, UdC, and Uac of the signaldetected at the surface of the medium. By assumingthat the source-detector separation r is much greaterthan the photon mean-free path, one may manipulatethe calculated quantities of (D, Udc, and Uac for thesemi-infinite geometry to yield expressions contain-ing [La and [', which are formally identical to theexpression of Eqs. (5)-(7). This allows for the use ofEqs. (8)-(17) for the determination of [la and [LA' bythe use of the two-distance method described in thispaper. We are currently testing the validity of theexpressions for a semi-infinite medium.
It is relevant that the two-distance method gives abetter determination of the scattering and absorptioncoefficients than the use of two modulation frequen-cies. Of course, if multiple modulation frequenciescan be employed, then multiple determination of thequantity can provide us enough information todetermine both [La and [L'. However, as shown bySvaasand et al.,23 a relatively wide frequency rangemust be employed.
In conclusion, to the best of our knowledge thisresearch represents the first quantitative spectraldetermination of the absorption and scattering coeffi-cients of a chromophore in a highly scattering me-dium through the use of a LED as a light source.
The experimental research and the analysis of thedata were performed at the Laboratory for Fluores-cence Dynamics in the Department of Physics at theUniversity of Illinois at Urbana-Champaign. Thislaboratory is supported jointly by the Division ofResearch Resource of the National Institutes of Health(RRO3155) and the University of Illinois at Urbana-
Champaign; this research was supported by grant CA57032. We thank W. W. Mantulin for the usefuldiscussions and the critical reading of the manu-script.
References and Notes1. G. Wagnieres, C. Depeursinge, P. Monnier, M. Savary, P.
Cornaz, A. Chatelain, and H. van den Bergh, "Photodetectionof early cancer by laser induced fluorescence of a tumor-selective dye: apparatus design and realization," in Photody-namic Therapy: Mechanisms II, T. J. Dougherty, ed., Proc.Soc. Photo-Opt. Instrum. Eng. 1203, 43-52 (1990).
2. M. S. Patterson, B. C. Wilson, J. W. Feather, D. M. Burns, andW. Pushka, "The measurement of dihematopotphyrin etherconcentration in tissue by reflectance spectrophotometry,"Photochem. Photobiol. 46, 337-343 (1987).
3. M. Cope and D. T. Delpy, "System for long-term measurementof cerebral blood and tissue oxygenation on newborn infants bynear infrared transillumination," Med. Biol. Eng. Comput. 26,289-294(1988).
4. B. C. Wilson and M. S. Patterson, "The physics of photody-namic therapy," Phys. Med. Biol. 31, 327-360 (1986).
5. S. L. Jacques and S. A. Prahl, "Modeling optical and thermaldistribution in tissue during laser irradiation," Laser Surg.Med. 6, 494-503 (1987).
6. W. F. Cheong, S. A. Prahl, and A. J. Welch, "A review of theoptical properties of biological tissues," IEEE J. QuantumElectron. 26, 2166-2185 (1990).
7. F. F. Jobsis, J. H. Keizer, J. C. LaManna, and M. Rosenthal,"Reflectance spectrophotometry of cytochrome aa 3 in vivo," J.Appl. Physiol. 43, 858-872 (1977).
8. E. Gratton, "Method for the automatic correction of scatteringin absorption spectra by using the integrating sphere, " Biopoly-mers 10, 2629-2634 (1971).
9. R. R. Anderson and J. A. Parrish, "Optical properties ofhuman skin," in The Science of Photomedicine, J. D. Reganand J. A. Parrish, eds. (Plenum, New York, 1982).
10. P. Parsa, S. L. Jacques, and N. S. Nishioka, "Optical propertiesof rat liver between 350 and 2200 nm," Appl. Opt. 28,2325-2330 (1989).
11. T. J. Farrel, M. S. Patterson, and B. Wilson, "A diffusiontheory model of spatially resolved, steady-state diffuse reflec-tance for the noninvasive determination of tissue opticalproperties in vivo," Med. Phys. 19, 879-888 (1992).
12. K. M. Yoo, Y. Takiguchi, and R. R. Alfano, "Dynamic effect ofweak localization on the light scattering from random mediausing ultrafast laser technology," Appl. Opt. 28, 2343-2349(1989).
13. R. Araki and I. Nashimoto, "Near-infrared imaging in vivo:imaging of Hb oxygenation in living tissues," in Time-Resolved Spectroscopy and Imaging of Tissues, B. Chance andA. Katzir, eds., Proc. Soc. Photo-Opt. Instrum. Eng. 1431,321-322 (1991).
14. M. S. Patterson, B. Chance, and B. C. Wilson, "Time resolvedreflectance and transmittance for the noninvasive measure-ment of tissue optical properties," Appl. Opt. 28, 2331-2336(1989).
15. M. S. Patterson, J. D. Moulton, B. C. Wilson, K. W. Berndt, andJ. R. Lakowicz, "Frequency-domain reflectance for the deter-mination of the scattering and absorption properties of tis-sue," Appl. Opt. 30, 4474-4476 (1991).
16. J. B. Fishkin and E. Gratton, "Propagation of photon-densitywaves in strongly scattering media containing an absorbingsemi-infinite plane bounded by a straight edge," J. Opt. Soc.Am. A 10, 127-140 (1993).
17. Aldrich Chemical Company Laboratories, Milwaukee, Wiscon-sin, 1993.
18. B. A. Feddersen, D. W. Piston, and E. Gratton, "Digitalparallel acquisition in frequency domain fluorometry," Rev.Sci. Instrum. 60, 2929-2936 (1989).
19. N. E. Dorsey, ed., Properties of Ordinary Water-Substance,(Reinhold, New York, 1940).
20. H. J. van Staveren, C. J. M. Moes, J. van Marie, S. A. Prahl,and M. J. C. van Gemert, "Light scattering in Intralipid-10%in the wavelength range of 400-1100 nm," Appl. Opt. 30,4507-4514 (1991).
21. J. L. Karagiannes, Z. Zhang, B. Grossweiner, and L. I.Grossweiner, "Applications of the 1-D diffusion approximationto the optics of tissues and tissue phantoms," Appl. Opt. 28,2311-2317(1989).
22. M. S. Patterson, J. D. Moulton, B. C. Wilson, and B. Chance,"Applications of time-resolved light scattering measurementsto photodynamic therapy dosimetry," in PhotodynamicTherapy: Mechanisms II, T. J. Dougherty, ed., Proc. Soc.Photo-Opt. Instrum. Eng. 1203, 62-75 (1990).
23. L. 0. Svaasand, B. J. Tromberg, R. C. Haskell, T.-T. Tsay, andM. W. Berns, "Tissue characterization and imaging usingphoton density waves," Opt. Eng. 32, 258-266 (1993).