Quantitative, directional measurement of electric field heterogeneity in the active site of ketosteroid isomerase Aaron T. Fafarman a,1,2 , Paul A. Sigala b,1,3 , Jason P. Schwans b , Timothy D. Fenn c , Daniel Herschlag b,4 , and Steven G. Boxer a,4 a Department of Chemistry, b Department of Biochemistry, and c Department of Molecular and Cellular Physiology, Stanford University, Stanford, CA 94305 AUTHOR SUMMARY Extensive structural studies of enzymes have revealed that biological catalysis occurs within sequestered active site crevices, where reacting substrates are surrounded by an anisotropic and chemically complex constellation of charged, polar, and hydrophobic groups. However, translating these structural pictures into a rigorous, quantitative understanding of the highly idiosyncratic electrostatic environment within a protein interior has remained one of the most challenging and elusive goals of protein biophysics. To address the scarcity of incisive experimental measures of electrostatic properties within proteins we have developed the nitrile (carbon-nitrogen triple bond) as a spectroscopic probe capable of reporting on local electrostatic fields. We have incorporated nitrile probes at multiple positions and orientations within the active site of bacterial ketosteroid isomerase (KSI) from Pseudomonas putida to quantitatively assess the landscape of electrostatic fields at discrete locations and orientations within this enzyme- active site. A battery of experimental and computational approaches using these probes revealed substantial electrostatic field heterogeneity, widely differing sensitivities of discrete probes to a set of common charge perturbations, and an unusual ionization of an active site tyrosine (Tyr) residue. Our results provide a direct measure of the heterogeneous and anisotropic nature of the electrostatic environment within a protein, identify unexpected features of the KSI active site, and establish a benchmark for developing accurate computational models of protein electrostatics. Three-dimensional structures obtained by X-ray crystallography are routinely used to calculate electrostatic properties within proteins (Fig. P1A), but even the most sophisticated computational methods have multiple approximations and limitations and have not been rigorously tested and evaluated through cycles of nontrivial computational predictions and experimental tests. Furthermore, protein structures have limited resolution, and only in rare cases are protons located, though they can greatly impact the output of electrostatics calculations and their location is often central to enzyme function. Numerous biophysical studies have provided important qualitative insights into the differences between solvation environments sampled within proteins versus bulk water or organic solvents, but these studies all contain important limitations that have precluded accurate quantitative measurement of electrostatic fields in proteins. Furthermore, these prior studies have been unable to assess how such fields vary as a function of position and orientation within enzyme-active sites and how local electrostatic perturbations influence local fields and ultimately catalytic function. Vibrational probes incorporated into proteins at defined positions can provide sensitive and directional information on the local electrostatic environment through a phenomenon known as the vibrational Stark effect. Nitrile groups provide a particularly powerful probe (1): Their small size allows incorporation with minimal structural perturbation; they can be easily introduced at discrete and well-defined positions within proteins; their strong absorbance bands lie in an uncluttered region of the IR spectrum; they are sensitive to both the magnitude and the direction of the local electric field (1); and as we demonstrate, their field sensitivity can be directly calibrated in situ. We have previously shown that nitrile probes can be introduced into the KSI active site close to key catalytic groups with minimal perturbation to KSI Fig. P1. Electrostatic potential map, experimental X-ray structural models, and IR spectra of KSI. (A) Electrostatic potential map of the D40N active site generated by solving the Poisson–Boltzmann equation. The transition-state analog equilenin is modeled in the active site in green. Foreground residues have been removed to allow viewing into the active site. (B) Superposition of the aligned X-ray crystal structures of three probe-modified KSI variants in a close-up view of key residues, depicting nitrile groups introduced at positions 105, 116, and 86 in magenta, green, and cyan, respectively. Catalytic residues and their numbering are also shown, along with equilenin, in gray. (C) IR absorption spectra in the CN-stretching region of KSI-CN variants. Author contributions: A.T.F., P.A.S., D.H., and S.G.B. designedresearch; A.T.F., P.A.S., J.P.S., and T.D.F. performed research; A.T.F., P.A.S., J.P.S., T.D.F., D.H., and S.G.B. analyzed data; and A.T.F., P.A.S., D.H., and S.G.B. wrote the paper. The authors declare no conflict of interest. This article is a PNAS Direct Submission. Data deposition: Atomic coordinates and structure factors have been deposited in the Protein Data Bank, www.pdb.org (PDB ID codes 3OXA, 3OWY, 3OX9, 3OWU). 1 A.T.F. and P.A.S. contributed equally to this work. 2 Present address: Department of Electrical and Systems Engineering, University of Pennsylvania, Philadelphia, PA 19104. 3 Present address: Department of Molecular Microbiology, Washington University School of Medicine, St. Louis, MO 63110. 4 To whom correspondence may be addressed. E-mail: [email protected] or herschla@ stanford.edu. See full research article on page E299 of www.pnas.org. Cite this Author Summary as: PNAS 10.1073/pnas.1111566109. 1824–1825 ∣ PNAS ∣ February 7, 2012 ∣ vol. 109 ∣ no. 6 www.pnas.org/cgi/doi/10.1073/pnas.1111566109
Transcript
Quantitative, directional measurementof electric field heterogeneity in theactive site of ketosteroid isomeraseAaron T. Fafarmana,1,2, Paul A. Sigalab,1,3, Jason P. Schwansb, Timothy D. Fennc,Daniel Herschlagb,4, and Steven G. Boxera,4aDepartment of Chemistry, bDepartment of Biochemistry, and cDepartment of Molecular and Cellular Physiology, Stanford University, Stanford, CA 94305
AUTHOR SUMMARY
Extensivestructuralstudies ofenzymes haverevealed thatbiologicalcatalysis occurswithinsequesteredactive sitecrevices, wherereactingsubstrates aresurrounded byan anisotropicand chemicallycomplexconstellation of charged, polar, and hydrophobic groups.However, translating these structural pictures into a rigorous,quantitative understanding of the highly idiosyncraticelectrostatic environment within a protein interior hasremained one of the most challenging and elusive goals ofprotein biophysics. To address the scarcity of incisiveexperimental measures of electrostatic properties withinproteins we have developed the nitrile (carbon-nitrogen triplebond) as a spectroscopic probe capable of reporting on localelectrostatic fields. We have incorporated nitrile probes atmultiple positions and orientations within the active site ofbacterial ketosteroid isomerase (KSI) from Pseudomonasputida to quantitatively assess the landscape of electrostaticfields at discrete locations and orientations within this enzyme-active site. A battery of experimental and computationalapproaches using these probes revealed substantialelectrostatic field heterogeneity, widely differing sensitivities ofdiscrete probes to a set of common charge perturbations, andan unusual ionization of an active site tyrosine (Tyr) residue.Our results provide a direct measure of the heterogeneousand anisotropic nature of the electrostatic environment withina protein, identify unexpected features of the KSI active site,and establish a benchmark for developing accuratecomputational models of protein electrostatics.
Three-dimensional structures obtained by X-raycrystallography are routinely used to calculate electrostaticproperties within proteins (Fig. P1A), but even the mostsophisticated computational methods have multipleapproximations and limitations and have not been rigorouslytested and evaluated through cycles of nontrivialcomputational predictions and experimental tests.Furthermore, protein structures have limited resolution, andonly in rare cases are protons located, though they can greatlyimpact the output of electrostatics calculations and theirlocation is often central to enzyme function. Numerousbiophysical studies have provided important qualitative insights
into thedifferencesbetween solvationenvironmentssampled withinproteins versusbulk water ororganic solvents,but these studiesall containimportantlimitations thathave precludedaccuratequantitativemeasurement ofelectrostatic
fields in proteins. Furthermore, these prior studies have beenunable to assess how such fields vary as a function of positionand orientation within enzyme-active sites and how localelectrostatic perturbations influence local fields and ultimatelycatalytic function.
Vibrational probes incorporated into proteins at definedpositions can provide sensitive and directional information onthe local electrostatic environment through a phenomenonknown as the vibrational Stark effect. Nitrile groups provide aparticularly powerful probe (1): Their small size allowsincorporation with minimal structural perturbation; they canbe easily introduced at discrete and well-defined positionswithin proteins; their strong absorbance bands lie in anuncluttered region of the IR spectrum; they are sensitive toboth the magnitude and the direction of the local electric field(1); and as we demonstrate, their field sensitivity can bedirectly calibrated in situ. We have previously shown thatnitrile probes can be introduced into the KSI active site closeto key catalytic groups with minimal perturbation to KSI
Fig. P1. Electrostatic potential map, experimental X-ray structural models, and IR spectra of KSI. (A)Electrostatic potential map of the D40N active site generated by solving the Poisson–Boltzmannequation. The transition-state analog equilenin is modeled in the active site in green. Foregroundresidues have been removed to allow viewing into the active site. (B) Superposition of the alignedX-ray crystal structures of three probe-modified KSI variants in a close-up view of key residues,depicting nitrile groups introduced at positions 105, 116, and 86 in magenta, green, and cyan,respectively. Catalytic residues and their numbering are also shown, along with equilenin, in gray. (C)IR absorption spectra in the CN-stretching region of KSI-CN variants.
Author contributions: A.T.F., P.A.S., D.H., and S.G.B. designed research; A.T.F., P.A.S., J.P.S.,and T.D.F. performed research; A.T.F., P.A.S., J.P.S., T.D.F., D.H., and S.G.B. analyzed data;and A.T.F., P.A.S., D.H., and S.G.B. wrote the paper.
The authors declare no conflict of interest.
This article is a PNAS Direct Submission.
Data deposition: Atomic coordinates and structure factors have been deposited in theProtein Data Bank, www.pdb.org (PDB ID codes 3OXA, 3OWY, 3OX9, 3OWU).1A.T.F. and P.A.S. contributed equally to this work.2Present address: Department of Electrical and Systems Engineering, University ofPennsylvania, Philadelphia, PA 19104.
3Present address: Department of MolecularMicrobiology, Washington University School ofMedicine, St. Louis, MO 63110.
structure or function (2). Although hydrogen bonds betweennitrile probes and the surrounding environment can shift thenitrile IR frequency via a nonelectrostatic mechanism, wepreviously published an experimental method that combines13C NMR and IR spectroscopies of the nitrile probe to detectand quantitatively correct for such effects (3).
For this study, we utilized KSI variants with nitrile groupsincorporated at multiple residue positions within the activesite. This labeling was accomplished by mutating specificamino acids to cysteine (within a cysteine-free KSI variant)and then covalently attaching the nitrile group to the cysteinesulfur atom. We determined X-ray crystal structures of eachnitrile-modified KSI variant to visualize the conformation ofeach probe within the active site and the nature of thesurrounding environment (Fig. P1B). All of the probes werewell ordered and positioned within a few angstroms of the keycatalytic residues. We next measured the IR stretchingfrequency of each nitrile probe; the spectra for the threeprobes are shown in Fig. P1C. Hydrogen bonds between theprobe and its environment were identified for two of theprobe sites, and 13C NMR measurements were used toquantitatively correct for nonelectrostatic contributions to theirmeasured IR frequencies (3). After in situ experimentalcalibration of the electric field sensitivity of the nitrile probesby vibrational Stark spectroscopy, we were able to use themeasured differences in IR stretch frequencies at the threeprobe sites to determine that each probe samples a uniqueelectrostatic field that varies by as much as 8 MV∕cm. Thisdispersion in local electric field sampled at discrete probepositions and orientations provides direct quantitative evidencefor a heterogeneous and anisotropic electrostatic environmentwithin the KSI active site.
To understand how this electric field range depends on localcharge groups within the KSI active site, we measured theelectrostatic effects on each probe of common chargeperturbations due to mutation, pH titration, and ligandbinding. We observed that single charge perturbations withinthe active site due to mutation of Asp40 to Asn or binding ofa negatively charged ligand can alter the electrostatic fieldregistered by each probe by an amount nearly as large as the8 MV∕cm site-to-site field variation between probes. Althoughelectrostatic fields within proteins are additive and necessarilythe sum of all charges and dipoles throughout the system, therelative contribution of individual charges to the collectiveelectric field measured at a specific location was unknown.Our results suggest that the site-to-site variability in the localelectrostatic fields in KSI is dominated by the specific locationof nearby charges rather than a dominant collectiveelectrostatic effect exerted by many residues throughout theprotein.
We carried out extensive computational modeling tounderstand the effects of the Asp40Asn mutation on the fieldsregistered by the nitrile probes. On the basis of literatureprecedence and computational prediction of active site
ionization states, we initially assumed that the Asp40Asnmutation would result in ionization of the nearby Asp103 andthat movement of negative charge from Asp40 to Asp103could explain the field changes measured by our nitrile probes.Our calculations, however, predicted that ionization of Asp103would result in electric field changes very different from thoserecorded by our experimental probes. Although we did notexpect quantitative agreement between calculation andexperiment, the discrepancies at each probe position wereenormous. This disagreement prompted us to considerwhether a residue other than Asp103 could be ionizing in theKSI active site in the Asp40Asn mutant. The only otherionizable groups within the active site were three Tyr residuesforming an extended hydrogen bond network. These Tyrgroups were predicted by pKa (the acid dissociation constant)prediction algorithms to be protonated and exhibit high pKavalues. Nevertheless, we computationally modeled the effectsof ionization of each Tyr on our nitrile probes. Surprisingly,ionization at any of these residues did a better job ofaccounting for the observed nitrile frequency shifts thanionization of Asp103. UV absorbance studies and 13C NMRexperiments of KSI-bearing Tyr-specific 13C labels confirmedthat an active site Tyr is indeed ionized at neutral pH in theAsp40Asn mutant, confirming our predictions based on the IRmeasurements. This result was unexpected and to the best ofour knowledge represents a unique example of a Tyr with apKa near 6 that is stabilized entirely by hydrogen bondswithout a nearby positive charge.
This synergism between directional IR electric fieldmeasurements, computational modeling, and spectroscopicprobes of side-chain ionization states highlights the productiveinterplay between experiment and theory and the power ofutilizing directional probes at multiple positions to triangulatelocal electrostatic effects. The directional sensitivity of ourelectrostatic probes contrasts with common electrostaticcharacterizations of protein interiors in terms ofnondirectional or uniform “effective dielectric” descriptionsand was indispensable in measuring the heterogeneity ofelectrostatic fields within the protein and in modeling anddistinguishing the effects of Tyr ionization versus otherpositions. Finally, our direct measurements of field differencesfrom multiple positions and orientations provide importantbenchmarks for improving computation modeling of proteinsand can serve as a guide for designing future incisive tests ofthe functional roles and contributions of protein electrostatics.
1. Suydam IT, Boxer SG (2003) Vibrational Stark effects calibrate the sensitivity of vibra-tional probes for electric fields in proteins. Biochemistry 42:12050–12055.
2. Sigala PA, Fafarman AT, Bogard PE, Boxer SG, Herschlag D (2007) Do ligand binding andsolvent exclusion alter the electrostatic character within the oxyanion hole of an en-zymatic active site? J Am Chem Soc 129:12104–12105.
3. Fafarman AT, Sigala PA, Herschlag D, Boxer SG (2010) Decomposition of vibrationalshifts of nitriles into electrostatic and hydrogen-bonding effects. J Am Chem Soc132:12811–12813.
Fafarman et al. PNAS ∣ February 7, 2012 ∣ vol. 109 ∣ no. 6 ∣ 1825
BIOPH
YSICSAND
COMPU
TATIONALBIOLO
GY
PNASPL
US
Quantitative, directional measurementof electric field heterogeneity in theactive site of ketosteroid isomeraseAaron T. Fafarmana,1,2, Paul A. Sigalab,1,3, Jason P. Schwansb, Timothy D. Fennc,Daniel Herschlagb,4, and Steven G. Boxera,4
aDepartment of Chemistry, bDepartment of Biochemistry, and cDepartment of Molecular and Cellular Physiology, Stanford University, Stanford, CA 94305
Edited by Ken A. Dill, Stony Brook University, Stony Brook, NY, and approved November 21, 2011 (received for review July 19, 2011)
Understanding the electrostatic forces and features within highlyheterogeneous, anisotropic, and chemically complex enzyme activesites and their connection to biological catalysis remains a long-standing challenge, in part due to the paucity of incisive experi-mental probes of electrostatic properties within proteins. Toquantitatively assess the landscape of electrostatic fields at dis-crete locations and orientations within an enzyme active site, wehave incorporated site-specific thiocyanate vibrational probes intomultiple positions within bacterial ketosteroid isomerase. A bat-tery of X-ray crystallographic, vibrational Stark spectroscopy, andNMR studies revealed electrostatic field heterogeneity of 8 MV∕cmbetween active site probe locations and widely differing sensitiv-ities of discrete probes to common electrostatic perturbations frommutation, ligand binding, and pH changes. Electrostatic calcula-tions based on active site ionization states assigned by literatureprecedent and computational pKa prediction were unable to quan-titatively account for the observed vibrational band shifts. How-ever, electrostatic models of the D40N mutant gave qualitativeagreement with the observed vibrational effects when an unusualionization of an active site tyrosine with a pKa near 7 was included.UV-absorbance and 13C NMR experiments confirmed the presenceof a tyrosinate in the active site, in agreement with electrostaticmodels. This work provides the most direct measure of the hetero-geneous and anisotropic nature of the electrostatic environmentwithin an enzyme active site, and these measurements provideincisive benchmarks for further developing accurate computa-tional models and a foundation for future tests of electrostaticsin enzymatic catalysis.
Extensive structural studies of enzymes have revealed that bio-logical catalysis occurs within sequestered active site crevices
that solvate reacting substrates with an anisotropic and chemi-cally complex constellation of charged, polar, and hydrophobicgroups. But beyond visualization of the chemical compositionand architecture of active sites permitted by the rich library ofavailable protein structures, our understanding of the electro-static nature and properties of this highly heterogeneous environ-ment and its role in molecular recognition and catalysis is largelybased on simulations. Computations using three-dimensionalstructures routinely provide electrostatic potentials, as in Fig. 1A.These potentials have been used to identify and characterizeprotein–protein and protein–ligand binding sites, and interactionenergies derived from these calculations have suggested keycontributions from the electrostatic environment to enzymaticrate enhancement and specificity (1–5). However, even the mostsophisticated computational methods have multiple approxima-tions and limitations (6–8) and, most importantly, have not beenrigorously evaluated through cycles of nontrivial computationalpredictions and experimental tests. Incisive and quantitative ex-perimental measures of the electrostatic fields within proteinsare needed to deepen our understanding of these environmentsand allow evaluation of computational predictions of electrostaticcontributions to binding and catalysis.
Numerous biophysical studies have provided important quali-tative insights into the differences between solvation environ-ments sampled within proteins versus bulk water or organicsolvents. These studies have inferred electrostatic potentialsbased on free energy measurements [e.g., pKa shifts of ionizableresidues (9–11), reactivity differences among cysteines (12, 13),equilibrium binding constants of charged ligands (14), and redoxpotential shifts (15)] or spectroscopic variations in probes incor-porated into or bound to proteins [e.g., fluorescent dyes (16), 19Fand 13C chemical shifts (17–21), and EPR-measured g-factorperturbations of nitroxides (22)]. These studies have spurred theongoing development of electrostatic calculation methodology(6, 7) and contributed greatly to our general recognition thatthe solvation environment within proteins is very different fromwater. However, each of these experimental observables is influ-enced by additional environmental factors beyond electric fieldeffects, without independent experimental means to distinguishthese contributions (8, 12, 23). For example, local electrostaticfields can perturb pKa values, but the observed pKa is also sen-sitive to the making or breaking of hydrogen bonds between thetitrating group and nearby groups and to the access of the site towater. These pervasive limitations have precluded accurate quan-titative measurement of electrostatic fields in proteins, how suchfields vary as a function of position and orientation within enzymeactive sites, and how local electrostatic perturbations influencelocal fields.
Vibrational probes incorporated into proteins at definedpositions can provide sensitive and directional reporters of thelocal electrostatic environment. Nitrile (-CN) groups provide aparticularly incisive and powerful probe. Their small size allowsincorporation with minimal structural perturbation; they can beeasily introduced at discrete and well-defined positions withinproteins; their strong absorbance bands lie in an unclutteredregion of the IR spectrum; and they are sensitive to both the mag-nitude and direction of the local electric field (24). Furthermore,
Author contributions: A.T.F., P.A.S., D.H., and S.G.B. designed research; A.T.F., P.A.S., J.P.S.,and T.D.F. performed research; A.T.F., P.A.S., J.P.S., T.D.F., D.H., and S.G.B. analyzed data;and A.T.F., P.A.S., D.H., and S.G.B. wrote the paper.
The authors declare no conflict of interest.
This article is a PNAS Direct Submission.
Data deposition: Atomic coordinates and structure factors have been deposited in theProtein Data Bank, www.pdb.org (PDB ID codes 3OXA, 3OWY, 3OX9, 3OWU).1A.T.F. and P.A.S. contributed equally to this work.2Present address: Department of Electrical and Systems Engineering, University ofPennsylvania, Philadelphia, PA 19104.
3Present address: Department ofMolecular Microbiology, Washington University School ofMedicine, St. Louis, MO 63110.
in contrast to many of the preceding examples, the field sensitivityof the nitrile stretching frequency can be calibrated in situ, obviat-ing the need for a computational model or calibration in terms ofan equivalent solution dielectric value that may not be transfer-able from bulk solvent to the heterogeneous structure of proteins.
The probe’s electric field sensitivity is largely due to the anhar-monicity of the nitrile bond that leads to an increase in dipolemoment,Δ ~μprobe, between the ground and first excited vibrationalstate. This difference dipole moment results in a dependenceof the transition energy on the size and direction of the local elec-trostatic field (Fig. S1 and SI Text). To quantify the electric fieldsensitivity of a specific vibrational probe, a known external elec-tric field is applied and the effect of the field on the IR absorptionspectrum is measured (25–27), a method known as vibrationalStark effect (VSE) spectroscopy. The electric field sensitivity ofa vibrational probe directly calibrated in this fashion is called thelinear Stark tuning rate, jΔ ~μprobej [in units of cm−1∕ðMV∕cmÞ].Eq. 1 can then be employed to translate observed IR frequencyshifts, Δνobs (in cm−1), into changes in the local protein electro-static field, Δ ~Fprotein (in MV∕cm), experienced by a probe at twodifferent sites in a protein or as a result of a side-chain ionization,mutation or ligand binding:
where h is Planck’s constant, c the speed of light, and θ is theangle between the vectors defined by Δ ~μ and Δ ~Fprotein. The direc-tion of the vibrational probe Δ ~μprobe is typically along the oscil-lator bond axis for simple, linear nitriles (27). Thus, X-raycrystallography can provide the orientation of Δ ~μCN within a ni-trile-modified protein and the VSE in an external field calibratesthe magnitude of Δ ~μCN. Finally, although specific chemical inter-actions, such as hydrogen bonds, between nitrile probes and thesurrounding environment can shift the nitrile IR frequency via anonelectrostatic mechanism not captured by Eq. 1, we previously
published an experimental method to detect and quantitativelycorrect for such effects (28). Thus, nitrile probes can providequantitative measures of local electrostatic fields in the presenceof specific interactions with surrounding groups.
Bacterial ketosteroid isomerase (KSI) has provided a powerfulmodel system for probing fundamental aspects of enzymatic cat-alysis. The basic catalytic mechanism (Fig. 1B) is well established,many high resolution structures are available, good transitionstate analogs exist, and the importance of electrostatics to cata-lysis is the subject of extensive and ongoing study (29–32). In ear-lier work, we demonstrated that vibrational probes could beintroduced into the active site in proximity to key catalytic resi-dues (28, 33). We now report detailed studies that use vibrationalprobes to measure the differences in local electrostatic fieldssampled at discrete positions within the active site and to test thesensitivity of local fields to nearby electrostatic perturbationsfrom ligand binding, pH changes, and mutation. Using Eq. 1,we make direct comparisons between observed and computedchanges in the electrostatic potential. Discrepancies, even at aqualitative level, between the predicted and observed effects ledus to reconsider the ionization states of key residues. Our resultsprovide quantitative insight into the fundamental electrostaticproperties of a protein interior, identify unexpected features ofthe KSI active site, establish a benchmark for future computa-tions, and provide a basis for designing future tests of electro-static contributions to catalysis.
ResultsIncorporation of Nitrile Electric Field Probes into Ketosteroid Isomer-ase. Bacterial KSI from Pseudomonas putida catalyzes double-bond isomerization in steroids using a general base, D40, todeprotonate the substrate and form a dienolate reaction inter-mediate. This intermediate is stabilized by hydrogen bondsformed to Y16 and protonated D103 within an active site oxya-nion hole that is linked via a hydrogen bond network to Y57 andY32 (Fig. 1B) (34–37). We incorporated thiocyanate vibrationalprobes into KSI from P. putida at positions M116, M105, and F86
Fig. 1. Electrostatic potential map, catalytic scheme, and experimental X-ray structural models of KSI. (A) Electrostatic potential map of the D40N active sitegenerated by solving the Poisson–Boltzmann equation using the program DelPhi (55, 56) and plotted on the solvent-accessible surface of the X-ray structuralmodel for M116C-CN/D40N (apoprotein, PDB ID code 3OXA). Equilenin is modeled in the active site, shown in stick representation, with carbon atoms in green.The foreground residues have been removed to allow viewing into the active site. A drop in potential from 80 mV to −80 mV in the space of two Å equates toan 8 MV∕cm field. (B) Reactionmechanism for pKSI catalysis of steroid isomerization, shown for the substrate 5-androstene-3,17-dione. (C) Superposition of thealigned X-ray crystal structures of M116C-CN/D40N, F86C-CN/D40N (equilenin bound, PDB ID code 3OWU) and M105C-CN/D40N (equilenin bound, PDB ID code3OWY). The carbon atoms of Tyr16, Asp103, Asn40, and the bound ligand equilenin are shown in gray and derived from 3OWU. The carbon atoms of the Cys-CNresidue for M116C-CN, M105C-CN, and F86C-CN are shown as green, magenta, and cyan, respectively. Atoms for nitrogen, oxygen, and sulfur appear as blue,red, and gold, respectively, for all structures. Inset: View of the thiocyanate groups of the three constructs translated in the same axis system so that sulfuratoms (yellow) coincide at the same location. The common Cartesian coordinate system is shown with gray sticks, demonstrating the relative orientation ofeach probe’s bond vectors to the coordinate system of the protein structure. (D) The local environment surrounding each of the three probes is shown insemitransparent surface representation. Note that cavities in the surface result in the nitrile probe being solvent-exposed for M116C-CN and F86C-CN, whereasM105C-CN lies beneath the surface.
E300 ∣ www.pnas.org/cgi/doi/10.1073/pnas.1111566109 Fafarman et al.
(Fig. 1C). These positions were selected on the basis of theirproximity (within 3–11 Å) to the key catalytic residues listedabove. Sites M116 and M105 were used in prior investigationsof the effects of solvation on active site electrostatic properties(28, 33). In the analysis that follows, we also refer to data for athiocyanate probe incorporated at residue L61 obtained in a pre-vious study (28). This residue is located near the mouth of theactive site and forms part of the solvent-accessible surface ofthe steroid binding pocket. Thiocyanate labeling of KSI wasaccomplished by engineering single cysteine mutations at eachof the above positions in the cysteine-free variant C69S/C81S/C97S to ensure unique labeling. The Cys residues at positions69, 81, and 97 are located on the enzyme’s surface, and theirremoval has a negligible effect on catalysis (38).
The single Cys-SH group introduced in each mutant wasconverted to Cys-S-CN using previously published methods(33, 39), and the individual probe-labeled enzymes are referredto as M116C-CN, M105C-CN, F86C-CN, and L61C-CN. LabeledKSI variants were prepared with the general base D40 intact ormutated to D40N to mimic the protonated D40 present in thedienolate intermediate complex (Fig. 1B). Functional assays withthe thiocyanate-modified enzymes revealed activities (kcat∕KM)within three- to sixfold of Cys-free KSI with D40 present or affi-nities within twofold for binding of the transition state analogequilenin to the D40N mutants, suggesting minimal perturbationto KSI structure and function.
X-Ray Crystal Structures of KSI-CN Variants. We determined X-raycrystal structures for the D40N variants of M116C-CN, M105C-CN, and F86C-CN with or without the bound steroid transitionstate analog equilenin (Table 1, complete data collection andrefinement statistics for each structure are listed in Table S1).The overall structures obtained for these variants were the sameas those determined previously for P. putida KSI bound to equi-lenin (1OH0) or phenol (2PZV), with average rmsd values of0.26 Å, 0.31 Å, and 0.31 Å, respectively, for main-chain atomsof apo M116C-CN, M105C-CN•equilenin, and F86C-CN•equi-lenin from the previously determined structures (which have amain-chain rmsd of 0.27 Å from each other). Thus, thiocyanateincorporation does not perturb the global structure of KSI.
Focusing on the nitrile probes, the electron-density mapsdetermined for each structure (Fig. S2) supported refinementof the thiocyanate group to a single well-ordered conforma-tion (Fig. 1C). Superposition of active site residues observedin the probe modified versus unmodified KSI structures revealedconformational differences on the same scale as the 0.1–0.2 Åestimated coordinate uncertainty in these structures, indicatingminimal structural rearrangements within the active site in re-sponse to probe insertion. The thiocyanate group in both theM116C-CN and M105C-CN structures refined to a position verysimilar to that occupied by the parent methionine residue in theunmodified structures, indicating a sterically conservative substi-tution. For F86C-CN the thiocyanate group refined to a positiondistinct from that occupied by the phenyl ring with F86 present.Nevertheless, we did not observe structural rearrangement ofnearby groups to fill this space, nor did this change perturb theposition of bound equilenin. Finally, comparison of F86C-CNstructures with and without bound equilenin revealed identicalthiocyanate positions, within error. We conclude that thiocyanateincorporation at each of these three positions minimally perturbs
the structure and function of the KSI active site and results inordered and well-defined nitrile probe conformations.
Each of the three probes is positioned within a unique localenvironment. The nitrile of M105C-CN is buried well belowthe solvent-accessible surface of the KSI active site and is located6 to 7 Å from the polar side-chain hydroxyl moieties of Tyr 16, 32and 57, Asp 103, and the oxyanion of the bound steroid (Fig. 1C).Its immediate solvation environment is thus composed of a tightlypacked shell of hydrophobic aliphatic and aromatic residues(Fig. 1D).
The cyano group in M116C-CN has the most central active sitelocation of the probes, with the nitrile positioned less than 5 Åfrom the polar side-chain hydroxyl groups of Tyr 16, 32 and 57and Asp 103, and less than 4 Å from the general base, Asp 40,and the expected position of the steroid oxyanion (Fig. 1C). Itforms part of the solvent-accessible active site surface and is thussusceptible to hydrogen bond formation to adventitious watermolecules within the active site.
The nitrile of F86C-CN refined to a position orthogonal to thatof the original F86 phenyl ring, projecting away from the boundsubstrate and into a small recess contoured by the backbonegroups of D103 and M84 (Fig. 1C). The 3-Å distance and trian-gular arrangement between the nitrile and amide groups of D103and M84 suggested formation of a bifurcated hydrogen bond inwhich lone pairs on both the nitrile nitrogen and M84 carbonyloxygen overlap with the amide proton of D103. IR and 13C NMRmeasurements described below support hydrogen bond forma-tion to the probe. Positioned within this recess, the nitrile ofF86C-CN is located 4 Å from a side-chain oxygen of D103, 5 Åfrom the oxyanion of the bound steroid, and 7–10 Å from theactive site tyrosines.
These three probes represent distinct orientations relative tothe molecular frame of the enzyme (Fig. 1C, Inset), span a rangeof distances to the polar groups of the active site, and experiencevarying degrees of solvent sequestration, hydrogen bond forma-tion, and hydrophobic packing interactions. The unique and ani-sotropic chemical environment observed at each site thereforesuggested that each probe samples a discrete electrostatic envir-onment that, via Eq. 1, would lead to dispersion in the vibrationalstretching frequency from site to site. In the sections that follow,we first present IR spectra for the three probes that demonstratesubstantial -CN frequency dispersion. We then describe 13CNMR measurements for each nitrile that allowed us to rule outhydrogen bonding to the M105C-CN probe and identify and cor-rect for hydrogen bond formation to the M116C-CN, and F86C-CN probes. Then we present in situ calibration of jΔ ~μCNj for eachnitrile to determine the inherent electric field sensitivity of eachprobe. With these measurements in hand, we are able to quanti-tatively determine the differences in electric fields sampled by thethree probes in their unique positions and orientations within theactive site and the response to changes in the local electrostaticenvironment.
Tandem Measurement of IR Stretch Frequency and 13C NMR ChemicalShift. FTIR spectra were acquired for each apo KSI-CN variantwith either D40 or D40N present. These spectra, shown inFig. 2A–C and summarized in Table 2, reveal symmetric peaksthat span a 12 cm−1 range in stretching frequency and exhibita broad range in linewidth. Although linewidths are determinedby the complex distribution of inhomogeneous environments andthe time scale for interconversion between them and are oftendifficult to interpret, our structural studies and NMR data pro-vide a guide for understanding the observed linewidth differ-ences. The narrow linewidth of the M105C-CN peak relativeto the other probes, or compared to the spectrum for urea-unfolded protein (33), is consistent with the tight packing ofhydrophobic groups around the probe within a region of theactive site previously suggested to have limited dynamic mobility
Table 1. X-ray crystallographic data for nitrile-modified KSI variants
D40N Variant Ligand Resolution (Å) Rwork∕Rfree (%) PDB ID code
(40). The relatively broad F86C-CN spectrum may reflect that itssubstitution for bulkier phenylalanine results in looser packingaround this probe than for the other probes. The observationof the same ordering of linewidths for the 13C NMR peaks foreach probe (Fig. S3) supports the hypothesis that broader line-width reflects greater conformational inhomogeneity (additionaldiscussion in SI Text).
Prior to any electrostatic analysis, it was necessary to first testand correct for effects from hydrogen bond formation to the ni-trile probes. We recently published a method, based on tandemmeasurement of the nitrile IR frequency and 13C NMR chemicalshift, that can detect the presence of specific probe interactionssuch as hydrogen bonds and quantitatively separate observednitrile IR shifts into electrostatic and nonelectrostatic contribu-tions (28). The common, linear electric field sensitivity of the IRand NMR observables leads to a correlation between them in theabsence of specific interactions with the probe. Direct hydrogenbond formation to a nitrile leads to a departure from this linearcorrelation, ascribed to anomalous behavior in the IR but not theNMR dimension (41–43). By comparing tandem IR and NMRmeasurements for KSI-CN probes to a previously determinedcorrelation of IR stretching frequency versus 13C NMR chemicalshift of ethyl thiocyanate in aprotic solvents, such departures canbe identified.
We previously applied this method to identify that the M116C-CN nitrile accepts a hydrogen bond and that the M105C-CNnitrile is free from hydrogen bonding (Table 2 and Fig. 3) (28).Hydrogen bond formation to the nitrile of M116C-CN but notM105C-CN is consistent with the solvent exposure of the formerand hydrophobic burial of the latter observed in the X-ray struc-tures (Fig. 1D). When we applied this method to F86C-CN, weobserved a substantial offset in the IR frequency of F86C-CNfrom that expected based on its 13C NMR chemical shift and thetrend line shown in green in Fig. 3, supporting the presence of thebifurcated hydrogen bond suggested from the X-ray structure.
Individual trend lines for the IR and 13C NMR data weredetermined by compiling multiple IR and 13C NMR measure-ments with mutants and bound ligands for each nitrile probe(Fig. 3). The slopes of all of these lines were the same, withinerror, strongly suggesting that in none of the examples of ligandbinding or mutation studied by this method does the nitrilechange from free to hydrogen-bonded or vice versa at any of thethree sites. The larger 13 cm−1 offset observed for F86C-CN fromthe IR/NMR correlation line, relative to the 10 cm−1 offset ob-served for M116C-CN, may arise from the different hydrogenbond donors in the two cases: a backbone amide in the case ofF86C-CN versus water for M116C-CN. Our prior conclusion(28), that IR shifts due to hydrogen bonding and local electro-static effects are additive, is reinforced with the contribution hereof additional data that strengthen the observed correlations.Based on this information, we can quantitatively correct for hy-drogen bond formation to the F86C-CN and M116C-CN probesby subtracting their IR frequency offset from the IR/NMR cor-relation line (Fig. 3). Upon correction, the total dispersion in
nitrile frequency between the three probes was reduced from 12to 4.4 cm−1 (Table 2) with D40N present and 1.6 cm−1 with D40present. This correction also reversed the relative peak positionsof M105C-CN and F86C-CN, leaving the M105C-CN nitrile withthe highest energy IR frequency.
In Situ Determination of the Stark Tuning Rate for Each Nitrile Probe.While both NMR and IR are sensitive to electrostatic fields, theVSE experiment provides a quantitative experimental calibrationof the sensitivity of the vibrational frequency with respect toa known, external electric field. Such a direct calibration is notcurrently possible for 13C NMR chemical shifts. Vibrational Stark
Table 2. Vibrational frequencies and 13C NMR chemical shifts for nitrile-modified KSI variants at pH 7 in 40 mM potassium phosphate
*Reproduced from ref. 33.†Reproduced from ref. 28.
Fig. 2. IR absorption spectra of KSI-CN variants in D40 versus D40N and atpH 6 versus 8. (A–C) X-ray structures of the ionizable groups in the regionaround each nitrile probe are shown with the Asn at position 40. In grayare the active site ionizable groups (Y32 omitted for clarity). The Cys-CN re-sidue in each variant (carbon atoms colored as in Fig. 1) is aligned accordingto the axis system shown in the upper left inset ofA. Dashed lines indicate thedistance from the probe to the side chain of residue 40, which are 11, 9.2, and5.7 Å, for positions 105, 86, and 116, respectively. (D–F) Absorption spectra ofthe nitrile stretching region for M105C-CN, F86C-CN, and M116C-CN (fromleft to right, respectively) in D40 (red) versus D40N (black) at pH 7.1. (G–I)A rotated view of the ionizable groups of D40N. D103 is circled in red inthe cases where the observations are most at odds with the expectationsfor D103 ionization (positions 105 and 86). (J–L) Absorption spectra of thenitrile stretching region for KSI-CN variants at pH 5.6 (red) or pH 7.8 (black)in 100 mM MES buffer.
E302 ∣ www.pnas.org/cgi/doi/10.1073/pnas.1111566109 Fafarman et al.
tuning rates for individual probes are typically obtained usingsmall molecules in frozen organic glasses (44–46). However, itremained untested whether the Stark tuning rate of a specificprobe, such as a nitrile, varies substantially upon large perturba-tions to the local environment of the probe (47).
To address this question, we determined vibrational Stark spec-tra (field on minus field off) in situ for each KSI-CN variant em-bedded in a frozen glass at 80 K (Fig. 4). The Stark spectra werefit as a sum of derivatives of the absorption spectrum, and thecontribution of the second derivative component was quantifiedto calculate jΔ ~μCNj (see SI Materials and Methods). The values ofjΔ ~μCNj · f (where f is the local field correction factor, which forsimplicity we assume to be equal to one*) determined for eachprobe were within 20% of each other and of the model compoundethyl thiocyanate (EtSCN) measured in frozen organic solvent(49) (Fig. 4). Thus, the electric field sensitivity of the three nitrileprobes, quantified by the Stark tuning rate, appears to be an in-trinsic property of the oscillator that varies minimally across theobserved range of measured IR frequencies and unique structuralenvironments, regardless of whether the probe is hydrogen-bonded or not. According to Eq. 1 and using the average cali-brated value for jΔ ~μCNj, a change in the projection of the fieldalong the C-to-N bond vector of þ1 MV∕cm would shift theIR absorption, Δνobs, by þ0.65 cm−1.
Quantitative Measurement of Electrostatic Field Heterogeneity Withinthe KSI Active Site. We first consider the data with the D40N mu-tant, because our results (X-ray, 13C NMR, and Stark) are mostextensive in this background. After correction for hydrogen bond-
ing, we observed a 4.4 cm−1 range in IR frequencies for the nitrileprobes at positions 116, 105, and 86 in the D40N background(Table 2). According to Eq. 1, this dispersion in IR frequencycorresponds to a 7� 3 MV∕cm variation in the magnitude of thelocal electrostatic field projected onto each probe (error analysisdescribed in SI Materials and Methods). When the corrected IRfrequency of L61C-CN was included in the analysis (28), theobserved IR range expanded to 5.4 cm−1 (L61C-CN/D40N vs.M105C-CN/D40N; Table 2), which translates to an 8� 4 MV∕cmdifference in the projection of the local electric field on eachnitrile. Comparing only the hydrogen-bonded probes, a differ-ence of 7� 4 MV∕cm (L61C-CN/D40N vs. F86C-CN/D40N;Table 2) is observed. This dispersion in local electric field sampledat discrete probe positions and orientations provides direct quan-titative evidence for a heterogeneous and anisotropic electro-static environment within KSI. To understand how this electricfield range depends on local charge groups within the KSI activesite, in the following sections we measure the electrostatic effectson each probe of common charge perturbations due to mutation,pH titration, and ligand binding.
Electrostatic Fields Within the KSI Active Site Are Altered by RestoringAsp at Position 40. Upon changing residue 40 from Asn back toAsp, IR shifts of different magnitude and direction were regis-tered by each probe (Fig. 2 D–F). The peak widths in either back-ground were similar, suggesting that mutations at residue 40 donot affect the dynamics or flexibility at any of the probe sites. Re-latively small shifts, defined as ΔνD40NCN ¼ νD40NCN − νD40CN , of +0.6and þ0.8 cm−1 were observed for the nitriles of F86C-CN andM105C-CN, respectively, and a larger −1.7 cm−1 shift was ob-served for the M116C-CN nitrile. These shifts by each probe,none of which involves a change in hydrogen bonding state (Fig. 3and Table 2), indicate that each nitrile experiences the electro-static effects of this mutation differently. On the basis of theseshifts, we determined that the 7 MV∕cm field dispersion sampledin D40N by probes at positions 86, 105, and 116 is reduced to3 MV∕cm with the negatively charged Asp a position 40.
Fig. 3. 13C-NMR Chemical shift versus nitrile stretching frequency for nitrileprobes in apo or ligand-bound KSI-CN variants: F86C-CN (blue, −1.6 cm−1∕ppm, R2 ¼ 0.9), M116C-CN (black, −2.2 cm−1∕ppm, R2 ¼ 0.89), and M105C-CN (red), in solid circles (data from Table 2). These results are compared todata for the model compound ethylthiocyanate in different aprotic solvents,taken from ref. 28, in green diamonds (−1.7 cm−1∕ppm, R2 ¼ 0.68). Hydrogenbond corrections of −13 and −10 cm−1, applied to the nitrile stretching fre-quency of F86C-CN and M116C-CN, respectively, as described in the text, givethe values shown with blue and black open circles, respectively. For a com-bined dataset including ethylthiocyanate, M105C-CN, and the correctedF86C-CN and M116C-CN values, the best fit line gives a slope of −1.8 cm−1∕ppm, R2 ¼ 0.83. Data points are numbered for ethylthiocyanate in dimethyl-sulfoxide (1), dimethylformamide (2), acetone (3), methylene chloride (4), tet-rahydrofuran (5), chloroform (6), toluene (7), and cyclohexane (8). Data forKSI-CN variants are numbered 9–19: apo M116C-CN/D40N (9), apo M116C-CN(10), M116C-CN/D40N•equilenin (11), M116C-CN∕D40N • 3-F-4-NO2-phenol(12), M116C-CN∕D40N • 4-NO2-phenol (13), apo F86C-CN (14), apo F86C-CN/D40N (15), F86C-CN/D40N•equilenin (16), apo M105C-CN/D40N (17), apoM105C-CN (18), and M105C-CN∕D40N • 3-F-4-NO2-phenol (19).
Fig. 4. Absorption (A) and Stark (B) spectra for KSI-CN variants. (A) Absorp-tion spectra of the apo enzymes at 77 K in 50% glycerol/water at 10–15 mM,scaled to a common concentration and path-length. From left to right,M105C-CN, M106C-CN, and F86C-CN in red, black, and blue, respectively.(B) Vibrational Stark spectra of the same samples, scaled to a common valueof applied field equal to 1 MV∕cm. M116C-CN and F86C-CN are further scaled4X and 8X, respectively, for ease of visualization (broader absorption featuresnecessarily result in smaller features in a Stark spectrum as the Stark spectrumis proportional to the second derivative of the absorption). Analytical fre-quency-weighted second derivatives of the absorption spectra of A areplotted with dashed lines next to the corresponding Stark spectrum.
*The local field correction factor describes the enhancement of the local field in thevicinity of the probe, with respect to the applied field in a Stark experiment, due todifferences in the solvent and solute dielectric properties. In general, it is a tensorproperty but can be approximated with a scalar and has been calculated (48) to fallwithin a range of 1 < f < 1.3, with the larger value for larger dielectric differences.
Fafarman et al. PNAS ∣ February 7, 2012 ∣ vol. 109 ∣ no. 6 ∣ E303
To understand the electrostatic effects of the D40N mutation,we first had to establish the protonation states of the ionizableresidues in the active site before and after the mutation. Priorfunctional studies of catalysis by wild-type KSI from P. putidarevealed a pKa of approximately 4 that was assigned to the gen-eral base, D40 (50). Upon mutation of D40 to Asn, phenolateand equilenin binding studies suggested an enzymatic pKa of ap-proximately 6 that was provisionally assigned to the oxyanion holeresidue, D103 (Fig. 1B) (32). This assignment was based on workwith the homologous KSI from Comamonas testosteroni thatsuggested that D103 has an elevated pKa of approximately 9 inWT, due to electrostatic repulsion from negative charge on D40and burial in a hydrophobic pocket, but a lower pKa in D40Nin the absence of charge repulsion from D40 (51). We testedthese assignments using state-of-the-art algorithms to predict pKavalues for active site residues [H++ (52), PROPKA (53), andKarlsberg+ (54); see SI Materials and Methods and Table S2] inwild type and D40N KSI from P. putida. These computationalmethods predicted that the D40N mutation, which ablates thenegative charge at position 40, lowers the pKa of D103 from >9in wild type to 7� 1 in D40N (Table S2). The D40N mutation isthus predicted by these computational methods to result incharge migration from position 40 to position 103 in apo P. putidaKSI at neutral pH. All other residues in and around the activesite, including Y16, Y32, and Y57 (Fig. 1), were predicted bycomputation to titrate with pKa values greater than 11 (Table S2).
Electrostatic Fields Within the KSI Active Site Are Altered by pH Titira-tion.The functional results described above provide evidence thatthe D40N mutation is accompanied by ionization of a nearbyresidue whose pKa has been lowered to a value near 7 due to thismutation. To study the effects of this ionization alone and thus tounderstand its contribution to the net electrostatic effect of theD40N mutation, we compared the changes sensed by the probesin response to raising the buffer pH from 5.6 to 7.8, values atwhich we expected this nearby residue to be neutral or ionized,respectively. Shifts, defined as ΔνpHCN ¼ νpH8
CN − νpH6CN , of +1, 0, and
−2 cm−1 were observed for F86C-CN, M105C-CN, and M116C-CN, respectively (Fig. 2 J–L). These values recapitulate the ap-proximate size and direction of the IR shifts observed above(Fig. 2 D–F) due to mutation of residue 40 from Asp to Asn. Thissuggests that the ionization of this nearby residue, affected eitherby pH or as an adventitious consequence of the D40N mutation,makes a larger contribution to the observed IR shifts of ourprobes than the ablation of charge at position 40 due to the D40Nmutation itself.
Electrostatic Modeling Suggests Ionization of an Active Site Tyr inD40N. Literature precedent (32), pKa prediction calculations, andsimple chemical reasoning all suggested that the D40N mutationresulted in charge transfer from D40 to D103, with a resultingpKa for D103 near 7 in D40N. However, the following analysismotivated us to question this assumption. We compared the ob-served frequency shifts to those predicted from continuum elec-trostatic modeling with DelPhi (55, 56), to test whether thesepredicted charge configurations were consistent with the electro-static field changes reported by the IR probes above. As summar-ized in Fig. 5, the predicted shifts assuming that D103 was theionizing residue in D40N disagreed with the experimental resultsfor each probe position. Even though we would not expect quan-titative agreement between calculation and experiment, we weresurprised by the enormity of the discrepancies at each probeposition.
The disagreement between measured field changes and thepredicted effects due to D103 ionization can be readily appre-ciated using Coulomb’s law, Eq. 1, and the distances and anglesbetween each probe and D103 shown in Fig. 2 G and H (for alist of angles, distances and Coulomb’s law calculations, see
Table S3). Based on the 5.7- and 3.5-Å proximity of D103 (circledin red) to M105C-CN and F86C-CN, respectively, and the 107°and 68° angles formed by the nitrile bond vector and the vectorbetween the probe and the carboxylate group, the ionization ofD103 would be expected to result in large −15 and þ22 MV∕cmfields at these probe positions. In contrast to this expectation,only small shifts are observed for these probes (Fig. 2 J andK). The failure of electrostatic modeling based on ionizationof D103 to account for our observed IR shifts motivated us toconsider whether a residue other than D103 might be ionizingin the D40N mutant.
The only other titratable residues within the active site areY16, Y32, and Y57, which form an extended hydrogen bondnetwork in the oxyanion hole (Fig. 1B). Although computationalpKa predictions for these Tyr residues all gave values greater than11 (see above), we nonetheless used Delphi to predict IR shiftsbased on ionization of each of these residues, as done above forD103, and compared these predictions to the observed shifts formutation of D40 to Asn (Fig. 5). Surprisingly, ionization at anyof these residues did a better job of accounting for the observedfrequency shifts than ionization of D103, with residue Y57 givingthe closest congruence. We therefore turned to experiments thatcould directly assess whether an ionized tyrosine was present inthe enzyme at neutral pH.
UV and Tyr 13C NMR Spectra Identify an Ionized Tyr in the D40N ActiveSite. UV absorbance provides a sensitive probe of possible tyro-sine ionization within KSI, as the absorbance peak centered at280 nm for neutral tyrosine shifts to 295 nm upon ionization (57).As shown in Fig. 6 there is an increase in absorbance at 295 nmin the UV spectrum of the D40N mutant that titrated with anapparent pKa of 6.3� 0.1 as the solution pH was raised from4.7 to 10.5, suggesting ionization of a Tyr residue within unli-ganded KSI D40N with this pKa.†
Fig. 5. Comparison of experimental electrostatic field changes (in MV/cm)observed at each probe site and predicted field changes calculated for eachprobe site based on ionization of different active site residues using DelPhiand the experimental Stark tuning rate. Comparison of experimental versuscalculated field changes are made for D40 versus D40N (A–B) and for raisingthe pH from 6 to 8 (C–D). A and C show the sign and magnitude of the ob-served (black) and predicted shifts side by side, with predictions for the sce-narios in which D103, Y16, Y32, or Y57 (red, green, blue, and magenta,respectively) lose a proton due to mutation or raising the pH. B and D showthe magnitude of the error in the predicted shift depending on the choice forthe group undergoing ionization at each of the probe sites, 105, 86, and 116(orange, light blue, and gray, respectively).
†Similar results are obtained for the probe modified KSI-CN variants (SI Text and Fig. S5)
E304 ∣ www.pnas.org/cgi/doi/10.1073/pnas.1111566109 Fafarman et al.
To directly test for the presence of an ionized Tyr in pKSI atneutral pH, we turned to 13C NMR studies of KSI containing Tyrresidues labeled with 13C at position Cζ , the carbon adjacent tothe hydroxyl group, as the chemical shift of this carbon is exqui-sitely sensitive to the ionization state of Tyr. For tyrosine-contain-ing peptides in neutral water, Cζ has a 13C chemical shift of155.5 ppm for a protonated Tyr that shifts downfield nearly11 ppm to 166.3 ppm upon ionization (58). Wild-type and theD40N mutant of pKSI were expressed in cells grown in a minimalM9 medium containing 13Cζ-labeled tyrosine, and 13C-NMRspectra were obtained. KSI from P. putida contains four tyrosines:Y16, Y32, and Y57 form an active site hydrogen bond networkwith each other, and Y119 is located on the protein surface nearthe dimer interface and far from the active site. For WT KSI, D40is expected to be the only ionized active site residue. Consistentwith this expectation, we observed a cluster of peaks in the 13CNMR spectrum of WT KSI with chemical shifts around 158 ppm,very similar to the expected position for a protonated Tyr(Fig. 7A). The peak at 157.5 ppm is approximately twice as in-tense as the flanking peaks at 157.0 and 158.5 ppm, suggestingthat two of the Tyr residues in WT KSI have identical chemicalshifts.
In contrast, the 13C NMR spectrum of D40N at pH 7 displaysfour well-resolved peaks (Fig. 7B). The most upfield peak at157.5 ppm is very similar to the expected chemical shift for a neu-tral tyrosine in water. This peak can be assigned to the surfaceresidue Y119 based on its selective disappearance in the 13C spec-trum of the Y119F/D40N mutant (Fig. S4). The three remainingpeaks are observed at 159.7 ppm, 161.6 ppm, and 165.4 ppm, alldownfield of the chemical shift expected for neutral Tyr. Thepeak at 165.4 ppm is deshielded by nearly 8 ppm relative to thepeak at 157.5 ppm for neutral Y119 and is within 1 ppm of thechemical shift expected for a fully ionized Tyr in aqueous solu-tion.‡ On the basis of our UVand 13C NMR results, we concludethat an active site Tyr is indeed ionized in unliganded D40N atneutral pH, consistent with our prediction above based on quan-titative modeling of the IR peak shifts for our nitrile probes.
Electrostatic Fields Within the KSI Active Site Are Altered by Bindinga Charged Ligand. As a final test of how fields in the KSI activesite are affected by a local charge perturbation, we measured theelectric field changes associated with binding of a charged ligand.The ligands 3-fluoro-4-nitrophenol (3F,4-NO2-phe), and 4-nitro-phenol (4NO2-phe) were previously shown to bind KSI D40N asanions and have been studied as transition state analogs (32, 59).As shown in Fig. 7C, binding of 4NO2-phe to D40N shifts theobserved 13Cζ resonances for KSI Tyr residues into the chemicalshift range expected for neutral tyrosine. Thus, binding of 4NO2-phe to D40N results in migration of negative charge from anactive site Tyr to the phenolate oxygen. Using the IR frequencydifference upon ligand binding, defined asΔνligandCN ¼ νD40N•ligand
CN −νD40NCN , the average Stark tuning rate of 0.65 cm−1∕ðMV∕cmÞ, andEq. 1, we determined that binding of 4-nitrophenol results infield shifts of +6.5,−1.1, andþ1.1 MV∕cm for probes at position116, 105, and 86, respectively. Similar values are observed for3F,4-NO2-phe (Table 2). The large þ6.5 MV∕cm shift observedfor M116C-CN upon 4-NO2-phe binding is consistent with theclose proximity (<4 Å) of this probe to the phenolate oxygenand is nearly as large as the 8 MV∕cm site-to-site field variationobserved in apo D40N.
Discussion and ConclusionsElectrostatic Heterogeneity Within an Enzyme Active Site.X-ray crys-tallography has contributed enormously to our understanding ofprotein structure. Nevertheless, translating the pictures of thechemically heterogeneous milieu of charged, polar, and hydro-phobic groups yielded by X-ray crystallography into a quantitativeunderstanding of the highly heterogeneous and anisotropic elec-trostatic environment has remained one of the most challengingand elusive goals of protein biophysics. Using thiocyanate vibra-tional probes incorporated at multiple positions and orientationswithin the active site of bacterial ketosteroid isomerase, we haveexploited the directional nature of the nitrile stretching vibrationand its exquisite electric field sensitivity to determine that electricfields within the KSI active site vary up to 8 MV∕cm, and futurestudies of additional probe positions may give a larger range.
To put this magnitude of site-to-site field heterogeneity incontext, consider that a positive and a negative elementary unitof charge separated from each other by 1 Å represents a dipole of5 Debye. The polar covalent bonds present within amino acids orthe KSI steroid substrate typically have bond dipoles in the rangeof 1–4 Debye. The difference in electrostatic stabilization of a 5Debye dipole situated with the position and orientation of thenitrile of L61C-CN versus that of M105C-CN can be calculated
Fig. 6. pH titration of the UV absorbance at 300 nm for pKSI D40N. The mo-lar absorptivity change at 300 nm is plotted relative to the value observedwith an external buffer pH of 4.7. A two-stage sigmoidal curve was fit tothe data, yielding a pKa of 6.3 for the lower pKa. The dashed line showsthe molar absorptivity change at 300 nm observed for the tyrosine deproto-nation in aqueous buffer. Inset: UV-vis absorption difference spectra for KSID40N (solid) and aqueous tyrosine (dashed), calculated from the pH 9.1 minuspH 5.5, and pH 14 minus pH 4.7 spectra, respectively.
Fig. 7. 13C-NMR spectra for 13Cζ-Tyr-labled KSI. (A–C) apo-WT, apo-D40N andD40N in complex with 4-NO2-phenolate, respectively. Spectra were taken in40 mM potassium phosphate, pH 7.1, 23 °C. Chemical shifts for the neutraland ionized tyrosine in small unstructured peptides (58) are shown withdashed lines.
‡We attempted to titrate the observed downfield peak by recording NMR spectra frompH 8 to pH 6. However, as the pH was lowered below 7 the downfield shifted peaks wereobserved to broaden, becoming difficult to distinguish from noise below pH 6.4, suggest-ing a complex exchange mechanism. A more detailed discussion can be found in SI Text.
Fafarman et al. PNAS ∣ February 7, 2012 ∣ vol. 109 ∣ no. 6 ∣ E305
from ΔE ¼ −Δ ~μdipole • ΔF and equals 2 kcal∕mol. Thus, mea-sured differences in the local electrostatic fields within the KSIactive site due to differences in location or orientation are ofsufficient magnitude to result in significant energetic effects onindividual bond dipoles, if properly aligned and if the surroundingdipoles are sufficiently restricted from rearrangement. Similararguments apply to differential stabilization of dipolar transitionstates.
Prior reports of electrostatic variation sampled within proteinsgenerally explored either changes in response to charge pertur-bation, or site-to-site differences, whereas this study encom-passed both features. In the first case, the stretching vibration ofCO bound to myoglobin (17, 60) and a nitrile-containing inhibitorbound at the active site of human aldose reductase (46) exhibiteda range of frequencies in response to mutations in the vicinity ofthe probe. The vibrational Stark model presented for these bandshifts translated into electrostatic changes of 15 and 13 MV∕cm,respectively. However, the largest shifts coincided with cases thatlikely involved the making or breaking of hydrogen bonds to theprobe, as hypothesized on structural grounds (46, 61), whichwould convolute the observed effects (28). In the second case, thechemical shift dispersion for 19F-labeled amino acids incorpo-rated at multiple locations within galactose binding protein werecalibrated using a computational model to suggest that site-to-sitevariations in the projection of the electrostatic field on the C─Fbond vector as large as 40 MV∕cm occur (20). However, conflict-ing computational arguments have been made that short-rangechemical interactions (i.e., van der Waals interactions) betweenfluorine atoms and surrounding groups can dominate the chemi-cal shift dispersion rather than local electrostatics (19, 62, 63).
While it may not be possible to completely isolate long-rangeelectrostatic effects from these examples of specific local interac-tions, our work suggests that, in select cases, such effects can becontrolled and corrected for by determining Stark tuning rates(Fig. 4), vibrational frequencies, and 13C NMR chemical shifts(Fig. 3 and Table 2) for the nitrile probes. In particular, the re-lationship between the nitrile’s NMR chemical shift and vibra-tional frequency allows for a separate accounting for hydrogenbond contributions, in contrast to electric field observables suchas those provided by modeling pKa shifts and for which no suchstraightforward corrections are currently possible. Furthermore,use of a spectator probe that experiences field changes remo-tely, rather than participating in a chemical change as part ofthe observation, greatly simplifies the interpretation. Thus, ourmeasurements of both charge perturbations and site-to-sitevariations, based entirely on experimental data, represent thecleanest isolation of electrostatic field effects in proteins obtainedto date. Nevertheless, future experimental tests and computa-tional comparisons will be needed to further define the capabil-ities and limitations of this approach.§
Local Versus Global Determinants of the Electrostatic Environment.The large size of enzymes relative to simple chemical catalystshas prompted many questions regarding the role of the globalprotein structure in shaping the catalytic properties of active sites.Unlike the significant, collective contribution of distal or nonac-tive site residues to the positioning of binding and catalytic groupswithin active sites, a role for these distal residues in shaping elec-trostatic properties of active sites has remained uncertain. Elec-trostatic effects are additive and therefore always a collectiveproperty of all residues. However, the relative contributions ofdiscrete charges and dipoles to the collective sum is unknown.
For KSI, the 7 MV∕cm field variation registered by probes atpositions 86, 105, and 116 in apo D40N is reduced to 2 MV∕cmupon reversion to D40, and reduced to zero within experimentalerror upon binding the ligand 4-nitrophenolate (Table 2). Thus,rearrangement of a single charge can result in local field changesthat approach the magnitude of static field variation within theactive site. This observation suggests that the site-to-site variabil-ity in local electrostatic fields in KSI is dominated by the specificlocation of nearby charges rather than the collective electrostaticeffects exerted by many residues throughout the protein.
Limited Electrostatic Rearrangement Within Active Sites. Two relatedobservations in this report support the long-held view that struc-tural organization of proteins during folding restricts electrostaticrearrangement and place quantitative limits on the extent of anysuch rearrangements. Our observation that charge perturbationsseparated by several angstroms from the probes can lead to sub-stantial electrostatic changes (Fig. 2) provides evidence for lim-ited electrostatic attenuation due to restricted motion of proteingroups and limited water penetration into the protein interior.The observation of qualitative agreement between measuredfield changes and those calculated with continuum electrostatics,assuming a value of 2 for the internal dielectric, also argues forlow electrostatic screening. However, we stress that computa-tional models based on a uniform “protein dielectric” are an in-adequate description of the heterogeneous protein environment,as noted by others (6, 11).
While the charge transfers explored in this manuscript repre-sent changes that have equilibrated with the surrounding proteinmatrix, understanding nonequilibrium effects due to transientcharge perturbations remains an important challenge. In a sepa-rate study, we have carried out time-resolved measurementsof the changes in vibrational frequency of these same nitrile-modified KSI constructs following photoexcitation of a boundchromophore. These experiments provide a measure of the elec-trostatic changes within the protein matrix in response to thenear-instantaneous creation of an excited state dipole in the KSIactive site (65). The results of this study, especially the observa-tion that the magnitude of the initial electric field-induced shiftand the orientation of the nitrile remain constant over the pico-second time-scale of the experiment suggest an effectively rigidstructural and electrostatic environment on this time scale. Thisobservation complements the finding in the current study of lim-ited steady-state electrostatic rearrangement in response tocharge perturbation.
Observation of an Ionized Tyr in the KSI D40NActive Site.An apparentpKa of 6.3, tentatively assigned to Y57 based on electrostaticmodeling, represents a 3.7 unit perturbation from the solutionpKa value of 10 for the tyrosine side chain in aqueous peptides(58) and occurs in the absence of a nearby stabilizing counter-ion.In contrast, ionized tyrosine residues in calmodulin, dTDP-glu-cose-4,6-dehydratase, UDP-galactose-4-epimerase and alanineracemase, the only prior literature reports to our knowledgefor tyrosine residues with pKa values near 6, appear to be stabi-lized by proximal positively charged side-chains or metal atoms(66–69). The role played by the unique and extended hydrogenbond network, that includes Y16, Y57, Y32 and multiple watermolecules, in shaping the unusual acidity of the tyrosine residuein D40N is the subject of an upcoming study.
Computational Prediction Versus Experimental Measurement of Pro-tein Properties.We have leveraged the strengths of computationalmodeling to extend and deepen our understanding of electro-static fields and features within KSI, while also highlighting cri-tical limitations in current computational approaches, as havebeen raised on theoretical grounds (7, 8). The algorithms wetested universally erred in predicting the relative pKa values for
§While it is theoretically possible to also extract the absolute value of the electric fieldprojection with this model by comparing the measured frequency with a gas-phase(i.e., zero external field) frequency measurement, there are multiple features of thegas-phase to condensed-phase frequency shift that are not captured by electrostaticsalone. For an introduction to this topic see ref. 64.
E306 ∣ www.pnas.org/cgi/doi/10.1073/pnas.1111566109 Fafarman et al.
D103 and the experimentally identified titratable active site tyr-osine in the D40N mutant of P. putida KSI. This failure is not asubtle effect due to ionization of the first of two residues of nearlyequal pKa creating a charge-repulsion interaction that raisesthe pKa of the second residue; even for the D40N/D103N doublemutant, the active site tyrosines are predicted to have pKa valuesabove 11 (additional discussion in SI Text). In light of the complexhydrogen bond network that appears to underpin the unusuallylow tyrosine pKa observed, we speculate that simple continuumelectrostatic models for the protein and solvent are inadequateto have predicted this observation.
Without experimental knowledge of the ionization states forall residues in the active site in all scenarios of mutation, ligandbinding and pH (a problem common to all but the most exhaus-tively characterized proteins), we found irreconcilable discrepan-cies between the electrostatic field differences measured by ournitrile probes and continuum electrostatic calculations or evensimple arguments based on Coulomb’s law. However, computa-tional models for the change in electrostatic field felt by ournitrile probes gave qualitative agreement with the experimentalresults provided that an ionization at neutral pH was assumed foran active site tyrosine residue instead of D103, with the modelsgiving the best agreement for ionization of Y57. These computa-tional results inspired UVand 13C NMR experiments in this workthat tested and confirmed ionization of a Tyr in apo D40N witha pKa of 6.3. Combined molecular mechanics sampling andcontinuum methods, the so-called MM-GBSA approach (70), theinclusion of explicit water molecules in the active site, moleculardynamics with polarizable force fields or a complete quantummechanical treatment may improve the accuracy of calculatedproperties.
This synergism between directional IR field measurements,computational modeling, and spectroscopic probes of side-chain
ionization states highlights the productive interplay between ex-periment and theory and the power of utilizing directional probesat multiple positions to triangulate local electrostatic effects. Thedirectional sensitivity of our electrostatic probes was indispensa-ble in modeling and distinguishing the effects of ionization at Y57versus other positions, and contrasts with common electrostaticcharacterizations of protein interiors in terms of nondirectionalor uniform “effective dielectric” descriptions. Finally, our studydirectly measuring field differences from multiple positions andorientations provides important benchmarks for improving com-putation modeling of proteins and can serve as a guide for design-ing future incisive tests of the functional roles and contributionsof protein electrostatics.
Materials and Methods.See SI Materials and Methods for complete experimental methodsincluding the procedure for thiocyanate and 13Cζ-tyrosine label-ing of KSI, the conditions of crystal growth for KSI-CN variants,the details of X-ray acquisition and structure solving, the para-meters for continuum electrostatic calculations with the programDelPhi and the description of instrumentation and sample pre-paration for UV-vis, IR, Stark-effect and NMR spectroscopies.
ACKNOWLEDGMENTS. We thank Corey Liu and Steve Lynch for assistancewith NMR experiments and Axel Brunger for helpful discussions. P.A.S.was supported in part by HHMI and G. Lieberman predoctoral fellowships.Funding was provided by grants to S.G.B. (National Institutes of Health GrantGM27738) and D.H. (National Science Foundation Grant MCB-1121778).Portions of this research were conducted at the Advanced Light Source, anational user facility operated by the Lawrence Berkeley National Labora-tory, and at the StanfordMagnetic Resonance Laboratory, which is supportedin part by the Stanford University Medical School.
1. Warshel A (1978) Energetics of enzyme catalysis. Proc Natl Acad Sci USA75:5250–5254.
2. Selzer T, Schreiber G (1999) Predicting the rate enhancement of protein complexformation from the electrostatic energy of interaction. J Mol Biol 287:409–419.
3. Lee L-P, Tidor B (2001) Barstar is electrostatically optimized for tight binding tobarnase. Nat Struct Mol Biol 8:73–76.
4. Getzoff ED, et al. (1992) Faster superoxide dismutasemutants designed by enhancingelectrostatic guidance. Nature 358:347–351.
5. Dong F, Zhou H (2006) Electrostatic contribution to the binding stability of protein-protein complexes. Proteins 65:87–102.
6. Schutz CN, Warshel A (2001)What are the dielectric “constants” of proteins and howto validate electrostatic models? Proteins 44:400–417.
8. Antosiewicz J, McCammon JA, Gilson MK (1996) The determinants of pKas inproteins. Biochemistry 35:7819–7833.
9. Sharp K, Honig B (1990) Electrostatic interactions in macromolecules: Theory andapplications. Annu Rev Biophys Biophys Chem 19:301–332.
10. Fersht AR, Sternberg MJE (1989) Can a simple function for the dielectric responsemodel electrostatic effects in globular proteins? Protein Eng 2:527–530.
11. Chimenti MS, Castañeda CA, Majumdar A, García-Moreno B (2011) Structural originsof high apparent dielectric constants experienced by ionizable groups in the hydro-phobic core of a protein. J Mol Biol 405:361–377.
12. Britto PJ, Knipling L, Wolff J (2002) The local electrostatic environment determinescysteine reactivity of tubulin. J Biol Chem 277:29018–29027.
13. Lu J, Kobertz WR, Deutsch C (2007) Mapping the electrostatic potential within theribosomal exit tunnel. J Mol Biol 371:1378–1391.
14. Kangas E, Tidor B (1999) Charge optimization leads to favorable electrostatic bindingfree energy. Phys Rev E Stat Nonlin Soft Matter Phys 59:5958–5961.
15. Mao JJ, Hauser K, Gunner MR (2003) How cytochromes with different folds controlheme redox potentials. Biochemistry 42:9829–9840.
16. Abbyad P, et al. (2007) Measurement of solvation responses at multiple sites in aglobular protein. J Phys Chem B 111:8269–8276.
17. Augspurger JD, Dykstra CE, Oldfield E (1991) Correlation of C-13 and O-17 chemical-shifts and the vibrational frequency of electrically perturbed carbon-monoxide—apossible model for distal ligand effects in carbonmonoxyheme proteins. J Am ChemSoc 113:2447–2451.
18. Park KD, et al. (1991) Distal and proximal ligand interactions in heme-proteins—correlations between C-O And Fe-C vibrational frequencies, O-17 and C-13nuclear-magnetic-resonance chemical-shifts. Biochemistry 30:2333–2347.
19. Feeney J, et al. (1996) F-19 nuclear magnetic resonance chemical shifts of fluorinecontaining aliphatic amino acids in proteins: Studies on Lactobacillus casei dihydro-folate reductase containing (2S,4S)-5-fluoroleucine. J Am Chem Soc 118:8700–8706.
20. Pearson JG, Oldfield E, Lee FS, Warshel A (1993) Chemical-shifts in proteins—a shield-ing trajectory analysis of the fluorine nuclear-magnetic-resonance spectrum of theEscherichia-coli galactose binding-protein using a multipole shielding polarizabilitylocal reaction field molecular-dynamics approach. J Am Chem Soc 115:6851–6862.
21. Augspurger JD, Dykstra CE (1993) Correlation of F-19 chemical shielding and chemi-cal-shift nonequivalence. J Am Chem Soc 115:12016–12019.
22. Voinov MA, Ruuge A, Reznikov VA, Grigor’ev IA, Smirnov AI (2008) Mapping localprotein electrostatics by EPR of pH-sensitive thiol-specific nitroxide. Biochemistry47:5626–5637.
23. Czerwinski RM, et al. (1999) Effects of mutations of the active site arginine residuesin 4-oxalocrotonate tautomerase on the pKa values of active site residues and on theph dependence of catalysis. Biochemistry 38:12358–12366.
24. Suydam IT, Boxer SG (2003) Vibrational Stark effects calibrate the sensitivity of vibra-tional probes for electric fields in proteins. Biochemistry 42:12050–12055.
25. Chattopadhyay A, Boxer SG (1995) Vibrational Stark effect spectroscopy. J Am ChemSoc 117:1449–1450.
26. Andrews SS, Boxer SG (2000) Vibrational stark effects of nitriles I. Methods andexperimental results. J Phys Chem A 104:11853–11863.
27. Andrews SS, Boxer SG (2002) Vibrational Stark effects of nitriles II. Physical origins ofstark effects from experiment and perturbation models. J Phys Chem A 106:469–477.
28. Fafarman AT, Sigala PA, Herschlag D, Boxer SG (2010) Decomposition of vibrationalshifts of nitriles into electrostatic and hydrogen-bonding effects. J Am Chem Soc132:12811–12813.
29. Feierberg I, Aqvist J (2002) The catalytic power of ketosteroid isomerase investigatedby computer simulation. Biochemistry 41:15728–15735.
30. Warshel A, Sharma P, Chu Z, Aqvist J (2007) Electrostatic contributions to binding oftransition state analogues can be very different from the corresponding contribu-tions to catalysis: Phenolates binding to the oxyanion hole of ketosteroid isomerase.Biochemistry 46:1466–1476.
31. Chakravorty DK, Hammes-Schiffer S (2010) Impact of mutation on proton transferreactions in ketosteroid isomerase: Insights from molecular dynamics simulations.J Am Chem Soc 132:7549–7555.
32. Kraut D, et al. (2006) Testing electrostatic complementarity in enzyme catalysis: Hy-drogen bonding in the ketosteroid isomerase oxyanion hole. PLoS Biol 4:e99.
33. Sigala PA, Fafarman AT, Bogard PE, Boxer SG, Herschlag D (2007) Do ligand bindingand solvent exclusion alter the electrostatic character within the oxyanion hole of anenzymatic active site? J Am Chem Soc 129:12104–12105.
Fafarman et al. PNAS ∣ February 7, 2012 ∣ vol. 109 ∣ no. 6 ∣ E307
34. Xue L, Talalay P, Mildvan AS (1990) Studies of the mechanism of the delta-5-3-ketos-teroid isomerase reaction by substrate, solvent, and combined kinetic deuterium-isotope effects on wild-type and mutant enzymes. Biochemistry 29:7491–7500.
35. Choi G, et al. (2000) Asp-99 donates a hydrogen bond not to tyr-14 but to the steroiddirectly in the catalytic mechanism of Delta(5)-3-ketosteroid isomerase from Pseudo-monas putida biotype B. Biochemistry 39:903–909.
36. Kim SW, et al. (1997) High-resolution crystal structures of Delta(5)-3-ketosteroidisomerase with and without a reaction intermediate analogue. Biochemistry36:14030–14036.
38. Kim S, et al. (1997) Mutational analysis of the three cysteines and active-site asparticacid 103 of ketosteroid isomerase from Pseudomonas putida biotype B. J Bacteriol179:7742–7747.
39. Fafarman AT, Webb LJ, Chuang JI, Boxer SG (2006) Site-specific conversion of cysteinethiols into thiocyanate creates an IR probe for electric fields in proteins. J Am ChemSoc 128:13356–13357.
40. Sigala P, et al. (2008) Testing geometrical discrimination within an enzyme active site:Constrained hydrogen bonding in the ketosterold isomerase oxyanion hole. J AmChem Soc 130:13696–13708.
41. Lindquist BA, Corcelli SA (2008) Nitrile groups as vibrational probes: Calculationsof the C N infrared absorption line shape of acetonitrile in water and tetra-hydrofuran. J Phys Chem B 112:6301–6303.
42. Choi J-H, Oh K-I, Lee H, Lee C, Cho M (2008) Nitrile and thiocyanate IR probes: Quan-tum chemistry calculation studies and multivariate least-square fitting analysis. JChem Phys 128:134506.
43. Reimers JR, Hall LE (1999) The solvation of acetonitrile. J Am Chem Soc121:3730–3744.
44. Suydam I, Snow C, Pande V, Boxer S (2006) Electric fields at the active site of anenzyme: Direct comparison of experiment with theory. Science 313:200–204.
45. Stafford AJ, Ensign DL, Webb LJ (2010) Vibrational Stark effect spectroscopy atthe interface of Ras and Rap1A bound to the Ras binding domain of RalGDSreveals an electrostatic mechanism for protein-protein interaction. J Phys Chem B114:15331–15344.
46. Webb LJ, Boxer SG (2008) Electrostatic fields near the active site of human aldosereductase: 1. New inhibitors and vibrational stark effect measurements. Biochemistry47:1588–1598.
47. Dalosto SD, Vanderkooi JM, Sharp KA (2004) Vibrational stark effects on carbonyl,nitrile, and nitrosyl compounds including heme ligands, CO, CN, and NO, studiedwith density functional theory. J Phys Chem B 108:6450–6457.
48. Bublitz G, Boxer S (1997) Stark spectroscopy: Applications in chemistry, biology, andmaterials science. Annu Rev Phys Chem 48:213–242.
49. Fafarman AT, Boxer SG (2010) Nitrile bonds as infrared probes of electrostatics inribonuclease S. J Phys Chem B 114:13536–13544.
50. Yun YS, et al. (2003) Origin of the different pH activity profile in two homologousketosteroid isomerases. J Biol Chem 278:28229–28236.
51. Thornburg L, et al. (1998) Electrophilic assistance by Asp-99 of 3-oxo-Delta 5-steroidisomerase. Biochemistry 37:10499–10506.
52. Gordon JC, et al. (2005) Hþþ: A server for estimating pKas and adding missing hydro-gens to macromolecules. Nucleic Acids Res 33:W368–W371.
53. Bas DC, Rogers DM, Jensen J (2008) Very fast prediction and rationalization of pKa
values for protein-ligand complexes. Proteins 73:765–783.54. Kieseritzky G, Knapp E (2008) Optimizing pKa computation in proteins with pH
adapted conformations. Proteins 71:1335–1348.55. Sitkoff D, Sharp K, Honig B (1994) Accurate calculation of hydration free energies
using macroscopic solvent models. J Phys Chem 98:1978–1988.56. Gilson MK, Sharp K, Honig B (1988) Calculating the electrostatic potential of mole-
cules in solution—method and error assessment. J Comput Chem 9:327–335.57. Li YK, Kuliopulos A, Mildvan AS, Talalay P (1993) Environments and mechanistic
roles of the tyrosine residues of delta-5-3-ketosteroid isomerase. Biochemistry32:1816–1824.
58. Richarz R, Wuthrich K (1978) C-13 NNMR chemical-shifts of common amino-acid re-sidues measured in aqueous-solutions of linear tetrapeptides H-Gly-Gly-X-L-Ala-OH.Biopolymers 17:2133–2141.
59. Petrounia I, Pollack R (1998) Substituent effects on the binding of phenols to theD38N mutant of 3-oxo-Delta(5)-steroid isomerase. A probe for the nature of hydro-gen bonding to the intermediate. Biochemistry 37:700–705.
60. Park ES, Andrews SS, Hu RB, Boxer SG (1999) Vibrational stark spectroscopy in pro-teins: A probe and calibration for electrostatic fields. J Phys Chem B 103:9813–9817.
61. Decatur SM, Boxer SG (1995) A test of the role of electrostatic interactions in deter-mining the CO stretch frequency in carbonmonoxymyoglobin. Biochem Biophys ResCommun 212:159–164.
62. Gregory DH, Gerig JT (1991) Prediction of fluorine chemical-shifts in proteins. Biopo-lymers 31:845–858.
63. Gregory DH, Gerig JT (1991) Structural effects of fluorine substitution in proteins.J Comput Chem 12:180–185.
64. Schweizer KS, Chandler D (1982) Vibrational dephasing and frequency-shifts ofpolyatomic-molecules in solution. J Chem Phys 76:2296–2314.
65. Jha SK, Ji M, Gaffney KJ, Boxer SG (2011) Direct measurement of the protein responseto an electrostatic perturbation that mimics the catalytic cycle in ketosteroid isomer-ase. Proc Natl Acad Sci USA 108:16612–16617.
66. Gerratana B, ClelandWW, Frey PA (2001) Mechanistic roles of Thr134, Tyr160, and Lys164 in the reaction catalyzed by dTDP-glucose 4,6-dehydratase. Biochemistry40:9187–9195.
67. Liu Y, et al. (1997) Mechanistic roles of tyrosine 149 and serine 124 in UDP-galactose4-epimerase from Escherichia coli. Biochemistry 36:10675–10684.
68. Pundak S, Roche RS (1984) Tyrosine and tyrosinate fluorescence of bovine testescalmodulin: Calcium and pH dependence. Biochemistry 23:1549–1555.
69. Sun S, Toney MD (1999) Evidence for a two-base mechanism involving tyrosine-265from arginine-219 mutants of alanine racemase. Biochemistry 38:4058–4065.
70. Kuhn B, Kollman PA, Stahl M (2004) Prediction of pKa shifts in proteins using acombination of molecular mechanical and continuum solvent calculations.J Comput Chem 25:1865–1872.
E308 ∣ www.pnas.org/cgi/doi/10.1073/pnas.1111566109 Fafarman et al.
Supporting InformationFafarman et al. 10.1073/pnas.1111566109I Materials and MethodsKSI Expression and Purification. Thiocyanate labeling and purifica-tion of KSI-CN variants were performed as previously described(1). The 13C-labeled KSI-CN variants were obtained by sub-stituting KCN with K13CN (Cambridge Isotope Labs) duringcyanylation, as described previously (2). For uniform 13C-tyrosinelabeling of wild-type and D40N P. putida KSI, protein expressionwas carried out in M9 minimal medium (Sigma-Aldrich), aug-mented with 1 mM MgSO4, 0.2% glucose, MEM Vitamin Solu-tion (GIBCO), 100 μg∕mL 13Cζ-labeled tyrosine (CambridgeIsotope Labs), and 25 μg∕mL of the remaining 19 naturallyoccurring L-amino acids, using previously published methods(3, 4). Site-directed mutagenesis of KSI was performed as pre-viously described (5), and sequences of all constructs were con-firmed by sequencing miniprep plasmid DNA. Protein masseswere confirmed by ESI LC/MS and were within 5 Da of theexpected values in all cases.
NMR Spectroscopy of KSI Variants Containing 13C-Tyrosine or a 13C-Ni-trile.One-dimensional 13C NMR spectra were acquired on VarianUNITYINOVA NMR spectrometers (500 or 600 MHz, 1H fre-quency) running VNMR v6.1C and equipped with a 5 mm PFGswitchable probe or a 10 mm broadband probe operating at am-bient temperature (20 °C). Samples contained 1 mM KSI, 2 mMligand (bound samples only), 40 mM potassium phosphate(pH 7.2), 1 mM EDTA, 2 mM DTT, and 5% D2O as the locksolvent. Spectra were acquired in a 5 mm or 10 mm Shigemi sym-metrical microtube for approximately 5,000 scans and processedusing a 10 Hz line broadening. Peak positions are reported as thechemical shift value corresponding to the position of maximumintensity for each peak. 13C chemical shifts were referenced to anexternal standard of sodium 3-trimethylsilylpropionate-2,2,3,3-d4(0 ppm) under identical solvent and temperature conditions.
KSI X-ray Crystallography. Crystals of KSI-CN variants in spacegroup P21 were obtained using hanging drop vapor diffusion bymixing 2 μL of 30 mg∕mL KSI (also containing equimolar equi-lenin in the cases of the F86C-CN/D40N•equilenin and M105C-CN/D40N•equilenin structures) with 2 μL of reservoir solution(1.1 M ammonium sulfate, 40 mM potassium phosphate (pH 7.2),1 mM EDTA). Blade-shaped crystals appeared after incubationfor 1 week at 20 °C. Cryoprotection was achieved by soaking crys-tals in a 1∶1mixture of mother liquor and 2.9 M sodiummalonatefollowed by a direct soak in 2.9 M sodiummalonate prior to flash-freezing in liquid nitrogen. Diffraction data for each KSI-CNvariant from single crystals maintained at 100 K were collected atbeamline 8.2.2 of the Advanced Light Source (Lawrence Berke-ley National Laboratory). Data were integrated and scaled usingDENZO and SCALEPACK, respectively. (6) Five percent of theobserved data were set aside for cross-validation. Data collectionand refinement statistics are summarized in Table S1.
An initial protein model for each structure was obtainedby molecular replacement with Phaser (7) using the coordinatesfrom the previously published structure of phenol bound to pKSID40N (PDB ID code 2PZV). After inspection of the σA-weighted2Fo-Fc and Fo-Fc electron density maps, a complete model wasconstructed for each structure using Coot. (8) Simulated anneal-ing refinement was carried out using a maximum-likelihoodamplitude-based target function as implemented in PHENIX. (9)Further refinement and water picking were carried out with PHE-NIX, interspersed with manual corrections and model rebuildingin Coot. A final round of refinement in PHENIX treated each
monomer as an independent TLS group. Structure factors andcoordinates have been deposited in the RCSB Protein DataBank, and the accession codes are given in Table S1. All structuralfigures were prepared using MacPyMOL (10).
FTIR Spectroscopy. IR spectra were obtained on a Bruker Vertex70 FTIR spectrometer equipped with an InSb detector and aband-pass (2;000–2;500 cm−1) interference filter from Spectro-gon. For room temperature measurements, samples were held ina gas-tight demountable liquid cell (Bruker Optics) with sapphirewindows and offset spacers (one 75 μm, and one 100 μm spaceron either side). Absorbance spectra were measured relative to abackground with buffer. Baselines were calculated using a poly-nomial fit (fourth to sixth order, depending on curvature) withroots defined at least 15 cm−1 distant from the peak maximum.Peak positions were determined using a second-derivative-basedmethod built into the OPUS FTIR software (Bruker Photonics)and are reported as the average value from three independentlyprepared samples. Pictured spectra are comprised of an un-weighted average of three independently prepared samples, aftereach spectrum is normalized to a peak height of 1. For pH de-pendence of the IR spectrum, the buffer 2-(N-morpholino)etha-nesulfonic acid (MES) was used because its buffering rangeallowed a single agent to be used across the pH range of interestand because the protein stability in this buffer allowed for mea-surements down pH values as low as 5.6 at the high (mM) proteinconcentrations required for IR. The desired pH was achieved bymixing appropriate ratios of the buffer and its sodium salt at 1 Mconcentration and adding it to a concentrated solution of the pro-tein in water, resulting in a final buffer concentration of 100 mMand final protein concentration of 2–3 mM. The pH of the pro-tein/buffer solution was confirmed by in situ measurements witha pH microelectrode that was calibrated daily.
Vibrational Stark experiments and low temperature absorp-tion spectra were acquired as described previously (11,12) usinga home-built liquid cell consisting of a pair of 1 mm thick, 13 mmdiameter sapphire windows (Meller Optics) with 40 Å of nickelvacuum deposited on the surfaces facing the sample. The nickelelectrodes were connected to a high voltage DC power supply(Trek Instruments Inc.), whose output voltage was synchronizedto the FTIR scan timing with a home-built control unit. The win-dows were separated from each other by a pair of 26-μm thickTeflon spacers and held in place with a metal clamp. The samplewas rapidly frozen by immersing the cell in a custom liquid nitro-gen cryostat (13) to form a glass. 512 scans with an applied field of1 MV∕cm were alternated with 512 scans with no applied field.Field-off scans were averaged and subtracted from the averagedfield-on scans. The Stark tuning rate was determined for eachKSI-CN construct as previously described (11, 12), and the re-ported values are the average and standard deviation of threeindependently prepared samples.
UV-vis Absorption Measurements.UV-vis spectra were obtained forthe nitrile-modified enzymes as a function of pH using a PerkinElmer Lambda 4 spectrophotometer with a 1-cm path lengthquartz cell. Difference spectra were acquired by subtraction ofthe absorption spectrum at pH 4.7 for wild type and D40N(Fig. 6), and at pH 5.3 for KSI-CN variants (Fig. S5). The higherpH value for the KSI-CN variants was necessary due to reducedsolublity at lower pH. The spectra were baseline-corrected to avalue of zero at 320 nm, and the lowest pH spectrum was sub-tracted from subsequent spectra to calculate the difference spec-
Fafarman et al. www.pnas.org/cgi/doi/10.1073/pnas.1111566109 1 of 8
tra. For D40N and WT enzymes, sodium acetate was used forpH 4.7, potassium phosphate was used in the range of 4.7 to 9.1and glycine was used in the range of 9.0 to 10, with a buffer con-centration of 10 mM in all cases. For the KSI-CN variants, 20 mMMES buffer was used and pH-adjusted by adding aliquots of0.1 M HCl while monitoring the pH with a microelectrode in situ.The enzyme concentration was 10–20 μM.
Poisson–Boltzmann Modeling. DelPhi, (14, 15) a finite differencealgorithm for solving the Poisson–Boltzmann equation, was em-ployed for each different charge-perturbation modeled above.Charge and radii parameters were taken from the PARSE para-meter set (14), which treats only heavy atoms and hydrogensattached to heteroatoms explicitly. Charge and radii parametersfor the nonnatural Cys-CN amino acid were taken from a pre-vious study (12). A dielectric of value, ϵ, of 80 was used for theprotein exterior. The value for the ϵ assigned to the protein in-terior presents an important choice: ε ¼ 2 is justified based onthe intrinsic polarizability of the chemical groups the protein iscomposed of (16), whereas it has been recognized that higherdielectric values can be employed in continuum electrostatic cal-culations to compensate for unaccounted for charge and dipolerearrangements (17,18). Through X-ray crystallography andNMR spectroscopy we have attempted to minimize the structuraland ionization state changes, respectively, that are not explicitlyaccounted for, therefore a lower value of ϵ is called for. Calcula-tions were performed for ε ¼ 2 and ε ¼ 4, with ε ¼ 2 providing alower rmsd from the experimental dataset; all calculated valuesreported were therefore taken from the ε ¼ 2 calculation. Heavyatoms positions were determined from the X-ray structures, withhydrogen atoms automatically added to heteroatoms using theprogram PDB2GMX, (19) based on database values for bond dis-tances and angles, H-bond-satisfaction criteria and unperturbedpKa values. To avoid artifacts from the finite grid treatment, aseven tier focusing routine was used. A calculation of the poten-tial on a 50 × 50 × 50 grid of 0.5 grid lines per Ångstrom, centeredaround the CN-bond and encompassing the whole protein pro-vided the initial the boundary conditions for a subsequent calcu-lation at two times finer grid spacing. This process was repeateduntil the grid spacing was 32 lines per Ångstrom. The gradient inthe potential along the CN-bond axis was calculated at each tier,and monitored for convergence; all values reported are from thefinal tier.
Error Analysis for Correction of Electric Field Measurements for Hydro-gen bond Formation. IR frequencies were corrected in cases ofdirect hydrogen bonding to a nitrile probe by subtracting a con-stant term from the vibrational frequency based on the magnitudeof its departure from the IR/NMR correlation line (Fig. 3) forethylthiocyanate in simple solvents, as described in the main text.This correction, which assumes that systematic nonelectrostaticeffects do not dominate the observed chemical shift across theseries of aprotic solvent observations (see ref. 2), introduces un-certainty in the corrected values for IR frequencies. To estimatethis uncertainty, we evaluated the degree of scatter in data pointsfrom the 13C NMR/IR correlation line of ethylthiocyanate inaprotic solvents (slope ¼ −1.66 (�28%) [cm−1∕ppm]) that wasused to make the hydrogen bond correction. The scatter in thesedata points presumably arises from environmental perturbationsof unspecified origin to either the 13C NMR or IR observable(e.g., anisotropic ring current effects on the chemical shift dueto solute-toluene complexes). We calculated the standard error inthe slope of this correlation using Eq. S1 below, where x is themeasured 13C NMR chemical shift and y is the measured IRfrequency for each ethylthiocyanate data point and obtained arelative error of 28%. This value was used as the error estimatefor each corrected IR frequency generated by subtraction of its
offset from the ethylthiocyanate correlation line.
The Stark tuning rate has two sources of error, statistical error(10% standard deviation across the three probe-sites) and the sys-tematic error due to the unknown local field correction factor,which for this situation is estimated as 10% (20). The chemicalshift error is estimated to be 0.02 ppm, or approximately 2%. Thetotal relative error in electrostatic fields calculated when compar-ing hydrogen-bonded and non-hydrogen-bonded cases is thesum of all of these relative errors, or 50%. In cases where thehydrogen bonds are not made or broken, the error is calculatedusing the uncertainty in the Stark tuning rate and the statisticalerror (i.e., standard deviation) in the measurement of the peakfrequency by IR.
II. Discussion of IR and NMR transition linewidths.As discussed in the main text, the linewidths of the nitrile IRstretching transitions for the apo-D40N KSI variants follow theorder M105C-CN < M116C-CN < F86C-CN, both at room tem-perature (Fig. 2 D–F) and at 80 K (Fig. 4). The overall linewidthof a spectroscopic transition results from the complex interplaybetween inhomogeneous broadening (due to distinct subpopula-tions with unique transition frequencies within the ensemble),motional narrowing (due to rapid interconversion between thesesubpopulations), and system-dependent excited-state lifetime-limited broadening. The observation of identical hierarchies attemperatures low enough to freeze out many motional narrowingmechanisms suggests that the observed difference in linewidthsat the three probe-sites is primarily due to inhomogeneous broad-ening. Additional evidence that linewidth differences are due todifferential contributions from inhomogenous broadening is pro-vided by the observation of an identical hierarchy of linewidths inthe 13C NMR spectra of the nitrile probes (Fig. S3). The timescale defined by the full-width-at-half-maxima (FWHM) forthe NMR peaks, approximately 100 Hz, is nine orders of mag-nitude slower than the time scale defined by the IR linewidthsof approximately 10 cm−1 or 300 GHz. Inhomogeneity that per-sists on the long time scale defined by NMR will necessarily bedetected on the much faster timescale of IR. We propose that theobserved differences in IR and NMR linewidth for the individualnitriles arise from differences in conformational heterogeneityfor each nitrile arising from differences in local packing interac-tions, as discussed in the main text.
III. Discussion of Monitoring Tyr ionization by NMR and UV-vis.We attempted to use NMR to ascertain the pKa of the mostdownfield tyrosine resonance in Fig. 7. Increasing the pH to 8resulted in no detectable change in the NMR spectrum. Loweringthe pH to 6.2 resulted in peak broadening and a diminished sig-nal-to-noise (Fig. S6). The broadening increased until the signalwas obscured but before new resonances from the protonatedtyrosine network were observed. This observation is common forwidely separated chemical shifts in dynamic exchange whose rateof exchange depends on pH (21). This effect limits the utility ofNMR for determining a pKa for this ionization. Furthermore, thebroadened resonances do not appear to disappear due to changesin relaxation time with pH. At pH 6.4, where the intensity of thepeak at 165.5 ppm is diminished relative to pH 7.1, increasing therecycle delay 4× (more than doubling the spacing between pulses)had no effect on the peak height. Fitting the downfield peak with
Fafarman et al. www.pnas.org/cgi/doi/10.1073/pnas.1111566109 2 of 8
a lorentzian lineshape allows determination of the linewidth ateach pH. Loss in peak height from pH 7.1 to pH 6.5 is exactlycompensated for by increase in peak width, so that net area isunchanged.
The change in the ultraviolet absorbance spectra upon ioniza-tion has also been used to study the tyrosine ionization state inKSI (22) and provides the means to study the pH titration withoutthe signal being obscured by chemical exchange. An increase inintensity and shift of the absorption maximum from 275 to293 nm accompanies ionization of tyrosine; additionally a strongabsorbance at 240 nm is present for ionized tyrosine. UV-vis spec-tra were obtained for the nitrile-modified enzymes as a functionof pH and difference spectra were calculated relative to the ab-sorption spectrum at pH 5.3 (Fig. S4). The choice to referencethe spectra at pH 5.3 was based on the observation of increasedabsorbance due to light scattering at lower pH values, which sug-gested protein unfolding and precipitation. The pH-dependentchanges confirmed that the probe-modified proteins experienceda change in protonation state of a tyrosine in the pH rangesexplored by in Fig. 2 J–L.
IV Discussion of pKa Prediction Algorithms.To test the ability of continuum electrostatic calculations to pre-dict active site pKa values for D103 and Y16 in D40N KSI, wesubmitted the crystal structure of the D40N and D40N/D103Nmutants to three web-based, continuum electrostatic calculationengines for the prediction of protein pKa values: H++ (23),PROPKA (24), and Karlsberg+ (25) (Table S2). These electro-static calculation engines not only fail to predict a low pKa tyr-osine in D40N but universally predict tyrosine pKa valuesperturbed upward, even for the D40N/D103N mutant, which
eliminates any charge-charge repulsions predicted due to ananion incorrectly predicted at D103. The failures of continuumelectrostatic methods for quantitatively predicting pKa valueshave previously been noted by others (26, 27), and we have pre-viously demonstrated that such disagreement between experi-ment and theory extends to electrostatic fields as well (28).However, disagreement often hinges on ambiguous structuralinformation, especially concerning the positions of protons, andin one case the agreement was shown to improve upon relaxingmodeled structures using molecular dynamics (17). Nevertheless,molecular dynamics-based structural adaptation is built in to theKarlsberg+ method (Table S2), yet this still does not lead toagreement with the experiment. In this case, a reasonable proto-nation state was used as a starting point; however, moleculardynamics by itself will not allow for the intrinsically quantum me-chanical movement of charge from one site to another or accountfor novel situations in which charge is delocalized.
V. Discussion of Electrostatic Field Calculations in Responseto Charge Perturbations.To obtain an estimate of the spectroscopic change expected toaccompany ionizations of active site residues to compare to theexperimental values, we employed the software package DelPhi(15) to calculate electric fields and Eq. 1 to calculate the spectralshift. During this study, we also explored molecular dynamics-based methods for calculating electrostatic fields present in thecourse of a simulation, using methods described previously (12).This approach was abandoned due to the preponderance of waterin the immediate vicinity of the nitrile and the well-known diffi-culties in accurately representing the interaction potential be-tween nitriles and water (29, 30).
1. Sigala PA, Fafarman AT, Bogard PE, Boxer SG, Herschlag D (2007) Do ligand bindingand solvent exclusion alter the electrostatic character within the oxyanion hole of anenzymatic active site? J Am Chem Soc 129:12104–12105.
2. Fafarman AT, Sigala PA, Herschlag D, Boxer SG (2010) Decomposition of vibrationalshifts of nitriles into electrostatic and hydrogen-bonding effects. J Am Chem Soc132:12811–12813.
3. Markley JL, Kainosho M (1993) in NMR of Macromolecules: A Practical Approach, edRoberts GCK (Oxford Univ Press, Oxford), pp 101–152.
4. Kato-Toma Y, Iwashita T, Masuda K, Oyama Y, Ishiguro M (2003) PKa measurementsfrom nuclear magnetic resonance of tyrosine-150 in class C beta-lactamase. BiochemJ 371:175–181.
5. Kraut D, et al. (2006) Testing electrostatic complementarity in enzyme catalysis: Hy-drogen bonding in the ketosteroid isomerase oxyanion hole. PLoS Biol 4:501–519.
6. Otwinowski Z, Minor W (1997) Processing of X-ray diffraction data collected inoscillation mode Methods Enzymol 276:307–326.
8. Emsley P, Cowtan K. (2004) Coot: Model-building tools for molecular graphics. ActaCrystallogr D Biol Crystallogr 60:2126–2132.
9. Adams PD, et al. (2002) PHENIX: Building new software for automated crystallo-graphic structure determination. Acta Crystallogr D Biol Crystallogr 58:1948–1954.
10. Schrödinger, LLC (2010) The PyMOL Molecular Graphics System, version 1.3r1.11. Andrews SS, Boxer SG (2000) Vibrational stark effects of nitriles I. Methods and
experimental results. J Phys Chem A 104:11853–11863.12. Fafarman AT, Boxer SG (2010) Nitrile bonds as infrared probes of electrostatics in
ribonuclease S. Phys Chem B 114:13536–13544.13. Andrews SS, Boxer SG (2000) A liquid nitrogen immersion cryostat for optical
measurements. Rev Sci Instrum 71:3567–3569.14. Sitkoff D, Sharp K, Honig B (1994) Accurate calculation of hydration free energies
using macroscopic solvent models. J Phys Chem 98:1978–1988.15. Gilson MK, Sharp K, Honig B (1988) Calculating the electrostatic potential of mole-
cules in solution—method and error assessment. J Comput Chem 9:327–335.16. Harvey SC, Hoekstra P (1972) Dielectric-relaxation spectra of water adsorbed on
lysozyme. J Phys Chem 76:2987–2994.
17. Suydam I, Snow C, Pande V, Boxer S (2006) Electric fields at the active site of anenzyme: Direct comparison of experiment with theory. Science 313:200–204.
18. Schutz CN, Warshel A (2001) What are the dielectric “constants” of proteins and howto validate electrostatic models? Proteins 44:400–417.
19. Lindahl E, Hess B, van der Spoel D (2001) GROMACS 3.0: A package for molecularsimulation and trajectory analysis. J Mol Modeling 7:306–317.
20. Andrews SS, Boxer SG (2002) Vibrational Stark effects of nitriles II. Physical origins ofstark effects from experiment and perturbation models. J Phys Chem A 106:469–477.
21. Sudmeier JL, Evelhoch JL, Jonsson NB-H (1980) Dependence of NMR lineshapeanalysis upon chemical rates and mechanisms: Implications for enzyme histidinetitrations. J Magn Reson 40:377–390.
22. Li YK, Kuliopulos A, Mildvan AS, Talalay P (1993) Environments and mechanisticroles of the tyrosine residues of delta-5-3-ketosteroid isomerase. Biochemistry32:1816–1824.
23. Gordon JC, et al. (2005) H++: A server for estimating pKas and adding missing hydro-gens to macromolecules. Nucleic Acids Res 33:W368.
24. Bas DC, Rogers DM, Jensen J (2008) Very fast prediction and rationalization ofpKa values for protein-ligand complexes. Proteins 73:765–783.
25. Kieseritzky G, Knapp E (2008) Optimizing pKa computation in proteins with pHadapted conformations. Proteins 71:1335–1348.
26. Antosiewicz J, McCammon JA, Gilson MK (1996) The determinants of pKas inproteins. Biochemistry 35:7819–7833.
27. Warshel A (1981) Calculations of enzymatic-reactions—calculations of pKa, proton-transfer reactions, and general acid catalysis reactions in enzymes. Biochemistry20:3167–3177.
28. Webb LJ, Boxer SG (2008) Electrostatic fields near the active site of human aldosereductase: 1. New inhibitors and vibrational stark effect measurements. Biochemistry47:1588–1598.
29. Choi J-H, Oh K-I, Lee H, Lee C, Cho M (2008) Nitrile and thiocyanate IR probes: Quan-tum chemistry calculation studies and multivariate least-square fitting analysis.J Chem Phys 128:134506.
30. Lindquist BA, Corcelli SA. Nitrile groups as vibrational probes: Calculations of theC N infrared absorption line shape of acetonitrile in water and tetrahydrofuran.J Phys Chem B 112:6301–6303.
Fafarman et al. www.pnas.org/cgi/doi/10.1073/pnas.1111566109 3 of 8
Fig. S1. Origins of the linear Stark effect. (A) An anharmonic potential energy function describing the CN stretching mode. As a consequence of the an-harmonicity, different average interatomic separation distances in the ground and vibrationally excited states, hxgsi and hxesi, respectively, lead to an increasein the dipole moment,Δμanh, in the excited state. The increase in the dipole moment leads to a different relative effect of an electric field on the two states, andthus a field-dependent change in the energy of excitation. The total influence of the field on the CN stretching transition also includes an effect on the forceconstant of the bond, Δμbond. For details see ref. 20. (B) Spectra for three variants of a hypothetical protein with a fixed nitrile probe. The field projection F inthe three separate constructs—wild-type, mutant 1, and mutant 2—is different in magnitude and/or angle, θ as a consequence of the mutation, leading todifferent projections ΔF, on the fixed position of Δμ. This leads to changes in the transition frequency, Δν, relative to WT.
Fafarman et al. www.pnas.org/cgi/doi/10.1073/pnas.1111566109 4 of 8
Fig. S2. 2Fo-Fc Electron density maps KSI-CN variants. The electron density, contoured at 1.5 sigma, is displayed as a wire mesh superimposed upon thestructural model shown in stick format. Carbon, oxygen, nitrogen, and sulfur atoms are shown in green, blue, red, and gold, respectively.
Fafarman et al. www.pnas.org/cgi/doi/10.1073/pnas.1111566109 5 of 8
Fig. S3. NMR spectra of 13C-nitrile labeled pKSI D40N variants. Spectral parameters are also shown for M116C-CN/D40N unfolded in 6 M urea.
Fig. S4. 13Cζ-tyrosine labeled KSI NMR spectra of the Y119F/D40N mutant (top) compared to D40N (bottom, reproduced from Fig. 7).
Fig. S5. UV-Vis difference-absorption spectra of probe-modified D40N KSI variants. (A–C) Difference spectra for pH values 5.3 to 9 (red to black) are calculatedrelative to the spectrum at pH 5.3, for M105C-CN, F86C-CN and M116C-CN, respectively. (D–F) The change in absorbance at the absorption maximum oftyrosinate, 293 nm, as a function of measured pH, for M105C-CN, F86C-CN and M116C-CN, respectively.
Fafarman et al. www.pnas.org/cgi/doi/10.1073/pnas.1111566109 6 of 8
Fig. S6. 13C NMR spectra of KSI D40N with labeled tyrosines. (A) The effect of decreasing the pH. All spectra were taken on the same sample (buffer ¼ 40 mMphosphate, no other additives; pH decreased with dropwise addition of 1 M KH2PO4). (B) Expanded view of downfield region of A, height-normalized to 1.
Table S1. X-ray data collection and structure refinement statistics
*Rmerge ¼ ∑hkl ∑i jIðhklÞi − ½IðhklÞ�j∕∑hkl ∑i IðhklÞi†Rwork ¼ ∑hkljFðhklÞo − ½FðhklÞc �j∕∑hklFðhklÞo‡Rfree was calculated exactly as Rwork where FðhklÞo were taken from 5% of the data not included inrefinement.
Table S2. pKa predictions from web-based continuum electrostaticcalculation engines


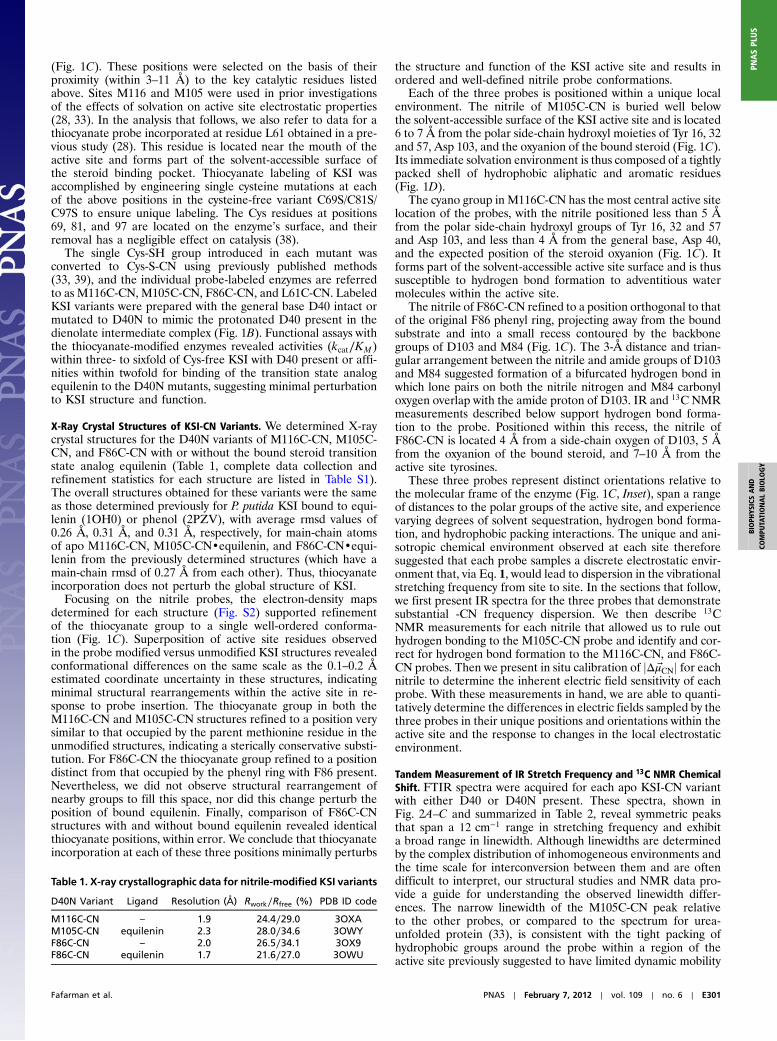

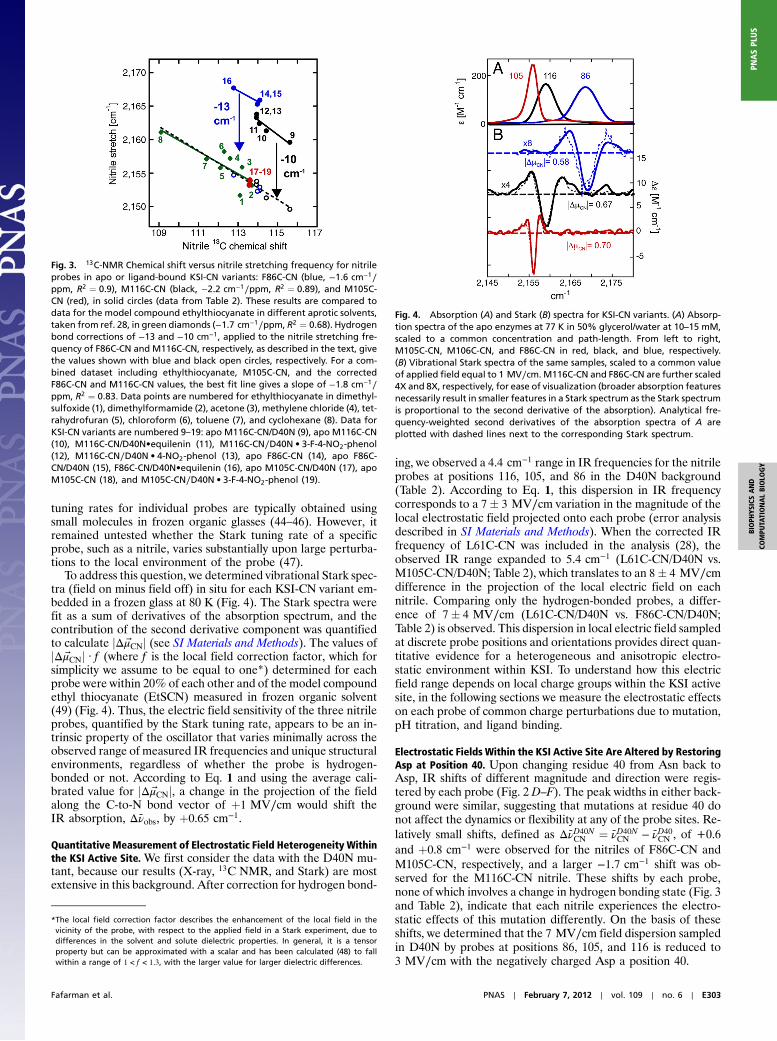
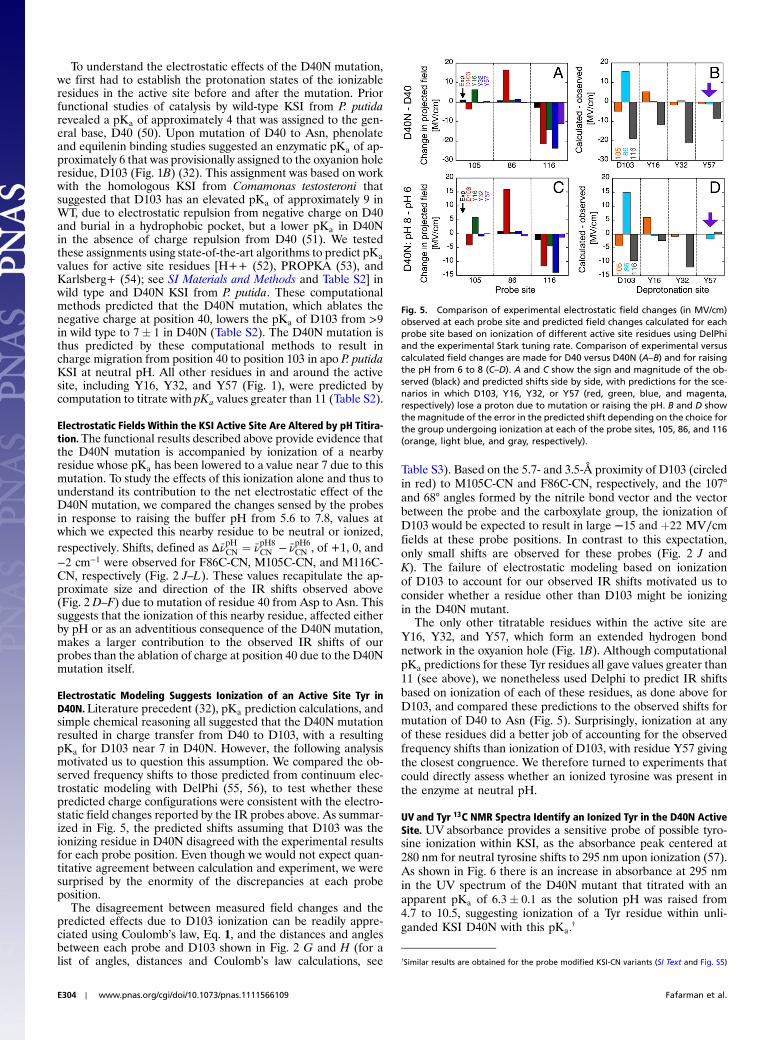


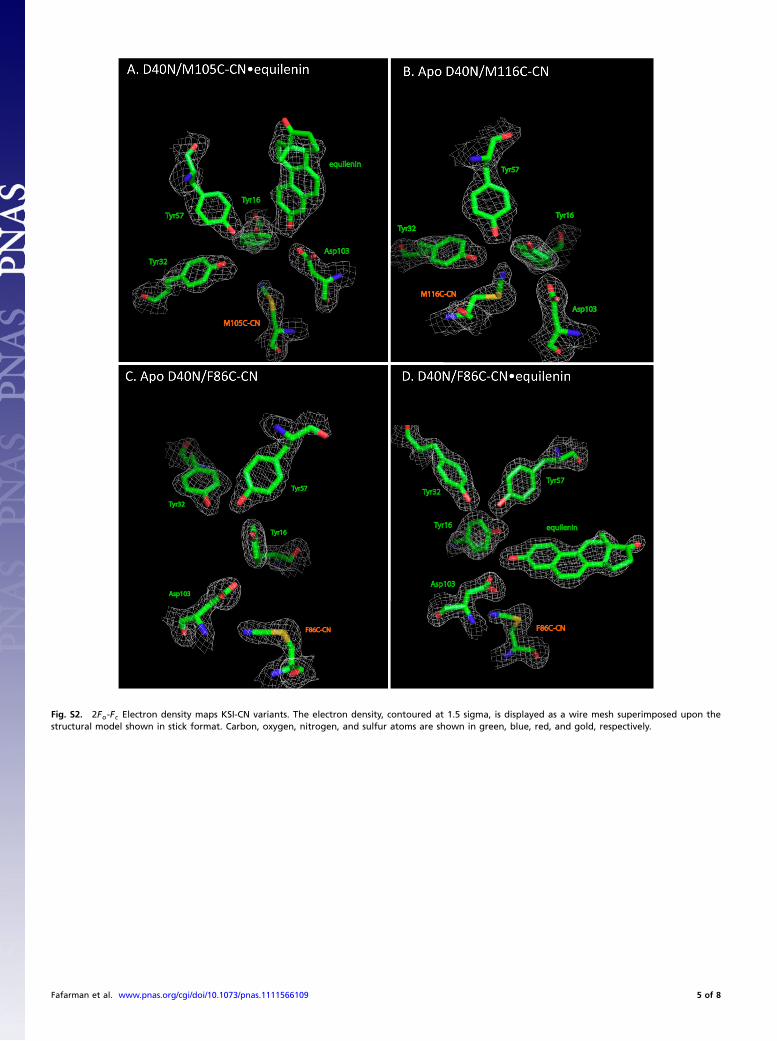


![Research Article Multivariate Analysis, Mass Balance ...downloads.hindawi.com/journals/tswj/2014/793236.pdfquantitative view of igneous petrological mechanisms [ , ]. Particularly,](https://static.documents.pub/doc/80x56/5f08debd7e708231d4241f2f/research-article-multivariate-analysis-mass-balance-quantitative-view-of-igneous.jpg)


