63
Page | 1 QUANTITATIVE RISK ASSESSMENT For BHARAT PETROLEUM CORPORATION LTD GULBARGA POL DEPOT KARNATAKA By Ultra-Tech Environmental Consultancy January 2018

Page | 1
QUANTITATIVE RISK ASSESSMENT For
BHARAT PETROLEUM CORPORATION LTD
GULBARGA POL DEPOT KARNATAKA
By
Ultra-Tech Environmental Consultancy
January 2018

POL DEPOT OF BPCL, GULBARGA
QUANTITATIVE RISK ASSESSMENT (QRA)
J-3076-S-RT-1801 Rev B1
Page | 2
Document Title : Risk Assessment Study Report
Project Title : POL DEOPT of BPCL, Gulbarga.
Client Company Name : Bharat Petroleum Corporation Ltd
HSE Consultant : UltraTech Environmental Consultancy & Laboratory
Document Number : J-3076-S-RT-1801
ACKNOWLEDGEMENT
UltraTech gratefully acknowledges the co-operation received from the management of BPCL,
Gulbarga.
DISCLAIMER
The advice rendered by Consultants is in the nature of guidelines based on good engineering practices
and generally accepted safety procedures. Consultants do not accept any liability for the same. This
Report is not intended to identify all hazards which may exist nor is it intended to be an exhaustive
review of all possible eventualities. Recommendations shown in the report are advisory in nature and
not binding on the parties involved viz. UltraTech, Bharat Petroleum Corporation Ltd.
Copying this report without written consent of Ultra Tech, Bharat Petroleum Corporation Ltd is not
permitted.
B1 25/1/18 Issued for Client Review BN SDR JS
Rev Date Comments / Nature of
Changes
Prepared
by Reviewed by
Approved
by
Approved
by(BPCL)

POL DEPOT OF BPCL, GULBARGA
QUANTITATIVE RISK ASSESSMENT (QRA)
J-3076-S-RT-1801 Rev B1
Page | 3
Table of Contents
1. EXECUTIVE SUMMARY .................................................................................................... 6
2. INTRODUCTION ............................................................................................................ 11
2.1 PROJECT BACKGROUND .......................................................................................... 11
3. QRA METHODOLOGY .................................................................................................... 13
3.1 HAZARD IDENTIFICATION ........................................................................................ 15
3.2 CONSEQUENCE ANALYSIS ....................................................................................... 15
3.3 FREQUENCY ANALYSIS ............................................................................................ 15
3.4 RISK ASSESSMENT ................................................................................................... 16
3.5 RISK EVALUATION ................................................................................................... 16
4. CONSEQUENCE ANALYSIS – BASIS AND RESULTS ........................................................... 17
5. RISK MODELLING – BASIS AND RESULTS ........................................................................ 29
5.1 FREQUENCY ANALYSIS ............................................................................................ 29
5.2 RISK CRITERIA .......................................................................................................... 31
5.3 RISK RESULTS ........................................................................................................... 32
6. RECOMMENDATIONS ................................................................................................... 36
7. LIST OF REFERENCE DOCUMENTS / STANDARDS ............................................................ 37
ANNEXURE 1 CONSEQUENCE CONTOURS ................................................................................... 38
ANNEXURE 2 ASSUMPTION REGISTER ........................................................................................ 53

POL DEPOT OF BPCL, GULBARGA
QUANTITATIVE RISK ASSESSMENT (QRA)
J-3076-S-RT-1801 Rev B1
Page | 4
ABBREVIATIONS
ALARP
BPCL
CR
ETP
FBR
FRVT
EFRVT
HSE
HZ Tank
IRPA
LFL
LOC
LSIR
NA
NR
PID
PFD
ROV
QRA
As Low as Reasonably Practicable
Bharat Petroleum Corporation Limited
Catastrophic Rupture
Effluent Treatment Plant
Full Bore Rupture
Fixed Roof Vertical Tank
External Floating Rood Vertical Tank
Health safety and Environment
Horizontal Tank
Individual Risk Per Annum
Lower Flammability Limit
Loss of Containment
Location Specific Individual Risk
Not Available
Not Reached
Piping & Instrumentation diagram
Process Flow Diagram
Remote Operated Valve
Quantitative Risk Assessment
POL DEPOT OF BPCL, GULBARGA
QUANTITATIVE RISK ASSESSMENT (QRA)
J-3076-S-RT-1801 Rev B1
Page | 5
DEFINITIONS
COMPANY Bharat Petroleum Corporation Limited (BPCL)
CONSULTANT UltraTech appointed by the COMPANY to perform PROJECT.
SITE OWNER BPCL
CONTRACT The contract between COMPANY and CONSULTANT for PROJECT
PROJECT POL Depot at Gulbarga, Karnataka
SERVICES Services being provided by UltraTech as per the CONTRACT for the PROJECT

POL DEPOT OF BPCL, GULBARGA
QUANTITATIVE RISK ASSESSMENT (QRA)
J-3076-S-RT-1801 Rev B1
Page | 6
1. EXECUTIVE SUMMARY
Bharat Petroleum Corporation Limited (BPCL has proposed POL Depot at Gulbarga, Karnataka for the
purpose of receipt, storage and dispatch of petroleum products (POL) such as Motor Spirit (MS), High
Speed Diesel (HSD), Superior Kerosene Oil (SKO) and Ethanol. BPCL has awarded UltraTech to carry
out Quantitative risk assessment for the proposed POL Depot.
This document identifies the methodology and results proposed by UltraTech and accepted by BPCL
for the completion of the Quantitative Risk Assessment Study (QRA) study.
As part of the QRA study, hazard scenarios were identified for the project facility and consequence
analysis was carried out using DNV PHAST software version 6.7. The risk analysis was carried out using
DNV PHAST RISK software version 6.7 to obtain risk results in the form of LSIR contours. These risk
results were assessed based on the Risk Acceptance Criteria and overall LSIR was found to broadly lie
in the ALARP region.
OVERALL LOCATION SPECIFIC RISK CONTOUR
Figure 1: LSIR Contour
Note: LSIR contours represent the worst-case scenario, Risk for an individual who is present at a particular
location 24 hour per day, and 365 days per year.

POL DEPOT OF BPCL, GULBARGA
QUANTITATIVE RISK ASSESSMENT (QRA)
J-3076-S-RT-1801 Rev B1
Page | 7
INDIVIDUAL RISK PER ANNUM
The LSIR values of the personnel in the Gulbarga Depot are provided in the Table 1. From this LSIR
value, the Individual Risk Per Annum (IRPA) to the personnel based on their exposure are calculated
and presented below:
Table 1 Individual Risk Per Annum
S. No Location of Interest LSIR
(per avg. year) Presence Factor IRPA RISK
1 Admin Building 7.96E-07 0.304 2.42E-07 Acceptable
2 TLF Gantry 8.74E-06 0.304 2.66E-06 ALARP
3 Railway Siding 5.29E-07 0.038 2.03E-08 Acceptable
4 TLF Pump House 1.11E-05 0.304 3.38E-06 ALARP
5 TWG Pump House 2.26E-06 0.038 8.67E-08 Acceptable
6 MS Tank farm 3.01E-06 1.000 3.01E-06 ALARP
7 HSD Tank farm 1.45E-06 1.000 1.45E-06 ALARP
8 SKO Tank Farm 4.86E-06 1.000 4.86E-06 ALARP
9 ETP 1.02E-10 0.304 3.11E-11 Acceptable
Note: IRPA represents the Risk for an individual who is present at different locations during different
periods.
Comparison of the HSE UK Risk Acceptance Criteria and the Individual Risks calculated from the
project facility shows that the estimated values of IRPA, as given in Table above broadly lies in ALARP
region.
SOCIETAL RISK
Assessment of societal risks is even more important than assessment of individual risk because they
involve the likelihood of multiple fatalities. Societal risk is the risk to any person or group of persons
who are not connected to project facilities and are outside the facility fence line.

POL DEPOT OF BPCL, GULBARGA
QUANTITATIVE RISK ASSESSMENT (QRA)
J-3076-S-RT-1801 Rev B1
Page | 8
FN CURVE:
It is helpful to consider group risk in the demonstration that risks are ALARP. This allows consideration
to be given to events, which, although low in frequency, may cause multiple injuries or fatalities.
Group risk can be presented in the form of a plot of cumulative frequency versus number of fatalities
(F‐N curve).
F = Frequency (experienced or predicted)
N = No. of multiple fatalities.
Figure 2 FN Curve
Hence, from the above graph it is seen that the Gulbarga Depot falls in ALARP category.
CONCLUSION
1. The Individual Risk Per Annum (IRPA) identified for various locations (Table 1) in the Depot falls
in the ALARP region broadly as per UK HSE Risk Acceptance Criteria.
2. The results of the QRA show that most long-ranging hazards are flash fires due to the large
volumes involved and the buoyancy of the fluid compositions assessed. The flammable gas
dispersion from MS tank Catastrophic rupture (Table 5) show that 100% LFL concentration is
dispersed at the maximum distance of 223 m which encompasses the adjacent HSD/SKO/MS
tanks, TLF gantry, TW pump house.

POL DEPOT OF BPCL, GULBARGA
QUANTITATIVE RISK ASSESSMENT (QRA)
J-3076-S-RT-1801 Rev B1
Page | 9
3. The Vapour Cloud Explosion (VCE) results present free field overpressure distances which almost
encompass the entire Depot, and therefore VCE hazards are the second largest hazard range
potential. The peak overpressure of 0.1 bar is reached at a distance of 508m and 0.3 bar is
reached at a distance of 389m affecting the BPCL installation and adjacent facilities across the
plant boundary due to Catastrophic rupture of MS tank.
4. The results of heat radiation due to jet fire from 30 mm leakage of MS pipeline from TLF pump
discharge to gantry (Table 5) show that 12.5 kW/m2 radiation levels were reached at the
maximum distances of 80 m and 37.5 kW/m2 radiation level is reached at the maximum
distances of 65m.
5. The results of heat radiation due to Pool fire from the rupture of HSD pipeline from tank to TLF
Pump shows that 12.5 kW/m2 radiation level is reached at the maximum distances of 84.

POL DEPOT OF BPCL, GULBARGA
QUANTITATIVE RISK ASSESSMENT (QRA)
J-3076-S-RT-1801 Rev B1
Page | 10
Recommendations
Recommendations of the QRA are as follows,
1. Ensure design and maintenance review are carried out to identify the hazards and corresponding
prevention and mitigation measures are in place.
2. The Flash fire scenario for certain accident scenarios are found to encompass the entire facility,
hence it is recommended to avoid any source of ignition in the depot.
3. Ensure proper access/exit to all the areas of the depot in order to evacuate safely during
emergency.
4. Consider carrying out SIMOPS study.
5. People movement in the TLF gantry should be maintained minimum.
6. Ensure proper fire protection system is in place at gantry and tank farm area to avoid escalation
of fire from TLF pump house.
7. Ensure adequate grounding and earthing arrangements in the loading area are in place to avoid
static charge generation.
8. Ensure regular monitoring in the tank farm and pump house.
9. It is recommended to develop procedures to verify the testing and inspection records of the
tankers at the entry gate.
10. Ensure arrangements and procedures for periodic proof testing of storage tank overfill
prevention systems are in place to minimize the likelihood of any failure that could result in loss
of containment.

POL DEPOT OF BPCL, GULBARGA
QUANTITATIVE RISK ASSESSMENT (QRA)
J-3076-S-RT-1801 Rev B1
Page | 11
2. INTRODUCTION
Bharat Petroleum Corporation Limited (BPCL), has awarded UltraTech to carry out Quantitative risk
assessment study for their POL Depot at Gulbarga, Karnataka. The document identifies the
methodology and results proposed by UltraTech and accepted by BPCL for the completion of the
Quantitative Risk Assessment Study (QRA) study.
2.1 PROJECT BACKGROUND
Bharat Petroleum Corporation Ltd(BPCL) has proposed an POL installation at Gulbarga Karnataka for
the purpose of receipt, storage and dispatch of petroleum products (POL) such as Motor Spirit (MS),
High Speed Diesel (HSD), Superior Kerosene Oil (SKO) and Ethanol.
The terminal is receiving the petroleum products through Railway wagons. These are stored in various
aboveground storage tanks and are distributed to various customers by loading in the tank trucks. A
Quantitative Risk Assessment Study has considered several potential scenarios that could lead to
major disasters. The scenarios considered are
• MS, SKO and HSD TW pump suction and discharge line leaks and rupture
• MS, SKO and HSD TLF pump suction and discharge line leaks and rupture
• Atmospheric Storage Tank Leak/Instantaneous rupture
The consequences could be fire with radiation effects for all the products stored. The risks arising out
of these events are discussed at length in the QRA report.
Table 2 Existing Storage tank details
Tank No Product Stored
Storage Capacity Tank Type
KL A/G OR U/G Roof Type
T-1 HSD 7000 AG FRVT
T-2 HSD 7000 AG FRVT
T-3 HSD 7000 AG FRVT
T-4 MS 4000 AG EFRVT
T-5 MS 4000 AG EFRVT

POL DEPOT OF BPCL, GULBARGA
QUANTITATIVE RISK ASSESSMENT (QRA)
J-3076-S-RT-1801 Rev B1
Page | 12
Tank No Product Stored
Storage Capacity Tank Type
KL A/G OR U/G Roof Type
T-6 SKO 858 AG FRVT
T-7 Bio-Diesel 500 AG FRVT
T-8 Bio-Diesel 500 AG FRVT
T-9 Ethanol 200 AG HZ Tank
T-10 Ethanol 200 AG HZ Tank
Figure 3 BPCL Gulbarga Depot

POL DEPOT OF BPCL, GULBARGA
QUANTITATIVE RISK ASSESSMENT (QRA)
J-3076-S-RT-1801 Rev B1
Page | 13
3. QRA METHODOLOGY
This section presents a brief description of the approach and steps followed in the QRA study.
The QRA Study included the following steps:
• Identification of Hazards (Fire / Explosion / uncontrolled release of Hazardous materials /
Flash Fire / Jet Fire / Vapor Cloud Explosion (VCE) Unconfined Vapor Cloud Explosion
(UVCE), etc.)
• Identification of Maximum Credible Accident (MCA) scenario.
• Frequency Analysis using internationally accepted database and Evaluation of the
likelihood of occurrence of possible events.
• Consequence modeling and analysis for the identified hazard covering impact on people
and potential escalation by using PHAST Risk.
• Estimation of Individual Risk (IR) and Societal Risk (SR).
• Recommendations.
The overall QRA methodology is shown in Figure 4 and is described in more detail in the subsequent
sections.

POL DEPOT OF BPCL, GULBARGA
QUANTITATIVE RISK ASSESSMENT (QRA)
J-3076-S-RT-1801 Rev B1
Page | 14
Figure 4: QRA Methodology

POL DEPOT OF BPCL, GULBARGA
QUANTITATIVE RISK ASSESSMENT (QRA)
J-3076-S-RT-1801 Rev B1
Page | 15
3.1 HAZARD IDENTIFICATION
The hazardous scenarios considered in the QRA for the project facility will be identified based on the
properties of the materials handled and the identification of the potential hazards in the pipeline
systems which could lead to loss of containment events.
HAZARDOUS MATERIALS
Class A & Class B petroleum products are received in wagons and stored in atmospheric tanks through
TW Pumps later transferred in road tankers through TLF pumps.
3.2 CONSEQUENCE ANALYSIS
The following activities comprise the consequence analysis which is carried out for the project facility:
• Review of the P&ID’s to determine process streams;
• Identification of isolatable sections based on the location of Shutdown Valves;
• Review of the design basis to obtain the properties of the stream (e.g. pressure,
temperature, composition and density) and
• Calculation of the inventory within the isolatable sections.
• Consequence modelling is conducted to evaluate the effect distances of the identified loss
of Containment (LOC) scenarios and their impact on people.
3.3 FREQUENCY ANALYSIS
Once the potential release scenarios are identified, the next stage is to estimate the failure
frequencies (likelihood for the event to occur) based on international standard databases.
The frequency analysis will be performed as follows:
• Identification of the base failure frequencies applicable to the pipelines from the relevant
international standard databases;
• The total failure frequencies will be derived from the combination of the time in use of the
pipelines/tanks with the base failure frequency data.

POL DEPOT OF BPCL, GULBARGA
QUANTITATIVE RISK ASSESSMENT (QRA)
J-3076-S-RT-1801 Rev B1
Page | 16
3.4 RISK ASSESSMENT
Risk assessment will be undertaken to evaluate the risk associated with the Storage tanks and the
associated facilities. The consequence analysis results and failure frequencies will be combined using
PHAST RISK 6.7 software. The risk shall be typically presented as Location Specific Individual Risk (LSIR)
contours.
3.5 RISK EVALUATION
The next stage of the QRA study includes the evaluation of the individual risk results against the Risk
Acceptance Criteria to determine whether the risks are broadly acceptable, ALARP or unacceptable
and to make some professional judgments about the significance of the risks.

POL DEPOT OF BPCL, GULBARGA
QUANTITATIVE RISK ASSESSMENT (QRA)
J-3076-S-RT-1801 Rev B1
Page | 17
4. CONSEQUENCE ANALYSIS – BASIS AND RESULTS
This section describes the approach used for the consequence analysis whereby consequence models
are built based on the identified LOC scenarios of the project facility. The consequences of the release
of hazardous substances by failures or catastrophes as well as the damage to the surrounding area
can be determined by means of consequence modelling. Models help to calculate the physical effects
resulting from a release of hazardous substances and help to translate the physical effects in terms of
injury or fatality to the exposed personnel.
The techniques used to model the consequences of the hazardous material releases cover the
following:
• Modelling of discharge rates when holes develop in pipeline systems.
• Modelling of the flammable gas clouds from releases to the atmosphere.
• Modelling of the heat radiation field of the releases that are ignited and burn as jet
fire and flash fire.
• Modelling of explosion overpressure from releases.
Table 3 Process Parameters for Pipelines
IS No Description Scenario
points Leak
Size,mm
Pipeline Dia, inch
Pressure kg/cm2
Temperature °C
Mass flow rate
m3/hr
IS 1 MS Pipeline from
Rail Gantry to TWG Pump Suction
TWG BAY 25 10 3 55 350
FR 10 3 55 350
IS 2 SKO Pipeline from
Rail Gantry to TWG Pump Suction
TWG BAY 25 10 3 55 350
FR 10 3 55 350
IS 3 HSD Pipeline from Rail Gantry to TWG
Pump Suction TWG BAY
30 12 3 55 500
FR 12 3 55 500
IS 4 MS Pipeline from
TWG Pump Discharge to Tank
TWG PUMP
25 10 5 55 350
FR 10 5 55 350
IS 5 SKO Pipeline from
TWG Pump Discharge to Tank
TWG PUMP
20 8 5 55 350
FR 8 5 55 350
IS 6 35 14 5 55 500

POL DEPOT OF BPCL, GULBARGA
QUANTITATIVE RISK ASSESSMENT (QRA)
J-3076-S-RT-1801 Rev B1
Page | 18
IS No Description Scenario
points Leak
Size,mm
Pipeline Dia, inch
Pressure kg/cm2
Temperature °C
Mass flow rate
m3/hr
HSD Pipeline from TWG Pump Discharge to Tank
TWG PUMP
FR 14 5 55 500
IS 7 From MOV MS
tank to TLF Pump suction
TLF BAY 40 16 3 55 200
FR 16 3 55 200
IS 8 From MOV SKO
tank to TLF Pump suction
TLF BAY 20 8 3 55 250
FR 8 3 55 250
IS 9 From MOV HSD
tank to TLF Pump suction
TLF BAY 50 24 3 55 350
FR 24 3 55 350
IS 10 TLF MS pump
discharge to TLF gantry
TLF PUMP 30 12 5 55 200
FR 12 5 55 200
IS 11 TLF SKO pump
discharge to TLF gantry
TLF PUMP 15 6 5 55 250
FR 6 5 55 250
IS 12 TLF HSD pump
discharge to TLF gantry
TLF PUMP 40 16 5 55 350
FR 16 5 55 350
Table 4 Process Parameters for Storage Tanks
IS No Description Scenario
points Leak Size, mm
Pressure kg/cm2
Temperature °C
Capacity, m3
IS 13 TANK 1 HSD 10 ATM 55
7000 CR ATM 55
IS 14 TANK 2 HSD 10 ATM 55
7000 CR ATM 55
IS 15 TANK 3 HSD 10 ATM 55
7000 CR ATM 55
IS 16 TANK 4 MS 10 ATM 55
4000 CR ATM 55
IS 17 TANK 5 MS 10 ATM 55
4000 CR ATM 55
IS 18 TANK 6 SKO 10 ATM 55
858 CR ATM 55
IS 19 TANK 7 BIODIESEL 10 ATM 55 500

POL DEPOT OF BPCL, GULBARGA
QUANTITATIVE RISK ASSESSMENT (QRA)
J-3076-S-RT-1801 Rev B1
Page | 19
IS No Description Scenario
points Leak Size, mm
Pressure kg/cm2
Temperature °C
Capacity, m3
CR ATM 55
IS 20 TANK 8 BIODIESEL 10 ATM 55
500 CR ATM 55
IS 21 TANK 9 ETHANOL 10 ATM 55
200 CR ATM 55
IS 22 TANK 10 ETHANOL 10 ATM 55
200 CR ATM 55

POL DEPOT OF BPCL, GULBARGA
QUANTITATIVE RISK ASSESSMENT (QRA)
J-3076-S-RT-1801 Rev B1
Page | 20
Table 5 Consequence Result
Isolatable
Section
Scenario Descriptio
n
Release categor
y
Release point
Flash Fire Effects: Radiation Effects: Jet Fire
Ellipse Radiation Effects: Pool
Fire Ellipse Overpressure
100% LFL Ellipse
Distance in meters
Radiation Levels (kW/m2)
Distance in meters
Radiation Levels (kW/m2)
Distance in meters
Overpressure level
bar
Distance in meters
2F 5D 2F 5D 2F 5D 2F 5D
IS-1
MS Pipeline from Rail Gantry to
TWG Pump
Suction
Leak 25 mm
TWG BAY 26.23 21.11
4 51.07 49.75 4 58.32 68.37 0.01 241.13 160.12
12.5 39.74 37.56 12.5 27.81 27.19 0.1 66.62 52.57
37.5 32.67 30.23 37.5 NR NR 0.3 48.29 41.27
FBR TWG BAY 26.03 24.88
4 71.51 80.96 4 80.22 98.69 0.01 298.52 217.66
12.5 56.02 61.84 12.5 39.20 38.82 0.1 74.76 62.55
37.5 46.25 50.39 37.5 NR NR 0.3 52.35 46.25
IS-2
SKO Pipeline from Rail Gantry to
TWG Pump
Suction
Leak 25 mm
TWG BAY 15.56 9.53
4 24.08 23.79 4 66.38 78.33 0.01 71.46 40.18
12.5 18.61 17.83 12.5 33.48 32.80 0.1 28.93 15.24
37.5 15.21 14.24 37.5 NR NR 0.3 24.46 12.61
FBR TWG BAY 13.16 10.14
4 25.72 29.64 4 79.85 96.20 0.01 113.69 69.26
12.5 20.10 22.60 12.5 39.78 39.66 0.1 27.99 20.28
37.5 16.54 18.37 37.5 NR NR 0.3 18.98 15.13
IS-3 HSD
Pipeline from Rail
Leak 30 mm
TWG BAY 8.65 8.28
4 11.64 11.69 4 77.47 90.66 0.01 NH NH
12.5 8.89 8.66 12.5 40.72 40.25 0.1 NH NH
37.5 7.11 6.74 37.5 NR NR 0.3 NH NH

POL DEPOT OF BPCL,GULBARGA
QUANTITATIVE RISK ASSESSMENT (QRA)
J-3076-S-RT-1801 Rev B1
Page | 21
Isolatable
Section
Scenario Descriptio
n
Release categor
y
Release point
Flash Fire Effects: Radiation Effects: Jet Fire
Ellipse Radiation Effects: Pool
Fire Ellipse Overpressure
100% LFL Ellipse
Distance in meters
Radiation Levels (kW/m2)
Distance in meters
Radiation Levels (kW/m2)
Distance in meters
Overpressure level
bar
Distance in meters
2F 5D 2F 5D 2F 5D 2F 5D
Gantry to TWG Pump
Suction
FBR TWG BAY 5.48 5.24
4 11.30 12.87 4 92.83 109.5
3 0.01 17.28 NR
12.5 8.73 9.74 12.5 48.40 48.26 0.1 11.26 NR
37.5 7.14 7.77 37.5 NR NR 0.3 10.63 NR
IS-4
MS Pipeline
from TWG Pump
Discharge to Tank
Leak 25 mm
TWG PUMP
35.71 29.48
4 69.76 63.02 4 64.39 70.69 0.01 306.64 212.90
12.5 54.07 47.25 12.5 32.81 30.53 0.1 86.25 69.99
37.5 44.45 37.80 37.5 NR NR 0.3 63.10 54.98
FBR TWG
PUMP 26.06 24.54
4 69.93 79.61 4 91.79 112.4
9 0.01 330.44 223.73
12.5 54.82 60.84 12.5 45.78 45.31 0.1 82.11 63.61
37.5 45.27 49.61 37.5 NR NR 0.3 56.02 46.78
IS-5
SKO Pipeline
from TWG Pump
Discharge to Tank
Leak 20 mm
TWG PUMP
19.74 13.27
4 33.30 34.85 4 72.11 84.10 0.01 63.74 78.81
12.5 25.64 25.92 12.5 37.73 36.97 0.1 27.59 30.20
37.5 20.98 20.60 37.5 NR NR 0.3 23.79 25.09
FBR TWG PUMP
11.51 8.67
4 21.44 24.49 4 84.14 101.4
4 0.01 125.54 68.89
12.5 16.81 18.75 12.5 41.94 41.84 0.1 30.04 20.21
37.5 13.84 15.29 37.5 NR NR 0.3 20.01 15.10
IS-6 HSD
Pipeline Leak 35
mm TWG
PUMP 12.48 12.71 4.00 19.72 20.67 4.00
114.94
134.01
0.01 23.97 31.78

POL DEPOT OF BPCL,GULBARGA
QUANTITATIVE RISK ASSESSMENT (QRA)
J-3076-S-RT-1801 Rev B1
Page | 22
Isolatable
Section
Scenario Descriptio
n
Release categor
y
Release point
Flash Fire Effects: Radiation Effects: Jet Fire
Ellipse Radiation Effects: Pool
Fire Ellipse Overpressure
100% LFL Ellipse
Distance in meters
Radiation Levels (kW/m2)
Distance in meters
Radiation Levels (kW/m2)
Distance in meters
Overpressure level
bar
Distance in meters
2F 5D 2F 5D 2F 5D 2F 5D
from TWG Pump
Discharge to Tank
12.50 15.13 15.31 12.50 64.70 64.70 0.10 12.42 13.78
37.50 12.30 12.10 37.50 NR NR 0.30 11.21 11.89
FBR TWG PUMP
6.71 5.93
4.00 12.81 14.42 4.00 115.0
2 135.0
6 0.01 23.96 NR
12.50 9.92 10.91 12.50 62.33 62.12 0.10 12.42 NR
37.50 8.04 8.74 37.50 NR NR 0.30 11.21 NR
IS-7
From MOV MS tank to
TLF Pump suction
Leak 40 mm
T TLF BAY 38.66 29.23
4.00 70.18 68.94 4.00 87.61 100.3
2 0.01 475.03 220.88
12.50 54.46 51.91 12.50 45.31 41.91 0.10 123.73 71.38
37.50 44.72 41.69 37.50 NR NR 0.30 86.81 55.67
FBR TLF BAY 30.17 27.75
4.00 80.32 91.50 4.00 102.8
0 125.5
3 0.01 335.84 267.18
12.50 62.90 69.85 12.50 52.41 51.89 0.10 79.58 79.41
37.50 51.94 56.91 37.50 NR NR 0.30 56.29 59.68
IS-8
From MOV SKO
tank to TLF Pump
suction
Leak 20 mm
TLF BAY
14.30 8.48
4.00 20.62 20.28 4.00 64.76 76.17 0.01 31.11 40.98
12.50 15.94 15.20 12.50 32.30 31.43 0.10 13.66 15.37
37.50 13.01 12.12 37.50 NR NR 0.30 11.83 12.68
FBR TLF BAY
9.51 7.46 4.00 17.85 20.21 4.00 74.73 90.48 0.01 118.58 64.73
12.50 14.05 15.56 12.50 36.14 36.10 0.10 28.83 19.49

POL DEPOT OF BPCL,GULBARGA
QUANTITATIVE RISK ASSESSMENT (QRA)
J-3076-S-RT-1801 Rev B1
Page | 23
Isolatable
Section
Scenario Descriptio
n
Release categor
y
Release point
Flash Fire Effects: Radiation Effects: Jet Fire
Ellipse Radiation Effects: Pool
Fire Ellipse Overpressure
100% LFL Ellipse
Distance in meters
Radiation Levels (kW/m2)
Distance in meters
Radiation Levels (kW/m2)
Distance in meters
Overpressure level
bar
Distance in meters
2F 5D 2F 5D 2F 5D 2F 5D
37.50 11.59 12.73 37.50 NR NR 0.30 19.40 14.74
IS-9
From MOV HSD
tank to TLF Pump
suction
Leak 50 mm
TLF BAY
10.95 10.48
4.00 15.66 15.94 4.00 147.4
8 171.1
5 0.01 34.68 23.21
12.50 12.03 11.87 12.50 84.77 84.24 0.10 22.55 12.29
37.50 9.74 9.38 37.50 NR NR 0.30 21.27 11.14
FBR
TLF BAY
7.69 7.02
4.00 15.58 16.78 4.00 141.4
0 165.1
8 0.01 26.52 24.47
12.50 12.09 12.72 12.50 79.63 79.41 0.10 12.87 12.51
37.50 9.86 10.24 37.50 NR NR 0.30 11.43 11.25
IS-10
TLF MS pump
discharge to TLF gantry
Leak 30 mm
TLF PUMP
39.75 33.21
4 82.02 74.15 4 70.17 77.97 0.01 436.19 219.98
12.5 63.48 55.52 12.5 36.51 33.72 0.1 116.99 71.22
37.5 52.15 44.38 37.5 NR NR 0.3 83.45 55.59
FBR
TLF PUMP
35.63 33.97
4.00 100.0
7 106.5
8 4.00 83.98
102.75
0.01 318.25 280.08
12.50 77.93 80.85 12.50 42.32 41.92 0.10 79.03 81.65
37.50 64.06 65.44 37.50 NR NR 0.30 56.16 60.79
IS-11 TLF SKO pump
discharge
TLF PUMP
11.33 9.53
4 28.00 29.48 4 55.51 64.49 0.01 66.10 61.33
12.5 21.58 21.95 12.5 27.36 28.27 0.1 28.00 18.90
37.5 17.66 17.45 37.5 NR NR 0.3 23.99 14.45

POL DEPOT OF BPCL,GULBARGA
QUANTITATIVE RISK ASSESSMENT (QRA)
J-3076-S-RT-1801 Rev B1
Page | 24
Isolatable
Section
Scenario Descriptio
n
Release categor
y
Release point
Flash Fire Effects: Radiation Effects: Jet Fire
Ellipse Radiation Effects: Pool
Fire Ellipse Overpressure
100% LFL Ellipse
Distance in meters
Radiation Levels (kW/m2)
Distance in meters
Radiation Levels (kW/m2)
Distance in meters
Overpressure level
bar
Distance in meters
2F 5D 2F 5D 2F 5D 2F 5D
to TLF gantry FBR
TLF PUMP
10.79 8.24
4.00 20.14 22.20 4.00 68.16 82.41 0.01 101.24 54.66
12.50 15.77 16.98 12.50 32.82 32.75 0.10 25.83 17.75
37.50 12.97 13.82 37.50 NR NR 0.30 17.90 13.87
IS-12
TLF HSD pump
discharge to TLF gantry
Leak 40 mm
TLF PUMP
13.00 13.29
4 20.90 21.81 4 113.4
5 132.3
7 0.01 21.84 28.36
12.5 16.03 16.16 12.5 63.98 64.09 0.1 12.05 13.19
37.5 13.05 12.77 37.5 NR NR 0.3 11.03 11.59
FBR
TLF PUMP
8.75 8.61
4 18.04 18.86 4 105.8
8 124.0
8 0.01 NH NH
12.5 13.96 14.22 12.5 57.67 57.47 0.1 NH NH
37.5 11.38 11.41 37.5 NR NR 0.3 NH NH
IS-13 TANK 1
Leak 10 mm
HSD
4.24 3.98
4 2.21 2.08 4 45.13 51.94 0.01 NH NH
12.5 NR NR 12.5 20.27 21.49 0.1 NH NH
37.5 NR NR 37.5 NR NR 0.3 NH NH
CR
HSD
93.46 118.4
7
4 NA NA 4 85.08 163.6
2 0.01 327.98 348.17
12.5 NA NA 12.5 41.61 103.6
3 0.1 131.28 151.31
37.5 NA NA 37.5 NR NR 0.3 110.61 130.63
IS-14 TANK 2 HSD 4.24 3.98 4 2.21 2.08 4 45.13 51.94 0.01 NH NH

POL DEPOT OF BPCL,GULBARGA
QUANTITATIVE RISK ASSESSMENT (QRA)
J-3076-S-RT-1801 Rev B1
Page | 25
Isolatable
Section
Scenario Descriptio
n
Release categor
y
Release point
Flash Fire Effects: Radiation Effects: Jet Fire
Ellipse Radiation Effects: Pool
Fire Ellipse Overpressure
100% LFL Ellipse
Distance in meters
Radiation Levels (kW/m2)
Distance in meters
Radiation Levels (kW/m2)
Distance in meters
Overpressure level
bar
Distance in meters
2F 5D 2F 5D 2F 5D 2F 5D
Leak 10 mm
12.5 NR NR 12.5 20.27 21.49 0.1 NH NH
37.5 NR NR 37.5 NR NR 0.3 NH NH
CR
HSD
93.46 118.4
7
4 NA NA 4 85.08 163.6
2 0.01 327.98 348.17
12.5 NA NA 12.5 41.61 103.6
3 0.1 131.28 151.31
37.5 NA NA 37.5 NR NR 0.3 110.61 130.63
IS-15 TANK 3
Leak 10 mm
HSD
4.24 3.98
4 2.21 2.08 4 45.13 51.94 0.01 NH NH
12.5 NR NR 12.5 20.27 21.49 0.1 NH NH
37.5 NR NR 37.5 NR NR 0.3 NH NH
CR
HSD
93.46 118.4
7
4 NA NA 4 85.08 163.6
2 0.01 327.98 348.17
12.5 NA NA 12.5 41.61 103.6
3 0.1 131.28 151.31
37.5 NA NA 37.5 NR NR 0.3 110.61 130.63
IS-16 TANK 4
Leak 10 mm
MS
11.53 5.59
4 14.00 12.64 4 40.98 44.20 0.01 48.75 NR
12.5 10.96 9.63 12.5 18.95 22.40 0.1 16.72 NR
37.5 8.96 7.72 37.5 12.58 11.40 0.3 13.36 NR
CR MS 222.9
8 202.3
6 4 NA NA 4 99.44
123.45
0.01 1745.5
8 1729.6
3

POL DEPOT OF BPCL,GULBARGA
QUANTITATIVE RISK ASSESSMENT (QRA)
J-3076-S-RT-1801 Rev B1
Page | 26
Isolatable
Section
Scenario Descriptio
n
Release categor
y
Release point
Flash Fire Effects: Radiation Effects: Jet Fire
Ellipse Radiation Effects: Pool
Fire Ellipse Overpressure
100% LFL Ellipse
Distance in meters
Radiation Levels (kW/m2)
Distance in meters
Radiation Levels (kW/m2)
Distance in meters
Overpressure level
bar
Distance in meters
2F 5D 2F 5D 2F 5D 2F 5D
12.5 NA NA 12.5 48.32 48.34 0.1 507.76 451.77
37.5 NA NA 37.5 NR NR 0.3 388.72 339.84
IS-17 TANK 5
Leak 10 mm
MS
11.53 5.59
4 14.00 12.64 4 40.98 44.20 0.01 48.75 NR
12.5 10.96 9.63 12.5 18.95 22.40 0.1 16.72 NR
37.5 8.96 7.72 37.5 12.58 11.40 0.3 13.36 NR
CR
MS
222.98
202.36
4 NA NA 4 99.44 123.4
5 0.01
1745.58
1729.63
12.5 NA NA 12.5 48.32 48.34 0.1 507.76 451.77
37.5 NA NA 37.5 NR NR 0.3 388.72 339.84
IS-18 TANK 6
Leak 10 mm
SKO
6.74 3.62
4 4.92 4.44 4 43.72 50.15 0.01 NH NH
12.5 3.50 3.13 12.5 19.15 20.81 0.1 NH NH
37.5 NR NR 37.5 NR NR 0.3 NH NH
CR
SKO
33.64 41.52
4 NA NA 4 54.01 66.26 0.01 221.88 240.80
12.5 NA NA 12.5 22.85 23.19 0.1 63.28 74.83
37.5 NA NA 37.5 NR NR 0.3 46.62 57.39
IS-19 TANK 7
Leak 10 mm
BIODIESEL 3.60 3.31
4 NR NR 4 42.38 48.34 0.01 NH NH
12.5 NR NR 12.5 18.92 20.72 0.1 NH NH
37.5 NR NR 37.5 NR NR 0.3 NH NH
CR BIODIESEL 27.47 33.58 4 NA NA 4 52.39 62.97 0.01 96.41 111.28

POL DEPOT OF BPCL,GULBARGA
QUANTITATIVE RISK ASSESSMENT (QRA)
J-3076-S-RT-1801 Rev B1
Page | 27
Isolatable
Section
Scenario Descriptio
n
Release categor
y
Release point
Flash Fire Effects: Radiation Effects: Jet Fire
Ellipse Radiation Effects: Pool
Fire Ellipse Overpressure
100% LFL Ellipse
Distance in meters
Radiation Levels (kW/m2)
Distance in meters
Radiation Levels (kW/m2)
Distance in meters
Overpressure level
bar
Distance in meters
2F 5D 2F 5D 2F 5D 2F 5D
12.5 NA NA 12.5 22.48 22.85 0.1 33.25 44.10
37.5 NA NA 37.5 NR NR 0.3 26.62 37.04
IS-20 TANK 8
Leak 10 mm
BIODIESEL 3.60 3.31
4 NR NR 4 42.38 48.34 0.01 NH NH
12.5 NR NR 12.5 18.92 20.72 0.1 NH NH
37.5 NR NR 37.5 NR NR 0.3 NH NH
CR BIODIESEL 27.47 33.58
4 NA NA 4 52.39 62.97 0.01 96.41 111.28
12.5 NA NA 12.5 22.48 22.85 0.1 33.25 44.10
37.5 NA NA 37.5 NR NR 0.3 26.62 37.04
IS-21 TANK 9
Leak 10 mm
ETHANOL 6.37 2.49
4 7.85 6.63 4 25.68 24.58 0.01 NH NH
12.5 7.25 5.07 12.5 16.43 17.26 0.1 NH NH
37.5 NR NR 37.5 8.79 8.18 0.3 NH NH
CR ETHANOL 46.71 43.40
4 NA NA 4 51.69 53.66 0.01 517.38 499.78
12.5 NA NA 12.5 32.05 36.08 0.1 131.07 119.75
37.5 NA NA 37.5 13.95 14.88 0.3 93.81 83.38
IS-22 TANK 10
Leak 10 mm
ETHANOL 6.37 2.49
4 7.85 6.63 4 24.07 23.58 0.01 NH NH
12.5 7.25 5.07 12.5 14.82 16.26 0.1 NH NH
37.5 NR NR 37.5 7.18 7.18 0.3 NH NH
CR ETHANOL 38.14 38.33 4 NA NA 4 26.88 28.14 0.01 452.37 447.51
12.5 NA NA 12.5 16.25 18.86 0.1 110.69 103.57

POL DEPOT OF BPCL,GULBARGA
QUANTITATIVE RISK ASSESSMENT (QRA)
J-3076-S-RT-1801 Rev B1
Page | 28
Isolatable
Section
Scenario Descriptio
n
Release categor
y
Release point
Flash Fire Effects: Radiation Effects: Jet Fire
Ellipse Radiation Effects: Pool
Fire Ellipse Overpressure
100% LFL Ellipse
Distance in meters
Radiation Levels (kW/m2)
Distance in meters
Radiation Levels (kW/m2)
Distance in meters
Overpressure level
bar
Distance in meters
2F 5D 2F 5D 2F 5D 2F 5D
37.5 NA NA 37.5 7.18 7.18 0.3 78.69 71.74
Where,
NA – Not Applicable
NR – Not Reached
NH – No Hazard

POL DEPOT OF BPCL, GULBARGA
QUANTITATIVE RISK ASSESSMENT (QRA)
J-3076-S-RT-1801 Rev B1
Page | 29
5. RISK MODELLING – BASIS AND RESULTS
5.1 FREQUENCY ANALYSIS
This section presents a brief description of the methodology and approach adopted for the frequency
analysis. To calculate the risk associated with a LOC scenario, it is necessary to estimate the failure
frequency. The frequency of occurrence of such an event is based on the probability of the LOC
scenario and the presence of constraints that influence the development of the event.
In case of leakage in the pipeline systems, flammable substances may be released into the
atmosphere. This can occur in the form of a small gasket failure in a flanged joint, a bleeding valve,
inadvertently left open valves, failure of pipeline, corrosion, or any other external factors.
BASE FAILURE FREQUENCY
The failure frequencies of full release cases are considered since the release is consistent with flow
through the defined hole, beginning at the normal operating pressure, and continuing until controlled
by emergency shutdown or inventory exhaustion.
TOTAL FAILURE FREQUENCY
The total failure frequencies for isolatable section are calculated by combining the base failure
frequency obtained from the international database and time in use factor. The details of the total
failure frequencies determined for the identified LOC scenario are given below:
Table 4 Total Failure Frequency
Isolatable section identification
Description Leak Size,
mm
Total failure frequency avg
per year
IS 1 MS Pipeline from Rail Gantry to TWG Pump
Suction
25 1.37E-06
FR 2.74E-07
IS 2 SKO Pipeline from Rail Gantry to TWG Pump
Suction
25 1.37E-06
FR 2.74E-07
IS 3 HSD Pipeline from Rail Gantry to TWG Pump
Suction
30 1.37E-06
FR 2.74E-07

POL DEPOT OF BPCL, GULBARGA
QUANTITATIVE RISK ASSESSMENT (QRA)
J-3076-S-RT-1801 Rev B1
Page | 30
Isolatable section identification
Description Leak Size,
mm
Total failure frequency avg
per year
IS 4 MS Pipeline from TWG Pump Discharge to Tank 25 3.42E-06
FR 6.84E-07
IS 5 SKO Pipeline from TWG Pump Discharge to
Tank
20 3.42E-06
FR 6.84E-07
IS 6 HSD Pipeline from TWG Pump Discharge to
Tank
35 3.42E-06
FR 6.84E-07
IS 7 From MOV MS tank to TLF Pump suction 40 2.74E-06
FR 5.47E-07
IS 8 From MOV SKO tank to TLF Pump suction 20 2.74E-06
FR 5.47E-07
IS 9 From MOV HSD tank to TLF Pump suction 50 2.74E-06
FR 5.47E-07
IS 10 TLF MS pump discharge to TLF gantry 30 2.05E-06
FR 4.11E-07
IS 11 TLF SKO pump discharge to TLF gantry 15 2.05E-06
FR 4.11E-07
IS 12 TLF HSD pump discharge to TLF gantry 40 2.05E-06
FR 4.11E-07
IS 13 TANK 1 10 9.00E-06
CR 4.50E-07
IS 14 TANK 2 10 9.00E-06
CR 4.50E-07
IS 15 TANK 3 10 9.00E-06
CR 4.50E-07
IS 16 TANK 4 10 9.00E-06
CR 4.50E-07
IS 17 TANK 5 10 9.00E-06
CR 4.50E-07
IS 18 TANK 6 10 9.00E-06
CR 4.50E-07
IS 19 TANK 7 10 9.00E-06
CR 4.50E-07

POL DEPOT OF BPCL, GULBARGA
QUANTITATIVE RISK ASSESSMENT (QRA)
J-3076-S-RT-1801 Rev B1
Page | 31
Isolatable section identification
Description Leak Size,
mm
Total failure frequency avg
per year
IS 20 TANK 8 10 9.00E-06
CR 4.50E-07
IS 21 TANK 9 10 9.00E-06
CR 4.50E-07
IS 22 TANK 10 10 9.00E-06
CR 4.50E-07
5.2 RISK CRITERIA
The risk associated with the project facility can be seen as the probable frequency of an event in
combination with its magnitude and is determined based on both consequence analysis results and
failure frequency. In order to take decisions based on these quantified risk levels, comparison with
numerical risk criteria is essential. These criteria are used to determine whether the risks are
unacceptable, tolerable if ALARP or broadly acceptable.
In order to be able to make HSE Risk management decisions, adopted the Risk Acceptance Criteria
which are discussed in this section.
RISK ACCEPTANCE CRITERIA
In India, there are no defined criteria for risk acceptance. However, in IS 15656 – Code of Practice for
Hazard Identification and Risk Analysis, Annexure E summarizes the risk criteria adopted in some
countries. Extracts for the same is presented below,
Table 6 HSE UK Risk Criteria
AUTHORITY AND APPLICATION MAXIMUM TOLERABLE RISK
(PER YEAR)
NEGLIGIBLE RISK
(PER YEAR)
VROM, The Netherlands (New) 1.0 x10⁻⁶ 1.0 x10⁻⁸
VROM, The Netherlands (existing) 1.0 x10⁻⁵ 1.0 x10⁻⁸
HSE, UK (existing-hazardous industry) 1.0 x10⁻⁴ 1.0 x10⁻⁶
HSE, UK (New nuclear power station) 1.0 x10⁻⁵ 1.0 x10⁻⁶

POL DEPOT OF BPCL, GULBARGA
QUANTITATIVE RISK ASSESSMENT (QRA)
J-3076-S-RT-1801 Rev B1
Page | 32
AUTHORITY AND APPLICATION MAXIMUM TOLERABLE RISK
(PER YEAR)
NEGLIGIBLE RISK
(PER YEAR)
HSE, UK (Substance transport) 1.0 x10⁻⁴ 1.0 x10⁻⁶
HSE, UK (New housing near plants) 3*1.0 x10-6 3*1.0 x10-7
Hong Kong Government (New plants) 1.0 x10⁻⁵ Not used
LOCATION SPECIFIC INDIVIDUAL RISK (LSIR)
The term “Location-Specific Individual Risk (LSIR)” is used for the calculations of the risk of fatality for
someone at a specific location, assuming that the person is always present at the location and
therefore, is continuously exposed to the risk at that location. This makes the LSIR a measure of the
geographic distribution of risk, independent of the distribution of people at that location or in the
surrounding area. The LSIR is presented as iso-risk contours on a map of the location of interest.
5.3 RISK RESULTS
The risk modeling has been performed using DNV PHAST RISK 6.7 software. Thereby, the details of
the input data used for the risk modeling such as, ignition probability and occupancy data are given
in the QRA Assumption Register. This section focuses on the outcome of the risk results and the
comparison of the risk results with risk acceptance criteria.
LOCATION SPECIFIC INDIVIDUAL RISK (LSIR) RESULTS
The location specific individual risk (LSIR) contour for the project facility is presented below:

POL DEPOT OF BPCL, GULBARGA
QUANTITATIVE RISK ASSESSMENT (QRA)
J-3076-S-RT-1801 Rev B1
Page | 33
INDIVIDUAL RISK PER ANNUM
The LSIR values of the personnel in the Gulbarga Depot are provided in the Table below. From this
LSIR value, the Individual Risk Per Annum (IRPA) to the personnel based on their exposure are
calculated and presented below:
S. No Location of Interest LSIR
(per avg. year) Presence Factor IRPA RISK
1 Admin Building 7.96E-07 0.304 2.42E-07 Acceptable
2 TLF Gantry 8.74E-06 0.304 2.66E-06 ALARP
3 Railway Siding 5.29E-07 0.038 2.03E-08 Acceptable
4 TLF Pump House 1.11E-05 0.304 3.38E-06 ALARP
5 TWG Pump House 2.26E-06 0.038 8.67E-08 Acceptable
6 MS Tank farm 3.01E-06 1.000 3.01E-06 ALARP
7 HSD Tank farm 1.45E-06 1.000 1.45E-06 ALARP
8 SKO Tank Farm 4.86E-06 1.000 4.86E-06 ALARP
9 ETP 1.02E-10 0.304 3.11E-11 Acceptable
Note: The presence factor has been calculated as shown below (e.g. person in the TLF gantry):

POL DEPOT OF BPCL, GULBARGA
QUANTITATIVE RISK ASSESSMENT (QRA)
J-3076-S-RT-1801 Rev B1
Page | 34
Total working hours in a year = 333 (days) x 8 (hours a day)
= 2664 hours
Number of hours in a year = 24 (hours a day) x 365 (days a year)
= 8760 hours
Presence Factor = Total working hours in a year / Number of hours in a year
= 2664 / 8760
= 0.3041
Comparison of the HSE UK Risk Acceptance Criteria and the Individual Risks calculated from the
project facility shows that the estimated values of IRPA, as given in Table above lies broadly in ALARP
region for all the identified locations in the Depot.
SOCEITAL RISK
Assessment of societal risks is even more important than assessment of individual risk because they
involve the likelihood of multiple fatalities. Societal risk is the risk to any person or group of persons
who are not connected to project facilities and are outside the facility fence line.
F-N CURVE
It is helpful to consider group risk in the demonstration that risks are ALARP. This allows consideration
to be given to events, which, although low in frequency, may cause multiple
injuries or fatalities. Group risk can be presented in the form of a plot of cumulative frequency versus
number of fatalities (F-N curve).
F = Frequency (experienced or predicted)
N = No. of multiple fatalities.
‘N’ includes indirect deaths caused as a result of the main event occurring and can therefore be
difficult to predict e.g. many people may die years after exposure to a toxic chemical.

POL DEPOT OF BPCL, GULBARGA
QUANTITATIVE RISK ASSESSMENT (QRA)
J-3076-S-RT-1801 Rev B1
Page | 35

POL DEPOT OF BPCL, GULBARGA
QUANTITATIVE RISK ASSESSMENT (QRA)
J-3076-S-RT-1801 Rev B1
Page | 36
6. RECOMMENDATIONS
Recommendations of the QRA are as follows,
1. Ensure design and maintenance review are carried out to identify the hazards and
corresponding prevention and mitigation measures are in place.
2. The Flash fire scenario for certain accident scenarios are found to encompass the entire
facility, hence it is recommended to avoid any source of ignition in the depot.
3. Ensure proper access/exit to all the areas of the depot in order to evacuate safely during
emergency.
4. Consider carrying out SIMOPS study.
5. People movement in the TLF gantry should be maintained minimum.
6. Ensure proper fire protection system is in place at gantry and tank farm area to avoid
escalation of fire from TLF pump house.
7. Ensure adequate grounding and earthing arrangements in the loading area are in place to
avoid static charge generation.
8. Ensure regular monitoring in the tank farm and pump house.
9. It is recommended to develop procedures to verify the testing and inspection records of the
tankers at the entry gate.
10. Ensure arrangements and procedures for periodic proof testing of storage tank overfill
prevention systems are in place to minimize the likelihood of any failure that could result in
loss of containment.

POL DEPOT OF BPCL, GULBARGA
QUANTITATIVE RISK ASSESSMENT (QRA)
J-3076-S-RT-1801 Rev B1
Page | 37
7. LIST OF REFERENCE DOCUMENTS / STANDARDS
• Guideline of Quantitative Risk Assessment - PGS 3 [Purple book]
• Methods for the determination of possible damage – CPR 16E [Green book]
• DNV SAFETI manual
• Population density survey of pipeline
• www.Meteoblue.com
• Piping & Instrumentation diagram
• Layout of the Depot
• OISD 244 –Storage and Handling of petroleum products at depots and terminals.
• Safety and Environmental standards for fuel storage sites, process safety leadership group final report- HSE UK.

POL DEPOT OF BPCL, GULBARGA
QUANTITATIVE RISK ASSESSMENT (QRA)
J-3076-S-RT-1801 Rev B1
Page | 38
ANNEXURE 1 CONSEQUENCE CONTOURS

POL DEPOT OF BPCL, GULBARGA
QUANTITATIVE RISK ASSESSMENT (QRA)
J-3076-S-RT-1801 Rev B1
Page | 39
FLASH FIRE
IS 1 MS Pipeline from Rail Gantry to TWG Pump Suction
IS 5 SKO Pipeline from TWG Pump Discharge to Tank

POL DEPOT OF BPCL, GULBARGA
QUANTITATIVE RISK ASSESSMENT (QRA)
J-3076-S-RT-1801 Rev B1
Page | 40
IS 7 From MOV MS tank to TLF Pump suction
IS 12 TLF HSD pump discharge to TLF gantry

POL DEPOT OF BPCL, GULBARGA
QUANTITATIVE RISK ASSESSMENT (QRA)
J-3076-S-RT-1801 Rev B1
Page | 41
IS 13 TANK 1
IS 16 TANK 4

POL DEPOT OF BPCL, GULBARGA
QUANTITATIVE RISK ASSESSMENT (QRA)
J-3076-S-RT-1801 Rev B1
Page | 42
IS 18 TANK 6
IS 22 TANK 10

POL DEPOT OF BPCL, GULBARGA
QUANTITATIVE RISK ASSESSMENT (QRA)
J-3076-S-RT-1801 Rev B1
Page | 43
JET FIRE ELLIPSE
IS 1 MS Pipeline from Rail Gantry to TWG Pump Suction
IS 5 SKO Pipeline from TWG Pump Discharge to Tank

POL DEPOT OF BPCL, GULBARGA
QUANTITATIVE RISK ASSESSMENT (QRA)
J-3076-S-RT-1801 Rev B1
Page | 44
IS 7 From MOV MS tank to TLF Pump suction
IS 12 TLF HSD pump discharge to TLF gantry

POL DEPOT OF BPCL, GULBARGA
QUANTITATIVE RISK ASSESSMENT (QRA)
J-3076-S-RT-1801 Rev B1
Page | 45
VAPOR CLOUD EXPLOSION
IS 1 MS Pipeline from Rail Gantry to TWG Pump Suction
IS 5 SKO Pipeline from TWG Pump Discharge to Tank

POL DEPOT OF BPCL, GULBARGA
QUANTITATIVE RISK ASSESSMENT (QRA)
J-3076-S-RT-1801 Rev B1
Page | 46
IS 7 From MOV MS tank to TLF Pump suction
IS 12 TLF HSD pump discharge to TLF gantry

POL DEPOT OF BPCL, GULBARGA
QUANTITATIVE RISK ASSESSMENT (QRA)
J-3076-S-RT-1801 Rev B1
Page | 47
IS 13 TANK 1
IS 16 TANK 4

POL DEPOT OF BPCL, GULBARGA
QUANTITATIVE RISK ASSESSMENT (QRA)
J-3076-S-RT-1801 Rev B1
Page | 48
IS 18 TANK 6
IS 22 TANK 10

POL DEPOT OF BPCL, GULBARGA
QUANTITATIVE RISK ASSESSMENT (QRA)
J-3076-S-RT-1801 Rev B1
Page | 49
POOL FIRE ELLIPSE
IS 1 MS Pipeline from Rail Gantry to TWG Pump Suction
IS 5 SKO Pipeline from TWG Pump Discharge to Tank

POL DEPOT OF BPCL, GULBARGA
QUANTITATIVE RISK ASSESSMENT (QRA)
J-3076-S-RT-1801 Rev B1
Page | 50
IS 7 From MOV MS tank to TLF Pump suction
IS 12 TLF HSD pump discharge to TLF gantry

POL DEPOT OF BPCL, GULBARGA
QUANTITATIVE RISK ASSESSMENT (QRA)
J-3076-S-RT-1801 Rev B1
Page | 51
IS 13 TANK 1
IS 16 TANK 4

POL DEPOT OF BPCL, GULBARGA
QUANTITATIVE RISK ASSESSMENT (QRA)
J-3076-S-RT-1801 Rev B1
Page | 52
IS 18 TANK 6
IS 22 TANK 10

POL DEPOT OF BPCL, GULBARGA
QUANTITATIVE RISK ASSESSMENT (QRA)
J-3076-S-RT-1801 Rev B1
Page | 53
ANNEXURE 2 ASSUMPTION REGISTER
BPCL GULBARGA TERMINAL
Assumption No: 1
Subject: Risk Calculation Tool
The risk analysis within this study is conducted using DNV Software’s Phast Risk program
Version 6.7, which is an industry standard method for carrying out QRA for POL terminal
tanks and pipelines (chemical and petrochemical) facilities.
• Phast Risk allows efficient identification of major risk contributors, so that time and
effort can then be directed to mitigating these highest risk activities.
• Phast Risk analyses complex consequences from accident scenarios, taking account
of local population, land usage and weather conditions, to quantify the risk
associated with the release of hazardous materials.
• Phast Risk incorporates the industry standard consequence modeling of Phast.
Phast Risk is intended as a set of models for risk analysts to enable them to provide timely,
accurate and appropriate advice on safety related issues. It models all stages of a release
from outflow through a hole or from a pipe end, through atmospheric dispersion, rain-out
and re-evaporation of liquid, to thermal radiation from fires, explosion overpressures and
toxic lethality. Phast Risk combines recognized and validated models for the various physical
phenomena, automatically selecting the appropriate model depending on the
circumstances of the release. It provides an experienced risk analyst with a tool that allows
them to focus their attention and experience on the real problem areas rather than the
administration of large quantities of data.
Reference:
1. www.dnvgl.com/services/hazard-analysis-phast-1675

POL DEPOT OF BPCL, GULBARGA
QUANTITATIVE RISK ASSESSMENT (QRA)
J-3076-S-RT-1801 Rev B1
Page | 54
BPCL GULBARGA TERMINAL
Assumption No: 2
Subject: Facility Description
BPCL GULBARGA is POL terminal which distributes MS/HSD/SKO/ETHANOL to nearby districts
The risk analysis is based on the onsite population and off-site population
Table 7 Onsite Population
Population No.
Admin 15
TLF gantry 10
TLF & TWD pump house 2
Tank farms 5
Main Gate Security cabin 5
MCC room 1
Tanker parking area 80
TW Gantry & ETP 5
Calibration shed and Fire pump
house 5
Table 2 Offsite Population around 2 KM range
S. No Village/District Name Population
1 Gulbarga 261/km2 (Density)

POL DEPOT OF BPCL, GULBARGA
QUANTITATIVE RISK ASSESSMENT (QRA)
J-3076-S-RT-1801 Rev B1
Page | 55
BPCL GULBARGA TERMINAL
Assumption No: 3
Subject: Material Composition
Composition of MS, SKO, HSD considered is given below:
Product Composition Mole %
MS N-HEPTANE 10
N-OCTANE 90
Product Composition Mole %
SKO
N-OCTANE 5
N-NONANE 10
n-DECANE 15
n-UNDECANE 30
n-DODECANE 15
n-TRIDECANE 20
n-TETRADECANE 5
n-PENTADECANE 5
n-HEXADECANE 3
n-HEPTADECANE 2
Product Composition Mole %
HSD
n-DECANE 2
n-UNDECANE 8
n-DODECANE 12
n-TRIDECANE 15

POL DEPOT OF BPCL, GULBARGA
QUANTITATIVE RISK ASSESSMENT (QRA)
J-3076-S-RT-1801 Rev B1
Page | 56
BPCL GULBARGA TERMINAL
Assumption No: 3
Subject: Material Composition
n-TETRADECANE 20
n-PENTADECANE 20
n-HEXADECANE 10
n-HEPTADECANE 8
n-OCTADECANE 5
Implication of assumption:
Key influence in determining the dispersion results.
POL DEPOT OF BPCL, GULBARGA
QUANTITATIVE RISK ASSESSMENT (QRA)
J-3076-S-RT-1801 Rev B1
Page | 57
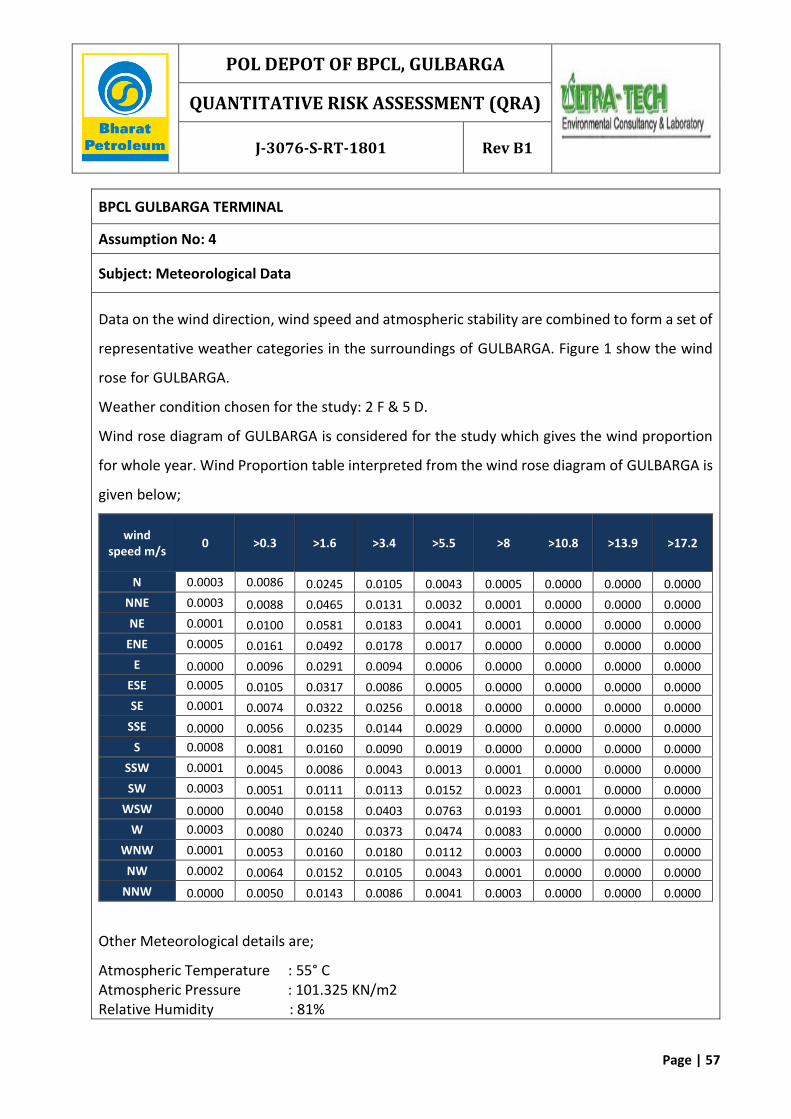
BPCL GULBARGA TERMINAL
Assumption No: 4
Subject: Meteorological Data
Data on the wind direction, wind speed and atmospheric stability are combined to form a set of
representative weather categories in the surroundings of GULBARGA. Figure 1 show the wind
rose for GULBARGA.
Weather condition chosen for the study: 2 F & 5 D.
Wind rose diagram of GULBARGA is considered for the study which gives the wind proportion
for whole year. Wind Proportion table interpreted from the wind rose diagram of GULBARGA is
given below;
wind speed m/s
0 >0.3 >1.6 >3.4 >5.5 >8 >10.8 >13.9 >17.2
N 0.0003 0.0086 0.0245 0.0105 0.0043 0.0005 0.0000 0.0000 0.0000 NNE 0.0003 0.0088 0.0465 0.0131 0.0032 0.0001 0.0000 0.0000 0.0000 NE 0.0001 0.0100 0.0581 0.0183 0.0041 0.0001 0.0000 0.0000 0.0000
ENE 0.0005 0.0161 0.0492 0.0178 0.0017 0.0000 0.0000 0.0000 0.0000 E 0.0000 0.0096 0.0291 0.0094 0.0006 0.0000 0.0000 0.0000 0.0000
ESE 0.0005 0.0105 0.0317 0.0086 0.0005 0.0000 0.0000 0.0000 0.0000 SE 0.0001 0.0074 0.0322 0.0256 0.0018 0.0000 0.0000 0.0000 0.0000
SSE 0.0000 0.0056 0.0235 0.0144 0.0029 0.0000 0.0000 0.0000 0.0000 S 0.0008 0.0081 0.0160 0.0090 0.0019 0.0000 0.0000 0.0000 0.0000
SSW 0.0001 0.0045 0.0086 0.0043 0.0013 0.0001 0.0000 0.0000 0.0000 SW 0.0003 0.0051 0.0111 0.0113 0.0152 0.0023 0.0001 0.0000 0.0000
WSW 0.0000 0.0040 0.0158 0.0403 0.0763 0.0193 0.0001 0.0000 0.0000 W 0.0003 0.0080 0.0240 0.0373 0.0474 0.0083 0.0000 0.0000 0.0000
WNW 0.0001 0.0053 0.0160 0.0180 0.0112 0.0003 0.0000 0.0000 0.0000 NW 0.0002 0.0064 0.0152 0.0105 0.0043 0.0001 0.0000 0.0000 0.0000
NNW 0.0000 0.0050 0.0143 0.0086 0.0041 0.0003 0.0000 0.0000 0.0000
Other Meteorological details are;
Atmospheric Temperature : 55° C Atmospheric Pressure : 101.325 KN/m2 Relative Humidity : 81%

POL DEPOT OF BPCL, GULBARGA
QUANTITATIVE RISK ASSESSMENT (QRA)
J-3076-S-RT-1801 Rev B1
Page | 58
BPCL GULBARGA TERMINAL
Assumption No: 4
Subject: Meteorological Data
Surface Roughness : 0.3 Solar Flux : 0.12 kW/m2
WIND ROSE
Reference:
1. https://www.meteoblue.com/en/weather/forecast/modelclimate/gulbarga_india_127
0752
2. Purple book CPR 18E- Guidelines for Quantitative Risk Assessment
3. http://www.kspcb.gov.in/PH/Thagadur_Mines_MML_EIA.pdf

POL DEPOT OF BPCL, GULBARGA
QUANTITATIVE RISK ASSESSMENT (QRA)
J-3076-S-RT-1801 Rev B1
Page | 59
BPCL GULBARGA TERMINAL
Assumption No: 5
Subject: Ignition Sources & Ignition Probability
Specification:
Ignition sources in the QRA study considered are of 3 types
Type Description In site Ignition
Probability
Point
Known specific sources such as
flares, workshops, equipment’s
etc.
Parking Area
Canteen
DG Room
0.4
0.9
0.4
M&R shed 1.0
Line
Roads
Railways
Electrical transmission lines
As Applicable
As Applicable
As Applicable
As Per no. of
Vehicles
0.2
Areas Population in the facility, mutual aid and surrounding village
As Applicable 0.01 Per person
Reference:
1.Purple book CPR 18E- Guidelines for Quantitative Risk Assessment

POL DEPOT OF BPCL, GULBARGA
QUANTITATIVE RISK ASSESSMENT (QRA)
J-3076-S-RT-1801 Rev B1
Page | 60
BPCL GULBARGA TERMINAL
Assumption No: 6
Subject: Inventory Calculation
Specification:
The inventory of a given section is defined as the isolatable mass within that section under
normal operating conditions and in addition to that, the inventory released prior to the segment
isolation.
i.e. Total inventory= static+ Dynamic inventory
Static Inventory is calculated from volume of pipe line section considered.
Dynamic inventory is given by the product of flow rate and release time duration taken.
Isolation time will be considered based on the type of isolation proposed for the terminal.
Provide type of isolation proposed to be provided in BPCL GULBARGA
Scenario Inventory Release Duration
Leak 10min
Rupture 2min
Reference:
1.Purple book CPR 18E- Guidelines for Quantitative Risk Assessment

POL DEPOT OF BPCL, GULBARGA
QUANTITATIVE RISK ASSESSMENT (QRA)
J-3076-S-RT-1801 Rev B1
Page | 61
BPCL GULBARGA TERMINAL
Assumption No: 7
Subject: Release Sizes
Specification:
To define the hazardous release events applying to each Process Accident release scenario (QRA
section), representative hole sizes are modeled. The selection of the hole sizes is made based
on the guidelines given in purple book.
For pipelines a leak size of 10% of nominal diameter is taken. And for storage tank a leak size of
10mm is considered.
Reference:
1.Purple book CPR 18E- Guidelines for Quantitative Risk Assessment

POL DEPOT OF BPCL, GULBARGA
QUANTITATIVE RISK ASSESSMENT (QRA)
J-3076-S-RT-1801 Rev B1
Page | 62
BPCL GULBARGA TERMINAL
Assumption No: 8
Subject: Event Failure frequencies
Specification:
The basic failure frequency data taken from the purple book for above ground pipelines are given
below which are then multiplied with the length of pipes respectively along with it to give the
calculated failure frequency per year.
Installation Leak Rupture
Pipeline
pipeline, nominal diameter < 75 mm
5 × 10⁻⁶ m-1 y-1 1 × 10⁻⁶ m-1 y-1
pipeline, 75 mm ≤ nominal diameter ≤ 150 mm
2 × 10⁻⁶ m-1 y-1 3 × 10⁻⁷ m-1 y-1
nominal diameter > 150 mm 5 × 10⁻⁷ m-1 y-1 1 × 10⁻⁷ m-1 y-1
Tank
Tank 1x10⁻⁴ y-1 5x10⁻⁶ y-1
Reference:
1.Purple book CPR 18E- Guidelines for Quantitative Risk Assessment

POL DEPOT OF BPCL, GULBARGA
QUANTITATIVE RISK ASSESSMENT (QRA)
J-3076-S-RT-1801 Rev B1
Page | 63
BPCL GULBARGA TERMINAL
Assumption No: 9
Subject: Damage Criteria
Specification:
The damage criteria give the relation between the extents of the physical effects
(exposure) and the effect of consequences.
Effects due to incident radiation
Incident Radiation (Kw/m2)
Type Of Damage
4.0 Sufficient to cause pain within 20 sec. Blistering of skin (first degree burns are likely)
12.5 Minimum energy required for piloted ignition of wood, melting plastic tubing’s etc.
37.5 Sufficient to cause damage to the equipment
Damages due to over pressure effect
Peak Overpressure Damage Type Description
0.30 bar Heavy Damage Major damage to plant equipment
structure
0.10 bar Moderate Damage Repairable damage to plant equipment
& structure
0.03 bar Significant Damage Shattering of glass


