TEXAS WATER DEVELOPMENT BOARD REPORT 90 OUANTITY AND QUALITY OF LOW FLOW IN SABINE AND OLD RIVERS NEAR ORANGE, TEXAS SEPTEMBER 12·15, 1967 By Jack Rawson, S. L. Johnson, and R. E. Smith United States Geological Survey Prepared by the U.S. Geological Survey in cooperation with Ihll Texas Weter Development Board ,nd th. SlIbine River Authority 01 TexilS January 1969
Transcript
TEXAS WATER DEVELOPMENT BOARD
REPORT 90
OUANTITY AND QUALITY OF LOW FLOW IN
SABINE AND OLD RIVERS NEAR ORANGE, TEXAS
SEPTEMBER 12·15, 1967
By
Jack Rawson, S. L. Johnson, and R. E. SmithUnited States Geological Survey
Prepared by the U.S. Geological Surveyin cooperation with Ihll
Texas Weter Development Board,nd th.
SlIbine River Authority 01 TexilS
January 1969
TABLE OF CONTENTS
INTRODUCTION , , .
DESCRIPTION OF STUDY AREA .
METHODS OF INVESTIGATION .
Water-Level Measurements
Streamflow Measurements
Waler-Quality Measurements.
ANALYSIS OF DATA
Water·Stage Records and Observations
Streamflow Distribution
Water·Quality Variations.
Sabine River-Mile +22.6 to Mile +10.9 .
Sabine River-Mile +10.9 to Mile +5.6 ........••.....
Old River-Mile T +10.5 to Mile T +4.8
Old River-Mile T +4.8 to Mile T 0.0 ...
Sabine River-Mile +5.6 to Mile ·1.6
Big Bayou-Mile T +5.5 to Mile T 0.0
Inflow From Tributaries
SUMMARY OF CONCLUSIONS
REFERENCES .
TABLES
1. Summary of Discharge Measurements, Sabine River Basin Near Orange. Texas
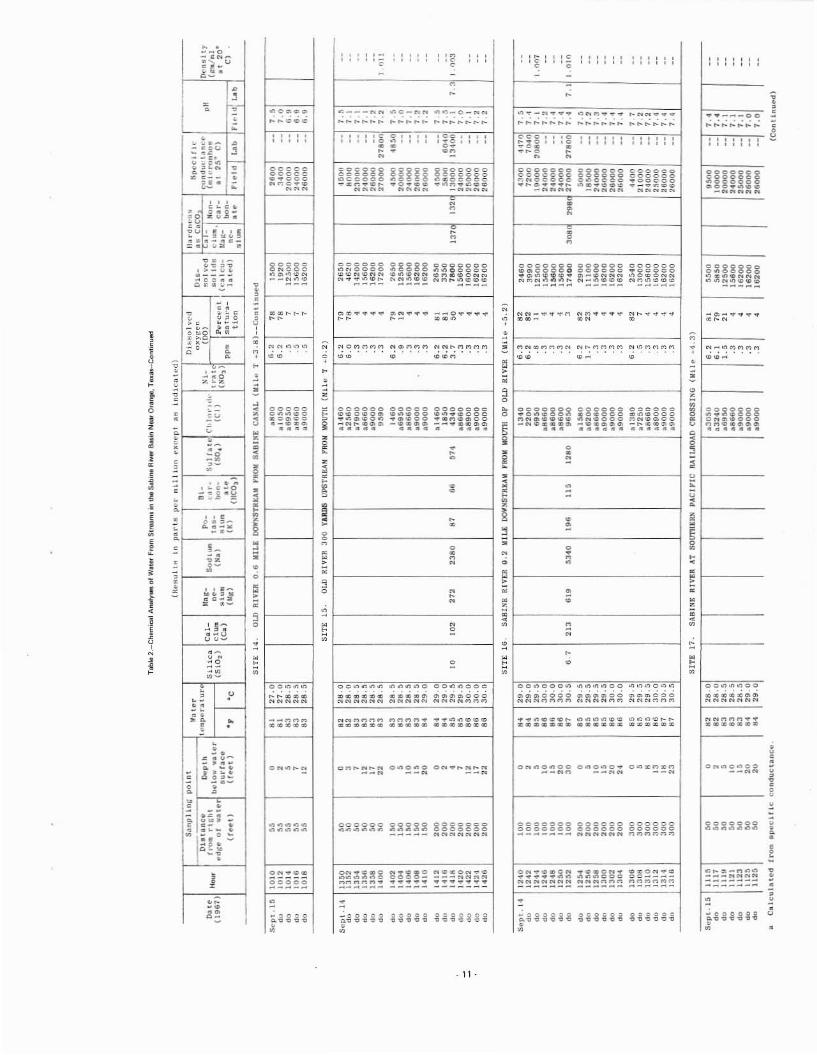
2. Chemical Analyses of Water From Streams in the sabine River Basin Near Orange, Texas .
iii
Page
3
3
3
3
3
3
3
5
7
""""16
16
16
17
•9
TABLE OF CONTENTS (Cont'd.)
Pogo
FIGURES
1. Map Showing locations of Streamflow and Chemical·Quaiity Data-Coll~tion Sites.
2. Diagrams Showing Summary of Stage and Flow Data for the Tide-AffectedReaches of the sabine and Old Rivers. . . . . . . . . . . . . . . . __ .•.....
3. Diagram Showing the Tide-Affected Reaches of the Sabine and Old Rivers .....
4. Profiles of Weighted-Average Chloride in the Sabine and Old Rivers .
2
5
6
7
5. Sections Showing Variations of Dissolved Solids, Chloride, and Dissolved Oxygen at Three Sitesin the Sabine and Old Rivers Upstream From the Advance of Sea Water . . . . . . . . . . . . . . . . • 8
6. Sections Showing Variations of Dissolved Solids, Chloride, and Dissolved Oxygen at Three Sitesin the Sea-Water Affected Reaches of the Sabine and Old Rivers . .. . . ... . . 15
QUANTITY AND QUALITY DF LDW FLOW IN
SABINE AND OLD RIVERS NEAR ORANGE TEXAS
SEPTEMBER
INTRODUCTION
The U.S. Geological Survey's stream-gaging andchemical-quality station, Sabine River near Ruliff,Texas, is the lowermost site on the Sabine River forwhich daily streamflow and water-quality records areavailable. Downstream from this station, the Old Riveranabranch of the Sabine River diverts part of the flowinto louisiana, where two large privately owned canalcompanies pump water for rice irrigation, Similarly. theSabine River Authority of Texas diverts water from themainstem Sabine River far industrial and irrigation uses.The Sabine and Old Rivers rejoin in the tidal reachupstream from Orange, Texas. Because the lower reachof the Sabine River is tidal, sea water from the Gulf ofMeXICO periodically intrudes through Sabine lake intoboth the Sabine and Old Rivers. Although several privatefirms have collected some water-Quality information onthe tidal reach of the Sabine River (Forrest and Cotton,1966, p. 51, the effects of tide on water quality and theextent 01 salt-water intrusion have not been definedadequately. Moreover, neither the Quantity of water thatflows from the mainstem into Old River nor theQuantity or quality of tributary inflow downstream fromthe station near Ruliff is known. Therefore, in April1966, the U.S. Geological Survey, in cooperation withthe Sabine River Authority of Texas and the TexasWater Development Board, began a series of investigations of the quantity and Quality of flow in streams ofthe Sabine River basin between the Ruliff gaging stationand Orange. Purposes of the investigations were: (1) todetermine the distribution of flow in the mainstem andanabranches of the Sabine River in the study area; (2) todevise a method whereby the distribution of flow can be
estimated from discharge records of the gaging stationSabine River near Ruliff; (31 to define the effects of tideon Quality of the water; and (41 to determine the Qualityand quantity of tributary inflow.
The results of investigations made on April 12,1966, and during the period October 31 to November 4,1966, when flow at the Ruliff station was about 1,680cfs (cubic feet per second) and 500 cfs, respectively,have been described by Rawson, Reddy, and Smith(19671.
12·15,1967
A third investigation, the results of which aredescribed herein, was made during the low-flow periodSeptember 12·15, 1967, to supplement the earlierinvestigations.
DESCRIPTION OF STUDY AREA
The area studied extends from the stream-gagingstation Sabine River near Ruliff to the head of theship·turning basin near Orange (Figure 1). Although flowin the mainstem and anabranches of the Sabine wasrestricted to their channels during this study, the streamsoverflow frequently. Therefore, much of the area, whichranges from about 15 feet above mean sea level to sealevel, is poorly drained swampland. The area is coveredby a profuse growth of pine, cypress, and other largetrees.
About 5 miles downstream from the station nearRuliff, the Sabine River branches and part of the flowenters Old River through Cutoff Bayou. The Old Riveranabranch extends gulfward for about 11 miles inlouisiana and then rejoins the mainstem. Periodically,two privately owned companies in louisiana divert partof the flow from Old River for rice irrigation.
Downstream from the divergence of Indian Bayou,the channel of the Sabine River is blocked by a sandbarFigure 3. Consequently, during low·flow periods, all ofthe mainstem flow below Cutoff Bayou divergenceenters the Indian Bayou anabranch. Periodically. theSabine River Authority diverts pan of thiS flow forirrigation and industrial use. During previous investi·gations, part of the flow from Indian Bayou wasreturned to the mainstem Sabine River through aman·made channel at Swift lake. However. during thisinvestigation, the man-made channel was complelelyblocked by a sand dam. Although the lower reach ofIndian Bayou was partly blocked by a sandbag dam.some flow passed over the dam and returned to themainstem.
Downstream from Indian Bayou, the channel ofthe Sabine River meanders in a series of almost completeloops across the flood plain; Old River is much
Ri,o, mileoqe on '0' Sobin, fl"e, i, moa'"fOd "p,troom(+) o( oo"n''',am(-) from In""ta'e Hi~tI"a1
10, fA,IM~' on ,t>, Old R".. , p,eti,'d by ,tI.
I.,,", T, i, moa,,,.d "p,t,"~m (~) from t~. mou'~
EXPLANATION
Sabme
... -
~..- "'-
'~'~:~'.
NO'O
,."," Tna
..[',
•T'7
,,, "\...-~--.7F'y
",I. I 6
L.'~'"-'"
r---', '~ __ J
OEWEY~'LLE
Hayov"
,,,,,,: OPANGE I ~t,,",••
1 ,"" .." BOlio19'-4" "",~;:;.",,>
, ' 0L \'
(
""\\
\\
Fig u re 1
locations of Streamflow and Chemical-Quality Data- Collection Sites
- 2,
straighter. Although channel widths differed from site tosite, they generally increased in the downstream direc·tion. The channel of the Sabine River near Ruliff wasabout 145 feet wide, whereas at Interstate Highway la,it was more than 500 feet wide. The width of the OldRiver channel increased from about 35 feet in the upperreach to about 175 feet near the mouth. Similarly,depths generally increased in the downstream direction.The maximum depth of water observed in the SabineRiver near Ruliff was about 3 feet, but depths of morethan 30 feet were noted at Interstate Highway 10.Although the downstream increase in depth was usuallygradual, the depth of the Sabine River near the mouth ofthe Old River increased abruptly from about 10 feet(site 9) to more than 20 feet (site 16). No such abruptchange in depth of the Old River was noted.
In Figure 1 and in the following discussion, rivermileage on the mainstem Sabine River (induding IndianBayou) is measured upstream and downstream fromInterstate Highway 10, which is designated as mile 0.0.Upstream mileage is designated as positive (+1; down·stream mileage is designated as negative H. Mileage onother streams (including Old River) is measuredupstream from the mouths, each of which is designatedas mile T 0.0.
METHOOS OF INVESTIGATION
Water-level Measurements
Two temporary water·stage recorders wereinstalled to measure the fluctuations of water levelscaused by the tide and the diversion of water by theSabine River Authority and two louisiana pumpingplants (Figure 1). One of these instruments continuouslyrecorded the water·level fluctuations in the Sabine Riverat Morgan Bluff (site 6). The other recorder was installedin Cutoff Bayou (site 10) to determine if the reach wasaffected by tide and if the distribution of flow betweenthe Sabine and Old Rivers was affected by operation ofpumping plants. During some periods, the recorder inCutoff Bayou was inoperative. However, the stage recordwas supplemented by frequent visual observations ofwater levels.
Streamflow Measurements
To determine the distribution of flow between theSabine River and the Old River anabranch, discharge wasmeasured repeatedly in Cutoff Bayou (site 101 and oncein the Sabine River downstream from the divergence ofOld River (site 2). Flow passing the station near Ruliff(site 1) during these measurements was determined fromgaging·station records. Also, discharge was measured inall diversion canals, and all accessible tributaries wereinspected for flow.
·3·
Water-Quality Measurements
Because the specific conductance of a water isrelated to the number and types of ions in solution, fieldmeasurements of specific conductance can be used todetect variations in the salinity of a stream, Therefore,conductance was measured at many sites in the mainstem and anabranches of the Sabine River to detectlongitudinal, transversal, and vertical variations ofsalinity. At most of these sites, specific conductance,temperature, pH, and dissolved oxygen were measured atthe surface and bottom in one or more verticals. Whenvertical variations were detected, the water·qualitymeasurements were made at several intermediate depths,If no change in conductance occurred, a single sam·pie for laboratory analysis was collected. If a sharpchange occurred, samples for laboratory analysis werecollected from the surface, bottom, and intermediatedepths. Also, samples were collected from each flowingtributary located during the study, In the laboratory, thespecific conductance and chloride content of eachsample were determined and were used to select anumber of samples lor more complete chemical analysis.The relation of conductance to the concentrations ofchloride and dissolved solids in these samples was usedto calculate the chloride and dissolved·solids content ofwater at other points where conductance was measured.
ANALYSIS OF DATA
Water-Stage Records and Observations
locations at which temporary water·stagerecorders were installed are shown in Figure 1; variationsof river stage at these sites and records of pumping plantoperations are shown graphically in Figure 2. Records ofstage for the Sabine River at Morgan Bluff (site 61.supplemented by field observations at upriver sites,indicate that the stage and thus the flow of the SabineRiver were affected by tide as far upstream as the partialdam on Indian Bayou (Figure 3). Similarly, fieldobservations and records of stage for Cutoff Bayou(Figure 2, site 10) indicate that the stage and flowthroughout Old River were affected by tide (F igure 3).
Streamflow Distribution
locations where discharge was measured areshown in Figure 1; results of discharge measurements aregiven in Table 1. During the investigation. flow in theSabine River near Ruliff receded fairly uniformly fromabout 315 cfs to about 300 cfs and averaged about 305cfs. However, the distribution of flow between theSabine and Old Rivers varied because of the effects oftide and pumping. The discharges measured in CutoffBayou (site 10) ranged from 159 cfs to 195 cfs. BecauseCutoff Bayou was tidal, the discharge was not directly
T~ble l.-·Summary of Oi$,~arge Mea$urements, Sabine River 8a~ln Near Orange, Te~~s
SI TE OATE STREM\ LOCATION RIVH DISCHARGE, IN CUBIC FEET PER SECONO( 1961) 'II LES MAINSTEM ANABRANCH n I BUTARV DIVERSION
Sept. 12 Sabine River Lat 30'18'13", long 93"1j4'37", +22.6 ,,,at gaging Itation, Sabine Rivernear Rullff, TeKa$
Sept. " '0 '0 '0 ,", Sept. ., Sllbine River Lat 30'16'30", long 9)'42'21", 0.5 +17. ) a 109mile downstream from CutoH Bavou
, '0 Ind i an Bllyou Lat )0'14')0", long 93' 42'52", 500 +1) .9 a,b 54feet downstream from Sabine RiverAuthority's diversion canal, 2.5 miles south-southeast of Ruliff, Tuas
, '0 '0 '0 '0 a ,b 24
, '0 Sabine River Lat )0"1)'42", long 9)'44'1)", about 120Authority's 1.4 mllu upstream from Swift Lakediversion
~ canal
7 Sept. " Unnamed tribu- Lat 30'11'53", long 93"IiS'00", at T+l.1i 0.'tary to Sabine Old TeKlls State HIghway 87River
" Sept. " Cutoff Bayou Lat 30'16'51", long 93'41 '57", 0.8 T+9.8 ~,b 185(Old River) mile downstrt'llm from Sabine River
" Sept. " '0 '0 '0 ~,b 170
" '0 '0 '0 '0 a,b 175
" '0 '0 '0 '0 ~,b 159
" Sept. ., '0 '0 '0 b 195
" Sept. " Krause and Lat 30"14'44", iong 93'40'35", 3.9 "Managon Cana i miiu southeast of Rul1H, TeKasCO.'s canal
" '0 Sllbine Canal Lat )0"1)'10", lon'il 93"40'1)",5.3 80Co. 's canal miles southt'llst of Rul;ff, TeKas
" '0 Gum Slough Lat 3D" 14'0)", long 98"38'21", at T+6.7 ,Louisiana State Highway 109
ll. Probllbly affected by pumping.b. Affected by tide.
related to stage (Figure 2). Consequently, the range ofmeasured discharges does not necessarily represent therange that actually occurred. Nevertheless, the dischargemeasurements indicate that the portion of flow thatentered Old River through Cutoff Bayou varied considerably.
Although the effect of pumping-station operationson the stage of Cutoff Bayou was masked by the effectof tide, much of the variation in the distribution of flowbetween the Sabine and Old Rivers resulted frompumping. For example, during periods when the SabineRiver Authority's pumping plant was operating, theamount of water stored in Indian Bayou and thus theamount of water that flowed over the partial dam (site3) and returned to the mainstem Sabine River decreased.However, lowering the stage by pumping caused thegradient into Indian Bayou to increase. In response tothis increased gradient, the proportion of upriver inflowto Indian Bayou increased.
During previous investigations when flow at theRuliff station was about 1,680 cfs and 500 cfs, about
half the flow entered the Indian Bayou anabranch,Therefore, Rawson, Reddy, and Smith (1967, p, 21)concluded that during other periods when streamflowconditions were similar, the daily inflow that enters themainstem Sabine River through Indian Bayou could beestimated by subtracting the amount of water divertedby the Sabine River Authority from 50 percent of themean daily discharge of the Sabine River near Ruliff.However, the construction of dams in Indian Bayou andin the man-made channel that connects Indian Bayou tothe mainstem and changes in pumping-station operationshave altered flow conditions. Under these altered condi.tions, the streamflow records of the Sabine River nearRuliff cannot be used to estimate accurately thedownstream distribution of flow.
Water-Quality Variations
Locations of chemical-quality sampling sites areshown in Figure 1; results of chemical analyses are givenin Table 2. Profiles of the weighted-average chlorideconcentrations for the Sabine and Old Rivers are shown
SITE 10 CUTOFF BAYOU (STAGE PARTIALLY ESTIMATEO)
" '"' !"170 d' 170 ," "9", ,,, d,
" r-rO.O'II"OOr rG~,+Ot" IH' 0"
,SITE II KRAUSE AND MANAGON PUMP PLANT
4' d'~ ~
10 :
SITE 13 SABINE CANAL PUMP PLANTao eo,
~ ~, ,HQO",
SITE 2 SABINE RIVER BELOW CUTOFF BAYOU
'" ,"0
(-0.'0'
SITE 4 SABINE RIVER AUTHORITY PUMP PLANT120 d'~ ~
'-0011
SITE 3. INDIAN BAYOU (BELOW SANDBAG OAMI
" ," '4 d,, ,,,00_1 l-t 0"
oSep' I~, 1967S.P' 4,1967Sop' 13.1%75'0' 12,1%7
000
SITE 6. SABINE RIVER AT MORGAN BLUFF (STAGE RECORD),
Tide-Affected Reaches of the Sabine and Old Rivers
·6·
in Figure 4. Because samples were not collected from allsampling sites at the same tidal phase, the chlorideprofiles do not represent conditions that actually existedat any given time. Instead, the profiles show the averagechloride concentration of water in each cross section atthe time of sampling and the approximate extent ofsalt-water intrusion. In the following discussion thechloride profiles were used to subdivide the study areainto six reaches.
Sabine River-Mile +22.6 to Mile +10.9
Data in Figure 4 and Table 2 show that theweighted-average chloride content of water in this11.7-mile reach of the Sabine River increased from 21ppm (parts per million) at site 1 (mile +22.6) to 60 ppmat site 5 (mile +10.9). Water at sites 1 and 2 was freshand well mixed-the water contained 90 ppm dissolvedsolids and 21 ppm chloride at the surface, bottom, andintermediate depths (Figure 5). Although water at site 5was fresh, the dissolved-mineral content was minimum atthe surface and gradually increased with depth. Water atthe surface contained 115 ppm dissolved solids and 37ppm chloride, whereas water at the bottom contained190 to 278 ppm dissolved solids and 75 to 129 ppm
chloride. No tributary inflow was noted in this reach;thus, the downstream increase of dissolved minerals andthe corresponding increase of dissolved minerals withincrease in depth are attributed to the upstream intrusion of sea Welter.
Water throughout the upper part of the reach waswell aerated; however, the dissolved-oxygen contentdecreased somewhat in the lower part of the reach. Atsite 1, water at the surface, bottom, and intermediatedepths contained 6.7 ppm dissolved oxygen (86 percentof saturation). At site 5, water at the surface contained5.7 to 6.3 ppm dissolved oxygen (72 to 80 percent ofsaturation). whereas water at the bottom contained 4.7to 5.2 ppm (59 to 67 percent of saturation). Among themore significant factors that affect the dissolved-oxygencontent of any stream are the amounts and nature oforganic material present, the temperature and dissolvedmineral content of the water, bacterial activity,photosynthesis, and aeration from exposure to theatmosphere. Aeration is influenced greatly by thedissolved-oxygen deficiency; the character of thestreambed, and the depth, volume, and velocity of flow.The downstream decrease of dissolved oxygen betweensites 1 and 5 probably resulted from a combination ofseveral of these factors. Because dissolved oxygen at
different sites was measured at different times of theday, differences in photosynthetic activity and watertemperature probably caused some variation in theobserved concentrations of dissolved oxygen. Moreimportant, as the water moves downstream through theprofuse vegetation, it picks up natural organic debris, theoxidation of which utilizes dissolved oxygen. Moreover,according to Forrest and Cotton (1966, p. 12·13), thedissolved·oxygen content of water in the lower reachesof the Sabine River is being depleted by pollution. Thetidal intrusion of this polluted water upstream wouldresult in depletion of dissolved oxygen at upstream sites.Furthermore, because the stream gradient decreases andthe channel widens in the downstream direction,velocity and turbulence decrease; thus, the rate ofaeration decreases. The velocity and rate of aerationperiodically are decreased still further by the rising tide.
Sabine River-Mile +10.9 to Mile +5.6
The chloride profile (Figure 4) shows that theweighted·average chloride content of water in this reachincreased from 60 ppm at site 5 (mile +10.9) to about4,500 ppm at site 9 (mile +5.6). Although water at site 5was fresh, Figure 6 shows that salt water advanced as farupstream as site 6 (mile +10.41. At site 6, mixing waspoor and considerable horizontal stratification of freshand salt water occurred. Water from the surface to adepth of about 6 feet contained 245 ppm dissolvedsolids and 106 ppm chloride; water below a depth of 15feet contained more than 7,800 ppm dissolved solids and4,300 ppm chloride. The dissolved·oxygen content ofthe water also varied greatly with increase in depth.Water at the surface contained 6.1 to 6.2 ppm dissolvedoxygen; below a depth of 15 feet, the water contained0.5 ppm. Although the decrease of dissolved oxygenroughly coincided with the increase in salinity, theincrease in salinity was responsible for only a small partof the decrease in dissolved oxygen. The solubility ofoxygen in water decreases as the salinity increases;however, the amount of oxygen dissolved by sea waterin equilibrium with air is about 80 percent of thatdissolved by fresh water. At site 6, water at the surfacewas 76 to 77 percent saturated with dissolved oxygen;below a depth of 15 feet, the water was only 7 percentsaturated. These data indicate that much of thedissolved-oxygen deficit resulted from the oJl:idalion oforganic material. Although Ihe source of the organicmaterial was not ascertained, the fact that water whichwas deficient in dissolved oxygen was also the moresaline water indicates that Ihe organic material wasfrom downstream sources.
Although erosion of the salt·water wedge byfresh·water currents and turbulenre caused some mixingat downstream sites. the salinity and dissolved-oxygengradient at site 9 (mile +5.6) near the mouth of OldRiver remained large. Water at the surface contained
·14·
2,840 to 2.970 ppm dissolved solids, 1.560 to 1,630ppm chloride, and 5.5 to 6.2 ppm dissolved oxygen.Bottom water contained 15.600 ppm dissolved solids,8,660 ppm chloride, and 0.2 to 0.3 ppm dissolvedOJl:ygen.
Old River-Mile T +10.5 to Mile T +4.8
Water in the upper 5.7-mite reach of the Old Riverwas fresh, well aerated. and similar in chemical characterto water in the upstream reach of the mainstem SabineRiver {Figure 51. Water at sites 10 (mile T +9.81 and 12(mile T +4.81 contained 90 ppm dissolved solids. 21 ppmchloride. and 6.4 10 7.1 ppm dissolved oJl:ygen.
Old River-Mile T +4.8 to Mile T 0.0
Figure 4 shows that Ihe weighted·average chloridecontent in this reach increased from 21 ppm at site 12(mile T +4.81 to more than 6.800 ppm at site 15 (mile T+0.2). Salt water was detected as far upstream as site 14(mile T +3.8). At this site, miJl:ing was poor and theinterface between waters with different salinities andconrentrations of dissolved oxygen was fairly sharp(Figure 6). Water at the surface contained 1.500 ppmdissolved solids, 800 ppm chloride, and 6.2 ppmdissolved oJl:ygen (78 percent of saturation). Below adepth of 7 feet, the water contained more than 15.500ppm dissolved solids, 8.600 ppm chloride, and 0.5 ppmdissolved oxygen (7 percent of saturation).
At site 15, near the mouth of Old River, thedissolved-solids and chloride conrentrations of water atthe surface were 2,650 ppm and 1,460 ppm. respectively. The salinity gradient from surface to bottomremained large-water at the bottom contained 16,20010 17,200 ppm dissolved solids and 9.000 to 9,590 ppmchloride. The dissolved,oJl:ygen content also variedgreatly with depth. The upper 2 feet of water contained6.2 ppm dissolved OJl:ygen (79 to 81 percent of satura·tion); below a depth of 7 feet, the dissolved oxygendecreased abruptly to 0.3 ppm (4 percent of saturation).
Sabine River-Mile +5.6 to Mile ·1.6
The weighted-average chloride concentration ofwater in this 7.2·mile reach increased from about 4.500ppm at site 9 (mile +5.61 to more than 8,500 ppm at site22 (mile ·1.6). Much of the increase occurred in theupper 0.4 mile of this reach (Figure 4). At site 16 (mile+5.2). for eJl:ample, the average chloride content of thewater was more than 7.200 ppm. In the O.4-mile reachbetween sites 9 and 16, depths of water increaseabruptly in the downstream direction-from about 10feet at site 9 to more than 20 feet at site 16 (Table 2).This abrupt increase in depth is a natural barrier to theupstream advanre of salt water (Rawson, Reddy. andSmith, 1967, p. 20). Nevertheless. some salt water
spilled over the barrier and advanced farther upstream inthe mainstem Sabine River. However, the quantity wasconsiderably less than that which advanced into OldRiver where no such abrupt change in depth occurred(Figure 4).
Although mixing of fresh and salt water generallyincreased downstream from site 16, complete mixingwas not attained. At site 22, the lowermost site in thestudy area, water at the surface contained 11,900 to12,500 ppm dissolved solids and 6,600 to 6,940 ppmchloride, whereas water at the bottom contained 16,000to 17,500 ppm dissolved solids and 8,910 to 9,690 ppmchloride. The dissolved·oxygen content of the waterdecreased from 4.7 ppm at the surface to 0 ppm belowdepths of 20 feet.
Big Bayou-Mile T +5.5 to Mile T 0.0
About 0.7 mile upstream from its mouth, OldRiver branches and part of the flow enters Big Bayou(Figure 1). Big Bayou flows for about 5.5 miles inlouisiana and then joins the Sabine River. The weighted·average chloride content of water in Big Bayou increasedfrom 2,770 ppm at site 18 (mile T +5.4) to 7,830 ppmat site 20 (mile T +0.2). Mixing of the water increased inthe downstream direction, but complete homogeneitywas not attained. At site 20, for example. water at thesurface contained 9,930 ppm dissolved solids, 5,520ppm chloride. and 3.8 to 3.9 ppm dissolved oxygen;water at the bottom contained 15.600 ppm dissolvedsolids, 8,660 ppm chloride, and 0.3 ppm dissolvedoxygen.
Inflow From Tributaries
Measured tributary inflow to the study reachtotaled only about 2.2 cis-0.2 cis from an unnamedtributary (site 7) and 2 cis from Gum Slough (site 19).Water in the unnamed tributary contained 1B4 ppmdissolved solids and 80 ppm chloride; water in GumSlough contained 220 ppm dissolved solids and 102 ppmchloride.
SUMMARY OF CONCLUSIONS
During the period September 12·15, 1967,measured tributary inflow to the Sabine and Old Riversbetween the stream-gaging station Sabine River nearRuliff and the ship·turning basin near Orange totaledabout 2.2 cis. Streamflow of the Sabine River at thestation near Ruliff averaged about 305 cis and recededfairly uniformly from about 315 cis on September 12 to
- 16·
about 300 cis on September 15. Downstream from theRuliff Station, the distribution of flow between theSabine River and Old River anabranch varied consid.erably in response to changes in stage produced by tidalfluctuations and pumping. Therefore, under the condi·tions that existed during the study, no accurate methodcan be devised for estimating the distribution of flowbetween the Sabine and Old Rivers.
Previous investigations (Rawson, Reddy, andSmith, 1967, p. 21) indicated that during low-flowperiods the daily inflow that enters the mainstem SabineRiver through Indian Bayou could be estimated fromstreamflow records of the upstream station Sabine Rivernear Ruliff. However, because of changes in channelconditions produced by the construction of dams inIndian Bayou, use of streamflow records of the SabineRiver near Ruliff for estimating the daily inflow atdownstream sites is no longer possible.
Because the lower reach of the Sabine River istidal, sea water from the Gulf of Mexico periodicallyintrudes through Sabine lake into both the Sabine andOld Rivers. During this investigation, water in the11.7-mile reach of the Sabine River between the Ruliffstation and Morgan Eddy and the upper 5.7·mile reachof the Old River was fresh and well aerated. Waterthroughout much of these reaches contained less than100 ppm dissolved solids and 25 ppm chloride and morethan 6.0 ppm dissolved oxygen. Farther seaward, theintrusion of sea water resulted in a large increase in theconcentrations of dissolved solids and chloride in boththe Sabine and Old Rivers. Although mixing of freshwater with sea water increased seaward, completehomogeneity was not attained. At the head of theship-turning basin near Orange, the lowermost site in thestudy area, water at the surface contained 11,900 to12,500 ppm dissolved solids and 6,600 to 6,940 ppmchloride, whereas water at the bottom contained 16,000to 17,500 ppm dissolved solids and 8,910 to 9,690 ppmchloride. The dissolved·oxygen content of the water atthis site decreased from 4.7 ppm at the surface to 0 ppmbelow depths of 20 feet.
Dissolved·oxygen concentrations in the reachaffected by salt·water intrusion generally decreasedgreatly with depth. Although the decrease of dissolvedoxygen coincided roughly with the increase in salinity,only a small part of the dissolved·oxygen deficit resultedfrom the increase in salinity. Much of the deficitprobably resulted from the oxidation of organic pollutants pushed upstream by the periodic rise of the tide.
REFERENCES
Forrest and Cotton, 1966. Water quality study: SabineRiver Authority of Texas duplicated rept. 22 p.
Rawson, Jack, Reddy, D. R., and Smith. R. E., 1961,Low-flow studies, Sabine and Old Rivers near Orange,
- 17-
Texas, quantity and quality, April 12, October 31 .November 4, 1966: Texas Water Devel. Board Rept.66, 23 p.