81
Page 1 of 81 Quarterly Drinking Water Quality Report 1 April 2015 to 30 June 2015
Page 1 of 81
Quarterly Drinking Water Quality Report 1 April 2015 to 30 June 2015
Page 2 of 81
Contents
1 Introduction ........................................................................................................ 5
1.1 Sydney Water’s system and operations ...................................................... 5 1.2 Multi-barrier approach ................................................................................. 6 1.3 Structure of this report ................................................................................. 7
2 Catchments, storages and raw water delivery systems .................................... 10 2.1 Catchments ............................................................................................... 10 2.2 Storages and raw water delivery systems ................................................. 10
2.2.1 Prospect, Orchard Hills and Warragamba delivery system - raw water .. ........................................................................................................... 12 2.2.2 Macarthur delivery system - raw water ............................................... 15 2.2.3 Woronora delivery system - raw water ............................................... 16 2.2.4 Illawarra delivery system - raw water.................................................. 17 2.2.5 North Richmond delivery system - raw water ..................................... 18 2.2.6 Cascade delivery system - raw water ................................................. 19 2.2.7 Nepean delivery system - raw water................................................... 20
2.3 Discussion of results for storages and raw water delivery systems ........... 21 3 Treatment ......................................................................................................... 22
3.1 Key parameters ......................................................................................... 22 3.1.1 Prospect Water Filtration Plant ........................................................... 23 3.1.2 Orchard Hills Water Filtration Plant .................................................... 25 3.1.3 Macarthur Water Filtration Plant ......................................................... 27 3.1.4 Woronora Water Filtration Plant ......................................................... 29 3.1.5 Illawarra Water Filtration Plant ........................................................... 31 3.1.6 North Richmond Water Filtration Plant ............................................... 33 3.1.7 Cascade Water Filtration Plant ........................................................... 35 3.1.8 Nepean Water Filtration Plant ............................................................ 37 3.1.9 Warragamba Water Filtration Plant .................................................... 39
3.2 Cryptosporidium and Giardia ..................................................................... 41 3.3 Other parameters ...................................................................................... 44 3.4 Discussion of results for water treatment ................................................... 48
3.4.1 Raw water .......................................................................................... 48 3.4.2 Treated water ..................................................................................... 48
4 Distribution (Customer Supply Systems) .......................................................... 49 4.1 Routine monitoring for key parameters ...................................................... 49
4.1.1 Prospect North Customer Supply System .......................................... 50 4.1.2 Prospect East Customer Supply System ............................................ 52 4.1.3 Prospect South Customer Supply System .......................................... 54 4.1.4 Potts Hill Customer Supply System .................................................... 56 4.1.5 Ryde Customer Supply System .......................................................... 58 4.1.6 Orchard Hills Customer Supply System ............................................. 60 4.1.7 Macarthur Customer Supply System .................................................. 62 4.1.8 Woronora Customer Supply System .................................................. 64 4.1.9 Illawarra Customer Supply System .................................................... 66 4.1.10 North Richmond Customer Supply System ........................................ 68 4.1.11 Cascade Customer Supply System .................................................... 70
Page 3 of 81
4.1.12 Nepean Customer Supply System ..................................................... 72 4.1.13 Warragamba Customer Supply System ............................................. 74
4.2 Other parameters ...................................................................................... 76 4.3 Discussion of results for Customer Supply Systems .................................. 77
5 Water Quantity Data ......................................................................................... 78 5.1 Storage ..................................................................................................... 78 5.2 Rainfall ...................................................................................................... 80 5.3 Water Consumption .................................................................................. 81
List of tables Table 1 Location, associated Water Treatment Plant and Water Supply System ..... 9 Table 2 Lake Burragorang @ 500m u/s Dam Wall (supplying Prospect, Orchard
Hills and Warragamba WFPs) ................................................................. 12 Table 3 Upper Canal @ Prospect (supplying Prospect WFP only) ........................ 13 Table 4 Prospect Lake (supplying Prospect WFP only - infrequently used) ........... 14 Table 5 Broughton’s Pass weir (supplying Macarthur WFP) .................................. 15 Table 6 Lake Woronora @ Dam Wall .................................................................... 16 Table 7 Upper Avon .............................................................................................. 17 Table 8 Nepean River ........................................................................................... 18 Table 9 Lake Top Cascade @ 100m u/s dam wall ................................................ 19 Table 10 Lake Nepean .......................................................................................... 20 Table 11 Prospect Water Filtration Plant – raw water ............................................ 23 Table 12 Prospect Water Filtration Plant – treated water ....................................... 24 Table 13 Orchard Hills Water Filtration Plant – raw water ...................................... 25 Table 14 Orchard Hills Water Filtration Plant – treated water ................................ 26 Table 15 Macarthur Water Filtration Plant – raw water .......................................... 27 Table 16 Macarthur Water Filtration Plant – treated water ..................................... 28 Table 17 Woronora Water Filtration Plant – raw water .......................................... 29 Table 18 Woronora Water Filtration Plant – treated water ..................................... 30 Table 19 Illawarra Water Filtration Plant – raw water ............................................. 31 Table 20 Illawarra Water Filtration Plant – treated water ....................................... 32 Table 21 North Richmond Water Filtration Plant – raw water ................................ 33 Table 22 North Richmond Water Filtration Plant – treated water ........................... 33 Table 23 Cascade Water Filtration Plant – raw water ............................................ 35 Table 24 Cascade Water Filtration Plant – treated water ....................................... 36 Table 25 Nepean Water Filtration Plant – raw water .............................................. 37 Table 26 Nepean Water Filtration Plant – treated water ........................................ 37 Table 27 Warragamba Water Filtration Plant – raw water ...................................... 39 Table 28 Warragamba Water Filtration Plant – treated water ................................ 40 Table 29 Cryptosporidium and Giardia results – raw water .................................... 42 Table 30 Cryptosporidium and Giardia results – treated water .............................. 43 Table 31 Other chemicals – raw water .................................................................. 45 Table 32 Pesticides and herbicides – raw water .................................................... 46 Table 33 Radionuclides – raw water ...................................................................... 47 Table 34 Other chemicals – treated water ............................................................. 47 Table 35 Prospect North Customer Supply System – health characteristics .......... 50 Table 36 Prospect North Customer Supply System – aesthetic characteristics ..... 51 Table 37 Prospect East Customer Supply System – health characteristics ........... 52 Table 38 Prospect East Customer Supply System – aesthetic characteristics ....... 53 Table 39 Prospect South Customer Supply System – health characteristics ......... 54
Page 4 of 81
Table 40 Prospect South Customer Supply System – aesthetic characteristics ..... 55 Table 41 Potts Hill Customer Supply System – health characteristics ................... 56 Table 42 Potts Hill Customer Supply System – aesthetic characteristics ............... 57 Table 43 Ryde Customer Supply System – health characteristics ......................... 58 Table 44 Ryde Customer Supply System – aesthetic characteristics..................... 59 Table 45 Orchard Hills Customer Supply System – health characteristics ............. 60 Table 46 Orchard Hills Customer Supply System – aesthetic characteristics ........ 61 Table 47 Macarthur Customer Supply System – health characteristics ................. 62 Table 48 Macarthur Customer Supply System – aesthetic characteristics ............. 63 Table 49 Woronora Customer Supply System – health characteristics .................. 64 Table 50 Woronora Customer Supply System – aesthetic characteristics ............. 65 Table 51 Illawarra Customer Supply System – health characteristics .................... 66 Table 52 Illawarra Customer Supply System – aesthetic characteristics ............... 67 Table 53 North Richmond Customer Supply System – health characteristics ........ 68 Table 54 North Richmond Customer Supply System – aesthetic characteristics ... 69 Table 55 Cascade Customer Supply System – Health characteristics ................... 70 Table 56 Cascade Customer Supply System – aesthetic characteristics ............... 71 Table 57 Nepean Customer Supply System – health characteristics ..................... 72 Table 58 Nepean Customer Supply System – aesthetic characteristics ................ 73 Table 59 Warragamba Customer Supply System – health characteristics ............. 74 Table 60 Warragamba Customer Supply System – aesthetic characteristics ........ 75 Table 61 Other parameters assessed against health guidelines ............................ 76 Table 62 Other parameters assessed against aesthetic guidelines ....................... 76 Table 63 Status of individual Storages .................................................................. 79
Page 5 of 81
1 Introduction Sydney Water produces this report each quarter to inform our customers about water quality, available water stored in the dams, rainfall and water consumption. This report summarises a selection of health characteristics, chosen in consultation with NSW Health and key aesthetic characteristics.
This report should be viewed along with the other complementary information available on the Sydney Water website. The complementary material includes a glossary of terms and details of our systems and operations that are referenced throughout this report. In addition to this report, Sydney Water produces fact sheets which review and summarise issues of concern to the water industry, also there are Q & A links on specific drinking water quality topics.
On 1st January 2015 the Sydney Catchment Authority and State Water merged to become WaterNSW. This new organisation is responsible for the management of Sydney’s catchments, raw water storages and delivery systems. WaterNSW has provided data for this report based on the raw water quality monitoring they perform. Enquiries concerning WaterNSW can be directed to their Penrith office on (02) 4725 2100 or to their website: WaterNSW website.
1.1 Sydney Water’s system and operations On average, Sydney Water supplies over 1.4 billion litres of drinking water daily, to over 4.8 million people in 1.8 million homes and businesses across Sydney, the Illawarra and the Blue Mountains. Households use about 70% of the water supplied and businesses use about 30%.
Rainfall from catchment areas provides water, which is stored in dams (except for the North Richmond plant, which draws water directly from the Hawkesbury-Nepean River), and then transported by large pipelines or canals to water filtration plants where it is treated and disinfected. The desalination plant, when operating, provides up to 15% of Sydney's water supply. Once treated, water is distributed to consumers through about 21,477 km of water pipes, 243 reservoirs and 150 pumping stations.
Sydney Water’s responsibility for the protection of public health falls under the Public Health Act 2010 as well as other relevant legislation. Sydney Water has a responsibility to supply safe drinking water to consumers in accordance with its Operating Licence (2010-2015) granted by the Independent Pricing and Regulatory Tribunal (IPART) under the Sydney Water Act 1994. Compliance is managed through a Memorandum of Understanding between NSW Health and Sydney Water. Water quality characteristics within the water supply system are compared to the Australian Drinking Water Guidelines 2011 (ADWG).
Sydney Water has adopted the Framework for Management of Drinking Water Quality, as outlined in the ADWG. The ADWG were developed by the National Health and Medical Research Council and the Natural Resource Management Ministerial Council in consultation with the water industry. The ADWG are a part of the National Water Quality Management Strategy. The Framework applies a risk management approach to ensure that the water supplied meets both the health and aesthetic requirements of the ADWG. Water quality monitoring is undertaken to verify that the quality management systems are working.
Sydney Water’s water quality results are audited yearly on behalf of NSW Health and IPART.
Page 6 of 81
For more information on Sydney Water’s system and operations see the Sydney Water website.
1.2 Multi-barrier approach The ADWG Framework for Management of Drinking Water Quality uses a preventive risk management approach that encompasses all the steps in water production from the catchment to the consumer’s tap.
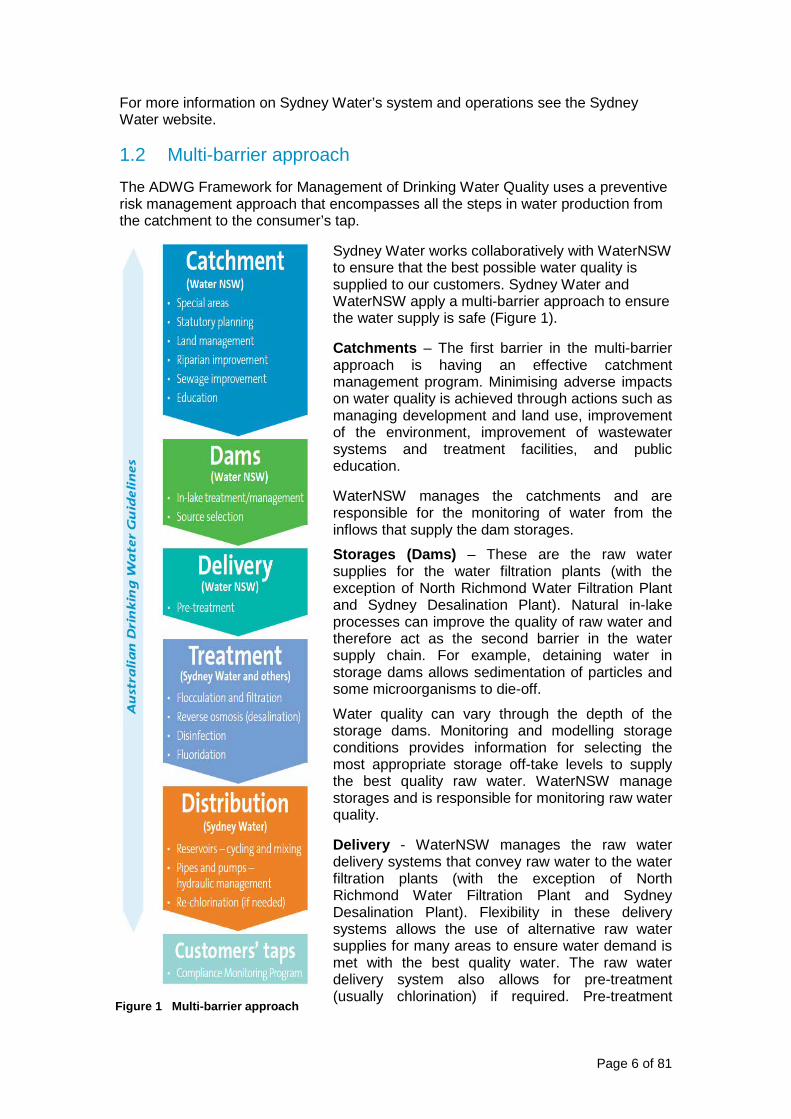
Sydney Water works collaboratively with WaterNSW to ensure that the best possible water quality is supplied to our customers. Sydney Water and WaterNSW apply a multi-barrier approach to ensure the water supply is safe (Figure 1).
Catchments – The first barrier in the multi-barrier approach is having an effective catchment management program. Minimising adverse impacts on water quality is achieved through actions such as managing development and land use, improvement of the environment, improvement of wastewater systems and treatment facilities, and public education.
WaterNSW manages the catchments and are responsible for the monitoring of water from the inflows that supply the dam storages.
Storages (Dams) – These are the raw water supplies for the water filtration plants (with the exception of North Richmond Water Filtration Plant and Sydney Desalination Plant). Natural in-lake processes can improve the quality of raw water and therefore act as the second barrier in the water supply chain. For example, detaining water in storage dams allows sedimentation of particles and some microorganisms to die-off.
Water quality can vary through the depth of the storage dams. Monitoring and modelling storage conditions provides information for selecting the most appropriate storage off-take levels to supply the best quality raw water. WaterNSW manage storages and is responsible for monitoring raw water quality.
Delivery - WaterNSW manages the raw water delivery systems that convey raw water to the water filtration plants (with the exception of North Richmond Water Filtration Plant and Sydney Desalination Plant). Flexibility in these delivery systems allows the use of alternative raw water supplies for many areas to ensure water demand is met with the best quality water. The raw water delivery system also allows for pre-treatment (usually chlorination) if required. Pre-treatment
Figure 1 Multi-barrier approach

Page 7 of 81
when applied can act as a third barrier in the supply chain.
Treatment – Treating water makes it fit for drinking and is a key barrier. Treatment removes sediment and other contaminants in the water, and removes or destroys harmful microorganisms. All plants use coagulation, flocculation, filtration and disinfection. Pre-treatment with chlorine can also be applied at the inlet of some water filtration plants to improve water quality. Additional treatment processes are also used at the North Richmond plant, which draws water directly from the Hawkesbury-Nepean River. The desalination plant uses reverse osmosis. Fluoride is added at all plants for dental health benefits as required by the Fluoridation of Public Water Supplies Act 1957.
The plants at Prospect, Appin (Macarthur), Kembla Grange (Illawarra) and Woronora were built and are owned / operated by private sector companies and together filter and disinfect about 90% of water supplied to consumers. The desalination plant at Kurnell is owned by Sydney Desalination Plant Pty Ltd (formerly a Sydney Water subsidiary but sold to a private sector corporation in June 2012). When running, this plant supplies approximately 15% of demand.
Sydney Water owns and operates five smaller water filtration plants (WFPs). These are Orchard Hills, Cascade, North Richmond, Nepean and Warragamba water filtration plants.
To help optimise the treatment process and ensure consistently good water quality, Sydney Water and WaterNSW monitor the raw water entering the plants. Treatment processes are continuously monitored to ensure they are working appropriately. Sydney Water also verifies that the treated water meets drinking water guideline values by undertaking ‘compliance’ and ‘operational’ monitoring programs.
Distribution – Treated water from nine water filtration plants and the Sydney Desalination plant (when operating) is supplied to thirteen customer supply systems. Sydney Water is responsible for the management and operation of the customer supply systems.
Maintaining adequate chlorine or chloramine levels throughout the distribution network minimises the risks from contamination of the supply and minimises bacterial regrowth. This is assisted by hydraulic management of the system to minimise water age and to keep the water well mixed. When necessary, in-system re-chlorination is undertaken.
Prevention of contamination is achieved through securing the distribution pipes and reservoir network by:
• roofing all reservoirs
• preventing backflow
• having security alarms on critical assets
• maintaining and renewing assets
• adhering to established operational and maintenance procedures.
Sydney Water has a comprehensive drinking water quality monitoring program in Customer Supply Systems to verify that equipment and processes are operating effectively and that the water meets required guidelines.
1.3 Structure of this report The tables in sections 2 to 4 of this report present water quality data from the analysis of water samples collected from the various stages (as illustrated in Figure
Page 8 of 81
1) of the water supply chain, from raw water sources, through treatment to the water supplied to the customer.
Raw water monitoring is generally undertaken by WaterNSW who supply data for this report, while treatment process verification monitoring and verification of water quality supplied to customers is undertaken by Sydney Water.
Data is arranged according to the water treatment plant and respective customer supply systems. To determine what data are relevant to your area, Table 1 and the information about water systems on our website can be used to determine your water treatment plant and particular customer supply system.
Data presented in this report are not exhaustive but are from the routine monitoring of key parameters. These data illustrate the effectiveness of the various barriers and processes to reduce contaminants and ensure the quality of the water supplied to our customers.
Section 5 of this report presents water quantity, rainfall and water consumption data. The quantity and rainfall data is supplied by WaterNSW.

Page 9 of 81
Table 1 Location, associated Water Treatment Plant and Water Supply System
Your location Local government area Water treatment plant
Water supply system
Northern suburbs
North Shore from Sydney Harbour to Palm Beach
Baulkham Hills (part), Hornsby (part), Hunters Hill, Ku-ring-gai (part), Lane Cove, Mosman, Manly, North Sydney, Parramatta (part), Pittwater, Ryde, Warringah, Willoughby
Prospect Ryde
North-West Sydney Kurrajong, Richmond, Wilberforce, Windsor, Hawkesbury (part), Penrith (part) North Richmond North
Richmond
Baulkham Hills, Blacktown
Baulkham Hills (part), Blacktown (part), Hawkesbury (part), Holroyd (part), Hornsby (part), Ku-ring-gai (part), Parramatta (part)
Prospect Prospect North
Western suburbs
Parramatta Auburn (part), Bankstown (part), Fairfield (part), Holroyd (part), Parramatta (part) Prospect Prospect East
Erskine Park, Penrith, St Marys Blue Mountains (part), Penrith (part) Orchard Hills Orchard Hills
Blacktown Blacktown (part), Fairfield (part), Liverpool (part), Penrith (part) Prospect Prospect South
Inner West, Central, Southern & Eastern suburbs
CBD and Eastern Suburbs south to the Georges River
Ashfield, Auburn (part), Botany Bay, Bankstown (part), Burwood, Canterbury, Canada Bay, Hurstville, Kogarah, Leichardt. Marrickville, Randwick, Rockdale, South Sydney, Strathfield, Sydney, Waverley, Woollahra
Can be supplied from Prospect and/or Sydney Desalination Plant
Potts Hill
South of the Georges River Sutherland
Can be supplied from Prospect, Woronora and/or Sydney Desalination Plant
Potts Hill and / or Woronora
South-West Sydney Liverpool Liverpool (part) Prospect Prospect East Appin, Camden (part), Campbelltown, Casula Glenfield, Leppington, Minto, Narellan
Camden (part), Campbelltown, Liverpool (part), Wollondilly (part) Macarthur Macarthur
Oakdale, Picton, Thirlmere Camden (part), Wollondilly (part) Nepean Nepean
Warragamba township Wollondilly (part) Warragamba Warragamba Blue Mountains Lower Blue Mountains, Springwood (part) to Penrith
Blue Mountains (part), Penrith (part) Orchard Hills Orchard Hills
Katoomba to Springwood (part), Mt Victoria, Medlow Bath, Blackheath
Blue Mountains (part) Cascade Cascade
Illawarra Illawarra from Scarborough to Gerroa
Kiama, Shellharbour and Wollongong (except Helensburgh and Stanwell Park) Illawarra Illawarra
Coalcliff , Helensburgh, Stanwell Park Wollongong (part) Woronora Woronora
Page 10 of 81
2 Catchments, storages and raw water delivery systems
WaterNSW supplies bulk raw water from its storages to Sydney Water according to the Raw Water Supply Agreement (RWSA), which was renewed in October 2013. The catchments are the source of the raw water stored in WaterNSW storages (dams). Under the risk-based approach, the first step to reduce the potential for water contamination and hence protect water quality is to maintain healthy catchments and manage external impacts on them. WaterNSW works with the community, other government agencies, local councils, industry bodies, environment groups and landholders to manage and protect the catchment areas.
WaterNSW is responsible for managing the water stored in the dams, selecting good quality water for treatment, and managing the transport and delivery systems for bulk raw water.
Water for the North Richmond Water Filtration Plant and supply system is sourced directly from the Hawkesbury-Nepean River. Government agencies work with local councils and community groups to help ensure the health of the catchment.
2.1 Catchments Routine monitoring of catchment streams is used to assess the quality of water within the catchments. Monitoring results provide an indication of environmental water quality, such as the ‘health’ of each sub-catchment and any changes to water quality over time. Identifying contaminants within catchment waters provides early warning of potential raw water quality problems and assists in the management of catchment lands to improve catchment health.
Not all contaminants identified in catchment waterways are considered a significant risk to the drinking water supply. In-stream processes, including dilution, sedimentation, oxidation or biodegradation, may reduce the concentration of these contaminants to acceptable levels before reaching raw water storages. As the results of catchment water-way monitoring are not immediately relevant to drinking water quality they have not been included in this report but can be found in WaterNSW Annual Water Quality Monitoring Report on WaterNSW website.
2.2 Storages and raw water delivery systems WaterNSW monitors water quality in the storages (dams) to help identify and target possible contamination sources. Monitoring in the storages also informs management actions, the selection of water sources and the depth of raw water extraction to optimise raw water quality supplied for treatment. Monitoring in the raw water delivery system and at the inflow to the water filtration plants helps to inform treatment operations, and verifies that the raw water delivered to the water filtration plants meets agreed quality and can be treated to meet the requirements of the ADWG.
Monitoring of the raw water in the Hawkesbury-Nepean River, the source of raw water supplying North Richmond Water Filtration Plant, is undertaken by Sydney Water.
Page 11 of 81
The data presented in Table 2 to Table 10 is not exhaustive but shows results for the key parameters from storage and raw water delivery system sites in close proximity to where water is extracted for treatment. Results for monitoring undertaken by WaterNSW at the inflow to the water filtration plants are not presented here but data for Sydney Water’s monitoring of the same sites are presented.
There are no relevant guidelines for the detection of indicator organisms in the raw water storages or raw water delivery systems. WaterNSW and Sydney Water have established their own agreed action levels that are used to trigger further investigation of possible faecal contamination, based on an understanding of system characteristics and historical information. Reference levels for other parameters are based on the Australian Drinking Water Guidelines for Fresh and Marine Waters, ANZECC, 2000.
Page 12 of 81
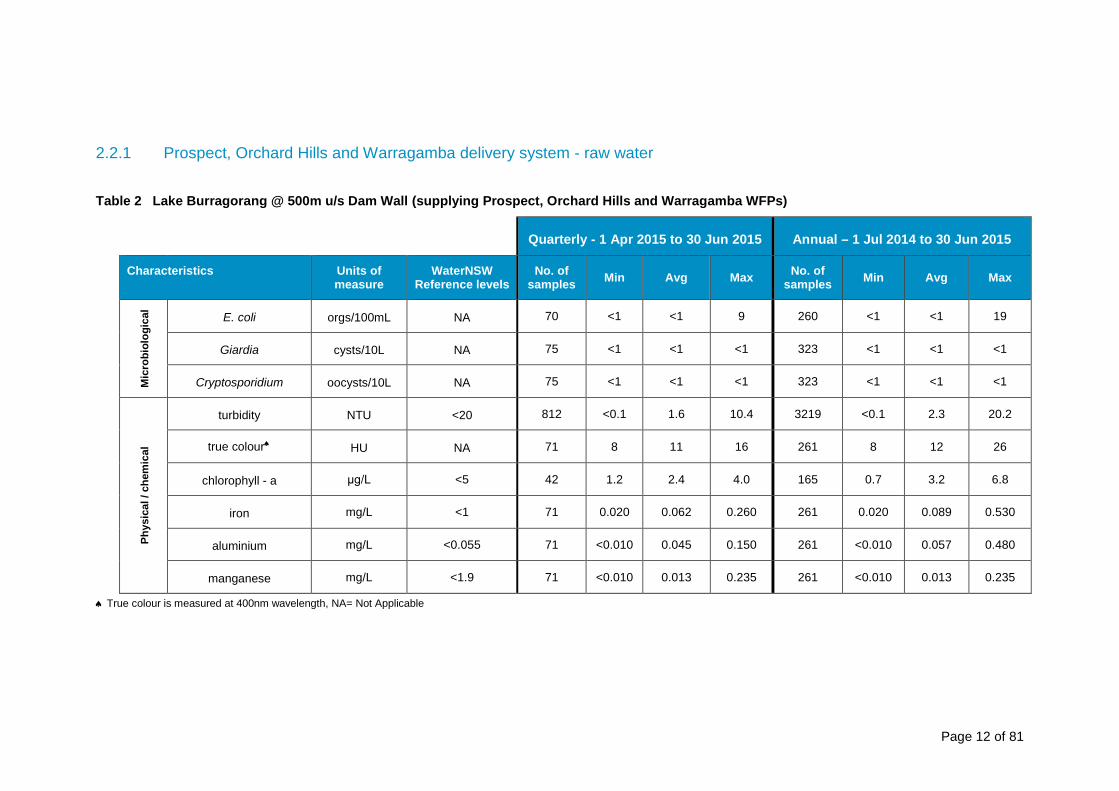
2.2.1 Prospect, Orchard Hills and Warragamba delivery system - raw water
Table 2 Lake Burragorang @ 500m u/s Dam Wall (supplying Prospect, Orchard Hills and Warragamba WFPs)
Quarterly - 1 Apr 2015 to 30 Jun 2015 Annual – 1 Jul 2014 to 30 Jun 2015
Characteristics Units of measure
WaterNSW Reference levels
No. of samples Min Avg Max No. of
samples Min Avg Max
Mic
robi
olog
ical
E. coli orgs/100mL NA 70 <1 <1 9 260 <1 <1 19
Giardia cysts/10L NA 75 <1 <1 <1 323 <1 <1 <1
Cryptosporidium oocysts/10L NA 75 <1 <1 <1 323 <1 <1 <1
Phys
ical
/ ch
emic
al
turbidity NTU <20 812 <0.1 1.6 10.4 3219 <0.1 2.3 20.2
true colour♠ HU NA 71 8 11 16 261 8 12 26
chlorophyll - a μg/L <5 42 1.2 2.4 4.0 165 0.7 3.2 6.8
iron mg/L <1 71 0.020 0.062 0.260 261 0.020 0.089 0.530
aluminium mg/L <0.055 71 <0.010 0.045 0.150 261 <0.010 0.057 0.480
manganese mg/L <1.9 71 <0.010 0.013 0.235 261 <0.010 0.013 0.235
♠ True colour is measured at 400nm wavelength, NA= Not Applicable

Page 13 of 81
Table 3 Upper Canal at Prospect (supplying Prospect WFP only)
Quarterly - 1 Apr 2015 to 30 Jun 2015 Annual – 1 Jul 2014 to 30 Jun 2015
Characteristics Units of measure
WaterNSW Reference levels
No. of samples Min Avg Max No. of
samples Min Avg Max
Mic
robi
olog
ical
E. coli orgs/100mL NA 3 1 10 25 11 <1 24 99
Giardia* cysts/10L NA 21 <1 <1 9 84 <1 <1 9
Cryptosporidium* oocysts/10L NA 21 <1 <1 4 84 <1 <1 8
Phys
ical
/ ch
emic
al
turbidity NTU <20 3 0.3 1.3 2.1 11 0.3 2.9 19.8
true colour♠ HU NA 3 8 12 16 11 4 13 47
chlorophyll - a μg/L <5 3 0.6 1.2 2.0 11 <0.1 0.9 2.2
iron mg/L <1 3 0.100 0.253 0.370 11 0.100 0.335 0.680
aluminium mg/L <0.055 3 0.040 0.073 0.130 11 0.040 0.153 0.850
manganese mg/L <1.9 3 0.010 0.018 0.034 11 0.010 0.025 0.060
* Cryptosporidium and Giardia are monitored at this site on an as needs basis in response to certain events. Monitoring is also done at the raw water inflow to each water filtration plant, which provides an indication of the raw water quality immediately before treatment. Results for both the raw water and treated water are presented in Section 3, Treatment. ♠ True colour is measured at 400nm wavelength, NA= Not Applicable
Page 14 of 81
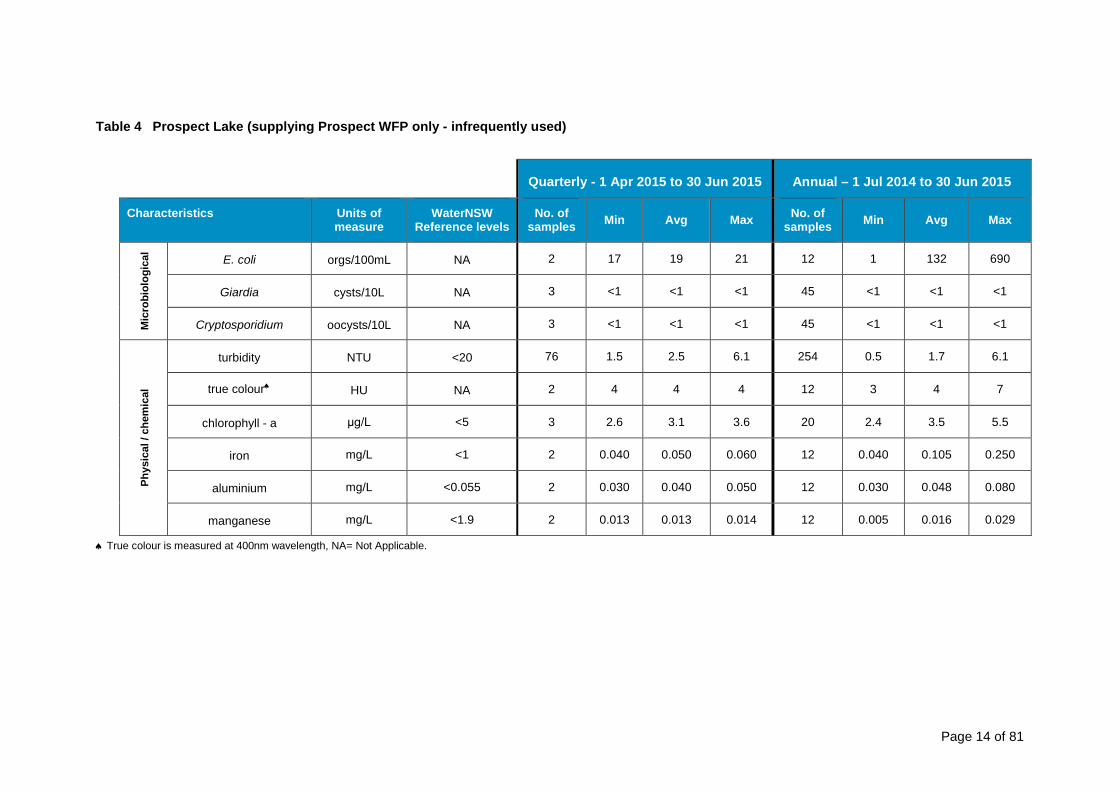
Table 4 Prospect Lake (supplying Prospect WFP only - infrequently used)
Quarterly - 1 Apr 2015 to 30 Jun 2015 Annual – 1 Jul 2014 to 30 Jun 2015
Characteristics Units of measure
WaterNSW Reference levels
No. of samples Min Avg Max No. of
samples Min Avg Max
Mic
robi
olog
ical
E. coli orgs/100mL NA 2 17 19 21 12 1 132 690
Giardia cysts/10L NA 3 <1 <1 <1 45 <1 <1 <1
Cryptosporidium oocysts/10L NA 3 <1 <1 <1 45 <1 <1 <1
Phys
ical
/ ch
emic
al
turbidity NTU <20 76 1.5 2.5 6.1 254 0.5 1.7 6.1
true colour♠ HU NA 2 4 4 4 12 3 4 7
chlorophyll - a μg/L <5 3 2.6 3.1 3.6 20 2.4 3.5 5.5
iron mg/L <1 2 0.040 0.050 0.060 12 0.040 0.105 0.250
aluminium mg/L <0.055 2 0.030 0.040 0.050 12 0.030 0.048 0.080
manganese mg/L <1.9 2 0.013 0.013 0.014 12 0.005 0.016 0.029
♠ True colour is measured at 400nm wavelength, NA= Not Applicable.
Page 15 of 81
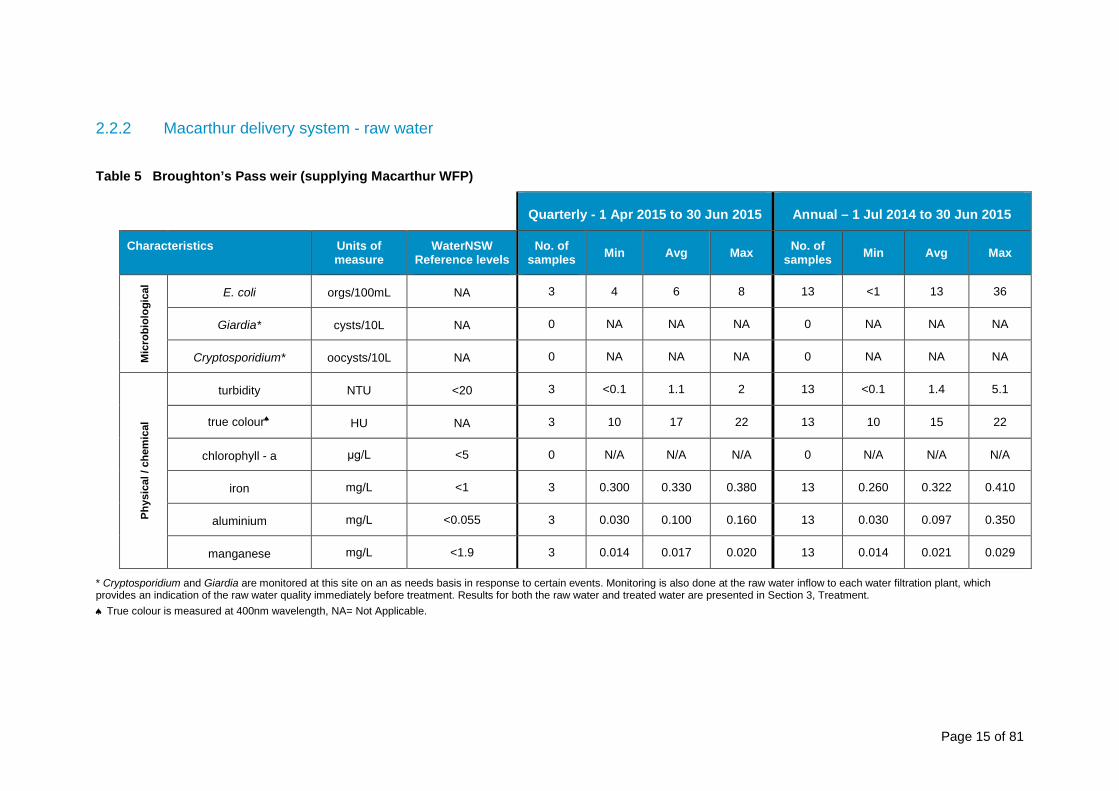
2.2.2 Macarthur delivery system - raw water
Table 5 Broughton’s Pass weir (supplying Macarthur WFP)
Quarterly - 1 Apr 2015 to 30 Jun 2015 Annual – 1 Jul 2014 to 30 Jun 2015
Characteristics Units of measure
WaterNSW Reference levels
No. of samples Min Avg Max No. of
samples Min Avg Max
Mic
robi
olog
ical
E. coli orgs/100mL NA 3 4 6 8 13 <1 13 36
Giardia* cysts/10L NA 0 NA NA NA 0 NA NA NA
Cryptosporidium* oocysts/10L NA 0 NA NA NA 0 NA NA NA
Phys
ical
/ ch
emic
al
turbidity NTU <20 3 <0.1 1.1 2 13 <0.1 1.4 5.1
true colour♠ HU NA 3 10 17 22 13 10 15 22
chlorophyll - a μg/L <5 0 N/A N/A N/A 0 N/A N/A N/A
iron mg/L <1 3 0.300 0.330 0.380 13 0.260 0.322 0.410
aluminium mg/L <0.055 3 0.030 0.100 0.160 13 0.030 0.097 0.350
manganese mg/L <1.9 3 0.014 0.017 0.020 13 0.014 0.021 0.029
* Cryptosporidium and Giardia are monitored at this site on an as needs basis in response to certain events. Monitoring is also done at the raw water inflow to each water filtration plant, which provides an indication of the raw water quality immediately before treatment. Results for both the raw water and treated water are presented in Section 3, Treatment. ♠ True colour is measured at 400nm wavelength, NA= Not Applicable.

Page 16 of 81
2.2.3 Woronora delivery system - raw water
Table 6 Lake Woronora @ Dam Wall
Quarterly - 1 Apr 2015 to 30 Jun 2015 Annual – 1 Jul 2014 to 30 Jun 2015
Characteristics Units of measure
WaterNSW Reference levels
No. of samples Min Avg Max No. of
samples Min Avg Max
Mic
robi
olog
ical
E. coli orgs/100mL NA 27 1 19 96 104 <1 6 96
Giardia* cysts/10L NA 0 NA NA NA 0 NA NA NA
Cryptosporidium* oocysts/10L NA 0 NA NA NA 0 NA NA NA
Phys
ical
/ ch
emic
al
turbidity NTU <20 932 <0.1 3.4 32.2 1395 <0.1 2.7 32.2
true colour♠ HU NA 27 11 19 35 104 7 13 35
chlorophyll - a μg/L <5 18 0.3 1.0 2.6 72 0.3 1.2 3.6
iron mg/L <1 27 0.180 0.253 0.500 104 0.170 0.288 0.620
aluminium mg/L <0.055 27 0.110 0.212 0.570 104 0.050 0.131 0.570
manganese mg/L <1.9 27 0.011 0.021 0.047 104 0.005 0.017 0.236
* Cryptosporidium and Giardia are monitored at this site on an as needs basis in response to certain events. Monitoring is also done at the raw water inflow to each water filtration plant, which provides an indication of the raw water quality immediately before treatment. Results for both the raw water and treated water are presented in Section 3, Treatment. ♠ True colour is measured at 400nm wavelength, NA= Not Applicable.
Page 17 of 81
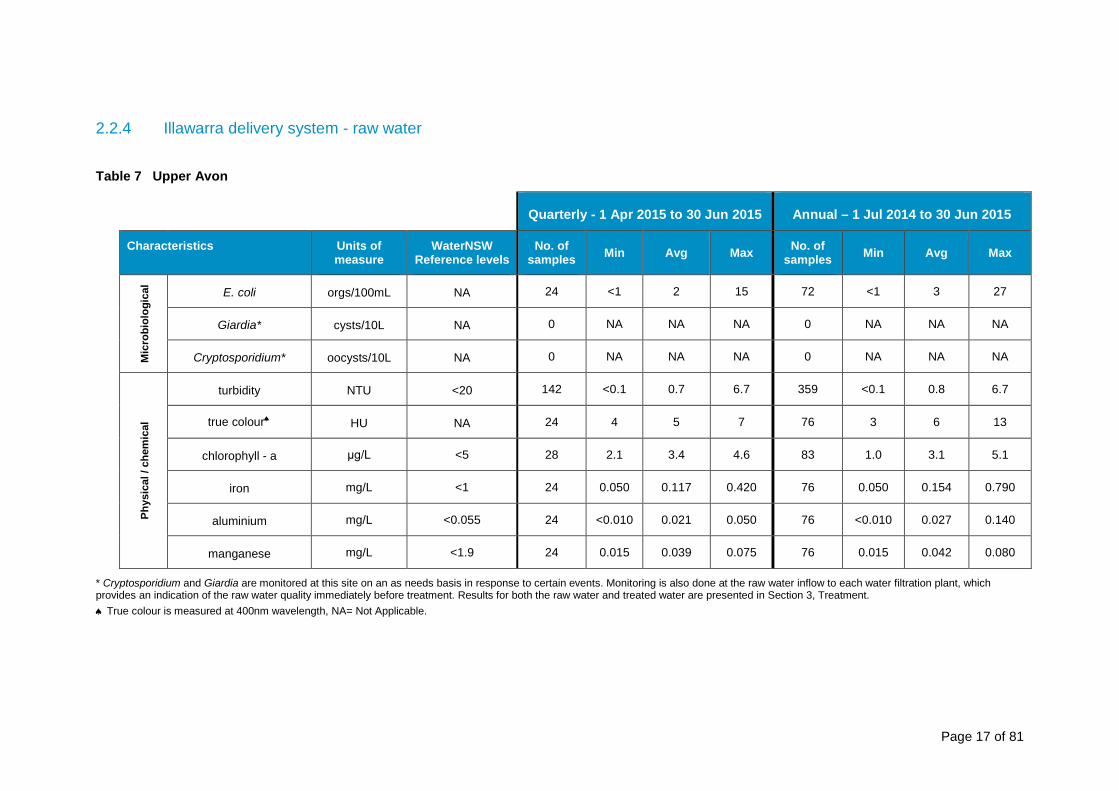
2.2.4 Illawarra delivery system - raw water
Table 7 Upper Avon
Quarterly - 1 Apr 2015 to 30 Jun 2015 Annual – 1 Jul 2014 to 30 Jun 2015
Characteristics Units of measure
WaterNSW Reference levels
No. of samples Min Avg Max No. of
samples Min Avg Max
Mic
robi
olog
ical
E. coli orgs/100mL NA 24 <1 2 15 72 <1 3 27
Giardia* cysts/10L NA 0 NA NA NA 0 NA NA NA
Cryptosporidium* oocysts/10L NA 0 NA NA NA 0 NA NA NA
Phys
ical
/ ch
emic
al
turbidity NTU <20 142 <0.1 0.7 6.7 359 <0.1 0.8 6.7
true colour♠ HU NA 24 4 5 7 76 3 6 13
chlorophyll - a μg/L <5 28 2.1 3.4 4.6 83 1.0 3.1 5.1
iron mg/L <1 24 0.050 0.117 0.420 76 0.050 0.154 0.790
aluminium mg/L <0.055 24 <0.010 0.021 0.050 76 <0.010 0.027 0.140
manganese mg/L <1.9 24 0.015 0.039 0.075 76 0.015 0.042 0.080
* Cryptosporidium and Giardia are monitored at this site on an as needs basis in response to certain events. Monitoring is also done at the raw water inflow to each water filtration plant, which provides an indication of the raw water quality immediately before treatment. Results for both the raw water and treated water are presented in Section 3, Treatment. ♠ True colour is measured at 400nm wavelength, NA= Not Applicable.

Page 18 of 81
2.2.5 North Richmond delivery system - raw water
Table 8 Nepean River
Quarterly - 1 Apr 2015 to 30 Jun 2015 Annual – 1 Jul 2014 to 30 Jun 2015
Characteristics Units of measure
WaterNSW Reference levels
No. of samples Min Avg Max No. of
samples Min Avg Max
Mic
robi
olog
ical
E. coli orgs/100mL NA 12 13 58 120 51 8 64 550
Giardia* cysts/10L NA 0 NA NA NA 0 NA NA NA
Cryptosporidium* oocysts/10L NA 0 NA NA NA 0 NA NA NA
Phys
ical
/ ch
emic
al
turbidity NTU <20 12 3.7 9.0 24.0 51 2.7 8.0 29.0
true colour♠ HU NA 12 10 18 39 51 5 13 39
chlorophyll - a μg/L <5 12 1.5 7.0 11.0 51 1.5 12.1 28.6
iron mg/L <1 12 0.322 0.658 0.946 51 0.157 0.485 0.946
aluminium mg/L <0.055 12 0.084 0.353 0.856 51 0.017 0.239 1.110
manganese mg/L <1.9 12 0.032 0.043 0.056 51 0.003 0.040 0.090
* Cryptosporidium and Giardia are monitored at this site on an as needs basis in response to certain events. Monitoring is also done at the raw water inflow to each water filtration plant, which provides an indication of the raw water quality immediately before treatment. Results for both the raw water and treated water are presented in Section 3, Treatment. ♠ True colour is measured at 400nm wavelength. NA= Not Applicable.
Page 19 of 81
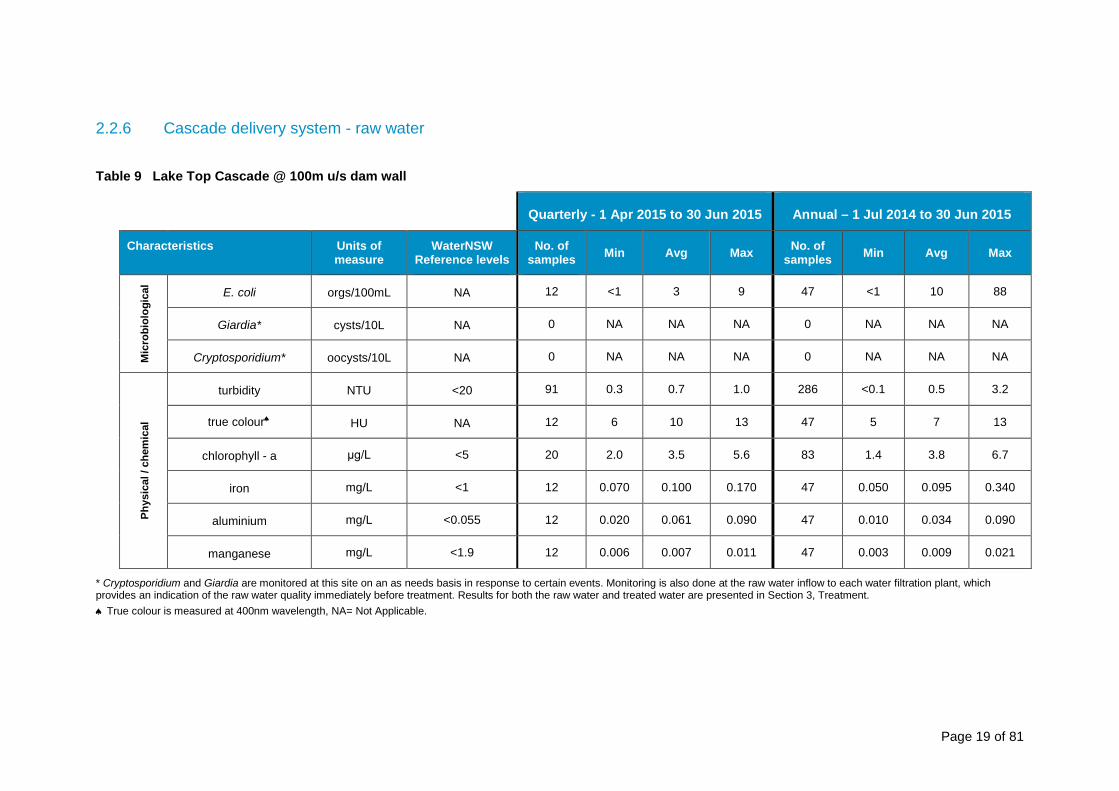
2.2.6 Cascade delivery system - raw water
Table 9 Lake Top Cascade @ 100m u/s dam wall
Quarterly - 1 Apr 2015 to 30 Jun 2015 Annual – 1 Jul 2014 to 30 Jun 2015
Characteristics Units of measure
WaterNSW Reference levels
No. of samples Min Avg Max No. of
samples Min Avg Max
Mic
robi
olog
ical
E. coli orgs/100mL NA 12 <1 3 9 47 <1 10 88
Giardia* cysts/10L NA 0 NA NA NA 0 NA NA NA
Cryptosporidium* oocysts/10L NA 0 NA NA NA 0 NA NA NA
Phys
ical
/ ch
emic
al
turbidity NTU <20 91 0.3 0.7 1.0 286 <0.1 0.5 3.2
true colour♠ HU NA 12 6 10 13 47 5 7 13
chlorophyll - a μg/L <5 20 2.0 3.5 5.6 83 1.4 3.8 6.7
iron mg/L <1 12 0.070 0.100 0.170 47 0.050 0.095 0.340
aluminium mg/L <0.055 12 0.020 0.061 0.090 47 0.010 0.034 0.090
manganese mg/L <1.9 12 0.006 0.007 0.011 47 0.003 0.009 0.021
* Cryptosporidium and Giardia are monitored at this site on an as needs basis in response to certain events. Monitoring is also done at the raw water inflow to each water filtration plant, which provides an indication of the raw water quality immediately before treatment. Results for both the raw water and treated water are presented in Section 3, Treatment. ♠ True colour is measured at 400nm wavelength, NA= Not Applicable.

Page 20 of 81
2.2.7 Nepean delivery system - raw water
Table 10 Lake Nepean
Quarterly - 1 Apr 2015 to 30 Jun 2015 Annual – 1 Jul 2014 to 30 Jun 2015
Characteristics Units of measure
WaterNSW Reference levels
No. of samples Min Avg Max No. of
samples Min Avg Max
Mic
robi
olog
ical
E. coli orgs/100mL NA 26 <1 <1 4 101 <1 1 15
Giardia* cysts/10L NA 0 NA NA NA 0 NA NA NA
Cryptosporidium* oocysts/10L NA 0 NA NA NA 0 NA NA NA
Phys
ical
/ ch
emic
al
turbidity♠ NTU <20 394 1.2 11.7 57.3 940 <0.1 6.7 57.3
true colour HU NA 26 15 19 24 101 15 20 28
chlorophyll - a μg/L <5 18 1.2 1.6 2.2 72 0.6 2.4 17.4
iron mg/L <1 26 0.340 0.385 0.470 101 0.240 0.405 0.790
aluminium mg/L <0.055 26 0.040 0.160 0.260 101 0.040 0.143 0.490
manganese mg/L <1.9 26 0.021 0.038 0.072 101 0.008 0.045 0.198
* Cryptosporidium and Giardia are monitored at this site on an as needs basis in response to certain events. Monitoring is also done at the raw water inflow to each water filtration plant, which provides an indication of the raw water quality immediately before treatment. Results for both the raw water and treated water are presented in Section 3, Treatment. ♠ True colour is measured at 400nm wavelength, NA= Not Applicable.
Page 21 of 81
2.3 Discussion of results for storages and raw water delivery systems
The results for the monitoring in the raw water storages and delivery system in Table 2 to Table 10 indicated that the water was of expected quality for supply to water filtration plants. Reporting of the details of these results can be found on the WaterNSW website.
Detention time in streams and lakes, together with artificial mixing in lakes, help to improve water quality. In-situ monitoring instruments and the ability to change supply depths in most storages facilitate selection of optimum quality raw water for treatment.
Raw water quality is maintained by WaterNSW through a combination of catchment management activities, natural in-stream/lake processes and source selection and in accordance with its Healthy Catchments Strategy which sets priorities for catchment improvement activities.
Catchment initiatives are delivered through the Healthy Catchments Program under the following broad categories:
• Rural lands
• Sewage and stormwater
• Land management
• Statutory and regulatory operations
• Catchment partnerships
Work undertaken under the program is reported annually in WaterNSW’s Annual Catchment Activities Report which can be found on the WaterNSW website.
Page 22 of 81
3 Treatment Sydney Water has nine water filtration plants that supply 13 water delivery systems.
With dam levels greater than 80 per cent, the operating rules established in the NSW Government’s 2010 Metropolitan Water Plan requires the desalination plant be turned off. The desalination plant will be operated when dam levels fall to 70%.
3.1 Key parameters Sydney Water monitors the quality of the raw water entering filtration plants to inform treatment requirements and verifies the quality of treated water entering the customer supply system for a range of water quality parameters. The information gathered under the ‘operational’ monitoring program assists in optimising water treatment processes.
Most analysis is conducted by laboratories that are accredited by the National Association of Testing Authorities, Australia (NATA). In some cases, additional operational monitoring is conducted at the plant or by on-line instrumentation.
Results for the key parameters from this analysis are presented for each filtration plant in Table 11 to Table 28 below. WaterNSW also monitors water quality for the raw water entering eight of the water filtration plants on a monthly basis. These results are not included below but can be found in WaterNSW’s Annual Water Quality Monitoring Report. The raw water used to supply the North Richmond filtration plant is monitored by Sydney Water.
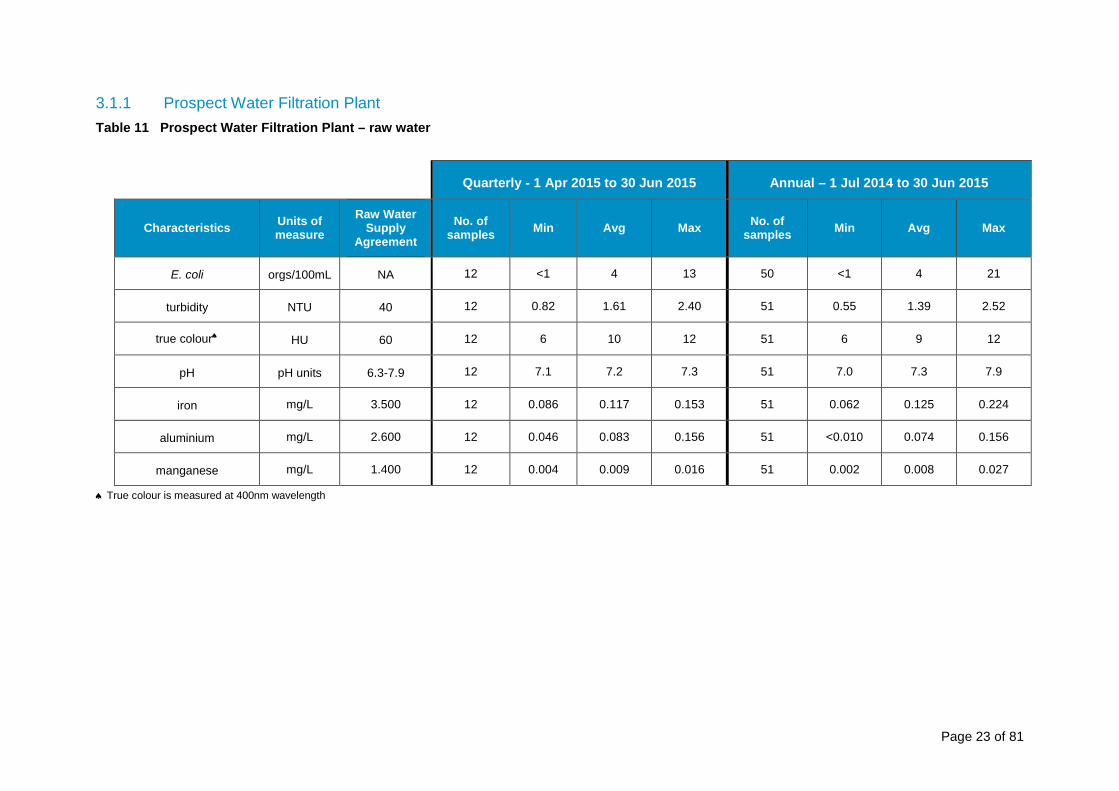
Raw water quality for the parameters reported in these tables is assessed against site-specific quality standards that have been developed based on historical water quality from the catchments and the capacity of each plant to treat water to meet the drinking water guidelines.
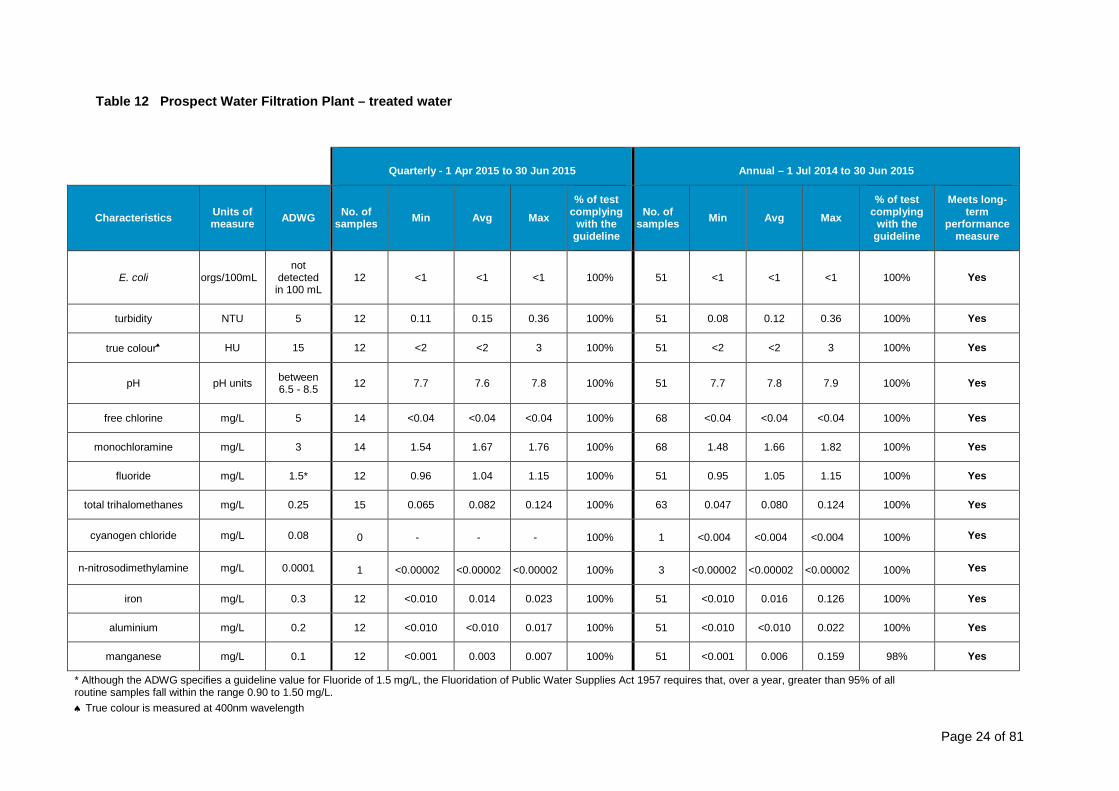
Treated water is assessed against the ADWG guideline values. In the tables below, the ADWG health guideline value is quoted for E. coli, free chlorine, monochloramine, fluoride, total trihalomethanes and NDMA. The more stringent ADWG aesthetic guidelines are quoted for turbidity, true colour, pH, iron, aluminium and manganese. With the exception of pH which has a guideline range, the guideline levels below are the concentration that should not be exceeded.
Page 23 of 81
3.1.1 Prospect Water Filtration Plant Table 11 Prospect Water Filtration Plant – raw water
Quarterly - 1 Apr 2015 to 30 Jun 2015 Annual – 1 Jul 2014 to 30 Jun 2015
Characteristics Units of measure
Raw Water Supply
Agreement No. of
samples Min Avg Max No. of samples Min Avg Max
E. coli orgs/100mL NA 12 <1 4 13 50 <1 4 21
turbidity NTU 40 12 0.82 1.61 2.40 51 0.55 1.39 2.52
true colour♠ HU 60 12 6 10 12 51 6 9 12
pH pH units 6.3-7.9 12 7.1 7.2 7.3 51 7.0 7.3 7.9
iron mg/L 3.500 12 0.086 0.117 0.153 51 0.062 0.125 0.224
aluminium mg/L 2.600 12 0.046 0.083 0.156 51 <0.010 0.074 0.156
manganese mg/L 1.400 12 0.004 0.009 0.016 51 0.002 0.008 0.027
♠ True colour is measured at 400nm wavelength
Page 24 of 81
Table 12 Prospect Water Filtration Plant – treated water
Quarterly - 1 Apr 2015 to 30 Jun 2015 Annual – 1 Jul 2014 to 30 Jun 2015
Characteristics Units of measure ADWG No. of
samples Min Avg Max % of test
complying with the
guideline
No. of samples Min Avg Max
% of test complying
with the guideline
Meets long-term
performance measure
E. coli orgs/100mL not
detected in 100 mL
12 <1 <1 <1 100% 51 <1 <1 <1 100% Yes
turbidity NTU 5 12 0.11 0.15 0.36 100% 51 0.08 0.12 0.36 100% Yes
true colour♠ HU 15 12 <2 <2 3 100% 51 <2 <2 3 100% Yes
pH pH units between 6.5 - 8.5 12 7.7 7.6 7.8 100% 51 7.7 7.8 7.9 100% Yes
free chlorine mg/L 5 14 <0.04 <0.04 <0.04 100% 68 <0.04 <0.04 <0.04 100% Yes
monochloramine mg/L 3 14 1.54 1.67 1.76 100% 68 1.48 1.66 1.82 100% Yes
fluoride mg/L 1.5* 12 0.96 1.04 1.15 100% 51 0.95 1.05 1.15 100% Yes
total trihalomethanes mg/L 0.25 15 0.065 0.082 0.124 100% 63 0.047 0.080 0.124 100% Yes
cyanogen chloride mg/L 0.08 0 - - - 100% 1 <0.004 <0.004 <0.004 100% Yes
n-nitrosodimethylamine mg/L 0.0001 1 <0.00002 <0.00002 <0.00002 100% 3 <0.00002 <0.00002 <0.00002 100% Yes
iron mg/L 0.3 12 <0.010 0.014 0.023 100% 51 <0.010 0.016 0.126 100% Yes
aluminium mg/L 0.2 12 <0.010 <0.010 0.017 100% 51 <0.010 <0.010 0.022 100% Yes
manganese mg/L 0.1 12 <0.001 0.003 0.007 100% 51 <0.001 0.006 0.159 98% Yes
* Although the ADWG specifies a guideline value for Fluoride of 1.5 mg/L, the Fluoridation of Public Water Supplies Act 1957 requires that, over a year, greater than 95% of all routine samples fall within the range 0.90 to 1.50 mg/L. ♠ True colour is measured at 400nm wavelength
Page 25 of 81
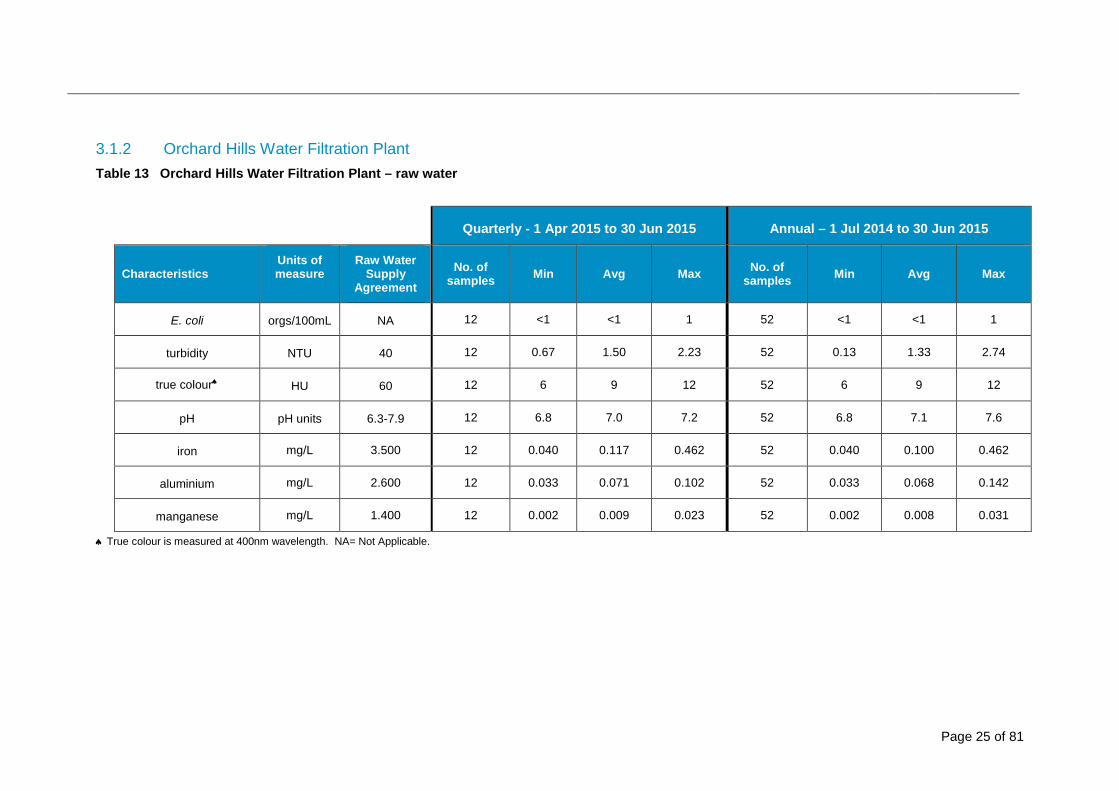
3.1.2 Orchard Hills Water Filtration Plant Table 13 Orchard Hills Water Filtration Plant – raw water
Quarterly - 1 Apr 2015 to 30 Jun 2015 Annual – 1 Jul 2014 to 30 Jun 2015
Characteristics Units of measure
Raw Water Supply
Agreement No. of
samples Min Avg Max No. of samples Min Avg Max
E. coli orgs/100mL NA 12 <1 <1 1 52 <1 <1 1
turbidity NTU 40 12 0.67 1.50 2.23 52 0.13 1.33 2.74
true colour♠ HU 60 12 6 9 12 52 6 9 12
pH pH units 6.3-7.9 12 6.8 7.0 7.2 52 6.8 7.1 7.6
iron mg/L 3.500 12 0.040 0.117 0.462 52 0.040 0.100 0.462
aluminium mg/L 2.600 12 0.033 0.071 0.102 52 0.033 0.068 0.142
manganese mg/L 1.400 12 0.002 0.009 0.023 52 0.002 0.008 0.031
♠ True colour is measured at 400nm wavelength. NA= Not Applicable.
Page 26 of 81
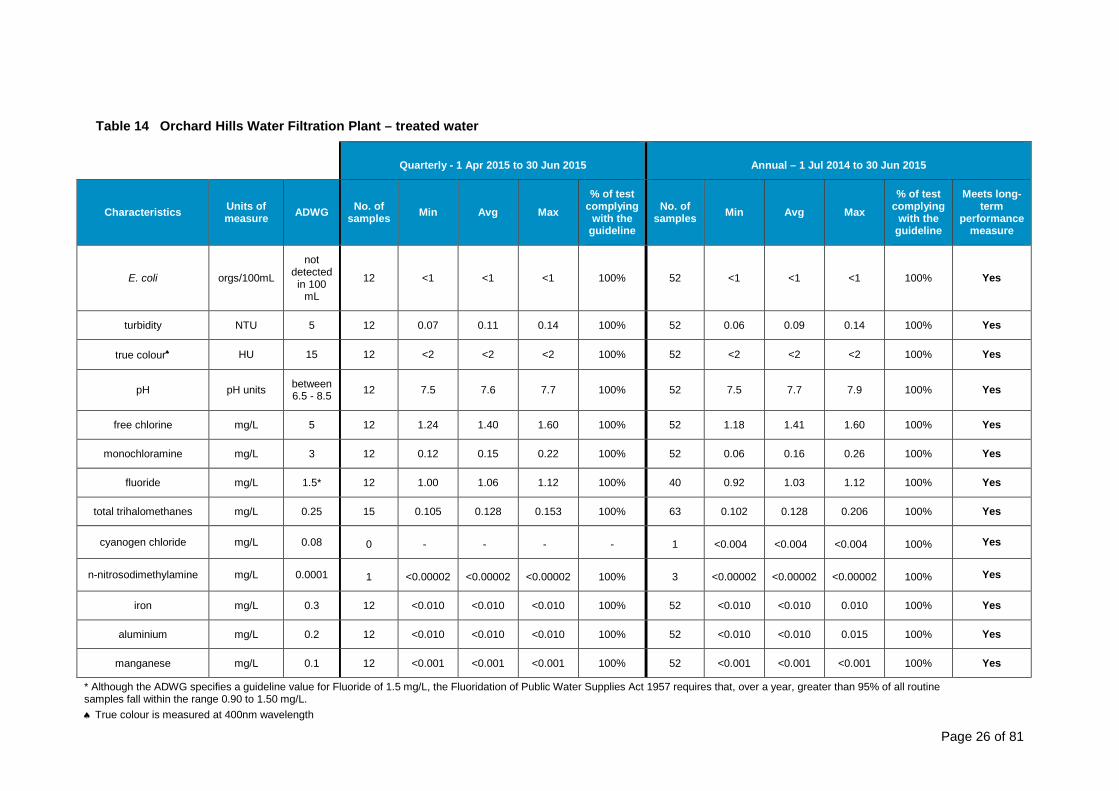
Table 14 Orchard Hills Water Filtration Plant – treated water
Quarterly - 1 Apr 2015 to 30 Jun 2015 Annual – 1 Jul 2014 to 30 Jun 2015
Characteristics Units of measure ADWG No. of
samples Min Avg Max % of test
complying with the
guideline
No. of samples Min Avg Max
% of test complying
with the guideline
Meets long-term
performance measure
E. coli orgs/100mL
not detected in 100
mL
12 <1 <1 <1 100% 52 <1 <1 <1 100% Yes
turbidity NTU 5 12 0.07 0.11 0.14 100% 52 0.06 0.09 0.14 100% Yes
true colour♠ HU 15 12 <2 <2 <2 100% 52 <2 <2 <2 100% Yes
pH pH units between 6.5 - 8.5 12 7.5 7.6 7.7 100% 52 7.5 7.7 7.9 100% Yes
free chlorine mg/L 5 12 1.24 1.40 1.60 100% 52 1.18 1.41 1.60 100% Yes
monochloramine mg/L 3 12 0.12 0.15 0.22 100% 52 0.06 0.16 0.26 100% Yes
fluoride mg/L 1.5* 12 1.00 1.06 1.12 100% 40 0.92 1.03 1.12 100% Yes
total trihalomethanes mg/L 0.25 15 0.105 0.128 0.153 100% 63 0.102 0.128 0.206 100% Yes
cyanogen chloride mg/L 0.08 0 - - - - 1 <0.004 <0.004 <0.004 100% Yes
n-nitrosodimethylamine mg/L 0.0001 1 <0.00002 <0.00002 <0.00002 100% 3 <0.00002 <0.00002 <0.00002 100% Yes
iron mg/L 0.3 12 <0.010 <0.010 <0.010 100% 52 <0.010 <0.010 0.010 100% Yes
aluminium mg/L 0.2 12 <0.010 <0.010 <0.010 100% 52 <0.010 <0.010 0.015 100% Yes
manganese mg/L 0.1 12 <0.001 <0.001 <0.001 100% 52 <0.001 <0.001 <0.001 100% Yes
* Although the ADWG specifies a guideline value for Fluoride of 1.5 mg/L, the Fluoridation of Public Water Supplies Act 1957 requires that, over a year, greater than 95% of all routine samples fall within the range 0.90 to 1.50 mg/L. ♠ True colour is measured at 400nm wavelength

Page 27 of 81
3.1.3 Macarthur Water Filtration Plant Table 15 Macarthur Water Filtration Plant – raw water
Quarterly - 1 Apr 2015 to 30 Jun 2015 Annual – 1 Jul 2014 to 30 Jun 2015
Characteristics Units of measure
Raw Water Supply
Agreement No. of
samples Min Avg Max No. of samples Min Avg Max
E. coli orgs/100mL NA 13 1 25 210 52 <1 17 210
turbidity NTU 10 / 60* 13 0.75 2.43 4.88 52 0.75 2.02 4.97
true colour♠ HU 40 13 9 17 27 52 9 14 27
pH pH units 5.7-7.7 13 6.4 6.9 7.8 52 6.4 7.0 7.8
iron mg/L 0.600 / 1.300* 13 0.302 0.449 0.760 52 0.201 0.421 0.760
aluminium mg/L 0.400 / 0.950* 13 0.026 0.171 0.432 52 0.026 0.125 0.432
manganese mg/L 0.200 / 0.350* 13 0.018 0.045 0.095 52 0.011 0.054 0.197
* Raw Water Supply Agreement (RWSA) standards for these parameters for this plant vary in four steps according to the water demand of the plant. Low and high values are shown ♠ True colour is measured at 400nm wavelength. NA= Not Applicable.
Page 28 of 81
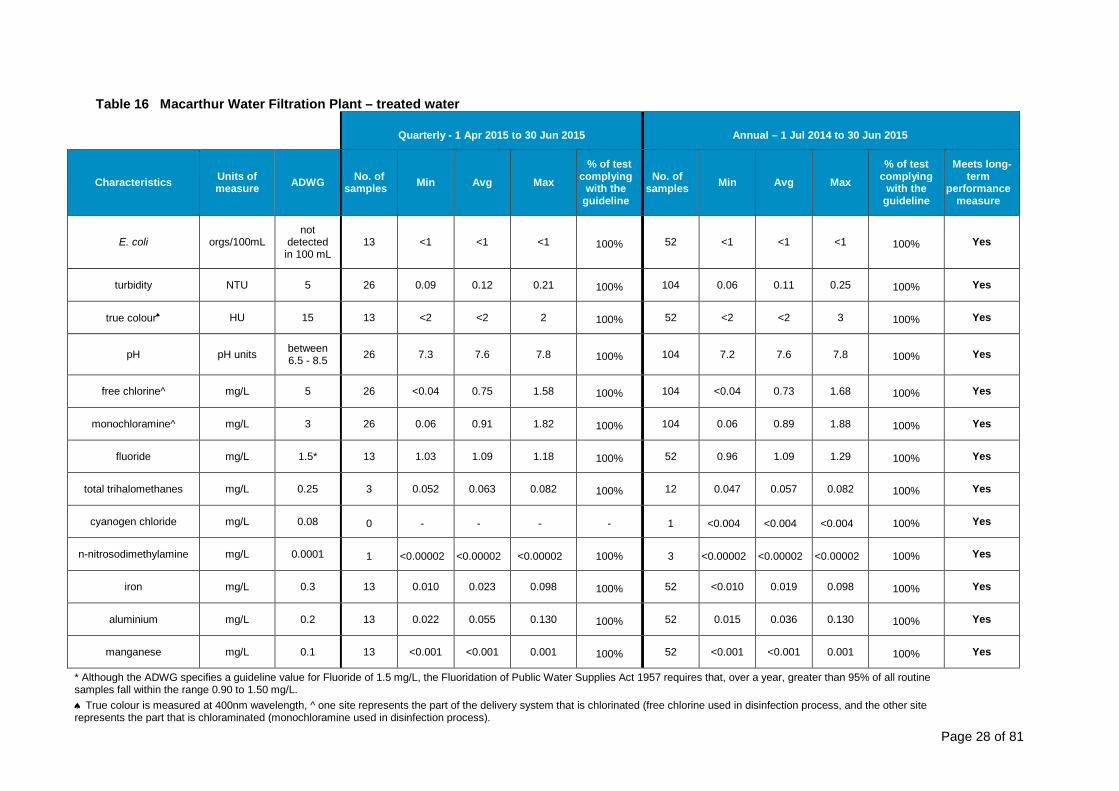
Table 16 Macarthur Water Filtration Plant – treated water
Quarterly - 1 Apr 2015 to 30 Jun 2015 Annual – 1 Jul 2014 to 30 Jun 2015
Characteristics Units of measure ADWG No. of
samples Min Avg Max % of test
complying with the
guideline
No. of samples Min Avg Max
% of test complying
with the guideline
Meets long-term
performance measure
E. coli orgs/100mL not
detected in 100 mL
13 <1 <1 <1 100% 52 <1 <1 <1 100% Yes
turbidity NTU 5 26 0.09 0.12 0.21 100% 104 0.06 0.11 0.25 100% Yes
true colour♠ HU 15 13 <2 <2 2 100% 52 <2 <2 3 100% Yes
pH pH units between 6.5 - 8.5 26 7.3 7.6 7.8 100% 104 7.2 7.6 7.8 100% Yes
free chlorine^ mg/L 5 26 <0.04 0.75 1.58 100% 104 <0.04 0.73 1.68 100% Yes
monochloramine^ mg/L 3 26 0.06 0.91 1.82 100% 104 0.06 0.89 1.88 100% Yes
fluoride mg/L 1.5* 13 1.03 1.09 1.18 100% 52 0.96 1.09 1.29 100% Yes
total trihalomethanes mg/L 0.25 3 0.052 0.063 0.082 100% 12 0.047 0.057 0.082 100% Yes
cyanogen chloride mg/L 0.08 0 - - - - 1 <0.004 <0.004 <0.004 100% Yes
n-nitrosodimethylamine mg/L 0.0001 1 <0.00002 <0.00002 <0.00002 100% 3 <0.00002 <0.00002 <0.00002 100% Yes
iron mg/L 0.3 13 0.010 0.023 0.098 100% 52 <0.010 0.019 0.098 100% Yes
aluminium mg/L 0.2 13 0.022 0.055 0.130 100% 52 0.015 0.036 0.130 100% Yes
manganese mg/L 0.1 13 <0.001 <0.001 0.001 100% 52 <0.001 <0.001 0.001 100% Yes
* Although the ADWG specifies a guideline value for Fluoride of 1.5 mg/L, the Fluoridation of Public Water Supplies Act 1957 requires that, over a year, greater than 95% of all routine samples fall within the range 0.90 to 1.50 mg/L. ♠ True colour is measured at 400nm wavelength, ^ one site represents the part of the delivery system that is chlorinated (free chlorine used in disinfection process, and the other site represents the part that is chloraminated (monochloramine used in disinfection process).

Page 29 of 81
3.1.4 Woronora Water Filtration Plant Table 17 Woronora Water Filtration Plant – raw water
Quarterly - 1 Apr 2015 to 30 Jun 2015 Annual – 1 Jul 2014 to 30 Jun 2015
Characteristics Units of measure
Raw Water Supply
Agreement No. of
samples Min Avg Max No. of samples Min Avg Max
E. coli orgs/100mL NA 12 <1 7 50 51 <1 3 50
turbidity NTU 10 12 0.50 1.51 2.56 51 0.11 0.98 2.56
true colour♠ HU 70 12 7 14 20 51 7 11 20
pH pH units 5.1-7.5 12 6.3 6.6 6.8 51 6.3 6.7 8.4
iron mg/L 1.000 12 0.190 0.234 0.270 51 0.190 0.303 0.396
aluminium mg/L 0.400 12 0.056 0.172 0.261 51 0.056 0.123 0.261
manganese mg/L 0.100 12 0.011 0.016 0.022 51 0.009 0.012 0.022
♠ True colour is measured at 400nm wavelength. NA= Not Applicable.

Page 30 of 81
Table 18 Woronora Water Filtration Plant – treated water
Quarterly - 1 Apr 2015 to 30 Jun 2015 Annual – 1 Jul 2014 to 30 Jun 2015
Characteristics Units of measur
e ADWG No. of
samples Min Avg Max % of test
complying with the
guideline
No. of samples Min Avg Max
% of test complying
with the guideline
Meets long-term
performance measure
E. coli orgs/100mL
not detected in 100 mL 12 <1 <1 <1 100% 51 <1 <1 <1 100% Yes
turbidity NTU 5 12 0.09 0.13 0.24 100% 51 0.06 0.10 0.24 100% Yes
true colour♠ HU 15 12 <2 <2 2 100% 51 <2 <2 2 100% Yes
pH pH units between 6.5 - 8.5 12 7.5 7.6 7.7 100% 51 7.4 7.7 7.8 100% Yes
free chlorine mg/L 5 12 <0.04 <0.04 <0.04 100% 51 <0.04 <0.04 <0.04 100% Yes
monochloramine mg/L 3 12 1.93 2.02 2.18 100% 51 1.74 1.99 2.18 100% Yes
fluoride mg/L 1.5* 12 1.00 1.04 1.08 100% 51 0.96 1.03 1.11 100% Yes
total trihalomethanes mg/L 0.25 3 0.049 0.058 0.070 100% 12 0.039 0.051 0.070 100% Yes
cyanogen chloride mg/L 0.08 0 - - - - 1 <0.004 <0.004 <0.004 100% Yes
n-nitrosodimethylamine mg/L 0.0001 1 <0.00002 <0.00002 <0.00002 100% 3 <0.00002 <0.00002 <0.00002 100% Yes
iron mg/L 0.3 12 <0.010 <0.010 0.014 100% 51 <0.010 <0.010 0.014 100% Yes
aluminium mg/L 0.2 12 0.025 0.060 0.083 100% 51 0.017 0.035 0.083 100% Yes
manganese mg/L 0.1 12 <0.001 <0.001 0.002 100% 51 <0.001 <0.001 0.002 100% Yes
* Although the ADWG specifies a guideline value for Fluoride of 1.5 mg/L, the Fluoridation of Public Water Supplies Act 1957 requires that, over a year, greater than 95% of all routine samples fall within the range 0.90 to 1.50 mg/L. ♠True colour is measured at 400nm wavelength

Page 31 of 81
3.1.5 Illawarra Water Filtration Plant Table 19 Illawarra Water Filtration Plant – raw water
Quarterly - 1 Apr 2015 to 30 Jun 2015 Annual – 1 Jul 2014 to 30 Jun 2015
Characteristics Units of measure
Raw Water Supply
Agreement No. of
samples Min Avg Max No. of samples Min Avg Max
E. coli orgs/100mL NA 14 <1 2 9 52 <1 <1 9
turbidity NTU 10 14 0.49 0.91 2.20 52 0.14 0.95 2.43
true colour♠ HU 50 14 3 5 8 52 3 5 8
pH pH units 6.2-7.2 14 6.6 6.7 6.9 52 6.4 6.7 9.0
iron mg/L 1.100 14 0.054 0.139 0.421 52 0.054 0.155 0.421
aluminium mg/L 1.400 14 0.010 0.020 0.037 52 <0.010 0.023 0.054
manganese mg/L 0.400 14 0.013 0.040 0.152 52 0.011 0.043 0.205
♠ True colour is measured at 400nm wavelength. NA= Not Applicable.

Page 32 of 81
Table 20 Illawarra Water Filtration Plant – treated water
Quarterly - 1 Apr 2015 to 30 Jun 2015 Annual – 1 Jul 2014 to 30 Jun 2015
Characteristics Units of measure ADWG No. of
samples Min Avg Max % of test
complying with the
guideline
No. of samples Min Avg Max
% of test complying
with the guideline
Meets long-term
performance measure
E. coli orgs/100mL not
detected in 100 mL
14 <1 <1 <1 100% 52 <1 <1 <1 100% Yes
turbidity NTU 5 14 0.10 0.13 0.19 100% 52 0.07 0.11 0.19 100% Yes
true colour♠ HU 15 14 <2 <2 <2 100% 52 <2 <2 <2 100% Yes
pH pH units between 6.5 - 8.5 14 7.4 7.5 7.7 100% 52 7.4 7.5 7.7 100% Yes
free chlorine mg/L 5 14 1.26 1.37 1.44 100% 51 1.12 1.34 1.52 100% Yes
monochloramine mg/L 3 14 0.06 0.07 0.12 100% 51 0.04 0.08 0.15 100% Yes
fluoride mg/L 1.5* 14 0.98 1.04 1.09 100% 52 0.96 1.03 1.13 100% Yes
total trihalomethanes mg/L 0.25 3 0.054 0.060 0.066 100% 12 0.053 0.063 0.081 100% Yes
cyanogen chloride mg/L 0.08 0 - - - - 1 <0.004 <0.004 <0.004 100% Yes
n-nitrosodimethylamine mg/L 0.0001 1 <0.00002 <0.00002 <0.00002 100% 3 <0.00002 <0.00002 <0.00002 100% Yes
iron mg/L 0.3 14 <0.010 <0.010 0.016 100% 52 <0.010 <0.010 0.016 100% Yes
aluminium mg/L 0.2 14 0.015 0.024 0.039 100% 52 0.013 0.021 0.039 100% Yes
manganese mg/L 0.1 14 <0.001 0.002 0.009 100% 52 <0.001 0.002 0.009 100% Yes
* Although the ADWG specifies a guideline value for Fluoride of 1.5 mg/L, the Fluoridation of Public Water Supplies Act 1957 requires that, over a year, greater than 95% of all routine samples fall within the range 0.90 to 1.50 mg/L. ♠ True colour is measured at 400nm wavelength

Page 33 of 81
3.1.6 North Richmond Water Filtration Plant Table 21 North Richmond Water Filtration Plant – raw water
Quarterly - 1 Apr 2015 to 30 Jun 2015 Annual – 1 Jul 2014 to 30 Jun 2015
Characteristics Units of measure
No. of samples Min Avg Max No. of
samples Min Avg Max
E. coli orgs/100mL 13 13 188 1900 52 <1 69 1900
turbidity NTU 13 3.08 15.87 60.00 52 1.64 8.84 60.00
true colour♠ HU 13 9 20 44 52 <2 13 44
pH pH units 13 6.7 7.1 7.4 52 6.7 7.3 8.8
iron mg/L 13 0.357 1.364 7.340 52 0.196 0.916 7.340
aluminium mg/L 13 0.081 0.850 4.250 52 0.058 0.379 4.250
manganese mg/L 13 0.028 0.103 0.784 52 0.019 0.063 0.784
♠ True colour is measured at 400nm wavelength

Page 34 of 81
Table 22 North Richmond Water Filtration Plant – treated water
Quarterly - 1 Apr 2015 to 30 Jun 2015 Annual – 1 Jul 2014 to 30 Jun 2015
Characteristics Units of measure ADWG No. of
samples Min Avg Max % of test
complying with the
guideline
No. of samples Min Avg Max
% of test complying
with the guideline
Meets long-term
performance measure
E. coli orgs/100mL not
detected in 100 mL
13 <1 <1 <1 100% 52 <1 <1 <1 100% Yes
turbidity NTU 5 13 0.08 0.11 0.14 100% 52 0.05 0.09 0.14 100% Yes
true colour♠ HU 15 13 <2 <2 <2 100% 52 <2 <2 <2 100% Yes
pH pH units between 6.5 - 8.5 13 7.0 7.4 7.5 100% 52 7.0 7.4 7.8 100% Yes
free chlorine mg/L 5 13 1.04 1.13 1.24 100% 52 0.82 1.08 1.42 100% Yes
monochloramine mg/L 3 13 0.04 0.06 0.08 100% 52 <0.04 0.07 0.1 100% Yes
fluoride mg/L 1.5* 13 0.98 1.06 1.11 100% 52 0.98 1.07 1.18 100% Yes
total trihalomethanes mg/L 0.25 3 0.035 0.037 0.038 100% 12 0.028 0.046 0.071 100% Yes
cyanogen chloride mg/L 0.08 0 - - - - 1 <0.004 <0.004 <0.004 100% Yes
n-nitrosodimethylamine mg/L 0.0001 1 <0.00002 <0.00002 <0.00002 100% 3 <0.00002 <0.00002 <0.00002 100% Yes
iron mg/L 0.3 13 <0.010 <0.010 <0.010 100% 52 <0.010 <0.010 <0.010 100% Yes
aluminium mg/L 0.2 13 <0.010 <0.010 <0.010 100% 52 <0.010 <0.010 0.039 100% Yes
manganese mg/L 0.1 13 <0.001 <0.001 0.002 100% 52 <0.001 <0.001 0.002 100% Yes
* Although the ADWG specifies a guideline value for Fluoride of 1.5 mg/L, the Fluoridation of Public Water Supplies Act 1957 requires that, over a year, greater than 95% of all routine samples fall within the range 0.90 to 1.50 mg/L. ♠ True colour is measured at 400nm wavelength

Page 35 of 81
3.1.7 Cascade Water Filtration Plant Table 23 Cascade Water Filtration Plant – raw water
Quarterly - 1 Apr 2015 to 30 Jun 2015 Annual – 1 Jul 2014 to 30 Jun 2015
Characteristics Units of measure
Raw Water Supply
Agreement No. of
samples Min Avg Max No. of samples Min Avg Max
E. coli orgs/100mL NA 12 <1 4 11 51 <1 9 66
turbidity NTU 15 12 0.66 1.09 1.51 51 0.54 0.85 2.88
true colour♠ HU 60 12 6 10 13 51 3 7 13
pH pH units 6.0-7.9 12 7.0 7.3 7.5 51 7.0 7.4 7.7
iron mg/L 3.000 12 0.093 0.109 0.136 51 0.051 0.093 0.138
aluminium mg/L 0.200 12 0.019 0.062 0.094 51 0.011 0.033 0.094
manganese mg/L 0.300 12 0.006 0.007 0.009 51 0.004 0.009 0.018
♠ True colour is measured at 400nm wavelength. NA= Not Applicable.
Page 36 of 81
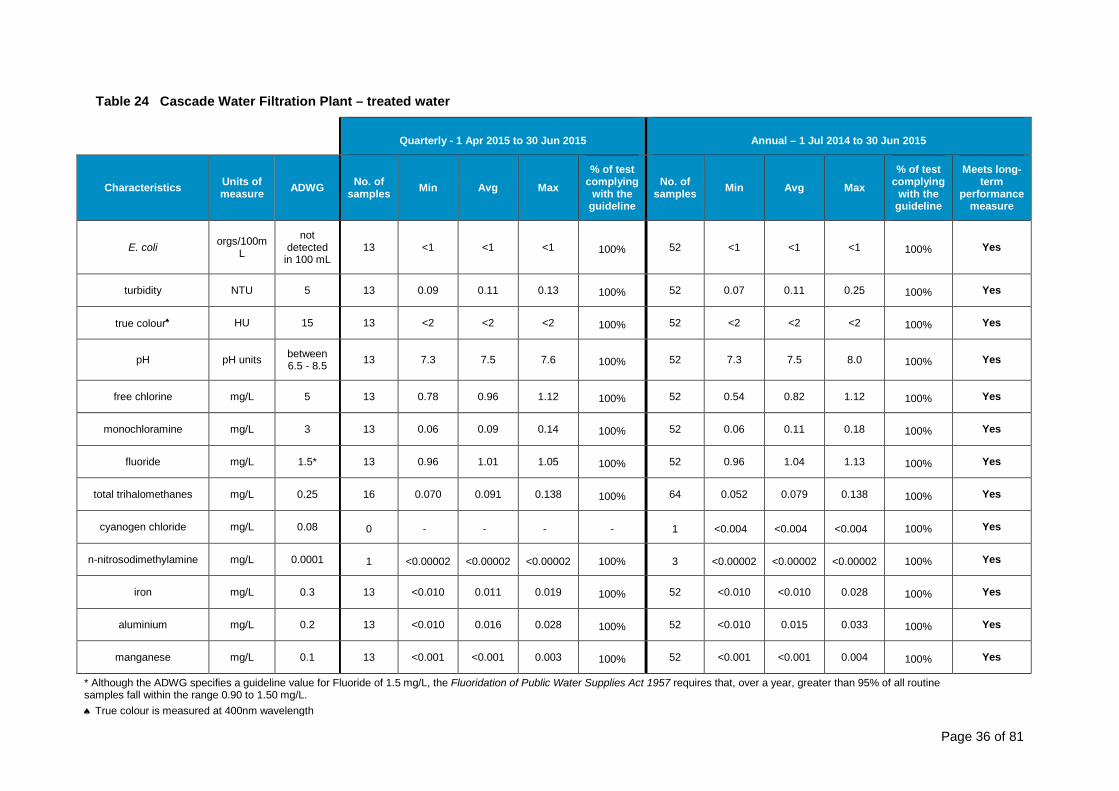
Table 24 Cascade Water Filtration Plant – treated water
Quarterly - 1 Apr 2015 to 30 Jun 2015 Annual – 1 Jul 2014 to 30 Jun 2015
Characteristics Units of measure ADWG No. of
samples Min Avg Max % of test
complying with the
guideline
No. of samples Min Avg Max
% of test complying
with the guideline
Meets long-term
performance measure
E. coli orgs/100mL
not detected
in 100 mL 13 <1 <1 <1 100% 52 <1 <1 <1 100% Yes
turbidity NTU 5 13 0.09 0.11 0.13 100% 52 0.07 0.11 0.25 100% Yes
true colour♠ HU 15 13 <2 <2 <2 100% 52 <2 <2 <2 100% Yes
pH pH units between 6.5 - 8.5 13 7.3 7.5 7.6 100% 52 7.3 7.5 8.0 100% Yes
free chlorine mg/L 5 13 0.78 0.96 1.12 100% 52 0.54 0.82 1.12 100% Yes
monochloramine mg/L 3 13 0.06 0.09 0.14 100% 52 0.06 0.11 0.18 100% Yes
fluoride mg/L 1.5* 13 0.96 1.01 1.05 100% 52 0.96 1.04 1.13 100% Yes
total trihalomethanes mg/L 0.25 16 0.070 0.091 0.138 100% 64 0.052 0.079 0.138 100% Yes
cyanogen chloride mg/L 0.08 0 - - - - 1 <0.004 <0.004 <0.004 100% Yes
n-nitrosodimethylamine mg/L 0.0001 1 <0.00002 <0.00002 <0.00002 100% 3 <0.00002 <0.00002 <0.00002 100% Yes
iron mg/L 0.3 13 <0.010 0.011 0.019 100% 52 <0.010 <0.010 0.028 100% Yes
aluminium mg/L 0.2 13 <0.010 0.016 0.028 100% 52 <0.010 0.015 0.033 100% Yes
manganese mg/L 0.1 13 <0.001 <0.001 0.003 100% 52 <0.001 <0.001 0.004 100% Yes
* Although the ADWG specifies a guideline value for Fluoride of 1.5 mg/L, the Fluoridation of Public Water Supplies Act 1957 requires that, over a year, greater than 95% of all routine samples fall within the range 0.90 to 1.50 mg/L. ♠ True colour is measured at 400nm wavelength

Page 37 of 81
3.1.8 Nepean Water Filtration Plant Table 25 Nepean Water Filtration Plant – raw water
Quarterly - 1 Apr 2015 to 30 Jun 2015 Annual – 1 Jul 2014 to 30 Jun 2015
Characteristics Units of measure
Raw Water Supply
Agreement No. of
samples Min Avg Max No. of samples Min Avg Max
E. coli orgs/100mL NA 12 <1 6 41 52 <1 3 43
turbidity NTU 150 12 1.04 3.03 7.72 52 0.88 2.10 7.72
true colour♠ HU 60 12 13 19 26 52 4 18 26
pH pH units 4.8-7.7 12 6.6 6.8 6.9 52 6.5 6.8 7.1
iron mg/L 5.000 12 0.354 0.469 0.704 52 0.255 0.472 0.806
aluminium mg/L 1.000 12 0.052 0.230 0.473 52 0.052 0.180 0.554
manganese mg/L 1.500 12 0.018 0.034 0.052 52 0.010 0.044 0.090
♠ True colour is measured at 400nm wavelength. NA= Not Applicable.
Page 38 of 81
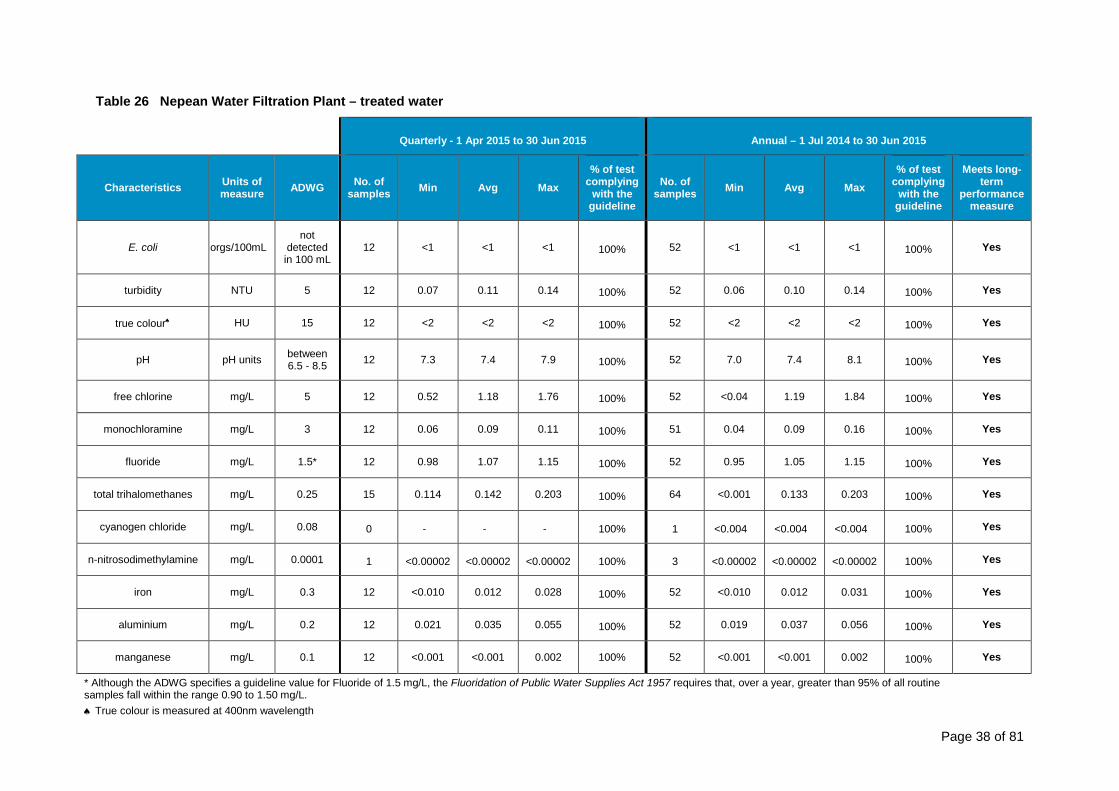
Table 26 Nepean Water Filtration Plant – treated water
Quarterly - 1 Apr 2015 to 30 Jun 2015 Annual – 1 Jul 2014 to 30 Jun 2015
Characteristics Units of measure ADWG No. of
samples Min Avg Max % of test
complying with the
guideline
No. of samples Min Avg Max
% of test complying
with the guideline
Meets long-term
performance measure
E. coli orgs/100mL not
detected in 100 mL
12 <1 <1 <1 100% 52 <1 <1 <1 100% Yes
turbidity NTU 5 12 0.07 0.11 0.14 100% 52 0.06 0.10 0.14 100% Yes
true colour♠ HU 15 12 <2 <2 <2 100% 52 <2 <2 <2 100% Yes
pH pH units between 6.5 - 8.5 12 7.3 7.4 7.9 100% 52 7.0 7.4 8.1 100% Yes
free chlorine mg/L 5 12 0.52 1.18 1.76 100% 52 <0.04 1.19 1.84 100% Yes
monochloramine mg/L 3 12 0.06 0.09 0.11 100% 51 0.04 0.09 0.16 100% Yes
fluoride mg/L 1.5* 12 0.98 1.07 1.15 100% 52 0.95 1.05 1.15 100% Yes
total trihalomethanes mg/L 0.25 15 0.114 0.142 0.203 100% 64 <0.001 0.133 0.203 100% Yes
cyanogen chloride mg/L 0.08 0 - - - 100% 1 <0.004 <0.004 <0.004 100% Yes
n-nitrosodimethylamine mg/L 0.0001 1 <0.00002 <0.00002 <0.00002 100% 3 <0.00002 <0.00002 <0.00002 100% Yes
iron mg/L 0.3 12 <0.010 0.012 0.028 100% 52 <0.010 0.012 0.031 100% Yes
aluminium mg/L 0.2 12 0.021 0.035 0.055 100% 52 0.019 0.037 0.056 100% Yes
manganese mg/L 0.1 12 <0.001 <0.001 0.002 100% 52 <0.001 <0.001 0.002 100% Yes
* Although the ADWG specifies a guideline value for Fluoride of 1.5 mg/L, the Fluoridation of Public Water Supplies Act 1957 requires that, over a year, greater than 95% of all routine samples fall within the range 0.90 to 1.50 mg/L. ♠ True colour is measured at 400nm wavelength
Page 39 of 81
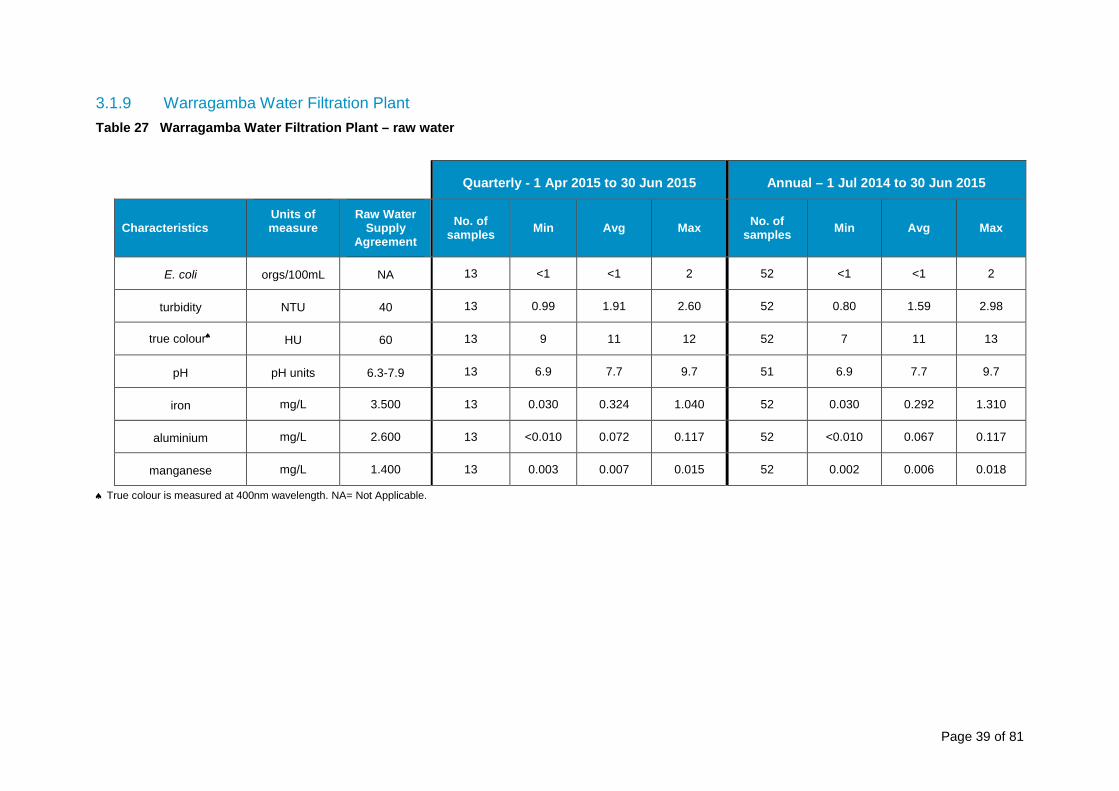
3.1.9 Warragamba Water Filtration Plant Table 27 Warragamba Water Filtration Plant – raw water
Quarterly - 1 Apr 2015 to 30 Jun 2015 Annual – 1 Jul 2014 to 30 Jun 2015
Characteristics Units of measure
Raw Water Supply
Agreement No. of
samples Min Avg Max No. of samples Min Avg Max
E. coli orgs/100mL NA 13 <1 <1 2 52 <1 <1 2
turbidity NTU 40 13 0.99 1.91 2.60 52 0.80 1.59 2.98
true colour♠ HU 60 13 9 11 12 52 7 11 13
pH pH units 6.3-7.9 13 6.9 7.7 9.7 51 6.9 7.7 9.7
iron mg/L 3.500 13 0.030 0.324 1.040 52 0.030 0.292 1.310
aluminium mg/L 2.600 13 <0.010 0.072 0.117 52 <0.010 0.067 0.117
manganese mg/L 1.400 13 0.003 0.007 0.015 52 0.002 0.006 0.018
♠ True colour is measured at 400nm wavelength. NA= Not Applicable.
Page 40 of 81
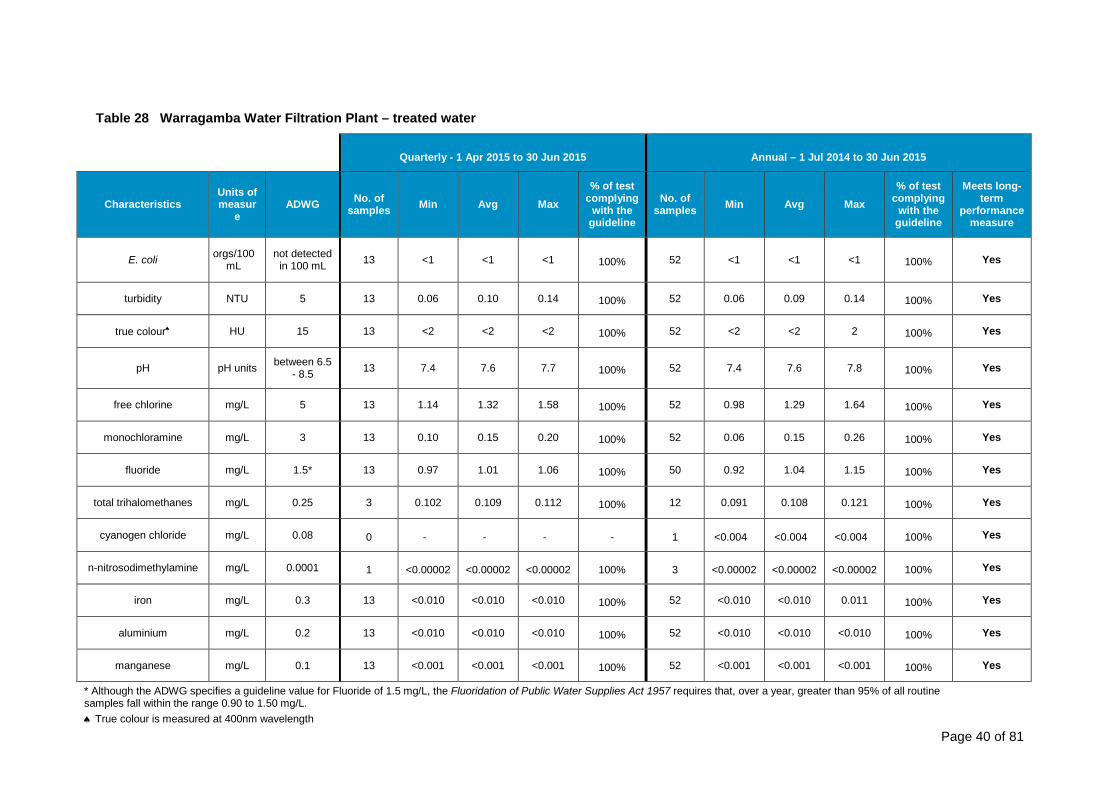
Table 28 Warragamba Water Filtration Plant – treated water
Quarterly - 1 Apr 2015 to 30 Jun 2015 Annual – 1 Jul 2014 to 30 Jun 2015
Characteristics Units of measur
e ADWG No. of
samples Min Avg Max % of test
complying with the
guideline
No. of samples Min Avg Max
% of test complying
with the guideline
Meets long-term
performance measure
E. coli orgs/100mL
not detected in 100 mL 13 <1 <1 <1 100% 52 <1 <1 <1 100% Yes
turbidity NTU 5 13 0.06 0.10 0.14 100% 52 0.06 0.09 0.14 100% Yes
true colour♠ HU 15 13 <2 <2 <2 100% 52 <2 <2 2 100% Yes
pH pH units between 6.5 - 8.5 13 7.4 7.6 7.7 100% 52 7.4 7.6 7.8 100% Yes
free chlorine mg/L 5 13 1.14 1.32 1.58 100% 52 0.98 1.29 1.64 100% Yes
monochloramine mg/L 3 13 0.10 0.15 0.20 100% 52 0.06 0.15 0.26 100% Yes
fluoride mg/L 1.5* 13 0.97 1.01 1.06 100% 50 0.92 1.04 1.15 100% Yes
total trihalomethanes mg/L 0.25 3 0.102 0.109 0.112 100% 12 0.091 0.108 0.121 100% Yes
cyanogen chloride mg/L 0.08 0 - - - - 1 <0.004 <0.004 <0.004 100% Yes
n-nitrosodimethylamine mg/L 0.0001 1 <0.00002 <0.00002 <0.00002 100% 3 <0.00002 <0.00002 <0.00002 100% Yes
iron mg/L 0.3 13 <0.010 <0.010 <0.010 100% 52 <0.010 <0.010 0.011 100% Yes
aluminium mg/L 0.2 13 <0.010 <0.010 <0.010 100% 52 <0.010 <0.010 <0.010 100% Yes
manganese mg/L 0.1 13 <0.001 <0.001 <0.001 100% 52 <0.001 <0.001 <0.001 100% Yes
* Although the ADWG specifies a guideline value for Fluoride of 1.5 mg/L, the Fluoridation of Public Water Supplies Act 1957 requires that, over a year, greater than 95% of all routine samples fall within the range 0.90 to 1.50 mg/L. ♠ True colour is measured at 400nm wavelength
Page 41 of 81
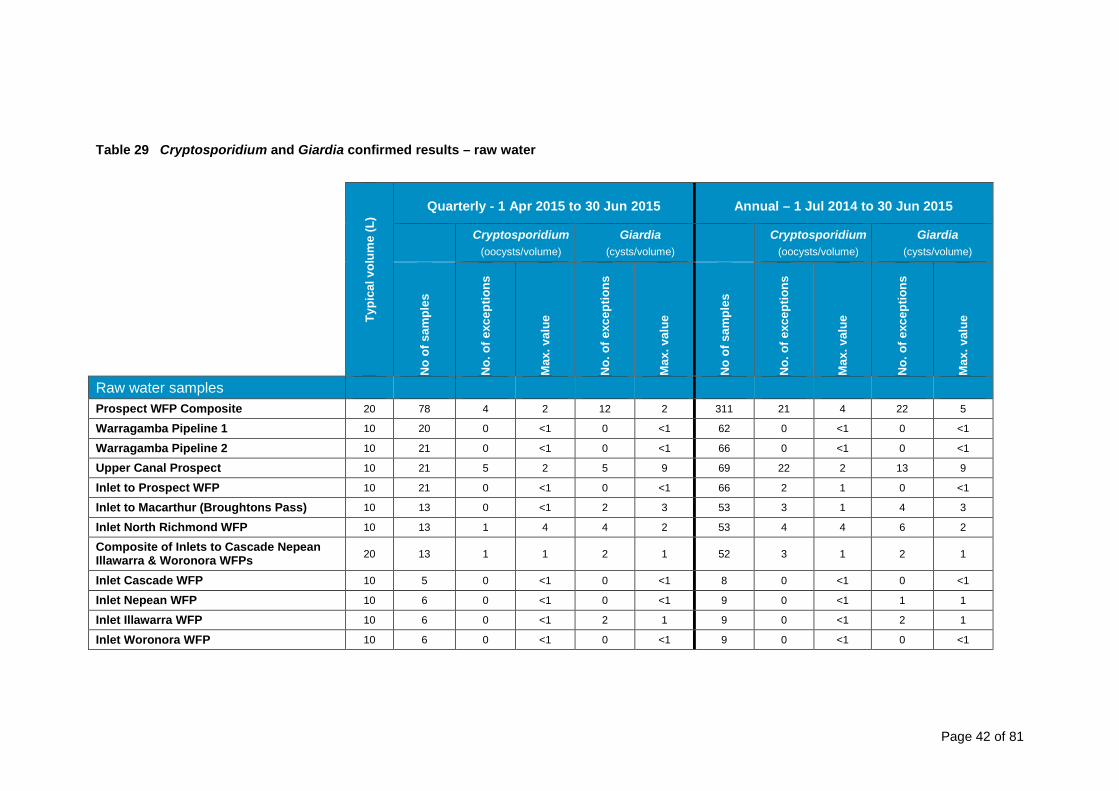
3.2 Cryptosporidium and Giardia Since 1998, Sydney Water has monitored water at the inlet and outlet of water filtration plants for Cryptosporidium and Giardia. This is to verify that the treatment processes used by Sydney Water are operating as required. WaterNSW has also conducted routine monitoring of raw water sources and undertaken investigative monitoring in the catchments to better define the risks presented by these organisms. If Cryptosporidium and Giardia are detected in raw or treated drinking water, WaterNSW and Sydney Water advise NSW Health. Any risks to public health are assessed and any necessary actions implemented.
Samples representing the raw water supply are analysed six days a week for the inlet to Prospect Water Filtration Plant only and weekly for the inlets to the other water filtration plants. Usually composite samples are analysed initially with samples from individual sites / plants analysed in response to detections in the corresponding composite sample. Results for this analysis are shown in Table 29.
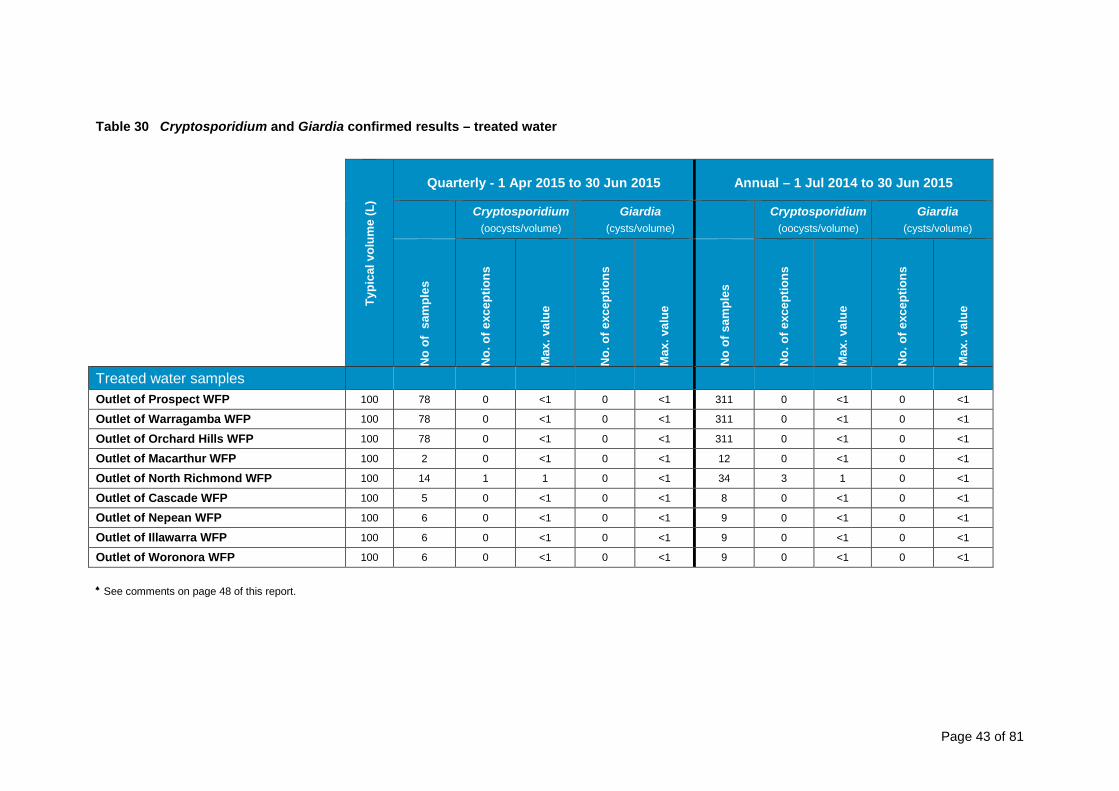
Samples of the treated water from Prospect, Orchard Hills and Warragamba water filtration plants are analysed six days a week and published on Sydney Water’s website under ‘Daily Drinking Water Quality Results’. Treated water from the other water filtration plants is analysed in response to detections in the corresponding raw water samples. Results for this analysis are shown in Table 30.
Page 42 of 81
Table 29 Cryptosporidium and Giardia confirmed results – raw water
Typi
cal v
olum
e (L
)
Quarterly - 1 Apr 2015 to 30 Jun 2015 Annual – 1 Jul 2014 to 30 Jun 2015
Cryptosporidium (oocysts/volume)
Giardia (cysts/volume)
Cryptosporidium (oocysts/volume)
Giardia (cysts/volume)
No
of s
ampl
es
No.
of e
xcep
tions
Max
. val
ue
No.
of e
xcep
tions
Max
. val
ue
No
of s
ampl
es
No.
of e
xcep
tions
Max
. val
ue
No.
of e
xcep
tions
Max
. val
ue
Raw water samples Prospect WFP Composite 20 78 4 2 12 2 311 21 4 22 5
Warragamba Pipeline 1 10 20 0 <1 0 <1 62 0 <1 0 <1
Warragamba Pipeline 2 10 21 0 <1 0 <1 66 0 <1 0 <1
Upper Canal Prospect 10 21 5 2 5 9 69 22 2 13 9
Inlet to Prospect WFP 10 21 0 <1 0 <1 66 2 1 0 <1
Inlet to Macarthur (Broughtons Pass) 10 13 0 <1 2 3 53 3 1 4 3
Inlet North Richmond WFP 10 13 1 4 4 2 53 4 4 6 2
Composite of Inlets to Cascade Nepean Illawarra & Woronora WFPs 20 13 1 1 2 1 52 3 1 2 1
Inlet Cascade WFP 10 5 0 <1 0 <1 8 0 <1 0 <1
Inlet Nepean WFP 10 6 0 <1 0 <1 9 0 <1 1 1
Inlet Illawarra WFP 10 6 0 <1 2 1 9 0 <1 2 1
Inlet Woronora WFP 10 6 0 <1 0 <1 9 0 <1 0 <1
Page 43 of 81
Table 30 Cryptosporidium and Giardia confirmed results – treated water
Typi
cal v
olum
e (L
)
Quarterly - 1 Apr 2015 to 30 Jun 2015 Annual – 1 Jul 2014 to 30 Jun 2015
Cryptosporidium (oocysts/volume)
Giardia (cysts/volume)
Cryptosporidium (oocysts/volume)
Giardia (cysts/volume)
No
of s
ampl
es
No.
of e
xcep
tions
Max
. val
ue
No.
of e
xcep
tions
Max
. val
ue
No
of s
ampl
es
No.
of e
xcep
tions
Max
. val
ue
No.
of e
xcep
tions
Max
. val
ue
Treated water samples Outlet of Prospect WFP 100 78 0 <1 0 <1 311 0 <1 0 <1
Outlet of Warragamba WFP 100 78 0 <1 0 <1 311 0 <1 0 <1
Outlet of Orchard Hills WFP 100 78 0 <1 0 <1 311 0 <1 0 <1
Outlet of Macarthur WFP 100 2 0 <1 0 <1 12 0 <1 0 <1
Outlet of North Richmond WFP 100 14 1 1 0 <1 34 3 1 0 <1
Outlet of Cascade WFP 100 5 0 <1 0 <1 8 0 <1 0 <1
Outlet of Nepean WFP 100 6 0 <1 0 <1 9 0 <1 0 <1
Outlet of Illawarra WFP 100 6 0 <1 0 <1 9 0 <1 0 <1
Outlet of Woronora WFP 100 6 0 <1 0 <1 9 0 <1 0 <1
♠ See comments on page 48 of this report.

Page 44 of 81
3.3 Other parameters A range of potential chemical contaminants (metals, organic chemicals and radionuclides) are monitored in the raw water at the inlet to each treatment plant. A few are also monitored in the treated water at the plant outlet. Risk assessments for these chemicals take in consideration the physical and chemical properties of the various compounds and usage within the catchment areas. For most of these chemicals, more intensive monitoring was carried out to establish if they were likely to be present in the supply and this historical data has been used along with the risk assessments to determine the range of potential contaminants and the frequency of analysis for the current monitoring program.
For the catchments managed by WaterNSW, the risks are similar and so the monitoring program is the same for each of these catchments. As North Richmond WFP and Sydney Desalination Plant are supplied from the Hawkesbury River and the Tasman Sea respectively, their risk profile is different from WaterNSW catchments and this is reflected in the monitoring programs.
Monitoring for additional chemicals may be done from time to time for investigative or other operational purposes but results are not shown here either because of the infrequency of monitoring, they do not directly influence drinking water quality or no guideline values exist.
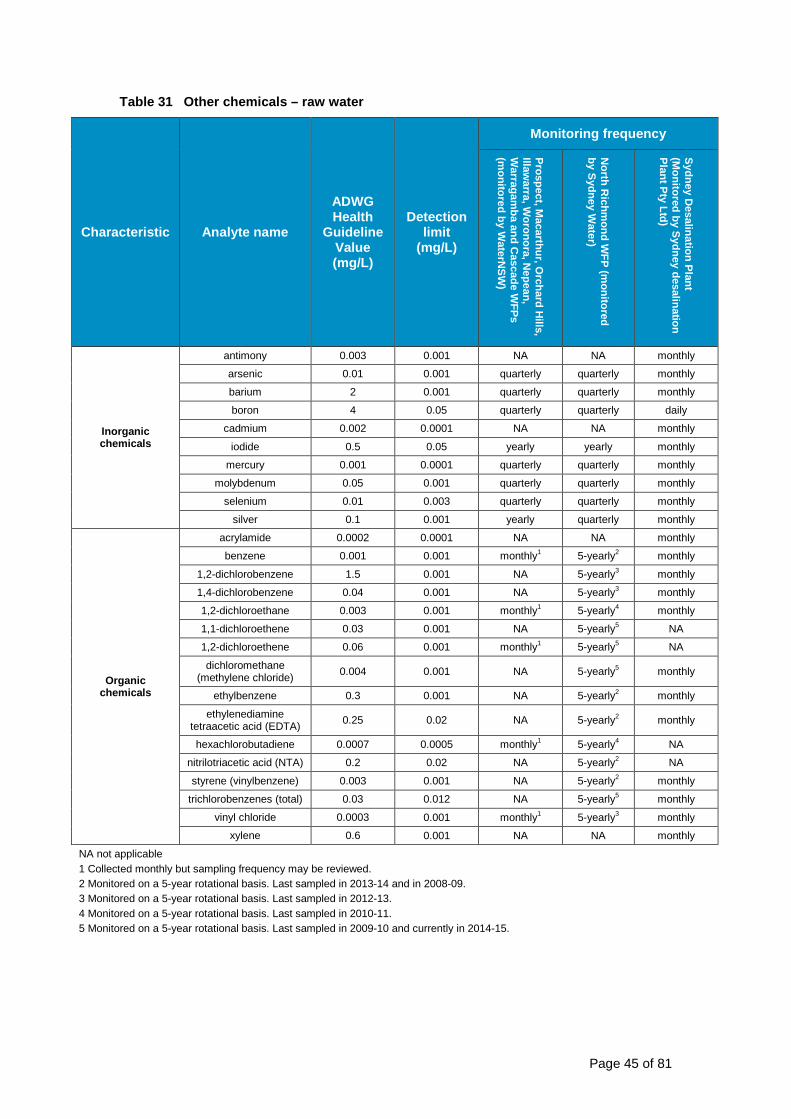
The following tables only show the ADWG health guideline value, the analytical limit of detection, and the frequency of analysis for each chemical. Results are not shown because analysis is infrequent and the majority of these chemicals are only rarely detected and at very low levels. Commentary on any recent detection of these chemicals is given in the discussion at the end of this section.
Tables 31 to 33 list chemicals monitored at the inlet to each water treatment plant while Table 34 lists chemicals monitored in the treated water at the outlet of each water treatment plant.
Page 45 of 81
Table 31 Other chemicals – raw water
Characteristic Analyte name
ADWG Health
Guideline Value (mg/L)
Detection limit
(mg/L)
Monitoring frequency
Prospect, Macarthur, O
rchard Hills,
Illawarra, W
oronora, Nepean,
Warragam
ba and Cascade W
FPs (m
onitored by WaterN
SW)
North R
ichmond W
FP (monitored
by Sydney Water)
Sydney Desalination Plant
(Monitored by Sydney desalination
Plant Pty Ltd)
Inorganic chemicals
antimony 0.003 0.001 NA NA monthly
arsenic 0.01 0.001 quarterly quarterly monthly
barium 2 0.001 quarterly quarterly monthly
boron 4 0.05 quarterly quarterly daily
cadmium 0.002 0.0001 NA NA monthly
iodide 0.5 0.05 yearly yearly monthly
mercury 0.001 0.0001 quarterly quarterly monthly
molybdenum 0.05 0.001 quarterly quarterly monthly
selenium 0.01 0.003 quarterly quarterly monthly
silver 0.1 0.001 yearly quarterly monthly
Organic chemicals
acrylamide 0.0002 0.0001 NA NA monthly
benzene 0.001 0.001 monthly1 5-yearly2 monthly
1,2-dichlorobenzene 1.5 0.001 NA 5-yearly3 monthly
1,4-dichlorobenzene 0.04 0.001 NA 5-yearly3 monthly
1,2-dichloroethane 0.003 0.001 monthly1 5-yearly4 monthly
1,1-dichloroethene 0.03 0.001 NA 5-yearly5 NA
1,2-dichloroethene 0.06 0.001 monthly1 5-yearly5 NA
dichloromethane (methylene chloride) 0.004 0.001 NA 5-yearly5 monthly
ethylbenzene 0.3 0.001 NA 5-yearly2 monthly
ethylenediamine tetraacetic acid (EDTA) 0.25 0.02 NA 5-yearly2 monthly
hexachlorobutadiene 0.0007 0.0005 monthly1 5-yearly4 NA
nitrilotriacetic acid (NTA) 0.2 0.02 NA 5-yearly2 NA
styrene (vinylbenzene) 0.003 0.001 NA 5-yearly2 monthly
trichlorobenzenes (total) 0.03 0.012 NA 5-yearly5 monthly
vinyl chloride 0.0003 0.001 monthly1 5-yearly3 monthly
xylene 0.6 0.001 NA NA monthly
NA not applicable 1 Collected monthly but sampling frequency may be reviewed. 2 Monitored on a 5-year rotational basis. Last sampled in 2013-14 and in 2008-09. 3 Monitored on a 5-year rotational basis. Last sampled in 2012-13. 4 Monitored on a 5-year rotational basis. Last sampled in 2010-11. 5 Monitored on a 5-year rotational basis. Last sampled in 2009-10 and currently in 2014-15.

Page 46 of 81
Table 32 Pesticides and herbicides – raw water
Characteristic Analyte name
ADWG Health
Guideline Value (mg/L)
Detection limit
(mg/L)
Monitoring frequency
Prospect, Macarthur, O
rchard Hills,
Illawarra, W
oronora, Nepean,
Warragam
ba and Cascade W
FPs (m
onitored by WaterN
SW)
North R
ichmond W
FP (monitored
by Sydney Water)
Sydney Desalination Plant
(Monitored by Sydney desalination
Plant Pty Ltd)
Pesticides / Herbicides
aldrin 0.0003 0.00001 NA monthly monthly
amritole 0.009 0.001 yearly1 NA NA
atrazine 0.02 0.0005 yearly1 monthly NA
chlordane 0.002 0.00001 NA monthly monthly
chlorpyrifos 0.01 0.001 monthly NA NA
2,4-D 0.03 0.0001 monthly monthly NA
DDT 0.009 0.00001 NA monthly monthly
diazinon 0.004 0.0001 monthly monthly NA
dicamba 0.1 0.005 NA monthly NA
dieldrin 0.0003 0.00001 NA monthly monthly
dimethoate 0.007 0.0001 NA monthly NA
diquat 0.007 0.0005 yearly1 monthly NA
diuron 0.02 0.01 yearly1 NA NA
endosulfan 0.02 0.00001 NA monthly monthly
glyphosate 1 0.01 monthly monthly NA
heptachlor 0.0003 0.00001 yearly1 monthly monthly
hexazinone 0.4 0.002 yearly1 NA NA
lindane 0.01 0.00001 NA monthly monthly
methoxychlor 0.3 0.000002 NA NA monthly
metsulfuron-methyl 0.04 0.005 NA monthly NA
molinate 0.004 0.0001 NA monthly NA
paraquat 0.02 0.0005 NA monthly NA
2,4,5-T 0.1 0.0005 yearly1 NA NA
triclopyr 0.02 0.0001 monthly monthly NA
NA not applicable 1 Additional samples collected following heavy rain.

Page 47 of 81
Table 33 Radionuclides – raw water
Characteristic Analyte name
ADWG Health
Guideline Value (Bq/L)
Detection limit
(Bq/L)
Monitoring frequency
Prospect, Macarthur, O
rchard Hills,
Illawarra, W
oronora, Nepean,
Warragam
ba and Cascade W
FPs (m
onitored by WaterN
SW)
North R
ichmond W
FP (monitored
by Sydney Water)
Sydney Desalination Plant
(Monitored by Sydney desalination
Plant Pty Ltd)
Radiological gross alpha NA1 0.005 yearly 5-yearly2 NA gross beta NA1 0.01 yearly 5-yearly2 NA
total radionuclides 0.5 0.02 NA NA 5 yrs3 NA not applicable 1 The sum of gross alpha and gross beta (total radionuclides) should not exceed 0.5Bq/L (becquerels per litre). 2 Monitored on a 5-year rotational basis. Last sampled in 2012-13. 3 Sampled at plant start-up in 2010 and each subsequent 5 years if/when operational.
Table 34 Other chemicals – treated water
Characteristic Analyte name
ADWG Health
Guideline Value (mg/L)
Detection limit
(mg/L)
Monitoring frequency
All W
FPs (m
onitored by Sydney W
ater)
Sydney D
esalination Plant (M
onitored by Sydney desalination Plant Pty Ltd)
Inorganic chemicals
antimony 0.003 0.001 NA1 monthly* bromate 0.02 0.002 NA monthly* cadmium 0.002 0.001 NA1 monthly* copper 2 0.001 NA1 monthly*
chromium (as Cr(VI)) 0.05 0.004 NA1 monthly* cyanide 0.08 0.005 NA1 monthly*
lead 0.01 0.001 NA1 monthly* nickel 0.02 0.001 NA1 monthly* sulfate 500 1 quarterly monthly*
Organic chemicals
acrylamide 0.0002 0.0001 5-yearly2 monthly* carbon tetrachloride 0.003 0.001 5-yearly3 monthly*
epichlorhydrin 0.0005 0.0005 NA monthly* toluene 0.8 0.001 NA1 monthly* xylene 0.6 0.001 NA1 monthly*
NA not applicable 1 Monitored in the customer supply systems rather than in the treated water from the WFP. 2 Monitored on a 5-year rotational basis. Last sampled in 2010-11, 1 sample for each WFP in each quarter. 3 Monitored on a 5-year rotational basis. Last sampled for each WFP in each quarter during 2011-12. * Monitored at this frequency when operational
Page 48 of 81
3.4 Discussion of results for water treatment 3.4.1 Raw water
A series of wet weather events starting in 2012 caused increased levels in turbidity, natural colour, organic matter, metals (iron, aluminium and manganese) and fluctuating pH levels. This has proven a challenge in water treatment over the past 12 months and is expected to cause persistent water quality issues that will continue to be reviewed and addressed.
During the 12-month period 1 July 2014 to 30 June 2015,
• Cryptosporidium oocysts and Giardia cysts have occasionally been detected in raw water in low numbers. These detections have mainly occurred in the raw water supplying Prospect WFP and North Richmond WFP (Table 29)
• none of the chemicals listed in Table 31, Table 32 or Table 33 have been detected at levels above the guideline value
• All detections were at a level well below the ADWG 2011 health guideline value.
3.4.2 Treated water
During the 12-month period 1 July 2014 to 30 June 2015,
• One manganese result was slightly above the ADWG aesthetic guideline level at Prospect Water Filtration plant. The average result was well below the aesthetic guideline value.
• A single Cryptosporidium oocyst was detected on three separate occasions. One in a 100 litre treated water sample collected from North Richmond WFP on 1 October 2014, 2 October 2014 and on 23 June 2015 (Table 30).
On each occasion, Sydney Water notified NSW Health immediately, investigated treatment performance and undertook re-sampling. The re-sampling and subsequent routine monitoring did not detect any further Cryptosporidium oocysts or Giardia cysts. Based on an assessment of all relevant risk factors associated with these events, NSW Health advised that these events were unlikely to have affected public health.
• All other results for the treated water sampled from the water filtration plants were within the ADWG 2011 health and aesthetic guideline values with excellent overall results for water treatment.

Page 49 of 81
4 Distribution (Customer Supply Systems)
The water distribution network is made up of about 21,477 kilometres of water pipes, 150 pumping stations, 243 reservoirs, and numerous valves, flow meters and rechlorination plants. The network operates to maintain continued and reliable supply and to maintain drinking water quality after treatment. More information on the customer supply systems can be found under Sydney Water’s water systems on the Sydney Water website .
The Australian Drinking Water Guidelines (ADWG) contains health guideline values for a wide range of microbiological, chemical, physical and radiological water quality characteristics. The ADWG recognises that it isn’t always possible to test for all substances or organisms that may be in the treated water. Rather monitoring efforts should be directed at key characteristics for each system.
In order to demonstrate compliance with the requirements of its Operating Licence, Sydney Water conducts drinking water quality (compliance) monitoring, at more than 670 customer properties throughout the supply system. This monitoring is consistent with the ADWG and verifies the quality of drinking water. Testing is conducted by laboratories that are NATA accredited.
4.1 Routine monitoring for key parameters The data presented in Table 35 to Table 60 are not exhaustive but shows the routinely monitored parameters for which the ADWG has set a health guideline value and those parameters for which Sydney Water is required to show compliance to ADWG aesthetic guidelines.
The majority of health guideline values for chemicals are based on a lifetime of exposure. The ADWG therefore recognise that occasionally there may be health or aesthetic related test results that fall outside the guideline values and that these results are not necessarily an immediate threat to health. The guidelines do not require 100% of results to fall within the guideline values.
Sydney Water’s compliance is measured for each Delivery System and is calculated over a 12-month period using the following long-term performance measures:
• For E. coli, at least 98% of scheduled samples must contain no E. coli.
• For health-related chemical characteristics, the upper bound of the 95% confidence interval for the 95th percentile must be less than the guideline value.
• For aesthetic characteristics, the upper bound of the 95% confidence interval for the mean must be less than the guideline value.
The following tables show data for the customer supply systems that are used to measure Sydney Water’s performance against the ADWG health and aesthetic guideline values. This information is also summarised in a factsheet and more data including typical ranges over a longer period can be found in the Typical Drinking Water Analysis on Sydney Water’s website.

Page 50 of 81
4.1.1 Prospect North Customer Supply System Table 35 Prospect North Customer Supply System – health characteristics
Characteristic Units of measure
ADWG health guideline value
No. of samples
1 Jul 2014 to 30 Jun 2015
No of exceptions
Long-term performance measure (assessment over
12 month period)
% of test results
complying with the
guideline
Met long-term performance
measure
E. coli orgs/100mL Should not be
detected in 100mL sample
1,104 0 At least 98% of test results <1 100% Yes
fluoride mg/L 1.5* 120 0 At least 95% of test results
0.9 to 1.5 mg/L 100% Yes
free chlorine mg/L 5 1,105 0
The 95th percentile value is less than the respective ADWG health guideline value
Yes monochloramine mg/L 3 1,105 0 Yes
antimony^ mg/L 0.003 8 0 Yes cadmium^ mg/L 0.002 8 0 Yes cyanide^ mg/L 0.08 2 0 Yes copper mg/L 2 28 0 Yes
lead mg/L 0.01 28 0 Yes nitrate as NO3 mg/L 50 28 0 Yes nitrite as NO2 mg/L 3 28 0 Yes
nickel^ mg/L 0.02 8 0 Yes sulphate^ mg/L 500 4 0 Yes
chromium^ mg/L 0.05 (as Cr(VI))** 8 0 Yes manganese mg/L 0.5 120 0 Yes
cyanogen chloride mg/L 0.08 1 0 Yes n-nitrosodimethylamine^ mg/L 0.0001 3 0 Yes
total trihalomethanes mg/L 0.25 48 0 The 95th percentile statistic
calculated for combined customer supply system and WFP less than 0.25mg/L
Yes
* Although the ADWG specifies a guideline value for Fluoride of 1.5 mg/L, the Fluoridation of Public Water Supplies Act 1957 requires that, over a year, greater than 95% of all routine samples fall within the range 0.90 to 1.50 mg/L. ** The ADWG sets a guideline value for hexavalent chromium (Cr(VI)) however Sydney Water measures total chromium which includes hexavalent chromium. ^ Insufficient data to calculate 95th percentile.

Page 51 of 81
Table 36 Prospect North Customer Supply System – aesthetic characteristics
Characteristic Units of measure
ADWG aesthetic guideline
value
No. of samples
1 Jul 2014 to 30 Jun 2015
Average result Long-term performance measure
(assessment over 12 month period)
Met long-term performance
measure
iron mg/L 0.3 120 0.024
Average of test results less than respective ADWG aesthetic
guideline value
Yes aluminium mg/L 0.2 28 <0.010 Yes
manganese mg/L 0.1 120 0.003 Yes copper mg/L 1 28 0.014 Yes
zinc mg/L 3 28 <0.005 Yes ammonia as NH3 mg/L 0.50 28 0.213 Yes
turbidity NTU 5 1104 0.13 Yes true colour♠ HU 15 28 2 Yes
dissolved oxygen % saturation greater than 85% 28 106.9 Yes
hardness (total) mg/L 200 28 56.6 Yes flavour rating* acceptable 1 2
Average rating of 1, 2 or 3 Yes
odour rating* acceptable 1 2 Yes
pH pH units 6.5-8.5 1104 8.0 Average of test results between
6.5 - 8.5 pH units Yes
* Rated by a panel on a scale from 1 to 5. Ratings of 1, 2 and 3 are generally acceptable to most people while ratings of 4 and 5 are generally not acceptable. ♠ True colour is measured at 400nm wavelength

Page 52 of 81
4.1.2 Prospect East Customer Supply System Table 37 Prospect East Customer Supply System – health characteristics
Characteristic Units of measure
ADWG health guideline value
No. of samples
1 Jul 2014 to 30 Jun 2015
No of exceptions
Long-term performance measure (assessment over
12 month period)
% of test results
complying with the
guideline
Met long-term performance
measure
E. coli orgs/100mL Should not be
detected in 100mL sample
480 0 At least 98% of test results <1 100% Yes
fluoride mg/L 1.5* 120 0 At least 95% of test results
0.9 to 1.5 mg/L 100% Yes
free chlorine mg/L 5 480 0
The 95th percentile value is less than the respective ADWG health guideline value
Yes monochloramine mg/L 3 480 0 Yes
antimony^ mg/L 0.003 8 0 Yes cadmium^ mg/L 0.002 8 0 Yes cyanide^ mg/L 0.08 2 0 Yes copper mg/L 2 28 0 Yes
lead mg/L 0.01 28 0 Yes nitrate as NO3 mg/L 50 28 0 Yes nitrite as NO2 mg/L 3 28 0 Yes
nickel^ mg/L 0.02 8 0 Yes sulphate^ mg/L 500 4 0 Yes
chromium^ mg/L 0.05 (as Cr(VI))** 8 0 Yes manganese mg/L 0.5 120 0 Yes
cyanogen chloride mg/L 0.08 1 0 Yes
n-nitrosodimethylamine^ mg/L 0.0001 3 0 Yes
total trihalomethanes mg/L 0.25 36 0 The 95th percentile statistic
calculated for combined customer supply system and WFP less than 0.25mg/L
Yes
* Although the ADWG specifies a guideline value for Fluoride of 1.5 mg/L, the Fluoridation of Public Water Supplies Act 1957 requires that, over a year, greater than 95% of all routine samples fall within the range 0.90 to 1.50 mg/L. ** The ADWG sets a guideline value for hexavalent chromium (Cr(VI)) however Sydney Water measures total chromium which includes hexavalent chromium. ^ Insufficient data to calculate 95th percentile.

Page 53 of 81
Table 38 Prospect East Customer Supply System – aesthetic characteristics
Characteristic Units of measure
ADWG aesthetic guideline
value
No. of samples
1 Jul 2014 to 30 Jun 2015
Average result Long-term performance measure
(assessment over 12 month period)
Met long-term performance
measure
iron mg/L 0.3 120 0.021
Average of test results less than respective ADWG aesthetic
guideline value
Yes
aluminium mg/L 0.2 28 <0.010 Yes manganese mg/L 0.1 120 0.003 Yes
copper mg/L 1 28 0.015 Yes zinc mg/L 3 28 <0.005 Yes
ammonia as NH3 mg/L 0.50 28 0.387 Yes turbidity NTU 5 480 0.12 Yes
true colour♠ HU 15 28 3 Yes
dissolved oxygen % saturation greater than 85% 28 111.4 Yes
hardness (total) mg/L 200 28 56.3 Yes flavour rating* acceptable 1 2
Average rating of 1, 2 or 3 Yes
odour rating* acceptable 1 2 Yes
pH pH units 6.5-8.5 480 8.0 Average of test results between
6.5 - 8.5 pH units Yes
*Rated by a panel on a scale from 1 to 5. Ratings of 1, 2 and 3 are generally acceptable to most people while ratings of 4 and 5 are generally not acceptable. ♠ True colour is measured at 400nm wavelength
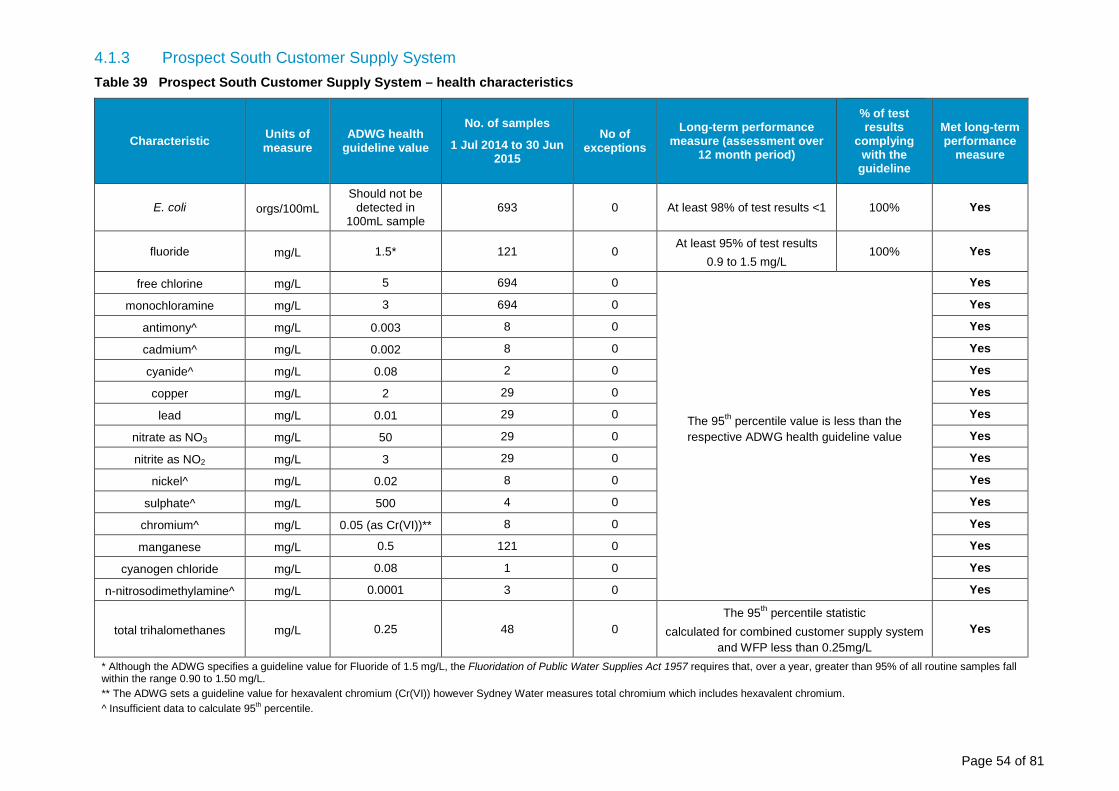
Page 54 of 81
4.1.3 Prospect South Customer Supply System Table 39 Prospect South Customer Supply System – health characteristics
Characteristic Units of measure
ADWG health guideline value
No. of samples
1 Jul 2014 to 30 Jun 2015
No of exceptions
Long-term performance measure (assessment over
12 month period)
% of test results
complying with the
guideline
Met long-term performance
measure
E. coli orgs/100mL Should not be
detected in 100mL sample
693 0 At least 98% of test results <1 100% Yes
fluoride mg/L 1.5* 121 0 At least 95% of test results
0.9 to 1.5 mg/L 100% Yes
free chlorine mg/L 5 694 0
The 95th percentile value is less than the respective ADWG health guideline value
Yes monochloramine mg/L 3 694 0 Yes
antimony^ mg/L 0.003 8 0 Yes cadmium^ mg/L 0.002 8 0 Yes cyanide^ mg/L 0.08 2 0 Yes copper mg/L 2 29 0 Yes
lead mg/L 0.01 29 0 Yes nitrate as NO3 mg/L 50 29 0 Yes nitrite as NO2 mg/L 3 29 0 Yes
nickel^ mg/L 0.02 8 0 Yes sulphate^ mg/L 500 4 0 Yes
chromium^ mg/L 0.05 (as Cr(VI))** 8 0 Yes manganese mg/L 0.5 121 0 Yes
cyanogen chloride mg/L 0.08 1 0 Yes
n-nitrosodimethylamine^ mg/L 0.0001 3 0 Yes
total trihalomethanes mg/L 0.25 48 0 The 95th percentile statistic
calculated for combined customer supply system and WFP less than 0.25mg/L
Yes
* Although the ADWG specifies a guideline value for Fluoride of 1.5 mg/L, the Fluoridation of Public Water Supplies Act 1957 requires that, over a year, greater than 95% of all routine samples fall within the range 0.90 to 1.50 mg/L. ** The ADWG sets a guideline value for hexavalent chromium (Cr(VI)) however Sydney Water measures total chromium which includes hexavalent chromium. ^ Insufficient data to calculate 95th percentile.
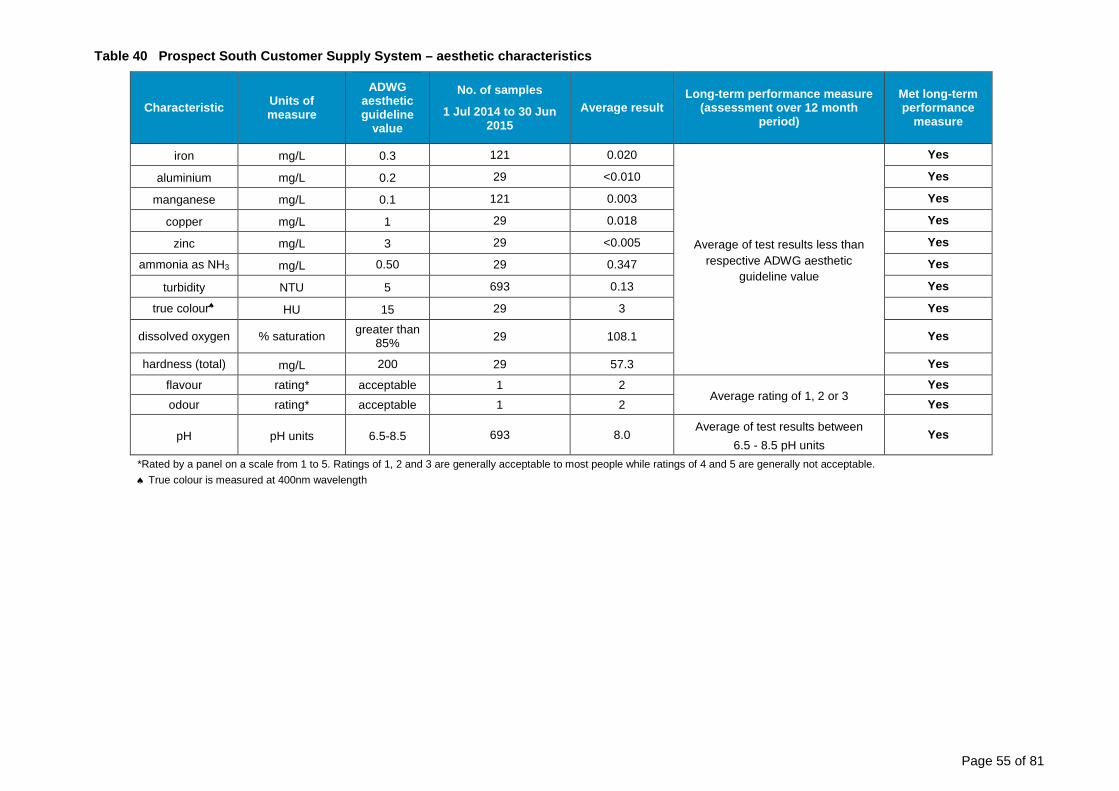
Page 55 of 81
Table 40 Prospect South Customer Supply System – aesthetic characteristics
Characteristic Units of measure
ADWG aesthetic guideline
value
No. of samples
1 Jul 2014 to 30 Jun 2015
Average result Long-term performance measure
(assessment over 12 month period)
Met long-term performance
measure
iron mg/L 0.3 121 0.020
Average of test results less than respective ADWG aesthetic
guideline value
Yes
aluminium mg/L 0.2 29 <0.010 Yes manganese mg/L 0.1 121 0.003 Yes
copper mg/L 1 29 0.018 Yes zinc mg/L 3 29 <0.005 Yes
ammonia as NH3 mg/L 0.50 29 0.347 Yes turbidity NTU 5 693 0.13 Yes
true colour♠ HU 15 29 3 Yes
dissolved oxygen % saturation greater than 85% 29 108.1 Yes
hardness (total) mg/L 200 29 57.3 Yes flavour rating* acceptable 1 2
Average rating of 1, 2 or 3 Yes
odour rating* acceptable 1 2 Yes
pH pH units 6.5-8.5 693 8.0 Average of test results between
6.5 - 8.5 pH units Yes
*Rated by a panel on a scale from 1 to 5. Ratings of 1, 2 and 3 are generally acceptable to most people while ratings of 4 and 5 are generally not acceptable. ♠ True colour is measured at 400nm wavelength
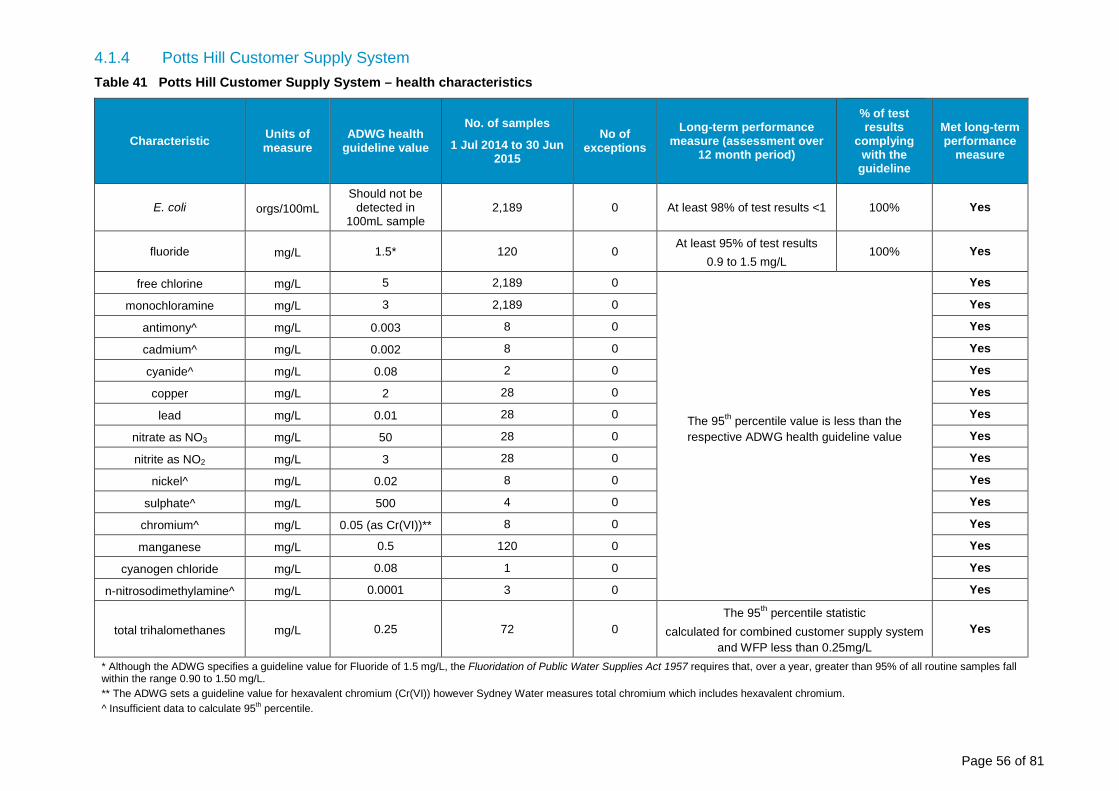
Page 56 of 81
4.1.4 Potts Hill Customer Supply System Table 41 Potts Hill Customer Supply System – health characteristics
Characteristic Units of measure
ADWG health guideline value
No. of samples
1 Jul 2014 to 30 Jun 2015
No of exceptions
Long-term performance measure (assessment over
12 month period)
% of test results
complying with the
guideline
Met long-term performance
measure
E. coli orgs/100mL Should not be
detected in 100mL sample
2,189 0 At least 98% of test results <1 100% Yes
fluoride mg/L 1.5* 120 0 At least 95% of test results
0.9 to 1.5 mg/L 100% Yes
free chlorine mg/L 5 2,189 0
The 95th percentile value is less than the respective ADWG health guideline value
Yes monochloramine mg/L 3 2,189 0 Yes
antimony^ mg/L 0.003 8 0 Yes cadmium^ mg/L 0.002 8 0 Yes cyanide^ mg/L 0.08 2 0 Yes copper mg/L 2 28 0 Yes
lead mg/L 0.01 28 0 Yes nitrate as NO3 mg/L 50 28 0 Yes nitrite as NO2 mg/L 3 28 0 Yes
nickel^ mg/L 0.02 8 0 Yes sulphate^ mg/L 500 4 0 Yes
chromium^ mg/L 0.05 (as Cr(VI))** 8 0 Yes manganese mg/L 0.5 120 0 Yes
cyanogen chloride mg/L 0.08 1 0 Yes
n-nitrosodimethylamine^ mg/L 0.0001 3 0 Yes
total trihalomethanes mg/L 0.25 72 0 The 95th percentile statistic
calculated for combined customer supply system and WFP less than 0.25mg/L
Yes
* Although the ADWG specifies a guideline value for Fluoride of 1.5 mg/L, the Fluoridation of Public Water Supplies Act 1957 requires that, over a year, greater than 95% of all routine samples fall within the range 0.90 to 1.50 mg/L. ** The ADWG sets a guideline value for hexavalent chromium (Cr(VI)) however Sydney Water measures total chromium which includes hexavalent chromium. ^ Insufficient data to calculate 95th percentile.

Page 57 of 81
Table 42 Potts Hill Customer Supply System – aesthetic characteristics
Characteristic Units of measure
ADWG aesthetic guideline
value
No. of samples
1 Jul 2014 to 30 Jun 2015
Average result Long-term performance measure
(assessment over 12 month period)
Met long-term performance
measure
iron mg/L 0.3 120 0.017
Average of test results less than respective ADWG aesthetic
guideline value
Yes
aluminium mg/L 0.2 28 <0.010 Yes manganese mg/L 0.1 120 0.003 Yes
copper mg/L 1 28 0.017 Yes zinc mg/L 3 28 <0.005 Yes
ammonia as NH3 mg/L 0.50 28 0.369 Yes turbidity NTU 5 2,189 0.14 Yes
true colour♠ HU 15 28 3 Yes
dissolved oxygen % saturation greater than 85% 28 107.9 Yes
hardness (total) mg/L 200 28 55.1 Yes flavour rating* acceptable 1 2
Average rating of 1, 2 or 3 Yes
odour rating* acceptable 1 3 Yes
pH pH units 6.5-8.5 2,189 7.9 Average of test results between
6.5 - 8.5 pH units Yes
*Rated by a panel on a scale from 1 to 5. Ratings of 1, 2 and 3 are generally acceptable to most people while ratings of 4 and 5 are generally not acceptable. ♠ True colour is measured at 400nm wavelength

Page 58 of 81
4.1.5 Ryde Customer Supply System Table 43 Ryde Customer Supply System – health characteristics
Characteristic Units of measure
ADWG health guideline value
No. of samples
1 Jul 2014 to 30 Jun 2015
No of exceptions
Long-term performance measure (assessment over
12 month period)
% of test results
complying with the
guideline
Met long-term performance
measure
E. coli orgs/100mL Should not be
detected in 100mL sample
1,116 0 At least 98% of test results <1 100% Yes
fluoride mg/L 1.5* 120 0 At least 95% of test results
0.9 to 1.5 mg/L 100% Yes
free chlorine mg/L 5 1,116 0
The 95th percentile value is less than the respective ADWG health guideline value
Yes monochloramine mg/L 3 1,116 0 Yes
antimony^ mg/L 0.003 8 0 Yes cadmium^ mg/L 0.002 8 0 Yes cyanide^ mg/L 0.08 2 0 Yes copper mg/L 2 28 0 Yes
lead mg/L 0.01 28 0 Yes nitrate as NO3 mg/L 50 28 0 Yes nitrite as NO2 mg/L 3 28 0 Yes
nickel^ mg/L 0.02 8 0 Yes sulphate^ mg/L 500 4 0 Yes
chromium^ mg/L 0.05 (as Cr(VI))** 8 0 Yes manganese mg/L 0.5 120 0 Yes
cyanogen chloride mg/L 0.08 1 0 Yes
n-nitrosodimethylamine^ mg/L 0.0001 3 0 Yes
total trihalomethanes mg/L 0.25 48 0 The 95th percentile statistic
calculated for combined customer supply system and WFP less than 0.25mg/L
Yes
* Although the ADWG specifies a guideline value for Fluoride of 1.5 mg/L, the Fluoridation of Public Water Supplies Act 1957 requires that, over a year, greater than 95% of all routine samples fall within the range 0.90 to 1.50 mg/L. ** The ADWG sets a guideline value for hexavalent chromium (Cr(VI)) however Sydney Water measures total chromium which includes hexavalent chromium.
^ Insufficient data to calculate 95th percentile.

Page 59 of 81
Table 44 Ryde Customer Supply System – aesthetic characteristics
Characteristic Units of measure
ADWG aesthetic guideline
value
No. of samples
1 Jul 2014 to 30 Jun 2015
Average result Long-term performance measure
(assessment over 12 month period)
Met long-term performance
measure
iron mg/L 0.3 120 0.021
Average of test results less than respective ADWG aesthetic
guideline value
Yes
aluminium mg/L 0.2 28 <0.010 Yes manganese mg/L 0.1 120 0.002 Yes
copper mg/L 1 28 0.024 Yes zinc mg/L 3 28 <0.005 Yes
ammonia as NH3 mg/L 0.50 28 0.318 Yes turbidity NTU 5 1,116 0.15 Yes
true colour♠ HU 15 28 3 Yes
dissolved oxygen % saturation greater than 85% 28 105.4 Yes
hardness (total) mg/L 200 28 56.3 Yes flavour rating* acceptable 1 2
Average rating of 1, 2 or 3 Yes
odour rating* acceptable 1 2 Yes
pH pH units 6.5-8.5 1,116 7.9 Average of test results between
6.5 - 8.5 pH units Yes
*Rated by a panel on a scale from 1 to 5. Ratings of 1, 2 and 3 are generally acceptable to most people while ratings of 4 and 5 are generally not acceptable. ♠ True colour is measured at 400nm wavelength

Page 60 of 81
4.1.6 Orchard Hills Customer Supply System Table 45 Orchard Hills Customer Supply System – health characteristics
Characteristic Units of measure
ADWG health guideline value
No. of samples
1 Jul 2014 to 30 Jun 2015
No of exceptions
Long-term performance measure (assessment over 12 month period)
% of test results
complying with the
guideline
Met long-term performance
measure
E. coli orgs/100mL Should not be
detected in 100mL sample
456 0 At least 98% of test results <1 100% Yes
fluoride mg/L 1.5* 98 0 At least 95% of test results 0.9 to 1.5 mg/L 100% Yes
free chlorine mg/L 5 456 0
The 95th percentile value is less than the respective ADWG health guideline value
Yes
monochloramine mg/L 3 456 0 Yes
antimony^ mg/L 0.003 8 0 Yes
cadmium^ mg/L 0.002 8 0 Yes
cyanide^ mg/L 0.08 2 0 Yes
copper mg/L 2 28 0 Yes
lead mg/L 0.01 28 0 Yes
nitrate as NO3 mg/L 50 28 0 Yes
nitrite as NO2 mg/L 3 28 0 Yes
nickel^ mg/L 0.02 8 0 Yes
sulphate^ mg/L 500 4 0 Yes
chromium^ mg/L 0.05 (as
Cr(VI))** 8 0 Yes
manganese mg/L 0.5 120 0 Yes
cyanogen chloride mg/L 0.08 1 0 Yes
n-nitrosodimethylamine^ mg/L 0.0001 3 0 Yes
total trihalomethanes mg/L 0.25 36 0 The 95th percentile statistic calculated for combined customer supply system and WFP is less than 0.25mg/L♠
Yes
♠ The combined water filtration plant and customer supply system 95th percentile statistic for total trihalomethanes over 12 months for Orchard Hills is 0.213 mg/L, less than the guideline value of 0.250 mg/L. See comments on page 77 of this report. ^ Insufficient data to calculate 95th percentile. NA= Not Applicable. * Although the ADWG specifies a guideline value for Fluoride of 1.5 mg/L, the Fluoridation of Public Water Supplies Act 1957 requires that, over a year, greater than 95% of all routine samples fall within the range 0.90 to 1.50 mg/L. ** The ADWG sets a guideline value for hexavalent chromium (Cr(VI)) however Sydney Water measures total chromium which includes hexavalent chromium.

Page 61 of 81
Table 46 Orchard Hills Customer Supply System – aesthetic characteristics
Characteristic Units of measure
ADWG aesthetic guideline
value
No. of samples
1 Jul 2014 to 30 Jun 2015
Average result Long-term performance measure
(assessment over 12 month period)
Met long-term performance
measure
iron mg/L 0.3 120 <0.01
Average of test results less than respective ADWG aesthetic
guideline value
Yes
aluminium mg/L 0.2 28 <0.01 Yes manganese mg/L 0.1 120 <0.001 Yes
copper mg/L 1 28 0.024 Yes zinc mg/L 3 28 <0.005 Yes
ammonia as NH3 mg/L 0.50 28 <0.001 Yes turbidity NTU 5 456 0.11 Yes
true colour♠ HU 15 28 <2 Yes
dissolved oxygen % saturation greater than 85% 28 108.4 Yes
hardness (total) mg/L 200 28 67.6 Yes flavour rating* acceptable 1 3
Average rating of 1, 2 or 3 Yes
odour rating* acceptable 1 3 Yes
pH pH units 6.5-8.5 456 7.9 Average of test results between
6.5 - 8.5 pH units Yes
*Rated by a panel on a scale from 1 to 5. Ratings of 1, 2 and 3 are generally acceptable to most people while ratings of 4 and 5 are generally not acceptable ♠ True colour is measured at 400nm wavelength.
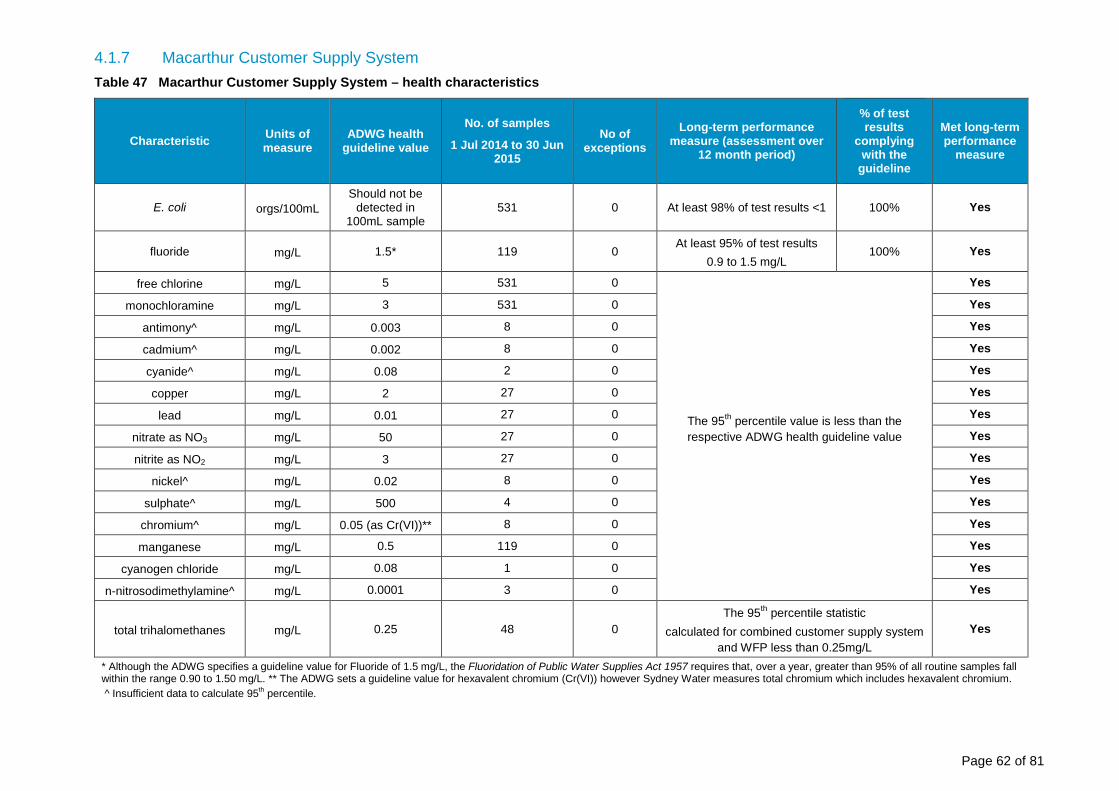
Page 62 of 81
4.1.7 Macarthur Customer Supply System Table 47 Macarthur Customer Supply System – health characteristics
Characteristic Units of measure
ADWG health guideline value
No. of samples
1 Jul 2014 to 30 Jun 2015
No of exceptions
Long-term performance measure (assessment over
12 month period)
% of test results
complying with the
guideline
Met long-term performance
measure
E. coli orgs/100mL Should not be
detected in 100mL sample
531 0 At least 98% of test results <1 100% Yes
fluoride mg/L 1.5* 119 0 At least 95% of test results
0.9 to 1.5 mg/L 100% Yes
free chlorine mg/L 5 531 0
The 95th percentile value is less than the respective ADWG health guideline value
Yes monochloramine mg/L 3 531 0 Yes
antimony^ mg/L 0.003 8 0 Yes cadmium^ mg/L 0.002 8 0 Yes cyanide^ mg/L 0.08 2 0 Yes copper mg/L 2 27 0 Yes
lead mg/L 0.01 27 0 Yes nitrate as NO3 mg/L 50 27 0 Yes nitrite as NO2 mg/L 3 27 0 Yes
nickel^ mg/L 0.02 8 0 Yes sulphate^ mg/L 500 4 0 Yes
chromium^ mg/L 0.05 (as Cr(VI))** 8 0 Yes manganese mg/L 0.5 119 0 Yes
cyanogen chloride mg/L 0.08 1 0 Yes
n-nitrosodimethylamine^ mg/L 0.0001 3 0 Yes
total trihalomethanes mg/L 0.25 48 0 The 95th percentile statistic
calculated for combined customer supply system and WFP less than 0.25mg/L
Yes
* Although the ADWG specifies a guideline value for Fluoride of 1.5 mg/L, the Fluoridation of Public Water Supplies Act 1957 requires that, over a year, greater than 95% of all routine samples fall within the range 0.90 to 1.50 mg/L. ** The ADWG sets a guideline value for hexavalent chromium (Cr(VI)) however Sydney Water measures total chromium which includes hexavalent chromium. ^ Insufficient data to calculate 95th percentile.

Page 63 of 81
Table 48 Macarthur Customer Supply System – aesthetic characteristics
Characteristic Units of measure
ADWG aesthetic guideline
value
No. of samples
1 Jul 2014 to 30 Jun 2015
Average result Long-term performance measure
(assessment over 12 month period)
Met long-term performance
measure
iron mg/L 0.3 119 0.024
Average of test results less than respective ADWG aesthetic
guideline value
Yes
aluminium mg/L 0.2 27 0.038 Yes manganese mg/L 0.1 119 <0.001 Yes
copper mg/L 1 27 0.011 Yes zinc mg/L 3 28 <0.005 Yes
ammonia as NH3 mg/L 0.50 27 0.204 Yes turbidity NTU 5 531 0.16 Yes
true colour♠ HU 15 28 <2 Yes
dissolved oxygen % saturation greater than 85% 27 104.3 Yes
hardness (total) mg/L 200 27 40.4 Yes flavour rating* acceptable 1 2
Average rating of 1, 2 or 3 Yes
odour rating* acceptable 1 3 Yes
pH pH units 6.5-8.5 531 7.8 Average of test results between
6.5 - 8.5 pH units Yes
*Rated by a panel on a scale from 1 to 5. Ratings of 1, 2 and 3 are generally acceptable to most people while ratings of 4 and 5 are generally not acceptable. ♠ True colour is measured at 400nm wavelength
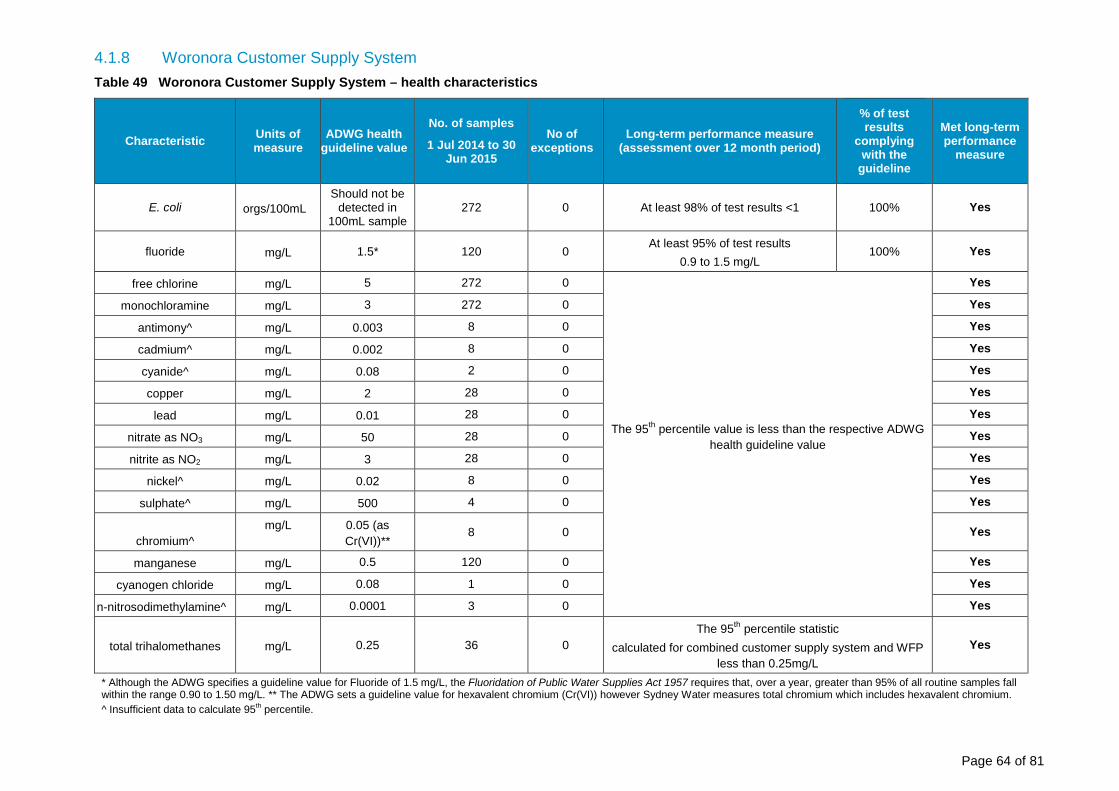
Page 64 of 81
4.1.8 Woronora Customer Supply System Table 49 Woronora Customer Supply System – health characteristics
Characteristic Units of measure
ADWG health guideline value
No. of samples
1 Jul 2014 to 30 Jun 2015
No of exceptions
Long-term performance measure (assessment over 12 month period)
% of test results
complying with the
guideline
Met long-term performance
measure
E. coli orgs/100mL Should not be
detected in 100mL sample
272 0 At least 98% of test results <1 100% Yes
fluoride mg/L 1.5* 120 0 At least 95% of test results
0.9 to 1.5 mg/L 100% Yes
free chlorine mg/L 5 272 0
The 95th percentile value is less than the respective ADWG health guideline value
Yes monochloramine mg/L 3 272 0 Yes
antimony^ mg/L 0.003 8 0 Yes cadmium^ mg/L 0.002 8 0 Yes cyanide^ mg/L 0.08 2 0 Yes copper mg/L 2 28 0 Yes
lead mg/L 0.01 28 0 Yes nitrate as NO3 mg/L 50 28 0 Yes nitrite as NO2 mg/L 3 28 0 Yes
nickel^ mg/L 0.02 8 0 Yes sulphate^ mg/L 500 4 0 Yes
chromium^ mg/L 0.05 (as
Cr(VI))** 8 0 Yes
manganese mg/L 0.5 120 0 Yes cyanogen chloride mg/L 0.08 1 0 Yes
n-nitrosodimethylamine^ mg/L 0.0001 3 0 Yes
total trihalomethanes mg/L 0.25 36 0 The 95th percentile statistic
calculated for combined customer supply system and WFP less than 0.25mg/L
Yes
* Although the ADWG specifies a guideline value for Fluoride of 1.5 mg/L, the Fluoridation of Public Water Supplies Act 1957 requires that, over a year, greater than 95% of all routine samples fall within the range 0.90 to 1.50 mg/L. ** The ADWG sets a guideline value for hexavalent chromium (Cr(VI)) however Sydney Water measures total chromium which includes hexavalent chromium. ^ Insufficient data to calculate 95th percentile.

Page 65 of 81
Table 50 Woronora Customer Supply System – aesthetic characteristics
Characteristic Units of measure
ADWG aesthetic guideline
value
No. of samples
1 Jul 2014 to 30 Jun 2015
Average result Long-term performance measure
(assessment over 12 month period)
Met long-term performance
measure
iron mg/L 0.3 120 0.014
Average of test results less than respective ADWG aesthetic
guideline value
Yes
aluminium mg/L 0.2 28 0.034 Yes manganese mg/L 0.1 120 <0.001 Yes
copper mg/L 1 28 0.018 Yes zinc mg/L 3 28 <0.005 Yes
ammonia as NH3 mg/L 0.50 28 0.251 Yes turbidity NTU 5 272 0.11 Yes
true colour♠ HU 15 28 <2 Yes
dissolved oxygen % saturation greater than 85% 28 104.5 Yes
hardness (total) mg/L 200 28 44.7 Yes flavour rating* acceptable 1 2
Average rating of 1, 2 or 3 Yes
odour rating* acceptable 1 2 Yes
pH pH units 6.5-8.5 272 7.9 Average of test results between
6.5 - 8.5 pH units Yes
*Rated by a panel on a scale from 1 to 5. Ratings of 1, 2 and 3 are generally acceptable to most people while ratings of 4 and 5 are generally not acceptable. ♠ True colour is measured at 400nm wavelength

Page 66 of 81
4.1.9 Illawarra Customer Supply System Table 51 Illawarra Customer Supply System – health characteristics
Characteristic Units of measure
ADWG health guideline value
No. of samples
1 Jul 2014 to 30 Jun 2015
No of exceptions
Long-term performance measure (assessment over 12 month period)
% of test results
complying with the
guideline
Met long-term performance
measure
E. coli orgs/100mL Should not be
detected in 100mL sample
792 0 At least 98% of test results <1 100% Yes
fluoride mg/L 1.5* 120 0 At least 95% of test results
0.9 to 1.5 mg/L 100% Yes
free chlorine mg/L 5 792 0
The 95th percentile value is less than respective ADWG health guideline value
Yes
monochloramine mg/L 3 792 0 Yes
antimony^ mg/L 0.003 8 0 Yes
cadmium^ mg/L 0.002 8 0 Yes
cyanide^ mg/L 0.08 2 0 Yes
copper^ mg/L 2 28 0 Yes
lead mg/L 0.01 28 0 Yes
nitrate as NO3 mg/L 50 28 0 Yes
nitrite as NO2 mg/L 3 28 0 Yes
nickel^ mg/L 0.02 8 0 Yes
sulphate^ mg/L 500 4 0 Yes
chromium^ mg/L 0.05 (as Cr(VI)) ** 8 0 Yes
manganese mg/L 0.5 120 0 Yes
cyanogen chloride mg/L 0.08 1 0 Yes
n-nitrosodimethylamine^ mg/L 0.0001 3 0 Yes
total trihalomethanes mg/L 0.25 48 0 The 95th percentile statistic
calculated for combined customer supply system and WFP less than 0.25mg/L
Yes
* Although the ADWG specifies a guideline value for Fluoride of 1.5 mg/L, the Fluoridation of Public Water Supplies Act 1957 requires that, over a year, greater than 95% of all routine samples fall within the range 0.90 to 1.50 mg/L. ** The ADWG sets a guideline value for hexavalent chromium (Cr(VI)) however Sydney Water measures total chromium which includes hexavalent chromium. ^ Insufficient data to calculate 95th percentile.
.

Page 67 of 81
Table 52 Illawarra Customer Supply System – aesthetic characteristics
Characteristic Units of measure
ADWG aesthetic guideline
value
No. of samples
1 Jul 2014 to 30 Jun 2015
Average result Long-term performance measure
(assessment over 12 month period)
Met long-term performance
measure
iron mg/L 0.3 120 0.014
Average of test results less than respective ADWG aesthetic
guideline value
Yes
aluminium mg/L 0.2 28 0.023 Yes manganese mg/L 0.1 120 0.001 Yes
copper mg/L 1 28 0.014 Yes zinc mg/L 3 28 <0.005 Yes
ammonia as NH3 mg/L 0.50 28 <0.001 Yes turbidity NTU 5 792 0.15 Yes
true colour♠ HU 15 28 <2 Yes
dissolved oxygen % saturation greater than 85% 28 105.5 Yes
hardness (total) mg/L 200 28 38.4 Yes flavour rating* acceptable 1 2
Average rating of 1, 2 or 3 Yes
odour rating* acceptable 1 3 Yes
pH pH units between 6.5-8.5
792 7.8 Average of test results between
6.5 - 8.5 pH units Yes
*Rated by a panel on a scale from 1 to 5. Ratings of 1, 2 and 3 are generally acceptable to most people while ratings of 4 and 5 are generally not acceptable. ♠ True colour is measured at 400nm wavelength
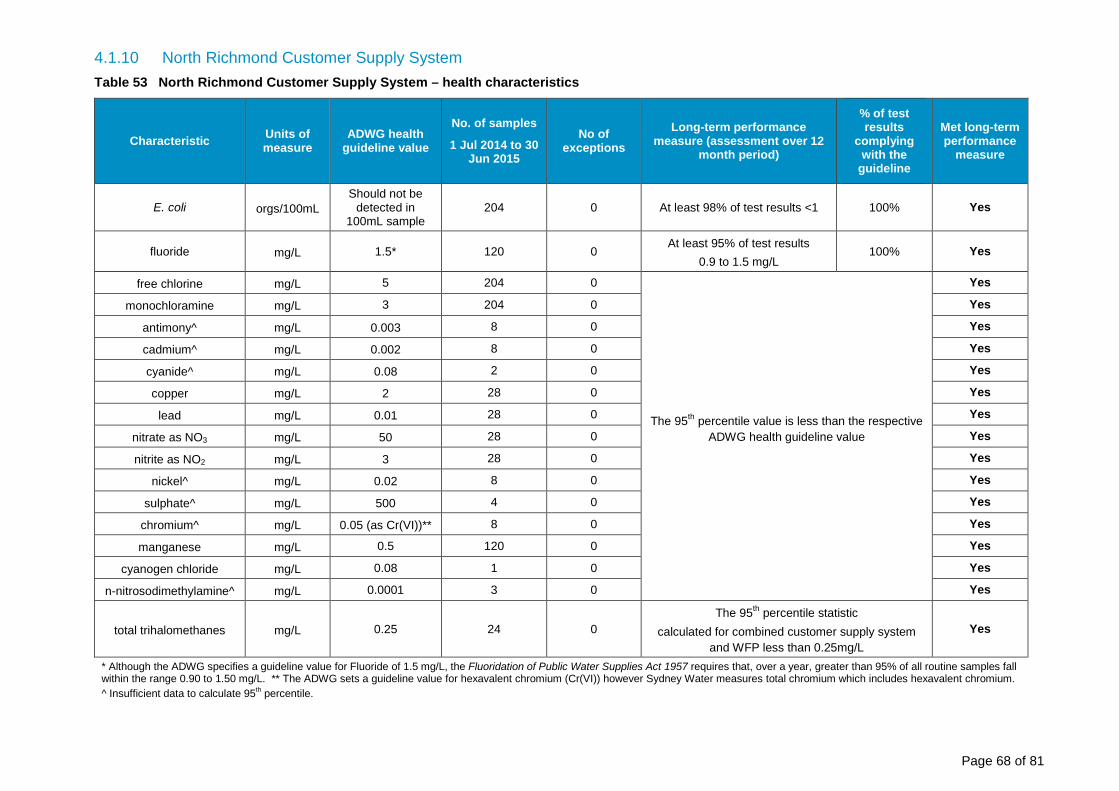
Page 68 of 81
4.1.10 North Richmond Customer Supply System Table 53 North Richmond Customer Supply System – health characteristics
Characteristic Units of measure
ADWG health guideline value
No. of samples
1 Jul 2014 to 30 Jun 2015
No of exceptions
Long-term performance measure (assessment over 12
month period)
% of test results
complying with the
guideline
Met long-term performance
measure
E. coli orgs/100mL Should not be
detected in 100mL sample
204 0 At least 98% of test results <1 100% Yes
fluoride mg/L 1.5* 120 0 At least 95% of test results
0.9 to 1.5 mg/L 100% Yes
free chlorine mg/L 5 204 0
The 95th percentile value is less than the respective ADWG health guideline value
Yes monochloramine mg/L 3 204 0 Yes
antimony^ mg/L 0.003 8 0 Yes cadmium^ mg/L 0.002 8 0 Yes cyanide^ mg/L 0.08 2 0 Yes copper mg/L 2 28 0 Yes
lead mg/L 0.01 28 0 Yes nitrate as NO3 mg/L 50 28 0 Yes nitrite as NO2 mg/L 3 28 0 Yes
nickel^ mg/L 0.02 8 0 Yes sulphate^ mg/L 500 4 0 Yes
chromium^ mg/L 0.05 (as Cr(VI))** 8 0 Yes manganese mg/L 0.5 120 0 Yes
cyanogen chloride mg/L 0.08 1 0 Yes
n-nitrosodimethylamine^ mg/L 0.0001 3 0 Yes
total trihalomethanes mg/L 0.25 24 0 The 95th percentile statistic
calculated for combined customer supply system and WFP less than 0.25mg/L
Yes
* Although the ADWG specifies a guideline value for Fluoride of 1.5 mg/L, the Fluoridation of Public Water Supplies Act 1957 requires that, over a year, greater than 95% of all routine samples fall within the range 0.90 to 1.50 mg/L. ** The ADWG sets a guideline value for hexavalent chromium (Cr(VI)) however Sydney Water measures total chromium which includes hexavalent chromium.
^ Insufficient data to calculate 95th percentile.

Page 69 of 81
Table 54 North Richmond Customer Supply System – aesthetic characteristics
Characteristic Units of measure
ADWG aesthetic guideline
value
No. of samples
1 Jul 2014 to 30 Jun 2015
Average result Long-term performance measure
(assessment over 12 month period)
Met long-term performance
measure
iron mg/L 0.3 120 0.024
Average of test results less than respective ADWG aesthetic
guideline value
Yes
aluminium mg/L 0.2 28 <0.010 Yes manganese mg/L 0.1 120 <0.001 Yes
copper mg/L 1 28 0.015 Yes zinc mg/L 3 28 <0.005 Yes
ammonia as NH3 mg/L 0.50 28 <0.001 Yes turbidity♠ NTU 5 204 0.15 Yes
true colour HU 15 28 <2 Yes
dissolved oxygen % saturation greater than 85% 28 96.9 Yes
hardness (total) mg/L 200 28 32.3 Yes flavour rating* acceptable 1 2
Average rating of 1, 2 or 3 Yes
odour rating* acceptable 1 3 Yes
pH pH units between 6.5-8.5
204 7.9 Average of test results between
6.5 - 8.5 pH units Yes
*Rated by a panel on a scale from 1 to 5. Ratings of 1, 2 and 3 are generally acceptable to most people while ratings of 4 and 5 are generally not acceptable. ♠ True colour is measured at 400nm wavelength
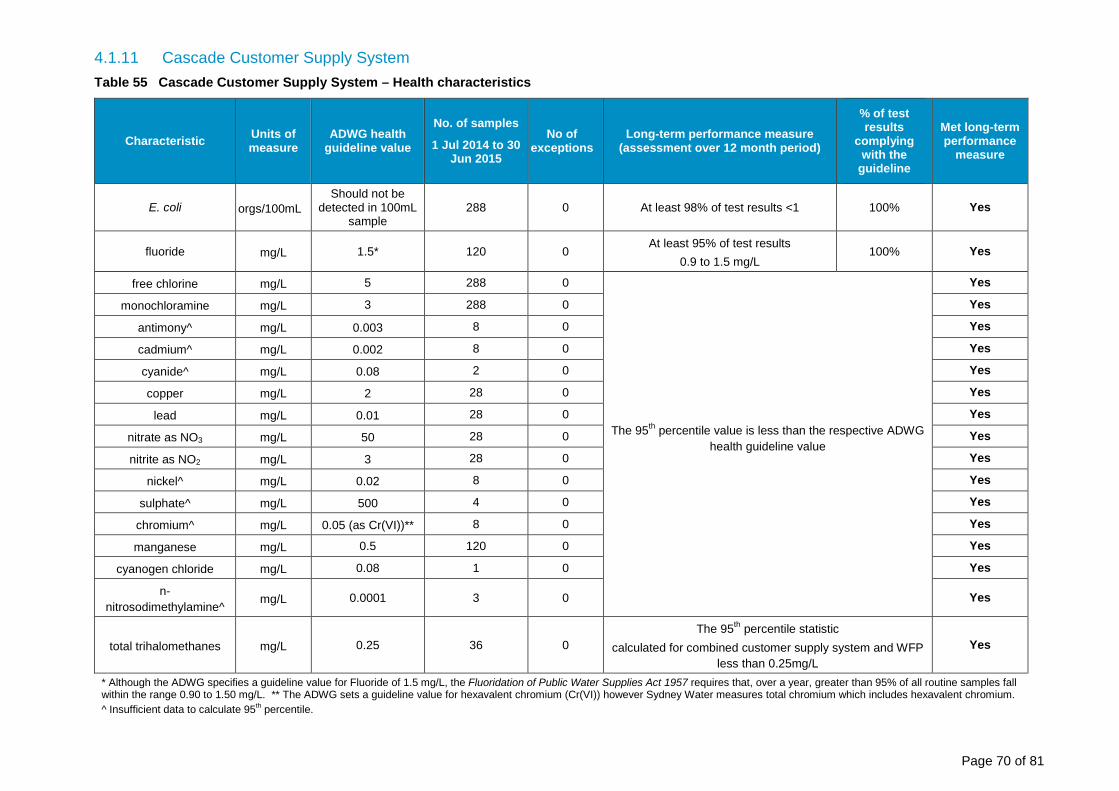
Page 70 of 81
4.1.11 Cascade Customer Supply System Table 55 Cascade Customer Supply System – Health characteristics
Characteristic Units of measure
ADWG health guideline value
No. of samples
1 Jul 2014 to 30 Jun 2015
No of exceptions
Long-term performance measure (assessment over 12 month period)
% of test results
complying with the
guideline
Met long-term performance
measure
E. coli orgs/100mL Should not be
detected in 100mL sample
288 0 At least 98% of test results <1 100% Yes
fluoride mg/L 1.5* 120 0 At least 95% of test results
0.9 to 1.5 mg/L 100% Yes
free chlorine mg/L 5 288 0
The 95th percentile value is less than the respective ADWG health guideline value
Yes
monochloramine mg/L 3 288 0 Yes
antimony^ mg/L 0.003 8 0 Yes
cadmium^ mg/L 0.002 8 0 Yes
cyanide^ mg/L 0.08 2 0 Yes
copper mg/L 2 28 0 Yes
lead mg/L 0.01 28 0 Yes
nitrate as NO3 mg/L 50 28 0 Yes
nitrite as NO2 mg/L 3 28 0 Yes
nickel^ mg/L 0.02 8 0 Yes
sulphate^ mg/L 500 4 0 Yes
chromium^ mg/L 0.05 (as Cr(VI))** 8 0 Yes
manganese mg/L 0.5 120 0 Yes
cyanogen chloride mg/L 0.08 1 0 Yes
n-nitrosodimethylamine^
mg/L 0.0001 3 0 Yes
total trihalomethanes mg/L 0.25 36 0 The 95th percentile statistic
calculated for combined customer supply system and WFP less than 0.25mg/L
Yes
* Although the ADWG specifies a guideline value for Fluoride of 1.5 mg/L, the Fluoridation of Public Water Supplies Act 1957 requires that, over a year, greater than 95% of all routine samples fall within the range 0.90 to 1.50 mg/L. ** The ADWG sets a guideline value for hexavalent chromium (Cr(VI)) however Sydney Water measures total chromium which includes hexavalent chromium. ^ Insufficient data to calculate 95th percentile.
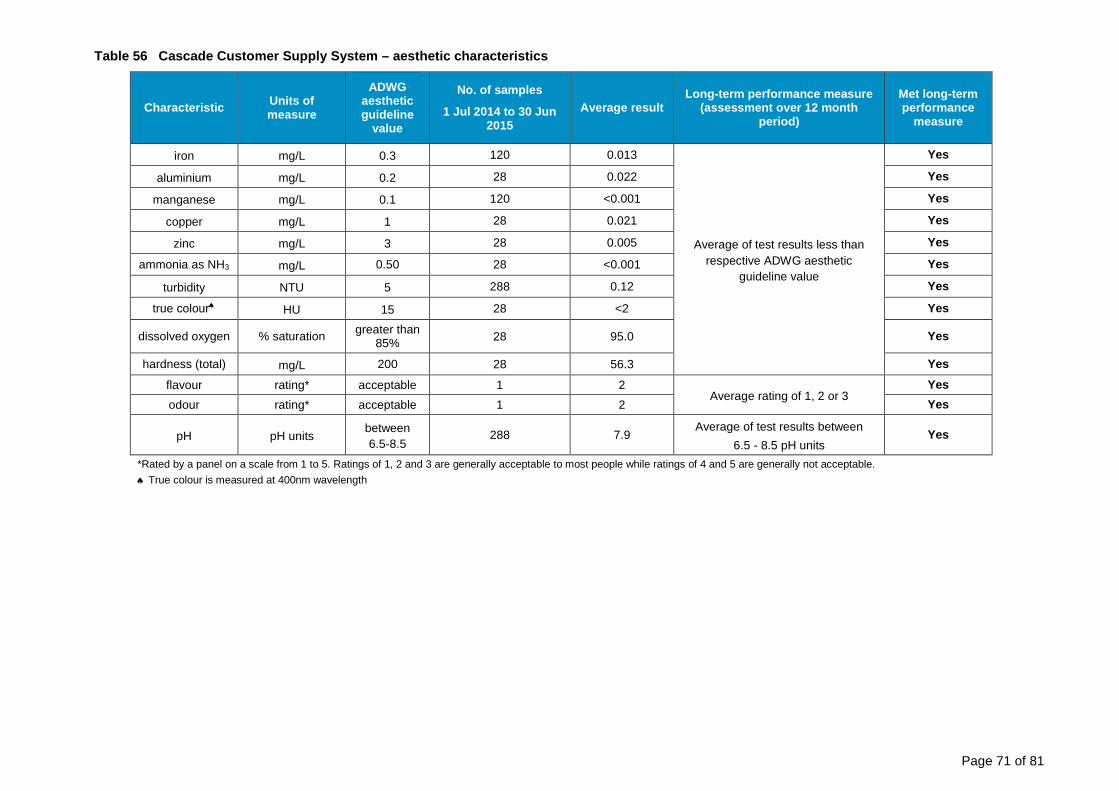
Page 71 of 81
Table 56 Cascade Customer Supply System – aesthetic characteristics
Characteristic Units of measure
ADWG aesthetic guideline
value
No. of samples
1 Jul 2014 to 30 Jun 2015
Average result Long-term performance measure
(assessment over 12 month period)
Met long-term performance
measure
iron mg/L 0.3 120 0.013
Average of test results less than respective ADWG aesthetic
guideline value
Yes
aluminium mg/L 0.2 28 0.022 Yes manganese mg/L 0.1 120 <0.001 Yes
copper mg/L 1 28 0.021 Yes zinc mg/L 3 28 0.005 Yes
ammonia as NH3 mg/L 0.50 28 <0.001 Yes turbidity NTU 5 288 0.12 Yes
true colour♠ HU 15 28 <2 Yes
dissolved oxygen % saturation greater than 85% 28 95.0 Yes
hardness (total) mg/L 200 28 56.3 Yes flavour rating* acceptable 1 2
Average rating of 1, 2 or 3 Yes
odour rating* acceptable 1 2 Yes
pH pH units between 6.5-8.5
288 7.9 Average of test results between
6.5 - 8.5 pH units Yes
*Rated by a panel on a scale from 1 to 5. Ratings of 1, 2 and 3 are generally acceptable to most people while ratings of 4 and 5 are generally not acceptable. ♠ True colour is measured at 400nm wavelength

Page 72 of 81
4.1.12 Nepean Customer Supply System Table 57 Nepean Customer Supply System – health characteristics
Characteristic Units of measure
ADWG health guideline value
No. of samples
1 Jul 2014 to 30 Jun 2015
No of exceptions
Long-term performance measure (assessment over
12 month period)
% of test results
complying with the
guideline
Met long-term performance
measure
E. coli orgs/100mL Should not be
detected in 100mL sample
156 0 At least 98% of test results <1 100% Yes
fluoride mg/L 1.5* 120 0 At least 95% of test results
0.9 to 1.5 mg/L 100% Yes
free chlorine mg/L 5 156 0
The 95th percentile value is less than the respective ADWG health guideline value
Yes monochloramine mg/L 3 156 0 Yes
antimony^ mg/L 0.003 8 0 Yes cadmium^ mg/L 0.002 8 0 Yes cyanide^ mg/L 0.08 2 0 Yes copper mg/L 2 28 0 Yes
lead mg/L 0.01 28 0 Yes nitrate as NO3 mg/L 50 28 0 Yes nitrite as NO2 mg/L 3 28 0 Yes
nickel^ mg/L 0.02 8 0 Yes sulphate^ mg/L 500 4 0 Yes
chromium^ mg/L 0.05 (as Cr(VI))** 8 0 Yes manganese mg/L 0.5 120 0 Yes
cyanogen chloride mg/L 0.08 1 0 Yes
n-nitrosodimethylamine^ mg/L 0.0001 3 0 Yes
total trihalomethanes mg/L 0.25 24 0 The 95th percentile statistic
calculated for combined customer supply system and WFP less than 0.25mg/L
Yes
^ Insufficient data to calculate 95th percentile. * Although the ADWG specifies a guideline value for Fluoride of 1.5 mg/L, the Fluoridation of Public Water Supplies Act 1957 requires that, over a year, greater than 95% of all routine samples fall within the range 0.90 to 1.50 mg/L. ** The ADWG sets a guideline value for hexavalent chromium (Cr(VI)) however Sydney Water measures total chromium which includes hexavalent chromium.

Page 73 of 81
Table 58 Nepean Customer Supply System – aesthetic characteristics
Characteristic Units of measure
ADWG aesthetic guideline
value
No. of samples
1 Jul 2014 to 30 Jun 2015
Average result Long-term performance measure
(assessment over 12 month period)
Met long-term performance
measure
iron mg/L 0.3 120 0.021
Average of test results less than respective ADWG aesthetic
guideline value
Yes
aluminium mg/L 0.2 28 0.029 Yes manganese mg/L 0.1 120 <0.001 Yes
copper mg/L 1 28 0.012 Yes zinc mg/L 3 28 <0.005 Yes
ammonia as NH3 mg/L 0.50 28 <0.001 Yes turbidity NTU 5 156 0.13 Yes
true colour♠ HU 15 28 <2 Yes
dissolved oxygen % saturation greater than 85% 28 104.2 Yes
hardness (total) mg/L 200 28 50.9 Yes flavour rating* acceptable 1 3
Average rating of 1, 2 or 3 Yes
odour rating* acceptable 1 3 Yes
pH pH units between 6.5-8.5
156 7.6 Average of test results between
6.5 - 8.5 pH units Yes
*Rated by a panel on a scale from 1 to 5. Ratings of 1, 2 and 3 are generally acceptable to most people while ratings of 4 and 5 are generally not acceptable. ♠ True colour is measured at 400nm wavelength
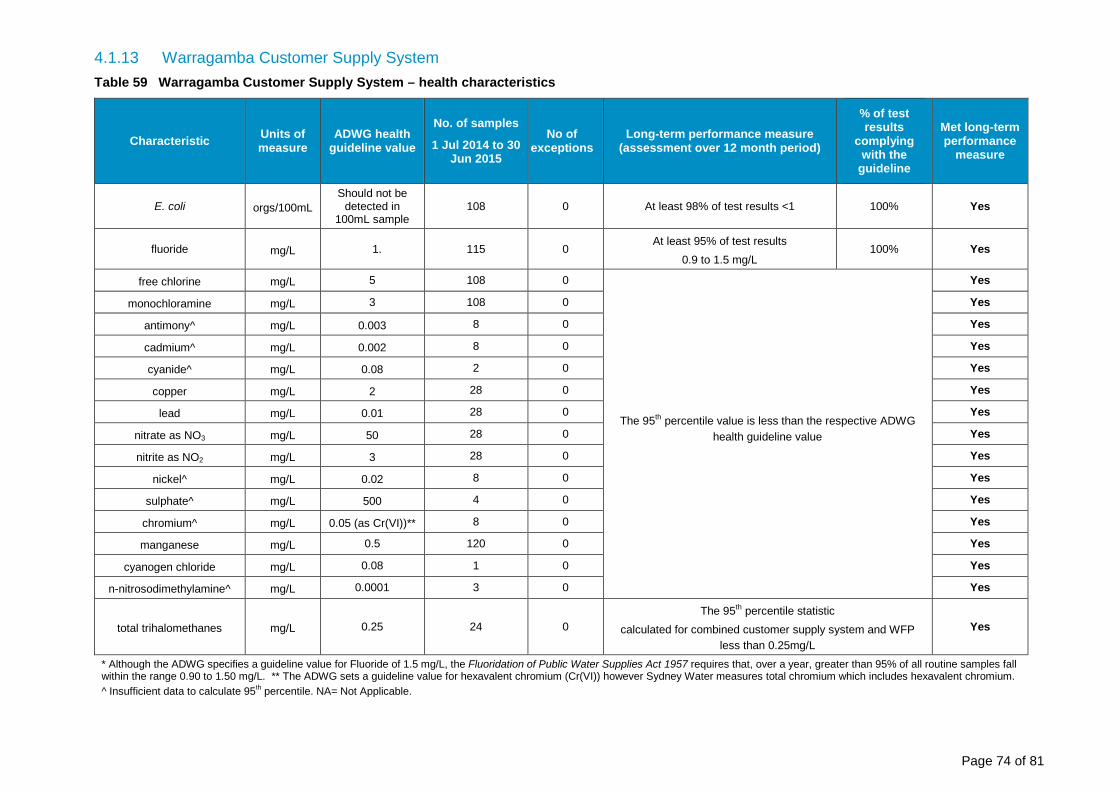
Page 74 of 81
4.1.13 Warragamba Customer Supply System Table 59 Warragamba Customer Supply System – health characteristics
Characteristic Units of measure
ADWG health guideline value
No. of samples
1 Jul 2014 to 30 Jun 2015
No of exceptions
Long-term performance measure (assessment over 12 month period)
% of test results
complying with the
guideline
Met long-term performance
measure
E. coli orgs/100mL Should not be
detected in 100mL sample
108 0 At least 98% of test results <1 100% Yes
fluoride mg/L 1. 115 0 At least 95% of test results
0.9 to 1.5 mg/L 100% Yes
free chlorine mg/L 5 108 0
The 95th percentile value is less than the respective ADWG health guideline value
Yes
monochloramine mg/L 3 108 0 Yes
antimony^ mg/L 0.003 8 0 Yes
cadmium^ mg/L 0.002 8 0 Yes
cyanide^ mg/L 0.08 2 0 Yes
copper mg/L 2 28 0 Yes
lead mg/L 0.01 28 0 Yes
nitrate as NO3 mg/L 50 28 0 Yes
nitrite as NO2 mg/L 3 28 0 Yes
nickel^ mg/L 0.02 8 0 Yes
sulphate^ mg/L 500 4 0 Yes
chromium^ mg/L 0.05 (as Cr(VI))** 8 0 Yes
manganese mg/L 0.5 120 0 Yes
cyanogen chloride mg/L 0.08 1 0 Yes
n-nitrosodimethylamine^ mg/L 0.0001 3 0 Yes
total trihalomethanes mg/L 0.25 24 0 The 95th percentile statistic
calculated for combined customer supply system and WFP less than 0.25mg/L
Yes
* Although the ADWG specifies a guideline value for Fluoride of 1.5 mg/L, the Fluoridation of Public Water Supplies Act 1957 requires that, over a year, greater than 95% of all routine samples fall within the range 0.90 to 1.50 mg/L. ** The ADWG sets a guideline value for hexavalent chromium (Cr(VI)) however Sydney Water measures total chromium which includes hexavalent chromium.
^ Insufficient data to calculate 95th percentile. NA= Not Applicable.

Page 75 of 81
Table 60 Warragamba Customer Supply System – aesthetic characteristics
Characteristic Units of measure
ADWG aesthetic
guideline value
No. of samples
1 Jul 2014 to 30 Jun 2015
Average result Long-term performance measure
(assessment over 12 month period)
Met long-term performance
measure
iron mg/L 0.3 120 0.011
Average of test results less than respective ADWG aesthetic
guideline value
Yes
aluminium mg/L 0.2 28 <0.010 Yes manganese mg/L 0.1 120 <0.001 Yes
copper mg/L 1 28 0.029 Yes zinc mg/L 3 28 <0.005 Yes
ammonia as NH3 mg/L 0.50 28 <0.001 Yes
turbidity NTU 5 108 0.10 Yes true colour♠ HU 15 28 <2 Yes dissolved oxygen % saturation greater than
85% 28 110.8 Yes
hardness (total) mg/L 200 28 52.2 Yes flavour rating* acceptable 1 2
Average rating of 1, 2 or 3 Yes
odour rating* acceptable 1 3 Yes
pH pH units between 6.5-8.5 108 7.9 Average of test results between
6.5 - 8.5 pH units Yes
*Rated by a panel on a scale from 1 to 5. Ratings of 1, 2 and 3 are generally acceptable to most people while ratings of 4 and 5 are generally not acceptable. ♠ True colour is measured at 400nm wavelength
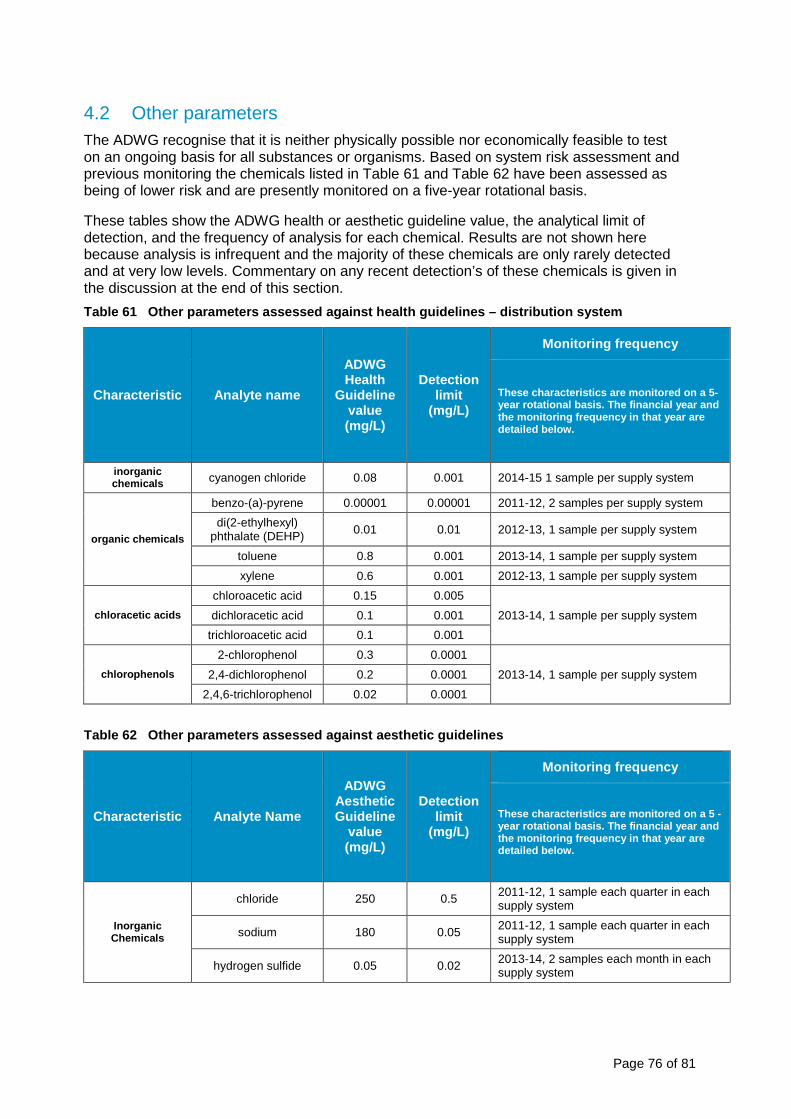
Page 76 of 81
4.2 Other parameters The ADWG recognise that it is neither physically possible nor economically feasible to test on an ongoing basis for all substances or organisms. Based on system risk assessment and previous monitoring the chemicals listed in Table 61 and Table 62 have been assessed as being of lower risk and are presently monitored on a five-year rotational basis.
These tables show the ADWG health or aesthetic guideline value, the analytical limit of detection, and the frequency of analysis for each chemical. Results are not shown here because analysis is infrequent and the majority of these chemicals are only rarely detected and at very low levels. Commentary on any recent detection’s of these chemicals is given in the discussion at the end of this section. Table 61 Other parameters assessed against health guidelines – distribution system
Characteristic Analyte name
ADWG Health
Guideline value (mg/L)
Detection limit
(mg/L)
Monitoring frequency
These characteristics are monitored on a 5-year rotational basis. The financial year and the monitoring frequency in that year are detailed below.
inorganic chemicals cyanogen chloride 0.08 0.001 2014-15 1 sample per supply system
organic chemicals
benzo-(a)-pyrene 0.00001 0.00001 2011-12, 2 samples per supply system di(2-ethylhexyl)
phthalate (DEHP) 0.01 0.01 2012-13, 1 sample per supply system
toluene 0.8 0.001 2013-14, 1 sample per supply system xylene 0.6 0.001 2012-13, 1 sample per supply system
chloracetic acids
chloroacetic acid 0.15 0.005 2013-14, 1 sample per supply system dichloracetic acid 0.1 0.001
trichloroacetic acid 0.1 0.001
chlorophenols
2-chlorophenol 0.3 0.0001 2013-14, 1 sample per supply system 2,4-dichlorophenol 0.2 0.0001
2,4,6-trichlorophenol 0.02 0.0001
Table 62 Other parameters assessed against aesthetic guidelines
Characteristic Analyte Name
ADWG Aesthetic Guideline
value (mg/L)
Detection limit
(mg/L)
Monitoring frequency
These characteristics are monitored on a 5 -year rotational basis. The financial year and the monitoring frequency in that year are detailed below.
Inorganic Chemicals
chloride 250 0.5 2011-12, 1 sample each quarter in each supply system
sodium 180 0.05 2011-12, 1 sample each quarter in each supply system
hydrogen sulfide 0.05 0.02 2013-14, 2 samples each month in each supply system
Page 77 of 81
4.3 Discussion of results for Customer Supply Systems
During the 12-month period from 1 July 2014 to 30 June 2015, all results meet the ADWG 2011 health guideline values.
Of the parameters listed in Table 61 cyanogen chloride has been monitored in the current financial year in the reticulated system and at the water filtration plants, and was not detected.
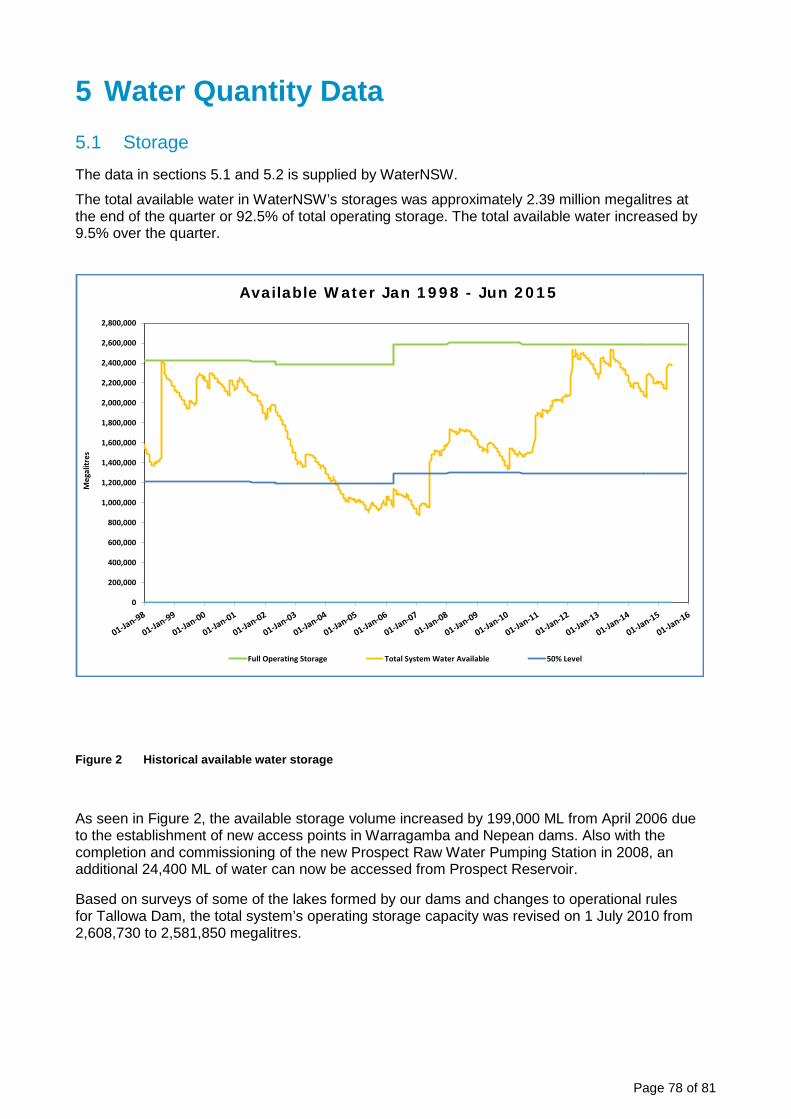
Page 78 of 81
5 Water Quantity Data 5.1 Storage The data in sections 5.1 and 5.2 is supplied by WaterNSW.
The total available water in WaterNSW’s storages was approximately 2.39 million megalitres at the end of the quarter or 92.5% of total operating storage. The total available water increased by 9.5% over the quarter.
Figure 2 Historical available water storage
As seen in Figure 2, the available storage volume increased by 199,000 ML from April 2006 due to the establishment of new access points in Warragamba and Nepean dams. Also with the completion and commissioning of the new Prospect Raw Water Pumping Station in 2008, an additional 24,400 ML of water can now be accessed from Prospect Reservoir.
Based on surveys of some of the lakes formed by our dams and changes to operational rules for Tallowa Dam, the total system’s operating storage capacity was revised on 1 July 2010 from 2,608,730 to 2,581,850 megalitres.
0
200,000
400,000
600,000
800,000
1,000,000
1,200,000
1,400,000
1,600,000
1,800,000
2,000,000
2,200,000
2,400,000
2,600,000
2,800,000
Meg
alitr
es
Full Operating Storage Total System Water Available 50% Level
Available Water Jan 1998 - Jun 2015

Page 79 of 81
Figure 3 Available Water for the Quarter
Table 63 Status of individual Storages
Full operating Water level Water
Available Water
Available Net quarter Storage * (ML) (m) (ML) (%) change (ML) Cataract 97,190 -1.98 81,527 83.9 27,975 Cordeaux 93,640 -0.87 87,018 92.9 21,052 Avon 146,700 -1.11 135,152 92.1 12,646 Nepean 67,730 -1.02 64,542 95.3 16,913 Woronora 71,790 -0.75 69,030 96.2 14,031 Warragamba 2,027,000 -1.88 1,888,110 93.1 151,155 Prospect 33,330 -0.73 29,557 88.7 199 Wingecarribee 24,130 -2.33 14,500 60.1 -649 Fitzroy Falls 9,950 -0.32 8,415 84.6 1,650 Tallowa 7,500 0.03 7,500 100.0 0 Blue Mountains 2,890 2,588 89.6 476 Total 2,581,850 2,387,939 92.5 245,448
0
200,000
400,000
600,000
800,000
1,000,000
1,200,000
1,400,000
1,600,000
1,800,000
2,000,000
2,200,000
2,400,000
2,600,000
2,800,000
1-Apr-15 10-Apr-15 20-Apr-15 30-Apr-15 10-May-15 20-May-15 30-May-15 9-Jun-15 19-Jun-15 29-Jun-15 30-Jun-15
AVAILABLE WATER APR - JUN 2015
FULL OPERATING STORAGE
AVAILABLE WATER 92.5%83.0%

Page 80 of 81
5.2 Rainfall Approximately 236 millimetres of rainfall was recorded on the Warragamba catchment during the quarter; 30.2% above the long term median for the same time of year.
Figure 4 Historical Warragamba Dam catchment rainfall
0
50
100
150
200
250
300
350
400
450
1958
1959
1960
1961
1962
1963
1964
1965
1966
1967
1968
1969
1970
1971
1972
1973
1974
1975
1976
1977
1978
1979
1980
1981
1982
1983
1984
1985
1986
1987
1988
1989
1990
1991
1992
1993
1994
1995
1996
1997
1998
1999
2000
2001
2002
2003
2004
2005
2006
2007
2008
2009
2010
2011
2012
2013
2014
2015
2016
MO
NT
HL
Y A
VE
RA
GE
RA
INF
AL
L (
mm
)
WARRAGAMBA DAM CATCHMENT RAINFALL JAN 1958 - JUN 2015
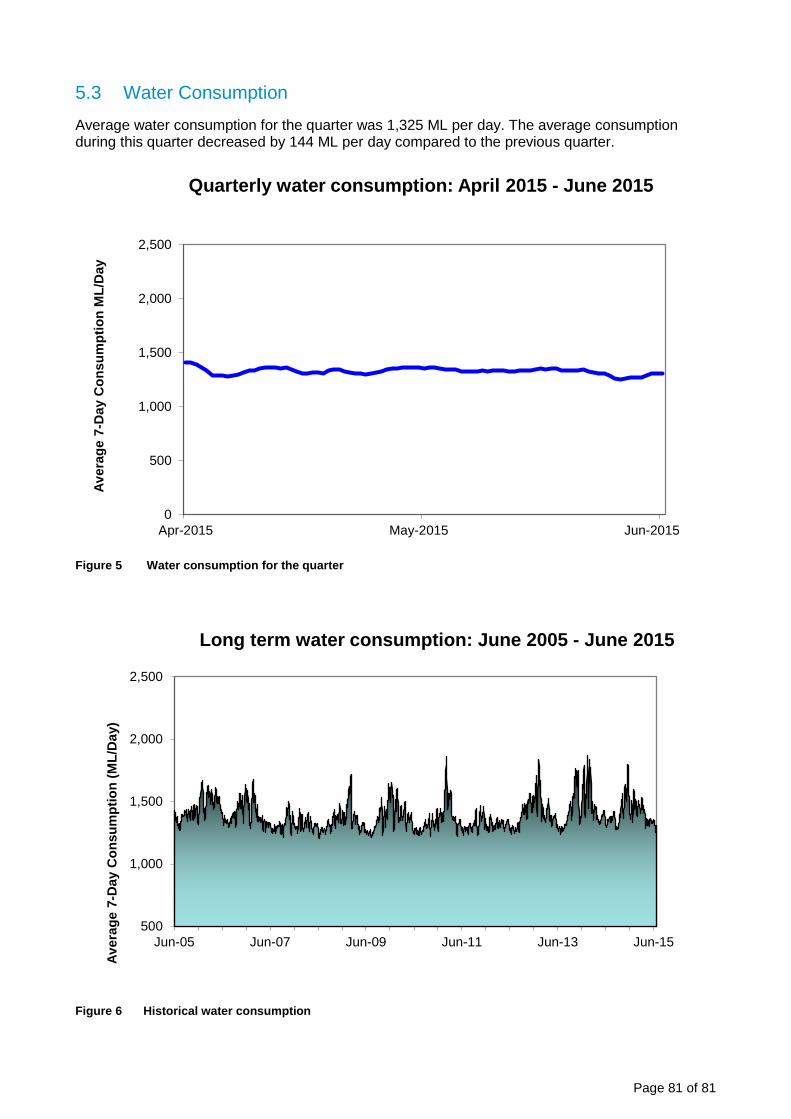
Page 81 of 81
5.3 Water Consumption
Average water consumption for the quarter was 1,325 ML per day. The average consumption during this quarter decreased by 144 ML per day compared to the previous quarter.
Figure 5 Water consumption for the quarter
Figure 6 Historical water consumption
0
500
1,000
1,500
2,000
2,500
Apr-2015 May-2015 Jun-2015
Aver
age
7-D
ay C
onsu
mpt
ion
ML/
Day
Quarterly water consumption: April 2015 - June 2015
500
1,000
1,500
2,000
2,500
Jun-05 Jun-07 Jun-09 Jun-11 Jun-13 Jun-15
Aver
age
7-D
ay C
onsu
mpt
ion
(ML/
Day
)
Long term water consumption: June 2005 - June 2015


