126
Quarterly Report June 30, 2018 Building cities — one building at a time 08.01.18

Quarterly Report June 30, 2018
Building cities — one building at a time
08.01.18

Q2 2018SANOI GROWTH 10.6%
OCCUPANCY GAIN 2.5%
RENT GROWTH ON RENEWALS AND REPLACEMENTS 22.6%
NAV/UNIT GROWTH 6.4%
DEBT RATIO AT QUARTER-END 29.9%
UNENCUMBERED ASSETS AT QUARTER-END $3.8B
COVER: YOUNES BOUNHAR, DOUBLESPACE PHOTOGRAPHY

Quarterly Report
August 1, 2018

Contents LETTER TO UNITHOLDERS . . . . . . . . . . . . 4
MANAGEMENT’S DISCUSSION AND ANALYSIS OF RESULTS OF OPERATIONS AND FINANCIAL CONDITION AS AT JUNE 30, 2018 . . . . . . . . . . . . . . . . . . . . . . . 8
SECTION I—Overview . . . . . . . . . . . . . . . . . . 9
Summary of Key Financial and
Operating Performance Measures . . . . . . . . . . . . . 12
Business Overview and Strategy . . . . . . . . . . . . . . 14
Property Management . . . . . . . . . . . . . . . . . . . . . . . 15
Property Portfolio . . . . . . . . . . . . . . . . . . . . . . . . . . 15
Acquisitions & Dispositions . . . . . . . . . . . . . . . . . . 16
Corporate Social Responsibility . . . . . . . . . . . . . . . 17
Business Environment and Outlook . . . . . . . . . . . . 17
SECTION II—Leasing . . . . . . . . . . . . . . . . . 18
Status . . . . . . . . . . . . . . . . . . . . . . . . . . . . . . . . . . . . 19
Activity . . . . . . . . . . . . . . . . . . . . . . . . . . . . . . . . . . . 21
Tenant Profile . . . . . . . . . . . . . . . . . . . . . . . . . . . . . . 22
Lease Maturity . . . . . . . . . . . . . . . . . . . . . . . . . . . . . 23
SECTION III—Asset Profile . . . . . . . . . . . . . 26
Rental Properties . . . . . . . . . . . . . . . . . . . . . . . . . . . 28
Development Properties . . . . . . . . . . . . . . . . . . . . . 31
Residential Inventory . . . . . . . . . . . . . . . . . . . . . . . . 34
Development Completions . . . . . . . . . . . . . . . . . . . 34
Loans Receivable . . . . . . . . . . . . . . . . . . . . . . . . . . . 36
SECTION IV—Liquidity and Capital Resources . . . . . . . . . . . . . . . . . . . . . . 37
Debt . . . . . . . . . . . . . . . . . . . . . . . . . . . . . . . . . . . . . 38
Credit Ratings . . . . . . . . . . . . . . . . . . . . . . . . . . . . . 43
Financial Covenants . . . . . . . . . . . . . . . . . . . . . . . . . 44
Unitholders’ Equity . . . . . . . . . . . . . . . . . . . . . . . . . 45
Distributions to Unitholders . . . . . . . . . . . . . . . . . . 47
Commitments . . . . . . . . . . . . . . . . . . . . . . . . . . . . . . 48
SECTION V—Discussion of Operations . . . . . . 49
Net Income and Comprehensive Income . . . . . . . . 49
Net Operating Income . . . . . . . . . . . . . . . . . . . . . . . 50
Same Asset NOI . . . . . . . . . . . . . . . . . . . . . . . . . . . . 53
Interest Expense . . . . . . . . . . . . . . . . . . . . . . . . . . . 55
General and Administrative Expenses . . . . . . . . . . 56
Other Financial Performance Measures . . . . . . . . . 56
SECTION VI—Historical Performance . . . . . . . 63
SECTION VII— Accounting Estimates and Assumptions . . . . . . . . . . . . . . . . . . . . . . 66
SECTION VIII—Disclosure Controls and Internal Controls . . . . . . . . . . . . . . . . . . . . . . 67
SECTION IX—Risks and Uncertainties . . . . . . . 68
Financing and Interest Rate Risk . . . . . . . . . . . . . . 69
Credit Risk . . . . . . . . . . . . . . . . . . . . . . . . . . . . . . . . 70
Lease Roll-Over Risk . . . . . . . . . . . . . . . . . . . . . . . . 71
Environmental and Climate Change Risk . . . . . . . . 72
Development Risk . . . . . . . . . . . . . . . . . . . . . . . . . . 72
Taxation Risk . . . . . . . . . . . . . . . . . . . . . . . . . . . . . . 73
Joint Arrangement Risk . . . . . . . . . . . . . . . . . . . . . . 73
Cybersecurity Risk . . . . . . . . . . . . . . . . . . . . . . . . . . 73
Real Estate Risk . . . . . . . . . . . . . . . . . . . . . . . . . . . . 73
SECTION X—Property Table . . . . . . . . . . . . . . . 74
UNAUDITED CONDENSED CONSOLIDATED FINANCIAL STATEMENTS FOR THE THREE AND SIX MONTHS ENDED JUNE 30, 2018 AND 2017 . . . . . . . 80
Unaudited Condensed Consolidated
Balance Sheets . . . . . . . . . . . . . . . . . . . . . . . . . . . . 81
Unaudited Condensed Consolidated Statements
of Income and Comprehensive Income . . . . . . . . . 82
Unaudited Condensed Consolidated Statements
of Unitholders’ Equity . . . . . . . . . . . . . . . . . . . . . . . 83
Unaudited Condensed Consolidated Statements
of Cash Flows . . . . . . . . . . . . . . . . . . . . . . . . . . . . . . 84
Notes to the Unaudited Condensed Consolidated
Financial Statements . . . . . . . . . . . . . . . . . . . . . . . 86
4 ALLIED PROPERTIES REIT Q2 2018 QUARTERLY REPORT
Letter to Unitholders
Dear Fellow Unitholder:
Our operating and development environments have been particularly supportive in 2018, and our team took advantage of the favourable conditions to deliver solid results in the second quarter and first half of the year. In the quarter, we continued to propel strong organic growth in our rental portfolio and made substantial progress in our development portfolio. In addition, we continued the ongoing strengthening of our debt-metrics, which will enable us to execute our development program over the next five years with added financial flexibility and discipline.
OPERATIONS AND LEASING
Driven by occupancy gain and rent growth in Toronto and Montréal, our same-asset NOI was up 10% from the comparable quarter last year, underpinning 15% growth in our Normalized AFFO per unit. Driven largely by the recent completion of upgrade properties in Montréal and rent growth in Toronto, our NAV per unit at the end of the quarter was up 6% from the end of the comparable quarter last year.
In the first half of the year, we increased the occupied area of our rental portfolio by 140 basis points to 94.9% and increased leased area by 20 basis points to 95.4%. We also renewed or replaced leases for 83% of the space that matured in the period. This resulted in an overall increase of 23% in net rent per square foot from the affected space.
DEVELOPMENT
We expect to allocate $1.2 billion to our urban development program from the beginning of this year to the end of 2022, with approximately $300 million being allocated in each of 2018, 2019 and 2020 and a much smaller amount in each of 2021 and 2022. We now expect to complete eight urban development projects within that timeframe with aggregate GLA (at our share) of approximately 2.3 million square feet, 175,000 of which will be in Vancouver, 316,000 in Calgary, 300,000 in Montréal and the balance (approximately 1.5 million) in Toronto.

5ALLIED PROPERTIES REIT Q2 2018 QUARTERLY REPORT
Our overriding development priority for 2018 was to pre-lease a significant portion of the office component of The Well in Toronto, a 50/50 joint venture with RioCan. We recently pre-leased 325,000 square feet of GLA, representing 30% of the 1.07 million square feet of office GLA at The Well. We’re now finalizing lease transactions with two other tenants for 533,752 square feet of office GLA, which would bring the leased area to 80%.
Another important priority was to pre-lease a significant portion of 400 West Georgia in Vancouver. (Having provided Westbank with financing for this development, we’re obligated to acquire an undivided 50% interest at cost upon placement of permanent mortgage financing, which is scheduled for late 2020.) Westbank recently pre-leased 117,000 square feet of GLA to Deloitte for a term of 15 years commencing in late 2020. This represents 33% of the total GLA in the development. Westbank is now working toward finalizing leases with two other high-calibre tenants for 165,000 square feet of GLA, which would bring the leased area to 80%.
TELUS Sky in Calgary is an equal three-way joint venture with Westbank and TELUS. Now proceeding toward completion in mid-2019, it will be comprised of 429,000 square feet of office GLA, 15,000 square feet of retail GLA, 326 rental apartments and 333 underground parking spaces. TELUS has pre-leased 143,000 square feet of GLA, representing 33% of the office space. Despite the cyclical downturn in the Calgary office market, the joint venture is beginning to make progress in leasing the remaining 286,000 square feet of office space. Negotiations are underway with three potential tenants with requirements aggregating 120,000 square feet of GLA.
I expect our development environment to be favourable for the remainder of the year and beyond. We’ve initiated the expansion and retrofitting of 425 Viger in Montréal. The timing appears to be opportune, as there’s substantial demand for the 300,000 square feet of GLA that will be created through this redevelopment. Completion is scheduled for 2020. We expect to initiate the development of 489-539 King West with Westbank and 540-544 King West with Great Gulf in the latter half of this year. I expect we’ll complete both projects in 2022.
CARRIER HOTELS IN TORONTO
When we acquired 151 Front West in 2009, we took the position publicly that we were not “getting into the data-centre business”. The expansion to 905 King West (now 93% occupied) and 250 Front West (now 61% occupied and 64% leased) did not contradict that position. Rather, these facilities were developed as extensions of 151 Front West.
What we often describe as “mission-critical facilities” are not mission-critical to us, though they are to many of the users of the facilities. They are also not “data centres”. They’re more aptly described as “carrier hotels”. They serve as major points of urban interconnection and have much more in common with specialized urban office properties than they do with data centres. As the interconnections become denser, carrier hotels become more valuable to both users and owners.
A data centre is analogous to an interchange on a small highway. It’s valuable, but easy to replicate. A carrier hotel is analogous to a massive interchange on an intersecting series of super-highways. It’s exceptionally valuable and very difficult to replicate. Having become critical components of Canada’s communications infrastructure, our carrier hotel assets are exceptionally valuable and essentially impossible to replicate.

6 ALLIED PROPERTIES REIT Q2 2018 QUARTERLY REPORT
Much has changed since 2009, all of it favourable to Allied as the owner of 151 Front West and its extensions. In the broader market, the value of comparable facilities in the US and elsewhere is rising, as evidenced by transactions concluded last year. Similarly, the revenue-generating potential is increasing significantly and continuously (which, of course, is the main reason values are rising). Operating these assets is not fundamentally different from operating urban office properties designed for people, which was our initial core competency. After nine years of operating 151 Front West very successfully, we know (i) that we have the necessary competence and (ii) that the assets compliment the remainder of our urban office portfolio in Toronto.
By acquiring 151 Front West, we put ourselves at the Canadian epicentre of an important global trend. Despite repeated suggestions that we monetize our carrier hotel assets in the interest of capital recycling, I believe that disposing of these assets would be irresponsible and tantamount to squandering an opportunity the magnitude of which isn’t currently quantifiable. Furthermore, we are now evaluating the possibility of increasing our exposure to assets where urban real estate and communications technology intersect. I believe we can do this credibly and without altering the risk-profile of our business. I also believe the NOI-margin on this activity could be high. Finally, this will not involve the kind of speculative development we engaged in at 250 Front West, but rather would be immediately accretive to our earnings per unit (and probably meaningfully accretive over time to our NAV per unit.)
Increasing our exposure to assets where urban real estate and communications technology intersect is an exploration we are undertaking, not a definitive position we have established. Our goal is to formulate a detailed and credible plan that we can review with our Board and our constituents in due course. And to repeat what I said explicitly in 2009, we’re definitely not getting into the data-centre business. We are, however, evaluating the possibility of augmenting our extraordinary “carrier hotel” asset base in a manner that doesn’t alter the risk-profile of our business.
OUTLOOK
Allied is intent on remaining a preferred public vehicle through which to participate in the urban-intensification trend in Canada’s major cities. Despite the strength and durability of this trend, we’re equally intent on retaining an industry-leading balance sheet. At the end of the second quarter, our total indebtedness ratio was 30% and our net debt as a multiple of EBITDA was 6.9:1, both among the strongest in the Canadian REIT universe. As our commitment to the balance sheet remains unwavering, our goal is to maintain these important debt metrics over the course of the year and beyond.
Looking forward, I expect our operating, acquisition and development environments to remain supportive this year. Our internal forecast contemplates (i) solid mid-single-digit percentage growth in same-asset NOI, (ii) low-single-digit percentage growth in FFO per unit and (iii) high-single-digit percentage growth in AFFO per unit. I expect continued growth in NAV per unit over the remainder of the year, with significant contribution from development completions, ongoing rent escalation and ongoing cap-rate strength in Canada’s major urban centres.

7ALLIED PROPERTIES REIT Q2 2018 QUARTERLY REPORT
Michael Emory president and chief executive officer
I remain confident in our near-term and longer-term outlook. My confidence is predicated on the continued intensification of the urban core of Canada’s major cities and the continued desire on the part of office and retail users to locate in distinctive urban environments. It is also underpinned by the depth and strength of the Allied team and the team’s ability to execute our strategy at all levels.
* * *
If you have any questions or comments, please don’t hesitate to call me at (416) 977-0643 or e-mail me at [email protected].
Yours truly,

8 ALLIED PROPERTIES REIT Q2 2018 QUARTERLY REPORT
Management’s Discussion and Analysis of Results of Operations and Financial Condition as at June 30, 2018

9ALLIED PROPERTIES REIT Q2 2018 QUARTERLY REPORT
Section I —Overview
This Management’s Discussion and Analysis (“MD&A”) of results of operations and financial condition relates to the quarter ended June 30, 2018. Unless the context indicates otherwise, all references to “Allied”, “the Trust”, “we”, “us” and “our” in this MD&A refer to Allied Properties Real Estate Investment Trust. The Board of Trustees of Allied, upon the recommendation of its Audit Committee, approved the contents of this MD&A.
This MD&A has been prepared with an effective date of August 1, 2018, and should be read in conjunction with the unaudited condensed consolidated financial statements and notes thereto for the quarter ended June 30, 2018, and Allied’s 2017 Annual Report. This MD&A is based on financial statements prepared in accordance with International Financial Reporting Standards (“IFRS”). Historical results and percentage relationships contained in this MD&A, including trends that might appear, should not be taken as indicative of future results, operations or performance. Unless otherwise indicated, all amounts in this MD&A are in thousands of Canadian dollars.
NON-IFRS MEASURES
Readers are cautioned that certain terms used in the MD&A such as Funds from Operations (“FFO”), Normalized Funds from Operations (“Normalized FFO”), Adjusted Funds from Operations (“AFFO”), Normalized Adjusted Funds from Operations (“Normalized AFFO”), Net Operating Income (“NOI”), “Same Asset NOI”, Net Asset Value (“NAV”), Gross Book Value (“GBV”), Earnings Before Interest, Taxes, Depreciation and Amortization (“EBITDA”), Adjusted Earnings Before Interest, Taxes, Depreciation and Amortization (“Adjusted EBITDA”), “Payout Ratio”, “Interest Coverage”, “Net Debt to Adjusted EBITDA” and any related per unit amounts used by Management of Allied to measure, compare and explain the operating results and financial performance of Allied do not have any standardized meaning prescribed under IFRS and, therefore, should not be construed as alternatives to net income or cash flow from operating activities calculated in accordance with IFRS. These terms are defined in the MD&A and reconciled to the unaudited condensed consolidated financial statements of Allied for the quarter ended June 30, 2018. Such terms do not have a standardized meaning prescribed by IFRS and may not be comparable to similarly titled measures presented by other publicly traded entities. See “Other Financial Performance Measures”, “Net Operating Income”, “Debt” and “Financial Covenants”.

10 ALLIED PROPERTIES REIT Q2 2018 QUARTERLY REPORT
FORWARD LOOKING STATEMENTS
Certain information included in this MD&A contains forward-looking statements within the meaning of applicable securities laws, including, among other things, statements concerning Allied’s objectives and strategies to achieve those objectives, statements with respect to Management’s beliefs, plans, estimates and intentions and statements concerning anticipated future events, circumstances, expectations, results, operations or performance that are not historical facts. Forward-looking statements can be identified generally by the use of forward-looking terminology, such as “indicators”, “outlook”, “objective”, “may”, “will”, “expect”, “intend”, “estimate”, “anticipate”, “believe”, “should”, “plans”, “continue” or similar expressions suggesting future outcomes or events. In particular, certain statements in the Letter to Unitholders, Section I—Overview, under the headings “Business Overview and Strategy”, “Corporate Social Responsibility” and “Business Environment and Outlook”, Section III—Asset Profile, under the headings “Rental Properties”, and “Development Properties” and Section IV—Liquidity and Capital Resources, constitute forward looking information. This MD&A includes, but is not limited to, forward-looking statements regarding: closing dates of proposed acquisitions; completion of construction and lease-up in connection with Properties Under Development (“PUDs”); growth of our normalized FFO and normalized AFFO per unit; continued demand for space in our target markets; increase in net rental income per square feet of gross leasable area (“GLA”); ability to extend lease terms; the creation of future value; estimated GLA, NOI and growth from PUDs; estimated costs of PUDs; future economic occupancy; return on investments, including yield on cost of PUDs; estimated rental NOI and anticipated rental rates; lease up of our intensification projects; anticipated available square feet of leasable area; Management’s plans to put additional buildings forward for certification; our ability to achieve risk-adjusted returns on intensification; receipt of municipal approval for value-creation projects, including intensifications; and completion of future financings and availability of capital. Such forward-looking statements reflect Management’s current beliefs and are based on information currently available to Management.
The forward-looking statements in this MD&A are not guarantees of future results, operations or performance and are based on estimates and assumptions that are subject to risks and uncertainties, including those described in Section IX - Risks and Uncertainties, which could cause actual results, operations or performance to differ materially from the forward-looking statements in this MD&A. Those risks and uncertainties include risks associated with property ownership, property development, geographic focus, asset-class focus, competition for real property investments, financing and interest rates, government regulations, environmental matters, construction liability, taxation and cybersecurity. Material assumptions that were made in formulating the forward-looking statements in this MD&A include the following: that our current target markets remain stable, with no material increase in supply of directly-competitive office space; that acquisition capitalization rates remain reasonably constant; that the trend toward intensification within our target markets continues; and that the equity and debt markets continue to provide us with access to capital at a reasonable cost to fund our future growth and potentially refinance our mortgage debt as it matures. Although the forward-looking statements contained in this MD&A are based on what Management believes are reasonable assumptions, there can be no assurance that actual results, operations or performance will be consistent with these statements.
11ALLIED PROPERTIES REIT Q2 2018 QUARTERLY REPORT
All forward-looking statements in this MD&A are qualified in their entirety by this forward-looking disclaimer. Without limiting the generality of the foregoing, the discussion in the Letter to Unitholders, Section I— Overview and Section III—Asset Profile are qualified in their entirety by this forward-looking disclaimer. These statements are made as of August 1, 2018, and, except as required by applicable law, Allied undertakes no obligation to update publicly or revise any such statements to reflect new information or the occurrence of future events or circumstances.

12 ALLIED PROPERTIES REIT Q2 2018 QUARTERLY REPORT
SUMMARY OF KEY FINANCIAL AND OPERATING PERFORMANCE MEASURES
The following table summarizes the key financial and operating performance measures for the periods listed below:
Portfolio
Number of properties (1) (2) 147 157 147
Total rental GLA (000’s of square feet) 10,940 11,805 11,268
Leased rental GLA (000’s of square feet) 10,435 11,000 10,728
Leased area 95.4% 93 .2% 95 .2%
Occupied area 94.9% 92 .4% 93 .5%
Average in-place net rent per occupied square foot (period-end) 22.41 21 .67 22 .52
Renewal and replacement rate for leases maturing in the period 82.8% 80 .9% 84 .7%
Increase in net rent on maturing leases 22.6% 21 .9% 17 .8%
Investment properties 5,886,980 5,444,426 5,627,439
Total assets 6,098,364 5,536,974 5,823,632
Cost of PUD as % of GBV 9.5% 5 .6% 6 .5%
Unencumbered investment properties 3,793,240 2,563,295 2,925,135
Total debt 1,808,302 2,062,989 1,959,877
Net asset value 3,961,304 3,158,121 3,549,022
Annualized Adjusted EBITDA 264,092 250,680 262,030 245,166 252,753
Net debt 1,806,222 2,052,362 1,806,222 2,052,362 1,953,829
Net debt as a multiple of Annualized Adjusted EBITDA 6.8x 8 .2x 6.9x 8 .4x 7 .7x
Adjusted EBITDA 66,023 62,670 131,015 122,583 252,753
Interest expense (3) 15,860 17,935 31,786 33,775 69,265
Adjusted EBITDA as a multiple of interest expense 4.2x 3 .5x 4.1x 3 .6x 3 .6x
Rental revenue from investment properties 106,983 103,134 213,877 205,245 419,263
NOI 66,917 60,903 133,074 120,771 250,344
Same Asset NOI - rental portfolio 64,557 58,477 128,314 115,989 216,383
Same Asset NOI - total portfolio 65,835 60,150 130,774 119,504 229,589
Net income excluding loss on disposal and fair value adjustments 34,982 37,012 76,672 73,102 148,516
Net income 113,652 113,081 198,352 192,948 357,959
JUNE 30, 2018
JUNE 30, 2018
JUNE 30, 2017
JUNE 30, 2017
DECEMBER 31, 2017
YEAR ENDEDTHREE MONTHS ENDED SIX MONTHS ENDED
($000’s except per-square foot, per-unit and financial ratios)

13ALLIED PROPERTIES REIT Q2 2018 QUARTERLY REPORT
(1) During Q1 2018, King & Spadina, which is composed of six properties (489 King W, 495 King W, 499 King W, 511-529 King W, 533 King W and 539 King W), was transferred to PUD as one grouping of properties.
(2) During Q1 2018, 1700 St Patrick was transferred out of PUD and is now included with 1655 and 1751 Richardson to compose the grouping of Le Nordelec properties.
(3) Excluding a one-time extraordinary item related to $7,502 of yield maintenance cost incurred on the early repayment of the first mortgage on 151 Front Street West, Toronto.
FFO 43,750 45,624 93,785 90,354 187,204
Normalized FFO (3) 51,252 45,624 101,287 90,354 187,204
Normalized AFFO (3) 42,610 33,587 83,425 67,699 139,668
Distributions 37,210 32,506 73,463 64,934 135,177
Per unit:
Net income excluding loss on disposal and fair value adjustments 0.37 0 .44 0.82 0 .86 1 .69
Net income 1.21 1 .33 2.12 2 .27 4 .07
FFO 0.47 0 .54 1.00 1 .06 2 .13
Normalized FFO (3) 0.55 0 .54 1.08 1 .06 2 .13
Normalized FFO payout ratio (3) 72.6% 71 .2% 72.5% 71 .9% 72 .2%
Normalized AFFO (3) 0.45 0 .39 0.89 0 .80 1 .59
Normalized AFFO payout ratio (3) 87.3% 96 .8% 88.1% 95 .9% 96 .8%
Distributions 0.39 0 .38 0.78 0 .77 1 .53
Net asset value 39.50 37 .14 38 .19
Actual Units outstanding 100,274,974 85,038,454 92,935,150
Weighted average diluted Units outstanding 93,868,833 85,073,714 93,486,243 84,972,290 88,006,010
Financial Ratios ALLIED’S TARGETS
Total indebtedness ratio <35% 29.9% 37 .3% 33 .8%
Secured indebtedness ratio <45% 14.2% 20 .1% 17 .4%
Debt service coverage ratio >1.50x 2.0x 1 .8x 2 .0x
Unencumbered property asset ratio >1.40x 4.0x 2 .7x 3 .1x
Interest-coverage ratio - including interest capitalized >3.0x 2.9x 2 .7x 2 .8x
JUNE 30, 2018
JUNE 30, 2018
JUNE 30, 2017
JUNE 30, 2017
DECEMBER 31, 2017
YEAR ENDEDTHREE MONTHS ENDED SIX MONTHS ENDED
($000’s except per-square foot, per-unit and financial ratios)

14 ALLIED PROPERTIES REIT Q2 2018 QUARTERLY REPORT
BUSINESS OVERVIEW AND STRATEGY
Allied is an unincorporated closed-end real estate investment trust created pursuant to the Declaration of Trust (“Declaration”) dated October 25, 2002, as amended and restated from time to time, most recently May 12, 2016. Allied is governed by the laws of Ontario. Allied’s units (“Units”) are publicly traded on the Toronto Stock Exchange under the symbol “AP.UN’’. Additional information on Allied, including its annual information form, is available on SEDAR at www.sedar.com.
Allied is a leading owner, manager and developer of distinctive urban workspace in Canada’s major cities. Allied’s objectives are to provide stable and growing cash distributions to unitholders and to maximize Unitholder value through effective management and accretive portfolio growth.
Allied specializes in an office format created through the adaptive re-use of light industrial structures in urban areas that has come to be known as Class I, the “I” stemming from the original industrial nature of the structures. This format typically features high ceilings, abundant natural light, exposed structural frames, interior brick and hardwood floors. When restored and retrofitted to the standards of Allied’s portfolio, Class I buildings can satisfy the needs of the most demanding office and retail tenants. When operated in the coordinated manner of Allied’s portfolio, these buildings become a vital part of the urban fabric and contribute meaningfully to a sense of community.
The Class I value proposition includes (i) proximity to central business districts in areas well served by public transportation, (ii) distinctive internal and external environments that assist tenants in attracting, retaining and motivating employees and (iii) significantly lower overall occupancy costs than those that prevail in the central business districts. This value proposition has proven appeal to a diverse base of business tenants, including the full range of service and professional firms, telecommunications and information technology providers, media and film groups and storefront retailers.
In addition to accommodating their employees in urban office space, many of Allied’s tenants utilize sophisticated and extensive telecommunication and computer equipment. This is often a mission-critical need for our tenants. In an effort to serve this related need, Allied established extensive capability in downtown Toronto through the acquisition of 151 Front Street West, the leading telecommunication interconnection point in Canada. Allied has since expanded its capability by retrofitting a portion of 905 King Street West and a portion of 250 Front Street West with a view to serving its tenants’ space requirements more fully.

15ALLIED PROPERTIES REIT Q2 2018 QUARTERLY REPORT
PROPERTY MANAGEMENT
Allied’s wholly owned subsidiary, Allied Properties Management Limited Partnership, provides property management and related services on a fee-for-services basis.
PROPERTY PORTFOLIO
Allied completed its initial public offering on February 20, 2003, at which time it had assets of $120 million, a market capitalization of $62 million and a local, urban-office portfolio of 820,000 square feet of GLA. As of June 30, 2018, Allied had assets of $6.1 billion, a market capitalization of $4.2 billion and rental properties with 10.9 million square feet of GLA in seven cities across Canada. The illustration below depicts the geographic diversity of Allied’s rental portfolio.

16 ALLIED PROPERTIES REIT Q2 2018 QUARTERLY REPORT
464 King Street West, Toronto (2) January 18, 2018 $7,529 — — —
812-11th Avenue SW, Calgary (3) January 25, 2018 1,750 — 5,482 5,482
137 George Street, Toronto January 30, 2018 1,110 750 750 1,500
731 10th Avenue SW, Calgary (3) February 12, 2018 5,970 — 10,433 10,433
305 Joseph Street, Kitchener (4) June 21, 2018 888 — — —
Total $17,247 750 16,665 17,415
ACQUISITION DATE
ACQUISITION COST (1)
OFFICE GLA
RETAIL GLA
TOTAL GLAPROPERTY
ACQUISITIONS AND DISPOSITIONS
During the six months ended June 30, 2018, Allied acquired the following properties:
(1) Purchase price plus transaction costs.
(2) 464 King Street West is a parking lot containing 12 spaces.
(3) These properties form a 50/50 co-ownership with First Capital.
(4) 305 Joseph Street is a parking lot containing 75 spaces.
During the six months ended June 30, 2018, Allied did not dispose of any investment properties.

17ALLIED PROPERTIES REIT Q2 2018 QUARTERLY REPORT
CORPORATE SOCIAL RESPONSIBILITY
Allied is committed to sustainability as it relates to the physical environment within which it operates. Most of Allied’s buildings were created through the adaptive re-use of structures built over a century ago. They are recycled buildings and the recycling has considerably less impact on the environment than new construction of equivalent GLA. To the extent Allied undertakes new construction through development or intensification, it is committed to obtaining LEED certification. LEED certification is a program administered by the Canada Green Building Council for certifying the design, construction and operation of high-performance green buildings.
The ongoing operation of our buildings also affects the physical environment. Allied is committed to obtaining BOMA BESt certification for as many of its existing buildings as possible. Certification is based on an independent assessment of key areas of environmental performance and management. Level 1 certification involves independent verification that all BOMA BESt practices have been adopted. Level 2 through to Level 4 involve progressively better assessments of environmental performance and management. Allied has six properties with Level 2 certification, seven properties with Level 3 certification and six properties with Level 4 certification, with plans to put additional buildings forward for certification on an annual basis.
Allied is also attentive to the impact of its business on the human environment. Allied’s investment and development activities can have a displacing impact on members of the artistic community. As building inventory in an area is improved, the cost of occupancy can become prohibitive. Allied believes that its buildings and tenants are best served if artists remain viable members of the surrounding communities. Accordingly, Allied has made a practice of allocating an appropriate portion of its rentable area to artistic uses on an affordable basis as part of its Make Room for the Arts program, the most recent example of this being the lease of over 200,000 square feet of GLA to Pied Carré at 5445-5455 de Gaspé in Montréal for a 30-year term. What Allied foregoes in short-term rent, it more than makes up in overall occupancy and net rent levels at other properties in the surrounding communities. Allied sees this as an important part of its corporate social responsibility.
BUSINESS ENVIRONMENT AND OUTLOOK
As at June 30, 2018, Allied operated in seven urban markets in Canada – Toronto, Kitchener, Ottawa, Montréal, Calgary, Edmonton and Vancouver.
Allied expects its operating, acquisition and development environments to remain supportive this year. Allied’s internal forecast contemplates (i) solid mid-single-digit percentage growth in same-asset NOI, (ii) low-single-digit percentage growth in FFO per unit and (iii) high-single-digit percentage growth in AFFO per unit. Allied expects continued growth in NAV per unit over the remainder of the year, with significant contribution from development completions, ongoing rent escalation and ongoing cap-rate strength in Canada’s major urban centres.
Allied’s internal forecast is predicated on the continued intensification of the urban core of Canada’s major cities and the continued desire on the part of office and retail users to locate in distinctive urban environments. It is also underpinned by the depth and strength of the Allied team and the team’s ability to execute our strategy at all levels.

18 ALLIED PROPERTIES REIT Q2 2018 QUARTERLY REPORT
Section II —Leasing

19ALLIED PROPERTIES REIT Q2 2018 QUARTERLY REPORT
Leased area (occupied & committed)
December 31, 2017 10,727,779 95.2%
Vacancy committed for future leases (189,075)
Occupancy - December 31, 2017 10,538,704 93.5%
Previous committed vacant space now occupied 188,512
New leases and expansions on vacant space 165,469
New vacancies during the period (101,033)
Surrender / early termination agreements (30,277)
Suite additions, remeasurements and removals (110,114)
Occupancy (pre acquisitions, dispositions, and transfers) 10,651,261 95.3%
Occupancy related to acquired properties 15,915
Occupancy related to transfers from PUD 20,879
Occupancy related to transfers to PUD (305,413)
Occupancy - June 30, 2018 10,382,642 94.9%
Vacancy committed for future leases 52,203
Leased area (occupied & committed), June 30, 2018 10,434,845 95.4%
(1) Excludes properties under development
GLAAS A % OF
TOTAL GLA (1)
Allied strives to maintain high levels of occupancy and leased area. At June 30, 2018, Allied’s rental portfolio was 95.4% leased.
STATUS
Leasing status for the rental portfolio as at June 30, 2018, is summarized in the following table:
Of 10,939,924 square feet total GLA in Allied’s rental portfolio, 10,382,642 square feet were occupied by tenants on June 30, 2018. Another 52,203 square feet were subject to contractual lease commitments with tenants whose leases commence subsequent to June 30, 2018, bringing the leased area to 10,434,845 square feet, which represents 95.4% of Allied’s total rental portfolio GLA.

20 ALLIED PROPERTIES REIT Q2 2018 QUARTERLY REPORT
Toronto 51,710 63,593
Kitchener 22,551 —
Montréal 103,115 76,349
Calgary 117,055 97,026
Vancouver — 3,679
Total square feet 294,431 240,647
% of Total GLA 2.7% 2 .1%
JUNE 30, 2018 DECEMBER 31, 2017
The table below outlines the timing of the contractual lease commitments by commencement of occupancy:
In most instances, occupancy commences with a rent-free fixturing period of two to four months. During the fixturing period, straight line rent revenue is recognized, and no recoverable costs are paid by the tenant. Thereafter, recoverable costs are paid by the tenant and recognized as rental revenue. In cases where interest and realty taxes were being capitalized prior to occupancy (in accordance with International Financial Reporting Standards), capitalization ends on occupancy, partially offsetting the impact of rent recognition.
The table below outlines the timing of the contractual lease commitments by commencement of rent payment:
Lease commitments - GLA 41,717 7,074 2,080 1,332 52,203
% of lease commitments 79 .8% 13 .6% 4 .0% 2 .6% 100%
Q4 2018Q3 2018 Q3 2019 Q4 2019 TOTALFIXTURING COMMENCEMENT (OCCUPANCY)
Lease commitments - GLA 18,845 18,315 4,557 7,074 3,412 52,203
% of lease commitments 36 .1% 35 .1% 8 .7% 13 .6% 6 .5% 100%
Q1 2019Q4 2018Q3 2018 Q2 2019 Q2 2020 TOTALRENT COMMENCEMENT (ECONOMIC OCCUPANCY)
Allied monitors the level of sub-lease space being marketed in its rental portfolio. Below is a summary of sub-lease space being marketed by city as at June 30, 2018 and December 31, 2017:
This level of marketed sublease space is consistent with past experience and does not represent an operating or leasing challenge.

21ALLIED PROPERTIES REIT Q2 2018 QUARTERLY REPORT
Vacancy on January 1, 2018, including re-measurement 603,007 200,785 33 .3% 402,222
Vacancy transferred to PUD as at June 30, 2018 (7,499) — — (7,499)
Vacancy transferred from PUD as at June 30, 2018 33,673 5,567 16 .5% 28,106
Acquired vacancy as at June 30, 2018 1,500 — — 1,500
Arranged and other vacancy as at June 30, 2018 42,680 2,540 6 .0% 40,140
Maturities during the period ended June 30, 2018 235,957 195,347 82 .8% 40,610
Maturities in remainder of 2018 432,353 126,512 29 .3% —
Total 1,341,671 530,751 39 .6% 505,079
LEASABLE SFLEASED SF BY
JUNE 30% LEASED BY
JUNE 30UNLEASED SF AT
JUNE 30
ACTIVITY
Allied places a high value on tenant retention, as the cost of retention is typically lower than the cost of securing new tenancies. When retention is neither possible nor desirable, Allied strives for high-quality replacement tenants.
Leasing activity in connection with the rental portfolio as at June 30, 2018, is summarized in the following table:
On January 1, 2018, 603,007 square feet of GLA was vacant. By the six months ended June 30, 2018, Allied leased 200,785 square feet of this GLA, leaving 394,723 square feet unleased (net of vacancy transferred to PUD).
Leases for 235,957 square feet of GLA matured in the period ending June 30, 2018, at the end of which Allied renewed or replaced leases totaling 195,347 square feet of GLA, leaving 40,610 square feet unleased.
Leases for 432,353 square feet of GLA are maturing in the remainder of 2018. Allied either renewed or replaced 126,512 square feet, leaving 305,841 square feet yet to be replaced or renewed.

22 ALLIED PROPERTIES REIT Q2 2018 QUARTERLY REPORT
Business service and professional 32 .2%
Telecommunications and information technology 26 .9%
Media and entertainment 14 .1%
Retail (head office and storefront) 11 .1%
Parking & other 8 .3%
Financial services 2 .8%
Government 2 .7%
Educational and institutional 1 .9%
100 .0%
% OF RENTAL REVENUE JUNE 30, 2018CATEGORY
For the six months ended June 30, 2018, the table below summarizes the rental rates achieved for the leases expiring in 2018 that were either renewed or replaced. Overall, this has resulted in an increase of 22.6% in the net rent per square foot from maturing leases. This unusually high increase stems, for the most part, from the material rent growth in Allied's primary target markets in Toronto.
TENANT PROFILE
The following sets out Allied’s tenant-mix on the basis of percentage of rental revenue for the six months ended June 30, 2018:
% of Total leased SF 66 .2% 18 .2% 15 .6%
Maturing leases in 2018 - Weighted average rent $23 .55 $21 .97 $19 .19
Renewals & Replacements - Weighted average rent $32 .26 $21 .97 $14 .94
ABOVE IN-PLACE RENTS
AT IN-PLACE RENTS
BELOW IN-PLACE RENTS
LEASE RENEWALS/REPLACEMENTS
FOR THE SIX MONTHS ENDED, JUNE 30, 2018

23ALLIED PROPERTIES REIT Q2 2018 QUARTERLY REPORT
WEIGHTED AVERAGE REMAINING LEASE
TERM (YEARS)CREDIT RATING
DBRS/S&P/MOODY’S
% OF RENTAL REVENUE
JUNE 30, 2018
Cloud Service Provider 3 .6% 2 .7 *-/AAA/Aaa
Ubisoft 2 .9% 6 .3 Not Rated
Equinix 2 .7% 6 .8 -/BB+/Ba3
Cologix 2 .4% 19 .5 -/B/B3
National Capital Commission, a Canadian Crown Corporation 1 .5% 17 .1 Not Rated
Morgan Stanley 1 .4% 2 .3 AH/BBB+/A3
Cogeco Data Services Inc . 1 .3% 0 .3 *BBH/BB+/-
Allstream 1 .3% 2 .1 *-/B+/B2
Entertainment One 1 .3% 10 .0 -/B+/Ba3
Bell Canada 1 .2% 2 .1 BBBH/BBB+/Baa1
19 .6%
TENANT
The following sets out the percentage of rental revenue from top 10 tenants by rental revenue for the six months ended June 30, 2018:
*Credit rating for parent company
LEASE MATURITY
As at June 30, 2018, 95.4% of the GLA in Allied’s rental portfolio was leased. The weighted average term to maturity of Allied’s leases at that time was 6.1 years. The weighted average market net rental rate is based on Management’s current estimates and is supported in part by independent appraisals of certain relevant properties. There can be no assurance that Management’s current estimates are accurate or that they will not change with the passage of time.

24 ALLIED PROPERTIES REIT Q2 2018 QUARTERLY REPORT
December 31, 2018 443,214 4 .1% 19 .87 27 .58
December 31, 2019 972,462 8 .9% 24 .55 28 .41
December 31, 2020 1,175,552 10 .7% 27 .87 31 .63
December 31, 2021 1,183,853 10 .8% 20 .32 25 .12
December 31, 2022 1,200,247 11 .0% 22 .08 25 .34
SQUARE FEET
% OF TOTAL GLA
WEIGHTED AVERAGE IN-PLACE
RENTAL RATE
ESTIMATED WEIGHTED
AVERAGE MARKET RENTAL RATE
TOTAL RENTAL PORTFOLIO
The following table contains information on the office, retail and mission-critical leases that mature up to 2022, assuming tenants do not exercise renewal options, and the corresponding estimated weighted average market rental rate as at June 30, 2018:

25ALLIED PROPERTIES REIT Q2 2018 QUARTERLY REPORT
The following tables contain information on lease maturities by segment:
December 31, 2018 194,264 4 .5% 9 .89 16 .89
December 31, 2019 358,995 8 .4% 19 .37 15 .91
December 31, 2020 323,449 7 .5% 16 .28 16 .57
December 31, 2021 545,494 12 .7% 16 .77 18 .08
December 31, 2022 320,073 7 .5% 17 .44 17 .69
SQUARE FEET
% OF SEGMENT GLA
WEIGHTED AVERAGE IN-PLACE
RENTAL RATE
ESTIMATED WEIGHTED
AVERAGE MARKET RENTAL RATEEASTERN CANADA
December 31, 2018 34,626 2 .3% 17 .66 15 .23
December 31, 2019 155,192 10 .5% 21 .82 16 .34
December 31, 2020 235,076 15 .9% 15 .13 10 .92
December 31, 2021 176,796 11 .9% 21 .44 21 .41
December 31, 2022 128,232 8 .7% 19 .07 14 .78
SQUARE FEET
% OF SEGMENT GLA
WEIGHTED AVERAGE IN-PLACE
RENTAL RATE
ESTIMATED WEIGHTED
AVERAGE MARKET RENTAL RATEWESTERN CANADA
December 31, 2018 193,209 4 .2% 19 .05 30 .15
December 31, 2019 390,930 8 .5% 20 .50 30 .22
December 31, 2020 492,008 10 .7% 18 .54 24 .63
December 31, 2021 435,947 9 .5% 20 .14 30 .26
December 31, 2022 723,447 15 .7% 20 .61 26 .60
SQUARE FEET
% OF SEGMENT GLA
WEIGHTED AVERAGE IN-PLACE
RENTAL RATE
ESTIMATED WEIGHTED
AVERAGE MARKET RENTAL RATECENTRAL CANADA
December 31, 2018 21,115 3 .8% 122 .93 122 .66
December 31, 2019 67,345 12 .0% 81 .98 112 .32
December 31, 2020 125,019 22 .3% 118 .49 137 .08
December 31, 2021 25,616 4 .6% 91 .05 113 .38
December 31, 2022 28,495 5 .1% 124 .79 126 .58
SQUARE FEET
% OF SEGMENT GLA
WEIGHTED AVERAGE IN-PLACE
RENTAL RATE
ESTIMATED WEIGHTED
AVERAGE MARKET RENTAL RATEMISSION CRITICAL

26 ALLIED PROPERTIES REIT Q2 2018 QUARTERLY REPORT
Section III —Asset Profile
As at June 30, 2018, Allied’s portfolio consisted of 147 investment properties (128 rental properties, seven development properties and 12 ancillary parking facilities), with a fair value of $5,886,980.
Changes to the carrying amounts of investment properties are summarized as follows:
Balance, beginning of period $5,131,866 $608,731 $5,740,597 $5,168,621 $458,818 $5,627,439
Additions:
Acquisitions 888 — 888 17,247 — 17,247
Tenant improvements 10,826 — 10,826 26,805 — 26,805
Leasing commissions 4,080 — 4,080 6,969 — 6,969
Capital expenditures 9,983 47,032 57,015 13,369 84,817 98,186
Transfers from PUD — — — 67,180 (67,180) —
Transfers to PUD — — — (182,180) 182,180 —
Finance lease 471 — 471 945 — 945
Amortization of straight-line rent and tenant improvements (5,474) — (5,474) (11,065) — (11,065)
Fair value gain (loss) on investment properties 84,090 (5,513) 78,577 128,839 (8,385) 120,454
Balance, end of period $5,236,730 $650,250 $5,886,980 $5,236,730 $650,250 $5,886,980
RENTAL PROPERTIES
RENTAL PROPERTIESTOTAL TOTAL
PROPERTIES UNDER
DEVELOPMENT
PROPERTIES UNDER
DEVELOPMENT
THREE MONTHS ENDED JUNE 30, 2018
SIX MONTHS ENDED JUNE 30, 2018

27ALLIED PROPERTIES REIT Q2 2018 QUARTERLY REPORT
JUNE 30, 2018 DECEMBER 31, 2017
Eastern Canada 5.25% - 7.25% 5.73% $1,206,160 5 .25% - 7 .75% 6 .03% $1,127,690
Central Canada 4.00% - 6.00% 4.80% 2,589,610 4 .00% - 6 .00% 4 .84% 2,615,526
Western Canada 4.00% - 7.00% 5.22% 608,710 4 .00% - 7 .00% 5 .25% 622,835
Mission Critical 6.00% - 6.50% 6.19% 832,250 6 .00% - 6 .50% 6 .33% 802,570
Rental Properties 4.00% - 7.25% 5.30% $5,236,730 4 .00% - 7 .75% 5 .42% $5,168,621
Properties Under Development 5.00% - 6.75% 5.61% 650,250 5 .00% - 6 .75% 5 .63% 458,818
Total Investment Properties 4.00% - 7.25% 5.31% $5,886,980 4 .00% - 7 .75% 5 .43% $5,627,439
RANGE % RANGE %WEIGHTED AVERAGE %
WEIGHTED AVERAGE %
FAIR VALUE $
FAIR VALUE $
OVERALL CAPITALIZATION RATE
For the six months ended June 30, 2018, Allied capitalized a total of $11,774 of borrowing costs, $10,172 of which related to development activity, $526 to rental properties going through intensification approval and $1,076 to upgrade activity in the rental portfolio. The rental properties undergoing upgrade activity consist of 250 Front West and 905 King West.
The appraised fair value of investment properties is most commonly determined using the following methodologies:
Discounted cash flow method (“DCF method”) - Under this approach, discount rates are applied to the projected annual operating cash flows, generally over a ten year period, including a terminal value of the properties based on a capitalization rate applied to the estimated net operating income (“NOI”), a non-GAAP measure, in the terminal year. This method is primarily used to value the rental properties portfolio.
Comparable sales method - This approach compares a subject property’s characteristics with those of comparable properties which have recently sold. The process uses one of several techniques to adjust the price of the comparable transactions according to the presence, absence, or degree of characteristics which influence value. These characteristics include the cost of construction incurred at a property under development. This method is primarily used to value the development portfolio and ancillary parking facilities.
Allied’s entire portfolio is revalued by the external appraiser each quarter. Management verifies all major inputs to the valuations, analyzes the change in fair values at the end of each reporting period and reviews the results with the independent appraiser every quarter. There were no material changes to the valuation techniques during the period. For properties with a leasehold interest with a term less than 40 years, the resulting valuation methodology is based upon a full-term discounted cash flow model.
In valuing the investment properties as at June 30, 2018, the independent appraiser compares the value derived using the DCF method to the value that would have been calculated by applying a capitalization rate to NOI. This is done to assess the reasonability of the value obtained under the DCF method. The corresponding portfolio weighted average overall capitalization rate used was 5.31%, detailed in the table below:

28 ALLIED PROPERTIES REIT Q2 2018 QUARTERLY REPORT
Cité Multimédia, Montréal $21,925 $369,050 5 .25% Desjardins, Morgan Stanley, SAP Canada
QRC West, Toronto 11,776 247,520 4 .25% eOne, Sapient Canada
Le Nordelec, Montréal 10,237 191,070 6 .00% Babel Games, Gsoft, Yellow Pages Media
5455 de Gaspé Avenue, Montreal 7,603 119,420 5 .75% Attraction Media, Framestore, Ubisoft
555 Richmond West, Toronto 7,153 133,180 4 .75% Good Life, Sentinelle, Synaptive
The Chambers, Ottawa (1) 6,070 140,480 — National Capital Commission
Vintage I & II, Calgary 5,527 87,610 5 .25% Royal & Sun Alliance
The Tannery, Kitchener 5,435 83,370 6 .00% Communitech Corp ., Desire 2 Learn
5445 de Gaspé Avenue, Montreal 5,082 79,620 6 .00% Sun Life Assurance Company of Canada, Ubisoft
Boardwalk Revillon, Edmonton 4,880 74,020 6 .25% Edmonton Public School Board, Legal Aid
Total $85,688 $1,525,340 5 .31%
NORMALIZED LQA NOI CAP RATE
APPRAISED FAIR VALUE PRINCIPAL TENANTSPROPERTY NAME
RENTAL PROPERTIES
Allied’s rental portfolio was built by consolidating the ownership in major Canadian cities of urban office properties with three distinct attributes—proximity to the core, distinctive internal and external environments and lower occupancy costs than conventional office towers. Scale within each city proved to be very important as Allied grew. It enabled Allied to provide its tenants with greater expansion flexibility, more parking and better telecommunication and information technology capacity than its direct competitors. Scale across the country also proved to be important. It enabled Allied to serve national and global tenants better, to expand its growth opportunities and to achieve meaningful geographic diversification.
TOP-10 OFFICE RENTAL PROPERTIES
Listed below are Allied’s top 10 office rental properties measured by Normalized Last Quarter Annualized (“LQA”) NOI. Normalized LQA NOI is a non-IFRS measure, which represents the normalized results for the most recently completed quarter (excluding straight-line rent) multiplied by four. These properties represent 32.0% of total annualized NOI for the period ended June 30, 2018.
(1) The Chambers is a leasehold interest property and the resulting valuation methodology is based upon a full-term discounted cash flow model as there are less than 40 years remaining on the land lease.

29ALLIED PROPERTIES REIT Q2 2018 QUARTERLY REPORT
151 Front West, Toronto $31,465 $449,180 6 .00% Allstream, Bell, Cologix, Equinix, Telus
250 Front West, Toronto 14,491 278,830 6 .50% Cloud Service Provider, Equinix
905 King West, Toronto 3,380 104,240 6 .21% Beanfield, Cologix
Total $49,336 $832,250 6 .19%
NORMALIZED LQA NOI CAP RATE
APPRAISED FAIR VALUE PRINCIPAL TENANTSPROPERTY NAME
MISSION CRITICAL FACILITIES
Allied has three mission-critical facilities in Downtown Toronto: 151 Front West (the “Internet Hub”), 905 King West (the “Colocation Facility”) and 250 Front West (the “Cloud Facility”).
Listed below are Allied’s mission-critical facilities measured by Normalized LQA NOI. These properties represent 18.4% of total annualized NOI for the period ended June 30, 2018.
Allied owns the Internet Hub, which is 98.5% leased. The Cloud Facility and the Colocation Facility are connected to the Internet Hub via a multi-layered, diverse infrastructure of high-density fibre, providing to users a varied configuration of exchange and carrier networks.
Allied leases 173,000 square feet of GLA at the Cloud Facility pursuant to a long-term lease that expires on February 28, 2061. As a result of substantial capital improvements completed by Allied, the Cloud Facility has become an important interconnected cloud-hosting facility in Canada, providing retail, wholesale and managed services.
Allied also owns the Colocation Facility. As a result of very substantial capital improvements completed by Allied, 56,814 square feet of GLA at the property has become a leading third-party colocation facility in Downtown Toronto. The mission-critical area of the Colocation Facility is 93% leased.
Allied has two basic sources of rental revenue from the Cloud Facility. The largest source, direct rental revenue, derives from subleasing the GLA in the Cloud Facility to ultimate users. Allied has subleased 61% of the total GLA (64% as at August 1, 2018), primarily to global providers of cloud infrastructure. A smaller but material source, ancillary rental revenue, derives from fiber cross-connects at the Cloud Facility. Cross-connects enable different types of users to interconnect with low-latency and redundancy, reducing network costs and improving network security and performance. Cloud infrastructure providers achieve this by deploying cross-connects to their cloud infrastructure within the Cloud Facility. These cloud interconnect nodes function as major on-ramps to the cloud.
Allied expects that cross-connects at the Cloud Facility will give rise to recurring ancillary rental revenue that will be phased in over a 24-month period. Cross-connects utilize the existing infrastructure at the Cloud Facility without occupying any of the unleased GLA or requiring additional capital expenditure by Allied.

30 ALLIED PROPERTIES REIT Q2 2018 QUARTERLY REPORT
RENTAL PROPERTIES UNDERGOING INTENSIFICATION APPROVAL
One way Allied creates value is by intensifying the use of underutilized land. The land beneath the buildings in Toronto is significantly underutilized in relation to the existing zoning potential. This is also true of some of Allied’s buildings in Kitchener, Montréal, Calgary and Vancouver. These opportunities are becoming more compelling as the urban areas of Canada’s major cities intensify. Since Allied has captured the unutilized land value at a low cost, it can achieve attractive risk-adjusted returns on intensification.
Allied began tracking the intensification potential inherent in the Toronto portfolio in the fourth quarter of 2007 (see our MD&A dated March 7, 2008, for the quarter and year ended December 31, 2007). At the time, the 46 properties in Toronto comprised 2.4 million square feet of GLA and were situated on 780,000 square feet (17.8 acres) of underutilized land immediately east and west of the Downtown Core. The 79 properties in Toronto (including properties in the development portfolio) now comprise 4.6 million square feet of GLA and are situated on 1.9 million square feet (44 acres) of underutilized land immediately east and west of the Downtown Core. With achievable rezoning, the underlying land in our Toronto portfolio could permit up to 11 million square feet of GLA, 6.4 million square feet more than currently is in place. Less than half of the potential value of this buildable area is reflected in the appraised fair values.
Allied entered the Montréal market in April of 2005. The 17 properties in Montréal now comprise 4.1 million square feet of GLA. As they are much larger buildings on average than those comprising the Toronto portfolio, the 1.4 million square feet (32 acres) of land on which they sit (immediately south, east and north east of the Downtown Core) is more fully utilized than the land in the Toronto portfolio. Nevertheless, the underlying land in the Montréal portfolio could permit up to 5.4 million square feet of GLA, 1.3 million square feet more than currently is in place. For the most part, the potential value of this buildable area is not reflected in the appraised fair value.
Allied’s Toronto portfolio will be the focal point of ongoing intensification activity in the near-term and longer-term. The Montréal portfolio also has significant intensification potential. While Allied will begin to realize that potential at 425 Viger West in the next few years, Montréal will remain more the focal point of upgrade activity in the near-and longer-term while Toronto will remain the focal point of intensification activity.

31ALLIED PROPERTIES REIT Q2 2018 QUARTERLY REPORT
College & Manning (1) $742 $14,780 Completed Office, limited retail, residential 28,921 56,000 2021
QRC West, Phase II (2) 1,216 30,920 Completed Office, retail 32,189 90,000 Unscheduled
King & Peter (3) 1,680 82,150 Completed Office, limited retail 86,889 790,000 Unscheduled
Union Centre 959 102,460 Completed Office, limited retail 39,975 1,129,000 Unscheduled
Adelaide & Spadina (4) 3,419 83,950 In Progress Office, retail 142,060 350,554 Unscheduled
King & Brant (5) 415 20,850 Completed Office, retail 17,006 130,000 Unscheduled
Le Nordelec — 25,570 In Progress Office — 250,000 Unscheduled
Total $8,431 $360,680 347,040 2,795,554
REZONING APPROVAL
STATUSNORMALIZED
LQA NOIAPPRAISED FAIR VALUE USE
CURRENT GLA
ESTIMATED GLA ON
COMPLETIONESTIMATED
COMPLETION
PROPERTY NAME
Allied has initiated the intensification approval process for six rental properties in Toronto and one rental property in Montréal, six of which are owned in their entirety and one of which is co-owned with a partner. These properties are identified in the following table:
(1) Equal two-way co-ownership with RioCan, total estimated GLA is 112,000 square feet.
(2) QRC West, Phase II is composed of the 375-381 Queen W properties.
(3) King & Peter is composed of the following properties: 82 Peter and 388 King W.
(4) Adelaide & Spadina is composed of the following properties: 383 Adelaide W, 379 Adelaide W, 387 Adelaide W and 96 Spadina.
(5) Allied has received permission to intensify 544 King Street W and 7-9 Morrison. The approval permits approximately 120,000 square feet of office space and 10,000 square feet of retail space. Allied is exploring the opportunity to increase the permitted leasable area.
Estimated GLA is based on applicable standards of area measurement and the expected or actual outcome of rezoning. These properties are currently generating NOI and will continue to do so until Allied initiates construction. With respect to the ultimate intensification of these properties, a significant amount of pre-leasing will be required on the larger projects before construction commences. The design-approval costs have been, and will continue to be, funded by Allied for its share.
DEVELOPMENT PROPERTIES
Development is another way to create value and a particularly effective one for Allied, given the strategic positioning of its portfolio in the urban areas of Canada’s major cities. Urban intensification is the single most important trend in relation to Allied’s business. Not only does it anchor Allied’s investment and operating focus, it provides the context within which Allied creates value for its Unitholders. The pace of urban intensification is accelerating. Residential structures are moving inexorably upward, office structures are moving well beyond traditional boundaries and retailers are accepting new and different spatial configurations, all in an effort to exploit opportunity while accommodating the physical constraints of the inner-city. It has even reached a point where the migration to the suburbs that started in the 1950s is reversing itself. What was identified a few years back as an incipient trend has become a reasonably widespread reverse migration, with office tenants returning to the inner city to capture the ever more concentrated talent pools.
32 ALLIED PROPERTIES REIT Q2 2018 QUARTERLY REPORT
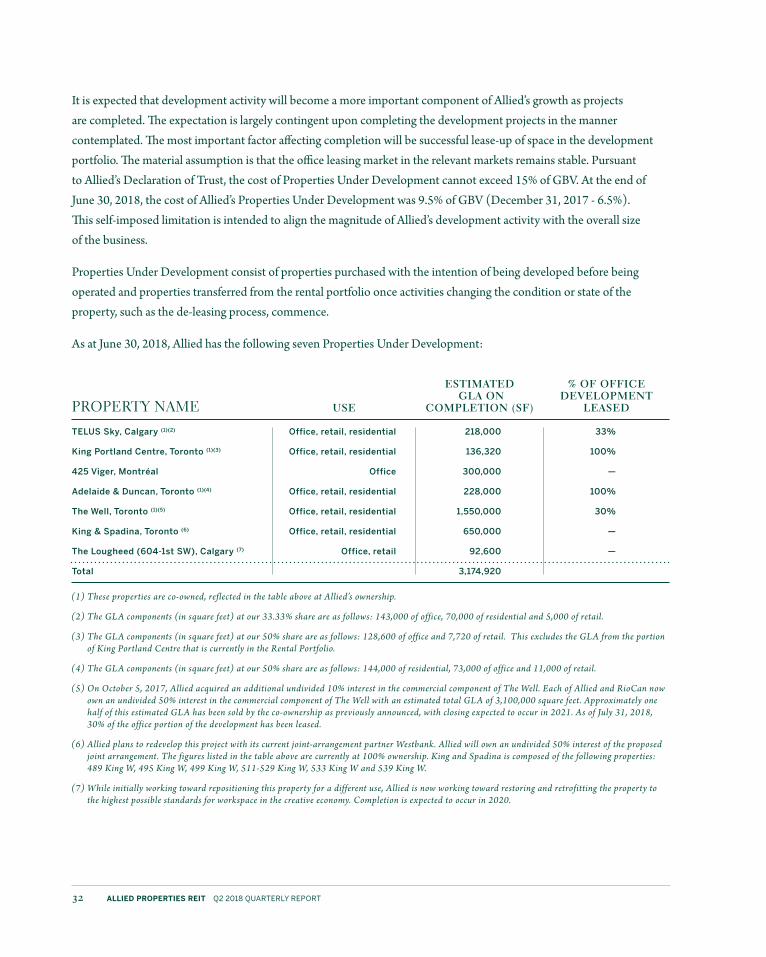
It is expected that development activity will become a more important component of Allied’s growth as projects are completed. The expectation is largely contingent upon completing the development projects in the manner contemplated. The most important factor affecting completion will be successful lease-up of space in the development portfolio. The material assumption is that the office leasing market in the relevant markets remains stable. Pursuant to Allied’s Declaration of Trust, the cost of Properties Under Development cannot exceed 15% of GBV. At the end of June 30, 2018, the cost of Allied’s Properties Under Development was 9.5% of GBV (December 31, 2017 - 6.5%). This self-imposed limitation is intended to align the magnitude of Allied’s development activity with the overall size of the business.
Properties Under Development consist of properties purchased with the intention of being developed before being operated and properties transferred from the rental portfolio once activities changing the condition or state of the property, such as the de-leasing process, commence.
As at June 30, 2018, Allied has the following seven Properties Under Development:
ESTIMATED GLA ON
COMPLETION (SF)
% OF OFFICE DEVELOPMENT
LEASEDUSE
TELUS Sky, Calgary (1)(2) Office, retail, residential 218,000 33%
King Portland Centre, Toronto (1)(3) Office, retail, residential 136,320 100%
425 Viger, Montréal Office 300,000 —
Adelaide & Duncan, Toronto (1)(4) Office, retail, residential 228,000 100%
The Well, Toronto (1)(5) Office, retail, residential 1,550,000 30%
King & Spadina, Toronto (6) Office, retail, residential 650,000 —
The Lougheed (604-1st SW), Calgary (7) Office, retail 92,600 —
Total 3,174,920
(1) These properties are co-owned, reflected in the table above at Allied’s ownership.
(2) The GLA components (in square feet) at our 33.33% share are as follows: 143,000 of office, 70,000 of residential and 5,000 of retail.
(3) The GLA components (in square feet) at our 50% share are as follows: 128,600 of office and 7,720 of retail. This excludes the GLA from the portion of King Portland Centre that is currently in the Rental Portfolio.
(4) The GLA components (in square feet) at our 50% share are as follows: 144,000 of residential, 73,000 of office and 11,000 of retail.
(5) On October 5, 2017, Allied acquired an additional undivided 10% interest in the commercial component of The Well. Each of Allied and RioCan now own an undivided 50% interest in the commercial component of The Well with an estimated total GLA of 3,100,000 square feet. Approximately one half of this estimated GLA has been sold by the co-ownership as previously announced, with closing expected to occur in 2021. As of July 31, 2018, 30% of the office portion of the development has been leased.
(6) Allied plans to redevelop this project with its current joint-arrangement partner Westbank. Allied will own an undivided 50% interest of the proposed joint arrangement. The figures listed in the table above are currently at 100% ownership. King and Spadina is composed of the following properties: 489 King W, 495 King W, 499 King W, 511-529 King W, 533 King W and 539 King W.
(7) While initially working toward repositioning this property for a different use, Allied is now working toward restoring and retrofitting the property to the highest possible standards for workspace in the creative economy. Completion is expected to occur in 2020.
PROPERTY NAME

33ALLIED PROPERTIES REIT Q2 2018 QUARTERLY REPORT
The following table sets out the fair value of Allied’s Properties Under Development, as at June 30, 2018, as well as Management’s estimates with respect to the financial outcome on completion:
The initial cost of Properties Under Development includes the acquisition cost of the property, direct development costs, realty taxes and borrowing costs directly attributable to the development. Borrowing costs and realty taxes associated with direct expenditures on Properties Under Development are capitalized. The amount of capitalized borrowing costs is determined first by reference to borrowings specific to the project, where relevant, and otherwise by applying a weighted average cost of borrowings to eligible expenditures after adjusting for borrowings associated with other specific developments.
Transfer to the rental portfolio occurs when the property is capable of operating in the manner intended by Management. Generally this occurs upon completion of construction and receipt of all necessary occupancy and other material permits. Estimated annual NOI is based on 100% economic occupancy. The most important factor affecting estimated annual NOI will be successful lease-up of vacant space in the development properties at current levels of net rent per square foot. The material assumption is that the office leasing market in the relevant markets remains stable. Estimated total cost includes acquisition cost, estimated total construction, financing costs and realty taxes. The material assumption made in formulating the estimated total cost is that construction and financing costs remain stable for the remainder of the development period. Estimated yield on cost is the estimated annual NOI as a percentage of the estimated total cost. Estimated cost to complete is the difference between the estimated total cost and the costs incurred to date.
TELUS Sky, Calgary (1) Q1 2019 $87,890 $7,650 - $8,310 $133,000 5 .8% - 6 .2% $41,430
King Portland Centre, Toronto (1)(2) Q1 2019 94,588 4,600 - 4,750 101,535 7 .7% - 8 .1% 26,180
425 Viger, Montréal Q1 2020 34,170 6,000 - 7,000 95,885 6 .3% - 7 .3% 53,900
Adelaide & Duncan, Toronto (1) Q3 2020 49,730 9,000 - 10,750 160,500 5 .6% - 6 .7% 124,500
The Lougheed (604-1st SW), Calgary 2020 20,020 TBD TBD TBD TBD
The Well, Toronto (1) Q3 2021 245,470 37,000 - 43,250 619,000 6 .0% - 7 .0% 434,800
King & Spadina (3) Unscheduled 153,980 TBD TBD TBD TBD
Total $ 685,848
TRANSFER TO RENTAL PORTFOLIO
ESTIMATED ANNUAL NOI
APPRAISED VALUE
ESTIMATED TOTAL COST
ESTIMATED COST TO
COMPLETE
ESTIMATED YIELD
ON COST
(1) These properties are co-owned, reflected in the table above at Allied’s ownership percentage of assets and liabilities.
(2) Excludes the portion of King Portland Centre that is currently in the rental portfolio, 602 King W. The appraised value and estimated total cost is inclusive of the residential and office component. The estimated yield on cost is net of the sale proceeds of the residential component, estimated to be between $10,000 - $11,000.
(3) Allied plans to redevelop this project with its current joint-arrangement partner Westbank. Allied will own an undivided 50% interest of the proposed joint arrangement. The figures listed in the table above are currently at 100% ownership. King and Spadina is composed of the following properties: 489 King W, 495 King W, 499 King W, 511-529 King W, 533 King W and 539 King W.
PROPERTY NAME

34 ALLIED PROPERTIES REIT Q2 2018 QUARTERLY REPORT
DEVELOPMENT ECONOMICS INVESTMENT
STABILIZED NOI
UNLEVERED YIELD ON
COST FAIR VALUEVALUE
CREATION
VALUE CREATION AS %
OF COST
Land Costs $11,000
Hard & Soft Costs 104,000
Capitalized Interest & Operating Costs 15,000
Total Development Costs $130,000 $11,700 9.0% $247,520 $117,520 90.4%
RESIDENTIAL INVENTORY
Residential inventory consists of assets that are developed by Allied for sale in the ordinary course of business. Allied may transfer an investment property to residential inventory based on a change in use, as evidenced by the commencement of development activities with the intention to sell. Alternatively, a transfer from residential inventory to investment property would be evidenced by the commencement of leasing activity.
On September 19, 2017, Allied with its partner RioCan, announced that they had finalized plans that would allow the co-owners to improve the return on the development of King Portland Centre. The co-owners had originally intended to develop the residential portion of the project as rental apartments and then decided to sell the residential portion as condominium units, comprised of 132 units. The residential condominium units have been fully sold, subject to customary closing conditions.
DEVELOPMENT COMPLETIONS
QRC WEST, TORONTO
This was a pioneering, large-scale intensification project that involved the integration of two restored heritage buildings with a new, mid-rise office structure. The project commenced in 2010 and was completed in 2015. It is comprised of 346,214 square feet of GLA and is fully leased.
The fair value is provided by our external appraiser, which is calculated based on the discounted cash flow method.

35ALLIED PROPERTIES REIT Q2 2018 QUARTERLY REPORT
DEVELOPMENT ECONOMICS INVESTMENT
STABILIZED NOI
UNLEVERED YIELD ON
COST FAIR VALUEVALUE
CREATION
VALUE CREATION AS %
OF COST
Land Costs $4,000
Hard & Soft Costs 18,470
Capitalized Interest & Operating Costs 2,550
Total Development Costs $25,020 $1,950 7.8% $43,980 $18,960 75.8%
DEVELOPMENT ECONOMICS INVESTMENT
STABILIZED NOI
UNLEVERED YIELD ON
COST FAIR VALUEVALUE
CREATION
VALUE CREATION AS %
OF COST
Land Costs $8,700
Hard & Soft Costs 17,500
Capitalized Interest & Operating Costs 1,300
Total Development Costs $27,500 $1,600 5.8% $29,690 $2,190 8.0%
THE BREITHAUPT BLOCK, KITCHENER
Allied acquired an undivided 50% interest in the property in 2010 and immediately put it into development, completing the first phase in 2014 and the second phase in mid-2016. The property is an equal two-way joint arrangement between Allied and Perimeter Development Corporation. It is comprised of 226,810 square feet of GLA (Allied’s share 113,405 square feet) and is fully leased.
The fair value is provided by our external appraiser, which is calculated based on the discounted cash flow method.
180 JOHN, TORONTO
Allied acquired the property in 2015. The property was redeveloped and leased in its entirety to Spaces. The project was completed in 2017. It is comprised of 45,631 square feet of GLA and is fully leased.
The fair value is provided by our external appraiser, which is calculated based on the discounted cash flow method.

36 ALLIED PROPERTIES REIT Q2 2018 QUARTERLY REPORT
DEVELOPMENT ECONOMICS INVESTMENT
STABILIZED NOI
UNLEVERED YIELD ON
COST FAIR VALUEVALUE
CREATION
VALUE CREATION AS %
OF COST
Land Costs $230
Hard & Soft Costs 10,890
Capitalized Interest & Operating Costs 240
Total Development Costs $11,360 $720 6.3% $13,070 $1,710 15.1%
189 JOSEPH, KITCHENER
189 Joseph was purchased as part of The Tannery in 2012. The building stood vacant, and was slated to be demolished before Allied proposed the redevelopment and secured Deloitte as the tenant. The project commenced in late-2015 and was completed in mid-2017. It is comprised of 26,373 square feet of GLA and is fully leased.
The fair value is provided by our external appraiser, which is calculated based on the discounted cash flow method.
LOANS RECEIVABLE
As of June 30, 2018, total loans receivable outstanding is $98,676 (December 31, 2017 - $88,316).
In February 2015, Allied entered into a joint arrangement with Westbank and completed the acquisition of an undivided 50% interest in Adelaide & Duncan. Allied advanced a total of $21,173 to Westbank. As at June 30, 2018, the loan receivable outstanding is $21,173 (December 31, 2017 - $21,173) and is secured by a first charge on the property and assignment of rents and leases. Interest on the loan is payable monthly at a rate of 6.17% per annum. The loan is repayable when the joint arrangement obtains external permanent financing.
On August 1, 2017, Allied entered into an arrangement with Westbank to provide a credit facility of up to $100,000, plus interest, for the land acquisition and the initial pre-development costs of 400 West Georgia in Vancouver. The credit facility bears interest at rates between 5.00% to 6.75% per annum in year one and 6.75% per annum in each year thereafter until maturity. The credit facility matures August 31, 2022, and has a one year extension option to August 31, 2023. Subject to placement of permanent financing, Allied intends to acquire a 50% undivided interest in 400 West Georgia based on total development costs. The loan outstanding as at June 30, 2018 is $77,503 (December 31, 2017 - $67,143).

37ALLIED PROPERTIES REIT Q2 2018 QUARTERLY REPORT
Section IV —Liquidity And Capital Resources
Allied’s liquidity and capital resources are used to fund capital investments including development activity, leasing costs, interest expense and distributions to Unitholders. The primary source of liquidity is net operating income generated from rental properties, which is dependent on rental and occupancy rates, the structure of lease agreements, leasing costs, and the rate and amount of capital investment and development activity, among other variables.
Allied has financed its operations through the use of equity, mortgage debt secured by rental properties, construction loans, an unsecured operating line, senior unsecured debentures and unsecured term loans. Conservative financial management has been consistently applied through the use of long term, fixed rate, debt financing. Allied’s objective is to maximize financial flexibility while continuing to strengthen the balance sheet. Management intends to achieve this by continuing to access the equity market, unsecured debenture market, unsecured loans and growing the pool of unencumbered assets, which totals $3.8 billion as at June 30, 2018.

38 ALLIED PROPERTIES REIT Q2 2018 QUARTERLY REPORT
Mortgages payable $805,537 $965,832
Construction loans payable 60,102 46,758
Unsecured Facility 20,000 25,000
Unsecured Debentures 573,084 572,849
Unsecured Term Loans 349,579 349,438
Total debt $1,808,302 $1,959,877
Less cash and cash equivalents 2,080 6,048
Net debt $1,806,222 $1,953,829
JUNE 30, 2018 DECEMBER 31, 2017
Remaining 2018 $64,776 5 .78% $— — $150,000 2 .65% $214,776 3 .46%
2019 24,965 — — — — — 24,965 —
2020 30,499 5 .22% 225,000 3 .75% — — 255,499 3 .78%
2021 124,215 4 .17% — — 200,000 2 .86% 324,215 3 .33%
2022 121,428 4 .18% 150,000 3 .93% — — 271,428 4 .04%
2023 230,689 4 .74% — — — — 230,689 4 .74%
2024 179,551 4 .29% — — — — 179,551 4 .29%
2025 9,934 3 .63% 200,000 3 .64% — — 209,934 3 .64%
2026 21,367 3 .59% — — — — 21,367 3 .59%
$807,424 4 .47% $575,000 3 .76% $350,000 2 .77% $1,732,424 3 .89%
MORTGAGES PAYABLE
W/A INTEREST
RATE
W/A INTEREST
RATE
W/A INTEREST RATE OF
MATURING MORTGAGES
UNSECURED TERM LOANS TOTAL
SENIOR UNSECURED
DEBENTURES
CONSOLIDATED W/A INTEREST
RATE OF MATURING DEBT
DEBT
Total debt and net debt are non-IFRS financial measures and do not have any standard meaning prescribed by IFRS. As computed by Allied, total debt and net debt may differ from similar computations reported by other Canadian real estate investment trusts and, accordingly, may not be comparable to similar computations reported by such organizations. Management considers total debt and net debt to be useful measures for evaluating debt levels and interest coverage. The following illustrates the calculation of total debt (net of transaction costs) and net debt as at June 30, 2018, and December 31, 2017:
The table below summarizes the scheduled principal maturity for Allied's Mortgages payable, Unsecured Debentures and Unsecured Term Loans:

39ALLIED PROPERTIES REIT Q2 2018 QUARTERLY REPORT
The chart below summarizes the maturities of principal in regards to Allied's various obligations as at June 30, 2018:

40 ALLIED PROPERTIES REIT Q2 2018 QUARTERLY REPORT
Remaining 2018 $12,824 $51,952 $64,776
2019 24,965 — 24,965
2020 26,043 4,456 30,499
2021 25,136 99,079 124,215
2022 21,326 100,102 121,428
2023 17,334 213,355 230,689
2024 4,691 174,860 179,551
2025 1,146 8,788 9,934
2026 924 20,443 21,367
Mortgages, principal $134,389 $673,035 $807,424 $966,894
Net premium on assumed mortgages 1,451 2,599
Net financing costs (3,338) (3,661)
$805,537 $965,832
PRINCIPAL REPAYMENTS
BALANCE DUE AT MATURITY
JUNE 30, 2018
DECEMBER 31, 2017
MORTGAGES PAYABLE
As of June 30, 2018, mortgages payable, net of financing costs, totaled $805,537 and have a weighted average stated interest rate of 4.47% (December 31, 2017 - 4.73%). The weighted average term of the mortgage debt is 4.7 years (December 31, 2017 - 4.7 years). The mortgages are secured by a first registered charge over specific investment properties and first general assignments of leases, insurance and registered chattel mortgages.
The following table contains information on the remaining contractual mortgage maturities:
For the six months ended June 30, 2018, in addition to regularly scheduled principal payments, Allied repaid four mortgages totaling $142,445 with a weighted average interest rate of 6.15%.

41ALLIED PROPERTIES REIT Q2 2018 QUARTERLY REPORT
Unsecured Facility limit $250,000 $250,000
Amounts drawn under the Unsecured Facility (20,000) (25,000)
Letters of credit outstanding under the Unsecured Facility (12,110) (5,551)
Remaining unused balance under the Unsecured Facility $217,890 $219,449
JUNE 30, 2018 DECEMBER 31, 2017
TELUS Sky 33 .33% $114,000 August 31, 2019 $60,102 $46,758
OWNERSHIP
ALLIED’S GUARANTEE
LIMITDATE OF
MATURITYJUNE 30,
2018DECEMBER
31, 2017
JOINT ARRANGEMENT
CONSTRUCTION LOANS PAYABLE
As of June 30, 2018 and December 31, 2017, Allied's obligation of the balance outstanding under construction loans is:
The construction loans payable for the TELUS Sky joint arrangement bears interest at bank prime plus 70 basis points or banker's acceptance rate plus 195 basis points.
In April 2018, Allied and Westbank received a commitment from a syndicate of Canadian banks for a construction loan for the Duncan & Adelaide joint arrangement, subject to execution of definitive financing documents and completion of customary financing conditions. The commitment is expected to fund up to $270,000 (Allied's 50% share being $135,000) at bank prime plus 35 basis points or banker’s acceptance rate plus 135 basis points.
UNSECURED REVOLVING OPERATING FACILITY
Allied has access to an unsecured revolving operating facility (the “Unsecured Facility”) of $250,000. On January 26, 2018, Allied amended the Unsecured Facility to extend the maturity date to January 29, 2021 at a more favourable rate. The Unsecured Facility will bear interest at bank prime plus 45 basis points or bankers’ acceptance plus 145 basis points with a standby fee of 29 basis points, subject to certain conditions being met (December 31, 2017 - maturity of January 29, 2019, interest rate at bank prime plus 70 basis points or bankers’ acceptance plus 170 basis points with a standby fee of 34 basis points). In the event that these conditions are not met, the Unsecured Facility will bear interest at bank prime plus 70 basis points or bankers’ acceptance plus 170 basis points with a standby fee of 34 basis points. The Unsecured Facility contains a $100,000 accordion feature, allowing Allied to increase the amount available under the facility to $350,000. The Unsecured Facility had a balance of $20,000 outstanding at June 30, 2018 (December 31, 2017 - $25,000).
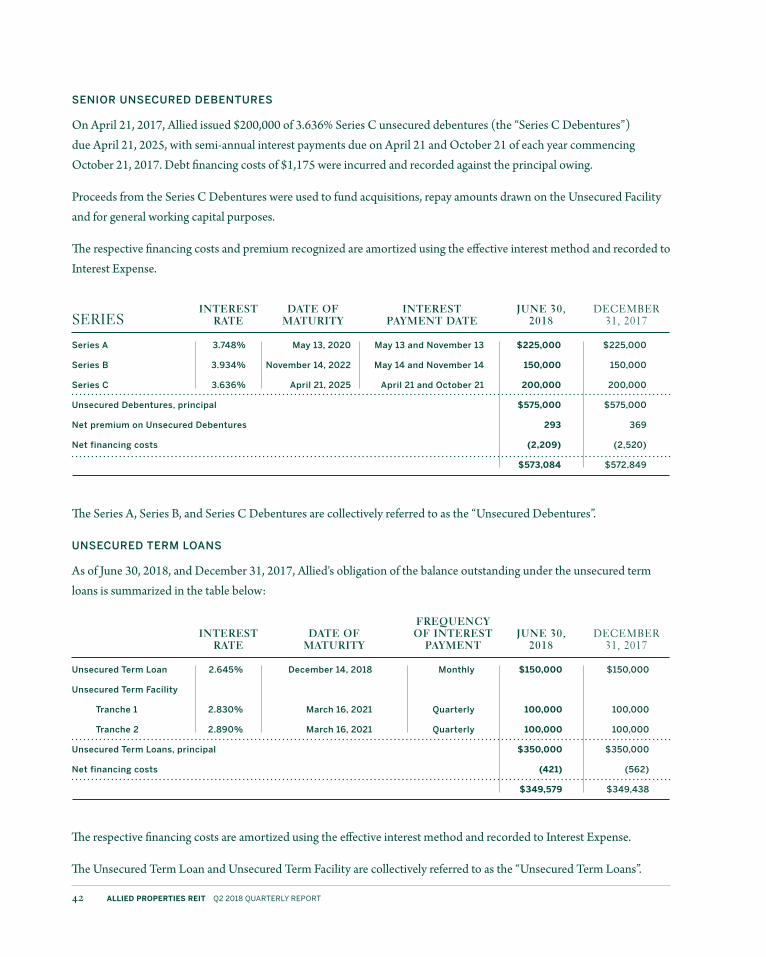
42 ALLIED PROPERTIES REIT Q2 2018 QUARTERLY REPORT
Series A 3 .748% May 13, 2020 May 13 and November 13 $225,000 $225,000
Series B 3 .934% November 14, 2022 May 14 and November 14 150,000 150,000
Series C 3 .636% April 21, 2025 April 21 and October 21 200,000 200,000
Unsecured Debentures, principal $575,000 $575,000
Net premium on Unsecured Debentures 293 369
Net financing costs (2,209) (2,520)
$573,084 $572,849
INTEREST RATE
DATE OF MATURITY
INTEREST PAYMENT DATE
JUNE 30, 2018
DECEMBER 31, 2017SERIES
SENIOR UNSECURED DEBENTURES
On April 21, 2017, Allied issued $200,000 of 3.636% Series C unsecured debentures (the “Series C Debentures”) due April 21, 2025, with semi-annual interest payments due on April 21 and October 21 of each year commencing October 21, 2017. Debt financing costs of $1,175 were incurred and recorded against the principal owing.
Proceeds from the Series C Debentures were used to fund acquisitions, repay amounts drawn on the Unsecured Facility and for general working capital purposes.
The respective financing costs and premium recognized are amortized using the effective interest method and recorded to Interest Expense.
The Series A, Series B, and Series C Debentures are collectively referred to as the “Unsecured Debentures”.
UNSECURED TERM LOANS
As of June 30, 2018, and December 31, 2017, Allied's obligation of the balance outstanding under the unsecured term loans is summarized in the table below:
Unsecured Term Loan 2 .645% December 14, 2018 Monthly $150,000 $150,000
Unsecured Term Facility
Tranche 1 2 .830% March 16, 2021 Quarterly 100,000 100,000
Tranche 2 2 .890% March 16, 2021 Quarterly 100,000 100,000
Unsecured Term Loans, principal $350,000 $350,000
Net financing costs (421) (562)
$349,579 $349,438
INTEREST RATE
DATE OF MATURITY
FREQUENCY OF INTEREST
PAYMENTJUNE 30,
2018DECEMBER
31, 2017
The respective financing costs are amortized using the effective interest method and recorded to Interest Expense.
The Unsecured Term Loan and Unsecured Term Facility are collectively referred to as the “Unsecured Term Loans”.
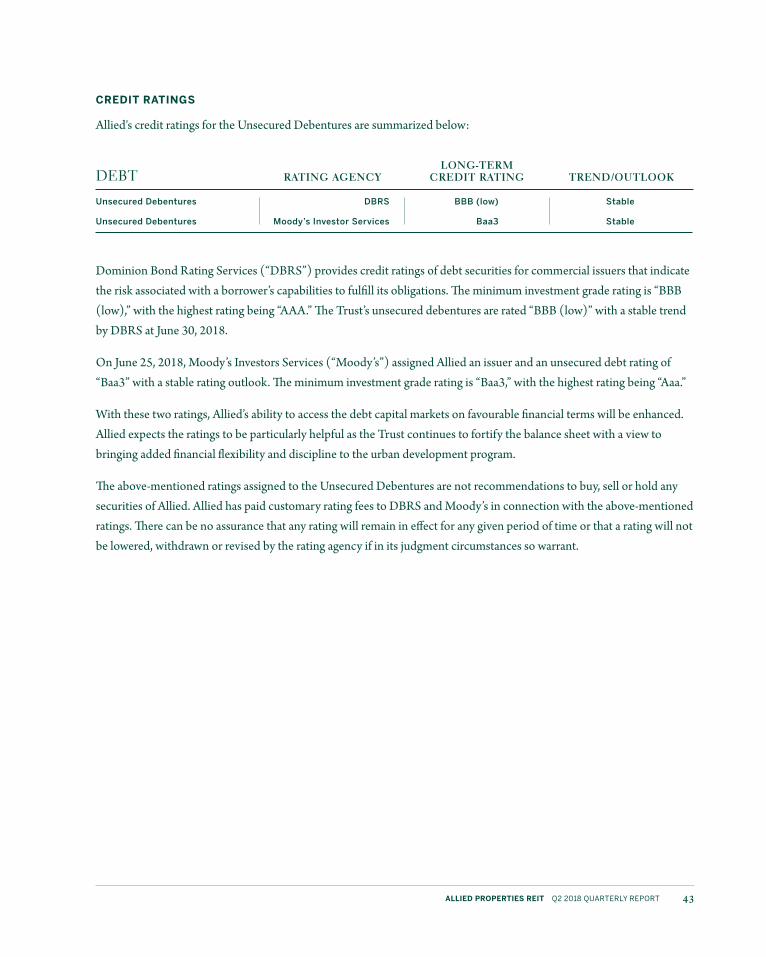
43ALLIED PROPERTIES REIT Q2 2018 QUARTERLY REPORT
Unsecured Debentures DBRS BBB (low) Stable
Unsecured Debentures Moody’s Investor Services Baa3 Stable
TREND/OUTLOOKLONG-TERM
CREDIT RATINGRATING AGENCYDEBT
CREDIT RATINGS
Allied's credit ratings for the Unsecured Debentures are summarized below:
Dominion Bond Rating Services (“DBRS”) provides credit ratings of debt securities for commercial issuers that indicate the risk associated with a borrower’s capabilities to fulfill its obligations. The minimum investment grade rating is “BBB (low),” with the highest rating being “AAA.” The Trust’s unsecured debentures are rated “BBB (low)” with a stable trend by DBRS at June 30, 2018.
On June 25, 2018, Moody’s Investors Services (“Moody’s”) assigned Allied an issuer and an unsecured debt rating of “Baa3” with a stable rating outlook. The minimum investment grade rating is “Baa3,” with the highest rating being “Aaa.”
With these two ratings, Allied’s ability to access the debt capital markets on favourable financial terms will be enhanced. Allied expects the ratings to be particularly helpful as the Trust continues to fortify the balance sheet with a view to bringing added financial flexibility and discipline to the urban development program.
The above-mentioned ratings assigned to the Unsecured Debentures are not recommendations to buy, sell or hold any securities of Allied. Allied has paid customary rating fees to DBRS and Moody’s in connection with the above-mentioned ratings. There can be no assurance that any rating will remain in effect for any given period of time or that a rating will not be lowered, withdrawn or revised by the rating agency if in its judgment circumstances so warrant.

44 ALLIED PROPERTIES REIT Q2 2018 QUARTERLY REPORT
FINANCIAL COVENANTS
The Unsecured Facility, Unsecured Term Loans and Unsecured Debentures contain numerous financial covenants. Failure to comply with the covenants could result in a default, which, if not waived or cured, could result in adverse financial consequences. The related covenants are as follows:
UNSECURED FACILITY AND UNSECURED TERM LOANS
The following outlines the requirements of covenants as defined in the agreements governing the Unsecured Facility and Unsecured Term Loans.
Pro forma interest Maintain a 12-month rolling consolidated coverage ratio pro forma EBITDA of at least 1 .65 times pro forma interest expense 2.9x 2 .8x
Pro forma asset Maintain net consolidated debt coverage test below 65% of net aggregate assets on a pro forma basis 29.7% 33 .7%
Equity maintenance covenant Maintain unitholders’ equity above $300,000 3,661,304 3,249,022
Pro forma unencumbered Maintain pro forma unencumbered net net aggregate adjusted aggregate adjusted assets above 1 .4 times asset ratio consolidated unsecured indebtedness 4.2x 3 .3x
DECEMBER 31, 2017JUNE 30, 2018THRESHOLDRATIO
Indebtedness ratio Below 60% 29.9% 33 .8%
Secured indebtedness ratio Below 45% 14.2% 17 .4%
Debt service coverage ratio Consolidated adjusted EBITDA to be more than 1 .5 times debt service payments 2.0x 2 .0x
Equity maintenance At least $1,250,000 plus 75% of future equity issuances 2,052,894 1,855,910
Unencumbered property Unencumbered property assets to be more assets ratio than 1 .4 times total unsecured debt 4.0x 3 .1x
Distribution payout ratio Maintain distributions below 100% of FFO 71.9% 71 .2%
DECEMBER 31, 2017JUNE 30, 2018THRESHOLDRATIO
SENIOR UNSECURED DEBENTURES
The following outlines the requirements of covenants specified in the Trust indenture agreement with respect to the Unsecured Debentures.
As of June 30, 2018, Allied was in compliance with the terms and covenants of the agreements governing the Unsecured Facility, the Unsecured Term Loans and the Unsecured Debentures.
A number of other financial ratios are also monitored by Allied, including net debt to EBITDA and EBITDA as a multiple of interest expense. These ratios are presented in Section I—Overview.

45ALLIED PROPERTIES REIT Q2 2018 QUARTERLY REPORT
JUNE 30, 2018 DECEMBER 31, 2017
Trust Units, beginning of period 92,935,150 $2,399,768 84,734,469 $2,098,267
Restricted unit plan (net of forfeitures) — (2,584) — (2,173)
Long-term incentive plan — — — 72
Unit option plan - options exercised 46,524 1,533 507,044 15,948
Unit offering 7,293,300 286,664 7,695,000 287,701
Purchase of Units under normal course issuer bid for cancellation — — (1,363) (47)
Trust Units, end of period 100,274,974 $2,685,381 92,935,150 $2,399,768
UNITS UNITSAMOUNT AMOUNT
UNITHOLDERS’ EQUITY
The following represents the number of Units issued and outstanding, and the related carrying value of Unitholders' equity, for the six months ended June 30, 2018, and for the year ended December 31, 2017.
As at August 1, 2018, 100,274,974 Trust Units and options to purchase 1,207,568 units were issued and outstanding.
On June 22, 2018, Allied raised gross proceeds of $299,025 through the issuance of 7,293,300 Units at a price of $41.00 per Unit. Costs relating to the issuance totaled $12,361 and were applied against the gross proceeds of the issuance and charged against Unitholders' equity.
Allied does not hold any of its own Units, nor does Allied reserve any Units for issue under options and contracts.
The table below represents weighted average Units outstanding for:
SIX MONTHS ENDEDTHREE MONTHS ENDED
Basic 93,697,810 84,938,714 93,327,182 84,853,716
Unit Option Plan 171,023 135,000 159,061 116,361
LTIP — — — 2,213
Fully diluted 93,868,833 85,073,714 93,486,243 84,972,290
JUNE 30, 2018JUNE 30, 2018 JUNE 30, 2017JUNE 30, 2017

46 ALLIED PROPERTIES REIT Q2 2018 QUARTERLY REPORT
NORMAL COURSE ISSUER BID
On February 20, 2018, Allied received approval from the Toronto Stock Exchange (“TSX”) for the renewal of its normal course issuer bid (“NCIB”), which entitles Allied to purchase up to 9,114,825 of its outstanding Units, representing approximately 10% of its public float as at February 14, 2018. The NCIB commenced February 22, 2018, and will expire on February 21, 2019, or such earlier date as Allied completes its purchases pursuant to the NCIB. All purchases under the NCIB will be made on the open market through the facilities of the TSX or alternate trading systems in Canada at market prices prevailing at the time of purchase. Any Units that are repurchased will either be cancelled or delivered to participants under Allied's Restricted Unit Plan or to employees pursuant to Allied's employee programs.
During the six months ended June 30, 2018, Allied purchased 61,733 Units for $2,584 at a weighted average price of $41.86 per Unit under its NCIB program, of which all were purchased for delivery to participants under the Trust's Restricted Unit Plan.
During the year ended December 31, 2017, Allied purchased 65,580 Units for $2,283 at a weighted average price of $34.81 per Unit under its NCIB program, of which 64,217 were purchased for delivery to participants under the Trust's Restricted Unit Plan and 1,363 were purchased for cancellation.
UNIT OPTION AND RESTRICTED UNIT PLANS
Allied adopted a Unit Option Plan providing for the issuance, from time to time, at the discretion of the trustees, of options to purchase Units for cash. Participation in the Unit Option Plan is restricted to certain employees of Allied. The Unit Option Plan complies with the requirements of the Toronto Stock Exchange. The exercise price of any option granted will not be less than the closing market price of the Units on the day preceding the date of grant. The term of the options may not exceed ten years. Options granted prior to February 22, 2017 vest evenly over three years; options granted subsequently vest evenly over four years from the date of grant. All options are settled in Units.
At June 30, 2018, Allied had issued options to purchase 1,207,568 Units outstanding, of which 634,402 had vested. At December 31, 2017, Allied had options to purchase 1,057,084 Units outstanding, of which 345,491 had vested.
For the three and six months ended June 30, 2018, Allied recorded share-based payment expense of $326 and $687, respectively, in general and administrative expense in the unaudited condensed consolidated statement of income and comprehensive income (for the three and six months ended June 30, 2017 - $330 and $771, respectively).

47ALLIED PROPERTIES REIT Q2 2018 QUARTERLY REPORT
Annualized increase per unit $0 .04 $0 .04 $0 .04 $0 .04 $0 .06 $0 .04 $0 .05 $0 .05 $0 .04 $0 .03 $0 .03
% increase 3 .6% 3 .5% 3 .4% 3 .3% 4 .8% 3 .0% 3 .7% 3 .5% 2 .7% 2 .0% 2 .0%
Annualized distribution per unit $1 .14 $1 .18 $1 .22 $1 .26 $1 .32 $1 .36 $1 .41 $1 .46 $1 .50 $1 .53 $1 .56
MARCH, 2004
MARCH, 2005
MARCH, 2006
MARCH, 2007
MARCH, 2008
DECEMBER, 2012
DECEMBER, 2013
DECEMBER, 2014
DECEMBER, 2016
DECEMBER, 2017
DECEMBER, 2015
In March 2010, Allied adopted a restricted unit plan (the “Restricted Unit Plan”), whereby restricted Units (“Restricted Units”) are granted to certain key employees and trustees, at the discretion of the Board of Trustees. The Restricted Units are purchased in the open market. Employees who are granted Restricted Units have the right to vote and to receive distributions from the date of the grant. The Restricted Units vest as to one-third on each of the three anniversaries following the date of the grant. Whether vested or not, without the specific authority of the Governance and Compensation Committee, the Restricted Units may not be sold, mortgaged or otherwise disposed of for a period of six years following the date of the grant. The Restricted Unit Plan contains provisions providing for the forfeiture within specified time periods of unvested Restricted Units in the event the employee’s employment is terminated. At June 30, 2018, Allied had 273,453 Restricted Units outstanding (December 31, 2017 – 241,557).
For the three and six months ended June 30, 2018, Allied recorded share-based payment expense of $560 and $1,093, respectively, in general and administrative expense in the unaudited condensed consolidated statement of income and comprehensive income (for the three and six months ended June 30, 2017 - $457 and $857, respectively).
DISTRIBUTIONS TO UNITHOLDERS
Allied is focused on increasing distributions to its unitholders on a regular and prudent basis. During the first 12 months of operations, Allied made regular monthly distributions of $1.10 per unit on an annualized basis. The distribution increases since then are set out in the table below:
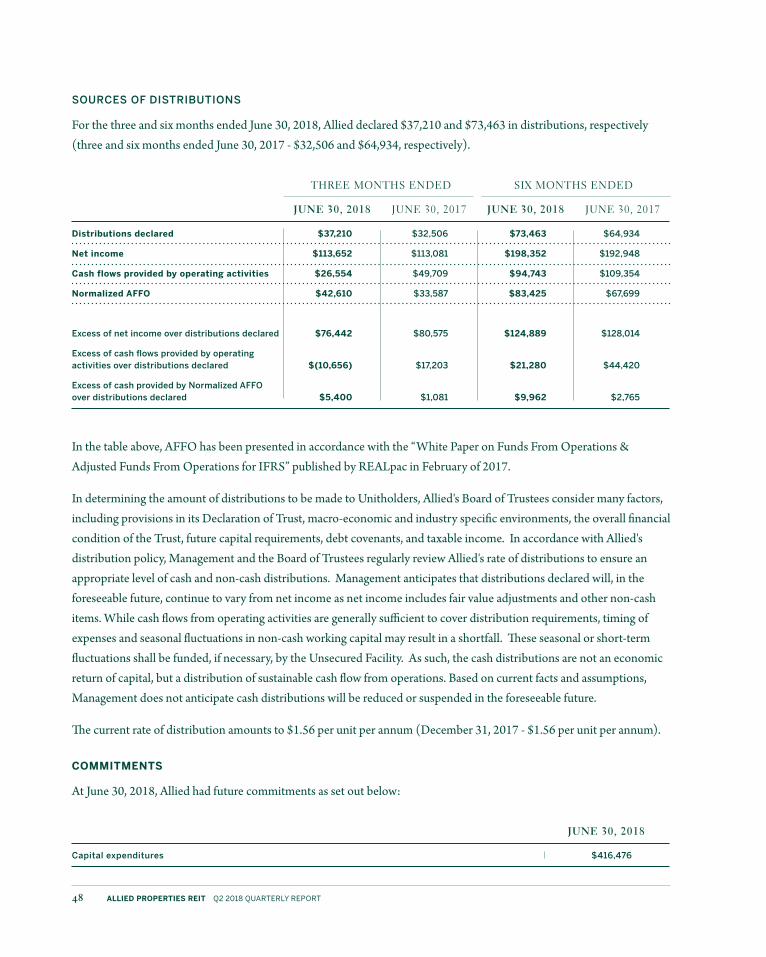
48 ALLIED PROPERTIES REIT Q2 2018 QUARTERLY REPORT
Capital expenditures $416,476
JUNE 30, 2018
SOURCES OF DISTRIBUTIONS
For the three and six months ended June 30, 2018, Allied declared $37,210 and $73,463 in distributions, respectively (three and six months ended June 30, 2017 - $32,506 and $64,934, respectively).
In the table above, AFFO has been presented in accordance with the “White Paper on Funds From Operations & Adjusted Funds From Operations for IFRS” published by REALpac in February of 2017.
In determining the amount of distributions to be made to Unitholders, Allied's Board of Trustees consider many factors, including provisions in its Declaration of Trust, macro-economic and industry specific environments, the overall financial condition of the Trust, future capital requirements, debt covenants, and taxable income. In accordance with Allied's distribution policy, Management and the Board of Trustees regularly review Allied's rate of distributions to ensure an appropriate level of cash and non-cash distributions. Management anticipates that distributions declared will, in the foreseeable future, continue to vary from net income as net income includes fair value adjustments and other non-cash items. While cash flows from operating activities are generally sufficient to cover distribution requirements, timing of expenses and seasonal fluctuations in non-cash working capital may result in a shortfall. These seasonal or short-term fluctuations shall be funded, if necessary, by the Unsecured Facility. As such, the cash distributions are not an economic return of capital, but a distribution of sustainable cash flow from operations. Based on current facts and assumptions, Management does not anticipate cash distributions will be reduced or suspended in the foreseeable future.
The current rate of distribution amounts to $1.56 per unit per annum (December 31, 2017 - $1.56 per unit per annum).
COMMITMENTS
At June 30, 2018, Allied had future commitments as set out below:
THREE MONTHS ENDED SIX MONTHS ENDED
Distributions declared $37,210 $32,506 $73,463 $64,934
Net income $113,652 $113,081 $198,352 $192,948
Cash flows provided by operating activities $26,554 $49,709 $94,743 $109,354
Normalized AFFO $42,610 $33,587 $83,425 $67,699
Excess of net income over distributions declared $76,442 $80,575 $124,889 $128,014
Excess of cash flows provided by operating activities over distributions declared $(10,656) $17,203 $21,280 $44,420
Excess of cash provided by Normalized AFFO over distributions declared $5,400 $1,081 $9,962 $2,765
JUNE 30, 2018 JUNE 30, 2018JUNE 30, 2017 JUNE 30, 2017

49ALLIED PROPERTIES REIT Q2 2018 QUARTERLY REPORT
Section V —Discussion Of Operations
The following sets out summary information and financial results for the three and six months ended June 30, 2018, and the comparable period in 2017.
NET INCOME AND COMPREHENSIVE INCOME
THREE MONTHS ENDED SIX MONTHS ENDED
Rental revenue from investment properties $106,983 $103,134 $213,877 $205,245
Property operating costs (45,540) (43,493) (91,868) (87,852)
Net rental income 61,443 59,641 122,009 117,393
Interest expense (23,362) (17,935) (39,288) (33,775)
General and administrative expenses (4,048) (2,628) (7,909) (6,128)
Amortization of other assets and leasing costs (412) (2,496) (817) (5,147)
Interest income 1,361 430 2,677 759
Fair value gain on investment properties 78,577 70,810 120,454 114,498
Fair value gain on derivative instruments 93 5,259 1,226 5,348
Net income and comprehensive income $113,652 $113,081 $198,352 $192,948
JUNE 30, 2018 JUNE 30, 2018JUNE 30, 2017 JUNE 30, 2017

50 ALLIED PROPERTIES REIT Q2 2018 QUARTERLY REPORT
Net income and comprehensive income for the three and six months ended June 30, 2018, increased by $571 and $5,404, respectively, over the comparable period in 2017. Excluding the effect of the yield maintenance costs, fair value changes on investment properties and derivative instruments, net income for the three and six months ended June 30, 2018, increased by $5,472 and $11,072 from the same period in the prior year primarily due to an increase in net rental and interest income and a decrease in amortized other assets and leasing costs, partially offset by higher general and administrative expenses.
NET OPERATING INCOME (“NOI”)
NOI is a non-IFRS financial measure and should not be considered as an alternative to net income or net income and comprehensive income, cash flow from operating activities or any other measure prescribed under IFRS. NOI does not have any standardized meaning prescribed by IFRS. As computed by Allied, NOI may differ from similar computations reported by other Canadian real estate investment trusts and, accordingly, may not be comparable to similar computations reported by such organizations. Management considers NOI to be a useful measure of performance for rental properties. Certain comparative figures have been reclassified to conform with the presentation adopted in the current year.
Allied operates in seven urban markets — Montréal, Ottawa, Toronto, Kitchener, Calgary, Edmonton and Vancouver. For the purpose of analyzing NOI, Allied grouped Montréal with Québec City and Ottawa as Eastern Canada, Toronto with Kitchener as Central Canada, Winnipeg with Calgary, Edmonton and Vancouver as Western Canada, and mission-critical facilities as Mission Critical. On December 20 and 27, 2017, Allied disposed of its Winnipeg and Québec City properties.
Over the past year, Allied's real estate portfolio has grown through acquisitions and development activities which have positively contributed to the operating results for the three and six months ended June 30, 2018, as compared to the same period in the prior year.
THREE MONTHS ENDED SIX MONTHS ENDED
Revenue from investment properties $106,983 $103,134 $213,877 $205,245
Property operating costs (45,540) (43,493) (91,868) (87,852)
Net rental income 61,443 59,641 122,009 117,393
Amortization of tenant improvements 7,267 5,227 14,238 10,559
Amortization of straight-line rents (1,793) (3,965) (3,173) (7,181)
NOI $66,917 $60,903 $133,074 $120,771
JUNE 30, 2018 JUNE 30, 2018JUNE 30, 2017 JUNE 30, 2017

51ALLIED PROPERTIES REIT Q2 2018 QUARTERLY REPORT
Office $46,659 69.7% $42,985 70 .6% $3,674 8 .5%
Mission Critical 11,334 16.9% 10,276 16 .9% 1,058 10 .3%
Retail 5,672 8.5% 4,689 7 .7% 983 21 .0%
Parking 3,252 4.9% 2,953 4 .8% 299 10 .1%
NOI $66,917 100.0% $60,903 100 .0% $6,014 9 .9%
CHANGE
JUNE 30, 2018 JUNE 30, 2017
THREE MONTHS ENDED
TYPE OF SPACE $ %
The following tables set out the NOI by segment and space type from the rental and development properties for the three and six months ended June 30, 2018, and the comparable period.
The increase in NOI for the three months ended June 30, 2018, was primarily the result of increased occupancy in Montréal, rent and occupancy growth in Toronto and increased occupancy at 250 Front Street West.
Office
Eastern Canada $16,702 25.0% $15,302 25 .1% $1,400 9 .1%
Central Canada 30,146 45.0% 27,004 44 .3% 3,142 11 .6%
Western Canada 7,721 11.5% 8,388 13 .8% (667) (8 .0)%
Office - Total 54,569 81.5% 50,694 83 .2% 3,875 7 .6%
Mission Critical 12,348 18.5% 10,209 16 .8% 2,139 21 .0%
NOI $66,917 100.0% $60,903 100 .0% $6,014 9 .9%
CHANGE
JUNE 30, 2018 JUNE 30, 2017
THREE MONTHS ENDED
SEGMENT $ %

52 ALLIED PROPERTIES REIT Q2 2018 QUARTERLY REPORT
The increase in NOI for the six months ended June 30, 2018, was primarily the result of increased occupancy in Montréal, rent and occupancy growth in Toronto, increased occupancy at 250 Front Street West and contributions from recent acquisitions.
Office $93,672 70.3% $85,658 70 .9% $8,014 9 .4%
Mission Critical 22,028 16.6% 19,537 16 .2% 2,491 12 .8%
Retail 10,910 8.2% 9,407 7 .8% 1,503 16 .0%
Parking 6,464 4.9% 6,169 5 .1% 295 4 .8%
NOI $133,074 100.0% $120,771 100 .0% $12,303 10 .2%
CHANGE
JUNE 30, 2018 JUNE 30, 2017
SIX MONTHS ENDED
TYPE OF SPACE $ %
Office
Eastern Canada $33,228 25.0% $31,253 25 .9% $1,975 6 .3%
Central Canada 60,060 45.1% 53,259 44 .1% 6,801 12 .8%
Western Canada 15,706 11.8% 16,722 13 .8% (1,016) (6 .1)%
Office - Total 108,994 81.9% 101,234 83 .8% 7,760 7 .7%
Mission Critical 24,080 18.1% 19,537 16 .2% 4,543 23 .3%
NOI $133,074 100.0% $120,771 100 .0% $12,303 10 .2%
CHANGE
JUNE 30, 2018 JUNE 30, 2017
SIX MONTHS ENDED
SEGMENT $ %

53ALLIED PROPERTIES REIT Q2 2018 QUARTERLY REPORT
THREE MONTHS ENDED CHANGE
Office
Eastern Canada $16,601 $14,386 $2,215 15 .4%
Central Canada 27,999 26,073 1,926 7 .4%
Western Canada 7,608 7,809 (201) (2 .6)%
Office 52,208 48,268 3,940 8 .2%
Mission Critical 12,349 10,209 2,140 21 .0%
Rental Portfolio - Same Asset NOI 64,557 58,477 6,080 10 .4%
Office 1,278 1,673 (395) (23 .6%)
Development Portfolio - Same Asset NOI 1,278 1,673 (395) (23 .6%)
Total Portfolio - Same Asset NOI $65,835 $60,150 $5,685 9 .5%
Acquisitions 708 55 653
Dispositions 14 441 (427)
Non-recurring items and other 360 257 103
NOI $66,917 $60,903 $6,014 9 .9%
Amortization of tenant improvements (7,267) (5,227) (2,040)
Amortization of straight-line rents 1,793 3,965 (2,172)
Net rental income $61,443 $59,641 $1,802 3 .0%
JUNE 30, 2018 $
JUNE 30, 2017 %
SAME ASSET NOI
Same asset NOI is a non-IFRS measure and refers to the NOI for those properties that Allied owned and operated for the entire period in question and for the same period in the prior year. Allied strives to maintain or increase same asset NOI over time.
The same asset NOI in the table below refers to those investment properties that were owned by Allied from April 1, 2017, to June 30, 2018. The same asset NOI of the development portfolio for the three months ended June 30, 2018, consists of 180 John, 189 Joseph, 425 Viger, 47 Front, Adelaide & Duncan, College & Palmerston, King Portland Centre (including 642 King), King & Spadina, The Lougheed (604-1st SW), Nordelec, TELUS Sky, and The Well.
Same asset NOI of the total portfolio increased by 9.5% for the three months ended June 30, 2018. Same asset NOI of the rental portfolio increased by 10.4% primarily as a result of increased occupancy in Montréal, rent growth in Toronto and increased occupancy at 250 Front Street West. Same asset NOI of the development portfolio decreased by 23.6%, primarily as a result of development commencing at 425 Viger and The Lougheed (604-1st SW), offset by full occupancy at 180 John and 189 Joseph, which were in development in the comparative quarter.
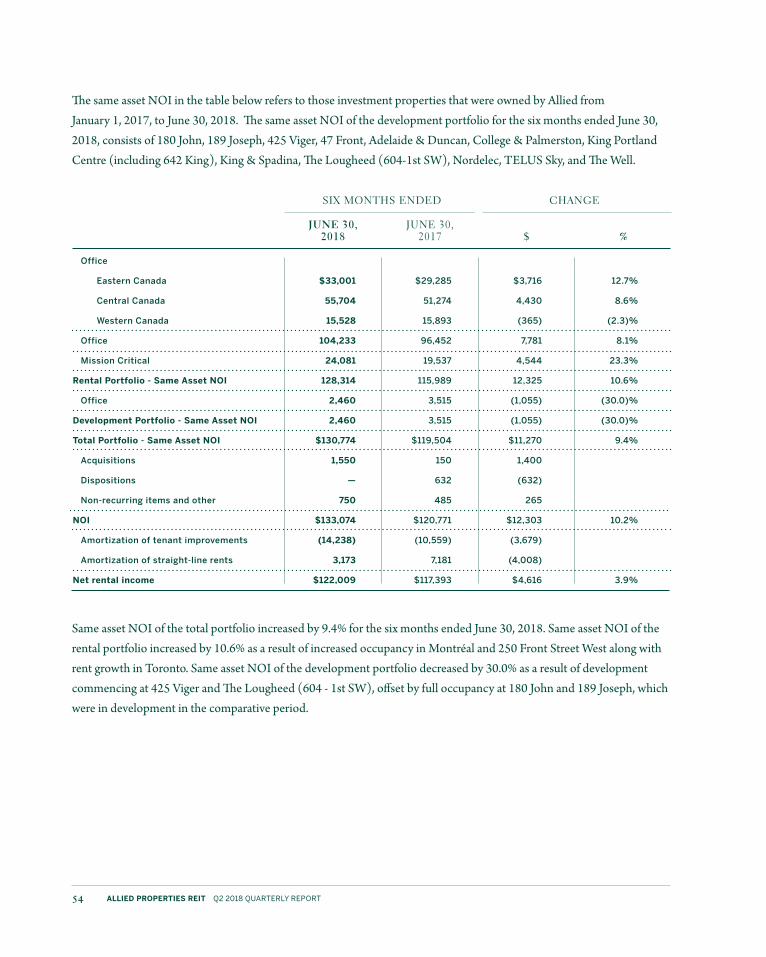
54 ALLIED PROPERTIES REIT Q2 2018 QUARTERLY REPORT
The same asset NOI in the table below refers to those investment properties that were owned by Allied from January 1, 2017, to June 30, 2018. The same asset NOI of the development portfolio for the six months ended June 30, 2018, consists of 180 John, 189 Joseph, 425 Viger, 47 Front, Adelaide & Duncan, College & Palmerston, King Portland Centre (including 642 King), King & Spadina, The Lougheed (604-1st SW), Nordelec, TELUS Sky, and The Well.
Same asset NOI of the total portfolio increased by 9.4% for the six months ended June 30, 2018. Same asset NOI of the rental portfolio increased by 10.6% as a result of increased occupancy in Montréal and 250 Front Street West along with rent growth in Toronto. Same asset NOI of the development portfolio decreased by 30.0% as a result of development commencing at 425 Viger and The Lougheed (604 - 1st SW), offset by full occupancy at 180 John and 189 Joseph, which were in development in the comparative period.
SIX MONTHS ENDED CHANGE
Office
Eastern Canada $33,001 $29,285 $3,716 12 .7%
Central Canada 55,704 51,274 4,430 8 .6%
Western Canada 15,528 15,893 (365) (2 .3)%
Office 104,233 96,452 7,781 8 .1%
Mission Critical 24,081 19,537 4,544 23 .3%
Rental Portfolio - Same Asset NOI 128,314 115,989 12,325 10 .6%
Office 2,460 3,515 (1,055) (30 .0)%
Development Portfolio - Same Asset NOI 2,460 3,515 (1,055) (30 .0)%
Total Portfolio - Same Asset NOI $130,774 $119,504 $11,270 9 .4%
Acquisitions 1,550 150 1,400
Dispositions — 632 (632)
Non-recurring items and other 750 485 265
NOI $133,074 $120,771 $12,303 10 .2%
Amortization of tenant improvements (14,238) (10,559) (3,679)
Amortization of straight-line rents 3,173 7,181 (4,008)
Net rental income $122,009 $117,393 $4,616 3 .9%
JUNE 30, 2018 $
JUNE 30, 2017 %

55ALLIED PROPERTIES REIT Q2 2018 QUARTERLY REPORT
INTEREST EXPENSE
For the three and six months ended June 30, 2018, excluding capitalized interest, interest expense increased over the comparable periods in 2017 primarily due to the one-time yield maintenance cost of $7,502 incurred for the early repayment of the first mortgage on 151 Front Street West, Toronto.
For the three and six months ended June 30, 2018, capitalized interest increased over the comparable period in 2017 with the continuation of development and upgrade activities across the portfolio.
In accordance with IAS 23 - Borrowing Costs, interest may be capitalized on properties in connection with activity required to get the assets ready for their intended use (refer to note 2 (g) in Allied's consolidated financial statements for the year ended December 31, 2017, for further details). This would include upgrade work as well as work completed in relation to a future development, such as obtaining zoning approval, completing site approval plans, engineering and architectural drawings. On completion of upgrade and development activity, the ability to capitalize interest expense ends, partially offsetting the positive impact of occupancy commencement.
THREE MONTHS ENDED SIX MONTHS ENDED
Interest on debt:
Mortgages payable $10,671 $12,562 $21,662 $25,122
Construction loans payable 498 171 903 232
Unsecured Facility 1,018 376 1,571 930
Unsecured Debentures 5,416 5,052 10,832 8,650
Unsecured Term Loans 2,388 2,411 4,757 4,794
Interest on finance lease obligations 2,063 1,842 4,155 3,379
Amortization, premium (discount) on debt (631) (83) (1,224) (130)
Amortization, net financing costs 452 479 904 1,012
$21,875 $22,810 $43,560 $43,989
Less: Interest capitalized to qualifying investment properties (6,015) (4,875) (11,774) (10,214)
Interest expense excluding yield maintenance cost $15,860 $17,935 $31,786 $33,775
Adjustment for yield maintenance cost due to early repayment 7,502 — 7,502 —
Interest expense $23,362 $17,935 $39,288 $33,775
JUNE 30, 2018 JUNE 30, 2018JUNE 30, 2017 JUNE 30, 2017

56 ALLIED PROPERTIES REIT Q2 2018 QUARTERLY REPORT
GENERAL AND ADMINISTRATIVE EXPENSES
For the three and six months ended June 30, 2018, general and administrative expenses increased by $1,420 and $1,781, respectively, from the comparable periods in 2017. The increase for the three and six months ended June 30, 2018, is mainly due to higher salaries and benefits.
OTHER FINANCIAL PERFORMANCE MEASURES
FUNDS FROM OPERATIONS AND NORMALIZED FUNDS FROM OPERATIONS ("FFO" AND
"NORMALIZED FFO")
FFO is a non-IFRS financial measure used by most Canadian real estate investment trusts and should not be considered as an alternative to net income or comprehensive income, cash flow from operating activities or any other measure prescribed under IFRS. While FFO does not have any standardized meaning prescribed by IFRS, the Real Property Association of Canada (“REALpac”) established a standardized definition of FFO. Management believes that this definition is followed by most Canadian real estate investment trusts and that it is a useful measure of cash available for distributions. Normalized FFO starts with the standardized definition of FFO and removes the effects of the one-time, extraordinary item related to $7,502 of yield maintenance cost incurred on the early repayment of the first mortgage on 151 Front Street West, Toronto.
For the three months ended June 30, 2018, excluding the one-time extraordinary item of the yield maintenance cost, Normalized FFO totaled $0.55 per unit. This is an increase of $0.01 per unit, or 1.9% with the same period FFO in the prior year. The increase was primarily due to an increase in NOI and interest income.
For the six months ended June 30, 2018, excluding the one-time extraordinary item of a yield maintenance cost, Normalized FFO totaled $1.08 per unit. This is an increase of $0.02 per unit, or 1.9%, as compared to the same period FFO in the prior year. The increase was primarily due to an increase in NOI and interest income.
THREE MONTHS ENDED SIX MONTHS ENDED
Salaries and benefits $3,422 $2,868 $6,823 $6,185
Professional and directors fees 681 561 1,287 1,210
Office and general expenses 886 478 1,665 1,101
$4,989 $3,907 $9,775 $8,496
Capitalized to qualifying investment properties (941) (1,279) (1,866) (2,368)
Total $4,048 $2,628 $7,909 $6,128
JUNE 30, 2018 JUNE 30, 2018JUNE 30, 2017 JUNE 30, 2017

57ALLIED PROPERTIES REIT Q2 2018 QUARTERLY REPORT
To ensure sufficient cash is retained to meet capital improvement and leasing objectives, Allied strives to maintain an appropriate Normalized FFO pay-out ratio, which is the ratio of actual distributions to Normalized FFO in a given period. For the three and six months ended June 30, 2018, the Normalized FFO pay-out ratio was 72.6% and 72.5%, respectively.
NORMALIZED ADJUSTED FUNDS FROM OPERATIONS ("NORMALIZED AFFO")
AFFO is a non-IFRS financial measure used by most Canadian real estate investment trusts and should not be considered as an alternative to net income or comprehensive income, cash flow from operating activities or any other measure prescribed under IFRS. AFFO does not have any standardized meaning prescribed by IFRS. The Real Property Association of Canada (“REALpac”) established a standardized definition of AFFO in its February 2017 white paper. Management considers AFFO to be a useful measure of recurring economic earnings. The principal advantage of AFFO is that it starts from the standardized definition of FFO and takes account of regular maintenance capital expenditures and regular leasing expenditures while ignoring the impact of non-cash revenue. With the adoption of the February 2017 white paper, Allied added recoverable maintenance capital expenditures and incremental leasing costs related to regular leasing in order to comply with the white paper. As regular maintenance capital expenditures and regular leasing expenditures are not incurred evenly throughout a fiscal year, there can be volatility in AFFO on a quarterly basis.
FFO is normalized for the one-time, extraordinary item related to $7,502 of yield maintenance cost incurred on the early repayment of the first mortgage on 151 Front Street West, Toronto, resulting in Normalized AFFO.
For the three months ended June 30, 2018, Normalized AFFO totaled $0.45 per unit. This represents an increase of $0.06 per unit, or 15.4%, over the comparable period in the prior year. Including the changes in Normalized FFO discussed above, Normalized AFFO per unit increased due to lower straight line rent amortization as occupied space became economically productive, lower regular maintenance capital expenditures and lower recoverable maintenance capital expenditures, partially offset by higher regular leasing expenditures.
For the six months ended June 30, 2018, Normalized AFFO totaled $0.89 per unit. This represents an increase of $0.09 per unit, or 11.3%, over the comparable period in the prior year. Including the changes in Normalized FFO discussed above, Normalized AFFO per unit increased primarily due to lower straight line rent amortization as occupied space became economically productive. It also increased due to lower regular maintenance capital expenditures and recoverable maintenance capital expenditures, partially offset by higher regular leasing expenditures.
To ensure sufficient cash is retained to meet capital improvement and leasing objectives, Allied strives to maintain an appropriate Normalized AFFO pay-out ratio, which is the ratio of actual distributions to Normalized AFFO in a given period. For the three and six months ended June 30, 2018, the Normalized AFFO pay-out ratio was 87.3% and 88.1%, respectively.
The following table reconciles Allied’s net income to FFO, Normalized FFO and Normalized AFFO for the three months ended June 30, 2018, and June 30, 2017.

58 ALLIED PROPERTIES REIT Q2 2018 QUARTERLY REPORT
RECONCILIATION OF FFO, NORMALIZED FFO AND NORMALIZED AFFO
CHANGE
THREE MONTHS ENDED
Net income and comprehensive income $113,652 $113,081 $571
Adjustment to fair value of investment properties (78,577) (70,810) (7,767)
Adjustment to fair value of derivative instruments (93) (5,259) 5,166
Incremental leasing costs 1,501 1,342 159
Amortization of leasing costs and tenant improvements 7,267 7,270 (3)
FFO $43,750 $45,624 $(1,874)
Add impact of other adjustments:
One-time extraordinary item (1) 7,502 — 7,502
Normalized FFO $51,252 $45,624 $5,628
Amortization of straight-line rents (1,793) (3,965) 2,172
Regular leasing expenditures (4,876) (3,293) (1,583)
Regular maintenance capital expenditures (288) (1,311) 1,023
Incremental leasing (related to regular leasing expenditures) (1,051) (940) (111)
Recoverable maintenance capital expenditures (634) (2,528) 1,894
Normalized AFFO $42,610 $33,587 $9,023
Weighted average number of Units
Basic 93,697,810 84,938,714 8,759,096
Diluted 93,868,833 85,073,714 8,795,119
Per Unit - basic
FFO $0.47 $0 .54 $(0 .07)
Normalized FFO $0.55 $0 .54 $0 .01
Normalized AFFO $0.45 $0 .40 $0 .05
Per Unit - diluted
FFO $0.47 $0 .54 $(0 .07)
Normalized FFO $0.55 $0 .54 $0 .01
Normalized AFFO $0.45 $0 .39 $0 .06
Payout Ratio
FFO 85.1% 71 .2% 13 .9%
Normalized FFO 72.6% 71 .2% 1 .4%
Normalized AFFO 87.3% 96 .8% (9 .5%)
JUNE 30, 2018 JUNE 30, 2017
(1) The one-time extraordinary item related to $7,502 of yield maintenance cost incurred on the early repayment of the first mortgage on 151 Front Street West, Toronto.

59ALLIED PROPERTIES REIT Q2 2018 QUARTERLY REPORT
SIX MONTHS ENDED
Net income and comprehensive income $198,352 $192,948 $5,404
Adjustment to fair value of investment properties (120,454) (114,498) (5,956)
Adjustment to fair value of derivative instruments (1,226) (5,348) 4,122
Incremental leasing costs 2,875 2,520 355
Amortization of leasing costs and tenant improvements 14,238 14,732 (494)
FFO $93,785 $90,354 $3,431
Add impact of other adjustments:
One-time extraordinary item (1) 7,502 — 7,502
Normalized FFO $101,287 $90,354 $10,933
Amortization of straight-line rents (3,173) (7,181) 4,008
Regular leasing expenditures (11,559) (8,308) (3,251)
Regular maintenance capital expenditures (376) (1,920) 1,544
Incremental leasing (related to regular leasing expenditures) (2,013) (1,764) (249)
Recoverable maintenance capital expenditures (741) (3,482) 2,741
Normalized AFFO $83,425 $67,699 $15,726
Weighted average number of Units
Basic 93,327,182 84,853,716 8,473,466
Diluted 93,486,243 84,972,290 8,513,953
Per Unit - basic
FFO $1.00 $1 .06 $(0 .06)
Normalized FFO $1.09 $1 .06 $0 .03
Normalized AFFO $0.89 $0 .80 $0 .09
Per Unit - diluted
FFO $1.00 $1 .06 $(0 .06)
Normalized FFO $1.08 $1 .06 $0 .02
Normalized AFFO $0.89 $0 .80 $0 .09
Payout Ratio
FFO 78.3% 71 .9% 6 .4%
Normalized FFO 72.5% 71 .9% 0 .6%
Normalized AFFO 88.1% 95 .9% (7 .8%)
CHANGEJUNE 30, 2018 JUNE 30, 2017
The following table reconciles Allied's net income to FFO, Normalized FFO and Normalized AFFO for the six months ended June 30, 2018, and June 30, 2017.
(1) The one-time extraordinary item related to $7,502 of yield maintenance cost incurred on the early repayment of the first mortgage on 151 Front Street West, Toronto.

60 ALLIED PROPERTIES REIT Q2 2018 QUARTERLY REPORT
The following table reconciles FFO, Normalized FFO and Normalized AFFO to cash flows from operating activities for the periods ended as indicated:
(1) The one-time extraordinary item related to $7,502 of yield maintenance cost incurred on the early repayment of the first mortgage on 151 Front Street West, Toronto.
THREE MONTHS ENDED SIX MONTHS ENDED
Cash flows from operating activities $26,554 $49,709 $94,743 $109,354
Add (deduct) impact of the following:
Amortization of equipment and other assets (412) (453) (817) (974)
Amortization of straight-line rents 1,793 3,965 3,173 7,181
Amortization, (premium) discount on assumed debt 631 83 1,224 130
Amortization of finance lease obligations 71 (171) (64) 238
Non-cash interest expense 6,118 1,855 1,026 (2,108)
Unit-compensation expense (886) (787) (1,780) (1,628)
Change in other non-cash financing items (625) (560) (1,075) (1,093)
Change in other non-cash operating items 7,521 (9,359) (10,114) (23,266)
Additions to residential inventory 1,484 — 4,594 —
Incremental leasing costs 1,501 1,342 2,875 2,520
FFO $43,750 $45,624 $93,785 $90,354
One-time extraordinary item (1) 7,502 — 7,502 —
Normalized FFO $51,252 $45,624 $101,287 $ 90,354
Amortization of straight-line rents (1,793) (3,965) (3,173) (7,181)
Regular leasing expenditures (4,876) (3,293) (11,559) (8,308)
Regular maintenance capital expenditures (288) (1,311) (376) (1,920)
Incremental leasing (related to regular leasing expenditures) (1,051) (940) (2,013) (1,764)
Recoverable maintenance capital expenditures (634) (2,528) (741) (3,482)
Normalized AFFO $42,610 $33,587 $83,425 $67,699
JUNE 30, 2018 JUNE 30, 2018JUNE 30, 2017 JUNE 30, 2017

61ALLIED PROPERTIES REIT Q2 2018 QUARTERLY REPORT
CAPITAL EXPENDITURES
Our portfolio requires ongoing maintenance capital expenditures and leasing expenditures. Leasing expenditures include the cost of in-suite or base-building improvements made in connection with the leasing of vacant space or the renewal or replacement of tenants occupying space covered by maturing leases, as well as improvement allowances and commissions paid in connection with the leasing of vacant space and the renewal or replacement of tenants occupying space covered by maturing leases.
For three months ended June 30, 2018, Allied incurred (i) $4,876 in regular leasing expenditures or $10.72 per leased square foot, (ii) $288 in regular maintenance capital expenditures and (iii) $634 of recoverable maintenance capital expenditures.
For the six months ended June 30, 2018, Allied incurred (i) $11,559 in regular leasing expenditures or $11.67 per leased square foot, (ii) $376 in regular maintenance capital expenditures and (iii) $741 of recoverable maintenance capital expenditures.
For the three and six months ended June 30, 2018, Allied invested $56,093 and $97,069, respectively, of revenue enhancing capital into the rental and development portfolio to enhance its income-producing capability and in ongoing development activity.
THREE MONTHS ENDED SIX MONTHS ENDED
Regular leasing expenditures $4,876 $3,293 $11,559 $8,308
Regular maintenance capital expenditures $288 $1,311 $376 $1,920
Recoverable maintenance capital expenditures $634 $2,528 $741 $3,482
Revenue-enhancing capital and development costs $56,093 $46,332 $97,069 $86,798
JUNE 30, 2018 JUNE 30, 2018JUNE 30, 2017 JUNE 30, 2017

62 ALLIED PROPERTIES REIT Q2 2018 QUARTERLY REPORT
EARNINGS BEFORE INTEREST, TAXES, DEPRECIATION AND AMORTIZATION ("EBITDA")
EBITDA is a non-IFRS measure that is comprised of earnings before interest expense, income taxes, depreciation expense and amortization expense. Adjusted EBITDA, as defined by Allied, is a non-IFRS measure that is comprised of net earnings before interest expense, income taxes, depreciation expense and amortization expense, as well as gains and losses on disposal of investment properties and the fair value changes associated with investment properties and financial instruments.
EBITDA is a metric that can be used to help determine Allied’s ability to service its debt, finance capital expenditures and provide for distributions to its Unitholders. Additionally, Adjusted EBITDA removes the non-cash impact of the fair value changes and gains and losses on investment property dispositions.
The ratio of Net Debt to Adjusted EBITDA is included and calculated each period to provide information on the level of Allied’s debt versus Allied’s ability to service that debt. Adjusted EBITDA is used as part of this calculation as the fair value changes and gains and losses on investment property dispositions do not impact cash flow, which is a critical part of the measure.
The following table reconciles Allied's net income and comprehensive income to Adjusted EBITDA for the three and six months ended June 30, 2018, and June 30, 2017.
THREE MONTHS ENDED SIX MONTHS ENDED
Net income and comprehensive income for the period $113,652 $113,081 $198,352 $192,948
Interest expense 23,362 17,935 39,288 33,775
Amortization of equipment and other assets 412 453 817 974
Amortization of leasing commissions — 2,043 — 4,173
Amortization of tenant improvement allowances 7,267 5,227 14,238 10,559
Fair value (gain) on investment properties (78,577) (70,810) (120,454) (114,498)
Fair value (gain) on derivative instruments (93) (5,259) (1,226) (5,348)
Adjusted EBITDA $66,023 $62,670 $131,015 $122,583
JUNE 30, 2018 JUNE 30, 2018JUNE 30, 2017 JUNE 30, 2017

63ALLIED PROPERTIES REIT Q2 2018 QUARTERLY REPORT
Section VI —Historical Performance

64 ALLIED PROPERTIES REIT Q2 2018 QUARTERLY REPORT
The following sets out summary information and financial results for the eight most recently completed fiscal quarters.
(1) Allied normalized FFO and AFFO in Q2 2018 and Q3 2016 by excluding a one-time extraordinary item.
Rental revenue from investment properties $106,983 $106,894 $107,709 $106,309 $103,134 $102,111 $104,497 $96,712
Property operating costs (45,540) (46,328) (46,419) (45,277) (43,493) (44,359) (47,939) (41,064)
Net rental income $61,443 $60,566 $61,290 $61,032 $59,641 $57,752 $56,558 $55,648
Net income and comprehensive income $113,652 $84,700 $63,066 $101,945 $113,081 $79,867 $163,731 $53,961
Weighted average units (diluted) 93,868,833 93,099,918 93,027,626 88,936,173 85,073,714 84,868,429 84,826,679 81,620,796
Distributions $37,210 $36,253 $35,754 $34,489 $32,506 $32,428 $31,984 $30,996
FFO $43,750 $50,035 $49,051 $47,799 $45,624 $44,730 $45,501 $42,720
FFO per unit (diluted) $0 .47 $0 .54 $0 .53 $0 .54 $0 .54 $0 .53 $0 .54 $0 .52
FFO pay-out ratio 85 .1% 72 .5% 72 .9% 72 .2% 71 .2% 72 .5% 70 .3% 72 .6%
Normalized FFO (1) $51,252 $50,035 $49,051 $47,799 $45,624 $44,730 $45,501 $43,855
Normalized FFO per unit (diluted) $0 .55 $0 .54 $0 .53 $0 .54 $0 .54 $0 .53 $0 .54 $0 .54
Normalized FFO pay-out ratio 72 .6% 72 .5% 72 .9% 72 .2% 71 .2% 72 .5% 70 .3% 70 .7%
Normalized AFFO (1) $42,610 $40,815 $38,072 $33,897 $33,587 $34,112 $32,770 $31,813
Normalized AFFO per unit (diluted) $0 .45 $0 .44 $0 .41 $0 .38 $0 .39 $0 .40 $0 .39 $0 .39
Normalized AFFO pay-out ratio 87 .3% 88 .8% 93 .9% 101 .7% 96 .8% 95 .1% 97 .6% 97 .4%
Investment properties $5,886,980 $5,740,597 $5,627,439 $5,534,005 $5,444,426 $5,237,400 $5,129,541 $4,939,585
Total debt $1,808,302 $2,019,245 $1,959,877 $1,989,815 $2,062,989 $1,944,203 $1,909,265 $1,909,720
Total indebtedness ratio 29 .9% 34 .0% 33 .8% 34 .3% 37 .3% 36 .6% 36 .7% 37 .6%
Total rental GLA 10,940 10,929 11,268 11,818 11,805 11,747 11,843 11,849
Leased rental GLA 10,435 10,380 10,728 11,027 11,000 10,879 10,906 10,839
Leased area % 95 .4% 95 .0% 95 .2% 93 .3% 93 .2% 92 .6% 92 .1% 91 .5%
Q2 2018 (1)
Q1 2018
Q4 2017
Q3 2017
Q2 2017
Q1 2017
Q4 2016
Q3 2016 (1)

65ALLIED PROPERTIES REIT Q2 2018 QUARTERLY REPORT
Factors that cause variation from quarter to quarter include, but are not limited to, occupancy, cost of capital, same asset NOI, acquisition activity, leasing expenditures and maintenance capital expenditures. While Allied's Normalized FFO per unit has been flat over the past eight quarters, its total indebtedness ratio has declined from 37.6% to 29.9% over the same time period.

66 ALLIED PROPERTIES REIT Q2 2018 QUARTERLY REPORT
Section VII — Accounting Estimates And Assumptions
SIGNIFICANT ACCOUNTING POLICIES
Accounting policies and any respective changes are discussed in notes 2 and 3 of Allied’s unaudited condensed consolidated financial statements for the three and six months ended June 30, 2018.
Furthermore, the future accounting policy changes as proposed by the International Accounting Standards Board (the “IASB”) are discussed in Allied's consolidated financial statements for the year ended December 31, 2017, and notes contained therein.

67ALLIED PROPERTIES REIT Q2 2018 QUARTERLY REPORT
Section VIII —Disclosure Controls And Internal Controls
Management maintains appropriate information systems, procedures and controls to provide reasonable assurance that information that is publicly disclosed is complete, reliable and timely. The Chief Executive Officer (CEO) and Chief Financial Officer (CFO) of the Trust, along with the assistance of senior management, have designed disclosure controls and procedures to provide reasonable assurance that material information relating to the Trust is made known to the CEO and CFO, and have designed internal controls over financial reporting to provide reasonable assurance regarding the reliability of financial reporting and the preparation of financial statements in accordance with IFRS.
No changes were made in our design of internal controls over financial reporting during the period ended June 30, 2018, that have materially affected, or are reasonably likely to materially affect, our internal controls over financial reporting.
It should be noted that a control system, no matter how well conceived and operated, can provide only reasonable, not absolute, assurance that the objectives of the control system are met. Because of the inherent limitations in all control systems, no evaluation of controls can provide absolute assurance of control issues, including whether instances of fraud, if any, have been detected. These inherent limitations include, among other items: (i) that Management’s assumptions and judgments could ultimately prove to be incorrect under varying conditions and circumstances; (ii) the impact of any undetected errors; and (iii) that controls may be circumvented by the unauthorized acts of individuals, by collusion of two or more people, or by Management override.

68 ALLIED PROPERTIES REIT Q2 2018 QUARTERLY REPORT
Section IX —Risks And Uncertainties
There are certain risk factors inherent in the investment and ownership of real estate. Real estate investments are capital intensive, and success from real estate investments depends upon maintaining occupancy levels and rental income flows to generate acceptable returns. These success factors are dependent on general economic conditions and local real estate markets, demand for leased premises and competition from other available properties.
Allied’s portfolio is focused on a particular asset class in seven metropolitan real estate markets in Canada. This focus enables Management to capitalize on certain economies of scale and competitive advantages that would not otherwise be available.

69ALLIED PROPERTIES REIT Q2 2018 QUARTERLY REPORT
FINANCING AND INTEREST RATE RISK
Allied is subject to risk associated with debt financing. The availability of debt to re-finance existing and maturing loans and the cost of servicing such debt will influence our success. In order to minimize risk associated with debt financing, Allied strives to re-finance maturing loans with long-term fixed-rate debt and to stagger the maturities over time. Allied's current debt-maturity schedule is set out below:
Interest rates on total debt are between 3.59% and 6.88% with a weighted average interest rate of 3.89%. The weighted average term of our debt is 3.86 years. The aforementioned excludes the revolving Unsecured Facility and construction loans, refer to Note 10(c) of the unaudited condensed consolidated financial statements for further details.
Allied is additionally subject to risk associated with equity financing. The ability to access the equity capital markets at appropriate points in time and at an acceptable cost will influence our success. In order to minimize the risk associated with equity financing, Allied engages in extensive investor-relations activity with retail and institutional investors globally and strives to fix the cost of equity in conjunction with a clear use of proceeds.

70 ALLIED PROPERTIES REIT Q2 2018 QUARTERLY REPORT
CREDIT RISK
Allied is subject to credit risk arising from the possibility that tenants may not be able to fulfill their lease obligations. Allied strives to mitigate this risk by maintaining a diversified tenant-mix and limiting exposure to any single tenant. Allied's exposure to top-10 tenants is 19.6% of gross revenue, which continues to decline, and the credit quality of our top-10 tenants continues to improve.
As Allied has invested in mortgages to facilitate acquisitions, further credit risks arise in the event that borrowers default on the repayment of their mortgages to Allied. Allied’s mortgage investments will typically be subordinate to prior ranking mortgage or charges. Not all of Allied’s financing activities will translate into acquisitions. As at June 30, 2018 and as at the date of this MD&A, Allied had $98,676 in loans receivable and advances to developer, loaned to affiliates of a single private company. In the event of a large commercial real estate market correction, the fair market value of an underlying property may be unable to support the mortgage investment. Allied mitigates this risk by obtaining corporate guarantees and/or registered mortgage charges.

71ALLIED PROPERTIES REIT Q2 2018 QUARTERLY REPORT
LEASE ROLL-OVER RISK
Allied is subject to lease roll-over risk. Lease roll-over risk arises from the possibility that Allied may experience difficulty renewing or replacing tenants occupying space covered by leases that mature. Allied strives to stagger its lease maturity schedule so that it is not faced with a disproportionately large level of lease maturities in a given year. Allied's current lease maturity schedule is set out below:
In evaluating lease roll-over risk, it is informative to determine Allied's sensitivity to a decline in occupancy. For every full-year decline of 100 basis points in occupancy at its average rental rate per square foot, Allied's annual Normalized AFFO would decline by approximately $4,278 (approximately $0.05 per unit). The decline in Normalized AFFO per unit would be more pronounced if the decline in occupancy involved space leased above our average rental rate per square foot and less pronounced if the decline in occupancy involved space leased below our average rental rate per square foot.

72 ALLIED PROPERTIES REIT Q2 2018 QUARTERLY REPORT
ENVIRONMENTAL AND CLIMATE CHANGE RISK
As an owner of real estate, Allied is subject to various federal, provincial and municipal laws relating to environmental matters. Such laws provide that Allied could be liable for the costs of removal of certain hazardous substances and remediation of certain hazardous locations. The failure to remove or remediate such substances or locations, if any, could adversely affect Allied's ability to sell such real estate or to borrow using such real estate as collateral and could potentially also result in claims against Allied. Allied is not aware of any material non-compliance with environmental laws at any of the properties. Allied is also not aware of any pending or threatened investigations or actions by environmental regulatory authorities in connection with any of the properties or any pending or threatened claims relating to environmental conditions at the properties.
Allied will make the necessary capital and operating expenditures to ensure compliance with environmental laws and regulations. Although there can be no assurances, Allied does not believe that costs relating to environmental matters will have a material adverse effect on Allied's business, financial condition or results of operation. However, environmental laws and regulations may change and Allied may become subject to more stringent environmental laws and regulations in the future. Compliance with more stringent environmental laws and regulations could have an adverse effect on Allied's business, financial condition or results of operation. It is Allied's operating policy to obtain a Phase I environmental assessment conducted by an independent and experienced environmental consultant prior to acquiring a property. Phase I environmental assessments have been performed in respect of all properties.
Natural disasters and severe weather such as floods, blizzards and rising temperatures may result in damage to the properties. The extent of Allied's casualty losses and loss in operating income in connection with such events is a function of the severity of the event and the total amount of exposure in the affected area. Allied is also exposed to risks associated with inclement winter weather, including increased need for maintenance and repair of its buildings. In addition, climate change, to the extent it causes changes in weather patterns, could have effects on Allied's business by increasing the cost of property insurance, and/or energy at the properties. As a result, the consequences of natural disasters, severe weather and climate change could increase Allied's costs and reduce Allied's cash flow.
DEVELOPMENT RISK
As an owner of Properties Under Development, Allied is subject to development risks, such as construction delays, cost over-runs and the failure of tenants to take occupancy and pay rent in accordance with lease arrangements. In connection with all Properties Under Development, Allied incurs development costs prior to (and in anticipation of) achieving a stabilized level of rental revenue. In the case of the development of ancillary or surplus land, these risks are managed in most cases by not commencing construction until a satisfactory level of pre-leasing is achieved. Overall, these risks are managed through Allied’s Declaration, which states that the cost of development cannot exceed 15% of GBV.

73ALLIED PROPERTIES REIT Q2 2018 QUARTERLY REPORT
TAXATION RISK
On June 22, 2007, rules changing the manner in which trusts are taxed were proclaimed into force. Trusts that meet the REIT exemption are not subject to these rules. The determination as to whether Allied qualifies for the REIT exemption in a particular taxation year can only be made with certainty at the end of that taxation year. While there can be no assurance in this regard, due to uncertainty surrounding the interpretation of the relevant provisions of the REIT exemption, Allied expects that it will qualify for the REIT exemption.
JOINT ARRANGEMENT RISK
Allied has entered into various joint arrangements and partnerships with different entities. If these joint arrangements or partnerships do not perform as expected or default on financial obligations, Allied has an associated risk. Allied reduces this risk by seeking to negotiate contractual rights upon default, by entering into agreements with financially stable partners and by working with partners who have a successful record of completing development projects.
CYBERSECURITY RISK
The efficient operation of Allied’s business is dependent on computer hardware and software systems. Information systems are vulnerable to cybersecurity incidents. A cybersecurity incident is considered to be any material adverse event that threatens the confidentiality, integrity or availability of Allied’s information resources. A cybersecurity incident is an intentional attack or an unintentional event including, but not limited to, malicious software, attempts to gain unauthorized access to data or information systems, and other electronic security breaches that could lead to disruptions in critical systems, unauthorized release of confidential or otherwise protected information and corruption of data. Allied’s primary risks that could directly result from the occurrence of a cyber incident include operational interruption, damage to its reputation, damage to its business relationships with tenants, the disclosure of confidential information including personally identifiable information, potential liability to third parties, loss of revenue, additional regulatory scrutiny and fines, as well as litigation and other costs and expenses. Allied takes data privacy and protection seriously and has implemented processes, procedures and controls to help mitigate these risks. Access to personal data is controlled through physical security and IT security mechanisms. For information stored with or processed by third parties, Allied undertakes due diligence prior to working with them and uses contractual means to ensure compliance to standards set by Allied. Additionally, Allied monitors and assesses risks surrounding collection, usage, storage, protection, and retention/destruction practices of personal data. These measures, as well as its increased awareness of a risk of a cyber incident, do not guarantee that its financial results will not be negatively impacted by such an incident.
REAL ESTATE RISK
Allied is subject to the conventional risks associated with the ownership of real estate. Allied strives to mitigate these risks by remaining fully informed on best practices, trends and legislative and demographic changes in the commercial real estate markets within which we operate. Allied additionally strives to mitigate these risks by focusing intently on execution.
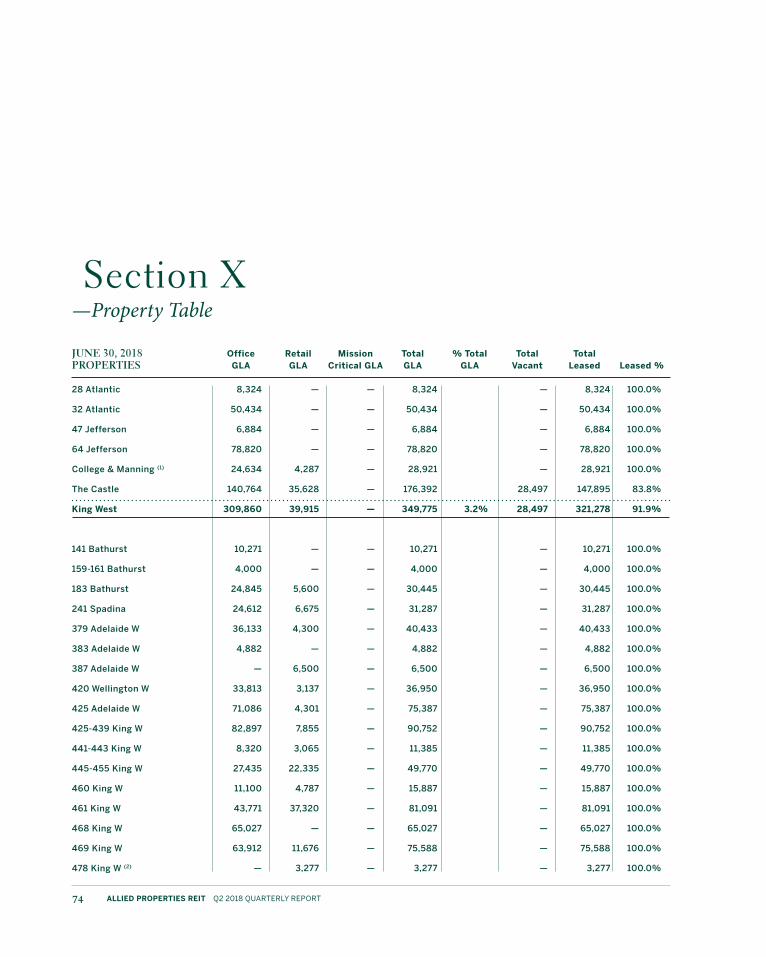
74 ALLIED PROPERTIES REIT Q2 2018 QUARTERLY REPORT
Section X —Property Table
28 Atlantic 8,324 — — 8,324 — 8,324 100 .0%
32 Atlantic 50,434 — — 50,434 — 50,434 100 .0%
47 Jefferson 6,884 — — 6,884 — 6,884 100 .0%
64 Jefferson 78,820 — — 78,820 — 78,820 100 .0%
College & Manning (1) 24,634 4,287 — 28,921 — 28,921 100 .0%
The Castle 140,764 35,628 — 176,392 28,497 147,895 83 .8%
King West 309,860 39,915 — 349,775 3.2% 28,497 321,278 91.9%
141 Bathurst 10,271 — — 10,271 — 10,271 100 .0%
159-161 Bathurst 4,000 — — 4,000 — 4,000 100 .0%
183 Bathurst 24,845 5,600 — 30,445 — 30,445 100 .0%
241 Spadina 24,612 6,675 — 31,287 — 31,287 100 .0%
379 Adelaide W 36,133 4,300 — 40,433 — 40,433 100 .0%
383 Adelaide W 4,882 — — 4,882 — 4,882 100 .0%
387 Adelaide W — 6,500 — 6,500 — 6,500 100 .0%
420 Wellington W 33,813 3,137 — 36,950 — 36,950 100 .0%
425 Adelaide W 71,086 4,301 — 75,387 — 75,387 100 .0%
425-439 King W 82,897 7,855 — 90,752 — 90,752 100 .0%
441-443 King W 8,320 3,065 — 11,385 — 11,385 100 .0%
445-455 King W 27,435 22,335 — 49,770 — 49,770 100 .0%
460 King W 11,100 4,787 — 15,887 — 15,887 100 .0%
461 King W 43,771 37,320 — 81,091 — 81,091 100 .0%
468 King W 65,027 — — 65,027 — 65,027 100 .0%
469 King W 63,912 11,676 — 75,588 — 75,588 100 .0%
478 King W (2) — 3,277 — 3,277 — 3,277 100 .0%
Office GLA
Retail GLA
Mission Critical GLA
Total GLA
% Total GLA
Total Vacant
Total Leased Leased %
JUNE 30, 2018 PROPERTIES

75ALLIED PROPERTIES REIT Q2 2018 QUARTERLY REPORT
485 King W 8,304 4,035 — 12,339 — 12,339 100 .0%
500-522 King W 78,271 43,079 — 121,350 — 121,350 100 .0%
552-560 King W 8,019 16,696 — 24,715 — 24,715 100 .0%
544 King W 17,006 — — 17,006 — 17,006 100 .0%
555 Richmond W 254,907 41,580 — 296,487 — 296,487 100 .0%
579 Richmond W 28,515 — — 28,515 — 28,515 100 .0%
589-591 Richmond W 2,000 — — 2,000 — 2,000 100 .0%
662 King W 33,580 — — 33,580 — 33,580 100 .0%
80-82 Spadina 60,072 16,009 — 76,081 — 76,081 100 .0%
96 Spadina 80,309 9,936 — 90,245 575 89,670 99 .4%
King Portland Centre, 602 King W (1) 18,811 12,768 — 31,579 250 31,329 99 .2%
King West Central 1,101,898 264,931 — 1,366,829 12.5% 825 1,366,004 99.9%
180 John 39,375 6,256 — 45,631 — 45,631 100 .0%
116 Simcoe 14,349 — — 14,349 — 14,349 100 .0%
179 John 69,065 — — 69,065 1,838 67,227 97 .3%
185 Spadina 55,814 — — 55,814 — 55,814 100 .0%
200 Adelaide W 26,685 — — 26,685 — 26,685 100 .0%
208-210 Adelaide W 11,592 — — 11,592 — 11,592 100 .0%
217-225 Richmond W 31,820 21,670 — 53,490 — 53,490 100 .0%
257 Adelaide W 46,018 — — 46,018 — 46,018 100 .0%
312 Adelaide W 62,825 8,015 — 70,840 2,350 68,490 96 .7%
331-333 Adelaide W 19,632 3,724 — 23,356 — 23,356 100 .0%
358-360 Adelaide W 52,405 — — 52,405 — 52,405 100 .0%
375-381 Queen W 21,541 10,648 — 32,189 — 32,189 100 .0%
388 King W 24,302 15,012 — 39,314 2,892 36,422 92 .6%
82 Peter 39,288 8,287 — 47,575 — 47,575 100 .0%
99 Spadina 50,692 — — 50,692 — 50,692 100 .0%
Union Center 10,736 29,239 — 39,975 3,736 36,239 90 .7%
QRC West Phase I 334,856 11,358 — 346,214 — 346,214 100 .0%
Entertainment District 910,995 114,209 — 1,025,204 9.4% 10,816 1,014,388 98.9%
193 Yonge 34,349 16,318 — 50,667 — 50,667 100 .0%
Downtown 34,349 16,318 — 50,667 0.5% — 50,667 100.0%
56 Esplanade 55,992 19,575 — 75,567 5,393 70,174 92 .9
70 Esplanade 19,306 5,767 — 25,073 — 25,073 100 .0%
Office GLA
Retail GLA
Mission Critical GLA
Total GLA
% Total GLA
Total Vacant
Total Leased Leased %
JUNE 30, 2018 PROPERTIES

76 ALLIED PROPERTIES REIT Q2 2018 QUARTERLY REPORT
106 Front E 24,035 10,373 — 34,408 4,066 30,342 88 .2%
35-39 Front E 31,101 13,804 — 44,905 — 44,905 100 .0%
36-40 Wellington E 14,662 9,893 — 24,555 — 24,555 100 .0%
41-45 Front E 20,957 14,079 — 35,036 — 35,036 100 .0%
47 Front E 6,925 3,993 — 10,918 — 10,918 100 .0%
45-55 Colborne 28,571 13,986 — 42,557 2,048 40,509 95 .2%
49 Front E 9,370 10,441 — 19,811 — 19,811 100 .0%
50 Wellington E 21,951 11,049 — 33,000 — 33,000 100 .0%
60 Adelaide E 106,128 4,608 — 110,736 — 110,736 100 .0%
184 Front E 80,544 6,489 — 87,033 4,691 82,342 94 .6%
St. Lawrence Market 419,542 124,057 — 543,599 5.0% 16,198 527,401 97.0%
137 George 750 750 — 1,500 1,500 — —%
204-214 King E 125,627 2,699 — 128,326 4,041 124,285 96 .9%
230 Richmond E 72,687 — — 72,687 — 72,687 100 .0%
252-264 Adelaide E 48,002 — — 48,002 3,401 44,601 92 .9%
489 Queen E 32,434 — — 32,434 — 32,434 100 .0%
70 Richmond 35,181 — — 35,181 — 35,181 100 .0%
Dominion Square 111,857 — — 111,857 1,700 110,157 98 .5%
QRC East 179,435 34,715 — 214,150 — 214,150 100 .0%
QRC South 44,024 — — 44,024 — 44,024 100 .0%
Queen Richmond 649,997 38,164 — 688,161 6.3% 10,642 677,519 98.5%
Toronto 3,426,641 597,594 — 4,024,235 36.8% 66,978 3,957,257 98.3%
189 Joseph 26,373 — — 26,373 — 26,373 100 .0%
72 Victoria 89,664 — — 89,664 11,982 77,682 86 .6%
Breithaupt Phase I (3) 66,559 — — 66,559 — 66,559 100 .0%
Breithaupt Phase II (3) 46,846 — — 46,846 — 46,846 100 .0%
The Tannery 254,941 73,779 — 328,720 1,965 326,755 99 .4%
Kitchener 484,383 73,779 — 558,162 5.1% 13,947 544,215 97.5%
Central Canada 3,911,024 671,373 — 4,582,397 41.9% 80,925 4,501,472 98.2%
The Chambers 210,238 10,945 — 221,183 2,499 218,684 98 .9%
Ottawa 210,238 10,945 — 221,183 2.0% 2,499 218,684 98.9%
3510 Saint-Laurent 82,633 16,223 — 98,856 13,130 85,726 86 .7%
Office GLA
Retail GLA
Mission Critical GLA
Total GLA
% Total GLA
Total Vacant
Total Leased Leased %
JUNE 30, 2018 PROPERTIES

77ALLIED PROPERTIES REIT Q2 2018 QUARTERLY REPORT
3575 Saint-Laurent 168,311 18,410 — 186,721 29,729 156,992 84 .1%
400 Atlantic 86,258 292 — 86,550 7,448 79,102 91 .4%
4446 Saint-Laurent 73,166 7,281 — 80,447 6,819 73,628 91 .5%
451-481 Saint-Catherine 22,328 8,510 — 30,838 — 30,838 100 .0%
480 Saint-Laurent 47,171 7,165 — 54,336 22,731 31,605 58 .2%
5445 Gaspé 480,315 955 — 481,270 15,457 465,813 96 .8%
5455 Gaspé 486,077 904 — 486,981 13,900 473,081 97 .1%
5505 Saint-Laurent 248,822 2,524 — 251,346 — 251,346 100 .0%
6300 Parc 181,091 1,310 — 182,401 8,103 174,298 95 .6%
645 Wellington 131,266 3,773 — 135,039 — 135,039 100 .0%
740 Saint-Maurice 67,967 — — 67,967 — 67,967 100 .0%
8 Place du Commerce 40,702 16,515 — 57,217 3,338 53,879 94 .2%
85 Saint-Paul 80,203 — — 80,203 5,465 74,738 93 .2%
Cité Multimédia 933,922 14,201 — 948,123 25,854 922,269 97 .3%
Le Nordelec 780,678 19,914 — 800,592 22,685 777,907 97 .2%
Montréal 3,910,910 117,977 — 4,028,887 36.8% 174,659 3,854,228 95.7%
Eastern Canada 4,121,148 128,922 — 4,250,070 38.8% 177,158 4,072,912 95.8%
100-6th SW 34,242 — — 34,242 — 34,242 100 .0%
119-6th SW 62,650 — — 62,650 — 62,650 100 .0%
1207-1215 13th SE 32,015 — — 32,015 — 32,015 100 .0%
1240-20th SE 44,885 — — 44,885 11,766 33,119 73 .8%
129-8th SW 2,339 4,591 — 6,930 — 6,930 100 .0%
209-8th SW 27,118 5,022 — 32,140 5,411 26,729 83 .2%
237-8th SE 65,485 8,581 — 74,066 1,457 72,609 98 .0%
322-326 11th SW 196,075 15,660 — 211,735 19,043 192,692 91 .0%
402-11th SE 39,414 — — 39,414 5,775 33,639 85 .3%
438-11th SE 52,489 — — 52,489 — 52,489 100 .0%
601-611 10th SW 46,319 2,592 — 48,911 7,957 40,954 83 .7%
603-605 11th SW 21,890 29,207 — 51,097 14,722 36,375 71 .2%
613-11th SW — 3,163 — 3,163 — 3,163 100 .0%
617-11th SW 2,986 6,306 — 9,292 636 8,656 93 .2%
625-11th SW 33,235 1,410 — 34,645 9,072 25,573 73 .8%
731-10th SW (4) — 10,433 — 10,433 — 10,433 100 .0%
812-11th SW (4) — 5,482 — 5,482 — 5,482 100 .0%
805-1st SW 9,135 18,767 — 27,902 2,529 25,373 90 .9%
808-1st SW 17,224 30,244 — 47,468 9,949 37,519 79 .0%
Office GLA
Retail GLA
Mission Critical GLA
Total GLA
% Total GLA
Total Vacant
Total Leased Leased %
JUNE 30, 2018 PROPERTIES

78 ALLIED PROPERTIES REIT Q2 2018 QUARTERLY REPORT
809-10th SW 35,704 — — 35,704 5,278 30,426 85 .2%
816-838 11th SW (4) 9,990 14,145 — 24,135 3,507 20,628 85 .5%
Demcor Building 39,533 — — 39,533 11,740 27,793 70 .3%
Calgary 772,728 155,603 — 928,331 8.5% 108,842 819,489 88.3%
Boardwalk & Revillon Building 220,122 45,442 — 265,564 3,185 262,379 98 .8%
Edmonton 220,122 45,442 — 265,564 2.4% 3,185 262,379 98.8%
128 West Pender 78,252 1,693 — 79,945 11,431 68,514 85 .7%
840 Cambie 91,437 — — 91,437 — 91,437 100 .0%
948-950 Homer 34,473 10,399 — 44,872 — 44,872 100 .0%
1040 Hamilton 36,108 8,765 — 44,873 — 44,873 100 .0%
1286 Homer 15,919 9,115 — 25,034 — 25,034 100 .0%
Vancouver 256,189 29,972 — 286,161 2.6% 11,431 274,730 96.0%
Western Canada 1,249,039 231,017 — 1,480,056 13.5% 123,458 1,356,598 91.7%
Total Office and Retail 9,281,211 1,031,312 — 10,312,523 94.3% 381,541 9,930,982 96.3%
905 King W 53,997 — — 53,997 20,331 33,666 62 .3%
905 King W — — 57,339 57,339 4,038 53,301 93 .0%
151 Front W — — 275,709 275,709 4,063 271,646 98 .5%
250 Front W — — 173,000 173,000 67,000 106,000 61 .3%
Mission Critical — — 506,048 506,048 4.6% 75,101 430,947 85.2%
Mission Critical Facilities 53,997 — 506,048 560,045 5.1% 95,432 464,613 83.0%
Total Rental Portfolio, Excluding PUD Transfers 9,335,208 1,031,312 506,048 10,872,568 99.4% 476,973 10,395,595 95.6%
642 King W (1) 7,000 6,024 — 13,024 — 13,024 100 .0%
491 College (1) 8,851 3,717 — 12,568 — 12,568 100 .0%
1700 St . Patrick — 41,764 — 41,764 28,106 13,658 32 .7%
Total Rental Portfolio, Including PUD Transfers 9,351,059 1,082,817 506,048 10,939,924 100% 505,079 10,434,845 95.4%
(1) RioCan/Allied Joint Arrangement
(2) Lifetime/Allied Joint Arrangement
(3) Perimeter/Allied Joint Arrangement
(4) First Capital/Allied Joint Arrangement
Office GLA
Retail GLA
Mission Critical GLA
Total GLA
% Total GLA
Total Vacant
Total Leased Leased %
JUNE 30, 2018 PROPERTIES

79ALLIED PROPERTIES REIT Q2 2018 QUARTERLY REPORT
301 Markham, Toronto 47
388 Richmond, Toronto 117
78 Spadina, Toronto 24
7-9 Morrison, Toronto 25
464 King, Toronto 12
650 King, Toronto 71
533 King, Toronto 107
560 King, Toronto 171
478 King, Toronto (1) 65
15 Brant, Toronto 203
105 George, Toronto 15
305 Joseph, Kitchener (2) 75
Total Parking 932
(1) Lifetime/Allied Joint Arrangement
(2) Perimeter/Allied Joint Arrangement
ANCILLARY PARKING FACILITIES NUMBER OF SPACES
TELUS Sky, Calgary (1) 218,000
King Portland Centre, Toronto (2) 136,320
425 Viger, Montréal 300,000
Adelaide & Duncan, Toronto (3) 228,000
The Well, Toronto (4) 1,550,000
King & Spadina, Toronto 650,000
The Lougheed (604-1st SW), Calgary 92,600
Total Development Portfolio 3,174,920
(1) Telus/Westbank/Allied Joint Arrangement
(2) RioCan/Allied Joint Arrangement
(3) Westbank/Allied Joint Arrangement
(4) RioCan/Allied Joint Arrangement. Allied acquired an additional undivided 10% interest in the commercial component of The Well. Each of Allied and RioCan now own an undivided 50% interest in the commercial component of The Well.
PROPERTIES UNDER DEVELOPMENTESTIMATED GLA ON COMPLETION (SF)

80 ALLIED PROPERTIES REIT Q2 2018 QUARTERLY REPORT
Unaudited Condensed Consolidated Financial Statements for the Three and Six Months Ended June 30, 2018 and 2017

81ALLIED PROPERTIES REIT Q2 2018 QUARTERLY REPORT
Gordon Cunningham trustee
Michael R. Emory trustee
Assets
Non-current assets
Investment properties 5 $5,886,980 $5,627,439
Residential inventory 6 32,833 28,239
Loans and notes receivable 7 100,877 90,613
Other assets 8 12,642 12,593
6,033,332 5,758,884
Current assets
Cash and cash equivalents 19 2,080 6,048
Loans and notes receivable 7 11,333 11,628
Accounts receivable, prepaid expenses and deposits 9 51,619 47,072
65,032 64,748
Total assets $6,098,364 $5,823,632
Liabilities
Non-current liabilities
Debt 10 $1,581,070 $1,705,526
Finance lease obligations 11 155,868 154,871
1,736,938 1,860,397
Current liabilities
Debt 10 227,232 254,351
Accounts payable and other liabilities 12 172,890 159,862
400,122 414,213
Total liabilities 2,137,060 2,274,610
Unitholders’ equity 3,961,304 3,549,022
Total liabilities and unitholders’ equity $6,098,364 $5,823,632
Commitments and Contingencies (note 25) The accompanying notes are an integral part of these unaudited condensed consolidated financial statements.
NOTES(in thousands of Canadian dollars) JUNE 30, 2018 DECEMBER 31, 2017
ALLIED PROPERTIES REAL ESTATE INVESTMENT TRUSTUNAUDITED CONDENSED CONSOLIDATED BALANCE SHEETSAS AT JUNE 30, 2018 AND DECEMBER 31, 2017

82 ALLIED PROPERTIES REIT Q2 2018 QUARTERLY REPORT
ALLIED PROPERTIES REAL ESTATE INVESTMENT TRUSTUNAUDITED CONDENSED CONSOLIDATED STATEMENTS OF INCOME AND COMPREHENSIVE INCOMEFOR THE THREE AND SIX MONTHS ENDED JUNE 30, 2018 AND 2017
THREE MONTHS ENDED SIX MONTHS ENDED
Rental revenue from investment properties 17 $106,983 $103,134 $213,877 $205,245
Property operating costs (45,540) (43,493) (91,868) (87,852)
Net rental income 61,443 59,641 122,009 117,393
Interest expense 10 (f) (23,362) (17,935) (39,288) (33,775)
General and administrative expenses 18 (4,048) (2,628) (7,909) (6,128)
Amortization of other assets and leasing costs 5 & 8 (412) (2,496) (817) (5,147)
Interest income 1,361 430 2,677 759
Fair value gain on investment properties 5 78,577 70,810 120,454 114,498
Fair value gain on derivative instruments 13, 24 (d) 93 5,259 1,226 5,348
Net income and comprehensive income $113,652 $113,081 $198,352 $192,948
Income per unit
Basic $1.21 $1 .33 $2.13 $2 .27
Diluted $1.21 $1 .33 $2.12 $2 .27
Weighted average number of Units 16
Basic 93,697,810 84,938,714 93,327,182 84,853,716
Diluted 93,868,833 85,073,714 93,486,243 84,972,290
The accompanying notes are an integral part of these unaudited condensed consolidated financial statements.
NOTES(in thousands of Canadian dollars, except unit and per unit amounts) JUNE 30, 2018 JUNE 30, 2017 JUNE 30, 2018 JUNE 30, 2017

83ALLIED PROPERTIES REIT Q2 2018 QUARTERLY REPORT
Balance at January 1, 2017 14 $2,098,267 $911,832 $11,407 $3,021,506
Net income and comprehensive income — 192,948 — 192,948
Distributions — (64,934) — (64,934)
Unit option plan – options exercised 15 (a) 9,141 — — 9,141
Contributed surplus – unit option plan 15 (a) — — 771 771
Restricted unit plan (net of forfeitures) 15 (b) (2,240) — 857 (1,383)
Long-term incentive plan 72 — — 72
Balance at June 30, 2017 $2,105,240 $1,039,846 $13,035 $3,158,121
NOTES TRUST UNITSRETAINED EARNINGS
CONTRIBUTED SURPLUS TOTAL(in thousands of Canadian dollars)
Balance at January 1, 2018 14 $2,399,768 $1,134,614 $14,640 $3,549,022
Net income and comprehensive income — 198,352 — 198,352
Unit offering (net of issuance costs) 14 286,664 — — 286,664
Distributions — (73,463) — (73,463)
Unit option plan – options exercised 15 (a) 1,533 — — 1,533
Contributed surplus – unit option plan 15 (a) — — 687 687
Restricted unit plan (net of forfeitures) 15 (b) (2,584) — 1,093 (1,491)
Balance at June 30, 2018 $2,685,381 $1,259,503 $16,420 $3,961,304
The accompanying notes are an integral part of these unaudited condensed consolidated financial statements.
NOTES TRUST UNITSRETAINED EARNINGS
CONTRIBUTED SURPLUS TOTAL(in thousands of Canadian dollars)
ALLIED PROPERTIES REAL ESTATE INVESTMENT TRUSTUNAUDITED CONDENSED CONSOLIDATED STATEMENTS OF UNITHOLDERS’ EQUITYFOR THE SIX MONTHS ENDED JUNE 30, 2018 AND 2017

84 ALLIED PROPERTIES REIT Q2 2018 QUARTERLY REPORT
ALLIED PROPERTIES REAL ESTATE INVESTMENT TRUSTUNAUDITED CONDENSED CONSOLIDATED STATEMENTS OF CASH FLOWSFOR THE THREE AND SIX MONTHS ENDED JUNE 30, 2018 AND 2017
THREE MONTHS ENDED SIX MONTHS ENDED
Operating activities
Net income for the period $113,652 $113,081 $198,352 $192,948
Fair value (gain) on investment properties 5 (78,577) (70,810) (120,454) (114,498)
Fair value (gain) on derivative instruments 24 (d) (93) (5,259) (1,226) (5,348)
Interest expense 10 (f) 23,362 17,935 39,288 33,775
Interest paid (excluding capitalized interest) 19, 5 (29,480) (19,790) (40,314) (31,667)
Amortization of equipment and other assets 8 412 453 817 974
Amortization of leasing commissions 5 — 2,043 — 4,173
Amortization of tenant improvement allowances 5 7,267 5,227 14,238 10,559
Amortization of straight-line rents 5 (1,793) (3,965) (3,173) (7,181)
Amortization of premium (discount) on debt 10 (f) (631) (83) (1,224) (130)
Amortization of finance lease obligations (71) 171 64 (238)
Unit compensation expense 15 886 787 1,780 1,628
Additions to residential inventory 6 (1,484) — (4,594) —
Change in other non-cash financing items 625 560 1,075 1,093
Change in other non-cash operating items 19 (7,521) 9,359 10,114 23,266
Cash provided by operating activities 26,554 49,709 94,743 109,354
Financing activities
Repayment of mortgages payable 10 (a) (143,873) (24,387) (159,845) (42,128)
Proceeds from senior unsecured debentures (net of financing costs) 10 (d) — 198,825 — 198,825
Principal payments of finance lease obligations (6) (6) (12) (11)
Distributions paid to Unitholders (36,260) (32,484) (72,509) (64,895)
Proceeds of unit offering (net of issuance costs) 14 286,664 — 286,664 —
Proceeds from exercise of unit options 14 392 5,642 1,533 9,141
Proceeds from units issued under the LTIP — — — 72
Restricted unit plan (net of forfeitures) 15 — 43 (2,584) (2,240)
Proceeds from loan receivables 143 267 285 534
Drawings from Unsecured Revolving Operating Facility 10 (c) 75,000 30,000 145,000 77,000
Repayments of Unsecured Revolving Operating Facility 10 (c) (150,000) (94,000) (150,000) (94,000)
Proceeds from construction loan 10 (b) 7,562 7,870 13,344 13,064
NOTES JUNE 30, 2018 JUNE 30, 2017 JUNE 30, 2018 JUNE 30, 2017(in thousands of Canadian dollars)

85ALLIED PROPERTIES REIT Q2 2018 QUARTERLY REPORT
Financing costs — — (300) —
Loan receivable issued to third-party 7 (a) (7,153) — (10,360) —
Cash provided by financing activities 32,469 91,770 51,216 95,362
Investing activities
Acquisition of investment properties 4 (514) (62,201) (16,546) (76,198)
Additions to investment properties (including capitalized interest) 5 (57,015) (50,171) (98,186) (92,200)
Additions to equipment and other assets 8 (396) 178 (1,421) (217)
Leasing commissions 5 (4,080) (2,791) (6,969) (5,469)
Tenant improvement allowances 5 (10,826) (23,517) (26,805) (32,198)
Cash used in investing activities (72,831) (138,502) (149,927) (206,282)
Increase (decrease) in cash and cash equivalents (13,808) 2,977 (3,968) (1,566)
Cash and cash equivalents, beginning of period 15,888 7,650 6,048 12,193
Cash and cash equivalents, end of period $2,080 $10,627 $2,080 $10,627
Supplemental cash flow information (note 19) The accompanying notes are an integral part of these unaudited condensed consolidated financial statements.
THREE MONTHS ENDED SIX MONTHS ENDED
NOTES JUNE 30, 2018 JUNE 30, 2017 JUNE 30, 2018 JUNE 30, 2017(in thousands of Canadian dollars)
ALLIED PROPERTIES REAL ESTATE INVESTMENT TRUSTUNAUDITED CONDENSED CONSOLIDATED STATEMENTS OF CASH FLOWSFOR THE THREE AND SIX MONTHS ENDED JUNE 30, 2018 AND 2017 - continued
86 ALLIED PROPERTIES REIT Q2 2018 QUARTERLY REPORT
ALLIED PROPERTIES REAL ESTATE INVESTMENT TRUSTNOTES TO THE UNAUDITED CONDENSED CONSOLIDATED FINANCIAL STATEMENTSFOR THE THREE AND SIX MONTHS ENDED JUNE 30, 2018 AND 2017 (IN THOUSANDS OF CANADIAN DOLLARS, EXCEPT PER UNIT AND UNIT AMOUNTS)
1. nature of operations
Allied Properties Real Estate Investment Trust (“Allied” or the “Trust”) is a Canadian unincorporated closed-end real estate investment trust created pursuant to the Declaration of Trust dated October 25, 2002, most recently amended May 12, 2016. Allied is governed by the laws of the Province of Ontario and began operations on February 19, 2003. The Units of the Trust are traded on the Toronto Stock Exchange and are traded under the symbol “AP.UN”.
Allied is domiciled in Ontario, Canada. The address of Allied’s registered office and its principal place of business is 134 Peter Street, Suite 1700, Toronto, Ontario, M5V 2H2.
2. significant accounting policies
The unaudited condensed consolidated financial statements are presented in Canadian dollars.
The unaudited condensed consolidated financial statements for the three and six months ended June 30, 2018 and 2017, were approved and authorized for issue by the Board of Trustees on August 1, 2018.
(a) Statement of compliance
The unaudited condensed consolidated financial statements of Allied for the three and six months ended June 30, 2018 and 2017 are prepared in accordance with International Accounting Standards (“IAS”) 34, Interim Financial Reporting as issued by the International Accounting Standards Board (“IASB”).
The significant accounting policies disclosed in Allied's December 31, 2017, audited annual consolidated statements have been applied consistently in the preparation of these unaudited condensed consolidated financial statements, except as described below.
Accounting standards implemented in 2018
IFRS 15 - Revenue from Contracts with Customers
The Trust has adopted IFRS 15, as issued in May 2014, on January 1, 2018, on a modified retrospective basis as of January 1, 2018 as if the standard had always been in effect. The comparative information has not been restated and continues to be reported under the accounting standards in effect for those periods. The objective of IFRS 15 is to establish a single comprehensive model for entities to use in accounting for revenue arising from contracts with customers; except for contracts that are within the scope of the standards on leases, insurance contracts, and financial instruments. IFRS 15 also contains enhanced disclosure requirements.

87ALLIED PROPERTIES REIT Q2 2018 QUARTERLY REPORT
As the Trust’s most material revenue stream of rental revenue is outside the scope of the new standard, the adoption of the new standard did not have a material impact to the unaudited condensed consolidated statements of income and comprehensive income. Service components within its lease arrangements fall within the scope of IFRS 15, specially the recovery of costs related to the provision of services provided to tenants. In respect of such recovery of services revenue, the Trust has concluded that the pattern of revenue recognition is unchanged. The Trust has included disclosure of the separate components of each revenue stream, including those included within gross leases (see Note 17).
No material impact on the unaudited condensed consolidated statements of cash flow has resulted from adoption.
IFRS 9 - Financial Instruments
The Trust has adopted IFRS 9, issued in July 2014, and the related consequential amendments to IFRS 7 - Financial Instruments: Disclosures, with a date of initial application of January 1, 2018. IFRS 9 introduces new requirements, which is summarized as follows:
- Classification and measurement of financial assets and financial liabilities;
- Impairment for financial assets; and
- General hedge accounting, which represent a significant change from IAS 39 - Financial Instruments: Recognition and Measurement (“IAS 39”).

88 ALLIED PROPERTIES REIT Q2 2018 QUARTERLY REPORT
Classification and measurement
IFRS 9 requires a new approach for the classification and measurement of financial assets based on the Trust’s business models for managing these financial assets and their contractual cash flow characteristics, this is summarized as follows:
- Assets held for the purpose of collecting contractual cash flows that represent solely payments of principal and interest are measured at amortized cost.
- Assets held within a business model where assets are both held for the purpose of collecting contractual cash flows or sold prior to maturity and the contractual cash flows represent solely payments of principal and interest will be measured at fair value through other comprehensive income (“FVTOCI”).
- Assets held within another business model or assets that do not have contractual cash flow characteristics that are solely payments of principal and interest are measured at fair value through profit or loss (“FVTPL”).
The Trust completed its review of all financial instruments held and has performed cash flow and business model assessments on the Trust’s financial assets, and the impact is summarized as follows:
- The Trust’s cash and cash equivalents, accounts receivable, and loans and notes receivable previously classified as loans and receivable and measured at amortized cost are classified and measured at amortized cost;
- The Trust’s derivative asset and liability instruments continue to be measured at FVTPL.
Impairment for financial assets
IFRS 9 introduces a new expected credit loss (“ECL”) impairment model for all financial assets measured at amortized cost or debt instruments measured at FVTOCI. The new ECL model results in an allowance for expected credit losses being recorded regardless of whether or not there has been an actual loss event. Under IFRS 9, credit losses are recognized earlier than under IAS 39.The adoption of IFRS 9 did not result in any change to the Trust’s allowance for impairment.
Hedge accounting
IFRS 9 also introduced a new hedge accounting model that expands the scope of hedge items and risks eligible for hedge accounting and aligns hedge accounting more closely with risk management. This new standard does not fundamentally change the types of hedging relationships or the requirement to measure and recognize ineffectiveness, however, it will provide more hedging strategies that are used for risk management to qualify for hedge accounting and introduce more judgment to assess the effectiveness of a hedging relationship. The Trust does not apply hedge accounting.

89ALLIED PROPERTIES REIT Q2 2018 QUARTERLY REPORT
As a result of adopting IFRS 9, the Trust updated its accounting policies for the recognition, classification and impairment of financial instruments, which are as follows:
Recognition and initial measurement - Financial assets and financial liabilities are recognized in the consolidated balance sheets when the Trust becomes a party to the contractual provisions of a financial instrument or non-financial derivative contract. All financial instruments are measured at fair value on initial recognition.
Transaction costs that are directly attributable to the acquisition or issuance of financial assets and financial liabilities, other than financial assets and financial liabilities classified as FVTPL, are added to or deducted from the fair value on initial recognition.
Transaction costs directly attributable to the acquisition of financial assets or financial liabilities classified as FVTPL are recognized immediately in net income.
Classification and subsequent measurement - The Trust classifies financial assets, at the time of initial recognition, according to the Trust’s business model for managing the financial assets and the contractual terms of the cash flows.
Financial assets are subsequently measured at amortized cost if both of the following conditions are met and they are not designated as at FVTPL: a) the financial asset is held within a business model whose objective is to hold financial assets to collect contractual cash flows; and b) the contractual terms of the financial asset give rise to cash flows on specified dates that are solely payments of principal and interest on the principal amount outstanding. These assets are subsequently measured at amortized cost using the effective interest rate method, less any impairment, with gains and losses recognized in net income in the period that the asset is derecognized or impaired.
Financial liabilities are subsequently measured at amortized cost using the effective interest rate method with gains and losses recognized in net income in the period that the liability is derecognized.
Impairment of financial instruments - The Trust recognizes a loss allowance on a forward looking basis at an amount equal to the lifetime ECL on its financial assets measured at amortized cost. Lifetime ECL represents the expected credit losses that will result from all possible default events over the expected life of a financial instrument. The Trust has applied the standard on a retrospective basis without restatement.
IAS 40 - Investment Property
On December 8, 2016, the IASB issued an amendment, effective January 1, 2018, to IAS 40 that requires an asset to be transferred to or from investment property only when there is a change in use. A change in use occurs when the property meets, or ceases to meet, the definition of investment property and there is evidence of the change in use. Allied adopted these amendments and clarifications in its financial statements on a retroactive basis for the annual period beginning on January 1, 2018 and it did not result in any impact.

90 ALLIED PROPERTIES REIT Q2 2018 QUARTERLY REPORT
FUTURE ACCOUNTING STANDARDS
IFRS 16 - Leases
On January 13, 2016, the IASB issued IFRS 16 Leases (“IFRS 16”). The new standard is effective for annual periods beginning January 1, 2019. This standard introduces a single lessee accounting model and requires a lessee to recognize assets and liabilities for all leases with a term of more than 12 months, unless the underlying asset is of low value. A lessee is required to recognize a right-of-use asset representing its right to use the underlying asset and a lease liability representing its obligation to make lease payments. This standard substantially carries forward the lessor accounting requirements of IAS 17, while requiring enhanced disclosures to be provided by lessors. Other areas of the lease accounting model have been impacted, including the definition of a lease. Transitional provisions have been provided.
The Trust has commenced the issue identification phase and impact assessment of the transition project. As a landlord, lessor accounting is substantially unchanged between IAS 17 and IFRS 16 and therefore, leases with tenants are to be accounted for as operating leases in a consistent manner with the current accounting treatment. Allied has reviewed all lease contracts in which it is a lessee, and has noted that the material leases are in relation to the Trust’s land leases; the remainder of leases are considered not to be significant. The land leases are presently accounted for as finance leases, therefore the adoption of IFRS 16 is not expected to have a material impact on the Trust.
(b) Comparative figures
Certain comparative figures have been recast to conform with the unaudited condensed consolidated financial statement presentation adopted in the current year, comprising the disclosure requirements of IFRS 15 adopted effective January 1, 2018 (see Note 17). The Statement of Cash Flows and segment disclosure comparatives have been recast to include the disaggregated level of information to be consistent with the Trust’s Statement of Cash Flows and operating segments as at December 31, 2017 presentation (see Unaudited Condensed Consolidated Statement of Cash Flows, Note 19 and Note 21).
3. critical accounting estimates and assumptions
The preparation of the unaudited condensed consolidated financial statements requires management to make judgments and estimates in applying Allied's accounting policies that affect the reported amounts and disclosures made in the unaudited condensed consolidated financial statements and accompanying notes.
The critical accounting estimates and assumptions disclosed in Allied's December 31, 2017, audited annual consolidated financial statements have been applied consistently in the preparation of these unaudited condensed consolidated financial statements, with the exception of judgment's made in relation to the new accounting standards adopted January 1, 2018.
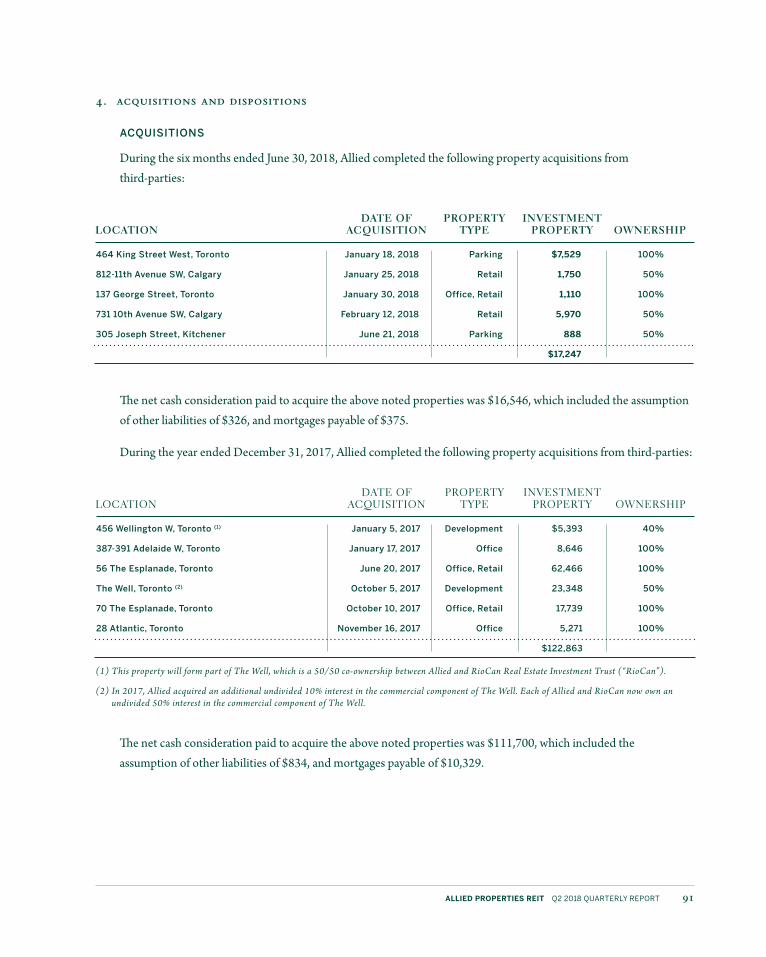
91ALLIED PROPERTIES REIT Q2 2018 QUARTERLY REPORT
464 King Street West, Toronto January 18, 2018 Parking $7,529 100%
812-11th Avenue SW, Calgary January 25, 2018 Retail 1,750 50%
137 George Street, Toronto January 30, 2018 Office, Retail 1,110 100%
731 10th Avenue SW, Calgary February 12, 2018 Retail 5,970 50%
305 Joseph Street, Kitchener June 21, 2018 Parking 888 50%
$17,247
DATE OF ACQUISITION
PROPERTY TYPE
INVESTMENT PROPERTY OWNERSHIPLOCATION
456 Wellington W, Toronto (1) January 5, 2017 Development $5,393 40%
387-391 Adelaide W, Toronto January 17, 2017 Office 8,646 100%
56 The Esplanade, Toronto June 20, 2017 Office, Retail 62,466 100%
The Well, Toronto (2) October 5, 2017 Development 23,348 50%
70 The Esplanade, Toronto October 10, 2017 Office, Retail 17,739 100%
28 Atlantic, Toronto November 16, 2017 Office 5,271 100%
$122,863
DATE OF ACQUISITION
PROPERTY TYPE
INVESTMENT PROPERTYLOCATION OWNERSHIP
4. acquisitions and dispositions
ACQUISITIONS
During the six months ended June 30, 2018, Allied completed the following property acquisitions from third-parties:
The net cash consideration paid to acquire the above noted properties was $16,546, which included the assumption of other liabilities of $326, and mortgages payable of $375.
During the year ended December 31, 2017, Allied completed the following property acquisitions from third-parties:
(1) This property will form part of The Well, which is a 50/50 co-ownership between Allied and RioCan Real Estate Investment Trust (“RioCan”).
(2) In 2017, Allied acquired an additional undivided 10% interest in the commercial component of The Well. Each of Allied and RioCan now own an undivided 50% interest in the commercial component of The Well.
The net cash consideration paid to acquire the above noted properties was $111,700, which included the assumption of other liabilities of $834, and mortgages payable of $10,329.
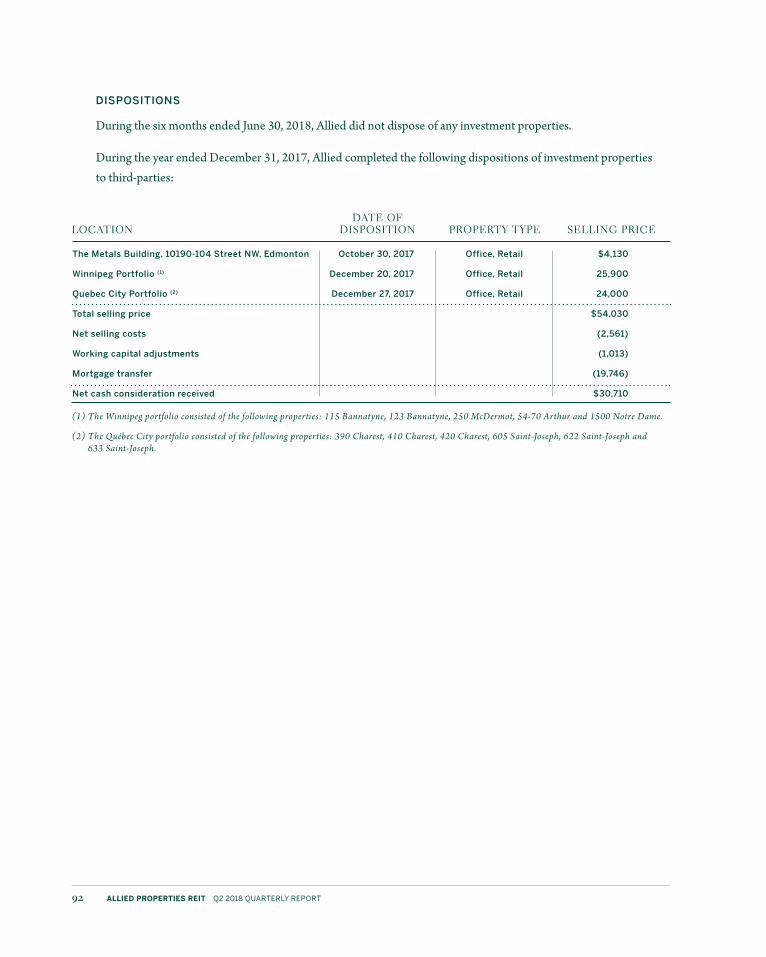
92 ALLIED PROPERTIES REIT Q2 2018 QUARTERLY REPORT
The Metals Building, 10190-104 Street NW, Edmonton October 30, 2017 Office, Retail $4,130
Winnipeg Portfolio (1) December 20, 2017 Office, Retail 25,900
Quebec City Portfolio (2) December 27, 2017 Office, Retail 24,000
Total selling price $54,030
Net selling costs (2,561)
Working capital adjustments (1,013)
Mortgage transfer (19,746)
Net cash consideration received $30,710
DATE OF DISPOSITION PROPERTY TYPE SELLING PRICELOCATION
DISPOSITIONS
During the six months ended June 30, 2018, Allied did not dispose of any investment properties.
During the year ended December 31, 2017, Allied completed the following dispositions of investment properties to third-parties:
(1) The Winnipeg portfolio consisted of the following properties: 115 Bannatyne, 123 Bannatyne, 250 McDermot, 54-70 Arthur and 1500 Notre Dame.
(2) The Québec City portfolio consisted of the following properties: 390 Charest, 410 Charest, 420 Charest, 605 Saint-Joseph, 622 Saint-Joseph and 633 Saint-Joseph.

93ALLIED PROPERTIES REIT Q2 2018 QUARTERLY REPORT
Balance, beginning of period $5,168,621 $458,818 $5,627,439 $4,948,043 $181,498 $5,129,541
Additions:
Acquisitions 17,247 — 17,247 94,122 28,741 122,863
Tenant improvements 26,805 — 26,805 74,186 — 74,186
Leasing commissions 6,969 — 6,969 7,793 — 7,793
Capital expenditures 13,369 84,817 98,186 70,083 119,775 189,858
Dispositions — — — (54,030) — (54,030)
Transfers from PUD 67,180 (67,180) — 46,360 (46,360) —
Transfers to PUD (182,180) 182,180 — (177,508) 177,508 —
Transfers to residential inventory — — — — (24,444) (24,444)
Finance lease 945 — 945 2,880 — 2,880
Amortization of straight-line rent, tenant improvements and leasing commissions (1) (11,065) — (11,065) (19,323) — (19,323)
Fair value gain (loss) on investment properties 128,839 (8,385) 120,454 176,015 22,100 198,115
Balance, end of period $5,236,730 $650,250 $5,886,980 $5,168,621 $458,818 $5,627,439
DECEMBER 31, 2017
RENTAL PROPERTIES
RENTAL PROPERTIES
PROPERTIES UNDER DEVELOPMENT
(“PUD”)
PROPERTIES UNDER DEVELOPMENT
(“PUD”)TOTAL TOTAL
JUNE 30, 2018
5. investment properties
Changes to the carrying amounts of investment properties are summarized as follows:
(1) Commencing January 1, 2018, initial direct leasing commissions are included in the fair value gain (loss) on investment properties.
For the six months ended June 30, 2018, Allied capitalized a total of $11,774 of borrowing costs to qualifying investment properties ( June 30, 2017 - $10,214).
Included in the rental properties amounts noted above are investment properties with a fair value of $482,400 (December 31, 2017 - $472,010) representing the fair value of Allied’s interest in five investment properties with corresponding finance leases. The finance leases' maturities range from 26.3 years to 84 years from year end.

94 ALLIED PROPERTIES REIT Q2 2018 QUARTERLY REPORT
Discount rate 6.81% 6 .93%
Terminal capitalization rate 5.74% 5 .86%
Overall capitalization rate 5.31% 5 .43%
Discount horizon (years) 10 10
JUNE 30, 2018 DECEMBER 31, 2017
WEIGHTED AVERAGE
VALUATION METHODOLOGY
The appraised fair value of investment properties is most commonly determined using the following methodologies:
(a) Discounted cash flow method - Under this approach, discount rates are applied to the projected annual operating cash flows, generally over a ten year period, including a terminal value of the properties based on a capitalization rate applied to the estimated net operating income (“NOI”), a non-GAAP measure, in the terminal year. This method is primarily used to value the rental properties portfolio.
(b) Comparable sales method - This approach compares a subject property's characteristics with those of comparable properties which have recently sold. The process uses one of several techniques to adjust the price of the comparable transactions according to the presence, absence, or degree of characteristics which influence value. These characteristics include the cost of construction incurred at a property under development. This method is primarily used to value the development portfolio and ancillary parking facilities.
In accordance with its policy, the Trust generally measures and records its investment properties using valuations under the supervision of Management with the support of an independent external appraiser. Allied's entire portfolio is revalued by the external appraiser each quarter. Management verifies all major inputs to the valuations, analyzes the change in fair values at the end of each reporting period and reviews the results with the independent appraiser every quarter. There were no material changes to the valuation techniques during the period. For properties with a leasehold interest with a term less than 40 years, the resulting valuation methodology is based upon a full-term discounted cash flow model.
SIGNIFICANT INPUTS
There are significant unobservable inputs used, such as capitalization rates, in determining the fair value of each investment property. Accordingly, all investment properties are measured in accordance with the fair value measurement hierarchy levels and the inputs for investment properties comprise Level 3 unobservable inputs, reflecting Management’s best estimate of what market participants would use in pricing the asset at the measurement date. Fair values are most sensitive to changes in capitalization rates and stabilized or forecasted NOI. Generally, an increase in NOI will result in an increase in the fair value of investment properties and an increase in capitalization rates will result in a decrease in the fair value of investment properties. Below are the rates used in the modeling process for valuations.

95ALLIED PROPERTIES REIT Q2 2018 QUARTERLY REPORT
Increase (decrease) in fair value
Investment Properties $611,952 $290,859 $(264,702) $(506,625)
-0 .50%CHANGE IN CAPITALIZATION RATE OF -0 .25% +0 .25% +0 .50%
The analysis below shows the maximum impact on fair values of possible changes in capitalization rates, assuming no changes in NOI:
6. residential inventory
Residential inventory consists of assets that are developed by Allied for sale in the ordinary course of business. Allied may transfer an investment property to residential inventory based on a change in use, as evidenced by the commencement of development activities with the intention to sell. Alternatively, a transfer from residential inventory to investment property would be evidenced by the commencement of leasing activity.
On September 19, 2017, Allied with its partner RioCan, announced that they had finalized plans that would allow the co-owners to improve the return on the development of King Portland Centre. The co-owners had originally intended to develop the residential portion of the project as rental apartments and then decided to sell the residential portion as condominium units, comprised of 132 units. The residential condominium units have been fully sold, subject to customary closing conditions.
As at June 30, 2018, the residential inventory balance is $32,833 (December 31, 2017 - $28,239).

96 ALLIED PROPERTIES REIT Q2 2018 QUARTERLY REPORT
Loans receivable (a) $98,676 $88,316
Notes and other receivables (b) 13,534 13,925
$112,210 $102,241
Current $11,333 $11,628
Non-current 100,877 90,613
$112,210 $102,241
JUNE 30, 2018 DECEMBER 31, 2017
7. loans and notes receivable
Loans and notes receivable are as follows:
(a) In February 2015, Allied entered into a joint arrangement with Westbank and completed the acquisition of an undivided 50% interest in Adelaide & Duncan. Allied advanced a total of $21,173 to Westbank (refer to note 20 for further details). As at June 30, 2018, the loan receivable outstanding is $21,173 (December 31, 2017 - $21,173) and is secured by a first charge on the property and assignment of rents and leases. Interest on the loan is payable monthly at a rate of 6.17% per annum. The loan is repayable when the joint arrangement obtains external permanent financing.
On August 1, 2017, Allied entered into an arrangement with Westbank to provide a credit facility of up to $100,000, plus interest, for the land acquisition and the initial pre-development costs of 400 West Georgia in Vancouver. The credit facility bears interest at rates between 5.00% to 6.75% per annum in year one and 6.75% per annum in each year thereafter until maturity. The credit facility matures August 31, 2022, and has a one year extension option to August 31, 2023. Subject to placement of permanent financing, Allied intends to acquire a 50% undivided interest in 400 West Georgia based on total development costs. The loan outstanding as at June 30, 2018, is $77,503 (December 31, 2017 - $67,143).
(b) As at June 30, 2018, the amount included in notes and other receivables includes $11,257 (December 31, 2017 - $11,542) of mortgage receivables due from the purchaser of the Trust's Québec City portfolio as the mortgage transfer was not executed by the lender. The remaining balance is made up of individually insignificant notes receivable.

97ALLIED PROPERTIES REIT Q2 2018 QUARTERLY REPORT
Equipment and other assets (1) $5,688 $5,084
Interest rate swap derivative assets 6,954 7,509
$12,642 $12,593
JUNE 30, 2018 DECEMBER 31, 2017
Tenant trade receivables - net of allowance (a) $8,551 $4,697
Other tenant receivables (b) 2,887 6,982
Miscellaneous receivables (c) 6,090 15,830
Prepaid expenses and deposits (d) 34,091 19,563
$51,619 $47,072
JUNE 30, 2018 DECEMBER 31, 2017
Allowance for doubtful accounts, beginning of period $2,342 $1,686
Additional provision recorded during the period 1,544 1,134
Reversal of previous provisions (795) (300)
Receivables written off during the period (726) (936)
Allowance for doubtful accounts, end of period $2,365 $1,584
JUNE 30, 2018 JUNE 30, 2017
SIX MONTHS ENDED
8. other assets
Other assets consist of the following:
(1) During the three and six months ended June 30, 2018, Allied recorded amortization of equipment and other assets of $412 and $817 (June 30, 2017 - $453 and $974).
9. accounts receivable, prepaid expenses and deposits
(a) Tenant trade receivables
Tenant trade receivables include minimum rent, annual common area maintenance (“CAM”), property tax recovery billings and other recoverable charges.
An allowance for doubtful accounts is maintained for estimated losses resulting from the inability of tenants to meet obligations under lease agreements. Allied actively reviews receivables on a continuous basis and determines the potentially uncollectible accounts on a per-tenant basis giving consideration to their credit risk. An accounts receivable is written down to its estimated realizable value when Allied has reason to believe that the tenant will not be able to fulfill its obligations under the lease agreement.
The movement in the allowance for doubtful accounts is reconciled as follows:

98 ALLIED PROPERTIES REIT Q2 2018 QUARTERLY REPORT
Mortgages payable (a) $805,537 $965,832
Construction loans payable (b) 60,102 46,758
Unsecured revolving operating facility (c) 20,000 25,000
Senior unsecured debentures (d) 573,084 572,849
Unsecured term loans (e) 349,579 349,438
$1,808,302 $1,959,877
Current $227,232 $254,351
Non-current 1,581,070 1,705,526
$1,808,302 $1,959,877
JUNE 30, 2018 DECEMBER 31, 2017
(b) Other tenant receivables
Other tenant receivables pertain to unbilled operating costs such as common area maintenance and property tax recoveries and chargebacks.
(c) Miscellaneous receivables
Miscellaneous receivables consist primarily of property taxes recoverable from municipalities and insurance claims. As at June 30, 2018, there are no credit risk indicators that the debtors will not meet their payment obligations.
(d) Prepaid expenses and deposits
Prepaid expenses primarily relate to property operating expenses (mainly realty taxes and insurance) and deposits relating to acquisitions.
10. debt
Debt consists of the following items, net of financing costs:

99ALLIED PROPERTIES REIT Q2 2018 QUARTERLY REPORT
Remaining 2018 $12,824 $51,952 $64,776
2019 24,965 — 24,965
2020 26,043 4,456 30,499
2021 25,136 99,079 124,215
2022 21,326 100,102 121,428
2023 17,334 213,355 230,689
2024 4,691 174,860 179,551
2025 1,146 8,788 9,934
2026 924 20,443 21,367
Mortgages, principal $134,389 $673,035 $807,424 $966,894
Net premium on assumed mortgages 1,451 2,599
Net financing costs (3,338) (3,661)
$805,537 $965,832
PRINCIPAL REPAYMENTS
DECEMBER 31, 2017
BALANCE DUE AT MATURITY
JUNE 30, 2018
TELUS Sky 33 .33% $114,000 August 31, 2019 $60,102 $46,758
OWNERSHIPJOINT ARRANGEMENT
DATE OF MATURITY
ALLIED’S GUARANTEE
LIMITJUNE 30,
2018DECEMBER 31,
2017
(a) Mortgages payable
Mortgages payable have a weighted average stated interest rate of 4.47% as at June 30, 2018 (December 31, 2017 - 4.73%). The mortgages are secured by a first registered charge over specific investment properties and first general assignments of leases, insurance and registered chattel mortgages.
(b) Construction loans payable
As of June 30, 2018, and December 31, 2017, Allied's obligation of the balance outstanding under the construction loans is:
The construction loans payable for the TELUS Sky joint arrangement bears interest at bank prime plus 70 basis points or banker's acceptance rate plus 195 basis points.
In April 2018, Allied and Westbank received a commitment from a syndicate of Canadian banks for a construction loan for the Duncan & Adelaide joint arrangement, subject to execution of definitive financing documents and completion of customary financing conditions. The commitment is expected to fund up to $270,000 (Allied's 50% share being $135,000) at bank prime plus 35 basis points or banker’s acceptance rate plus 135 basis points.
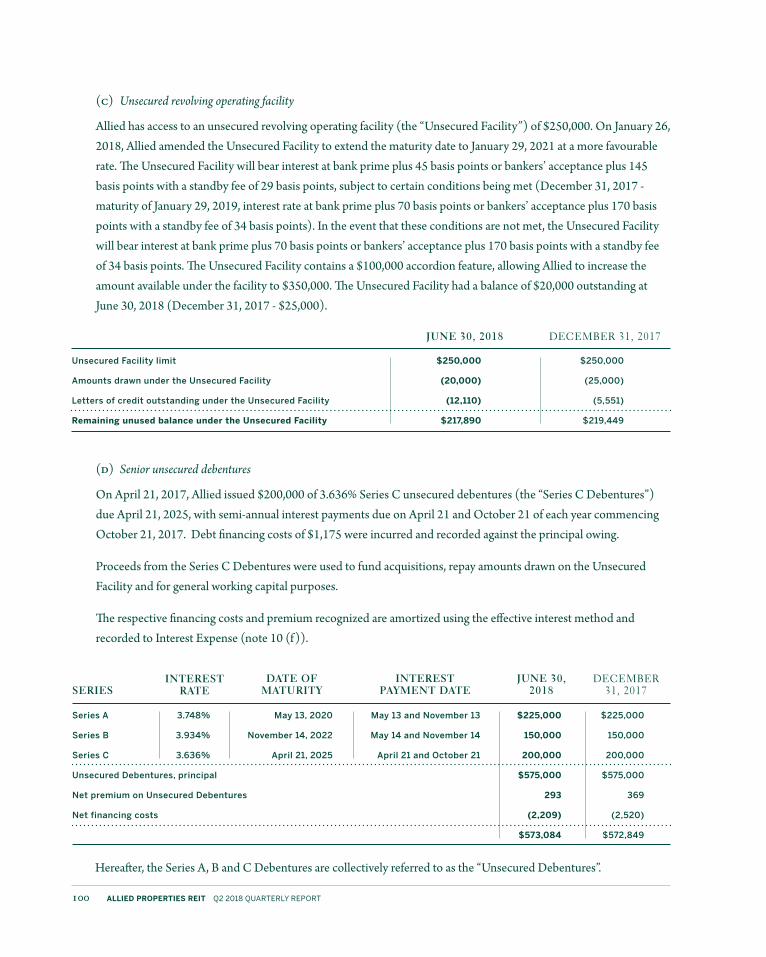
100 ALLIED PROPERTIES REIT Q2 2018 QUARTERLY REPORT
Series A 3 .748% May 13, 2020 May 13 and November 13 $225,000 $225,000
Series B 3 .934% November 14, 2022 May 14 and November 14 150,000 150,000
Series C 3 .636% April 21, 2025 April 21 and October 21 200,000 200,000
Unsecured Debentures, principal $575,000 $575,000
Net premium on Unsecured Debentures 293 369
Net financing costs (2,209) (2,520)
$573,084 $572,849
INTEREST RATESERIES
INTEREST PAYMENT DATE
DATE OF MATURITY
JUNE 30, 2018
DECEMBER 31, 2017
Unsecured Facility limit $250,000 $250,000
Amounts drawn under the Unsecured Facility (20,000) (25,000)
Letters of credit outstanding under the Unsecured Facility (12,110) (5,551)
Remaining unused balance under the Unsecured Facility $217,890 $219,449
JUNE 30, 2018 DECEMBER 31, 2017
(c) Unsecured revolving operating facility
Allied has access to an unsecured revolving operating facility (the “Unsecured Facility”) of $250,000. On January 26, 2018, Allied amended the Unsecured Facility to extend the maturity date to January 29, 2021 at a more favourable rate. The Unsecured Facility will bear interest at bank prime plus 45 basis points or bankers’ acceptance plus 145 basis points with a standby fee of 29 basis points, subject to certain conditions being met (December 31, 2017 - maturity of January 29, 2019, interest rate at bank prime plus 70 basis points or bankers’ acceptance plus 170 basis points with a standby fee of 34 basis points). In the event that these conditions are not met, the Unsecured Facility will bear interest at bank prime plus 70 basis points or bankers’ acceptance plus 170 basis points with a standby fee of 34 basis points. The Unsecured Facility contains a $100,000 accordion feature, allowing Allied to increase the amount available under the facility to $350,000. The Unsecured Facility had a balance of $20,000 outstanding at June 30, 2018 (December 31, 2017 - $25,000).
(d) Senior unsecured debentures
On April 21, 2017, Allied issued $200,000 of 3.636% Series C unsecured debentures (the “Series C Debentures”) due April 21, 2025, with semi-annual interest payments due on April 21 and October 21 of each year commencing October 21, 2017. Debt financing costs of $1,175 were incurred and recorded against the principal owing.
Proceeds from the Series C Debentures were used to fund acquisitions, repay amounts drawn on the Unsecured Facility and for general working capital purposes.
The respective financing costs and premium recognized are amortized using the effective interest method and recorded to Interest Expense (note 10 (f)).
Hereafter, the Series A, B and C Debentures are collectively referred to as the “Unsecured Debentures”.

101ALLIED PROPERTIES REIT Q2 2018 QUARTERLY REPORT
Unsecured Term Loan 2 .645% December 14, 2018 Monthly $150,000 $150,000
Unsecured Term Facility
Tranche 1 2 .830% March 16, 2021 Quarterly 100,000 100,000
Tranche 2 2 .890% March 16, 2021 Quarterly 100,000 100,000
Unsecured Term Loans, principal $350,000 $350,000
Net financing costs (421) (562)
$349,579 $349,438
INTEREST RATE
FREQUENCY OF INTEREST
PAYMENTDATE OF MATURITYJUNE 30,
2018DECEMBER
31, 2017
(e) Unsecured term loans
As of June 30, 2018, and December 31, 2017, Allied's obligation of the balance outstanding under the unsecured term loans is summarized in the table below:
The respective financing costs are amortized using the effective interest method and recorded to Interest Expense (note 10 (f)).
Hereafter, the Unsecured Term Loan and Unsecured Term Facility are collectively referred to as the “Unsecured Term Loans”.

102 ALLIED PROPERTIES REIT Q2 2018 QUARTERLY REPORT
(f) Interest expense
Interest expense consists of the following:
Borrowing costs have been capitalized to qualifying investment properties, where applicable, at a weighted average rate of 3.88% per annum ( June 30, 2017 – 4.11%).
THREE MONTHS ENDED SIX MONTHS ENDED
Interest on debt:
Mortgages payable $10,671 $12,562 $21,662 $25,122
Construction loans payable 498 171 903 232
Unsecured Facility 1,018 376 1,571 930
Unsecured Debentures 5,416 5,052 10,832 8,650
Unsecured Term Loans 2,388 2,411 4,757 4,794
Interest on finance lease obligations 2,063 1,842 4,155 3,379
Amortization, premium (discount) on debt (631) (83) (1,224) (130)
Amortization, net financing costs 452 479 904 1,012
$21,875 $22,810 $43,560 $43,989
Less: Interest capitalized to qualifying investment properties (6,015) (4,875) (11,774) (10,214)
Interest expense excluding yield maintenance cost $15,860 $17,935 $31,786 $33,775
Adjustment for yield maintenance cost due to early repayment 7,502 — 7,502 —
Interest expense $23,362 $17,935 $39,288 $33,775
JUNE 30, 2018 JUNE 30, 2017 JUNE 30, 2018 JUNE 30, 2017

103ALLIED PROPERTIES REIT Q2 2018 QUARTERLY REPORT
Future minimum lease payments $5,357 $38,864 $474,000 $518,221 $535,247
Interest accrued on lease obligations (281) 2,032 — 1,751 3,641
Less: amounts representing interest payments (5,076) (40,896) (318,132) (364,104) (384,017)
Present value of lease payments $— $— $155,868 $155,868 $154,871
2018 (1)2019 - 2022 (1) THEREAFTER
JUNE 30, 2018
DECEMBER 31, 2017
(1) The future minimum lease payments prior to 2022 are less than the effective interest on the finance lease obligations.
Some of Allied’s finance lease agreements contain contingent rent clauses. Contingent rental payments are recognized in the unaudited condensed consolidated statements of income and comprehensive income as required when contingent criteria are met. The finance lease agreements contain renewal options, purchase options, escalation clauses, additional debt and further leasing clauses. For the three and six months ended June 30, 2018, minimum lease payments of $2,128 and $4,078, respectively were paid by Allied ( June 30, 2017 - $1,935 and $3,826).
(g) Schedule of principal repayments
The table below summarizes the scheduled principal maturity for Allied's Mortgages payable, Construction loans payable, Unsecured Facility, Unsecured Debentures and Unsecured Term Loans.
Mortgages payable, principal repayments $12,824 $24,965 $26,043 $25,136 $21,326 $17,334 $6,761 $134,389
Mortgages payable, balance due at maturity 51,952 — 4,456 99,079 100,102 213,355 204,091 673,035
Construction loans payable — 60,102 — — — — — 60,102
Unsecured Facility — — — 20,000 — — — 20,000
Unsecured Debentures — — 225,000 — 150,000 — 200,000 575,000
Unsecured Term Loans 150,000 — — 200,000 — — — 350,000
Total $214,776 $85,067 $255,499 $344,215 $271,428 $230,689 $410,852 $1,812,526
THEREAFTER TOTAL20232022202120202019REMAINING
2018
A description of Allied’s risk management objectives and policies for financial instruments is provided in note 24.
11. finance lease obligations
Allied's future minimum finance lease payments as a lessee are as follows:

104 ALLIED PROPERTIES REIT Q2 2018 QUARTERLY REPORT
Trade payables and other liabilities $100,178 $89,627
Prepaid tenant rents and tenant deposits 51,818 47,705
Accrued interest payable 5,565 6,374
Distributions payable to Unitholders 13,036 12,082
Interest rate swap derivative liability 2,293 4,074
$172,890 $159,862
JUNE 30, 2018 DECEMBER 31, 2017
13. fair value measurements
The classification, measurement basis, and related fair value for disclosures of the financial assets and liabilities are summarized in the following table:
12. accounts payable and other liabilities
Accounts payable and other liabilities consists of the following:
Financial Assets:
Loans and notes receivable and advances to developer (note 7) Amortized cost 112,210 112,210 102,241 102,241
Cash and cash equivalents (note 19) Amortized cost 2,080 2,080 6,048 6,048
Accounts receivable, prepaid expenses and deposits (note 9) Amortized cost 51,619 51,619 47,072 47,072
Unsecured term loan interest swap asset (note 8) FVTPL 6,954 6,954 7,509 7,509
Financial Liabilities:
Debt (note 10)
Mortgages Amortized cost 805,537 827,730 965,832 993,774
Construction loans payable Amortized cost 60,102 60,102 46,758 46,758
Unsecured Facility Amortized cost 20,000 20,000 25,000 25,000
Unsecured Debentures Amortized cost 573,084 577,588 572,849 578,267
Unsecured Term Loans Amortized cost 349,579 346,569 349,438 344,149
Mortgage interest swap liability (note 12) FVTPL 2,293 2,293 4,074 4,074
Finance lease obligations (note 11 and note 5) Amortized cost 155,868 173,525 154,871 172,857
Accounts payable and other liabilities (note 12) Amortized cost 170,597 170,597 155,788 155,788
CLASSIFICATION/ MEASUREMENT
CARRYING VALUE FAIR VALUE
CARRYING VALUE FAIR VALUE
JUNE 30, 2018 DECEMBER 31, 2017

105ALLIED PROPERTIES REIT Q2 2018 QUARTERLY REPORT
Financial Assets:
Loans and notes receivable and advances to developer (note 7) — 112,210 — — 102,241 —
Cash and cash equivalents (note 19) 2,080 — — 6,048 — —
Accounts receivable, prepaid expenses and deposits (note 9) — 51,619 — — 47,072 —
Unsecured term loan interest swap asset (note 8) — 6,954 — — 7,509 —
Financial Liabilities:
Debt (note 10)
Mortgages — 827,730 — — 993,774 —
Construction loans payable — 60,102 — — 46,758 —
Unsecured Facility — 20,000 — — 25,000 —
Unsecured Debentures — 577,588 — — 578,267 —
Unsecured Term Loans — 346,569 — — 344,149 —
Mortgage interest swap liability (note 12) — 2,293 — — 4,074 —
Finance lease obligations (note 11 and note 5) — — 173,525 — — 172,857
Accounts payable and other liabilities (note 12) — 170,597 — — 155,788 —
LEVEL 1 LEVEL 2 LEVEL 3 LEVEL 1 LEVEL 2 LEVEL 3
JUNE 30, 2018 DECEMBER 31, 2017
Allied uses various methods in estimating the fair value of assets and liabilities that are measured on a recurring or non-recurring basis in the unaudited condensed consolidated Balance Sheet after initial recognition. The fair value hierarchy reflects the significance of inputs used in determining the fair values.
- Level 1 – quoted prices in active markets for identical assets and liabilities;
- Level 2 – inputs other than quoted prices in active markets or valuation techniques where significant inputs are based on observable market data; and
- Level 3 – valuation technique for which significant inputs are not based on observable market data.
The following table presents the hierarchy of assets and liabilities:
The carrying value of Allied’s financial assets and liabilities approximates the fair value except for debt (note 10) and finance lease obligations (note 11).
There were no transfers between levels of the fair value hierarchy during the periods.

106 ALLIED PROPERTIES REIT Q2 2018 QUARTERLY REPORT
Interest rate swap derivative asset (note 8) $6,954 $7,509
Interest rate swap derivative liability (note 12) (2,293) (4,074)
Net asset $4,661 $3,435
JUNE 30, 2018 DECEMBER 31, 2017
DECEMBER 31, 2017JUNE 30, 2018
Trust Units, beginning of period 92,935,150 $2,399,768 84,734,469 $2,098,267
Restricted unit plan (net of forfeitures) (note 15(b)) — (2,584) — (2,173)
Long-term incentive plan — — — 72
Unit option plan - options exercised (note 15(a)) 46,524 1,533 507,044 15,948
Unit offering 7,293,300 286,664 7,695,000 287,701
Purchase of Units under normal course issuer bid for cancellation — — (1,363) (47)
Trust Units, end of period 100,274,974 $2,685,381 92,935,150 $2,399,768
UNITS UNITSAMOUNT AMOUNT
Other than as described in investment properties (note 5), the following summarizes the significant methods and assumptions used in estimating the fair value of Allied’s financial assets and liabilities measured at fair value:
INTEREST RATE SWAP DERIVATIVE CONTRACTS
The fair value of Allied’s interest rate derivative contracts, which represents a net asset as at June 30, 2018, is $4,661 (December 31, 2017 - $3,435). The fair value of the derivative contracts is determined using forward interest rates observable in the market (Level 2).
DEBT
The fair value of debt is determined by discounting the cash flows of these financial instruments using period end market rates for instruments of similar terms and credit risks that are observable in the market (Level 2).
FINANCE LEASE OBLIGATIONS
The fair value of finance lease obligations is determined by discounting the cash flows for the obligations using applicable Level 3 inputs based on Allied’s assumptions of interest rates and the residual lease term.
14. unitholders equity
The following represents the number of Units issued and outstanding, and the related carrying value of Unitholders' equity, for the six months ended June 30, 2018, and for the year ended December 31, 2017.

107ALLIED PROPERTIES REIT Q2 2018 QUARTERLY REPORT
On June 22, 2018, Allied raised gross proceeds of $299,025 through the issuance of 7,293,300 Units at a price of $41.00 per Unit. Costs relating to the issuance totaled $12,361 and were applied against the gross proceeds of the issuance and charged against Unitholders' equity.
On August 17, 2017, Allied raised gross proceeds of $300,105 through the issuance of 7,695,000 Units at a price of $39.00 per unit. Costs relating to the issuance totaled $12,404 and were applied against the gross proceeds of the issuance and charged against Unitholders' equity.
Allied does not hold any of its own Units, nor does Allied reserve any Units for issue under options and contracts.
CASH DISTRIBUTIONS
The current rate of distribution amounts to $1.56 per unit per annum (December 31, 2017 - $1.56 per unit per annum).
NORMAL COURSE ISSUER BID
On February 20, 2018, Allied received approval from the Toronto Stock Exchange (“TSX”) for the renewal of its normal course issuer bid (“NCIB”), which entitles Allied to purchase up to 9,114,825 of its outstanding Units, representing approximately 10% of its public float as at February 14, 2018. The NCIB commenced February 22, 2018, and will expire on February 21, 2019, or such earlier date as Allied completes its purchases pursuant to the NCIB. All purchases under the NCIB will be made on the open market through the facilities of the TSX or alternate trading systems in Canada at market prices prevailing at the time of purchase. Any Units that are repurchased will either be cancelled or delivered to participants under Allied's Restricted Unit Plan or to employees pursuant to Allied's employee programs.
During the six months ended June 30, 2018, Allied purchased 61,733 Units for $2,584 at a weighted average price of $41.86 per Unit under its NCIB program, of which all were purchased for delivery to participants under the Trust's Restricted Unit Plan.
During the year ended December 31, 2017, Allied purchased 65,580 Units for $2,283 at a weighted average price of $34.81 per Unit under its NCIB program, of which 64,217 were purchased for delivery to participants under the Trust's Restricted Unit Plan and 1,363 were purchased for cancellation.

108 ALLIED PROPERTIES REIT Q2 2018 QUARTERLY REPORT
March 5, 2013 March 5, 2018 209,235 $34 .25 (182,787) (26,448) — —
March 4, 2014 March 4, 2019 266,174 $33 .29 (182,673) (65,914) 17,587 17,587
May 6, 2014 May 6, 2019 8,474 $34 .59 (8,474) — — —
March 3, 2015 March 3, 2020 302,706 $40 .60 — — 302,706 302,706
March 1, 2016 March 1, 2026 540,480 $31 .56 (112,534) (19,132) 408,814 244,195
February 22, 2017 February 22, 2027 279,654 $35 .34 — — 279,654 69,914
February 14, 2018 February 14, 2028 198,807 $40 .30 — — 198,807 —
1,805,530 (486,468) (111,494) 1,207,568 634,402
Expiry dateDate granted VestedNet
outstandingForfeited - life to date
Exercised - life to date
Exercise price
Units granted
SUMMARY OF UNIT OPTION GRANTS:
DECEMBER 31, 2017
YEAR ENDED
JUNE 30, 2018
SIX MONTHS ENDED
For the Units outstanding at the end of the period $31.56-40.60 6.62 $31 .56-40 .60 6 .41
The range of exercise prices
The range of exercise prices
Weighted average remaining contractual
life (years)
Weighted average remaining contractual
life (years)
15. unit option and restricted unit plans
(a) Unit option plan
Allied adopted a Unit Option Plan providing for the issuance, from time to time, at the discretion of the trustees, of options to purchase Units for cash. Participation in the Unit Option Plan is restricted to certain employees of Allied. The Unit Option Plan complies with the requirements of the Toronto Stock Exchange. The exercise price of any option granted will not be less than the closing market price of the Units on the day preceding the date of grant. Options granted prior to February 22, 2017 vest evenly over three years and options granted subsequently vest evenly over four years from the date of grant. All options are settled in Units.

109ALLIED PROPERTIES REIT Q2 2018 QUARTERLY REPORT
DECEMBER 31, 2017
YEAR ENDED
JUNE 30, 2018
SIX MONTHS ENDED
Balance at the beginning of the period 1,057,084 $35.24 1,296,191 $33 .70
Granted during the period 198,807 40.30 279,654 35 .34
Forfeited during the period (1,799) 31.56 (11,717) 31 .56
Exercised during the period (46,524) 32.94 (507,044) 31 .46
Balance at the end of the period 1,207,568 $36.17 1,057,084 $35 .24
Units exercisable at the end of the period 634,402 $36.34 345,491 $37 .11
Number of Units Number of UnitsWeighted average
exercise priceWeighted average
exercise price
Unit options granted 198,807 279,654
Unit option holding period (years) 10 10
Volatility rate 24.48% 25 .08%
Distribution yield 3.87% 4 .33%
Risk free interest rate 2.32% 1 .69%
Value of options granted $1,354 $1,423
JUNE 30, 2018
SIX MONTHS ENDED
DECEMBER 31, 2017
YEAR ENDED
Allied accounts for its Unit Option Plan using the fair value method, under which compensation expense is measured at the date options are granted and recognized over the vesting period.
Allied utilizes the Black-Scholes Model for the valuation of unit options with no performance criteria.
Assumptions utilized in the Black-Scholes Model for option valuation are as follows:
The underlying expected volatility was determined by reference to historical data of Allied’s Units over 10 years.
For the three and six months ended June 30, 2018, Allied recorded share-based payment expense of $326 and $687, respectively in general and administrative expense in the unaudited condensed consolidated statement of income and comprehensive income (for the three and six months ended June 30, 2017 - $330 and $771, respectively).
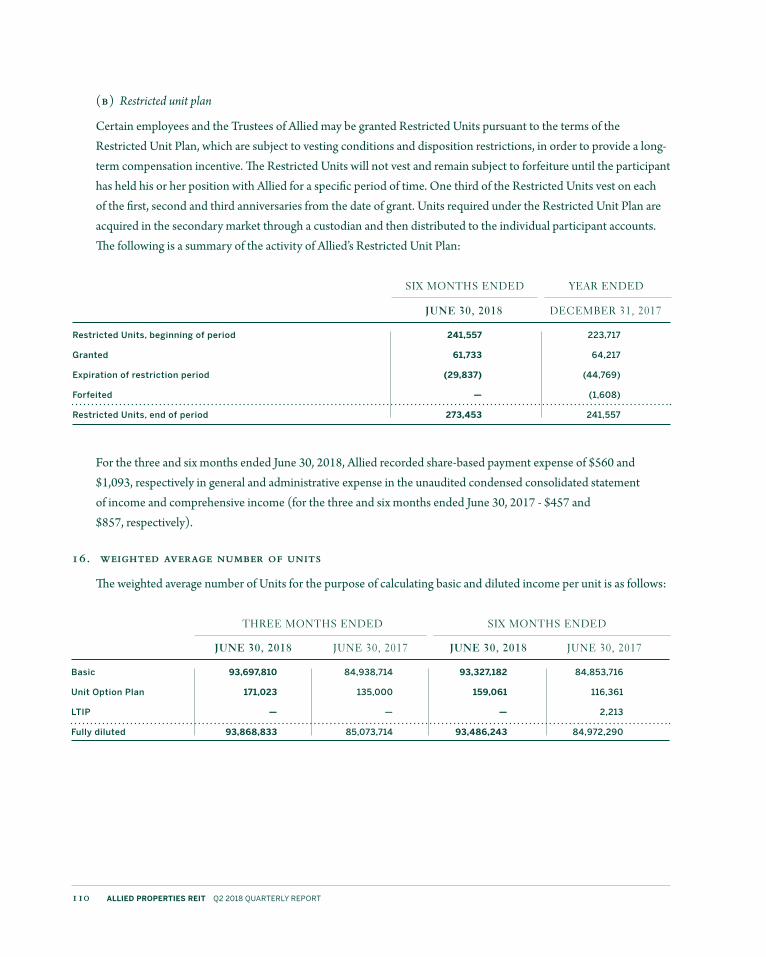
110 ALLIED PROPERTIES REIT Q2 2018 QUARTERLY REPORT
Restricted Units, beginning of period 241,557 223,717
Granted 61,733 64,217
Expiration of restriction period (29,837) (44,769)
Forfeited — (1,608)
Restricted Units, end of period 273,453 241,557
JUNE 30, 2018 DECEMBER 31, 2017
SIX MONTHS ENDED YEAR ENDED
(b) Restricted unit plan
Certain employees and the Trustees of Allied may be granted Restricted Units pursuant to the terms of the Restricted Unit Plan, which are subject to vesting conditions and disposition restrictions, in order to provide a long-term compensation incentive. The Restricted Units will not vest and remain subject to forfeiture until the participant has held his or her position with Allied for a specific period of time. One third of the Restricted Units vest on each of the first, second and third anniversaries from the date of grant. Units required under the Restricted Unit Plan are acquired in the secondary market through a custodian and then distributed to the individual participant accounts. The following is a summary of the activity of Allied’s Restricted Unit Plan:
For the three and six months ended June 30, 2018, Allied recorded share-based payment expense of $560 and $1,093, respectively in general and administrative expense in the unaudited condensed consolidated statement of income and comprehensive income (for the three and six months ended June 30, 2017 - $457 and $857, respectively).
16. weighted average number of units
The weighted average number of Units for the purpose of calculating basic and diluted income per unit is as follows:
Basic 93,697,810 84,938,714 93,327,182 84,853,716
Unit Option Plan 171,023 135,000 159,061 116,361
LTIP — — — 2,213
Fully diluted 93,868,833 85,073,714 93,486,243 84,972,290
JUNE 30, 2018JUNE 30, 2017JUNE 30, 2018 JUNE 30, 2017
THREE MONTHS ENDED SIX MONTHS ENDED

111ALLIED PROPERTIES REIT Q2 2018 QUARTERLY REPORT
Future minimum rental income $116,075 $611,190 $922,920 $1,650,185
REMAINING 2018 2019 - 2022 THEREAFTER TOTAL
Cash $1,068 $4,717
Short-term deposits 1,012 1,331
Total cash and cash equivalents $2,080 $6,048
JUNE 30, 2018 DECEMBER 31, 2017
17. rental revenue from investment properties
Rental revenue includes the following:
Rental revenue from rental properties $47,163 $47,267 $95,563 $96,525
Revenue from non-lease components (property taxes, insurance) 21,897 20,904 43,911 40,067
Operating cost recoveries 37,923 34,963 74,403 68,653
Total rental revenue 106,983 103,134 $213,877 $205,245
JUNE 30, 2018JUNE 30, 2017JUNE 30, 2018 JUNE 30, 2017
THREE MONTHS ENDED SIX MONTHS ENDED
Future minimum rental income is as follows:
18. general and administrative expenses
19. supplemental cash flow information
Cash and cash equivalents include the following components:
Salaries and benefits $3,422 $2,868 $6,823 $6,185
Professional and directors fees 681 561 1,287 1,210
Office and general expenses 886 478 1,665 1,101
$4,989 $3,907 $9,775 $8,496
Capitalized to qualifying investment properties (941) (1,279) (1,866) (2,368)
Total $4,048 $2,628 $7,909 $6,128
JUNE 30, 2018
JUNE 30, 2017
JUNE 30, 2018
JUNE 30, 2017
THREE MONTHS ENDED SIX MONTHS ENDED

112 ALLIED PROPERTIES REIT Q2 2018 QUARTERLY REPORT
The following summarizes supplemental cash flow information and non-cash transactions:
The following summarizes the change in non-cash operating items:
Supplemental
Interest paid on debt (including capitalized interest) $35,495 $24,665 $52,088 $41,881
Interest received $1,361 $430 $2,677 $759
JUNE 30, 2018
JUNE 30, 2017
JUNE 30, 2018
JUNE 30, 2017
THREE MONTHS ENDED SIX MONTHS ENDED
Net change in accounts receivable, prepaid expenses and deposits $663 $(7,421) $(4,547) $(9,304)
Net change in loans receivable 83 21 106 91
Net change in accounts payable and other liabilities (14,077) 12,145 13,028 31,467
Less: Non-cash interest 6,118 1,855 1,026 (2,108)
Less: Distributions payable to Unitholders (950) (21) (954) (38)
Less: Mortgage interest swap liability 641 3,045 1,781 3,465
Less: Amounts from acquired properties 1 (265) (326) (307)
Change in non-cash operating items $(7,521) $9,359 $10,114 $23,266
JUNE 30, 2018
JUNE 30, 2017
JUNE 30, 2018
JUNE 30, 2017
THREE MONTHS ENDED SIX MONTHS ENDED

113ALLIED PROPERTIES REIT Q2 2018 QUARTERLY REPORT
305 Joseph Street Kitchener, ON Rental Property 50% —%
478 King W Toronto, ON Rental Property 50% 50%
642 King W Toronto, ON Rental Property 50% 50%
731 10th Avenue SW Calgary, AB Rental Property 50% —%
812-11th Avenue SW Calgary, AB Rental Property 50% —%
816-838 11th SW Calgary, AB Rental Property 50% 50%
Adelaide & Duncan Toronto, ON Property Under Development 50% 50%
Breithaupt Block I & II Kitchener, ON Rental Property 50% 50%
College & Manning Toronto, ON Rental Property 50% 50%
College & Palmerston Toronto, ON Rental Property 50% 50%
King Portland Centre Toronto, ON Rental Property and 50% 50% Property Under Development
TELUS Sky Calgary, AB Property Under Development 33.33% 33 .33%
The Well Toronto, ON Property Under Development 50% 50%
OWNERSHIP
LOCATIONJUNE 30,
2018DECEMBER 31,
2017CURRENT STATUSPROPERTIES
Total assets $619,892 $533,734
Total liabilities $187,695 $167,371
JUNE 30, 2018 DECEMBER 31, 2017
20. joint arrangements
The Trust has investments in properties under joint arrangements which are accounted for as joint operations. The following tables summarize Allied’s ownership interests in joint operations and its share of the rights to the assets, obligations with respect to liabilities, and its share of revenues and expenses for the joint operations in which it participates.
Revenue $2,054 $1,737 $4,120 $3,463
Expenses (1,179) (998) (2,237) (1,952)
Income before fair value adjustment on investment properties 875 739 1,883 1,511
Fair value (loss) gain on investment properties (5,114) 1,805 (7,803) 4,006
Net income $(4,239) $2,544 $(5,920) $5,517
JUNE 30, 2018
JUNE 30, 2017
JUNE 30, 2018
JUNE 30, 2017
THREE MONTHS ENDED SIX MONTHS ENDED

114 ALLIED PROPERTIES REIT Q2 2018 QUARTERLY REPORT
21. segmented information
IFRS 8, Operating Segments, requires operating segments to be determined based on internal reports that are regularly reviewed by the chief operating decision maker (“CODM”) for the purpose of allocating resources to the segment and assessing its performance. The Trust has determined that its CODM is the Chief Executive Officer. The Trust's operating segments are managed by use of properties and geographical locations. Mission Critical Facilities are comprised of properties operating similar to data centers and colocation facilities. The urban office properties are managed by geographical area consisting of three geographical locations comprising Eastern Canada (Montréal, Québec City and Ottawa), Central Canada (Toronto and Kitchener) and Western Canada (Winnipeg, Calgary, Edmonton, Vancouver and Victoria). On December 20 and 27, 2017, Allied disposed of its Winnipeg and Québec City properties. These disposals are consistent with Allied's previously disclosed business strategy of exiting these two markets.
The CODM measures and evaluates performance of the Trust's operating segments based on net rental income.
Management reviews assets and liabilities on a total corporate basis and therefore assets and liabilities are not included in the segmented information below.
Allied does not allocate interest expense to segments as debt is viewed by Management to be used for the purpose of acquisitions, development and improvement of all the properties. Similarly, general and administrative expenses, interest income and fair value of derivative instruments are not allocated to operating segments. These are presented in the tables below within the “Other” column.
The following summary tables present a reconciliation of net rental income to net income for the three and six months ended June 30, 2018 and 2017.

115ALLIED PROPERTIES REIT Q2 2018 QUARTERLY REPORT
SEGMENTED UNAUDITED CONDENSED CONSOLIDATED STATEMENTS OF INCOME (LOSS) AND COMPREHENSIVE INCOME (LOSS)
SEGMENTED UNAUDITED CONDENSED CONSOLIDATED STATEMENTS OF INCOME (LOSS) AND COMPREHENSIVE INCOME (LOSS)
Rental revenue from investment properties $28,664 $46,496 $12,001 $19,822 $— $106,983
Property operating costs (14,308) (17,951) (5,515) (7,766) — (45,540)
Net rental income 14,356 28,545 6,486 12,056 — 61,443
Interest expense — — — — (23,362) (23,362)
General and administrative expenses — — — — (4,048) (4,048)
Amortization of leasing costs and other assets — — — — (412) (412)
Interest income — — — — 1,361 1,361
Fair value gain (loss) on investment properties 8,363 71,684 (22,171) 20,701 — 78,577
Fair value gain on derivative instruments — — — — 93 93
Net income (loss) and comprehensive income (loss) $22,719 $100,229 $(15,685) $32,757 $(26,368) $113,652
CENTRAL CANADA
EASTERN CANADA
WESTERN CANADA
MISSION CRITICAL OTHER TOTAL
Three months ended June 30, 2018
Rental revenue from investment properties $57,063 $93,552 $24,111 $39,151 $— $213,877
Property operating costs (28,509) (36,790) (10,986) (15,583) — (91,868)
Net rental income 28,554 56,762 13,125 23,568 — 122,009
Interest expense — — — — (39,288) (39,288)
General and administrative expenses — — — — (7,909) (7,909)
Amortization of other assets — — — — (817) (817)
Interest income — — — — 2,677 2,677
Fair value gain (loss) on investment properties 44,845 80,081 (27,179) 22,707 — 120,454
Fair value gain on derivative instruments — — — — 1,226 1,226
Net income (loss) and comprehensive income (loss) $73,399 $136,843 $(14,054) $46,275 $(44,111) $198,352
CENTRAL CANADA
EASTERN CANADA
WESTERN CANADA
MISSION CRITICAL OTHER TOTAL
Six months ended June 30, 2018

116 ALLIED PROPERTIES REIT Q2 2018 QUARTERLY REPORT
22. income taxes
Allied is taxed as a “Mutual Fund Trust” for income tax purposes. Pursuant to its Declaration of Trust, it distributes or designates substantially all of its taxable income to Unitholders and does not deduct such distributions or designations for income tax purposes. Accordingly, no provision for income taxes has been made. Income tax obligations relating to distributions of Allied are the obligations of the Unitholders.
SEGMENTED UNAUDITED CONDENSED CONSOLIDATED STATEMENTS OF INCOME (LOSS) AND COMPREHENSIVE INCOME (LOSS)
SEGMENTED UNAUDITED CONDENSED CONSOLIDATED STATEMENTS OF INCOME (LOSS) AND COMPREHENSIVE INCOME (LOSS)
Rental revenue from investment properties $27,849 $43,363 $13,365 $18,557 $— $103,134
Property operating costs (13,121) (17,160) (5,802) (7,410) — (43,493)
Net rental income 14,728 26,203 7,563 11,147 — 59,641
Interest expense — — — — (17,935) (17,935)
General and administrative expenses — — — — (2,628) (2,628)
Amortization of leasing costs and other assets (773) (867) (271) (131) (454) (2,496)
Interest income — — — — 430 430
Fair value gain (loss) on investment properties (13,898) 98,637 (24,858) 10,929 — 70,810
Fair value gain on derivative instruments — — — — 5,259 5,259
Net income (loss) and comprehensive income (loss) $57 $123,973 $(17,566) $21,945 $(15,328) $113,081
CENTRAL CANADA
EASTERN CANADA
WESTERN CANADA
MISSION CRITICAL OTHER TOTAL
Three months ended June 30, 2017
Rental revenue from investment properties $55,906 $84,900 $27,858 $36,581 $— $205,245
Property operating costs (26,690) (33,876) (12,611) (14,675) — (87,852)
Net rental income 29,216 51,024 15,247 21,906 — 117,393
Interest expense — — — — (33,775) (33,775)
General and administrative expenses — — — — (6,128) (6,128)
Amortization of leasing costs and other assets (1,509) (1,892) (509) (262) (975) (5,147)
Interest income — — — — 759 759
Fair value gain (loss) on investment properties (15,609) 145,740 (33,591) 17,958 — 114,498
Fair value gain on derivative instruments — — — — 5,348 5,348
Net income (loss) and comprehensive income (loss) $12,098 $194,872 $(18,853) $39,602 $(34,771) $192,948
CENTRAL CANADA
EASTERN CANADA
WESTERN CANADA
MISSION CRITICAL OTHER TOTAL
Six months ended June 30, 2017

117ALLIED PROPERTIES REIT Q2 2018 QUARTERLY REPORT
23. related party transactions
Allied’s related parties include its subsidiaries, nominee corporations, Allied Properties Management Trust, Allied Properties Management Limited Partnership, Allied Properties Management GP Limited and key management, board of trustees, and their close family members.
Allied engages in third-party property management business, including the provision of services for properties in which certain trustees of Allied have an ownership interest. For the three and six months ended June 30, 2018, real estate service revenue earned from these properties was $72 and $148, respectively (for the three and six months ended June 30, 2017 - $101 and $158, respectively).
The transactions are in the normal course of operations and were measured at the amount set out in agreement between the respective property owners. Related party transactions were made on terms equivalent to those that prevail in arm's length transactions.
Transactions with key management personnel are summarized in the table below:
Salary, bonus and other short-term employee benefits $945 $917 $1,891 $1,833
Unit-based compensation 715 662 1,450 1,303
$1,660 $1,579 $3,341 $3,136
JUNE 30, 2018
JUNE 30, 2017
JUNE 30, 2018
JUNE 30, 2017
THREE MONTHS ENDED SIX MONTHS ENDED
24. risk management
(a) Capital management
Allied defines capital as the aggregate of Unitholders’ equity, mortgages payable, construction loans payable, Unsecured Facility, Unsecured Debentures, Unsecured Term Loans and finance lease obligations. Allied manages its capital to comply with investment and debt restrictions pursuant to the Declaration of Trust, to comply with debt covenants, to ensure sufficient operating funds are available to fund business strategies, to fund leasing and capital expenditures, to fund acquisitions and development activities of properties, and to provide stable and growing cash distributions to Unitholders.
Various debt, equity and earnings distributions ratios are used to monitor capital adequacy requirements. For debt management, debt to gross book value and fair value, debt average term to maturity, and variable debt as a percentage of total debt are the primary ratios used in capital management. The Declaration of Trust requires Allied to maintain debt to gross book value, as defined by the Declaration of Trust, of less than 60% (65% including convertible debentures, if any) and the variable rate debt and debt having maturities of less than one year to not exceed 15% of gross book value. As at June 30, 2018, the debt to gross book value ratio was 29.9% (December 31, 2017 - 33.7%) and debts having variable interest rates or maturities of less than one year aggregated to 4.1% of gross book value (December 31, 2017 - 4.8%).
On December 15, 2016, Allied filed a short form Base Shelf Prospectus allowing for the issuance, from time to time, of Units and debt securities, or any combination thereof having an aggregate offering price of up to $1,000,000. This document is valid for a 25-month period.
Allied has certain key financial covenants in its Unsecured Debentures, Unsecured Facility and Unsecured Term Loans. The key financial covenants include debt service ratios and leverage ratios, as defined in the respective agreements. These ratios are evaluated by the Trust on an ongoing basis to ensure compliance with the agreements. Allied was in compliance with each of the key financial covenants under these agreements as at June 30, 2018.

119ALLIED PROPERTIES REIT Q2 2018 QUARTERLY REPORT
-1 .0% +1 .0%
Unsecured Facility $20,000 $200 $(200)
Unsecured Term Loans maturing within one year $150,000 $1,500 $(1,500)
Mortgages payable maturing within one year $77,232 $772 $(772)
CARRYING AMOUNT
INCOME IMPACT
INCOME IMPACTAS AT JUNE 30, 2018
(b) Market risk
Market risk is the risk that the fair value or future cash flow of financial instruments will fluctuate because of changes in market prices. Allied is exposed to interest rate risk on its borrowings. Substantively all of Allied’s mortgages payable as at June 30, 2018, are at fixed interest rates and are not exposed to changes in interest rates during the term of the debt. However, there is interest rate risk associated with Allied’s fixed interest rate term debt due to the expected requirement to refinance such debts upon maturity. As fixed rate debt matures and as Allied utilizes additional floating rate debt under the Unsecured Facility, Allied will be further exposed to changes in interest rates. As at June 30, 2018, the Unsecured Facility, which is at a floating interest rate and is exposed to changes in interest rates, has a balance of $20,000 (December 31, 2017 - $25,000). In addition, there is a risk that interest rates will fluctuate from the date Allied commits to a debt to the date the interest rate is set with the lender. As part of its risk management program, Allied endeavours to maintain an appropriate mix of fixed rate and floating rate debt, to stagger the maturities of its debt and to minimize the time between committing to a debt and the date the interest rate is set with the lender.
The following table illustrates the annualized sensitivity of income and equity to a reasonably possible change in interest rates of +/- 1.0%. These changes are considered to be reasonably possible based on observation of current market conditions. The calculations are based on a change in the average market interest rate for each period, and the financial instruments held at each reporting date that are sensitive to changes in interest rates. All other variables are held constant.

120 ALLIED PROPERTIES REIT Q2 2018 QUARTERLY REPORT
(c) Credit risk
As Allied has provided loans and advances to facilitate property development, further credit risks arise in the event that borrowers default on the repayment of their amounts owing to Allied. Allied’s loans and advances will be subordinate to prior ranking mortgages or charges. Not all of Allied’s financing activities will translate into acquisitions. As at June 30, 2018, Allied had $98,676 outstanding in loans receivable and advances to developer (December 31, 2017 - $88,316). In the event of a large commercial real estate market correction, the fair market value of an underlying property may be unable to support the loan and advances value. Allied mitigates this risk by obtaining corporate guarantees and/or registered mortgage charges.
Credit risk from tenant receivables arises from the possibility that tenants may experience financial difficulty and be unable to fulfill their lease commitments, resulting in Allied incurring a financial loss. Allied manages credit risk to mitigate exposure to financial loss by staggering lease maturities, diversifying revenue sources over a large tenant base, ensuring no individual tenant contributes a significant portion of Allied’s revenues and conducting credit reviews of new tenants. Management reviews tenant receivables on a regular basis and reduces carrying amounts through the use of an allowance for doubtful accounts and the amount of any loss is recognized in the unaudited condensed consolidated statements of income and comprehensive income within property operating costs. As at June 30, 2018, and June 30, 2017, allowance for doubtful accounts totals $2,365 and $1,584, respectively.
Allied considers that all the financial assets that are not impaired or past due for each of the reporting dates under review are of good quality. The carrying amount of accounts receivable best represents Allied’s maximum exposure to credit risk. None of Allied’s financial assets are secured by collateral or other credit enhancements. An aging of trade receivables, including trade receivables past due but not impaired can be shown as follows:
Less than 30 days $1,408 $3,702
30 to 60 days 2,656 728
More than 60 days 4,487 4,218
Total $8,551 $8,648
JUNE 30, 2018 JUNE 30, 2017

121ALLIED PROPERTIES REIT Q2 2018 QUARTERLY REPORT
(d) Liquidity risk
Liquidity risk arises from the possibility of not having sufficient capital available to fund ongoing operations or the ability to refinance or meet obligations as they come due. Mitigation of liquidity risk is also managed through credit risk as discussed above. A significant portion of Allied’s assets have been pledged as security under the related mortgages and other security agreements. Interest rates on the mortgages payable are between 3.59% and 6.88% for June 30, 2018 (2.00% and 6.88% - December 31, 2017).
As at June 30, 2018, Allied has entered into interest rate derivative contracts to limit its exposure to fluctuations in interest rates on $212,302 of its variable rate mortgages payable and $350,000 of its variable rate Unsecured Term Loans (December 31, 2017 - $215,827 and $350,000, respectively). Gains or losses arising from the change in fair values of the interest rate derivative contracts are recognized in the unaudited condensed consolidated statements of income and comprehensive income. For the three and six months ended June 30, 2018, Allied recognized as part of the change in fair value adjustment on derivative instruments a net gain of $93 and $1,226, respectively (for the three and six months ended June 30, 2017 – a net gain of $5,259 and $5,348, respectively).
Liquidity and capital availability risks are mitigated by maintaining appropriate levels of liquidity, diversifying Allied's sources of funding, maintaining a well-staggered debt maturity profile and actively monitoring market conditions.
(e) Maturity Analysis
The un-discounted future principal and interest payments on Allied's debt instruments are as follows:
Mortgages payable $81,687 $56,696 $61,141 $152,073 $144,118 $464,848 $960,563
Construction loans payable 1,116 61,590 — — — — 62,706
Unsecured Facility 312 623 623 20,052 — — 21,610
Unsecured Debentures 10,803 21,606 246,606 13,173 163,173 221,816 677,177
Unsecured Term Loans 154,503 5,720 5,720 200,000 — — 365,943
Total $248,421 $146,235 $314,090 $385,298 $307,291 $686,664 $2,087,999
2018 THEREAFTER TOTAL2019 2020 2021 2022
122 ALLIED PROPERTIES REIT Q2 2018 QUARTERLY REPORT
25. commitments and contingencies
Allied has entered into commitments for acquisitions, building renovations with respect to leasing activities and development costs. The commitments as at June 30, 2018, and December 31, 2017, were $416,476 and $77,609, respectively.
Allied is subject to legal and other claims in the normal course of business. Management and legal counsel evaluate all claims. In the opinion of Management these claims are generally covered by Allied’s insurance policies and any liability from such claims would not have a significant effect on the unaudited condensed consolidated financial statements.
Allied, through a financial intermediary, has issued letters of credit in the amount of $12,251 representing deposits on financing requirements (December 31, 2017 - $5,691).

2018 OutlookSOLID MID-SINGLE-DIGIT % GROWTH IN SANOI
LOW-SINGLE-DIGIT % GROWTH IN FFO/UNIT
HIGH-SINGLE-DIGIT % GROWTH IN AFFO/UNIT
CONTINUED GROWTH IN NAV/UNIT
CONTINUED STRONG DEBT-METRICS
CONTINUED GROWTH IN UNENCUMBERED ASSETS

ALLIED PROPERTIES REIT
134 PETER STREET, SUITE 1700 TORONTO, ONTARIO M5V 2H2 T 416.977.9002 F 416.306.8704 alliedreit.com


