The Pennsylvania State University The Graduate School College of the Liberal Arts RACE/ETHNICITY, SOCIAL STRUCTURE, AND VIOLENCE: MOVING BEYOND BLACK-WHITE COMPARISONS TOWARD AN UNDERSTANDING OF HISPANIC VIOLENCE A Thesis in Sociology by Ben Feldmeyer Copyright 2007 Ben Feldmeyer Submitted in Partial Fulfillment of the Requirements for the Degree of Doctor of Philosophy August 2007
Transcript
The Pennsylvania State University
The Graduate School
College of the Liberal Arts
RACE/ETHNICITY, SOCIAL STRUCTURE, AND VIOLENCE: MOVING BEYOND
BLACK-WHITE COMPARISONS TOWARD AN UNDERSTANDING OF HISPANIC
VIOLENCE
A Thesis in
Sociology
by
Ben Feldmeyer
Copyright 2007 Ben Feldmeyer
Submitted in Partial Fulfillment
of the Requirements
for the Degree of
Doctor of Philosophy
August 2007
ii
The thesis of Ben Feldmeyer has been reviewed and approved* by the following:
Darrell Steffensmeier
Professor of Sociology and Crime, Law, and Justice
Thesis Advisor
Chair of Committee
Barrett A. Lee
Professor of Sociology and Demography
Eric Silver
Associate Professor of Crime, Law, and Justice and Sociology
Jeffery T. Ulmer
Associate Professor of Sociology and Crime, Law, and Justice
James Eisenstein
Professor Emeritus of Political Science
John D. McCarthy
Professor of Sociology and Demography
Head of the Department of Sociology
*Signatures are on file in the Graduate School
iii
ABSTRACT
It is widely recognized that poverty, disadvantage, and other structural conditions shape
racial/ethnic patterns of violence. However, ecological research on race/ethnicity and violence
has been limited almost exclusively to black-white comparisons and has overlooked Hispanics
and other race/ethnic groups. Additionally, studies on race/ethnicity, social structure, and
violence have been limited in that they (1) continue to debate whether the structural sources of
violence are “racially invariant” (similar), (2) have focused on the effects of disadvantage while
often overlooking how segregation, immigration, and other structural factors influence violence
across race/ethnic groups, and (3) have faced methodological limitations that may have biased
prior findings about racial/ethnic differences in violence and the structural predictors of violence.
In light of its recent population growth and the paucity of research in the area, the
primary objective of this project is to expand ecological research on race/ethnicity and violence
by examining the structural sources of Hispanic violence – both alone and compared to whites
and blacks. Three key questions about the relationship between race/ethnicity, social structure,
and violence are addressed. First, this project tests the racial invariance hypothesis, which
argues that the structural sources of violence are similar across race/ethnicity. Specifically, I
examine whether the structural predictors of violence and especially the effects of disadvantage
on violence are the same for whites, blacks, and Hispanics, and also whether support for the
racial invariance argument depends on how invariance is defined (Chapter 2). Second, moving
beyond the effects of disadvantage, this project examines whether racial/ethnic isolation
influences black and Hispanic violence and whether the effects of segregation on violence are
similar/invariant across race/ethnicity (Chapter 3). Third, focusing specifically on Hispanics, I
iv
examine whether immigration influences Hispanic violence and whether immigration
disorganizes or stabilizes Hispanic communities.
To address these questions, I use arrest data on violent crime and measures of social
structure for whites, blacks, and Hispanics for more than 200 census places across California and
New York during the 1999 to 2001 period. Data on white, black, and Hispanic violent crime are
drawn from the California Arrest Data (CAL) and the New York State Arrest Data (NYSAD).
Race/ethnicity-specific measures of social structure are drawn from 2000 U.S. Census data for
each race/ethnic group at the census place-level. Seemingly Unrelated Regression techniques are
used to compare the structural sources of violence across race/ethnic groups, and structural
equation models are used to identify the total, direct, and indirect effects of immigration on
Hispanic violence rates.
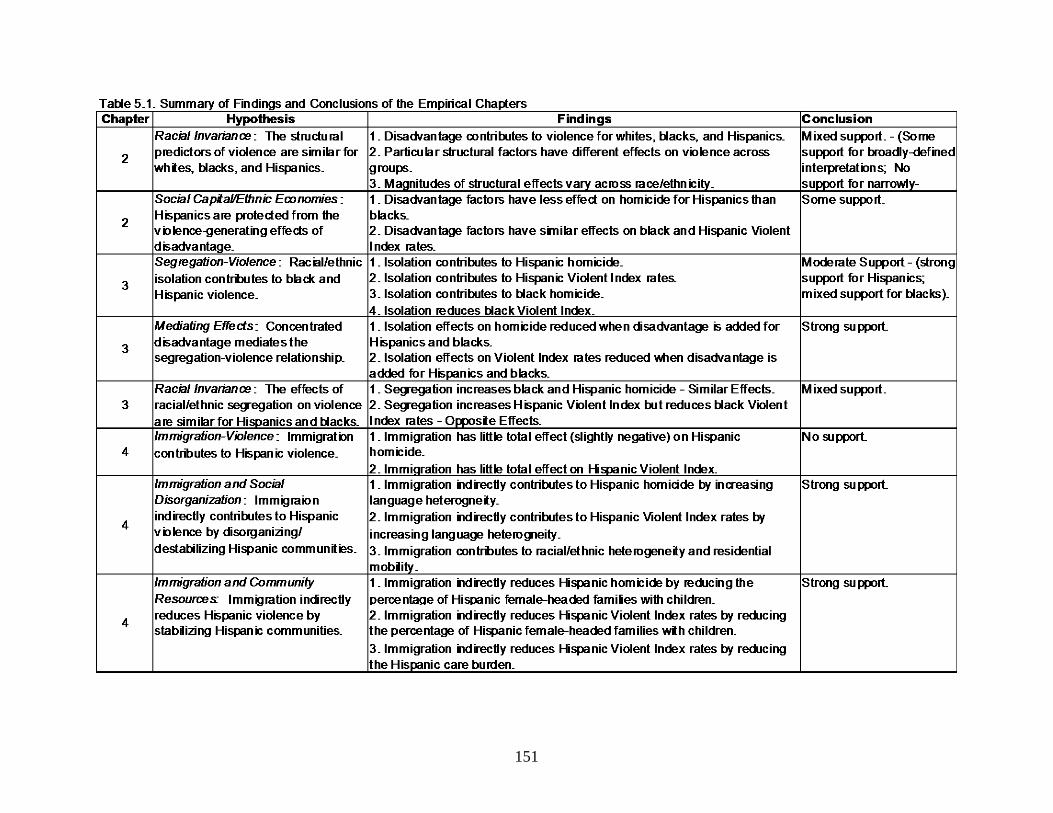
Findings from Chapter 2 provide mixed support for racial invariance arguments and
indicate that disadvantage contributes to violence for whites, blacks, and Hispanics. However,
the effects of particular structural predictors and the magnitudes of structural effects on violence
vary widely across race/ethnicity. Thus, the racial invariance hypothesis is not supported when
using narrowly-defined interpretations and receives modest support when using the broadest
possible definitions of “invariance.”
Chapter 3, which examines the effects of racial/ethnic segregation on black and Hispanic
violence, also provides mixed evidence for the racial invariance hypothesis and reveals that
being residentially isolated (from whites and from all other race/ethnic groups) contributes to
Hispanic violence and black homicide but appears to reduce black Violent Index rates.
Additionally, findings suggest that segregation effects on violence for both blacks and Hispanics
are mediated by concentrated disadvantage.
v
Chapter 4 relies on social disorganization theory and community resource arguments
drawn from the social capital perspective to examine the effects of immigration on Hispanic
violence. The findings from this chapter suggest that immigration has little direct effect on
Hispanic violence. However, immigration appears to have multiple, offsetting indirect effects on
Hispanic violence that work through social disorganization and community resource/social
capital measures. The combination of these direct and indirect effects shows that immigration
has little total effect on Hispanic violence. Chapter 5 concludes by discussing important
implications of this project for research and theory on the ecology of crime and the relationship
between race/ethnicity, social structure, and violence.
vi
TABLE OF CONTENTS
List of Tables……………………………………………………………………………………viii
List of Figures……………………………………………………………………………………..x
Second, cities are so large that it can be difficult to observe community-level processes
and structural effects on violence. Large cities have a great deal of internal diversity and do not
closely reflect “communities” or cohesive social units. For example, the white population within
a city is likely to vary substantially across neighborhoods. Thus, structural analyses at the city-
level that examine a race/ethnic population are likely to contain a great deal of “noise” and may
not capture influences on violence that are found among smaller communities or neighborhoods
(Peterson and Krivo 2005).
Third, city-level analyses tend to truncate variation in measures and predictors of
violence and therefore, provide a limited picture of the race/ethnicity-violence relationship.
Structural conditions like poverty, education, population size, and violence are not likely to vary
much across the 100-125 largest cities in the U.S. For example, black structural disadvantage is
likely to be high and fairly similar across the 100 largest cities. Thus, it is more difficult to
estimate and compare structural effects on violence across race/ethnicity using city-level data
that contain little variation in structural conditions.
Failure to Provide Formal Tests of Racial Invariance
A final limitation in prior research is that conclusions about racial invariance have often
been based on visual observation of effect sizes. Research has rarely used formal significance
tests (i.e. Z-tests or F-tests) to determine whether structural factors have significantly different
effects on violent offending across race/ethnic groups (Patternoster et al. 1998; Clogg et al.
28
1995). Instead, scholars have argued that black and white predictors of violence vary if
structural factors significantly predict violence for one group but not the other. For example, if
poverty is significantly and positively related to white homicide but has no significant effect on
black homicide, researchers have often argued that poverty does not have similar effects on black
and white violence (Harer and Steffensmeier 1992; LaFree et al. 1992; Phillips 2002). However,
this difference in effects for blacks and whites may not be significantly different. Thus, there
may have been a tendency in prior research to claim that structural sources of violence vary
across race/ethnicity when they actually do not. Additionally, by failing to use significance tests,
prior research has rarely been able to discern whether the magnitude of effects varies across
race/ethnic groups.
The research described in this chapter addresses the limitations of prior research
identified above and extends research on racial invariance and the race/ethnicity-violence
relationship in several ways. First, this research moves beyond the standard white-black
comparisons of prior studies and compares the structural sources of violence for three race/ethnic
groups: blacks, whites, and Hispanics. This added focus on Hispanic violence is advantageous
because it broadens our understanding of racial invariance beyond a basic black and white
picture and also adds to the underdeveloped literature on Hispanic crime. Second, I examine
whether support for the racial invariance hypothesis depends on how racial invariance is defined.
Specifically, the structural sources of violence for blacks, whites, and Hispanics are examined
using both narrowly-defined and broadly-defined interpretations to see if evidence on racial
invariance depends on whether one focuses on particular structural effects or on the general,
underlying effects of disadvantage on violence. Third, a census place-level analysis is used to
provide greater variation in measures of violence and social structure and to provide more
29
similarly situated race/ethnic populations for testing the racial invariance hypothesis. Fourth,
this research separates Hispanic, black, and white crime figures to provide measures of black and
white violent crime that are not confounded with Hispanic crime figures and are therefore less
likely to produce biased results. Last, this project extends prior research by using formal
significance tests to compare the structural effects and the magnitude of these effects on violence
across race/ethnic groups.
DATA AND METHODS
The current study compares the structural predictors of black, white, and Hispanic arrest
rates for homicide and the Violent Index. Information on race/ethnicity-disaggregated violence
is drawn from California Arrest Data (CAL) and New York State Arrest Data (NYSAD) for the
1999-2001 period. Information on the structural characteristics of white, black, and Hispanic
populations is drawn from 2000 U.S. Census data. The unit of analysis is the census place,
which is described in greater detail in the following paragraphs.
CENSUS PLACES
Census places include two types of non-overlapping geographic units: incorporated
places and non-incorporated census designated places (CDPs). The majority of census places are
classified as incorporated places (approximately 82 percent in the current study; 83 percent
across the U.S.). Incorporated places include a variety of geographic areas that are recorded by
the U.S. census bureau (e.g., cities, villages, towns, and boroughs) and may vary greatly in terms
of size, ranging from several hundred to several million residents. Incorporated places are
legally-recognized under the laws of their respective states and typically have active governing
bodies (U.S. Bureau of the Census 1994). Requirements for incorporation vary across states and
may depend on a variety of factors, such as the place’s population size, land area, and distance
30
from other incorporated places. However, these requirements are often loosely defined and may
require that places have only 200 or 300 people to be recognized as an incorporated town or
city.1
The second type of census place recorded by the U.S. Census Bureau is the “census
designated place.” CDPs are similar to incorporated places in many ways in that they typically
include large concentrations of people, housing, and commercial structures that are recognizable
by name and typically have distinct geographic boundaries. However, unlike incorporated
places, CDPs are not officially incorporated or recognized by their respective states and rarely
have their own active governing bodies. Additionally, there are no minimum population or
density requirements to be recognized as a CDP. Otherwise, they are quite similar to
incorporated places. As a result, the U.S. Census Bureau recognizes them as distinct places and
records their populations and community characteristics.
Though rarely used as a unit of analysis in criminological research, census places are
well-suited for this analysis and have several advantages. First, they are large enough to provide
reliable measures of violence and social structure for each racial/ethnic group (using some
selection criteria) but small enough to preserve a large sample size for the analysis. Second, as
described above, census places vary widely in terms of size, structural characteristics, and rates
of violence. Prior aggregate research on race/ethnicity and violence has typically used city-level
analyses, which tend to truncate variation in independent and dependent measures. For example,
studies examining the largest 100-125 cities provide a limited picture of the race/ethnicity and
violence relationship and do not offer information about violent offending and the structural
1 In California, cities and towns may be considered for incorporation if they meet the state requirement of 500
registered voters. To be incorporated in New York, villages must have at least 500 people and at least 100 people
per square mile. Incorporation of cities requires a special act of the New York state legislature, but there are no
population requirements for incorporated cities in New York (U.S. Bureau of the Census 1994).
31
conditions of smaller black and white populations. By including a wider range of variation in
size and structural characteristics, census places avoid problems associated with truncating
variation in independent and dependent measures.
Third, the greater variation in structural characteristics across census places provides
greater overlap in the structural conditions across race/ethnic populations. As discussed earlier,
city-level studies rarely provide data on comparable, similarly-situated race/ethnic populations.
As a result, prior research has generally been unable to compare black and white populations that
have similar levels of disadvantage, which some argue may explain the mixed findings of prior
racial invariance studies (see Krivo and Peterson 2000; McNulty 2001; Peterson and Krivo
2005). Census place-level analyses avoid this problem to a greater degree by providing more
potential overlap in black, white, and Hispanic measures of disadvantage and social structure.
For example, as shown later, mean census place rates of unemployment, poverty, education,
family structure, and residential mobility for blacks, whites, and Hispanics are within
approximately 1 standard deviation of each other. Thus, even though white populations do not
experience the most extreme levels of disadvantage found among blacks and Hispanics, census
places provide sizable overlap in the structural conditions for each race/ethnic groups and more
opportunity for comparing “similarly situated” race/ethnic groups.2
Several selection criteria were used to select census places for the analysis in order to
provide greater reliability in the race- and ethnicity-specific measures of violence and social
structure. Census places were included only if they had a total population of at least 10,000 and
2 For example, the average percentage of blacks who are unemployed/not in the labor force (29 percent) is higher than either the white (25 percent) or Hispanic (22 percent) unemployment rates (see Table 2.2). However, the
standard deviations for the black, white, and Hispanic unemployment measures (11.2, 6.7, and 6.9, respectively)
indicate that there is considerable overlap in census-place unemployment rates across race/ethnic groups. This
pattern of variation and overlap is similar for other structural measures of the analyses but is somewhat less
prominent for poverty measures, particularly for black-white comparisons.
32
1,000 black, white, and Hispanic residents in the year 2000, resulting in a final sample of 234
census places.3 The census places meeting these criteria have an average population of
approximately 133,000, with approximately two-thirds of census places in the sample having
populations between 10,000 and 485,000 people.
DEPENDENT VARIABLES
Data on black, white, and Hispanic violent crime were drawn from the California Arrest
Data (CAL) and the New York State Arrest Data (NYSAD).4 The CAL and NYSAD provide
agency-level arrest counts for a variety of offenses, disaggregated by race, ethnicity, age, and
gender. These data sources are particularly well-suited for this project because, unlike the
Uniform Crime Reports (UCR) and many commonly used sources of crime data, they provide
separate “Hispanic” identifiers. Thus, the data offer essential information for analyzing Hispanic
violence and allow comparisons of black and white violence that are not confounded with
Hispanic crime figures. Agency-level arrest counts for whites, blacks, and Hispanics were
compiled and combined with year 2000 race/ethnicity-disaggregated population figures for each
census place (U.S. Census Bureau – STF 4) to create the dependent measures for the analysis:
white, black, and Hispanic arrest rates/100,000 for homicide and Violent Index offenses.5
3 Approximately 440 census places met the criteria of having a total population of at least 10,000. However,
Seemingly Unrelated Regression analysis requires that the same sample of census places is used to predict violence for all 3 race/ethnic groups. Thus, the final sample of census places required at least 1,000 of each group in order to
use SUR analysis, leaving a sample of 234 census places. 4 The California arrest data were obtained from the California Bureau of Criminal Information and Analysis (1999-
2001). The New York State Arrest Data were obtained from the New York State Division of Criminal Justice
Services (1999-2001). 5 Agency-level arrest counts were linked to UCR Crosswalk Data (U.S. Department of Justice 2000) to further
aggregate arrest data to the census place-level. This final aggregation was necessary because independent variables drawn from U.S. Census data were available at the census place-level but not for each arresting agency. Arrest
counts for each racial/ethnic group include only offenders ages 10-64. Violent Index offenses include arrests for
homicide, rape, robbery, and aggravated assault. Following the procedures used in prior demographic research
(Logan et al. 2004), population counts for the “black alone or including any other race” are used as a proxy for the
black population. Alternative measures of the black population produced similar population estimates.
33
Research has often noted potential problems with using arrest data to measure race- and
ethnicity-specific violence. To address these criticisms, the current analysis focuses on index-
violent arrests (i.e., homicide and Violent Index) – which are considered “serious” offenses and
are more reliably reported across demographic groups (Hindelang 1978; 1981; LaFree et al.
1992; Sampson 1987; Steffensmeier et al. 2005; Steffensmeier and Feldmeyer 2006). To add
stability to measures of violent offending and to ensure the data include adequate arrest counts
for statistically rare offenses (e.g. homicide), year 2000 arrest rates were calculated using 3-year
averaged arrest figures for the 1999-2001 period. Both dependent variables had positively
skewed distributions and required square-root transformations to impose normal distributions for
each measure of violence.6
INDEPENDENT VARIABLES
The independent variables were drawn from prior communities and crime research and
include black, white, and Hispanic measures of structural characteristics at the census place-
level. These structural measures were drawn from 2000 U.S. Census data (Summary Tape File
4) and include the following place-level variables: poverty rates, unemployment rates, education
levels, family structure, the size of the young-male population, residential mobility, immigration,
racial/ethnic heterogeneity, population size, and population density. Excluding population size,
density, and heterogeneity, all of the independent variables are disaggregated by race/ethnicity.
Table 2.1 provides the reader with more detailed descriptions of the independent variables and
their operationalizations.
Poverty is measured as the percentage of residents in a census place with income levels
below the poverty line. Unemployment reflects the percentage of males in each census place
6 Log transformations are frequently used to transform positively skewed measures of violence in aggregate-level
studies of crime. However, preliminary analyses revealed that square root transformations produced more normal
distributions in the dependent measures than logarithmic transformations (for similar procedures, see Phillips 2002).
34
who were at least 16 years old and were either unemployed or not in the labor force in the year
2000. Education is measured using the percentage of the population age 25 and over that has at
least a high school degree (or equivalent). Additionally, these three measures were combined
using principal components analysis to create disadvantage indices for each race/ethnic group.
For each race/ethnic group, the measures of poverty, unemployment, and education loaded
strongly on one dimension, indicating that they were related to a single construct that is referred
to as the structural disadvantage index. As discussed in the next section, the disadvantage
indices are used in place of the three individual measures of structural disadvantage to examine
whether general disadvantage measures and particular disadvantage measures have different
effects on violence across race/ethnicity.
In addition to these disadvantage measures, the analysis includes several other structural
predictors of black, white, and Hispanic violence. Family structure, which is also commonly
considered a measure of community disadvantage, is measured using the percentage of families
that had female heads and children less than 18 years of age. 7 The relative size of the young-
male population is measured using the percentage of males age 15-24 for each race/ethnic group.
Residential mobility reflects the percentage of households that did not have the same residents
throughout the 5-year period from 1995 to 2000. Immigration is measured using the percentage
of each race/ethnic group that is foreign-born. A 3-group (black, white, and Hispanic) entropy
index was calculated to measure racial/ethnic heterogeneity. The entropy index (E) is a multi-
group measure of the diversity of a geographic area calculated as:
7 Poverty, unemployment, and education had factor loadings greater than .70 for each race/ethnic group. Family
structure was excluded from the structural disadvantage index because principal components analysis results
indicated that it did not load strongly (less than .50) onto the same factor as measures of poverty, unemployment,
and education for all race/ethnic groups. Therefore, family structure is used as a separate predictor in the
multivariate models.
35
M
E = Σ πm ln(1 / πm) m=1
where, πm is the proportion of people in race/ethnicity m (e.g., proportion black) and M is the
total number of racial/ethnic groups (Reardon and Firebaugh 2002). The minimum value of E
approaches 0 when a census place has no diversity and is composed entirely of one racial/ethnic
group. The maximum value of E is approximately 1.099, which occurs when blacks, whites, and
Hispanics are equally represented in a census place. Population size is measured using the
logged total population for the census place. Additionally, population density reflects the
number of persons per square mile of land.8
Multicollinearity among structural predictors is a common concern among macro-level
studies using multiple measures of structural disadvantage. Thus, several steps were taken to
identify and manage potential multicollinearity problems among the independent variables.
First, variables were carefully selected with close attention being given to correlations among the
measures. With one exception (i.e., the relationship between unemployment and education for
whites), none of the independent variables included in the analysis are correlated above r = .65
(see Tables 2.3 through 2.5). Second, in addition to the full models, each of the structural
disadvantage measures (poverty, unemployment, education, and family structure) were entered
into separate regression models with the set of control variables (e.g. population size, density).
The substantive findings for racial invariance from these separate models were similar to those
8 In several supplemental models, dummy variables are included to control for the state in which census places were located (New York or California) (results not shown). Violent index arrest rates for all three race/ethnic groups
were shown to be lower in New York than in California census places. Homicide rates in New York census places
were similar for whites, lower for Hispanics, and higher for blacks than California rates. Inclusion of the state
dummy variable had little impact on the substantive results presented below or conclusions about the racial
invariance hypothesis.
36
shown in the full models.9 Third, regression diagnostics revealed that variance inflation factor
(VIF) scores were at acceptable limits (below 4.0) for all of the variables included in the final
models.
ANALYTIC PROCEDURES
This analysis uses seemingly unrelated regression (SUR) models to compare the
structural sources of violence for whites, blacks, and Hispanics for the 1999 to 2001 period.
SUR models are well-suited for this analysis because, unlike OLS models, they can account for
the fact that the white, black, and Hispanic samples used in this analysis are not drawn from
independent samples and actually include the same set of census places (Ousey, 1999; Peterson
and Krivo, 1999; Phillips, 2002; Steffensmeier and Haynie, 2000). Because the black, white, and
Hispanic models rely on the same sample of census places, the coefficients for each model are
likely to be correlated, and OLS regression is likely to produce inefficient estimates of the predictors
of violence for each race/ethnic group. As a result, statistical tests comparing the predictors of violence
across race/ethnicity are likely to be biased using OLS regression (King 1989; Schwartz 2006; Zellner
1963).
SUR techniques address these problems by simultaneously estimating models for each
race/ethnic group and accounting for the similar samples and correlated errors across the white,
black, and Hispanic models. SUR regression calculates a covariance of errors across the
race/ethnicity-specific models and then uses generalized least squares to weight estimates
appropriately for each race/ethnic group based on the correlated error terms (King, 1989;
Schwartz 2006). This procedure results in more efficient estimates for each race/ethnic group
9 The significance levels of several predictors (poverty and family structure) were somewhat reduced in the full
models compared to the individual models, especially for whites. However, the differences in effects across
race/ethnic groups remained substantial in both the separate and full models. Thus, interpretations for racial
invariance were similar for both the reduced and full models.
37
and reduces potential bias in statistical tests (Z-tests, F-tests) used to compare the predictors of
violence across groups.
Z-tests described by Clogg et al. (1995) and Paternoster et al. (1998) are used to compare
the predictors of violence across race/ethnicity and test for statistically significant variation in the
predictors of black, white, and Hispanic violence.10
RESULTS
DESCRIPTIVE STATISTICS
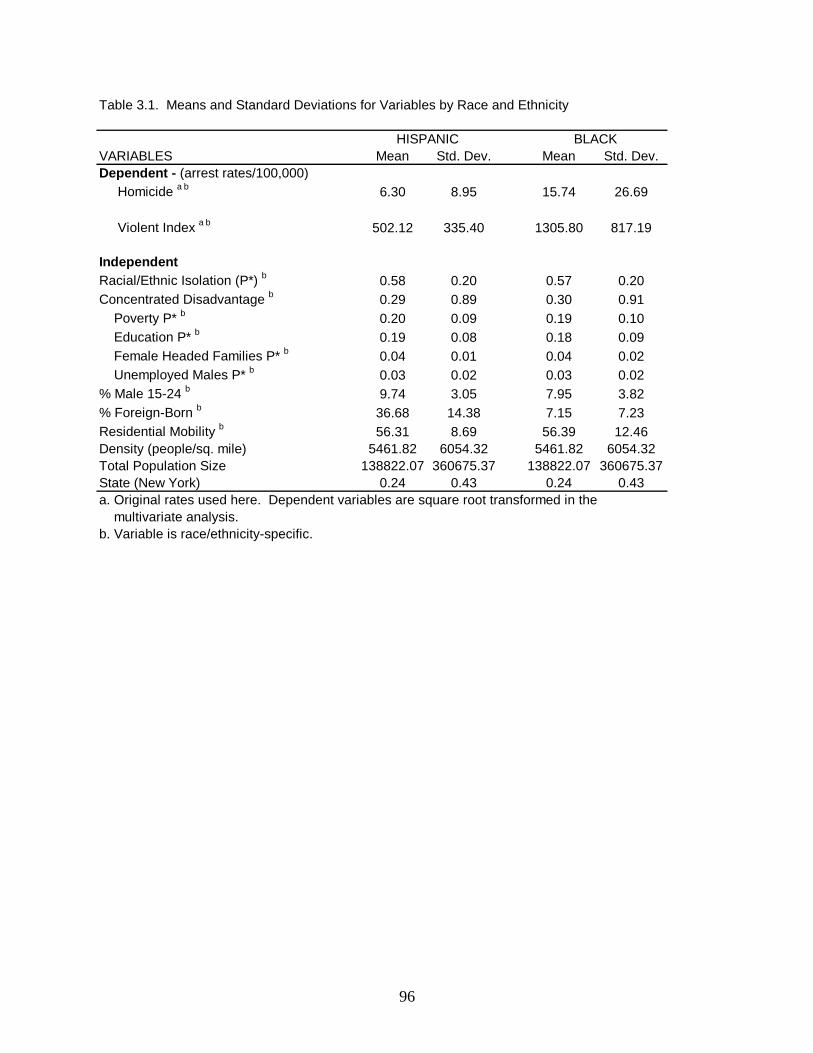
Table 2.2 provides the means and standard deviations for the independent and dependent
variables and reveals several noteworthy patterns in violence and structural characteristics
among white, black, and Hispanic populations. Table 2.2 shows that for both homicide and
Violent Index offenses, year 2000 arrest rates are the highest for blacks and lowest for whites.
Hispanic rates consistently fall between black and white arrest rates but are somewhat closer to
white rates of violence. For example, the average homicide rates/100,000 are 15.5 for blacks,
6.3 for Hispanics, and 2.9 for whites. Similarly, mean Violent Index arrest rates/100,000 are
1282.5 for blacks, 502.7 for Hispanics, and 321.6 for whites. Table 2.2 also shows that there is
substantial variation in violence rates across census places for all three groups. For example, the
standard deviations indicate that for 95 percent of the census places, homicide rates range from
approximately zero to approximately 14/100,000 for whites, 24/100,000 for Hispanics, and
slightly more than 56/100,000 for blacks. Thus, as seen in prior research, violence rates vary
widely across race/ethnicity and place. Additionally, Hispanics and especially blacks appear to
be overrepresented among arrests for serious violent offenses compared to whites.
10
The formula for the Z-test used to compare coefficients across black, white, and Hispanic models is as follows:
Z = (b1 – b2) / (√ SEb12 + SEb2
2 ), where b1 = the coefficient of a predictor for group 1, and b2 = the coefficient of
the same predictor for group 2.
38
Table 2.2 also reveals that structural disadvantage is more severe among blacks and
Hispanics than among whites. Black and Hispanic poverty levels are similar, with about 19
percent of the black and Hispanic populations living below the poverty line. In contrast, the
white poverty rate (8.7 percent) is less than half of black and Hispanic poverty levels. Poverty
rates vary across census places, especially for Hispanics and blacks. The standard deviations
indicate that the percentage of people in poverty ranges from near zero for all three groups to as
much as 19 percent for whites and close to 40 percent for blacks and Hispanics across 95 percent
of census places. Thus, while poverty rates are higher for minorities, the wide variation in
poverty across census places provides substantial overlap in the structural conditions of whites,
blacks, and Hispanics.
Whites also enjoy higher education levels than blacks and Hispanics. On average, more
than 86 percent of whites have at least a high school education, while 81 percent of blacks and
only 58 percent of Hispanics have high school degrees. The standard deviations indicate that
education levels vary across census places for all three groups. Specifically, the percentage of
whites with high school degrees ranges from approximately 73 percent to close to 100 percent
for 95 percent of the sample. There is even greater variation in Hispanic and black education,
with the percentage of residents with high school degrees ranging from approximately 30 to 86
percent for Hispanics and 55 to nearly 100 percent for blacks.
Unemployment shows a slightly different pattern, with Hispanics having the lowest
percentage of unemployed males (21.7 percent), followed by whites (25.0 percent) and then
blacks (29.2 percent). The standard deviations indicate that the percentage of unemployed males
ranges from about 12 to 38 percent for whites, 8 to 36 percent for Hispanics, and 7 to 51 percent
for blacks across 95 percent of census places in the sample. The percentage of female-headed
39
families with children was lowest among whites (8.3 percent) followed by Hispanics (15.1
percent) and blacks (24.6 percent). Similar to the other measures of disadvantage, family
structure varies widely across places for blacks (std. dev. = 11.0), Hispanics (std. dev = 8.2), and
much less so for whites (std. dev. = 3.6).
Several of the remaining structural variables also reveal interesting patterns across
race/ethnicity. Table 2.2 shows that the size of the young male population (ages 15-24) varies
slightly across race/ethnic groups, with Hispanics having the largest percentage of young males
(9.7 percent), followed by blacks (8.1 percent) and then whites (5.9 percent). The relative sizes
of the young, male populations vary only slightly across census places based on the standard
deviations for whites (2.8), Hispanics (3.0), and blacks (3.9). As one might expect, immigration
rates - measured as the percentage of foreign-born residents – are more than five times higher
among Hispanics (36.5 percent) than among blacks and whites (7.1 and 7.3 percent respectively).
Additionally, Hispanic immigration rates vary more than white and black rates across census
places. The standard deviations indicate that the percentage of foreign-born residents is as low
as 0 for all three groups but is as high as 65 percent for Hispanic, 18 percent for whites, and 21
percent for blacks across 95 percent of census places. Lastly, residential mobility is the lowest
among whites (44.1 percent), while slightly more than half of black and Hispanic households
experienced turnover from 1995 to 2000.
RACIAL INVARIANCE IN THE STRUCTURAL SOURCES OF VIOLENCE
Bivariate Results
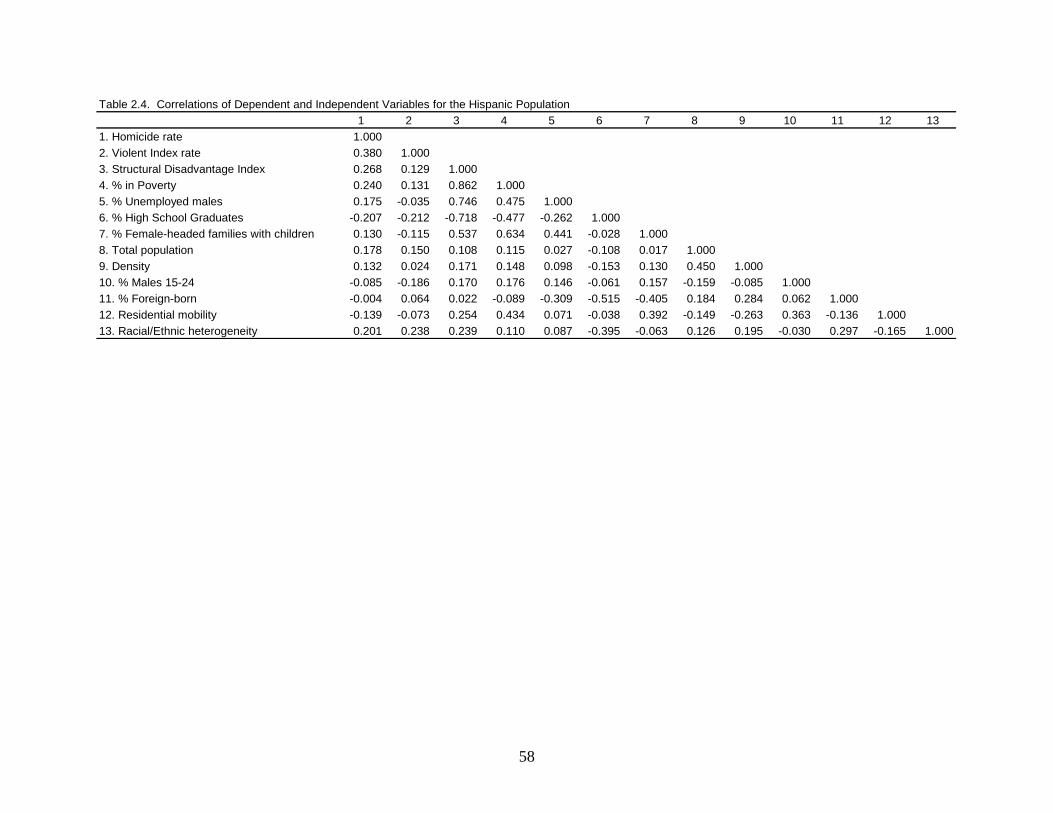
Tables 2.3, 2.4, and 2.5 display the bivariate correlation matrices for whites, blacks, and
Hispanics, which are used to examine and compare the relationships between structural
predictors (e.g., structural disadvantage, poverty, unemployment) and violence across
40
race/ethnicity. First examining the particular/specific predictors, the bivariate findings show that
poverty is positively correlated with homicide and Violent Index rates for all three race/ethnic
groups. This indicates that places with relatively more residents in poverty tend to have higher
homicide and Violent Index rates. Additionally, Tables 2.3, 2.4, and 2.5 show that the
percentage of residents in poverty has some of the strongest correlations with violence of all the
structural predictors.
The bivariate results indicate that male unemployment is positively related to white
violence, but is not linked strongly to Hispanic or black violence. Table 2.3 shows that the
percentage of unemployed males is strongly and positively correlated with white homicide (r =
.25) and Violent Index rates (r = .413), which indicates that white violence is higher in places
with higher white, male unemployment rates. Tables 2.4 and 2.5 show that male unemployment
is positively related to Hispanic and black homicide (r = .17 and r = .21, respectively) but has
almost no relationship with Violent Index rates for Hispanics (r = -.04) or blacks (r = .04).
Turning next to the education-violence relationship, the percentage of high school
graduates is negatively correlated with white and Hispanic rates of homicide and Violent Index
offenses, which suggests that white and Hispanic violence rates are lower in census places with
larger percentages of white and Hispanic high school graduates (Tables 2.3 and 2.4). Table 2.5
shows that the percentage of high school graduates is also negatively related to black homicide (r
= -.21) but has a positive relationship with black Violent Index rates (r = .15). This suggests that
black homicide is lower but that black Violent Index rates are higher in place with higher black
education levels.
The bivariate relationships between family structure and violence vary widely across
race/ethnicity. Table 2.5 shows that the percentage of female-headed families with children is
41
strongly and positively related to black homicide (r = .32) and Violent Index rates (r = .36),
indicating that black violence is higher in census places with relatively more black female-
headed families. Additionally, the family structure-violence correlations are among the strongest
bivariate relationships with violence observed for blacks. In contrast, the percentage of female-
headed families with children has much weaker relationships with homicide for whites (r = .08)
and Hispanics (r = .13) and actually has a negative relationship with Hispanic Violent Index rates
(r = -.12). Thus, the bivariate results provide little support for narrowly-defined racial invariance
arguments and show that the relationships between particular structural measures and violence
and the magnitudes of these relationships vary widely across whites, blacks, and Hispanics.
Turning next to the structural disadvantage index, the bivariate results indicate that the
structural disadvantage index is positively correlated with homicide and Violent Index rates for
whites, Hispanics, and blacks. This indicates that violence rates are higher for all three groups in
places with more structural disadvantage. However, it is worth noting that the magnitudes of
these bivariate relationships vary across race/ethnicity.
In sum, the bivariate results provide some support for broadly-defined interpretations of
the racial invariance hypothesis and indicate that structural disadvantage contributes to violence
for whites, Hispanics, and blacks. However, the results provide little support for narrowly-
defined interpretations of racial invariance. Specifically, the correlations in Tables 2.3 through
2.5 suggest that specific/particular structural predictors have varying effects (in direction and
magnitude) on violence across race/ethnicity. Thus, the bivariate results indicate that evidence
for the racial invariance hypothesis may depend on how invariance is defined. However, it is
unclear whether these bivariate findings and effects persist net of other structural controls. To
provide more rigorous tests of these tentative conclusions, we turn next to multivariate models.
42
Multivariate Results
Tables 2.6 through 2.9 show the results of the seemingly unrelated regression models
predicting white, black, and Hispanic rates of homicide and the Violent Index. In each table,
separate models are estimated for each race/ethnic group in order to test the racial invariance
hypothesis and compare the structural predictors of violence across race/ethnicity. Additionally,
each table provides Z-test results comparing the magnitude and direction of the effects of
structural predictors of violence across race/ethnic groups (black-white, Hispanic-white,
Hispanic-black comparisons). Results are first presented for homicide models and then
replicated and discussed for Violent Index models.
In order to examine racial invariance using both a narrowly-defined approach and a
broadly-defined approach, two sets of multivariate tables and results are provided for each
offense examined. First, to address the narrowly-defined approach, Table 2.6 reports homicide
models for each race/ethnic group that test whether particular measures of disadvantage and
social structure (e.g., poverty, unemployment, education) have similar/different effects on
violence across race/ethnic groups. Then, Table 2.7 presents a second set of homicide models
that replicates the earlier models from Table 2.6 but replaces the particular measures of
disadvantage with the structural disadvantage indices for each race/ethnic group. This second set
of models more closely addresses the broadly-defined approach for examining racial invariance
and tests whether structural disadvantage generally contributes to violence for all three
race/ethnic groups. These steps are then replicated for the Violent Index models, which are
shown in Tables 2.8 and 2.9.
43
Homicide
Table 2.6 shows the results of models estimating black, white, and Hispanic homicide
rates using a narrowly-defined approach. The results reveal several noteworthy structural effects
on violence for each race/ethnic group, but also show several important race/ethnic differences in
the predictors of violence.
Table 2.6 shows that poverty has a significant and positive effect on black and Hispanic
homicides, indicating that places with greater black and Hispanic poverty have higher black and
Hispanic homicide rates. In contrast, poverty has no significant effect on white homicide.
Additionally, the Z-test results indicate that the black poverty effect on violence is significantly
stronger than the null effect for whites (Z = 2.78, p<.01). Poverty rates also contribute more
strongly to Hispanic homicide than to white homicide, but the difference in these effects is only
marginally significant (Z = 1.80, p<.10). Thus, the results suggest that the effects of poverty on
homicide vary across race/ethnic groups, with poverty contributing most strongly to black
homicides, followed by Hispanics, and having no noticeable effect on white homicide.
The results also show that unemployment contributes significantly to white homicide but
not to Hispanic or black homicide rates. Thus, high rates of unemployment appear to increase
white homicide but not black or Hispanic homicide. Additionally, the difference between the
white and black effects is significant (Z = 2.38, p<.05), indicating that unemployment has a
significantly stronger effect on white homicide than on black homicide. Although the effect of
unemployment is non-significant for Hispanics, the difference between the white and Hispanic
effects is only marginally significant (Z = 1.65, p<.10).
Education has negative effects on homicide for all three race/ethnic groups, indicating
that places with greater high school graduation rates are less likely to experience homicide across
44
race/ethnicity. However, there are significant differences in the magnitude of the education
effects across race/ethnic groups. Table 2.6 shows that education has a significantly stronger
effect on blacks than it has on Hispanics (Z = 1.97, p<.05). Thus, the results suggest that greater
education reduces homicide more for blacks than for Hispanics.
Turning to the final disadvantage measure, the results indicate that family structure does
not influence homicide rates for whites, blacks, or Hispanics. Table 2.6 shows that the
percentage of female-headed families with children has no significant effects on homicide for
any of the three race/ethnic groups examined. Additionally, the effects for each race/ethnic
group are not significantly different. Thus, family structure appears to have little impact on
homicides, net of other disadvantage measures.
Table 2.6 reveals that several of the remaining structural control variables also have
noteworthy effects on homicide across race/ethnic groups. Population size has positive effects
on homicide rates for whites, blacks, and Hispanics, indicating that census places with more
people have higher black, white, and Hispanic homicide rates compared to less populous census
places. Additionally, the Z-tests reveal that population size contributes to black homicide
significantly more strongly than it contributes to white (and possibly Hispanic) homicide rates.
The results indicate that residential mobility reduces Hispanic but not white or black homicide
rates. Additionally, this effect is significantly stronger for Hispanics than for either blacks or
whites. Last, racial/ethnic heterogeneity has similar positive effects on homicide for all three
groups, indicating that racial and ethnic diversity contributes to greater homicide rates for whites,
blacks, and Hispanics.11
11 In supplemental analyses, an alternative entropy index that includes whites, blacks, Hispanics, and “other
race/ethnicities” was used to estimate the effects of racial/ethnic heterogeneity on each form of violence for whites,
blacks, and Hispanics (results not shown). The supplemental results were similar to the homicide and Violent Index
results presented here with only 1 exception: the effect of racial/ethnic heterogeneity on homicide was still positive
45
Overall, these findings provide little support for the racial invariance hypothesis based on
a narrowly-defined interpretation of invariance. Table 2.6 shows that there are several notable
differences in the structural predictors of violence among whites, blacks, and Hispanics.
Disadvantage measures – such as poverty, unemployment, and education – as well as other
structural factors have different effects on violence across race/ethnicity. Additionally, the
results show that the magnitudes of these structural effects on homicide vary across the 3
race/ethnic groups examined. Thus, contrary to racial invariance arguments, the results suggest
that specific structural factors have differing directions and magnitudes of effects on homicide
across race/ethnicity.
Turning next to broadly-defined interpretations of racial invariance, Table 2.7 again
predicts white, black, and Hispanic homicide rates but replaces the specific disadvantage
measures from Table 2.6 with more general structural disadvantage indices for each race/ethnic
group. Outside of the structural disadvantage and family structure effects, the other structural
predictors have similar effects on homicide as the models described above. Therefore, the
following discussion focuses on the effects of the disadvantage indices and family structure on
homicide.
As expected, the structural disadvantage indices have significant, positive effects on
homicide for all three groups, which indicates that disadvantage contributes to black, white, and
Hispanic homicide. These results provide at least some support for the broadest interpretations
of racial invariance arguments and indicate that structural disadvantage plays a central role in the
violence-generating process for whites, blacks, and Hispanics.
but just missed significance for blacks in the first series of models (the equivalent of Table 2.3). However, as seen
above, the effects of racial/ethnic heterogeneity on homicide (or Violent Index rates) did not differ significantly
across race/ethnic groups.
46
On the other hand, if one considers the magnitudes of these effects, there are substantial
racial/ethnic differences in the effects of the disadvantage indices on homicide. Table 2.7 shows
that while disadvantage contributes to homicide for all three race/ethnic groups, the disadvantage
index has significantly stronger effects on black than on white or possibly Hispanic homicide (Z
= 2.43, p<.05 and Z = 1.67, p<.10, respectively). Thus, disadvantage appears to have the greatest
impact on black homicide and contributes to homicide more strongly for blacks than for other
race/ethnic groups.
In contrast to the models from Table 2.6, the results in Table 2.7 show that family
structure influences black homicide but not white or Hispanic homicide. The percentage of
black, female-headed families with children significantly contributes to black homicide,
indicating that census places with relatively more black, female-headed families with children
are more likely to have high black homicide rates. Additionally, the effect of family structure is
significantly stronger for blacks than for either whites or Hispanics, which suggests that family
structure influences black homicide more strongly than it influences either white or Hispanic
homicide.
In sum, the results from Tables 2.6 and 2.7 provide weak support for the racial invariance
hypothesis. Support for the racial invariance hypothesis is found only if one uses the broadest
possible interpretation of racial invariance – i.e., that general measures of structural disadvantage
contribute to violence for all three race/ethnic groups. However, outside of this broad
generalization, there is little support for racial invariance arguments. The racial invariance
hypothesis receives little to no support when one uses narrowly-defined interpretations of
invariance. Specifically, the results show that (1) the particular structural predictors of homicide
(e.g., poverty, unemployment, education, family structure, etc.) vary across race/ethnicity, and
47
(2) the magnitudes of structural effects on homicide vary widely across race/ethnic groups, even
for general disadvantage indices.
Violent Index
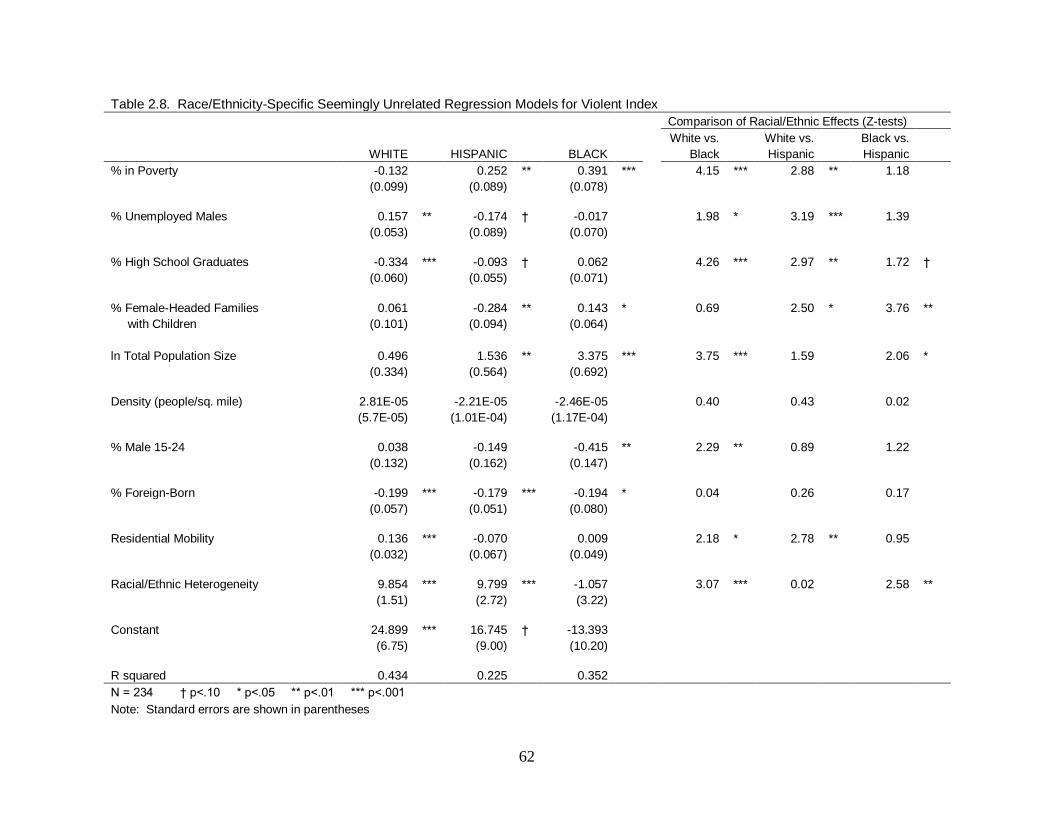
Turning next to the Violent Index models (sum of arrests for homicide, robbery, rape, and
aggravated assault), Table 2.8 shows the results of models predicting black, white, and Hispanic
Violent Index rates using a narrowly-defined approach. Although these results differ from the
homicide results in several ways described below, there is also considerable similarity between
the Violent Index and homicide results.
As seen in the homicide models, Table 2.8 shows that poverty has significant, positive
effects on Violent Index rates for blacks and Hispanics but not for whites. This indicates that
places with higher black and Hispanic poverty rates have higher black and Hispanic Violent
Index rates. Additionally, the Z-tests show that the poverty effects are stronger for blacks and
Hispanics than for whites (Z = 4.15, p<.001 and Z = 2.88, p<.01, respectively). Thus, as
observed in the homicide models, the effects of poverty on Violent Index rates vary across
race/ethnic groups, with poverty having the strongest effects on black and Hispanic violence.
The results show that unemployment contributes significantly to white Violent Index
rates but not to Hispanic or black rates. Additionally, the Z-test results indicate that the effect of
unemployment is significantly stronger for whites than for blacks or Hispanics (Z = 1.98, p<.05
and Z = 3.19, p<.001, respectively). This finding closely parallels the results observed in the
homicide models and indicates that unemployment is a key source of white violence but has little
effect on black or Hispanic violence.
In contrast to the homicide models, education has a negative effect on Violent Index rates
for whites but not for blacks or Hispanics. Thus, census places with greater white high school
48
graduation rates are less likely to experience white violence. Additionally, the education effects
for whites are significantly stronger than the effects for blacks (Z = 4.26, p<.001) and Hispanics
(Z = 2.97, p<.01), which suggests that education has a stronger impact on white violence than on
either black or Hispanic violence.
Family structure is also significantly related to Violent Index rates for blacks and
Hispanics. Table 2.8 shows that the percentage of black female-headed families with children
has a positive effect on black Violent Index rates, indicating that census places with relatively
more black female-headed families have greater black rates of violence. In contrast, the effect of
family structure on Hispanic violence is negative, indicating that an increase in the share of
Hispanic female-headed families with children leads to a drop in Hispanic violence.
Additionally, the Z-test results indicate that the percentage of female-headed families contributes
to violence more strongly for blacks and whites than for Hispanics.
In addition to the structural disadvantage effects described above, several other structural
predictors have varying effects on violence across race/ethnic groups. For example, Table 2.8
reveals that population size contributes to black and to Hispanic Violent Index rates but not to
white rates, and has the strongest effects on black rates. The relative size of the young, male
population has a negative effect on black but not white or Hispanic violence rates. Residential
mobility contributes to white but not black or Hispanic Violent Index rates. Last, racial/ethnic
heterogeneity appears to contribute to greater white and Hispanic violence but does not influence
black violence.
Similar to the homicide models, the results of the Violent Index models described above
provide little support for narrowly-defined interpretations of the racial invariance hypothesis.
Table 2.8 reveals several notable differences in the particular/specific structural predictors of
49
violence among whites, blacks, and Hispanics. Additionally, the magnitudes of these structural
effects on violence vary across race/ethnic groups.
To examine racial invariance using a broadly-defined interpretation, Table 2.9 replicates
the models from Table 2.8 but replaces the specific disadvantage measures with more general
disadvantage indices for each race/ethnic group. Outside of the structural disadvantage effects,
the effects of the structural predictors (e.g., population size, percent foreign born, racial/ethnic
heterogeneity) in Table 2.9 generally mirror those found in Table 2.8 and described above.
Therefore, the following discussion focuses on the effects of the disadvantage indices on Violent
Index rates.
Table 2.9 shows that the structural disadvantage indices are significantly and positively
related to Violent Index rates for all three race/ethnic groups. Thus, structural disadvantage
appears to be an underlying source of Violent Index rates for blacks, whites, and Hispanics.
However, in contrast to the homicide models, the Z-tests indicate that the magnitudes of the
disadvantage index effects on Violent Index rates are not significantly different across
race/ethnicity. The effect of the structural disadvantage index is the largest for whites (b =
2.894, p<.001) and is similar for both Hispanics (b = 1.889, p<.01) and blacks (b = 1.882,
p<.01). However, the Z-test statistics comparing these effects are not significant, indicating that
the effects of disadvantage indices on Violent Index rates do not significantly vary for blacks,
whites, and Hispanics. These findings support broadly-defined racial invariance arguments and
indicate that structural disadvantage contributes to violence for all race/ethnic groups and that the
violence-generating effects of disadvantage are similar for whites, blacks, and Hispanics.
In sum, the Violent Index results (Table 2.8 and 2.9) are generally similar to the homicide
results (Tables 2.6 and 2.7) and provide similar conclusions for the racial invariance hypothesis.
50
As shown in the homicide models, the Violent Index results provide little support for narrowly-
defined interpretations of racial invariance. There are several racial/ethnic differences in the
effects and effect sizes of particular structural predictors on Violent Index rates. Additionally,
both the homicide and Violent Index models support the broadest interpretations of racial
invariance and show that general structural disadvantage measures contribute to violence for
whites, blacks, and Hispanics. However, the Violent Index results provide greater support for
broadly-defined interpretations of racial invariance than the homicide models because they show
that the magnitudes of disadvantage index effects on violence are similar across race/ethnicity.
DISCUSSION AND CONCLUSION
The primary goal of this chapter has been to test the racial invariance hypothesis by
comparing the structural predictors of violence across three race/ethnic groups: whites, blacks,
and Hispanics. Focusing particularly on the effects of structural disadvantage, this analysis
provides several important findings regarding the racial invariance hypothesis.
First, the results provide mixed support for the racial invariance hypothesis, depending on
how it is defined. The results illustrate that racial invariance arguments may be interpreted
several ways and that support for invariance arguments depends on one’s definition or
interpretation of “racial invariance.” Specifically, there is greater support for racial invariance
arguments as one uses broader and more general interpretations of “invariance.”
Using a broadly-defined interpretation of invariance – which focuses on the underlying
influence of structural disadvantage on violence – there appears to be some support for the racial
invariance hypothesis. Taken as a whole, structural disadvantage measures generally contributed
to homicide and Violent Index rates as expected for whites, blacks, and Hispanics. Poverty and
unemployment contributed to violence, while higher education levels helped reduce violence
51
among the groups examined (Tables 2.6 and 2.8). Composite disadvantage measures increased
homicide and Violent Index rates for all race/ethnic groups (Tables 2.7 and 2.9). Additionally,
the disadvantage indices had similar magnitudes of effects on Violent Index rates (but not
homicide rates) for all three race/ethnic groups (Table 2.9). Thus, the results provide some
support for racial invariance, but only if one uses the broadest interpretation of “invariance” and
focuses solely on whether structural disadvantage contributes to violence for blacks, whites, and
Hispanics.
In contrast, there is little or no support for the racial invariance hypothesis if one
examines the results using a narrowly-defined interpretation of racial invariance. The findings
indicate that the particular structural predictors of violence vary across race/ethnic groups. For
example, poverty contributes to black and Hispanic homicide and Violent Index rates but has no
significant effect on white violence. A greater presence of female-headed families contributes to
black violence but not to white or Hispanic violence. Unemployment rates appear to increase
white violent crime but have no effect on black or Hispanic violence. Also, residential mobility
appears to decrease Hispanic homicide rates but increases white Violent Index rates.
Furthermore, the results reveal significant differences in the magnitude of structural
effects on violence across race/ethnic groups. For example, poverty appears to have stronger
effects on black violence than on white or Hispanic violence. Additionally, even though they
had positive effects on violent crime for all race/ethnic groups, the general disadvantage indices
had much stronger effects on homicide for blacks than for other race/ethnic groups. Thus, when
one uses a narrowly-defined interpretation of racial invariance and focuses on the effects of
particular predictors on violence as well as the magnitude of these effects, the results provide
little support for the racial invariance hypothesis.
52
Second, comparison of the structural predictors of violence for blacks and Hispanics
provides mixed support for social capital and ethnic economies arguments claiming that the
sources of Hispanic violence are unique and that Hispanic populations may be protected or
“buffered” from the violence-generating effects of disadvantage. Some scholars suggest that
structural disadvantage may not have the same severe, crime-producing effects on Hispanic
violence that it has on black violence. In particular, researchers have argued that strong social
capital/support networks, kinship bonds, and active ethnic economies may provide a buffer that
protects Hispanic communities from violence and the effects of disadvantage (Martinez and
Nielsen 2006; Nielsen et al. 2005; Velez 2006).
The results support these social capital and ethnic economies arguments in as much as the
structural disadvantage measures contribute more strongly to black homicide than to Hispanic
homicide rates. Education had a significantly stronger impact on black homicide than on
Hispanic homicide (Table 2.6). Female-headed families contributed to black homicide and
Violent Index rates but not to Hispanic violence. Additionally, if relaxed significance levels are
used (p<.10), the disadvantage index had a stronger effect on black homicide than on Hispanic
homicide (Table 2.7). Based on these findings, there is some indication that structural
disadvantage has a weaker impact on Hispanic violence than on black violence. However, aside
from the effects of family structure, the Violent Index models show almost no differences in the
effects of disadvantage on black and Hispanic violence. Thus, it is difficult to determine from
these results whether structural disadvantage plays a smaller roll in the violence-generating
process for Hispanics than for blacks and whether Hispanic communities are more
protected/insulated than black communities from the crime-producing effects of disadvantage.
However, the fact that Hispanic violence rates are substantially lower than black rates, even
53
though both groups face high levels of disadvantage, suggests that Hispanic populations are
protected or buffered from violence more than blacks.
In sum, this chapter illustrates that support for the racial invariance hypothesis greatly
depends on the way we define “invariance” and partly on the measure of “violence.” While
there is almost no support for narrowly-defined interpretations of racial invariance, broader
interpretations of the racial invariance hypothesis receive some support. In other words, the
structural predictors of violence and the magnitudes of structural effects on violence vary
substantially across race/ethnic groups, but structural disadvantage appears to be a key
component of the violence-generating process for whites, blacks, and Hispanics.
Additionally, this study highlights several areas for future research. Research on
race/ethnicity and violence must continue to expand its focus beyond comparisons of white and
black violence. As shown here, racial invariance literature and research on race/ethnicity and
violence may greatly benefit by incorporating Hispanics and other race/ethnic groups. There is
also a need for future research that examines whether the violence-generating process is invariant
across “Hispanic” subgroups (e.g., Mexican, Cuban, Puerto Rican). Racial invariance literature
may also benefit from examining non-violent forms of crime. Almost no research has examined
whether the processes generating property and/or drug offending are invariant across race/ethnic
groups.
Future racial invariance research should also make greater efforts to incorporate cultural
explanations. Racial invariance literature to date has focused almost exclusively on the
structural sources of violence and has overlooked whether cultural influences on violence vary
across race/ethnic groups. Thus, to better understand whether the violence-generating process is
invariant across race/ethnicity, research should examine whether both cultural and structural
54
influences on violence are similar/different across racial/ethnic groups (see Ulmer and
Steffensmeier 2005). Last, research has often examined whether structural factors have
similar/different effects on violence across race/ethnicity, but these racial invariance studies do
not actually predict racial/ethnic gaps in violence (for exceptions see, Velez et al. 2003; Phillips
2002). Future research should examine the racial/ethnic gaps in violence and attempt to identify
the structural sources of racial and ethnic violence disparities. As shown here, Hispanic
communities face similar levels of disadvantage as black populations but typically have lower
rates of violence. Thus, key questions remain concerning the substantial gaps in violence
between black and Hispanic populations.
55
VARIABLES MEASUREMENT
Independent
Structural Disadvantage Index* Factor Score that includes poverty, unemployment, and education
Poverty * Percentage of the population with income below the poverty level
Unemployment * Percentage of males age 16+ who are unemployed/not in labor force
Education* Percentage of the total population age 25+ with at least a High School Degree (or Equivalent)
Family Structure* Percentage of families with female heads and own children under 18
Population Size Logged total population
Population Density Persons per square mile of land
Young, Male Population* Percentage of the population that is male, age 15-24
Immigration* Percentage of the population that is foreign born
Residential Mobility* Percentage of households in 2000 that are not occupied by the same residents as in 1995
Racial/Ethnic Heterogeneity 3-Group Entropy index (E)
Dependent
Homicide* Place-level Homicide Rate/100,000
Violent Index* Place-level Violent Index Rate/100,000
* = Measures are race/ethnicity-specific
Table 2.1. Variable Descriptions
56
Table 2.2. Means and Standard Deviations for Variables by Race and Ethnicity
WHITE HISPANIC BLACK
VARIABLES Mean Std. Dev. Mean Std. Dev. Mean Std. Dev.
Dependent - (arrest rates/100,000)
Homicide 2.9 5.7 6.3 8.9 15.5 26.4
Homicide (sq. root) 1.0 1.2 1.8 1.8 2.6 2.9
Violent Index 321.6 222.9 502.7 334.8 1282.5 817.4
Violent Index (sq. root) 15.7 6.8 21.3 8.6 33.7 12.0
Independent
Structural Disadvantage Index 0.0 1.0 0.0 1.0 0.0 1.0
% in Poverty 8.7 4.9 19.0 9.9 18.8 10.7
% Unemployed Males 25.0 6.7 21.7 6.9 29.2 11.2
% High School Graduates 86.7 6.6 57.5 14.1 80.7 12.6
% Female-Headed Families with Children 8.3 3.6 15.1 8.2 24.6 11.0
% Male 15-24 5.9 2.8 9.7 3.0 8.1 3.9
% Foreign-Born 7.3 5.5 36.5 14.5 7.1 7.1
Residential Mobility 44.1 9.4 56.4 8.7 56.9 12.8
Total Population Size 133286.7 351027.0 133286.7 351027.0 133286.7 351027.0
Density (people/sq. mile) 5281.7 5932.8 5281.7 5932.8 5281.7 5932.8
State (New York) -12.135 -0.621 ** # 0.193 0.007 # -14.855 -0.760 ** # -6.301 -0.232 ** #
(0.973) (2.007) (1.031) (1.997)
Constant 14.325 ** -3.388 26.768 ** 17.086 *
(5.413) (9.156) (5.583) (8.673)
R-squared 0.534 0.244 0.604 0.390
N = 232 † p<.10 * p<.05 ** p<.01
NOTE: # Indicates Hispanic and black coefficients are significantly different (p<.05). Standard errors are shown in parentheses.
MODEL 1 MODEL 2
HISPANIC BLACK HISPANIC BLACK
103
CHAPTER 4:
HISPANIC IMMIGRATION AND VIOLENCE
The previous chapter sought to extend research on race/ethnicity, social structure, and
crime by examining and comparing the effects of racial/ethnic segregation on violence for
Hispanics and blacks. This chapter seeks to further extend theory and research on the social
ecology of crime toward an understanding of Hispanic violence by focusing specifically on the
impact of recent immigration on Hispanic rates of violence. In particular, Chapter 4 examines
both the direct and indirect effects of immigration on violence and draws from social
disorganization theory and the social capital perspective to identify the processes by which
immigration influences violence.
This chapter begins with a brief background discussion of the immigration-violence
linkage and then provides a more detailed review of prior research on immigration and violence.
Because the data and methods were described in greater detail in the previous chapter, I provide
only a brief discussion of data and methods in the present chapter. Next, I discuss the findings of
the analysis, highlighting the direct, indirect, and total effects of immigration on Hispanic
violence. The chapter concludes by describing key contributions of this chapter, caveats, and
directions for future research on immigration and violence.
BACKGROUND
Dating back to the Chicago School, sociology has had a rich tradition of research
examining the social and economic influence of immigration. Scholars describe the patterns of
social change caused by the influx of immigrants into the U.S. at the beginning of the 20th
century and explain how early patterns of immigration influenced the social organization,
economic conditions, culture, and crime in urban communities (Shaw and McKay 1942;
104
Sutherland and Cressey 1966). However, sociological research has yet to fully explore the social
consequences of immigration. In particular, research has often overlooked how recent patterns
of Hispanic immigration may influence social structure, crime, and violent offending.
In recent decades, increasingly large numbers of Hispanic and especially Mexican
immigrants have entered the U.S. For example, between 1990 and 2005, approximately 6.5
million Mexican immigrants entered the country. Additionally, the Hispanic foreign-born
population increased by more than 20 percent between 2000 and 2005 so that there were nearly
17 million foreign-born Hispanics in the U.S. in 2005. Due in part to these immigration patterns,
Hispanics have now become the largest and fastest growing minority group in the U.S. (Healey
2006; U.S. Census Bureau 2005; Pew Hispanic Center 2006a; 2006b). These high levels of
immigration and population growth are likely to have substantial influences on social structure
and possibly on violent offending in Hispanic communities. However, the effects of these recent
patterns of immigration on Hispanic violence have rarely been examined and are highly debated
in sociological and criminological research.
Both public perception and criminological research and theory have linked immigration
with violent crime. Popular stereotypes and public opinions commonly link immigration and
violence, claiming that recent patterns of Hispanic immigration have contributed to higher crime
and violence rates (Horowitz 2001; Pew Hispanic Center 2006b; for critical reviews of these
claims see Hagan and Palloni 1999; Lee et al. 2001; Martinez and Lee 2000; Sampson and Bean
2006). Sociological research also notes that Hispanic immigration may lead to higher rates of
violence because recent immigrants have often been part of a highly crime-prone demographic
group - young males with few family attachments or conventional ties (Martinez and Lee 2000;
Hagan and Palloni 1999). Additionally, the traditional arguments of social disorganization
105
theory (hereafter, social disorganization or traditional social disorganization) suggests that
immigration leads to social change and may contribute to violence by disorganizing and
destabilizing communities (Lee et al. 2001; Martinez 2000; 2002; Martinez and Lee 2000;
Nielsen et al. 2005; Shaw and McKay 1942). Specifically, traditional social disorganization
theory suggests that immigration may contribute to violence indirectly by increasing community
levels of residential mobility, poverty, and heterogeneity.
However, in contrast to these arguments and drawing from social capital perspectives, an
emerging body of research indicates that violence is less common among immigrant populations
and that the immigration process may reduce violence in Hispanic communities (at least
temporarily) (Butcher and Piehl 1998a; 1998b; Hagan and Palloni 1999; Lee et al. 2001;
Martinez 2000; 2002; Martinez and Lee 1998; 2000; Nielsen et al. 2005; Sampson et al. 2005;
Velez 2006). Some scholars present a “counterclaim” to the social disorganization argument,
referred to here as the community resource perspective, which suggests that immigration may not
disorganize and destabilize communities at all, but may instead act as a stabilizing force in many
Hispanic communities (Lee et al. 2001:563; Martinez 2000). According to social capital
perspectives, the community resource perspective suggests that Hispanic immigration may help
to draw resources and jobs into communities and strengthen community cohesion, family
structure, and social capital networks (Lee et al. 2001; Martinez 2002; Martinez and Lee 1998;
2000; Martinez et al. 2004; Martinez and Nielsen 2006; Nielsen et al. 2005; Portes and Stepick
1993; Velez 2006). Thus, immigration may help reduce violence among Hispanic populations
by providing protective resources and by strengthening key social institutions and resource-
sharing networks in Hispanic communities.
106
Research has only recently begun to revisit the immigration-violence relationship. Thus,
it is unclear whether immigration acts as a stabilizing, crime-reducing force or whether it creates
social disorganization and ultimately greater violence among Hispanics. This study contributes
to research on immigration and violence by examining how recent patterns of Hispanic
immigration in California and New York influence Hispanic violence (i.e., homicide and Violent
Index rates). In particular, this project extends immigration-crime research by testing the
competing traditional social disorganization theory and the community resource perspective
(drawn from the social capital perspective) about the effects of immigration on violence. That is,
this analysis examines both the direct and indirect effects of immigration on Hispanic violence to
discern whether immigration (1) contributes to violence by increasing social disorganization in
Hispanic populations (e.g., residential mobility, poverty, and heterogeneity) or (2) decreases
Hispanic violence by stabilizing communities and strengthening social capital/support and social
institutions among Hispanic populations (e.g., family structure, employment, burden of care for
dependents). Although a handful of studies have addressed the Hispanic immigration-crime
relationship, this marks the first attempt to simultaneously test competing arguments about the
immigration-crime relationship and to empirically examine the indirect paths by which
immigration influences Hispanic violence.
CONCEPTUAL FRAMEWORK AND PRIOR RESEARCH
Scholars devoted considerable attention to the immigration-crime relationship following
periods of high European immigration near the beginning of the 20th century (Shaw and McKay
1942; Taft 1933; Thomas and Znaniecki 1927; for review see Bursik 2006). However, there is a
paucity of research addressing how the recent influx of Hispanic immigrants has influenced
violence in the U.S. This gap in the research has not prevented sociologists and the general
107
public from forming ideas and speculating about potential immigration-crime relationships.
However, as described below, these perceptions and proposed theoretical explanations have
rarely been tested and are often contradictory.
COMPETING VIEW OF THE IMMIGRATION-VIOLENCE RELATIONSHIP
Violence-Generating Effects of Immigration
Both public perception and criminological and sociological theories have linked
immigration to increased violence and suggest that Hispanic immigration may lead to higher
rates of Hispanic violence. First, in response to high levels of immigration and the rapid growth
in the Hispanic population, US citizens have become increasingly concerned with the effects of
immigration – including its possible effects on crime and violence. Recent reports describe fears
among US citizens that immigrants are harming the American way of life, taking job
opportunities from citizens, and contributing to violence and crime in the U.S. (Horowitz 2001;
Pew Hispanic Center 2006b; see reviews in Butcher and Piehl 1998a; 1998b; Hagan and Palloni
1999; Lee et al. 2001; Martinez and Lee 2000). Such fears are illustrated in a recent report by
Horowitz (2001:6, 8) from the Center for Immigration Studies, which claims that “immigrant
crime poses a far greater problem than many researchers are willing to admit” and that
“newcomers have brought with them a criminal element who … have turned their communities
into zones of lawlessness.”16
Horowitz (2001:24) draws further links between immigration and crime when he argues
that “Congress must restrict the number of immigrants who may enter this nation legally in a
16 Horowitz is a policy consultant for the Center for Immigration Studies (CIS). He received his Ph.D. in urban
planning and policy development from Rutgers University and formerly served as an assistant professor of urban
and regional planning at the Virginia Polytechnic Institute. CIS states that it is a “non-profit, non-partisan research organization based in Washington, D.C.” whose purpose is to examine the impact of immigration on the United
States. The center’s mission statement states that its purpose is to “expand the base of public knowledge and
understanding of the need for an immigration policy that gives first concern to the broad national interest. The
Center is animated by a pro-immigrant, low-immigration vision which seeks fewer immigrants but a warmer
welcome for those admitted.” (http://www.cis.org/aboutcis.html)
108
given year to make major headway in crime control.” Both the general public and elected
officials have made similar claims and have increasingly drawn attention to high violent crime
rates and incidents involving immigrants in order to link immigration and violence and to pass
legislation restricting immigrant opportunities and rights (see review in Lee et al. 2001). For
example, the Illegal Immigration Relief Act of Hazelton, Pennsylvania provides a cogent
illustration of such legislation. This act, which punishes businesses and landlords for employing
and renting to illegal aliens, was inspired when Hazelton Mayor Louis Barletta claimed that a
recent influx of Hispanic immigrants was responsible for increases in Hazelton crime rates.
Even though Mayor Barletta’s claims of an immigration-crime link in Hazelton have been
scrutinized and have received little support from official crime statistics, this restrictive
legislation has been emulated in other towns attempting to crack down on illegal immigration
and reacting to fears of immigration-violence links (New York Times, March 20, 2007). Thus,
despite research showing that immigrants often have lower violent crime rates than comparable
native-born residents (Butcher and Piehl 1998a; 1998b; Hagan and Palloni 1999; Martinez 2002;
Martinez and Lee 2000; Taft 1933; Tonry 1997), public perception and some elected officials
continue to view immigration as a key source of violence.
Second, sociological and criminological research has also drawn links between Hispanic
immigration and high levels of violence and provides several theoretical arguments to explain
why immigration may contribute to Hispanic violence. Demographic studies of crime and
violence consistently report that young males have the highest rates of violence and crime
compared to other demographic groups (Brown et al. 2007; Feldmeyer and Steffensmeier
Forthcoming; Steffensmeier 1993; Steffensmeier and Allan 1995; Steffensmeier and Feldmeyer
2006; Steffensmeier et al. 2005). Young males make up a larger share of the Hispanic immigrant
109
population than found among most native-born U.S. groups (Pew Hispanic Center 2006a).
Additionally, many of these immigrants enter the country alone, without a spouse or children.
Thus, Hispanic immigration may lead to higher rates of violence because immigrants tend to be
young males with fewer family attachments (Martinez and Lee 2000; Hagan and Palloni 1999).
Criminological theories also suggest that the immigration process may contribute to
violence by creating strain and limited opportunities among immigrant populations. New
Hispanic immigrants may be subject to prejudice and discrimination that limits housing and
employment opportunities. Furthermore, undocumented immigrants face the additional
challenges and strain of obtaining work and housing while avoiding detection by authorities.
Language barriers and difficulties assimilating to a new culture and environment may cause
additional strain and distress for immigrant groups. Additionally, Hispanic immigrants often
move into highly disadvantaged communities and therefore, must learn to manage the difficulties
of living in neighborhoods with few resources or jobs, below-average schools, and low-quality
housing.
Structural-cultural theories of crime argue that the harsh conditions in many immigrant
communities are conducive to subcultural adaptations that are more accepting and permissive of
violence than found in mainstream culture (Anderson 1999; Oliver 2003; Sampson and Wilson
1995). For example, Elijah Anderson’s (1999) depiction of the inner-city street code provides
one of the most well-known descriptions of the defensive violent adaptations and oppositional
subcultures that may be found in disadvantaged and predominantly minority, inner-city
neighborhoods. Thus, criminological theory argues that immigrants and especially immigrants’
children may be pulled into violence as they are exposed to oppositional subcultures and adopt
the normative values and patterns of these disadvantaged communities.
110
However, the most common theoretical link between immigration and violence is drawn
from social disorganization theory and the Chicago School of criminology. In developing social
disorganization theory, Shaw and McKay (1942) mapped Chicago crime patterns around the turn
of the century and found that crime was consistently highest in the “Zone of Transition,” an area
that experienced high levels of immigration and population turnover. They argue that the high
crime rates in the zone of transition were not due to any characteristics of immigrant groups but
instead resulted from the disadvantaged characteristics and social disorganization of the
community. They explain that the zone of transition was poor, experienced high population
turnover, and was highly heterogeneous in terms of race/ethnicity, cultures, and languages. They
argue that these factors created disorganized communities by limiting the residents’ ability to
communicate and to recognize and achieve common goals, like crime control (Shaw and McKay
1942; see also, Cullen and Agnew 2006; Martinez and Lee 2000; Martinez et al. 2004; Sampson
and Groves 1989; Silver 2000). Based on these traditional arguments, social disorganization
theory suggests that immigration may contribute to violence indirectly by creating social
disorganization and by contributing to social conditions that destabilize communities.
Hispanic immigrants often have few resources and are poor when they enter the US,
which may increase disadvantage and poverty levels in immigrant communities. Immigration
also creates population turnover and residential mobility as new residents enter a community. As
new immigrants arrive from different parts of the world, racial/ethnic heterogeneity is also likely
to increase in a community. Furthermore, immigrants often bring new languages, cultures,
values, and beliefs into a community, which could create cultural conflict and increase the
heterogeneity of values, norms, and languages among community residents (Thomas and
Znaniecki 1927). In sum, while there may be nothing particularly criminal about immigrants as
111
a whole, the traditional arguments of social disorganization theory explain that the immigration
process may serve to disorganize and destabilize communities. Thus, immigration may break
down community cohesion and social control and lead to greater rates of violence and crime.
Violence-Reducing Effects of Immigration
In contrast to the arguments discussed above, there is mounting evidence indicating that
violence rates are fairly low among immigrants and that recent patterns of Hispanic immigration
may actually reduce violence. First, research on immigration and crime consistently reports that
Hispanic immigrants and other foreign-born groups commit either similar or lower levels of
crime and violence than comparable, native-born populations with similar age and gender
distributions (Butcher and Piehl 1998a; 1998b; Hagan and Palloni 1999; Martinez 2002;
Martinez and Lee 2000; Taft 1933; Tonry 1997). Several studies by Martinez and colleagues
show that violence levels among highly immigrant Hispanic and Haitian populations are
consistently low and are often only slightly higher than white levels of violence (Martinez and
Lee 1998; 2000; Martinez 2002; 2003; Martinez and Nielsen 2006; Riedel 2003). Research by
Butcher and Piehl (1998a) indicates that immigrants and especially recent immigrants are much
less likely to be incarcerated and institutionalized than native-born U.S. residents with similar
demographic characteristics. Hagan and Palloni (1999) show that Hispanics are incarcerated at a
higher rate than whites – which has often led people to believe that immigrants are more crime
prone. However, they find that foreign-born Hispanics are actually less likely to be incarcerated,
leading them to conclude that the immigration-crime link is “misleading, to the extent of
constituting mythology” (Hagan and Palloni 1999:630).
Second, although few studies have examined how recent patterns of Hispanic
immigration have influenced violent offending, there is growing evidence indicating that the
112
immigration process does not contribute to violence and may even have violence-reducing
effects in Hispanic communities (Butcher and Piehl 1998b; Lee et al. 2001, Martinez 2000;
Martinez et al. 2004; Nielsen et al. 2005; Sampson et al. 2005; Velez 2006). That is,
immigration may not destabilize communities and lead to violence as argued by social
disorganization theory.
For example, Lee et al. (2001) show that having high proportions of new immigrants had
no significant effect on Latino homicides in San Diego and Miami neighborhoods and may have
actually lowered homicide rates in El Paso neighborhoods. Martinez (2000) reports that
immigration has no significant effect on either Latino or total homicide rates (also see, Martinez
2003). However, he notes that immigration effects vary across types of homicides and shows
that immigration contributes to felony homicides but reduces acquaintance homicides among
Latinos. In another study, Martinez et al. (2004) show that neighborhoods with large populations
of recent immigrants are more likely to be involved in drug violence while communities with
large, established immigrant populations are less likely to have drug violence. Sampson et al.
(2005) show that immigrant concentration is strongly related to lower rates of violence and
report that the odds of violence are four-fifths lower for individuals in neighborhoods with 40
percent immigrants compared to communities without any immigrants. Additionally, researchers
provide further evidence against immigration-crime links by noting that Hispanic levels of
violence have remained low and close to white rates of violence, even though Hispanic
immigration has steadily increased during recent decades (Martinez and Lee 2000; Martinez
2002).
Researchers offer several arguments suggesting why new immigrants, including recent
Hispanic immigrants, are not particularly crime prone (Hagan and Palloni 1999; Tonry 1997).
113
First, they explain that immigrants are rarely the poorest or most disadvantaged people from their
native countries. In contrast, immigrants often have higher education levels and greater
resources and human capital than the average individual from their homeland (Gonzalez 2000;
Johnston et al. 1997). Second, immigrants are generally a self-selected set of highly-motivated,
hard-working, dedicated individuals. Gaining entry to the U.S. can often be a difficult and
strenuous process that requires determination, work, risk, and sacrifice. Many Hispanic
immigrants have left behind family members, friends, and support networks to travel to the U.S.
in search of opportunities. Thus, it is unlikely that immigrants would take such risks and
undergo such hardships to gain entry into the U.S. and to gain access to employment and new
opportunities only to risk these accomplishments by resorting to crime (Tonry 1997). Third,
upon entering the country, Hispanic immigrants are typically accepting of conventional
institutions (e.g., work, family, church) and mainstream American values (Tonry 1997).
Research indicates that Hispanic immigrants are willing to work hard for success and the
“American Dream” and often enter the U.S. specifically in search of employment and legitimate
success opportunities. Thus, Hispanic immigrants are not likely to view crime as a viable
pathway to success and are unlikely to support violence and crime in their communities.
Researchers also now suggest that the immigration process may have violence-reducing
effects on communities. Rather than destabilizing a community as suggested by social
disorganization theory, the community resource perspective argues that immigration may
increase community stability and cohesion and strengthen social networks and ties (Healey 2006;
Lee et al. 2001; Martinez and Lee 1998; 2000; Portes and Stepick 1993; Sampson and Bean
2006; Velez 2006). Drawing from the social capital perspective, researchers explain that
Hispanic enclaves often have strong kinship bonds and social ties/networks that are based largely
114
on the shared heritage, language, and cultural background of residents. These networks act as
support systems for new immigrants and provide resources and social capital to help protect
community residents against crime, violence, and the crime-producing effects of disadvantage
and poverty that are present in many Hispanic communities (Light and Gold 2000; Healey 2006;
Lee et al. 2001; Martinez and Lee 2000; Nielsen et al. 2005).
Researchers argue that immigration helps strengthen these social ties/networks and
support systems by reinforcing the common culture, heritage, and traditions that bond members
of Hispanic enclaves. Each new wave of new immigrants provides Hispanic communities with a
fresh infusion of shared heritage and culture that reinforces traditional values and norms of the
Hispanic community and strengthens the sense of community and cohesion among residents
(Martinez 2002; 2003; Healey 2006). Additionally, the kinship ties and support-networks are
further strengthened due to frequent “chain migration,” in which new immigrants move into
communities near their family members and friends and where they can receive support with
childcare, employment, finances, and housing (Healey 2006; Martinez 2002; Martinez et al.
2004; Portes and Rumbaut 2006). Thus, immigration may not destabilize communities, but may
instead help to solidify and stabilize Hispanic communities and ultimately reduce Hispanic
violence by increasing social organization and strengthening social support/capital networks in
Hispanic communities.
Additionally, research suggests that Hispanic immigration may strengthen conventional
institutions, like the church and family, and may attract new resources into Hispanic
communities. As new immigrants enter Hispanic enclaves and communities, they may draw
resources and aid into the communities, which would benefit all residents (Martinez and Lee
1998; 2000; Portes and Stepick 1993). For example, because they are an attractive source of low
115
income labor to US employers, immigrants are likely to attract jobs to Hispanic communities and
increase the employment potential for all community residents. Research also notes that
Hispanic immigration may lead to construction of newer and bigger churches to accommodate
the growing Hispanic population. Also, the importance placed on family and church in Hispanic
communities is likely to increase as immigrants enter the community and reinforce these
traditional values (Martinez and Lee 1998). Thus, traditional family structures and Hispanic
attachment to the church and other conventional social institutions may be strengthened by
immigration.
In sum, there is both a scarcity of research addressing the immigration-violence
relationship for recent patterns of Hispanic immigration, as well as diverse, conflicting views
about this relationship Social disorganization theory and several other sociological theories of
crime suggest that recent Hispanic immigration may lead to violence by destabilizing Hispanic
communities. In contrast, some research finds that violence is less common among new
Hispanic immigrants than among similarly-situated, native-born populations. Additionally, the
community resource argument, drawn from the social capital perspective, provides a
counterclaim to traditional social disorganization arguments and suggests that the immigration
process does not disorganize communities and may actually reduce violence by stabilizing
Hispanic enclaves.
A thorough review of research on immigration and crime revealed no studies that have
simultaneously tested and compared the competing theories on immigration and violence (i.e.,
social disorganization vs. community resource perspectives) by examining the indirect effects of
immigration on violence. That is, sociological research has only shown the total effects of
immigration on violence and has not examined the indirect processes and effects by which
116
immigration influences violence. Thus, it is unclear whether immigration creates violence by
disorganizing Hispanic communities or whether immigration has stabilizing, violence-reducing
effects on Hispanic violence.
The current study marks the first attempts to (1) empirically test the competing
hypotheses on the immigration-violence relationship – i.e., to examine whether (a) recent
Hispanic immigration increases social disorganization and ultimately increases violence and/or
social support/capital, and strengthening conventional institutions, and (2) identify both the
direct and indirect effects of immigration on violence.
DATA AND METHODS
To address these issues, I use information on Hispanic violence drawn from California
Arrest Data (CAL) and New York State Arrest Data (NYSAD) for the 1999-2001 period.
Information on the immigration patterns and structural conditions of Hispanic populations are
drawn from 2000 U.S. Census data.
The unit of analysis is the census place (see Chapters 1 and 2 for more detailed
discussions of census places). To ensure that measures of Hispanic violence and social structure
are reliable, the analysis includes census places only if the place had at least 10,000 total
residents and at least 1,000 Hispanic residents in the year 2000. The final sample includes 396
census places that met the selection criteria.
DEPENDENT VARIABLES
Data on Hispanic violent crime were drawn from the California Arrest Data (CAL) and
the New York State Arrest Data (NYSAD), which provide individual-level arrest counts for a
variety of offenses, disaggregated by race/ethnicity, age, gender, and arresting agency (see
117
Chapter 2 for further description of the CAL and NYSAD data). Hispanic counts of homicide
and Violent Index arrests were drawn from these data and aggregated to the census place-level to
measure levels of Hispanic violence. These arrest counts were then combined with year 2000
Hispanic population figures to create the dependent measures for the analysis: Hispanic arrest
rates/100,000 for homicide and the Violent Index.
To minimize potential problems associated with using arrest data to measure race/ethnic
patterns of violence, the current study focuses on index-violent offenses – which are considered
“serious” offenses and are more reliably reported across demographic groups (Hindelang 1978;
1981; LaFree et al. 1992; Sampson 1987; Steffensmeier et al. 2005). Dependent measures were
calculated using 3-year averaged arrest figures for the 1999-2001 period to add stability to
violence measures and to ensure that the data included adequate arrest counts for statistically rare
offenses (e.g. homicide). Additionally, all dependent measures received square root
transformations to reduce positive skewness and impose normal distributions in the violence
measures.
INDEPENDENT VARIABLES
The independent variables for this analysis are structural indicators of Hispanic social and
economic well-being across California and New York census places, which are drawn from 2000
U.S. Census data – Summary Tape Files 1 and 4. The key explanatory variable in this analysis is
recent Hispanic immigration, which is measured using the percentage of the Hispanic population
in 2000 that is foreign-born and entered the U.S. between 1990 and 2000.
Prior research argues that immigration may contribute to violence indirectly by
increasing social disorganization in Hispanic communities. Therefore, drawing from prior
research and theory, the following variables are used as the traditional measures of social
118
disorganization of census places: poverty, residential mobility, racial/ethnic heterogeneity, and
language heterogeneity. The measures for poverty, residential mobility, and racial/ethnic
heterogeneity are described in Chapter 2. Also included in this analysis is a measure of the
language heterogeneity of census places, which is calculated using a 2-group (English-only and
Spanish-only speakers) entropy index:
M
E = Σ πm ln(1 / πm) m=1
.
where, πm is the proportion of people who speak a language (e.g., Spanish or English only) and
M is the number of languages (Reardon and Firebaugh 2002). The minimum language
heterogeneity value approaches 0 when all residents speak either English or Spanish, while the
maximum value is approximately .693 when a census place has an equal share of English-only
and Spanish-only speakers.
The reader may recall that the community resource perspective provides a counterclaim
to social disorganization arguments, which suggests that immigration reduces violence by
strengthening social support/capital, key community institutions, and family structures in
Hispanic communities. To capture these potential mediating effects, the analysis includes
measures of male unemployment, female-headed families with children, and the care burden in
Hispanic populations. The reader may refer to Chapter 2 (Table 2.1) for a description of
measures for unemployment and female-headed families with children. The Hispanic care
burden is included as an alternative measure of community social support and strain that is
drawn from research on child abuse and demographic studies of gender, family, and crime
(Schwartz 2006). The care burden is measured as the sum of children (0-12) and elderly (65+) per
119
100 Hispanic adults (21-64), where higher values reflect a greater potential burden/strain of caring for
children and elders among the adult Hispanic population.17
This analysis also includes the following structural control variables, which are described
in greater detail in Chapter 2 (Table 2.1): young-male population, population size, population
density, and state. The predictors in this analysis were selected primarily based on theoretical
considerations and practices of prior literature. However, potential collinearity problems were
considered, and correlations among measures were closely examined when selecting independent
variables. The final set of independent variables included in the analysis are correlated
approximately below r = .50, with only one exception (see Table 4.2).18
Additionally,
preliminary analyses revealed that estimated effects did not substantially change when predictors
were added to models one at a time. Based on these observations, multicollinearity does not
appear to be a serious concern in the analyses.
ANALYTIC PROCEDURES
Structural equation models are used to examine the impact of immigration on Hispanic
violence. These models are particularly well-suited for this analysis because, unlike ordinary
least squares regression, they allow easy estimation not only of direct effects, but also indirect
and total effects of immigration on violence. Thus, structural equation models provide the most
straightforward and efficient methods for empirically examining the process by which
immigration influences violence and for testing the competing hypotheses described in the
previous sections.
17 Research suggests that the care burden may also partially reflect an adult population’s ability to monitor youth
and exert informal social control in a community. However, the care burden’s effect on violence is not expected to
vary substantially regardless of its precise meaning. 18 Hispanic family structure and poverty measures are correlated at r = .63. Although it is stronger than the
correlations among the other predictors, this correlation is below standard cut off points for collinearity in
sociological research (e.g., r >.80). Additionally, as shown in Chapters 2 and 3, VIF values were below 4.0 for
Hispanic models of violence that included these two measures. Thus, collinearity does not appear to be a critical
concern for the models.
120
Figure 4.1 displays the key elements of the structural equation models. The straight
arrow going from left to right between immigration and violence reflects a direct effect of
immigration on Hispanic violence. The model also includes seven mediating or indirect effects
between immigration and Hispanic violence. The short arrows branching out from the
immigration variable show that immigration is used to predict the four traditional social
disorganization measures (poverty, residential mobility, racial/ethnic heterogeneity, and
language heterogeneity) as well as the three community resource measures (unemployment,
family structure, and care burden). In turn, each of these mediators is included as a predictor of
the Hispanic violence measures. Thus, the structural equation models test whether immigration
influences violence indirectly through its effect on each of these seven structural factors.
Additionally, the short, thick arrow from the control variable box (Figure 4.1, bottom left)
indicates that the control measures are included as predictors for each of the mediators and for
Hispanic violence measures. The structural equation models outlined in Figure 4.1 are estimated
using AMOS, and the results are reported below (Arbuckle and Wothke 1999).19
RESULTS
DESCRIPTIVE STATISTICS
Table 4.1 provides descriptive statistics for the independent, mediating, and dependent
variables for Hispanic census place-populations. To better situate these results, measures of
violence and structural well-being for Hispanics are compared to white and black populations.20
Turning first to the violence measures, Table 4.1 shows that Hispanic violence rates fall between
19 Exploratory factor analysis revealed that the social disorganization and community resource measures included in
the analysis did not load cleanly onto separate factors. Thus, rather than forcing the variables into two latent factors,
the seven mediators are entered into the model separately. This also provides the added advantage of showing whether the immigration-violence relationship is mediated only by certain aspects of social disorganization or social
resources/support. 20 Although these comparisons are similar to those reported in Chapter 2, the descriptive statistics include several
new measures not included in previous chapters. In addition, the sample of census places used in this analysis is
nearly twice as large (N = 396) as the samples from the previous two chapters (N = 234, approximately).
121
black and white rates. White arrest rates/100,000 are consistently the lowest among the three
race/ethnic groups at approximately 2.8 for homicide and 338.3 for Violent Index crimes. In
contrast, black rates are the highest for both violent offenses at 15.9 for homicide and 1306.3 for
Violent Index arrests. Hispanic violence rates are lower than black rates and slightly higher than
white rates at 6.5 for homicide and 527.5 for Violent Index offenses. Additionally, the standard
deviations of the violence measures show that Hispanic violence varies substantially across
census places. Ninety-five percent of the census places in the sample have Hispanic homicide
rates ranging from approximately zero to 29/100,000 and Violent Index rates ranging from
between zero to about 1,200/100,000.
Turning next to the independent variables, Table 4.1 provides information about the
structural patterns of Hispanic populations and shows that the presence of recent immigrants is
much greater among Hispanics than blacks or whites. On average, nearly 15 percent of the
Hispanic population is comprised of foreign-born residents that entered the U.S. between 1990
and 2000, whereas new immigrants make up only about 2 to 3 percent of the black and white
populations. The standard deviation (std. dev. = 9.14) for this measure also shows that Hispanic
immigration varies widely across census places. Specifically, it indicates that the percentage of
new immigrants in the Hispanic population is between 6 and 24 percent for two-thirds of the
census places in the sample.
Table 4.1 also reveals several noteworthy patterns among the other structural measures.
Hispanic populations have a slightly higher percentage of young males (9.5 percent) than the
black (8.0 percent) or white (5.6 percent) populations. The standard deviation also shows that
the relative size of the young male population varies slightly across the sample (std. dev. = 2.9).
Poverty rates among Hispanics are higher than white poverty levels but are similar to black
122
poverty rates. Slightly more than 18 percent of Hispanics and blacks live below the poverty line,
while only 8 percent of whites live in poverty. Additionally, Hispanic poverty varies widely
across the sample (std. dev. = 9.9), with some census places having almost no poverty and many
others having more than 30 percent of Hispanic residents living in poverty.
Hispanics and blacks also both experience high residential turnover, with more than 55
percent of Hispanic and black households experiencing a change in residents from 1995 to 2000.
In contrast, only 44 percent of white households experienced a change in residents during this
time. The standard deviation for the Hispanic residential mobility measure (std. dev. = 8.87)
indicates that the percentage of Hispanic households experiencing turnover ranges from between
46 to 64 percent for approximately two-thirds of the sample.
The percentage of female-headed families with children is highest among blacks (23
percent) and lowest among whites (8 percent), with Hispanics falling between whites and blacks
at 14 percent. Unemployment is least common among Hispanics compared to whites and blacks.
Table 4.1 shows that 21 percent of Hispanic males are unemployed/not in the labor force,
compared to 28 and 26 percent of blacks and whites respectively. Care burden values are similar
across race/ethnicity, with Hispanics having a slightly greater burden of care (57.4) than whites
(55.9) or blacks (54.5). As observed for the other predictors, the standard deviations indicate
that there is wide variation in these structural measures across Hispanic populations. For two-
thirds of the sample, (1) the Hispanic percentage of female-headed families with children ranges
from 7 to 21 percent (std. dev. = 7.3), (2) the percentage of unemployed males in the Hispanic
population ranges from between 14.5 and 27.5 percent (std. dev. = 6.5), and (3) care burden
scores for the Hispanic populations range from about 43 to 71.
123
THE IMMIGRATION-VIOLENCE RELATIONSHIP
Bivariate Results
Table 4.2 displays the bivariate correlation matrix for measures of Hispanic violence and
proxies of structural position. These bivariate results are used as an initial method to identify
links between Hispanic immigration, mediating variables, and Hispanic violence. Turning first
to the immigration-violence relationship, Table 4.2 shows that immigration is negatively
correlated with both forms of violence (homicide, r = -.05; Violent Index, r = -.12). These
findings indicate that Hispanic rates of violence tend to be lower in census places with higher
levels of recent Hispanic immigration. Thus, the bivariate results provide some initial support
for community resource/social capital arguments and indicate that Hispanic immigration may
reduce Hispanic rates of violence. However, immigration is not the strongest predictor of
Hispanic violence, based on the more sizable correlations between violence and other structural
measures observed in Table 4.2.
Turning next to the traditional social disorganization measures, Table 4.2 reveals several
important relationships between immigration, social disorganization measures, and Hispanic
violence. The bivariate results show that social disorganization measures are all closely related
to Hispanic violence. As expected, measures of Hispanic poverty, racial/ethnic heterogeneity,
and language heterogeneity are all positively correlated with Hispanic homicide and Violent
Index rates. This indicates that Hispanic violence is higher in census places with greater Hispanic
poverty and greater racial/ethnic and language diversity. However, in contrast to traditional
social disorganization arguments, residential mobility is negatively correlated with Hispanic
violence measures, which indicates that Hispanic violence is lower in places with more Hispanic
residential turnover.
124
Additionally, Hispanic immigration is closely linked to all four disorganization measures as
expected. Specifically, Hispanic immigration is positively correlated with all of the social
disorganization measures (e.g., poverty, racial/ethnic heterogeneity), which indicates that social
disorganization is greater in areas with more Hispanic immigration. These findings support
social disorganization arguments about the immigration-violence relationship and suggest that
immigration indirectly increases violence by destabilizing Hispanic communities. That is,
Hispanic immigration may increase social disorganization in Hispanic communities, and in turn,
increases in social disorganization may lead to higher rates of Hispanic violence.
However, the bivariate results also provide some initial support for community resource
arguments drawn from the social capital perspective. Table 4.2 shows that immigration is
negatively correlated with the percentage of female-headed families with children (r = -.15), the
percentage of unemployed males (r = -.17), and the care burden in Hispanic populations (r = -
.24). This indicates that census places with high levels of Hispanic immigration have relatively
fewer Hispanic families with single mothers, less Hispanic unemployment, and lower care
burdens for dependents. The results show that these structural factors are also all positively
related to Hispanic violence (with one exception for the family structure-Violent Index
relationship, r = -.015). As expected, this suggests that Hispanic violence is higher in places with
relatively more Hispanic female-headed families with children, unemployment, and a greater
care burden. Thus, the bivariate findings provide some support for community resource/social
capital arguments and suggest that immigration may also reduce violence indirectly by
stabilizing Hispanic communities. That is, Hispanic immigration may reduce strains and
strengthen social institutions in Hispanic communities, which may ultimately lead to lower rates
of Hispanic violence. However, it is unclear whether these bivariate findings and effects persist
125
net of other structural controls. To provide more rigorous tests of these tentative conclusions, we
turn next to the multivariate structural equation models.
Multivariate Results: Structural Equation Models
Table 4.3 provides the results of the structural equation models predicting Hispanic
homicide and Violent Index rates. The first 7 columns in Table 4.3 reflect the first half of the
structural equation models and show the standardized effects of the Hispanic immigration and
control variables (e.g., population size, population density) on the mediating variables (e.g., % in
poverty, residential mobility, family structure). The last 2 columns list the effects of the full set
of independent and mediating variables on the measures of Hispanic violence. Although
homicide and Violent Index rates were predicted in separate models, the results of these two
models are shown in one table to ease presentation and interpretation of results. The effects of
the independent variables on the mediating variables – i.e., the first 7 columns – were nearly
identical in the homicide and Violent Index models, and therefore are reported only once based
on the homicide model. The following paragraphs will first describe the direct effects of
immigration (and controls) on Hispanic violence. The indirect effects of immigration on
Hispanic violence will then be presented by showing how immigration influences mediating
variables and in turn, how these mediators then influence Hispanic violence (see Figure 4.1 for
graphical layout of predicted effects). Additionally, the indirect effects of immigration on
violence are used to test and draw conclusions about traditional social disorganization theory and
the community resource arguments about the immigration-violence relationship.
Direct Effects
The last 2 columns of Table 4.3 show the direct effects of the independent, control, and
mediating variables on Hispanic violence. First, examining the effects of the control variables on
126
Hispanic violence, we find that the percentage of young males in the Hispanic population has no
significant effect on Hispanic homicide. In contrast, the percentage of young, males has negative
effects on Hispanic Violent Index rates, indicating that Hispanic violence is lower in places with
relatively more Hispanic males in the population. Population size has positive effects on
Hispanic homicide, indicating that Hispanic homicide is higher in places with larger populations.
Additionally, the control for state shows that Hispanic homicide and Violent Index rates are
lower in New York than in California census places.
Turning next to direct effects of immigration on violence, Table 4.3 shows that
immigration does not directly contribute to Hispanic violence. The percentage of recent foreign-
born arrivals in the Hispanic population has no significant direct effects on Hispanic homicide (B
= -0.004) or Violent Index rates (B = -0.003). Thus, controlling for other structural conditions,
immigration does not appear to influence Hispanic violence. However, although they do not
reach significance, it is important to acknowledge the negative direction of these effects. Thus,
in contrast to public perception, these results indicate that net of other structural factors, the
immigration process does not have violence-generating effects and does not contribute to
Hispanic violence.
However, the direct effects of immigration are only one part of the immigration-violence
relationship. Immigration may influence violence through other structural factors and may have
important indirect effects on violence that cannot be seen when one tests only for direct effects
and when immigration is included as one of many predictors of Hispanic violence. Thus, the
following paragraphs turn to examination of indirect effects of immigration on Hispanic
violence.
127
Indirect Effects
As the reader may recall, researchers have proposed competing arguments about the
indirect effects of immigration on violence. On one hand, the traditional social disorganization
perspective suggests that Hispanic immigration may contribute to violence by increasing
poverty, residential mobility, and heterogeneity in Hispanic communities (Lee et al. 2001;
Martinez 2000; 2002; Martinez and Lee 2000; Nielsen et al. 2005; Shaw and McKay 1942). In
contrast, the community resource approach drawn from the social capital perspective, posits that
Hispanic immigration stabilizes Hispanic populations by strengthening family structure and
kinship bonds, attachment to the labor force, and other forms of social support/capital (Lee et al.
2001; Martinez 2002; Martinez and Lee 1998; 2000; Martinez et al. 2004; Martinez and Nielsen
2006; Nielsen et al. 2005; Portes and Stepick 1993; Velez 2006). To address this debate and
gain a more refined picture of the immigration-violence relationship, the following paragraphs
describe the indirect effects of immigration on violence.
First, Table 4.3 (first 7 columns) shows that several of the control variables are related to
the social disorganization and community resource/social capital measures. The results show
that the presence of young males in the population contributes to Hispanic social disorganization.
Specifically the percentage of young males has positive effects on Hispanic residential mobility
and poverty rates, indicating that census places with relatively more young males in the Hispanic
population have greater Hispanic residential mobility and poverty. The percentage of young
males is also related to Hispanic community resource measures. The percentage of young males
has positive effects on Hispanic rates of female-headed families and unemployment, which
suggests that female-headed families and unemployment rates increase as the share of young
128
males in the Hispanic population increases. In contrast, the percentage of young males appears
to reduce the Hispanic care burden.
The results suggest that population size increases racial/ethnic heterogeneity but has no
effect on the other social disorganization variables or any of the community resource/capital
measures (Table 4.3). Population density has mixed effects on both the social disorganization
and community resource measures. Specifically, density contributes to Hispanic poverty,
language heterogeneity, female-headed families, and unemployment, but appears to reduce
residential mobility and the Hispanic care burden. In addition, the results suggest that social
disorganization is greater and community resources and capital are lower for Hispanics in New
York census places compared to California census places. That is, Hispanic poverty, residential
mobility, the percentage of female-headed families, and unemployment are all greater for
Hispanic populations in New York compared to California, while only language heterogeneity
and the care burden have significantly lower values in New York census places.
Second, turning next to the immigration effects on the mediating variables, the results
indicate that recent Hispanic immigration contributes to Hispanic social disorganization
measures (Table 4.3, Columns 1-4). In support of traditional social disorganization arguments,
the percentage of recent immigrants in the Hispanic population has positive and significant
p<.05), and language heterogeneity (B = 0.38, p<.001). Additionally, the standardized
coefficients in Table 4.3 reveal that immigration contributes particularly heavily to the language
heterogeneity of census places. In contrast, the relative size of the immigrant population has no
noticeable effect on poverty rates among Hispanic populations. Overall, these results support
traditional social disorganization arguments and suggest that immigration increases the
129
population turnover and heterogeneity (racial/ethnic and language) of census places. Thus, the
findings suggest that immigration has potentially destabilizing and disorganizing effects on
Hispanic populations.
Additionally, several of these social disorganization measures appear to influence
Hispanic violence. The last 2 columns of Table 4.3 show that, as predicted, poverty has
significant, positive effects on Hispanic homicide (B = 0.16, p<.01) and Violent Index rates (B =
0.27, p<.001), which suggests that Hispanic poverty contributes to Hispanic violence. Language
heterogeneity has significant, positive effects on both forms of Hispanic violence, which
suggests that Hispanic violence increases as the language heterogeneity of census places
increases. In contrast, residential mobility appears to reduce Hispanic homicide and has no
significant effect on Hispanic Violent Index rates. Additionally, racial/ethnic heterogeneity has
no significant effects on Hispanic violence. Thus, in support of traditional social disorganization
arguments, poverty and language heterogeneity both appear to contribute to several forms of
Hispanic violence. Furthermore, because immigration contributes to several of the social
disorganization measures, these findings also suggest that immigration has indirect effects on
violence – i.e., that immigration contributes to violence indirectly by increasing social
disorganization and destabilizing Hispanic communities.21
To better illustrate the indirect effects of immigration on violence, Table 4.4 lists the
effects of Hispanic immigration on each mediating variable and then shows the effects of the
mediators on Hispanic rates of violence.22
As noted above, Table 4.4 shows that recent Hispanic
immigration increases language heterogeneity, which in turn contributes to Hispanic homicide
21 In supplemental analyses, an alternative entropy index that includes whites, blacks, Hispanics, and “all other
race/ethnicities” was used to estimate the effects of immigration on racial/ethnic heterogeneity and the effects of
racial/ethnic heterogeneity on both forms of violence for Hispanics (results not shown). The supplemental results
were nearly identical to the results described above. 22 For similar strategies for identifying and illustrating indirect effects, see Guo and Harris (2000).
130
and Violent Index rates. As discussed earlier, Hispanic immigration also contributes to
racial/ethnic heterogeneity and residential mobility. However, these variables have little effect
on violence and in contrast to social disorganization arguments, residential mobility appears to
reduce Hispanic homicide. Table 4.4 (top 2 rows) also combines these indirect effects to show
exactly how much immigration influences violence through the combined set of social
disorganization measures. These findings show that through the combined set of social
disorganization measures, immigration has positive indirect effects on Hispanic homicide (B =
0.045) and Violent index rates (B = 0.046). Thus, the results from Table 4.4 provide some
additional support for social disorganization arguments and suggest that immigration indirectly
increases violence by disorganizing Hispanic communities and primarily by increasing the
language heterogeneity of census places.
Third, in contrast to these findings, the results also support community resource
arguments drawn from the social capital perspective, which posit that immigration has
stabilizing, violence-reducing effects on Hispanic populations. The findings show that recent
immigration strengthens several important social institutions and sources of resources and
support in Hispanic populations. Table 4.3 (columns 5-7) shows that the percentage of recent
Hispanic immigrants has significant negative effects on the percentage of female-headed families
with children (B = -0.31, p<.001), the percentage of unemployed males (B = -0.32, p<.001), and
the burden of care (B = -0.15, p<.01) in Hispanic populations. This indicates that places with
higher immigration tend to have relatively fewer Hispanic female-headed families with children,
unemployed males, and a lower Hispanic burden of care for dependents. Thus, the findings
suggest that Hispanic immigration has some stabilizing effects on Hispanic populations and
especially on Hispanic family structure and employment.
131
Additionally, the results indicate that several of the structural measures drawn from the
community resource perspective are related to Hispanic violence. The last 2 columns of Table
4.3 show that the percentage of Hispanic female-headed families with children has significant,
positive effects on Hispanic homicide (B = 0.16, p<.01) and Violent Index rates (B = .08, p<.05),
which suggests that the percentage of female-headed Hispanic families contributes to Hispanic
violence. The Hispanic care burden is also positively related to Hispanic Violent Index
offending (B = .10, p<.01), indicating that Hispanic violence is higher in places with a greater
burden of care placed on Hispanic residents. Thus, the findings provide some support for the
community resource argument and show that the care burden and especially the presence of
female-headed families contribute to Hispanic violence. Additionally, because immigration
contributes to these community resource measures, the findings again suggest that immigration
has indirect effects on violence. However, instead of contributing to violence, the community
resource effects suggest that immigration reduces violence indirectly by strengthening social
institutions and support systems and by stabilizing Hispanic communities.
To further illustrate these indirect effects of immigration on violence, we again turn to
Table 4.4. As noted above, Table 4.4 shows that recent Hispanic immigration decreases all of
the community resource measures (i.e., female-headed families, unemployment, care burden). In
turn, female-headed families contribute to both forms of Hispanic violence, and the Hispanic
care burden contributes to Violent Index rates. Thus, the results suggest that immigration
indirectly decreases violence by strengthening Hispanic family structure and reducing the burden
of care. Table 4.4 (top 2 rows) also combines the indirect effects to show how much
immigration influences violence through the full set of community resource measures. Through
these three combined community resource measures, immigration has negative indirect effects
132
on Hispanic homicide (B = -0.080) and Violent Index rates (B = -0.052). Thus, the findings in
Table 4.4 provide further support for community resource arguments drawn from the social
capital perspective and suggest that immigration indirectly reduces violence by stabilizing
Hispanic communities and mostly by decreasing the percentage of female-headed Hispanic
families.
In sum, the results support both the traditional social disorganization and community
resource arguments on the immigration-violence relationship and show that immigration has
multiple, countervailing indirect effects on violence. Table 4.4 shows that the violence-
generating effects of immigration that work through social disorganization measures are offset
by the violence-reducing effects of immigration that operate through social support/capital
measures. For example, the standardized, positive indirect effects of immigration on Hispanic
homicide that work through social disorganization (B = 0.045) are washed out by the indirect
community resource effects on Hispanic homicide (B = -0.080). As noted earlier, Table 4.4 also
shows that immigration has little direct effect on Hispanic violence measures. Combining the
indirect (social disorganization and community resource) and direct effects reveals that
immigration has little total effect on Hispanic homicide (B = -0.039) or Violent Index rates (B =
-0.009). Thus, due to the offsetting indirect effects of immigration on violence, the results
provide little evidence that immigration contributes to violence. Instead, immigration has an
overall negligible effect on violence and does not strongly support violence-generating or
violence-reducing arguments about the effects of immigration.
DISCUSSION AND CONCLUSION
In recent decades, the U.S. has experienced a growing trend in Hispanic and especially
Mexican immigration. Due in part to these immigration patterns, Hispanics have now become
133
the largest and fastest growing minority group in the U.S. (Healey 2006; U.S. Census Bureau
2005; Pew Hispanic Center 2006a; 2006b). Sociological and criminological research has yet to
fully explore the impact of these immigration patterns on social structure and Hispanic violence.
Additionally, prior research and theory on crime offer conflicting ideas on the immigration-
violence relationship. Key criminological theories, such as social disorganization theory, argue
that increases in Hispanic immigration may disorganize and destabilize Hispanic communities
and ultimately increase crime (Lee et al. 2001; Martinez 2000; 2002; Martinez and Lee 2000;
Nielsen et al. 2005; Shaw and McKay 1942). However, research also suggests that violence is
less common among immigrants compared to similarly-situated native-born populations.
Additionally, researchers drawing from social capital perspectives have presented a counterclaim
to social disorganization arguments, referred to here as the community resource perspective,
which suggests that immigration has stabilizing effects on communities and provides protective
benefits and resources to community residents (Butcher and Piehl 1998a; 1998b; Hagan and
Palloni 1999; Lee et al. 2001; Martinez 2000; 2002; Martinez and Lee 1998; 2000; Nielsen et al.
2005; Sampson et al. 2005; Velez 2006). Instead of increasing violence, the community resource
approach argues that immigration may reduce violence by strengthening community cohesion,
social and familial bonds, community institutions, and social support/capital networks in
Hispanic communities.
This chapter addresses the immigration-violence debate by examining both the direct and
indirect effects of Hispanic immigration on Hispanic violence and by testing the competing
social disorganization versus community resource hypotheses. The results indicate that recent
patterns of Hispanic immigration have several noteworthy effects on Hispanic violence
(homicide and Violent Index rates). First, immigration appears to have little direct effect on
134
Hispanic homicide or Violent Index rates. Second, the results also show that immigration has
several indirect effects on Hispanic violence that work through both social disorganization and
community resource measures. However, these indirect effects are opposing and largely offset
one another. The percentage of recent immigrants contributes to Hispanic violence by increasing
social disorganization measures and especially by increasing language heterogeneity.
Simultaneously, immigration also appears to reduce violence indirectly by strengthening
Hispanic social institutions and support/capital – i.e., by reducing the presence of female-headed
families and the burden of care among Hispanic populations. Third, combining these direct and
indirect effects reveals that immigration has little total effect on Hispanic violence (Note: What
effect does exist is negative in direction – suggesting at a minimum that immigration does not
lead to higher violence rates, at least in the short run). Thus, the results suggest that immigration
does not contribute to Hispanic violence and does not appear to be a key part of the violence-
generating process for Hispanics.
These findings provide several important implications and make several key
contributions to research on immigration and violence. First, in contrast to public perception,
this research indicates that immigration is not a key source of Hispanic violence. Claims that
recent trends in Hispanic immigration have sparked increased violence and that immigrants are
turning their communities into “zones of lawlessness” receive no support from these results (as
for example, Horowitz 2001:8). Thus, fears of immigration-generated waves of Hispanic
violence seem unlikely based on these results. Furthermore, the results suggest that policies and
legislation aimed at reducing immigration may do little to reduce Hispanic violence.
Second, these findings help extend our understanding of the processes by which
immigration influences violence and provide important implications for both social
135
disorganization and social support/capital explanations of the immigration-violence relationship.
The indirect effects reported above provide some insight on the immigration-violence debate and
show that both the social disorganization and community resource/social capital arguments are
supported. The analysis shows that immigration does not appear to have one direct pathway to
influencing violence. As argued by social disorganization theory, immigration appears to have
some disorganizing, destabilizing effects on Hispanic communities (e.g., increased language
heterogeneity) that contribute to violence. But at the same time, immigration reduces violence
by stabilizing and strengthening Hispanic institutions and social support/capital frameworks
(e.g., family structure, employment, and ability to care for dependents). Although these effects
largely neutralize one another and result in little overall effect of immigration on violence, their
presence indicates that both the social disorganization and the community resource arguments
about the immigration-violence relationship are supported. This suggests that immigration-
violence research should consider both social disorganization and community resource/social
capital arguments and should continue to examine both the potential stabilizing and destabilizing
effects of immigration on Hispanic communities and violence.
Third, this analysis illustrates the need to examine both the direct and indirect effects of
immigration on violence. Prior research has typically only examined the direct effects of
immigration on violence, controlling for other structural factors (Lee et al. 2001; Martinez 2000;
Nielsen et al 2005; Sampson et al. 2005). However, as shown here, the direct effects are only
part of the immigration-violence relationship. By ignoring the indirect and total effects of
immigration on violence, research is likely to overlook important nuances of the immigration-
violence relationship.
136
Although this study offers several important findings and provides the first examination
of indirect effects of immigration on violence, several caveats must be acknowledged. First, as
in most macro-level studies of crime, independent and mediating variables measuring
immigration, social disorganization, social support/capital, and other structural factors were
limited to measures available from U.S. Census Data. Thus, the predictors and mediators may
not perfectly capture the processes of immigration, social disorganization, and social
support/capital. The immigration and social disorganization measures used in this chapter (i.e.,
percentage foreign-born Hispanics that entered the U.S. between 1990 and 2000, poverty,
residential mobility, heterogeneity) are well established measures that have frequently been used
in prior research and therefore, should not be a critical concern (Lee et al. 2001; Nielsen et al.
2005; Osgood and Chambers 2000; Sampson and Groves 1989; Silver and Miller 2004; Warner
and Pierce 1993). However, social support/capital concepts that inspired the community
resource arguments are particularly difficult concepts to measure in aggregate-level studies of
crime (Silver 2000; Kubrin and Weitzer 2003; Peterson and Krivo 2005; Velez 2006).
The measures representing the community resource argument were selected based on
arguments in prior research that immigration strengthens family structure, support systems, and
labor force participation in Hispanic communities (Martinez 2000; 2002 Martinez and Lee 1998;
2000; Lee et al. 2001; Nielsen et al. 2005; Velez 2006). However, there are many other potential
forms of social capital and social support that may mediate the immigration-violence
relationship. Researchers suggest that the immigration-violence relationship is mediated by
extended family ties and by religious beliefs and participation. Thus, future research should
examine whether these forms of social capital mediate the immigration-violence relationship. To
further address community resource/social capital arguments, future research should also
137
examine how immigration influences social networks and factors like collective efficacy within
Hispanic neighborhoods and whether these factors mediate the immigration-violence relationship
(Morenoff et al. 2001).
Second, as characterizes most prior research, this study relies on cross-sectional data to
examine the immigration-violence relationship. As a result, it is more difficult to establish the
direction of effects between variables, particularly between immigration and mediating factors
such as poverty and unemployment. This potential problem is reduced by using an immigration
measure that reflects immigration patterns for the prior 10 year period (1990-2000). However, to
better establish the effects of immigration on violence and to reveal any potential reciprocal
effects or selection effects, there is also a need for future research that employs longitudinal data
to examine immigration and violence.
Third, although social disorganization and the community resource factors are modeled
as separate and distinct characteristics of Hispanic populations, these factors are likely to overlap
and may influence each other. In preliminary analyses, several models were estimated in which
social disorganization measures and community resource measures were permitted to influence
each other. These effects did not substantially improve the fit of the structural equation models
and did not change the substantive findings of the analysis. However, future research may wish
to further explore the connections between these mediating processes in the immigration-
violence relationship.
138
Table 4.1. Means and Standard Deviations for Hispanic
Independent and Dependent Variables
BLACK WHITE
VARIABLES Mean Std. Dev. Mean Mean
Dependent - (arrest rates/100,000)
Homicide 6.53 11.23 15.87 2.82
Homicide (sq. root) 1.77 1.85 2.62 1.15
Robbery 73.14 74.97 322.83 33.11
Robbery (sq. root) 7.55 4.03 16.66 5.14
Violent Index 527.45 345.39 1306.28 338.27
Violent Index (sq. root) 21.31 8.56 34.23 17.27
Independent
% Foreign-Born 1990-2000 14.80 9.14 2.55 2.00
% Males Age 15-24 9.47 2.90 7.95 5.59
Total Population Size 95635.08 283906.98 95635.08 95635.08
Density (people/sq. mile) 5148.28 5321.91 5148.28 5148.28
New York 0.19 0.39 0.19 0.19
Social Disorganization
% in Poverty 18.38 9.90 18.65 8.40
Residential Mobility 55.32 8.87 56.41 43.80
Racial/Ethnic Heterogeneity 0.63 0.26 0.63 0.63
Language Heterogeneity 0.32 0.15 0.32 0.32
Community Resource/Social Capital
% Female Headed Families with Children 14.02 7.25 23.15 8.02
% Unemployed Males 21.00 6.57 28.25 25.69
Burden of Care 57.41 13.95 54.54 55.90
N = 396
HISPANIC
139
Table 4.2. Correlations of Dependent and Independent Variables for the Hispanic Population
1 2 3 4 5 6 7 8 9 10 11 12 13 14
1. Hispanic Homicide Rate 1.000
2. Hispanic Violent Index Rate 0.447 1.000
3. % Foreign Born -0.051 -0.115 1.000
4. % Males Age 15-24 -0.053 -0.086 0.305 1.000
5. Total Population 0.215 0.076 0.030 -0.079 1.000
6. Population Density 0.166 0.060 0.160 -0.080 0.389 1.000
7. State (New York = 1) -0.207 -0.674 0.184 0.110 0.006 0.085 1.000
a. Homicide, Robbery, and Violent Index are predicted in 3 separate models. The effects of immigration and the controls on the mediatiors are reported only once because they did not
change across models.
b. Correlations are estimated for all exogenous predictors to account for unobserved shared association among predictors and to improve model fit.
RobberyHomicide
SOCIAL DISORGANIZATION COMMUNITY RESOURCE
Language
Heterogeneity
Female-
Headed Violent Index
Families
Unemployment
Residential
Mobility % Poverty
Racial/Ethnic
Heterogeneity
Care
Burden
141
Table 4.4 Direct, Indirect, and Total Effects of Immigration on Hispanic Homicide and Violent Index Arrest Rates
INDIRECT EFFECTS INDIRECT EFFECTS TOTAL IMMIGRATION
DIRECT EFFECT Through Soc. Disorg. Through Community Resource EFFECT
% Foreign-Born 1990-2000 → Violent Index -0.003 0.046 -0.052 -0.009
Standardized Effects of Hispanic Immigration on Mediating Variables and Effects of Mediating Variables on Hispanic Violence
% Foreign-Born 1990-2000 → Mediator → Homicide
0.12 * Residential Mobility -0.12 *
0.01 Poverty 0.16 **
0.11 * Racial/Ethnic Heterogeneity 0.07
0.38 *** Language Heterogeneity 0.14 *
-0.31 *** Female-Headed Families 0.16 **
-0.32 *** Unemployment 0.09
-0.15 ** Care Burden 0.01
% Foreign-Born 1990-2000 → Mediator → Violent Index
0.12 * Residential Mobility 0.02
0.01 Poverty 0.27 ***
0.11 * Racial/Ethnic Heterogeneity 0.06
0.38 *** Language Heterogeneity 0.09 *
-0.31 *** Female-Headed Families 0.08 *
-0.32 *** Unemployment 0.03
-0.15 ** Care Burden 0.10 **
N = 396 * p<.05 ** p<.01 *** p<.001
142
Figure 4.1. Structural Equation Model for the Direct and Indirect Effects of Immigration on Hispanic Violence
Note: Social disorganization, social support/capital, and control variables are all measured, entered, and predicted separately. Latent factors are not used to
predict Hispanic violence.
a. The full set of control variables is used to predict all Hispanic violence and all mediating variables (e.g., poverty, residential mobility, unemployment).
Hispanic Immigration
% Males 15-24 Population Size
Population Density State
Residential Mobility Poverty
Race/Ethnic Heterogeneity Language Heterogeneity
Female Headed Families Unemployment
Care Burden
Social Disorganization
Community Resources
Hispanic Violence
Controls a
143
CHAPTER 5:
SUMMARY AND DISCUSSION
Research on race/ethnicity, social structure, and violence has a long-standing tradition in
sociological and criminological research. Ecological studies of crime have often shown that
racial/ethnic patterns and trends in violence are shaped by differences in poverty, disadvantage,
and other structural conditions. However, a critical limitation of this research is that it has
focused almost exclusively on black-white comparisons and has overlooked Hispanics and other
race/ethnic groups. Additionally, ecological studies on the race/ethnicity-violence relationship
have been limited in that they (a) continue to debate whether the structural sources of violence
are “racially invariant” and (b) have focused on the effects of disadvantage while often
overlooking how segregation, immigration, and other structural factors influence violence across
race/ethnic groups.
The primary objective of this research has been to expand ecological and structural
research on race/ethnicity and violence by examining the structural sources of Hispanic violence
– both alone and compared to whites and blacks. This dissertation sought to address the
limitations of prior research identified above by addressing three questions about the relationship
between race/ethnicity, social structure, and violence:
1. whether the structural sources of violence are similar or “racially invariant” for whites
blacks, and Hispanics; and whether support for racial invariance arguments depends
on how invariance is defined,
2. whether racial/ethnic residential segregation contributes to black and Hispanic
violence and whether the effects of segregation are invariant across race/ethnicity.
3. whether immigration stabilizes/destabilizes Hispanic communities and ultimately
influences Hispanic violence.
144
To address these questions, I used arrest data and measures of social structure for whites,
blacks, and Hispanics for more than 200 census places across California and New York during
the 1999 to 2001 period. Data on white, black, and Hispanic violent crime were drawn from the
California Arrest Data (CAL) and the New York State Arrest Data (NYSAD), which provide
individual-level arrest counts for a variety of offenses, disaggregated by race/ethnicity, age,
gender, and arresting agency. These data were aggregated to the census place-level and were
combined with year 2000 population figures for each census place (U.S. Census Bureau – STF 4)
to create the dependent measures for the analysis: white, black, and Hispanics homicide and
Violent Index rates/100,000. Race/ethnicity-specific measures of social structure (e.g., measures
of structural disadvantage, racial/ethnic segregation, immigration) served as the independent
variables and were drawn from 2000 U.S. Census data for each race/ethnic group at the census
place-level. Seemingly Unrelated Regression techniques were used to test the racial invariance
hypothesis and examine whether structural factors had significantly different effects on violence
across race/ethnic groups. Additionally, structural equation modeling techniques were used to
identify the total, direct, and indirect effects of immigration on Hispanic violence.
Key findings from the analyses are summarized in Table 5.1 and in a chapter-by-chapter
description in the following paragraphs. Chapter 2 tested the racial invariance hypothesis and
compared the structural predictors of violence for blacks, whites, and Hispanics to discern
whether the structural sources of violence, and especially the effects of disadvantage on violence,
are similar across race/ethnic groups. The findings from Chapter 2 provide mixed support for the
“racial invariance” hypothesis, depending on how it is defined. The results provide almost no
support for narrowly-defined interpretations of racial invariance and show that the particular
structural predictors of violence (e.g., poverty, unemployment, family structure) and the
145
magnitudes of structural effects on violence vary substantially across race/ethnic groups.
However, broadly-defined interpretations of the racial invariance hypothesis receive some
support. That is, the findings show that structural disadvantage generally contributes to violence
and appears to be a key component of the violence-generating process for whites, blacks, and
Hispanics. Additionally, Chapter 2 provides mixed support for social capital and ethnic
economies arguments that suggest that Hispanics are protected or insulated from the violence-
generating effects of disadvantage. The results show that disadvantage has weaker effects on
homicide for Hispanics than for blacks but similar effects on black and Hispanic Violent Index
rates. In sum, Chapter 2 provides some support for racial invariance arguments, but only if one
uses the broadest interpretation of “invariance” and focuses solely on whether structural
disadvantage contributes to violence for blacks, whites, and Hispanics.
Chapter 3 extends research on race/ethnic segregation and violence and also contributes
to racial invariance literature by comparing the effects of racial/ethnic segregation on black and
Hispanic violence. The findings show that Hispanic isolation (from whites and from all other
race/ethnic groups) contributes to both Hispanic homicide and Violent Index rates. Segregation
also contributes to black homicide, but segregation appears to actually reduce black Violent
Index rates. The results also suggest that concentrated disadvantage mediates the effects of
racial/ethnic isolation on both Hispanic and black violence. That is, segregation appears to
indirectly contribute to black and Hispanic violence by increasing concentrated disadvantage.
Additionally, Chapter 3 provides mixed support for the racial invariance assumption and shows
that racial/ethnic isolation and concentrated disadvantage have similar effects on black and
Hispanic homicide but different effects on Violent Index rates across race/ethnicity.
Racial/ethnic isolation appears to contribute to Violent Index rates more strongly for Hispanics
146
than blacks, while concentrated disadvantage contributes to black violence more than Hispanic
violence. Thus, Chapter 3 indicates that racial/ethnic segregation is a social problem that extends
beyond black communities and suggests that racial/ethnic isolation is a key part of the violence-
generating process for Hispanics.
Chapter 4 focused on the impact of immigration on Hispanic homicide and Violent Index
rates. In particular, Chapter 4 addressed the immigration-violence debate by examining both the
direct and indirect effects of recent immigration on Hispanic violence and by testing the
competing social disorganization versus community resource hypotheses. The results indicate
that immigration has almost no direct effect on Hispanic homicide or Violent Index rates.
However, immigration appears to have multiple, offsetting indirect effects on Hispanic violence
that work through social disorganization and community resource/social capital measures.
Specifically, the percentage of recent immigrants contributes to Hispanic homicide and Violent
Index rates by increasing social disorganization and especially by increasing language
heterogeneity among Hispanic populations. Simultaneously, immigration also appears to reduce
violence by strengthening Hispanic social institutions and support/capital – i.e., by reducing the
presence of female-headed families and the burden of care among Hispanic populations. The
combination of these direct and indirect effects shows that immigration has little total effect on
Hispanic violence. In addition, when effects are observed they are slightly negative, indicating
that immigration may slightly reduce Hispanic violence. Thus, the results of Chapter 4 suggest
that immigration does not contribute to Hispanic violence.
This dissertation makes several key contributions to research on race/ethnicity, social
structure, and violence and also highlights several important gaps in research on race/ethnicity
and crime. First, although there appear to be differences in the violence-generating process
147
across race/ethnic groups, questions remain about the sources of these variations. Why does
disadvantage have stronger effects on violence for blacks than for Hispanics and whites, and why
does segregation have different effects on black and Hispanic violence? Research suggests that
kinship bonds and social capital networks may shape the way that structural factors influence
violence across race/ethnic groups. Thus, strong social support and social capital/kinship
networks may help protect Hispanics and whites from the violence-generating effects of
disadvantage (Martinez 2003; Martinez and Nielsen 2006; Velez 2006). Additionally, research
suggests that immigration may contribute to social capital networks and provide a buffer against
violence in Hispanic populations (Martinez 2000; 2002; Martinez and Lee 1998; 2000; Lee et al
2001; Nielsen et al. 2005; Sampson and Bean 2006; Velez 2006).
The findings from this project provide some support for these arguments, but the
evidence offered is largely indirect. Additional research is needed that directly examines and
measures social capital, support networks, kinship ties, and participation in ethnic economies to
identify how these factors influence violence and shape the impact of structural factors on
violence across race/ethnic groups. However, obtaining such measures is often difficult at the
city, county, and census place-levels due to the limitations of census data. Such analyses would
likely require neighborhood-level data on black, white, and Hispanic violence and social
structure (Kubrin and Weitzer 2003). Thus, future neighborhood-level studies of race/ethnicity
and violence may be particularly well-suited to address these questions and examine how social
capital, kinship networks, and ethnic economies influence the social structure-violence
relationship across race/ethnic groups. However, because violent crime and especially
homicides are rare events, obtaining neighborhood-level measures of serious violence may prove
difficult.
148
Second, this project addresses whether structural factors have similar/different effects on
violence across race/ethnicity, but further research is needed that predicts racial/ethnic gaps in
violence. There are relatively few studies that examine how structural factors influence
racial/ethnic gaps in violence. Velez et al. (2003) and Phillips (2002) provide two of the only
studies that directly examine how racial/ethnic differences in social structure influence
racial/ethnic differences in violence. Additionally, Phillips (2002) is the only study that
examines the structural sources of Hispanic-white and Hispanic-black gaps in violence. This
oversight is particularly noteworthy because, as shown here, Hispanic communities face similar
levels of disadvantage as black populations but typically have lower rates of violence. Thus,
there is a great need for research that identifies the structural sources of racial and ethnic
disparities in violence, especially involving Hispanic populations.
Third, as discussed in Chapter 3, it is unclear why segregation has stronger effects on
violence for Hispanics than for blacks. Social capital and ethnic economy perspectives suggest
that strong support networks and active ethnic economies should provide Hispanics with some
protection from the effects of segregation. Additionally, research argues that Hispanic-white
segregation is not as concentrated as black-white segregation and occurs in part due to the
formation of Hispanic enclaves. Based on these arguments, one would expect segregation to
have either similar or possibly weaker effects on Hispanic than on black violence. Thus, further
research is needed to identify why segregation is more strongly linked to Hispanic than to black
violence.
Fourth, as characterizes most prior research, this project relies on cross-sectional data to
examine the relationships between race/ethnicity, social structure, and violence. Thus, there is
also a need for research that employs longitudinal data, which are particularly useful for
149
establishing the direction of effects between structural factors and violence and also for
identifying indirect effects and reciprocal effects between structural factors and violence. Thus,
although such data may not be easily accessible, use of longitudinal data on crime and social
structure disaggregated by race/ethnicity would be advantageous in future studies of
race/ethnicity and violence.
Last, future research on race/ethnicity, social structure, and violence should continue to
expand its scope to include other race/ethnic groups, offenses, and locations. As illustrated in
this project, it is important for future research to focus more heavily on Hispanic violence and to
continue to move beyond black-white comparisons to include other race/ethnic groups, such as
Asian/Pacific Islanders and Native Americans. There is also a need to examine how structural
factors influence violence across the diverse set of “Hispanic” subgroups (e.g., Mexican, Cuban,
Puerto Rican). Almost all racial invariance studies and the majority of research on race/ethnicity
and crime have focused on violent offending. Thus, future analyses should also examine the
structural predictors of non-violent forms of crime and potential similarities/differences in these
predictors across race/ethnicity.
Taken together, this project makes several key contributions to ecological research on
race/ethnicity, social structure, and violence. These include – first, refining our understanding of
the racial invariance hypothesis; second, moving beyond structural disadvantage to examine how
segregation and immigration influence violence among minority groups; third, using census
place-level analyses to overcome the limitations of city-level data and analyses; fourth,
separating Hispanic, black, and white crime figures to provide cleaner comparisons of the
structural sources of violence across race/ethnic groups; and fifth, illustrating the importance of
examining both direct and indirect effects of structural factors on violence across race/ethnic
150
groups. Most notably, the key contribution of this dissertation is that, drawing from research and
theory on the ecology of crime and particularly that research that has focused on black-white
comparisons, it has extended our understanding of the patterns and sources of Hispanic violence
– both alone and compared to those of whites and blacks.
This project raises important questions about the impacts of segregation, immigration,
and other structural factors on violence across race/ethnicity and highlights several remaining
gaps in ecological research on race/ethnicity and violence that call for further study. It is hoped
that future research will extend the parameters of this study to provide further probes of the
relationships between race/ethnicity, social structure, and crime. In light of the growth of the
Hispanic population, there is a particular need for further research addressing the structural
sources of Hispanic violence and the Hispanic immigration-violence relationship in order to
better understand how recent population growth and increasing trends in Hispanic immigration
have influenced violence among Hispanics. Doing so has key implications for sociological and
criminological theory; for addressing longstanding, core themes in sociology related to
race/ethnicity, social stratification, social change, and social control; and for public policy. In
effect more research along the lines of this dissertation is critical to help inform scholars, policy-
makers, and the general public about the societal impact of ecological changes, recent patterns of
immigration, and changes in the racial/ethnic landscape of the country.
151
152
REFERENCES
Agnew, Robert. 1999. "A General Strain Theory of Community Differences in Crime Rates."
Journal of Research in Crime and Delinquency 36:123-155.
Akins, Scott. 2003. “Racial Segregation and Property Crime: Examining the Mediating Effect of
Police Strength.” Justice Quarterly 20:675-695.
Anderson, Elijah. 1997. "Violence and the Inner-City Street Code." Pp. 1-30 in Violence and
Childhood in the Inner City, edited by J. McCord. Cambridge, UK ; New York:
Cambridge University Press.
Anderson, Elijah. 1999. Code of the Street: Decency, Violence, and the Moral Life of the Inner
City. New York: W. W. Norton & Company.
Arbuckle, James L. and Werner Wothke. 1999. Amos 4.0 User's Guide. Chicago: Small Waters
Corporation.
Bellair, Paul E. 1997. "Social Interaction and Community Crime: Examining the Importance of
Neighbor Networks." Criminology 35:677-703.
Bellair, Paul E. and Thomas L. McNulty. 2005. "Beyond the Bell Curve: Community
Disadvantage and the Explanation of Black-White Differences in Adolescent Violence."
Criminology 43:1135-1168.
Blau, Judith R. and Peter M. Blau. 1982. "The Cost of Inequality: Metropolitan Structure and
Violent Crime." American Sociological Review 47:114-129.
Brown, Stephen E., Finn-Aage Esbensen, and Gilbert Geis. 2007. Criminology: Explaining
Crime and Its Context. Newark: Anderson Publishing.
Bureau of Justice Statistics. 2006. Prison and Jail Inmates at Midyear 2005. Washington, D.C.:
U.S. Dept. of Justice, Office of Justice Programs, Bureau of Justice Statistics.
153
Bursik Jr., Robert J. 2006. "Rethinking the Chicago School of Criminology: A New Era of
Immigration." Pp. 20-35 in Immigration and Crime: Race, Ethnicity, and Violence, edited
by R. Martinez Jr. and A. Valenzuela Jr. New York: New York University Press.
Butcher, Kristin F. and Anne Morrison Piehl. 1998. "Recent Immigrants: Unexpected
Implications for Crime and Incarceration." Industrial and Labor Relations Review
51:654-679.
Butcher, Kristin F. and Anne Morrison Piehl. 1998. "Cross-City Evidence on the Relationship
between Immigration and Crime." Journal of Policy Analysis and Management 17:457-
493.
California Bureau of Criminal Information and Analysis. 1999-2001. Criminal Justice
Statistics. Sacramento, California.
Charles, Camille Zubrinsky. 2000. “Residential Segregation in Los Angeles.” In Prismatic
Metropolis: Inequality in Los Angeles, A Volume in the Multi-City Study of Urban
Inequality, edited by L. Bobo. New York: Russell Sage Foundation.
Clogg, Clifford C., Eva Petkova, and Adamantios Haritou. 1995. “Statistical Methods for
Comparing Regression Coefficients between Models.” American Journal of Sociology
100:1261-1293.
Coleman, James S. 1988. “Social Capital in the Creation of Human Capital.” American Journal
of Sociology 94:S95-S120.
Cullen, Francis T. and Robert Agnew. 2006. Criminological Theory: Past to Present. Los
Angeles: Roxbury.
Eitle, David and Tamela McNulty Eitle. 2003. “Segregation and School Violence.” Social
Forces 82:589-615.
154
Ellen, Ingrid Gould. 2000. Sharing America's Neighborhoods: The Prospects for Stable Racial
Integration. Cambridge, Mass.: Harvard University Press.
Federal Bureau of Investigation. 2006. Uniform Crime Reports in the United States,
2005. Washington, D.C.: United States Department of Justice, Federal Bureau of
Investigation.
Feldmeyer, Ben and Darrell Steffensmeier. Forthcoming. "Elder Crime: Patterns and Current
Trends, 1980-2003." Research on Aging 29:1-27.
Fischer, Claude S., Gretchen Stockmayer, Jon Stiles, and Michael Hout. 2004. “Distinguishing
the Geographic Levels and Social Dimensions of U.S. Metropolitan Segregation, 1960-
2000.” Demography 41:37-59.
González, Juan. 2000. Harvest of Empire: A History of Latinos in America. New York: Viking.
Gotham, Kevin Fox. 2002. “Beyond Invasion and Succession: School Segregation, Real Estate
Blockbusting, and the Political Economy of Neighborhood Racial Transition.” City &
Community 1:83-111.
Guo, Guang and Kathleen Mullan Harris. 2000. "The Mechanisms Mediating the Effects of
Poverty on Children's Intellectual Development." Demography 37:431-447.
Hagan, John and Alberto Palloni. 1999. "Sociological Criminology and the Mythology of
Hispanic Immigration and Crime." Social Problems 46:617-632.
Harer, Miles D. and Darrell Steffensmeier. 1992. "The Differing Effects of Economic
Inequality on Black and White Rates of Violence." Social Forces 70:1035-1054.
Harris, Anthony R. and James A. W. Shaw. 2000. "Looking for Patterns: Race, Class, and
Crime." Pp. 129-163 in Criminology: A Contemporary Handbook, edited by J. Sheley:
Wadsworth.
155
Healey, Joseph F. 2006. Race, Ethnicity, Gender, and Class: The Sociology of Group Conflict
and Change. Thousand Oaks, CA: Sage Publications.
Hindelang, Michael J. 1978. “Race and Involvement in Common Law Personal Crimes.”
American Sociological Review 43:93-109.
Hindelang, Michael J. 1981. “Variations in Sex-Race-Age-Specific Incidence Rates of
Offending.” American Sociological Review 46:461-474.
Horowitz, Carl F. 2001. "An Examination of U.S. Immigration Policy and Serious Crime."
Center for Immigration Studies, Washington, DC.
Johnston, Stephen J., Morsina Katimin, and William J. Milczarski. 1997. "Homeownership
Aspirations and Experiences: Immigrant Koreans and Dominicans in Northern Queens,
Ruback, R. Barry, Stacy N. Hoskins, Alison C. Cares, and Ben Feldmeyer. 2006. “Perception and
Payment of Economic Sanctions: A Survey of Offenders.” Federal Probation 70:26-31.
Feldmeyer, Ben and Darrell Steffensmeier. “Elder Crime: Patterns and Trends, 1980-2004.” Research on
Aging. (Forthcoming – July, 2007).
MANUSCRIPTS UNDER REVIEW
Feldmeyer, Ben and Jeffery T. Ulmer. “Racial Criminal Threat and Racial Power Threat: A Multi-Level
Analysis of Racial Threat in Federal Sentencing.” Social Problems. (Under Review)
Steffensmeier, Darrell, Jennifer Schwartz, and Ben Feldmeyer. “Gender and Violence: Trends in Adult Male and Female Violence, 1980-2004.” Social Forces. (Under Review)
HONORS AND AWARDS
2005 The Department of Sociology Excellence in Teaching Award 2005 Joan Huber and William Form Graduate Scholarship in Sociology
2006 Joan Huber and William Form Graduate Scholarship in Sociology
2006 Penn State College of the Liberal Arts Dissertation Support Grant 2006 Penn State Alumni Association Dissertation Award
2007 Second Place – 22nd
Annual Graduate Exhibition in Social and Behavioral Sciences
2007 Quantitative Methodology Certification – Department of Sociology and Crime, Law, and Justice, Penn State University