Page 1
8/3/2019 Radars for Detection and Tracking
http://slidepdf.com/reader/full/radars-for-detection-and-tracking 1/28
• STONE AND BANNER Radars for the Detection and Tracking of Ballistic Missiles, Satellites, and Planets
V O LU ME 12 , NU MBE R 2 , 2000 L INCO LN LA BORATO RY JO URNAL 217
Radars for the Detection and
Tracking of Ballistic Missiles,Satellites, and PlanetsMelvin L. Stone and Gerald P. Banner
s This article is an overview of the forty-plus years in which Lincoln
Laboratory has been developing and applying radar techniques for the long-
range detection and tracking of ballistic missiles, satellites, and planets. Thiseffort has included the development and use of several large radar systems:
the AN/FPS-17 radar in Turkey, the Millstone and Haystack radars inMassachusetts, and the Ballistic Missile Early Warning System (BMEWS). The
Millstone and Haystack radars have been used to make significant contributions
to space science and deep-space satellite tracking. The availability of high-power
radars has spurred their application in ionospheric and radar-astronomy studies.
The processing techniques developed in support of the astronomical mapping of
the Moon and planets provided the foundation for subsequent radar imaging of
objects in space. We highlight the radar technology involved and discuss the use
of these systems and their legacy.
T in this article
were developed in direct response to signifi-
cant threats to U.S. national security. These
threats included the development of nuclear-armed
intercontinental ballistic missiles (ICBMs) and the
launching of military satellites in near-earth and, sub-sequently, deep-space orbits. The complexity and ur-
gency of each threat required a quick response utiliz-
ing and extending state-of-the-art radar capabilities.
Lincoln Laboratory’s successful efforts to develop
these radars yielded vital information about the
threats. The radars left a legacy of surveillance capa-bility that is still benefiting the United States today.
Radar-based studies in astronomy and the ionosphere
that utilized this surveillance capability continue to
be relevant to science and defense applications.
In the early 1950s, Lincoln Laboratory was devel-
oping the Semi-Automatic Ground Environment sys-tem (SAGE) in response to the long-range bomber
threat from the Soviet Union [1]. Significant ad-
vances had been made in all three of the primary SAGE components: radars, computers, and commu-
nications. By the mid-1950s, the prospect of the So-
viet Union using ICBMs as well as long-range bomb-
ers to deliver thermonuclear warheads became real.
The United States needed to confirm the existence of the Soviet ICBM program and monitor its missile
tests, which led to the development of the AN/FPS-
17 radar. When the missile threat potential had been
established, the Ballistic Missile Early Warning Sys-
tem (BMEWS) was developed to warn the United
States of a missile attack [2]. Two kinds of UHF ra-dars (surveillance and tracking) comprised the origi-
nal BMEWS system.
A developmental model of a long-range UHF
tracking radar was installed at Millstone Hill in West-
ford, Massachusetts, to demonstrate the feasibility of
advanced Doppler processing, high-power systemcomponents, and computerized tracking needed for
BMEWS. An adjunct high-power UHF test facility
Page 2
8/3/2019 Radars for Detection and Tracking
http://slidepdf.com/reader/full/radars-for-detection-and-tracking 2/28
• STONE AND BANNER Radars for the Detection and Tracking of Ballistic Missiles, Satellites and Planets
218L INCOL N LA BORATO RY J OU RNA L V O LU ME 12, NUMBER 2, 2000
employed the Millstone transmitter to stress-test the
components that were candidates for the operationalBMEWS.
The Millstone radar observed missiles fired from
Cape Canaveral, Florida, as well as early satellites, andperformed pioneering experiments in ionospheric
physics and lunar and planetary detection. In the
early 1960s, the Millstone radar was converted from aUHF to an L-band system. Both incarnations of the
radar proved valuable in defense and scientific appli-
cations. Anticipating the need for a high-power facil-
ity for communications and space surveillance, the
Air Force in the 1960s sponsored the development of
Haystack, a versatile facility in Tyngsboro, Massachu-setts, that supports radar- and radio-astronomy re-
search and the national need for deep-space surveil-lance. By the 1970s the Soviets employed deep-space
satellite orbits for military use. In response, Lincoln
Laboratory applied real-time coherent integration to
the detection and tracking of deep-space satellites.The Millstone and Haystack radars continue to oper-
ate in the twenty-first century, supporting national
space surveillance and scientific missions.
Observation of Soviet ICBM Tests with the AN/FPS-17 Radar
The prospect of a Soviet ICBM raised the possibility of nuclear weapons descending on the United States
without warning or defense. This possibility consti-
tuted a critical threat to the United States in the mid-
1950s and exposed the urgent need to confirm the
existence of a Soviet ICBM test program, characterizeits capabilities, and monitor its development. Will-
iam M. Siebert, leading analyses at Lincoln Labora-
tory from 1954 to 1955, established the possibility
that high-power radars could be built to fill this
need—and, in fact, were the only feasible technology
that could be applied [3]. The result was the expe-dited construction of the AN/FPS-17 radar in
Pirinclik (originally Diyarbakir), Turkey, chosen be-
cause of its proximity to the ballistic missile launch
test site at Kapustin Yar in the Soviet Union. Figure 1
shows an artist’s conception of the AN/FPS-17 radar
facility. The radar was built under Air Force sponsor-ship with General Electric Company (GE) as primary
contractor and, in a highly unusual arrangement due
to the urgency of the need, Lincoln Laboratory as a
subcontractor to GE. Although many of the fundamental concepts used
to build air-defense radars applied to the detection
and tracking of ballistic missiles, there were signifi-cant technical challenges to building a radar for this
task. The radar would be hundreds of kilometers
from the launch site and would need to observe rock-ets in flight that were additional hundreds of kilome-
ters away in range. The small target size and the long
ranges to the targets required great sensitivity, thereby
driving the need for high-power transmitters, a large
antenna, and long pulses to maximize average power.
However, the use of long continuous-wave (CW)pulses yielded poor range resolution, limiting the ac-
curate characterization of any observed missile tests. A significant contribution by Lincoln Laboratory was
the conceptualization and first-ever implementation
of a receiver-exciter system that used a phase-coded
pulse-compression system to increase the range reso-lution by a factor of 100 while still using long pulses
for maximum energy on target and accurate measure-
ments of the range rate.
The radar was designed around the existing high-
power VHF transmitters being produced by GE for
domestic television transmission. The tubes used had
a center frequency of 198 MHz with a peak power of 1.5 MW. They were operated with 2-msec pulses at a
50-Hz pulse-repetition frequency (PRF), yielding an
average power of 150 kW.
The system was designed with a very large antenna
to maximize the radar detection range. The resultingantenna reflector was a portion of a paraboloid of
revolution almost half an acre in size (175 ft high by
110 ft wide). Lincoln Laboratory designed and di-
rected the construction of the antenna system. The
feed consisted of two horizontal rows of feedhorns
that formed a pair of azimuth-scanned beams (eachscan was approximately 15° wide) at two elevation
angles. Lincoln Laboratory also developed a high-
power rotary radio-frequency (RF) switch for time-
sharing a single transmitter among the feedhorns for
continuous azimuth-sector scanning. This switch was
an original implementation of a switch in which a
noncontacting blade is rotated past a series of output
couplers connected to the feedhorns. The phase-
Page 3
8/3/2019 Radars for Detection and Tracking
http://slidepdf.com/reader/full/radars-for-detection-and-tracking 3/28
Page 4
8/3/2019 Radars for Detection and Tracking
http://slidepdf.com/reader/full/radars-for-detection-and-tracking 4/28
• STONE AND BANNER Radars for the Detection and Tracking of Ballistic Missiles, Satellites and Planets
220L INCOL N LA BORATO RY J OU RNA L V O LU ME 12, NUMBER 2, 2000
recorded. The data-reduction process was manual and
cumbersome, but also relatively straightforward.The successful completion of the AN/FPS-17 in
early 1956, fifteen months after the start of the
project, remains a remarkable technical achievementthat reflects the heroic efforts of dedicated engineers
and scientists. The development and implementation
of a pulse-compression system contributed signifi-cantly to the success of the project.
In 1988, C.E. Cook (Sperry Gyroscope Co.) and
Siebert (MIT) shared the IEEE Aerospace and Elec-
tronic Systems Society’s Pioneer Award for their con-
tributions to the development of pulse-compression
techniques for radar signal processing [6]. Phase-coded pulse compression has been widely used in
planetary astronomy and for communications withspace probes at solar-system ranges.
The Turkey site was the first radar built for track-
ing at ranges greater than 1000 km, and it gathered
much valuable data. Other units were constructed by GE in Texas for observing domestic test flights over
the White Sands Missile Range, New Mexico, and
Shemya, Alaska, to observe the later stages of Soviet
ICBM tests.
The Ballistic Missile Early Warning System
While the AN/FPS-17 was being constructed to con-firm and characterize Soviet ICBM capabilities, the
development of a system for reliable, timely warning
of ICBM attacks against the United States became an
important national priority as a vital link in the Cold
War concept of mutually assured destruction. Lin-coln Laboratory played a major role in the design and
development of the Ballistic Missile Early Warning
System (BMEWS), which provided the necessary
warning time for counterstrike action to be launched.
For the interesting story behind one high-level threat
warning issued by BMEWS, see the sidebar entitled“False Alarm!”
As a result of both experimental and systems stud-
ies [7], Lincoln Laboratory recommended the basic
BMEWS configuration that was adopted by the Air
Force. It consisted of three operational sites in Thule,
Greenland; Clear, Alaska; and Fylingdales Moor,United Kingdom, with two basic types of radars—
surveillance/detection radars scanning in azimuth at
two fixed elevation angles and pencil-beam tracking
radars—as well as real-time data communications tothe North American Air Defense Command
(NORAD) in Colorado Springs, Colorado. Figure 2
shows three AN/FPS-50 BMEWS surveillance radarsin Clear, Alaska. System requirements included long-
range detection of missiles out to 4800-km range to
provide warning, target-threat characterization, accu-rate tracking for impact-point estimation, and com-
munications to inform the command center for for-
mulating counterstrike decisions.
The surveillance radar operated at UHF (440
MHz) and included a parabolic-torus antenna with
an organ-pipe-scanner feed, a high-power transmit-ter, a receiver with a Doppler filter bank, a data-pro-
cessing computer bank, and a communications inter-face. The prototype for the radar, designated the AN/
FPS-50, was built by GE in Trinidad, where it was
used to support missile tests launched from the U.S.
Atlantic Missile Range in Cape Canaveral. LincolnLaboratory’s contributions were significant. They in-
cluded the design and development of the high-
power organ-pipe feed (using a rotating horn to illu-
minate a sequence of feeds on the focal arc of the
torus) [8], Doppler filter banks, algorithms for target-
threat characterization, and the specification and test-
ing of many other radar components.The pencil-beam tracking-radar component of the
BMEWS also operated at UHF. Lincoln Laboratory
FIGURE 2. Three Ballistic Missile Early Warning System
(BMEWS) AN/FPS-50 surveillance radars at Clear, Alaska.
The parabolic-torus antenna reflector of an AN/FPS-50
radar was approximately the size of a football field.
Page 5
8/3/2019 Radars for Detection and Tracking
http://slidepdf.com/reader/full/radars-for-detection-and-tracking 5/28
• STONE AND BANNER Radars for the Detection and Tracking of Ballistic Missiles, Satellites, and Planets
V O LU ME 12 , NU MBE R 2 , 2000 L INCO LN LA BORATO RY JO URNAL 221
successfully developed the required technology and it was demonstrated at the Laboratory’s Millstone Hill
radar facility. The Millstone radar served as a develop-
ment model for RCA’s AN/FPS-49, AN/FPS-49A,
and AN/FPS-92 radars, all of which were used in the
BMEWS. The first site at Thule, Greenland, became
operational in 1960 with four AN/FPS-50 surveil-lance radars, all powered by big UHF klystrons. An
AN/FPS-49 tracker was added later.
The installation stretched for over 1.4 mi and used
over 10 miles of 21-in-wide waveguide. The second
site, at Fylingdales Moor, United Kingdom, had three
AN/FPS-49A trackers to provide intermediate-range-missile warning for the United Kingdom and long-
range-missile warning for North America. The third
site at Clear, Alaska, had three AN/FPS-50s and an AN/FPS-92. The twelve large UHF radars of the
original BMEWS performed their critical missile-
warning functions as well as satellite-surveillance and
tracking functions with extremely high reliability for
close to thirty years. In time it became possible to re-
place them with UHF solid-state phased-array radars.The first of these new radars came online at the Thule
BMEWS site in 1987; the last came online at Clear in
2001. These new radars use the same transmit/receive
modules and array-element design as the four UHF
Precision Acquisition of Vehicle Entry Phased Array
Warning System (PAVE PAWS) radars (AN/FPS-115, later AN/FPS-123) that were built within the
continental United States to provide warning of sub-
Early Warning System (BMEWS) per-
formed well for over three de-
cades. However, during the Initial
Operating Capability (IOC)
phase in the fall of 1960, it gener-
ated a high-level threat warningreport that was an incident of
great concern to the Defense
Command Staff.
On 6 September 1960, theThule, Greenland, BMEWS site
began generating warning reportsat the lowest threat level that rap-
idly escalated up to the maximum
level. It automatically sent a series
of messages warning of an im-
pending missile attack to the
North American Air DefenseCommand (NORAD) in Colo-
rado Springs, Colorado. Before
alerts could be sent to the Presi-dent and dispatched to the Strate-
F A L S E A L A R M !
gic Air Command bombers, thealerts had to be validated by means
of a direct telephone conversation
between Command Center per-
sonnel and the radar site. An Air
Force captain at the site asked for
time to perform a check on theradar because he believed it was
malfunctioning. He temporarily
turned off the transmitter in the
sector that was generating thealarms and noted that the echoes
ceased. He correctly inferred thatthe echoes were caused by reflec-
tions from the Moon; a hostile
missile threat did not exist. The
great power and aperture of the
BMEWS radar allowed it to detect
reflections from the Moon, which was 384,400 km away.
In December 1960, a Lincoln
Laboratory team was sent toThule to investigate a number of
issues related to the IOC, includ-ing the Moon echoes. The
BMEWS contractor, Radio Cor-
poration of America, had pro-
posed a low-perigee test that
eliminated most but not all of the
false-alarm conditions attributedto Moon echoes. A member of the
Lincoln Laboratory team recog-
nized that simply changing the
operating frequency of the radarabout every two seconds (less
than the round-trip Earth-Moontravel time) could uncondition-
ally eliminate the Moon echoes.
This recommendation was pre-
sented to the Commander of the
North American Air Defense
Command on 20 January 1961and implemented in the radar in
conjunction with other improve-
ments. The Moon ceased to be asource of false alarms.
Page 6
8/3/2019 Radars for Detection and Tracking
http://slidepdf.com/reader/full/radars-for-detection-and-tracking 6/28
• STONE AND BANNER Radars for the Detection and Tracking of Ballistic Missiles, Satellites and Planets
222L INCOL N LA BORATO RY J OU RNA L V O LU ME 12, NUMBER 2, 2000
marine-launched ballistic missiles. The upgraded
BMEWS remains an important component of our
national security system.
The Millstone Hill UHF and L-Band Radars
In 1956, even before the BMEWS design concept was completed, the Laboratory began construction of
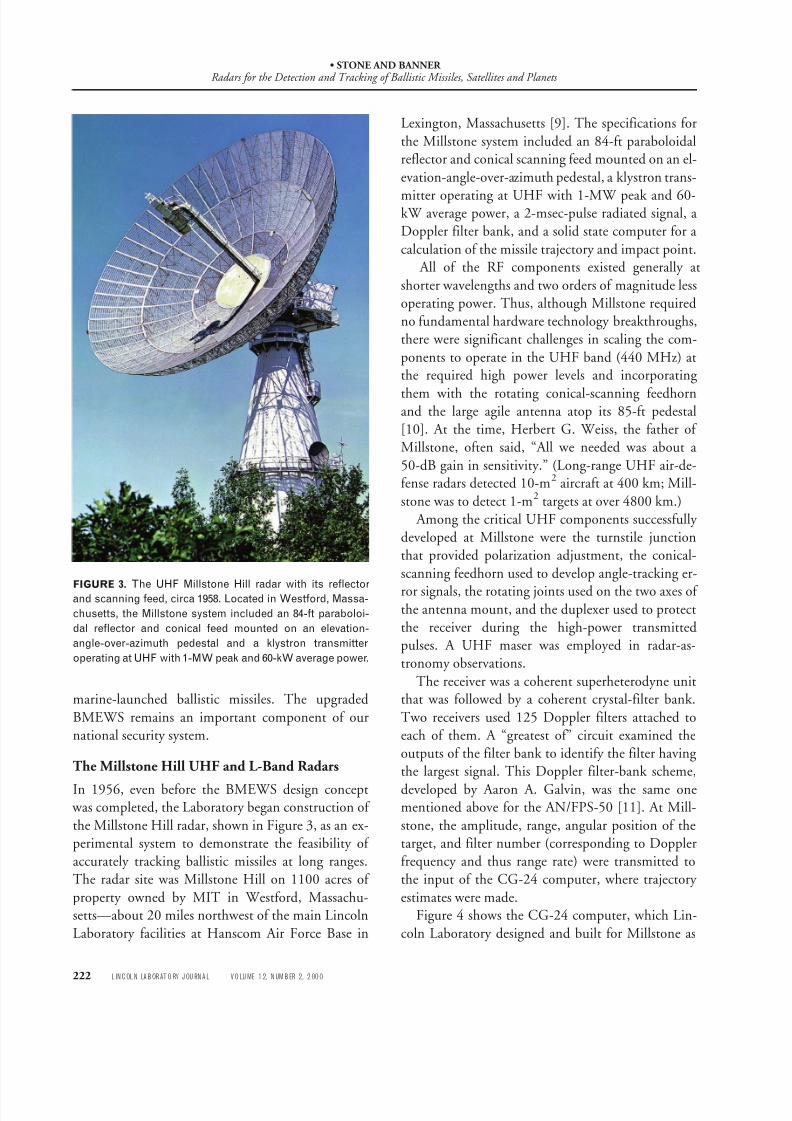
the Millstone Hill radar, shown in Figure 3, as an ex-
perimental system to demonstrate the feasibility of
accurately tracking ballistic missiles at long ranges.
The radar site was Millstone Hill on 1100 acres of
property owned by MIT in Westford, Massachu-setts—about 20 miles northwest of the main Lincoln
Laboratory facilities at Hanscom Air Force Base in
Lexington, Massachusetts [9]. The specifications for
the Millstone system included an 84-ft paraboloidalreflector and conical scanning feed mounted on an el-
evation-angle-over-azimuth pedestal, a klystron trans-
mitter operating at UHF with 1-MW peak and 60-kW average power, a 2-msec-pulse radiated signal, a
Doppler filter bank, and a solid state computer for a
calculation of the missile trajectory and impact point. All of the RF components existed generally at
shorter wavelengths and two orders of magnitude less
operating power. Thus, although Millstone required
no fundamental hardware technology breakthroughs,
there were significant challenges in scaling the com-
ponents to operate in the UHF band (440 MHz) atthe required high power levels and incorporating
them with the rotating conical-scanning feedhornand the large agile antenna atop its 85-ft pedestal
[10]. At the time, Herbert G. Weiss, the father of
Millstone, often said, “All we needed was about a
50-dB gain in sensitivity.” (Long-range UHF air-de-fense radars detected 10-m2 aircraft at 400 km; Mill-
stone was to detect 1-m2 targets at over 4800 km.)
Among the critical UHF components successfully
developed at Millstone were the turnstile junction
that provided polarization adjustment, the conical-
scanning feedhorn used to develop angle-tracking er-
ror signals, the rotating joints used on the two axes of the antenna mount, and the duplexer used to protect
the receiver during the high-power transmitted
pulses. A UHF maser was employed in radar-as-
tronomy observations.
The receiver was a coherent superheterodyne unitthat was followed by a coherent crystal-filter bank.
Two receivers used 125 Doppler filters attached to
each of them. A “greatest of” circuit examined the
outputs of the filter bank to identify the filter having
the largest signal. This Doppler filter-bank scheme,
developed by Aaron A. Galvin, was the same onementioned above for the AN/FPS-50 [11]. At Mill-
stone, the amplitude, range, angular position of the
target, and filter number (corresponding to Doppler
frequency and thus range rate) were transmitted to
the input of the CG-24 computer, where trajectory
estimates were made.Figure 4 shows the CG-24 computer, which Lin-
coln Laboratory designed and built for Millstone as
FIGURE 3. The UHF Millstone Hill radar with its reflectorand scanning feed, circa 1958. Located in Westford, Massa-
chusetts, the Millstone system included an 84-ft paraboloi-
dal reflector and conical feed mounted on an elevation-
angle-over-azimuth pedestal and a klystron transmitter
operating at UHF with 1-MW peak and 60-kW average power.
Page 7
8/3/2019 Radars for Detection and Tracking
http://slidepdf.com/reader/full/radars-for-detection-and-tracking 7/28
• STONE AND BANNER Radars for the Detection and Tracking of Ballistic Missiles, Satellites, and Planets
V O LU ME 12 , NU MBE R 2 , 2000 L INCO LN LA BORATO RY JO URNAL 223
the first entirely solid state computer used for real-
time processing of radar data [12]. It was installed atthe radar in 1958 for radar tracking. The CG-24
computer was a major factor in the development of
digital data-processing techniques that were funda-
mental in the evolution of modern radars. The CG-
24 was dedicated to the tasks of real-time control of
the antenna and calculation of the trajectories and
impact points of threat missiles.In the absence of threat missiles, the radar and
computer were tested against rocket launches from
Cape Canaveral. In an original work, Irwin I. Shapiro
developed the theory for predicting ballistic missile
trajectories from radar observations [13].The Millstone radar successfully demonstrated the
feasibility of detecting ballistic missiles at a range of a
few thousand kilometers [9, 14]. This achievement
helped advance the construction of the BMEWS,
with Millstone as the model for the radars installed in
Thule (AN/FPS-49), Clear (AN/FPS-92), andFylingdales Moor (AN/FPS-49A). As mentioned
above, the transmitter, receiver, and Doppler filter
bank of the BMEWS surveillance radar were pat-
terned after their Millstone counterparts. (An IBM
commercial solid state computer was used for the
post-detection processing.) Millstone also was themodel for a radar built for NASA at Wallops Island,
Virginia. Full-scale models of Millstone were installed
FIGURE 4. Original Millstone site CG-24 computer, circa
1960. All functions performed by the CG-24, which took up
an entire room, could now be performed by one of today’s
desktop computers.
at the Air Force downrange tracking station in
Trinidad and the Prince Albert Radar Laboratory inSaskatchewan, Canada.
The Trinidad radar supported the Atlantic Missile
Range testing and, in the 1960s, provided an opera-tional warning capability for detecting submarine-
launched missiles in the Caribbean. The Prince
Albert Radar Laboratory system, shown in Figure 5, was employed by the Canadian Defence Research Es-
tablishment for study of the aurora and the develop-
ment of satellite-tracking techniques.
Another major contribution by Lincoln Labora-
tory was the use of Millstone to develop a fundamen-
tal understanding of several important environmentalchallenges facing the BMEWS. These challenges in-
cluded the measurement of UHF propagation effectsin the ionosphere, the impact of refraction close to
the horizon, the effect of Faraday rotation on polar-
ization, and the impact of backscatter from meteors
and the aurora on the detection performance of theradar and its false-alarm rate [15–17]. The Labora-
tory also developed algorithms for use in processing
BMEWS data to provide the requisite warning of an
impending missile attack.
FIGURE 5. Prince Albert Radar Laboratory, Saskatchewan,
Canada. The radar is a twin of the UHF Millstone radar
shown in Figure 3. During the dedication ceremony on 6
June 1959, President Eisenhower made the first communica-
tion between heads of state by using a passive satellite re-
flector, the Moon, when he greeted Canadian Prime Minister
Diefenbaker via a prerecorded message. The Millstone radar
site, equipped with a single-sideband transmitter, broadcast
the message.
Page 8
8/3/2019 Radars for Detection and Tracking
http://slidepdf.com/reader/full/radars-for-detection-and-tracking 8/28
• STONE AND BANNER Radars for the Detection and Tracking of Ballistic Missiles, Satellites and Planets
224L INCOL N LA BORATO RY J OU RNA L V O LU ME 12, NUMBER 2, 2000
1977, a 150-ft, fully steerable antenna was installed to
study horizontal motion in the ionosphere [19]. Bothof these antennas are shown in Figure 7.
In September 1994 the 104-in-diameter azimuth
bearing atop the Millstone radar’s antenna pedestalfailed for the first time since it had been erected in
1957. A spare bearing was on hand, but the radar was
to be out of commission for six weeks to replace thebearing. To cover this gap in radar support to the U.S.
Space Command, a descendant of the original Mill-
stone UHF transmitter and the nearby 150-ft-diam-
eter steerable antenna were partially diverted from
their scientific tasks and brought into service for satel-
lite tracking. The UHF radar’s antenna was less accu-rate in angle than that of the L-band Millstone, but
the stopgap radar made a useful contribution.The conversion of Millstone to L-band repre-
sented several significant advances in radar technol-
ogy [20]. (The original antenna was removed and
shipped to Pirinclik, Turkey, where it was used as partof the UHF system there for over twenty years.) A
new paraboloidal antenna with a finer mesh matched
to the shorter L-band wavelength was placed atop the
FIGURE 6. Detection in 1957 by Millstone UHF radar of the
first Soviet satellite, Sputnik I. The display shows amplitudeversus range of the transmitted pulse and the echo.
FIGURE 7. UHF antennas for ionospheric measurements at
Millstone Hill. The fixed 220-ft zenith-pointing antenna (left)
was installed in 1963 and the steerable 150-ft-diameter an-
tenna (right) was installed in 1977.
Even before its completion—with the high-power
transmitter, conical-scan tracking system, and CG-24not yet fully developed—Millstone was used in an
unexpected way when the Soviet Union surprised the
world by launching Sputnik I on 4 October 1957. By
the next day, Millstone had successfully detected
Sputnik I [18]. Figure 6 shows the first detection of an
artificial Earth satellite by active radar. Many sites de-
tected the radiated signal from Sputnik I , but theMillstone activity was unique because it transmitted
RF signals from the transmitter-driver stage and de-
tected the energy reflected from the satellite back to
the radar. The receive signals were displayed on an A-
scope. Thus both the space age and the U.S. space-surveillance system were born.
The Millstone UHF system was completed in
1958. Since the early 1960s, the tracking of satellites
has been Millstone’s primary role in supporting de-
fense interests. In 1960, its peak power was increased
from 1 MW to 2.5 MW (with a corresponding in-crease in average power to 150 kW). By 1962, the
BMEWS was complete and the Millstone radar was
reconfigured to operate at its present L-band (1295
MHz) frequency.
John V. Evans continued to use the original UHF
system for ionospheric and upper-atmosphere stud-ies. A 220-ft zenith-pointing antenna was installed in
1963 to support vertical sounding measurements. In
Page 9
8/3/2019 Radars for Detection and Tracking
http://slidepdf.com/reader/full/radars-for-detection-and-tracking 9/28
• STONE AND BANNER Radars for the Detection and Tracking of Ballistic Missiles, Satellites, and Planets
V O LU ME 12 , NU MBE R 2 , 2000 L INCO LN LA BORATO RY JO URNAL 225
85-ft pedestal. The new system employed a Casse-
grainian feed in place of the rotating conical-scan feedused at UHF. A two-tube klystron transmitter system
provided over 3 MW of peak power and 120 kW of
average power. Nominal operating parameters in-cluded a 1-msec pulse and a 40-Hz PRF. The maxi-
mum bandwidth was 8 MHz, yielding a range resolu-
tion of approximately 30 m. The transmitted wave was right-hand circularly polarized. For reception,
both the principal (left circular) and orthogonal
(right circular) channels were processed as well as the
two angle-error channels. The unique features of the
Millstone L-band radar included parametric-ampli-
fier receivers (since replaced by low-noise solid stateamplifiers), a set of L-band “pancake” low-power ro-
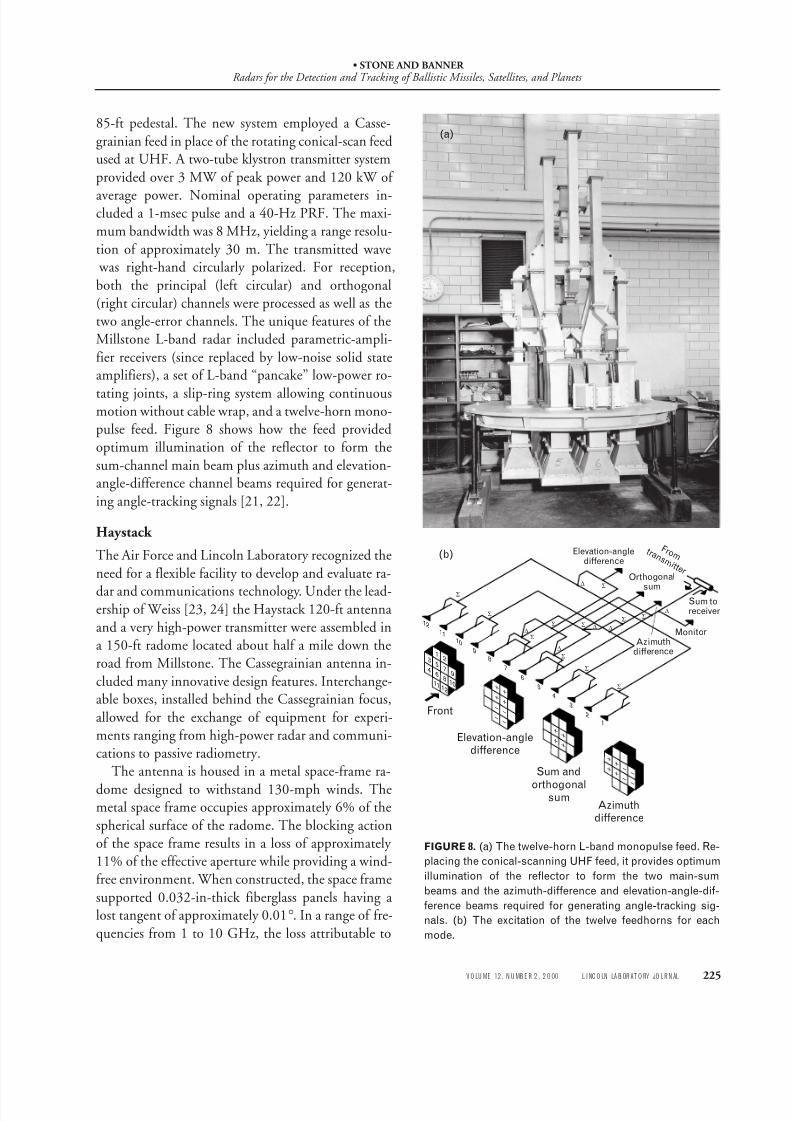
tating joints, a slip-ring system allowing continuousmotion without cable wrap, and a twelve-horn mono-
pulse feed. Figure 8 shows how the feed provided
optimum illumination of the reflector to form the
sum-channel main beam plus azimuth and elevation-angle-difference channel beams required for generat-
ing angle-tracking signals [21, 22].
Haystack
The Air Force and Lincoln Laboratory recognized the
need for a flexible facility to develop and evaluate ra-
dar and communications technology. Under the lead-ership of Weiss [23, 24] the Haystack 120-ft antenna
and a very high-power transmitter were assembled in
a 150-ft radome located about half a mile down the
road from Millstone. The Cassegrainian antenna in-
cluded many innovative design features. Interchange-able boxes, installed behind the Cassegrainian focus,
allowed for the exchange of equipment for experi-
ments ranging from high-power radar and communi-
cations to passive radiometry.
The antenna is housed in a metal space-frame ra-
dome designed to withstand 130-mph winds. Themetal space frame occupies approximately 6% of the
spherical surface of the radome. The blocking action
of the space frame results in a loss of approximately
11% of the effective aperture while providing a wind-
free environment. When constructed, the space frame
supported 0.032-in-thick fiberglass panels having alost tangent of approximately 0.01°. In a range of fre-
quencies from 1 to 10 GHz, the loss attributable to
FIGURE 8. (a) The twelve-horn L-band monopulse feed. Re-
placing the conical-scanning UHF feed, it provides optimum
illumination of the reflector to form the two main-sum
beams and the azimuth-difference and elevation-angle-dif-
ference beams required for generating angle-tracking sig-
nals. (b) The excitation of the twelve feedhorns for each
mode.
1
1
2
3
4
5
6
7
8
9
10
11
12
25
3
49
10
76
8
1211
++
++
++
++
++
++
–
–
–
–
–
–
–
–
Front
Σ
Σ
Σ
Σ
Σ
ΣΣ
Σ Σ
Σ
Σ
∆
∆∆
∆
∆
∆
Elevation-angledifference
Sum and
orthogonalsum
Azimuthdifference
Elevation-angledifference
Orthogonal
sum
Azimuthdifference
Sum to
receiver
Monitor
F r o m t r a n s m i t t e r
(b)
(a)
Page 10
8/3/2019 Radars for Detection and Tracking
http://slidepdf.com/reader/full/radars-for-detection-and-tracking 10/28
• STONE AND BANNER Radars for the Detection and Tracking of Ballistic Missiles, Satellites and Planets
226L INCOL N LA BORATO RY J OU RNA L V O LU ME 12, NUMBER 2, 2000
the space frame is 1.1 dB. The dielectric constant of the panels is approximately 4, resulting in an increas-
ing reflection at frequencies above 8 GHz. As origi-
nally designed the radome provided a useful capabil-
ity for frequencies up to 15 GHz.
Mechanically, the antenna represented a tour de force in structural design and analysis, state-of-the-art
manufacture of precision structures, surface align-ment, contour determination [25], and drive system
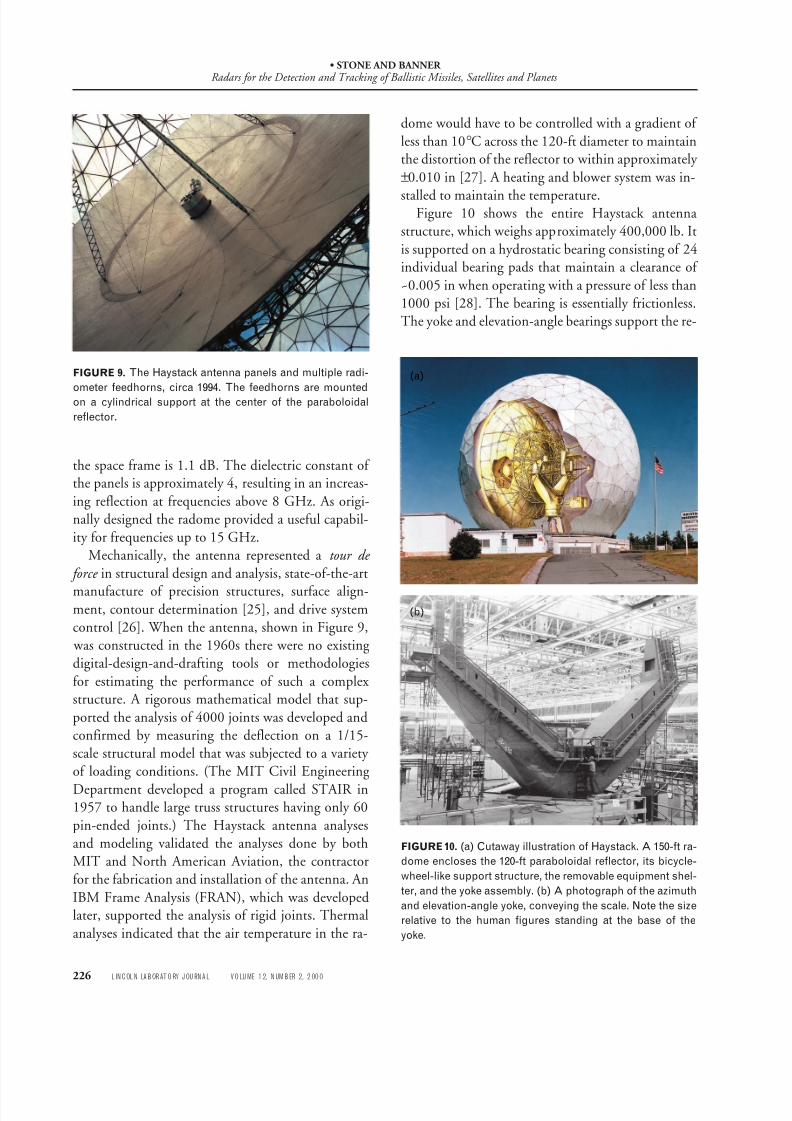
control [26]. When the antenna, shown in Figure 9,
was constructed in the 1960s there were no existing
digital-design-and-drafting tools or methodologies
for estimating the performance of such a complexstructure. A rigorous mathematical model that sup-
ported the analysis of 4000 joints was developed and
confirmed by measuring the deflection on a 1/15-
scale structural model that was subjected to a variety
of loading conditions. (The MIT Civil Engineering
Department developed a program called STAIR in1957 to handle large truss structures having only 60
pin-ended joints.) The Haystack antenna analyses
and modeling validated the analyses done by both
MIT and North American Aviation, the contractor
for the fabrication and installation of the antenna. An
IBM Frame Analysis (FRAN), which was developedlater, supported the analysis of rigid joints. Thermal
analyses indicated that the air temperature in the ra-
dome would have to be controlled with a gradient of
less than 10°C across the 120-ft diameter to maintainthe distortion of the reflector to within approximately
±0.010 in [27]. A heating and blower system was in-
stalled to maintain the temperature.Figure 10 shows the entire Haystack antenna
structure, which weighs approximately 400,000 lb. It
is supported on a hydrostatic bearing consisting of 24individual bearing pads that maintain a clearance of
~0.005 in when operating with a pressure of less than
1000 psi [28]. The bearing is essentially frictionless.
The yoke and elevation-angle bearings support the re-
FIGURE 9. The Haystack antenna panels and multiple radi-
ometer feedhorns, circa 1994. The feedhorns are mountedon a cylindrical support at the center of the paraboloidal
reflector.
FIGURE 10. (a) Cutaway illustration of Haystack. A 150-ft ra-
dome encloses the 120-ft paraboloidal reflector, its bicycle-
wheel-like support structure, the removable equipment shel-
ter, and the yoke assembly. (b) A photograph of the azimuth
and elevation-angle yoke, conveying the scale. Note the size
relative to the human figures standing at the base of the
yoke.
(b)
(a)
Page 11
8/3/2019 Radars for Detection and Tracking
http://slidepdf.com/reader/full/radars-for-detection-and-tracking 11/28
• STONE AND BANNER Radars for the Detection and Tracking of Ballistic Missiles, Satellites, and Planets
V O LU ME 12 , NU MBE R 2 , 2000 L INCO LN LA BORATO RY JO URNAL 227
flector and back structure of the antenna as well as the
interchangeable equipment shelter. Ninety-six shapedpanels manufactured with a root-mean-square (rms)
surface tolerance of 0.010 in are attached to a 60-ft-
diameter splice ring and supported from a bicycle- wheel-like structure. The antenna was designed to
point to and track both nearby satellites and the posi-
tions of celestial objects. A then state-of-the-art com-puter-controlled hydraulic servo system drove the an-
tenna. A 30-bit computer provided the requisite
accuracy for tracking astronomical objects.
The 120-ft reflector was specified to have a surface
tolerance of 0.075 in to meet the original design goal
for operation at 10 GHz. Owing to the existence of the rigid, complex backup structure, a gravity-com-
pensating counterweight, a manual set of adjust-ments, and a novel statistically based rigging tech-
nique, the reflector was readjusted to operate at 15
GHz about two years after it was initially installed.
A six-year effort, started in 1986, resulted in theupgrading of the Haystack radio telescope for astro-
nomical operation at 85-to-115 GHz. The National
Science Foundation supported the upgrading pro-
gram that was performed by the Northeast Radio Ob-
servatory Corporation (NEROC) and the Haystack
Observatory staff and its supporting contractors. Ri-
chard P. Ingalls led a team of sixteen scientists and en-gineers in implementing major enhancements to the
120-ft reflector, the hyperboloidal subreflector, the
thermal compensation of the back structure and ra-
dome, and the technique for mapping surface devia-
tions [29]. The upgrade took place in two stages: thefirst three-year effort increased the system’s aperture
efficiency to 25% at 35 GHz; the next three years ex-
tended the frequency coverage to the 85-to-115-GHz
range. The first phase comprised the installation of
new membrane material on the radome, the upgrad-
ing of the thermal control of the entire surface, and areadjustment of the surface of the paraboloidal reflec-
tor to attain a 0.020-in (450-µ m) rms tolerance. At-
taining the second-phase goal required further im-
proving the thermal compensation, adjusting the
paraboloidal surface to a 0.010-in (210-µ m) rms tol-
erance, and installing a deformable subreflector [30,31].
One of the major limitations of extending the op-
erating frequency range of the Haystack antenna was
the existing thermal lag of a 60-ft-diameter splice ringthat interconnected the inner and outer sets of the
30-ft-radial-length panels. A bidirectional thermo-
electrical control system was installed on the spliceplate to cause its temperature to track that of its
neighboring panels. In addition, electric heating and
chilled-water cooling were used to quickly adjust thetemperature when the antenna changed elevation-
angle position rapidly.
Extensive finite-element analyses were made of all
the components of the Haystack antenna. A finite-
element model of the paraboloidal surface was con-
structed to facilitate the setting, both statically anddynamically, of the many adjustments of the primary
and secondary reflector surfaces.Measurements of the 120-ft paraboloid were per-
formed by microwave holography employing Very
Long Baseline Interferometry (VLBI) techniques.
The Haystack antenna and a reference antenna re-ceived signals from a geostationary communications
satellite operating in the 12-GHz band. They were
correlated by the Haystack VLBI processor operating
in a real-time mode. These measurements involved a
comprehensive elimination of the effects of the space-
frame radome that both blocks and diffracts the satel-
lite signals, causing distortions of the mapping of thesurface of the antenna. The process mapped the pa-
raboloidal surface with an estimated accuracy of 100
µ m in equivalent surface deviation [32].
A precision thermal-control system was added for
compensation of the gravitational deformation of thereflector. Because not all of the deformation could be
compensated thermally, a deformable, fiber-rein-
forced plastic hyperboloidal subreflector was devel-
oped to correct for gravity and astigmatic deforma-
tions of the back structure of the 120-ft reflector.
The upgrading program achieved its objectives of a17-arcsec beamwidth (8.24 µ rad) and 15% efficiency
at 115 GHz. Blind pointing of the antenna within 4
arcsec and tracking within 2 arcsec was realized.
In addition to the antenna system, high-power ra-
dar components were also improved. In the 1960s the
development of a system for use in planetary as-tronomy [33] significantly advanced the state of the
art of X-band high-power technology. A number of
Page 12
8/3/2019 Radars for Detection and Tracking
http://slidepdf.com/reader/full/radars-for-detection-and-tracking 12/28
• STONE AND BANNER Radars for the Detection and Tracking of Ballistic Missiles, Satellites and Planets
228L INCOL N LA BORATO RY J OU RNA L V O LU ME 12, NUMBER 2, 2000
firsts were achieved, including the development of a
500-kW CW transmitter with its associated high-power waveguide components, an ephemeris-con-
trolled frequency and range-tracking system, a he-
lium-cooled maser receiver preamplifier, and a digitalmonitoring system to prevent damage of the high-
power components. For lunar measurements the sys-
tem was equipped with a pulse modulator and appro-priate transmit/receive switch to accommodate the
~2-sec radar transit time.
A wideband radar system known as the Haystack
Long Range Imaging Radar (LRIR) was assembled in
1977 to support the observation of satellites. That ra-
dar continues to operate to this day. (For more infor-mation on this topic, see the article entitled “Wide-
band Radar for Ballistic Missile Defense andRange-Doppler Imaging of Satellites,” by William W.
Camp et al., in this issue.)
In the early 1990s, increased interest in the
wideband imaging capability of Haystack led to thedevelopment of the Haystack Auxiliary Radar
(HAX). By utilizing a 2-GHz bandwidth centered at
16.667 GHz and a refurbished 40-ft antenna, HAX
was able to share much of the signal and data-process-
ing systems of the LRIR and thus provide full-time
availability for the imaging of satellites. The sharing
of the processing systems reduced development andoperations costs under the constraint that only HAX
or the LRIR could be operational at one time.
Radar Astronomy and Space Science
In addition to defense-related activities, the Millstoneradar and subsequently Haystack contributed signifi-
cantly to the fields of ionospheric, lunar, and plan-
etary science. Important theoretical contributions
were made in the early 1960s: Robert Price and Paul
E. Green described radar-astronomy signal-process-
ing techniques [34] and Green described the use of range-Doppler imaging in radar astronomy [35].
Evans and Tor Hagfors edited a comprehensive book
summarizing theory, instrumentation, and observa-
tions in radar astronomy through the mid-1960s
[36].
Pioneering planetary radar observations were madein the late 1950s and early 1960s with the Millstone
radar. The more powerful Haystack radar played a
prominent role during the 1960s in refining the
knowledge of the solar system and in the mapping of the Moon. Gordon H. Pettengill led efforts to observe
the reflection characteristics and mapping of the
Moon and planets noted herein. An aeronomy program commenced in 1959 with
the first observation of Thomson scattering in the
ionosphere. This work was relevant to the scientificcommunity and played a key role in studies related to
ballistic missile defense.
Ionospheric Studies
The Thomson-scatter observation, made in 1959 by
Victor C. Pineo [37, 38], was the world’s first confir-mation of J.J. Thomson’s physical theory on the inco-
herent scattering of radio waves by electrons in theionosphere. W.E. Gordon postulated the existence of
Thomson scattering in the ionosphere [39]. From
1963 to 1982, the Millstone facility performed and
documented measurements of ionospheric proper-ties, including dynamic effects [40, 41], electron den-
sities, and electron and ion temperatures [42–44]. In
1977, installation of a UHF 150-ft fully steerable an-
tenna was completed to support investigation of the
mid-latitude ionosphere that rotates with the Earth
and the auroral ionosphere that does not [45]. Evans
led the synoptic ionospheric research by using the220-ft zenith-pointing fixed antenna and the steer-
able 150-ft paraboloidal antenna, both shown in Fig-
ure 7. He published over fifty journal articles covering
these activities.
From 1969 to 1973, the Millstone facility was en-gaged in a propagation study to characterize the im-
pact of ionospheric effects on precision measurements
required for ballistic missile defense. The U.S. Army
Ballistic Missile Defense Agency and the U.S. Army
SAFEGUARD System Command sponsored the pro-
gram, conducted jointly with Bell Telephone Labora-tories. Satellites of the U.S. Navy Navigation Satellite
System (the predecessor of the Global Positioning
System, or GPS) were tracked simultaneously by us-
ing the UHF navigation signals radiated by the satel-
lites and their L-band radar echoes to observe and
measure the effects of the ionosphere refraction. Bell
Telephone Laboratories employed these measure-
ments and the Thomson-scattering measurements in
Page 13
8/3/2019 Radars for Detection and Tracking
http://slidepdf.com/reader/full/radars-for-detection-and-tracking 13/28
• STONE AND BANNER Radars for the Detection and Tracking of Ballistic Missiles, Satellites, and Planets
V O LU ME 12 , NU MBE R 2 , 2000 L INCO LN LA BORATO RY JO URNAL 229
their development of propagation models appropriate
to ballistic missile defense [46, 47].The object of the study was to determine the angu-
lar bias refraction of UHF beacon signals as they
passed through the ionosphere. The bias was accu-rately determined by averaging many daytime satellite
passes. Good agreement was found among predic-
tions based on ray-tracing studies performed by BellTelephone Laboratories, incoherent scattered elec-
tron-density profiles, and real-time measurements of
the electron content along the line of sight to the sat-
ellite that were obtained by differential-Doppler ob-
servations.
Signal-amplitude fluctuations caused by the iono-spheric-density irregularities were observed in the au-
roral zone. Angular scintillation above the thresholdof detectability occurred less frequently than the fluc-
tuations. Considerable information gathered on the
occurrence of scintillation as a function of the time of
day and geomagnetic activity was summarized in theform of a simple model.
The most serious source of angular scintillation in
the apparent position of the UHF satellites was the
existence of ionospheric waves known as traveling
ionospheric disturbances (TID). Two classes of waves
were identified. TIDs with wavelengths in the 25-to-
50-km range were common. They gave rise to fluc-tuations in the apparent elevation angle of the target
with periods of less than 10 sec and amplitudes as
large as 80 millideg (peak to peak). TIDs with wave-
lengths in the 100-to-1000-km range were less com-
mon but could be readily recognized by their clearsignature in the differential-Doppler records. They
produce somewhat smaller fluctuations in the appar-
ent elevation angle [41].
Lincoln Laboratory made extensive modifications
to the Millstone Hill radar facility to accomplish the
above measurements. To support the simultaneoususe of the Millstone antenna at two frequencies, Lin-
coln Laboratory and Philco-Ford developed a fre-
quency-selective subreflector (FSS) [48, 49]. It em-
ployed both the Cassegrainian and Newtonian foci of
the Millstone antenna and was reflective at L-band
and transparent at UHF frequencies. Figure 11 showsthe Newtonian/Cassegrainian geometry of the FSS.
The unit consisted of a hyperboloidal surface of
crossed dipoles that reflected both linearly and circu-
larly polarized L-band signals to the feed at the
Cassegrainian focus and transmitted UHF signals to amonopulse feed at the Newtonian focus. Figure 12
shows a photograph of the FSS array of L-band
crossed-dipole elements mounted on a low-loss, plas-
tic hyperboloidal substrate. The FSS was the progeni-
tor of a two-layer unit that was developed later for use
at VHF and UHF on the very high-power Advanced
Research Projects Agency (ARPA) Long Range Track-
FIGURE 11. Newtonian/Cassegrainian geometry of the fre-
quency-selective subreflector (FSS). This sketch shows the
relative location of the two feeds with respect to the FSS,
which is transparent to low-frequency (UHF) signals and re-
flective to high-frequency (L-band) signals.
FIGURE 12. The FSS used for the U.S. Army SAFEGUARD
System Command propagation study, comprising an array
of L-band crossed-dipole elements mounted on a low-loss,
plastic, hyperboloidal substrate. The loss in antenna gain at
L-band was less than 0.2 dB and was negligible at UHF.
Frequency-selective
subreflector
UHF signal
Primary reflector
L-band signals
Cassegrainianfeed location
(L-band)
Newtonian feedlocation (UHF)
Page 14
8/3/2019 Radars for Detection and Tracking
http://slidepdf.com/reader/full/radars-for-detection-and-tracking 14/28
• STONE AND BANNER Radars for the Detection and Tracking of Ballistic Missiles, Satellites and Planets
230L INCOL N LA BORATO RY J OU RNA L V O LU ME 12, NUMBER 2, 2000
ing and Instrumentation Radar (ALTAIR) radar at
the Kiernan Reentry Measurements Site (KREMS).These modifications represented the first use of an
FSS in radar having over 100 kW average power.
A study of auroral radar clutter at 1.2 GHz wasconducted in conjunction with the satellite particle
measurements and airborne optical observations [50].
These observations showed that the evening andmorning echoes observed at Millstone are from re-
gions of diffuse proton precipitation lying toward the
equator of the main visible auroral arc. No significant
tracking perturbations were uncovered that appeared
to be associated with the appearance of auroral re-
turns along the line of sight to the satellite. A comparison of the estimated total electron con-
tent of the first 1000 km of ionosphere made by theMillstone incoherent-scatter radar system with an es-
timate based on GPS measurements made out to a
range of approximately 19,000 km showed a signifi-
cant difference between results obtained by the twomeasuring techniques. From this comparison it was
concluded that at times a significant portion of the
total electron content comes from altitudes above 800
km [51, 52].
Radar-Astronomy Studies
The large power-aperture products and digital signalprocessing capabilities of Millstone and Haystack al-
lowed researchers to observe the Moon and planets.
Commencing in the 1950s scientists at Lincoln Labo-
ratory made significant contributions to radar as-
tronomy [53], including measurements of the Moon[54–57] and Venus [58, 59]. This work continued
through the 1960s with the L-band Millstone radar.
Beginning operation in 1964, the more powerful
Haystack extended the scope of lunar and planetary
radar observations to include topographic mapping
of the Moon [60, 61], characterization of the topog-raphy of Mars [62, 63], Venus, and Mercury, and de-
tection of the asteroids Icarus [64] and Toutartis [65].
Several independent groups from the United States
and the United Kingdom reported radar echoes from
Venus in the spring of 1961. One of these groups was
the Lincoln Laboratory team using the MillstoneUHF radar [66]. Earlier Laboratory reports on the
detection of radar echoes from Venus were not cor-
roborated and were subsequently judged false [58].Lincoln Laboratory achieved significant solar sys-
tem measurements, including the refinement of the
estimate of the astronomical unit [59, 67], the estab-
lishment of the rotational motion of Venus (243-day
period with retrograde motion) [68], the establish-
ment of the radius of the planet, and a radar cross sec-
tion indicating that Venus is much less porous (i.e.,more like solid rock) than the Moon, with a thinner
layer of “topsoil” [66]. Similarly, Haystack radar re-
flections from both Mercury and Mars [62, 63, 69]
were instrumental in helping Lincoln Laboratory and
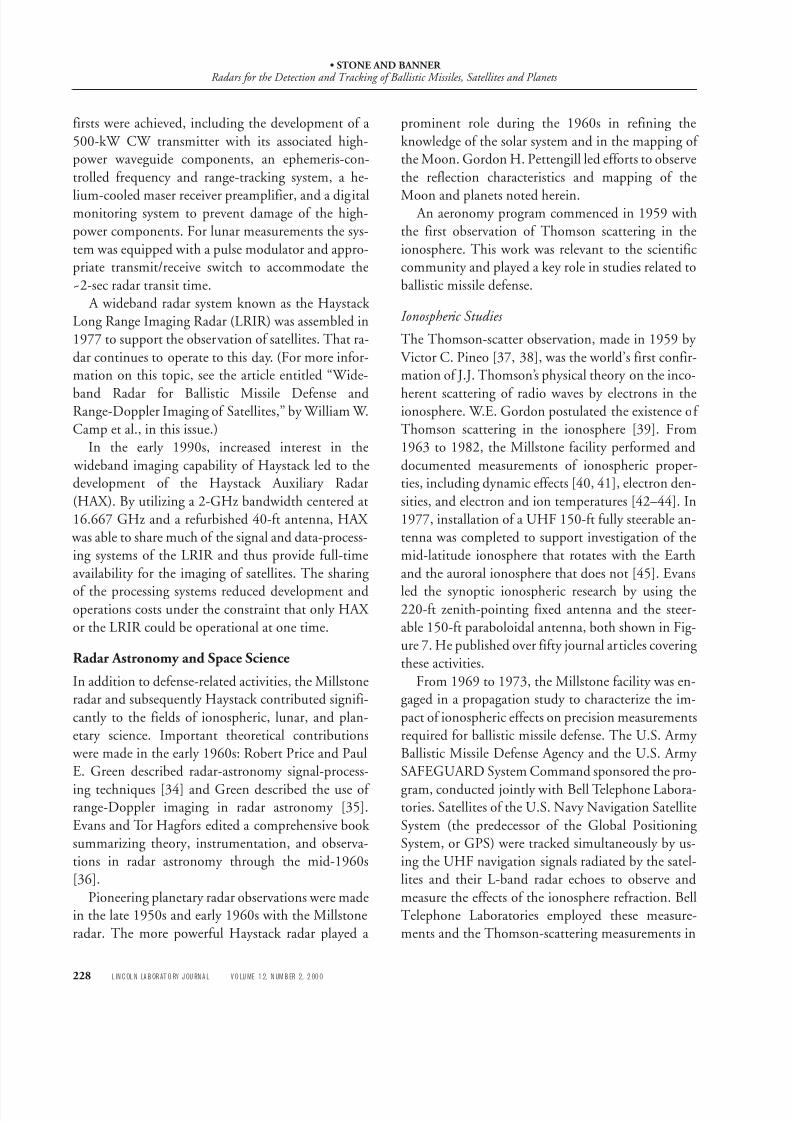
the rest of the scientific community analyze the prop-erties of these two planets [68]. Figure 13 shows the
radar determinations of the astronomical unit from
several laboratories through 1995.
Shapiro proposed employing Haystack to perform
time-of-flight measurements to the planets Venus and
Mercury as they orbited the Sun to measure the effectsuggested by Einstein’s general theory of relativity
[70, 71]. The thrust of this fourth test of general rela-
tivity was to isolate general relativistic effects from
classical mechanical effects. Relativity entered into
the experiment in two ways: the anomalous advance
of the planetary perihelia (the perihelion is the pointin a planet’s orbit where it is closest to the Sun) and in
the general relativistic slowing down of interplanetary
FIGURE 13. Radar determinations of the astronomical unit,
1961 through 1965. The most recent determinations by the
Arecibo Observatory in Puerto Rico and by Lincoln Labora-
tory are consistent with the 1965 value but several orders ofmagnitude more precise. (Adapted from Reference 68.)
149,600,000
149,599,000
149,598,000
149,597,000
149,596,000
149,595,000
1961 1962 1963 1964 1965
149,601,000
A s t r o n o m i c a l u n i t ,
k m
Lincoln Laboratory
Jet Propulsion Laboratory
Arecibo Ionospheric Obs.
U.S.S.R.
Jodrell Bank
Page 15
8/3/2019 Radars for Detection and Tracking
http://slidepdf.com/reader/full/radars-for-detection-and-tracking 15/28
• STONE AND BANNER Radars for the Detection and Tracking of Ballistic Missiles, Satellites, and Planets
V O LU ME 12 , NU MBE R 2 , 2000 L INCO LN LA BORATO RY JO URNAL 231
radar signals that pass near a massive body. Accurate
estimates of the radius and the mass of the planetsMercury, Venus, and Mars, the Earth-Moon mass ra-
tio, and the astronomical unit were obtained by pro-
cessing the radar measurements along with optical
observations. Once the planetary orbits had been pre-
cisely determined, measurements of the round-triptransit time to Mercury as it passed behind the Sun
provided the data from which the slowing down of
the signal could be determined. Figure 14 shows the
positions of Earth and Mercury relevant to the fourth
test of Einstein’s general theory of relativity. Figure 15
shows the slowing down of radar signals due to gen-eral relativistic effects.
The radar observations were coupled in iterative
analyses with extensive optical observations to refine
various parameters of the solar system [67]. The
analyses took advantage of the several orders of mag-
nitude improved relative accuracy attained by the ra-dar over the best optical techniques then available for
describing the solar system [67].
The fourth test of general relativity presented a for-
midable challenge in accurately determining solar-system parameters, particularly the interplanetary dis-
tances and planetary motions, and in the radar
technology needed for accurately measuring the rangeand Doppler shifts of targets at ranges on the order of
100 million miles.
Major enhancements were made to the radar trans-mitter/receiver capability and to precision frequency
and time control. The use of the ephemeris control in
scheduling of pointing the antenna, as well as range
sampling and Doppler-shift compensation essential
to the fourth test of general relativity, exemplified the
technology that was later applied to deep-space satel-lite observations. Owing to the large transit time, the
antenna position had to lead the planet’s positionduring the transmitting interval and point in the di-
rection of the planet during the receiving interval.
An atomic hydrogen frequency standard was used
for both time and frequency determination. The highDoppler shift (e.g., ±4 MHz at 8 GHz when observ-
ing Mercury) made it necessary to use predictive ex-
pansion/compression of the sampling interval of the
received signal and to track the coherent reference os-
cillator of the superheterodyne receiver. Doppler pre-
dictions were based on an ephemeris that increased in
accuracy during the course of the experiment. Thereference oscillator was tracked with an rms accuracy
FIGURE 15. Contribution of relativistic effects to time delays
of radar signals between Earth and Mercury. The time delay
is greatest at superior conjunction, when the radar signals
pass closest to the Sun. (Adapted from Reference 68.)
FIGURE 14. Plan view of the orbits of Mercury and Earth
showing the positions of the planets relevant to the radar
observations for the fourth test of Einstein’s general theory
of relativity. This theory predicts that radar waves traveling
to and reflecting off Mercury are slowed down by the gravi-
tational effect of the Sun. The effect would be most pro-
nounced at the time of superior conjunction, when the radar
waves pass closest to the Sun. (Adapted from Reference
68.)
Earth
t1 (inferior conjunction)
t3 (superior conjunction)
t2 (elongation)
Earth
Earth
Mercury
SunMercury
Mercury
t1
t2
t3
200
160
120
80 ∆
t
(
s e c )
T w o - w a
y d e l a y ( A s t r o n o m i c a l u n i t )
Angular distance of Mercury from Sun (deg)
40
10 20 30 40
2.760
Superior conjunction
Inferior conjunction
Elongation
2.759
2.741
2.686
2.523
1.891
0
µ
τ
Page 16
8/3/2019 Radars for Detection and Tracking
http://slidepdf.com/reader/full/radars-for-detection-and-tracking 16/28
• STONE AND BANNER Radars for the Detection and Tracking of Ballistic Missiles, Satellites and Planets
232L INCOL N LA BORATO RY J OU RNA L V O LU ME 12, NUMBER 2, 2000
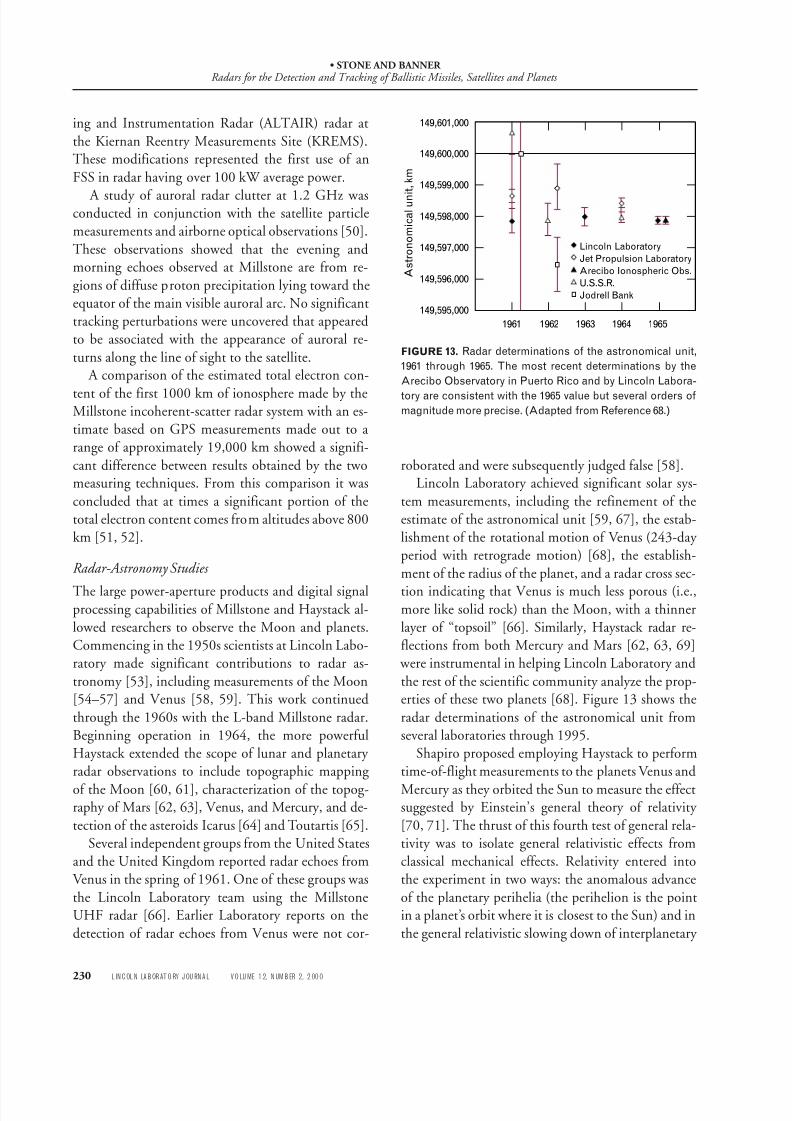
FIGURE 16. Footprint of the 8-GHz beam from the Haystack
antenna on the surface of the Moon.
of 0.1 Hz and a precision of 0.01 Hz. The time-base
expansion/contraction was adjusted proportionally tothe Doppler shift. Coherent integration was per-
formed over an interval of approximately 103 seconds.
The coherent data sets obtained were incoherently in-tegrated for up to fourteen hours. Measurements of
radar echoes made when the paths of Venus and Mer-
cury were nearly tangential to the Sun allowed scien-tists to estimate the relativistic delay predicted by
Einstein’s general theory of relativity.
Millstone and later Haystack supported pioneering
radio-astronomy work performed by MIT students
and faculty during the 1960s and 1970s. This work
came under the aegis of the NEROC in 1967. Working with a National Science Foundation
grant to the MIT Research Laboratory of Electronics(RLE) under the late Professors Alan H. Barrett and
Jerome B. Weisner, Sander Weinreb developed a one-
bit correlator that enabled the Millstone antenna to
look for evidence of the hydroxyl radical (OH) inouter space. In 1963, a successful measurement cam-
paign was completed. The analysis confirming the ex-
istence of OH was the first time a molecule was de-
tected in outer space [72].
Bernard Burke, MIT professor of physics, and
Alan E.E. Rogers, a student of Barrett, began an inter-
ferometry program to measure characteristics of OHmasers in space. This work started in 1965 with a
modest baseline of 700 m between the Haystack and
Millstone antennas. In 1966, James M. Moran, an-
other student of Barrett, joined the team and ex-
tended the interferometry to a 13-km baseline be-tween Millstone and the Harvard Agassiz antennas.
Subsequent measurements employed a longer base-
line between the Haystack antenna and the National
Radio Astronomy Observatory, Green Bank, West
Virginia. Following the success with bistatic opera-
tions, tests involving additional observatories at HatCreek, California, and Onsala, Sweden, were per-
formed to determine the size of the OH maser for the
first time [73, 74].
Shapiro and Rogers also applied VLBI techniques
to geodesy. This work led to accurate intercontinental
measurements of tectonic-plate movement and earth-quake fault lines. GPS measurements have since sup-
planted VLBI measurements of various geodetic
parameters. VLBI, however, continues to be the prin-cipal instrument for the measurement of the rotation
of the Earth and polar motion [75–77].
Lunar Studies
In 1958, the Millstone UHF radar was the most pow-erful radar used up to that time to observe the Moon.
Pettengill led an effort to confirm the quasi-specular
returns seen by other radars and discovered weaker
diffuse returns with strongly cross-polarized reflec-
tions [78]. (For more information on this topic, see
the article entitled “Wideband Radar for BallisticMissile Defense and Range-Doppler Imaging of Sat-
ellites,” by William W. Camp et al., in this issue.)
A bistatic Moon-bounce experiment was per-
formed between a Stanford Research Institute trans-
mitting site at College, Alaska, and receivers at the
Canadian Defence Research Telecommunication Es-tablishment, Shirley Bay, Ottawa, Ontario, and at
Millstone to characterize auroral-propagation effects.
Page 17
8/3/2019 Radars for Detection and Tracking
http://slidepdf.com/reader/full/radars-for-detection-and-tracking 17/28
• STONE AND BANNER Radars for the Detection and Tracking of Ballistic Missiles, Satellites, and Planets
V O LU ME 12 , NU MBE R 2 , 2000 L INCO LN LA BORATO RY JO URNAL 233
The principal legacy of the experiment was the analy-
sis of the effects of the libration of the Moon on thespectral characteristics of lunar echoes [79, 80].
By the mid-1960s, radar measurements, together
with subsequent measurements from other radars (in-cluding the Millstone L-band radar), were used to
confirm the existence of a relatively smooth undulat-
ing lunar surface (with an average slope of ~11°)coupled with boulders strewn about to account for
the diffuse returns [54, 56, 57]. The crater Tycho was
characterized at 23 cm and later at 3.2-cm and 70-cm
wavelengths [81, 82].
The narrow Haystack antenna beam pinpointed a
spot 200 km in diameter centered on the apparentaxis of the Moon (its libration axis) [83]. The small
spot size, shown in Figure 16, made possible the reso-lution of the Doppler ambiguity that exists when
using a radar beamwidth that exceeds the Moon’s di-
ameter. The Doppler ambiguity was resolved by map-
ping range-Doppler contours on the surface of a ro-tating sphere, as shown in Figure 17. Extensive
analysis based on radar data overcame the accuracy
limitations in the published lunar ephemeris. Exten-sive radar data processing to obtain topography and
albedo yielded a mosaic map of ≈51% of the Moon’s
surface. The resolution was comparable to or better
than that from an optical telescope on Earth.
High-resolution maps of the Moon, such as the
one shown in Figure 18, were made to convey details
of local albedo [60]. These approximately 2-km × 2-km-resolution maps and the collateral data played a
role in NASA’s plans to put men on the Moon and
collect geologic specimens. Stanley Zisk helped advise
NASA in real time as astronauts selected specimens.
A great advantage of the Haystack mapping wasthe ability to resolve details at the limb of the Moon
that could not be adequately imaged by optical
means. Haystack was also useful in bringing the dis-
crepancies between radar data and the lunar ephem-
eris to the attention of the astronomical community
[61].In the period from the end of the 1950s through
the 1960s, Lincoln Laboratory scientists used the
Millstone radar to make numerous important contri-
butions to lunar, planetary, and ionospheric studies.
By the end of the 1960s, Millstone’s radar-astronomy
usefulness was diminishing because of advances inother technology. But at this time, satellite detection
and tracking for space surveillance was becoming an
FIGURE 17. Projection of constant range and Doppler con-
tours on the surface of the Moon. The projection of the nar-
row Haystack beam allows resolution of the ambiguity that
exists in the intersection of the contours. The contours are
referred to the apparent axis of rotation of the Moon relative
to the observation point on the Earth (libration axis).
FIGURE 18. Mosaic radar map of the Moon from latitude
48°S to 90°S and longitude 104°E to 104°W. Approximately
120 individual areas were surveyed as the apparent axis ofrotation of the Moon allowed the radar beam to be posi-
tioned unambiguously on the region of interest.
∆ Frequency
∆Range
Haystackbeam
To Earth
Apparentlibration axis
Constant-Doppler-frequency ring
Constant-range ring
– 48– 56
– 1 0 0
– 6 0
– 2 0 + 2 0 0°
+ 6 0
+ 1 0 0
– 64– 72
– 80 – 48
– 56 – 64
– 72 – 80
Latitude (deg)
Longitude (deg)
Page 18
8/3/2019 Radars for Detection and Tracking
http://slidepdf.com/reader/full/radars-for-detection-and-tracking 18/28
• STONE AND BANNER Radars for the Detection and Tracking of Ballistic Missiles, Satellites and Planets
234L INCOL N LA BORATO RY J OU RNA L V O LU ME 12, NUMBER 2, 2000
increasingly important national-security need. It be-
came the principal focus of activity at Millstone.
Deep-Space Satellite Tracking at Millstone
As mentioned earlier, Millstone was used to detect ra-dar reflections from Sputnik I shortly after its launch
in October 1957 [84]. The following year, closed-
loop tracking had been attained. Throughout the late1950s and the entire 1960s Millstone was used to
track satellites for NORAD. In its early days, the
SPACETRACK system was actually located at nearby
Hanscom Air Force Base, and the Millstone radar had
been designated officially as SPACETRACK sensor
number one.Tracking space probes provided some of the truly
satisfying success with the Millstone radar in the1960s [85]. Some of the notable successes occurred
by using the L-band system to track satellites at
ranges far greater than they had ever before been
achieved. In 1963, Millstone was used to detectSyncom II , the first successful experimental geosyn-
chronous communications satellite. By employing
the data-recording and processing capability of the
site at the time, the Millstone radar was able to detect
in post-processing the echo from the Syncom II satel-
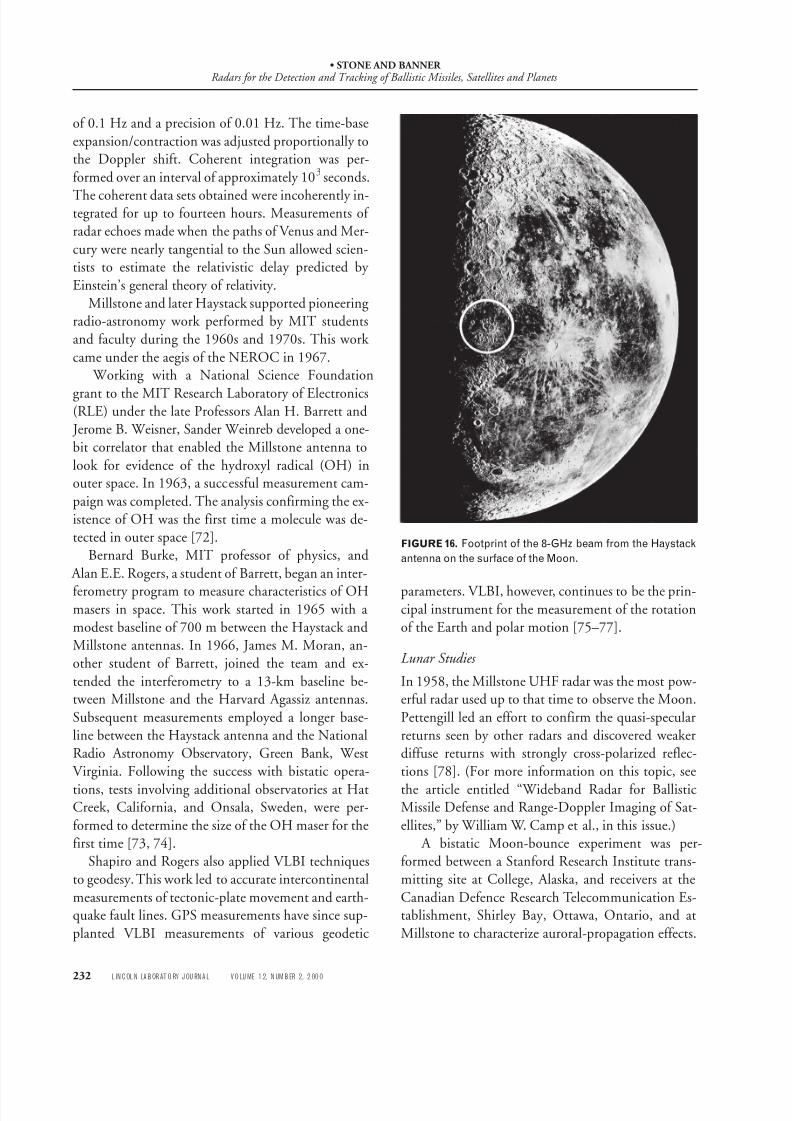
lite in geosynchronous orbit. Figure 19 shows the
processed data from that measurement. This result was generated from about 45 minutes of recorded
data and represents the noncoherent processing of the
A-scope traces from about 40,000 pulses. Other no-
table achievements included the 1964 track of Syn-com III , the first operational geostationary satellite, asit was injected into orbit.
Over the next several years the U.S. space-surveil-
lance network utilized the Baker-Nunn optical sen-
sors for monitoring the slowly growing deep-space
population. That growth had included the launch of
the first Soviet Launch Detection Satellite in 1972and the expanding use of deep space, primarily geo-
synchronous orbits, for U.S. military and commercial
applications. In 1971, the Laboratory conducted a
number of experiments using the Haystack planetary
radar to observe geosynchronous satellites [86]. At
the same time, the ionospheric work at the Millstoneradar was winding down, and similar satellite experi-
ments were being performed at Millstone. To support
this work, the upgrade to the real-time computer in1965 had enabled a rudimentary capability in real-
time multi-pulse processing. A computer program,
Satellite Tracking Utilizing Coherent Integration
Techniques (SATCIT), had been developed at thesite. Having evolved from early planetary-radar work,
that software provided the capability to coherently
process via a fast Fourier transform (FFT) and display
the result of the coherent integration of about 1000
pulses to produce a potential gain in radar sensitivity
of 30 dB.
That capability was sufficient to counter the addi-tional range (R 4) losses of objects in deep-space orbits
[87]. Similar techniques had also been employed by
Laboratory staff associated with Millstone [88] at the
Arecibo Observatory radar in Puerto Rico to observe
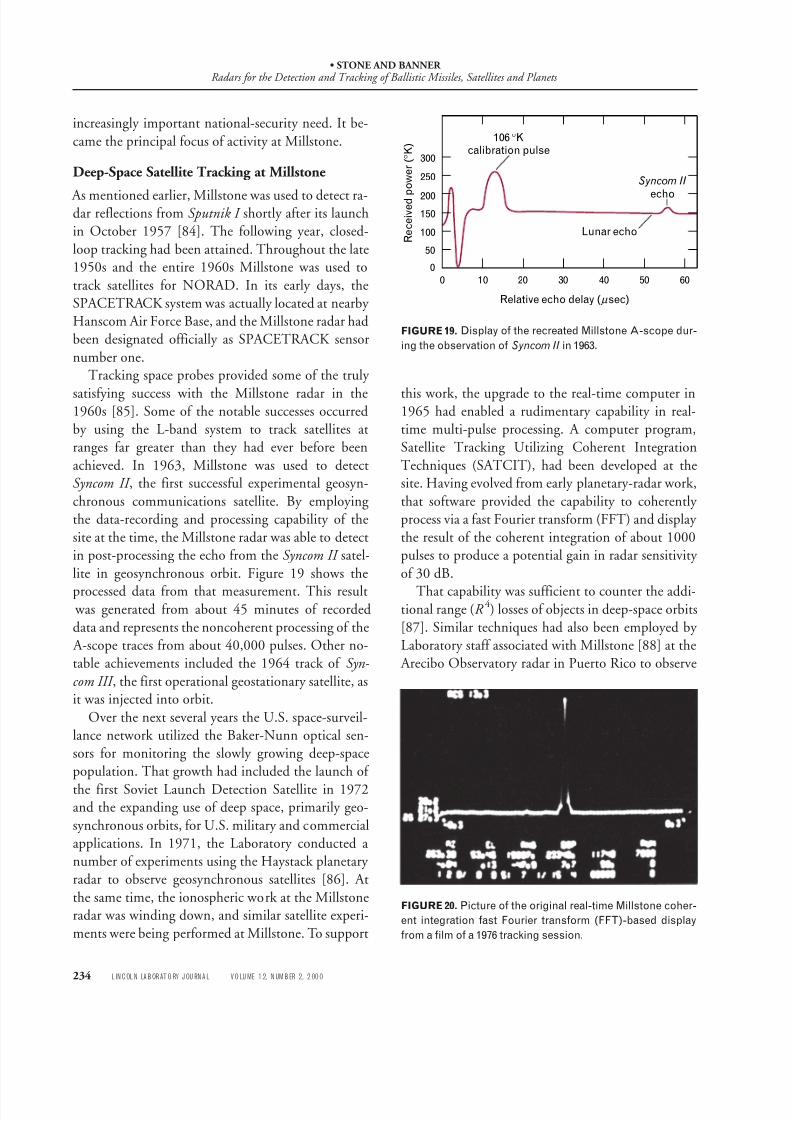
FIGURE 20. Picture of the original real-time Millstone coher-
ent integration fast Fourier transform (FFT)-based display
from a film of a 1976 tracking session.
FIGURE 19. Display of the recreated Millstone A-scope dur-
ing the observation of Syncom II in 1963.
300
R e c e i v e d p o w e r ( ° K )
250
200
150
100
0
100 20 30
Relative echo delay ( sec)
106 °Kcalibration pulse
Lunar echo
Syncom II
echo
40 50 60
50
µ
Page 19
8/3/2019 Radars for Detection and Tracking
http://slidepdf.com/reader/full/radars-for-detection-and-tracking 19/28
• STONE AND BANNER Radars for the Detection and Tracking of Ballistic Missiles, Satellites, and Planets
V O LU ME 12 , NU MBE R 2 , 2000 L INCO LN LA BORATO RY JO URNAL 235
satellites at long ranges. By early 1975, in response to
Air Force needs for improved timely tracking of deep-
space objects, the Millstone radar again became acontributing sensor to the network, and it continues
in that role to this day. Figure 20 includes a frame
captured from a 1976 16-mm film of the Millstone
real-time tracking display. The peak in the center re-
sults from the processing of 512 pulses and represents
the signal from a target tracked at 19,000 km. Thisreal-time FFT processing, coupled with real-time or-
bit propagation and a variety of search techniques,
forms the foundation for the radar tracking of deep-
space objects used today.
Since that time the techniques developed at Mill-
stone have been the cornerstone of a network of radarsensors that track a dramatically increasing number of
objects in deep-space orbit (formally designated by
Space Command as objects with orbits greater than a
225-min period) [89]. The current population of ob-
jects in deep-space orbits has grown to more than1800 as the technology for communications, naviga-
tion, and surveillance has exploded. Figure 21 sum-
marizes the orbital distribution of these objects.
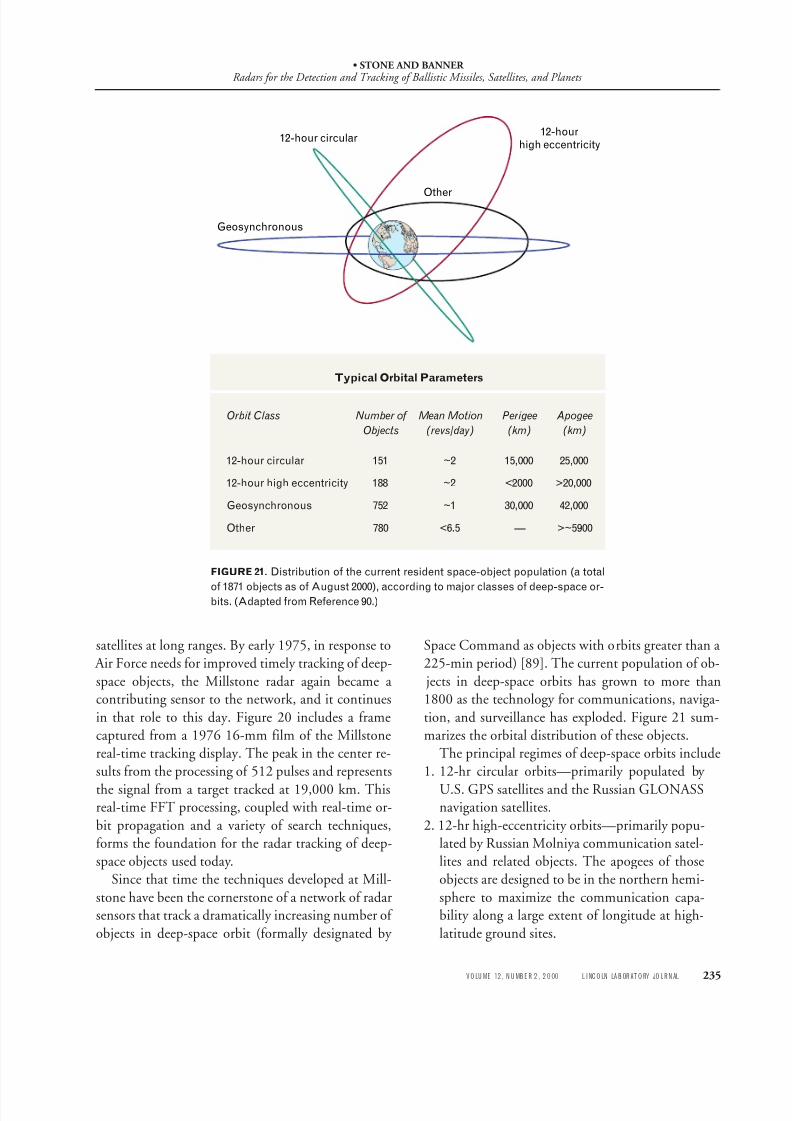
The principal regimes of deep-space orbits include
1. 12-hr circular orbits—primarily populated by
U.S. GPS satellites and the Russian GLONASSnavigation satellites.
2. 12-hr high-eccentricity orbits—primarily popu-
lated by Russian Molniya communication satel-
lites and related objects. The apogees of those
objects are designed to be in the northern hemi-
sphere to maximize the communication capa-bility along a large extent of longitude at high-
latitude ground sites.
FIGURE 21. Distribution of the current resident space-object population (a total
of 1871 objects as of August 2000), according to major classes of deep-space or-bits. (Adapted from Reference 90.)
Typical Orbital Parameters
Orbit Class Number of Mean Motion Perigee Apogee
Objects (revs/day) (km) (km)
12-hour circular 151 ~2 15,000 25,000
12-hour high eccentricity 188 ~2 <2000 >20,000
Geosynchronous 752 ~1 30,000 42,000
Other 780 <6.5 — >~5900
Other
12-hourhigh eccentricity
Geosynchronous
12-hour circular
Page 20
8/3/2019 Radars for Detection and Tracking
http://slidepdf.com/reader/full/radars-for-detection-and-tracking 20/28
• STONE AND BANNER Radars for the Detection and Tracking of Ballistic Missiles, Satellites and Planets
236L INCOL N LA BORATO RY J OU RNA L V O LU ME 12, NUMBER 2, 2000
3. geosynchronous orbits —24-hr orbits generally
at low inclination along the equator to provideessentially Earth-fixed position for communica-
tions and other functions. This category in-
cludes objects in near geosynchronous orbitsthat are either rocket stages, which were used to
boost payloads into this orbit, or dead payloads
that were boosted out of geosynchronous orbitinto so-called graveyard orbits either below or
above strictly geosynchronous orbit.
4. other—this category includes a broad variety of
objects with a large mix of orbital parameters. A
large segment of this category includes spent
rocket bodies and significant numbers of otherobjects from Cape Canaveral launches (~28° in-
clination) and Ariane launches from FrenchGuiana (~7° inclination).
As of August 2000, the total number of objects in
the deep-space catalog was 1871 [90]. Space surveil-
lance of the truly geosynchronous objects from any location on the Earth’s surface is constrained to only
that portion of the geosynchronous belt which is vis-
ible from that site. In contrast, for low-altitude and
the other nonsynchronous orbits, potential coverage
by a surveillance site is primarily constrained only by
the inclination of the orbit relative to the site’s lati-
tude. In these cases, the site location rotates with theEarth under the orbit, which results in regular access
to the satellite orbit.
The estimated orbits of these objects are main-
tained by regular tracking with both radar and
electro-optical systems. The current radar sites in-clude, in addition to the Millstone radar, the AN/
FPS-85 [91] radar at Eglin Air Force Base, Florida,
and the ALTAIR radar [92] on the Kwajalein Atoll in
the Marshall Islands. Both of these sensors were en-
hanced directly with the multi-pulse processing de-
veloped at Millstone to perform the deep-space track-ing function. The AN/FPS-85 had been established
primarily as a low-altitude-target space-surveillance
sensor in the mid-1960s. Millstone personnel in-
stalled the multi-pulse coherent tracking at the AN/
FPS-85 in the late 1980s to significantly extend its
detection range. That deep-space mode complementsthe standard low-altitude surveillance fences of the ra-
dar that provide a large amount of data to the overall
space-surveillance system. The low-altitude fences of
the AN/FPS-85 also generate significant trackingdata on highly eccentric deep-space objects, whose
orbits in many cases intercept that fence at detectable
ranges.The deep-space tracking capabilities of Millstone
have also been replicated on the ALTAIR radar, lo-
cated on the Kwajalein Atoll in the Marshall Islands.The ALTAIR radar was originally built in 1969 as an
instrumentation radar as part of the Pacific Range
Electromagnetic Signature Studies (PRESS). The ra-
dar is a dual-frequency radar operating at both VHF
(155–162 MHz) and UHF (422 MHz.) The deep-
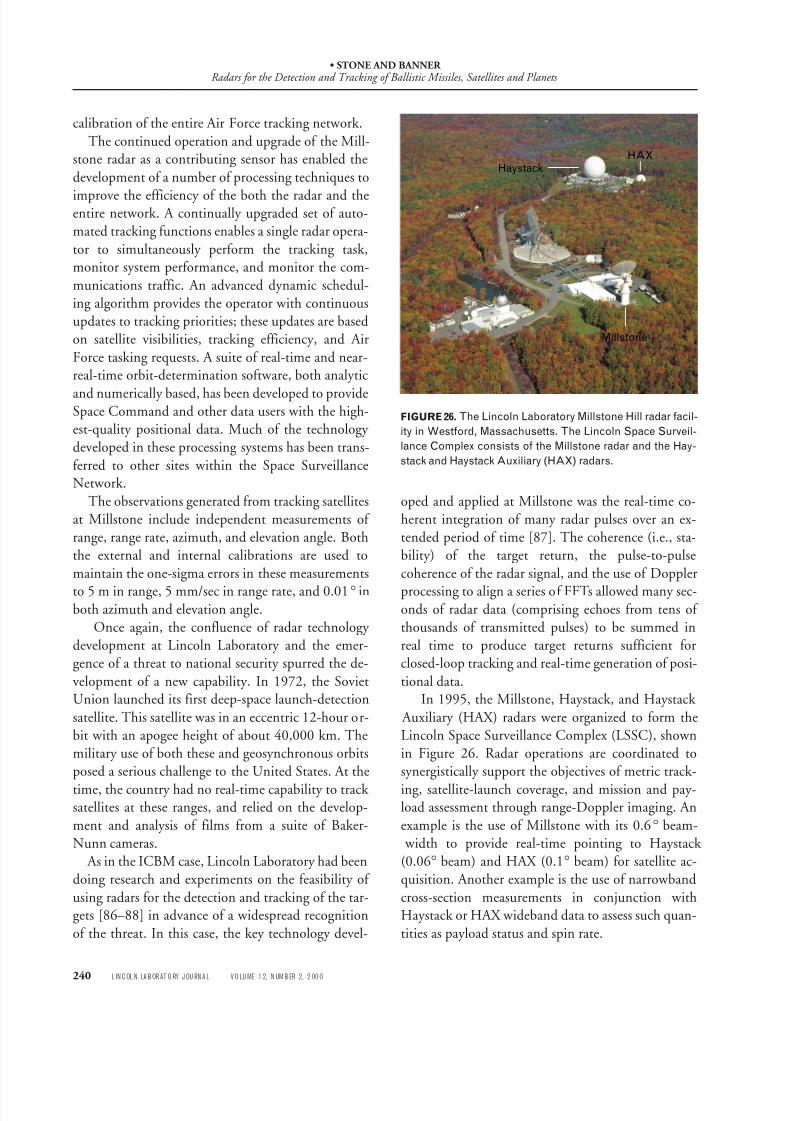
space capability was installed as part of the UHF sys-tem in 1982 [92]. Figure 22 shows the Millstone Hill
radar, and Figure 23 shows the ALTAIR radar onKwajalein Atoll in the Marshall Islands.
The contributing radar sensors, Millstone and AL-
TAIR, provide a significant amount of deep-space
tracking data over a large fraction of the geosynchro-nous belt. Table 1 summarizes some of the principal
operating characteristics of the Millstone radar. Oper-
ating at L-band (1295 MHz), the high-power trans-
mitter coupled to the 84-ft antenna results in a signal-
to-noise ratio with a 1-msec pulse of 50 dB on a 1-m2
(0 dBsm) space object at a range of 1000 km. With
coherent processing of a large number of pulses(~1000), the radar sensitivity can be further improved
by 30 dB to mitigate the range losses of 64 dB going
from near-Earth 1000-km ranges to the 40,000-km
range typical of geosynchronous distance. By utilizing
the 1-MHz radar bandwidth, the Doppler informa-tion available from the FFT processing, and the
monopulse error channels, the radar consistently pro-
duces positional data with the accuracy indicated in
the Millstone operating characteristics.
With sensitivity similar to Millstone, ALTAIR also
produces a large number of high-quality deep-spaceobservations with the accuracy indicated in Table 2,
which lists key operating characteristics. Since 1975,
the Millstone radar has taken over five million obser-
vations while performing over 500,000 satellite tracks
in support of Space Command. Operating for a larger
number of hours (~128 hours per week), ALTAIR hasproduced more than 700,000 tracks in its deep-space
mode.
Page 21
8/3/2019 Radars for Detection and Tracking
http://slidepdf.com/reader/full/radars-for-detection-and-tracking 21/28
• STONE AND BANNER Radars for the Detection and Tracking of Ballistic Missiles, Satellites, and Planets
V O LU ME 12 , NU MBE R 2 , 2000 L INCO LN LA BORATO RY JO URNAL 237
Table 1. Millstone Operating Characteristics
Operating frequency L-band (1295 MHz)
Dish Steerable 84-ft dish
Beamwidth 0.6°
Peak power output 3 MW
Average power output 120 kW
Pulse-repetition frequency 40 Hz
Pulse length 1 msec
Signal-to-noise ratio 50 dB @ 1000 km
(per pulse) (0-dBsm target)
Accuracy
Range resolution 5 m
Range-rate resolution 5 mm/sec
Azimuth and elevation angle 0.01°
Table 2. ALTAIR Operating Characteristics
Operating frequency UHF (422 MHz)
(deep-space mode)
Dish Steerable 150-ft dish
Beamwidth 1.1° (UHF)
Peak power output 5 MW
Average power output 120 kW
Pulse-repetition frequency 300 Hz
Pulse length 80 µ sec
Signal-to-noise ratio 38 dB @ 1000 km
(per pulse) (0-dBsm target)
Accuracy
Range resolution 20 m
Range-rate resolution 15 mm/sec
Azimuth and elevation angle 0.03°
FIGURE 22. The Millstone Hill radar in its current configura-
tion in Westford, Massachusetts. Multipulse coherent pro-
cessing techniques were developed at the Millstone site to
enhance the radar’s effectiveness as a deep-space tracking
sensor.
FIGURE 23. The ARPA Long-Range Tracking and Instru-
mentation Radar (ALTAIR) on Kwajalein Atoll in the Marsh-
all Islands. Like the Millstone radar, ALTAIR is part of a net-
work of contributing radar sensors that perform deep-space
tracking.
Page 22
8/3/2019 Radars for Detection and Tracking
http://slidepdf.com/reader/full/radars-for-detection-and-tracking 22/28
• STONE AND BANNER Radars for the Detection and Tracking of Ballistic Missiles, Satellites and Planets
238L INCOL N LA BORATO RY J OU RNA L V O LU ME 12, NUMBER 2, 2000
The hardware components and operating details of
the Millstone and ALTAIR radars in the deep-space
modes are specific to each site, but they share the
same fundamental characteristics. The remaining dis-cussion focuses specifically on details of the Millstone
system. Two Nighthawk computers perform the real-
time processing of the system. These computers rep-
resent the fourth generation of computers used to
drive the real-time tracking system for deep-spacetracking.
The current real-time tracking system produces
the tracking display shown in Figure 24. This display
demonstrates the principal features of the tracking
system. In this case, a geosynchronous satellite is be-
ing tracked at a range of 40,506 km from the radar. Inthe center of the screen are two FFT-based displays
showing the results of processing 1024 (256 × 4)
pulses for both the principal polarization (transmit
right circular, receive left circular) channel on the bot-
tom and orthogonal polarization (receive right circu-
lar) channel above. The radar-return signal from thattarget is the spike in each trace, and the relative signal
strength in the principal polarization is only 1.5 dB
(70.0 versus 68.5) greater on the displayed scale than
the orthogonal polarization. The topmost trace repre-
sents the signal/radar-cross-section history of the
track and shows a steady radar cross-section of the sat-ellite of close to 25 dBsm in the principal channel.
The real-time display also includes a large amount of
pointing and tracking status information below the
display and the verification of a number of operator-
selected modes along the right side.On the basis of the Millstone tracking experience
and the properties of the actual deep-space targets to
be tracked, it has been found beneficial to utilize a va-
riety of tracking modes to maximize tracking perfor-
mance. The variety of the coherence properties of the
objects, generally represented by the stability of pay-loads and the tumbling of uncontrolled objects and
the polarization properties of the objects, has led to
the development and installation of a sophisticated
array of data-driven detection modes in the real-time
tracking system. These modes are characterized in
Figure 25.The coherent target in the real-time tracking dis-
play of Figure 24 represents one possible coherency
FIGURE 24. The Millstone real-time tracking display. The traces include results of
FFT-based coherent integration for both polarizations and a recreated strip chart
record (radar cross section versus time) at the top. Detailed status information is in-
cluded at the bottom; operator tracking information is included along the right side.
Page 23
8/3/2019 Radars for Detection and Tracking
http://slidepdf.com/reader/full/radars-for-detection-and-tracking 23/28
• STONE AND BANNER Radars for the Detection and Tracking of Ballistic Missiles, Satellites, and Planets
V O LU ME 12 , NU MBE R 2 , 2000 L INCO LN LA BORATO RY JO URNAL 239
model. Figure 25 shows two other coherency models,
a quasi-coherent model typified by a limited line-
spectrum response on the FFT-amplitude scale, and a
totally noncoherent model characterized by thespread of the response over a large fraction of the FFT
sampling-bandwidth Doppler scale of the FFT. On
the polarization axis of the target model, assuming
right-circular transmission, examining both the left
and right receive channels, four cases are possible: (1)left (principal) circular return only, (2) right (or-
thogonal) circular return only, (3) joint returns in
both receive channels, and (4) polarimetric (i.e. corre-
lated) returns in both channels.
Processing all possible models can improve the de-
tection and tracking signal-to-noise ratio by severaldB relative to much simpler versions, such as the
single-polarization channel with coherent and nonco-
herent models, that were originally installed at the
site. Additionally, processing all modes simulta-
neously and selecting the best model means that a priori target models are not required.
Another significant feature of deep-space tracking
that has been developed and employed at Millstone is
the concept of sophisticated radar calibration [93]. To
produce the highest quality metric data, the radar
must achieve signal-to-noise-ratio-limited accuracy.
In this case, errors introduced by atmospheric effects,inaccurate system biases, and changes in system per-
formance must be monitored and accounted for. A
necessary step in the calibration process is the deter-
mination of an independent standard that can be
compared to actual site observations. Such a standardcan be obtained from the orbits of several resident
space objects, including the Laser Geodynamics Sat-
ellite (LAGEOS), that are derived from laser tracking
of objects with laser retroreflectors. Tracking these ob-
jects with the radars, assuming a sufficient signal-to-
noise ratio over a variety of antenna angles and atmo-spheric conditions, can determine system biases for
the radars. These biases can be applied to the process-
ing of the resulting data. Subsequently, regular track-
ing of these objects, particularly following any
changes to the radar system, can be used to update
and/or validate system biases. This technique hasbeen used at Millstone for many years and that tech-
nology has now made the transition to support the
FIGURE 25. The upgraded Millstone data-driven processing system addressing the cases of three
possible target-spectrum characteristics and four possible polarization characteristics. System
performance is enhanced by simultaneously processing all of the possible combinations (twelve
real-time processing models) and by using the strongest signal.
15
10
5
0
15
10
5
0
15
10
5
0
15
10
5
0
L
R
– 20 200 – 20 200 – 20 200
R a d
a r c r o s s
s e c t i o
n
( d B s m )
Time Time Time Time
Left only Right only Joint Polarimetric
Wide
spectrum
Narrow
spectrum
Line
spectrum
Coherent Quasi-coherent Noncoherent
Frequency (Hz) Frequency (Hz) Frequency (Hz)
L
R L
R
L
R
| F F T |
2
Three possible target spectra
Four possible receive polarization characteristics
| F F T |
2
| F F T |
2
Page 24
8/3/2019 Radars for Detection and Tracking
http://slidepdf.com/reader/full/radars-for-detection-and-tracking 24/28
• STONE AND BANNER Radars for the Detection and Tracking of Ballistic Missiles, Satellites and Planets
240L INCOL N LA BORATO RY J OU RNA L V O LU ME 12, NUMBER 2, 2000
calibration of the entire Air Force tracking network.
The continued operation and upgrade of the Mill-stone radar as a contributing sensor has enabled the
development of a number of processing techniques to
improve the efficiency of the both the radar and theentire network. A continually upgraded set of auto-
mated tracking functions enables a single radar opera-
tor to simultaneously perform the tracking task,monitor system performance, and monitor the com-
munications traffic. An advanced dynamic schedul-
ing algorithm provides the operator with continuous
updates to tracking priorities; these updates are based
on satellite visibilities, tracking efficiency, and Air
Force tasking requests. A suite of real-time and near-real-time orbit-determination software, both analytic
and numerically based, has been developed to provideSpace Command and other data users with the high-
est-quality positional data. Much of the technology
developed in these processing systems has been trans-
ferred to other sites within the Space SurveillanceNetwork.
The observations generated from tracking satellites
at Millstone include independent measurements of
range, range rate, azimuth, and elevation angle. Both
the external and internal calibrations are used to
maintain the one-sigma errors in these measurements
to 5 m in range, 5 mm/sec in range rate, and 0.01° inboth azimuth and elevation angle.
Once again, the confluence of radar technology
development at Lincoln Laboratory and the emer-
gence of a threat to national security spurred the de-
velopment of a new capability. In 1972, the SovietUnion launched its first deep-space launch-detection
satellite. This satellite was in an eccentric 12-hour or-
bit with an apogee height of about 40,000 km. The
military use of both these and geosynchronous orbits
posed a serious challenge to the United States. At the
time, the country had no real-time capability to track satellites at these ranges, and relied on the develop-
ment and analysis of films from a suite of Baker-
Nunn cameras.
As in the ICBM case, Lincoln Laboratory had been
doing research and experiments on the feasibility of
using radars for the detection and tracking of the tar-gets [86–88] in advance of a widespread recognition
of the threat. In this case, the key technology devel-
oped and applied at Millstone was the real-time co-
herent integration of many radar pulses over an ex-
tended period of time [87]. The coherence (i.e., sta-
bility) of the target return, the pulse-to-pulse
coherence of the radar signal, and the use of Doppler
processing to align a series of FFTs allowed many sec-onds of radar data (comprising echoes from tens of
thousands of transmitted pulses) to be summed in
real time to produce target returns sufficient for
closed-loop tracking and real-time generation of posi-
tional data.In 1995, the Millstone, Haystack, and Haystack
Auxiliary (HAX) radars were organized to form the
Lincoln Space Surveillance Complex (LSSC), shown
in Figure 26. Radar operations are coordinated to
synergistically support the objectives of metric track-
ing, satellite-launch coverage, and mission and pay-load assessment through range-Doppler imaging. An
example is the use of Millstone with its 0.6° beam-
width to provide real-time pointing to Haystack
(0.06° beam) and HAX (0.1° beam) for satellite ac-
quisition. Another example is the use of narrowband
cross-section measurements in conjunction withHaystack or HAX wideband data to assess such quan-
tities as payload status and spin rate.
FIGURE 26. The Lincoln Laboratory Millstone Hill radar facil-
ity in Westford, Massachusetts. The Lincoln Space Surveil-
lance Complex consists of the Millstone radar and the Hay-
stack and Haystack Auxiliary (HAX) radars.
HaystackHAX
Millstone
Page 25
8/3/2019 Radars for Detection and Tracking
http://slidepdf.com/reader/full/radars-for-detection-and-tracking 25/28
• STONE AND BANNER Radars for the Detection and Tracking of Ballistic Missiles, Satellites, and Planets
V O LU ME 12 , NU MBE R 2 , 2000 L INCO LN LA BORATO RY JO URNAL 241
Summary
Beginning in the mid-1950s and continuing today,
Lincoln Laboratory has addressed a series of threats—
ICBMs, near-earth satellites, and deep-space satel-lites—by designing, developing, and implementing
high-power radar technology for surveillance. Many
advances were made to provide both the theoreticalunderpinnings and the practical implementation.
Among the key technologies developed were phase-
coded pulse compression, Doppler processing, com-
puter-guided tracking, range-Doppler imaging, and
long-term coherent integration. The application of
these technologies to lunar and planetary science es-tablished many of the foundational discoveries in this
field.Demonstration of capability was an integral part of
system design and proved successful for both ballistic-
missile early warning and deep-space satellite surveil-
lance. The result of the tremendous effort and dedica-tion by many talented people over the last four
decades has been advances in the fundamental under-
standing of radars, the collection of surveillance data
to meet critical national needs, and a legacy for future
generations of radars.
AcknowledgmentsPaul B. Sebring established the environment in which
engineers and scientists made effective contributions
at the Millstone facility, beginning in 1957. He was
also Lincoln Laboratory’s first operational site man-
ager at Kwajalein from 1962 to 1964. His leadershipcontinued at the Millstone and Haystack facilities
until 1979. The reestablishment of space-surveillance
activities at Millstone in the mid-1970s owes much of
its success to Antonio F. Pensa, currently a Lincoln
Laboratory assistant director, whose leadership was
instrumental in focusing the efforts of many talentedstaff members on the upgraded Millstone facility and,
subsequently, on several other systems as well. Her-
bert G. Weiss was awarded the IEEE Aerospace and
Electronic Systems Society 2000 Pioneer Award for
his contributions to the development of the Millstone
Hill and Haystack space surveillance radars. The au-thors also thank Alan Rogers, Joseph Salah, and
Ramaswamy Sridharan for reviewing the article.
R E F E R E N C E S
1. D.L. Clark, “Early Advances in Radar Technology for AircraftDetection,” in this issue.
2. K. Schaffel, The Emerging Shield: The Air Force and the Evolu-tion of Continental Air Defense, 1945–1960 (Office of AirForce History, Washington, 1990).
3. W.M. Siebert, “A Radar Detection Philosophy,” IRE Trans.Info. Theory 2 (3), 1956, pp. 204–221.
4. W.M. Siebert, “The Development of AN/FPS-17 Coded-Pulse Radar at Lincoln Laboratory,” IEEE Trans. Aerosp. Elec-tron. Syst. 24 (6), 1988, pp. 833–837.
5. R.F. Lerner, “A Matched Filter Detection System for Compli-cated Doppler Shifted Signals,” IRE Trans. Info. Theory 6 (3),1960, pp. 373–385.
6. Pioneer Award Declaration for 1987, C.E. Cook and W.M.Siebert, IEEE Trans. Aerosp. Electron. Syst. 24 (6), 1988, p.823.
7. G.H. Pettingill and D.E. Dustin, private communication.
8. K.S. Kelleher and H.H. Hibbs, “An Organ Pipe Scanner,”Naval Research Laboratory Report 4141 (11 May 1953).
9. J.S. Arthur, J.C. Henry, G.H. Pettengill, and P.B. Sebring,“The Millstone Radar in Satellite and Missile Tracking,” Bal-listic Missiles and Space Technology, vol. III (Pergamon Press,New York, 1961), pp. 81–93.
10. R.C. Fritsch, “Antenna and RF Circuit Design Millstone HillRadar,” Technical Report 193, Lincoln Laboratory (7 Jan.1959), DTIC #AD-658465.
11. W.H. Drury, W.F. Kelley, A.A. In, and D.R. Bromaghim, “Se-quential Detection System for the Processing of Radar Re-turns,” Group Report 41G-0005, Lincoln Laboratory (22 Mar.1961), DTIC #AD-658465.
12. G.P. Dinneen, J.A. Dumanian, I.L. Lebow, I.S. Reed, and P.B.Sebring, private communications.
13. I. Shapiro, The Prediction of Ballistic Missile Trajectories fromRadar Observations (McGraw-Hill, New York, 1958).14. G.H. Pettengill and L.G. Kraft, Jr., “Observations Made with
the Millstone Hill Radar,” Avionics Research: Satellites and Problems of Long Range Detection and Tracking, AGARD Avion-ics Panel Mtg., Copenhagen, 20–25 Oct. 1958, pp. 125–134.
15. G.H. Pettengill, “A New Technique for Investigation of Meteor Echoes at UHF,” Geophys. Res. Lett. 67 (1), 1962, pp.409–411.
16. J.V. Evans and M. Loewenthal, “Ionospheric Backscatter Ob-servations,” Planet. Space Sci . 12, Oct. 1964, pp. 915–944.
17. J.V. Evans, “Radio-Echo Studies of Meteors at 68-Centimeter Wavelength,” J. Geophys. Res. 70 (21), 1965, pp. 5395–5416.
18. E.N. Hayes, Trackers of the Sky: A History of the SmithsonianSatellite-Tracking Program (Howard A. Doyle Publishing,Cambridge, Mass., 1968).
19. J.V. Evans, W.A. Reid, and P. Stetson, “Upgrading MillstoneHill Radar for the International Magnetosphere Study,” Na-tional Science Foundation Final Report, Lincoln Laboratory (1
Apr. 1978).20. “Millstone Hill Observatory,” vols. I and II, Lincoln Manual
51, Lincoln Laboratory (1 Apr. 1964).21. C.A. Lindberg, “12-Horn Monopulse Antenna System for
Millstone Radar,” Technical Report 393 (15 June 1965), DTIC#AD-627008.
22. L.J. Ricardi and L. Niro, “Design of a 12 Horn MonopulseFeed,” IRE Conv. Record, New York, 20–23 Mar. 1961, pp. 49–56.
Page 26
8/3/2019 Radars for Detection and Tracking
http://slidepdf.com/reader/full/radars-for-detection-and-tracking 26/28
• STONE AND BANNER Radars for the Detection and Tracking of Ballistic Missiles, Satellites and Planets
242L INCOL N LA BORATO RY J OU RNA L V O LU ME 12, NUMBER 2, 2000
23. H.G. Weiss, “The Haystack Microwave Research Facility,”IEEE Spectr. 2 (2), 1965, pp. 50–69.
24. IEEE Aerospace and Electronic Systems Society 2000 Pioneer Award for Development of the Millstone Hill and Haystack Space Surveillance Radars; presented to Herbert G. Weiss (Lin-coln Laboratory), IEEE Trans. Aerosp. Electron. Syst. 37 (1),
2001, pp. 361–379.25. J. Ruze, “Antenna Tolerance Theory—A Review,” Proc. IEEE
54 (4), 1966, pp. 633–640.26. A.O. Kuhnel, “Haystack Antenna System Status Report,”
Technical Report 328, Lincoln Laboratory (13 Sept. 1963),DTIC #AD-600930.
27. H. Simpson, “Structural Aspects of Large Precision Anten-nas,” NEREM Rec . 4, Boston, 5–7 Nov. 1962, pp. 70, 197.
28. G.R. Carroll, “A Hydrostatic Bearing for Haystack,” ASME Winter Mtg., New York, 25–30 Nov. 1962, paper no. 62-WA-299.
29. R.P. Ingalls, J. Antebi, J.A. Ball, R. Barvainis, J.F. Cannon, J.C.Carter, P.J. Charpentier, B.E. Corey, J.W. Crowley, K.A.Dudevoir, M.J. Gregory, F.W. Kan, S.M. Milner, A.E.E.Rogers, J.E. Salah, and M.S. Zarghamee, “Upgrading the
Haystack Radio Telescope for Operation at 115 GHz,” Proc.IEEE 82 (5), May 1994, pp. 742–755.
30. M.S. Zarghamee and J. Antebi, “Surface Deformation of Cassegrain Antennas,” IEEE Trans. Antennas Propag. 33 (8),1985, pp. 828–837.
31. R. Barvainis, J.A. Ball, R.P. Ingalls, and J.E. Salah, “The Hay-stack Observatory λ 3-mm Upgrade,” Publ. Astron. Soc. Pac.105 (693), 1993, pp. 1334–1341.
32. A.E.E. Rogers, R. Barvainis, P.J. Charpentier, and B.E. Corey,“Corrections for the Effects of a Radome on Antenna SurfaceMeasurements by Microwave Holography,” IEEE Trans. An-tennas Propag . 41 (1), 1993, pp. 77–84.
33. C.W. Jones, “The Microwave System for the Haystack Plan-etary Radar,” Technical Report 457, Lincoln Laboratory (23Oct. 1968), DTIC #AD-685696.
34. P. Green and R. Price, private communications.35. P.E. Green, “Radar Astronomy Measurement Techniques,”Technical Report 282, Lincoln Laboratory (12 Dec. 1962),DTIC #AD-400563.
36. J.V. Evans and T. Hagfors, eds., Radar Astronomy (McGraw Hill, New York, 1968).
37. V.C. Pineo, L.G. Kraft, and H.W. Briscoe, “Ionospheric Back-scatter Observation at 440 Mc/s,” J. Geophys. Res. 65 (5), 1960pp. 1620–1621.
38. V.C. Pineo and H.W. Briscoe, “Discussion of Incoherent Back-scatter Power Measurements at 440 Mc/s,” J. Geophys. Res. 66(11), 1961, pp. 3965–3966.
39. W.E. Gordon, “Incoherent Scattering of Radio Waves by FreeElectrons with Application to Space Exploration by Radar,”Proc. IRE 46 (11), 1958, pp. 1824–1829.
40. J.V. Evans, J.M. Holt, and R.W. Wand, “On the Formation of Daytime Troughs in the F-Region within the Plasmasphere,”Geophys. Res. Lett. 10 (5), 1983, pp. 405–408.
41. J.V. Evans and R.H. Wand, “Traveling Ionospheric Distur-bances Detected by UHF Angle-of-Arrival Measurements,” J.
Atmos. Terr. Phys. 45 (4), 1983, pp. 255–265.42. J.V. Evans, “Diurnal Variation of the Temperature of the F Re-
gion,” J. Geophys. Res. 67 (12), 1962, pp. 4914–4920.43. J.V. Evans, “Ionospheric Temperatures during the Launch of
NASA Rocket 8.14 on July 2, 1963,” J. Geophys. Res. 69 (7),1964, pp. 1436–1444.
44. J.V. Evans, “A Comparison of Rocket, Satellite, and Radar De-terminations of Electron Temperature at Midlatitudes,” J.
Geophys. Res. 70 (17), 1965, pp. 4365–4374.45. J.V. Evans, J.M. Holt, W.L. Oliver, and R.H. Wand, “Mill-
stone Hill Incoherent Scatter Observations of Auroral Convec-tion over 60° ≤ Λ ≤ 75°,” J. Geophys. Res. 85 (A1), 1985, pp.41–54.
46. J.V. Evans, ed., “Millstone Hill Radar Propagation,” Technical
Report 509, Bell Laboratories and Lincoln Laboratory (13 Nov.1973), DTIC #AD-781179/7.
47. J.H. Ghiloni, “Millstone Radar Propagation Study: Instru-mentation,” Technical Report 247, Lincoln Laboratory (20Sept. 1973), DTIC #AD-775140.
48. A. Gradisar, G. Schennum, J. Ruze, and M.L. Stone, “Devel-opment of a High Power Frequency Selective Cassegrain Sub-Reflector (FSS),” G-AP Int. Symp., Columbus, Ohio, 14–16 Sept. 1970, p. 407.
49. G.H. Schennum, “Frequency-Selective Surfaces for Multiple-Frequency Antennas,” Microw. J. 16 (5), 1973, pp. 55–57, 76.
50. W.G. Abel and R.E. Newell, “Measurements of the AfternoonRadio Aurora at 1295 MHz,” J. Geophys. Res., Space Phys . 74(1), 1969, pp. 231–245.
51. A.J. Coster, “Use of GPS in Satellite Tracking: Real-Time Es-
timation of Ionospheric Refraction,” IAP ’92 Technical Semi-nar Series, MIT, Cambridge, Mass., 14 Jan. 1992 [submitted].
52. A.J. Coster and M.J. Buosanto, “Comparison of Millstone HillGPS and Incoherent Scatter Total Electron Content Measure-ments,” 1992 Int. Beacon Satellite Symp., MIT, Cambridge,
Mass., 6–10 July 1962, pp. 113–117 [submitted].53. J.W. Meyer, “Program Description—Radar Observations of
the Planets,” Technical Note 1965-35 (9 July 1965), DTIC#AD-619708.
54. J.V. Evans and G.H. Pettengill, “The Scattering Properties of the Lunar Surface at Radio Wave Lengths,” chap. 5 in The
Moon, Meteorites, and Comets (The Solar System), vol. IV, B.M.Middlehurst and G.P. Kuiper, eds. (University of ChicagoPress, Chicago, 1963), pp. 129–161.
55. J.V. Evans and G.H. Pettengill, “The Radar Cross Section of
the Moon,” J. Geophys. Res. 68 (17), 1963, pp. 5098–5099.56. J.V. Evans and T. Hagfors, “Study of Radio Echoes from theMoon at 23 Centimeters Wavelength,” J. Geophys. Res .71 (20),1966, pp. 4871–4889.
57. J.V. Evans and. T. Hagfors, “On the Interpretation of RadarReflections from the Moon,” Icarus 3 (2), 1964, pp. 151–160.
58. R. Price, P.E. Green, T.J. Goblick, Jr., R.H. Kingston, L.G.Kraft, Jr., R. Silver, and W.B. Smith, “Radar Echoes from Ve-nus,” Science 129 (3351), 1959, pp. 751–753.
59. G.H. Pettengill and R. Price, “Radar Echoes from Venus anda New Determination of the Solar Parallax,”Planet. Space Sci .5 (1), 1961, pp. 71–74.
60. G.H. Pettengill, “Radar Studies of the Moon: Final Report,”Lincoln Laboratory (28 Feb. 1970).
61. C.R. Smith, G.H. Pettengill, I.I. Shapiro, and F.S. Weinstein,“Discrepancies between Radar Data and the Lunar Ephem-eris,” Science 160 (3830), 1968, pp. 876–878.
62. G.H. Pettengill, “Radar Studies of Mars: Final Report,” Lin-coln Laboratory (15 Feb. 1970).
63. A.E.E. Rogers, M.E. Ash, C.C. Counselman, I.I. Shapiro, andG.H. Pettengill, “Radar Measurements of the Surface Topog-raphy and Roughness of MARS,” Radio Sci. 5 (2), 1970, pp.465–473.
64. G.H. Pettengill, I.I. Shapiro, M.E. Ash, R.P. Ingalls, L.P.Rainville, W.B. Smith, and M.L. Stone, “Radar Observationsof Icarus,” Icarus 10 (3b), 1968, pp. 432–435.
65. L.B. Spence, private communications with G.P. Banner.66. G.H. Pettengill, H.W. Briscoe, J.V. Evans, E. Gehrels, G.M.
Page 27
8/3/2019 Radars for Detection and Tracking
http://slidepdf.com/reader/full/radars-for-detection-and-tracking 27/28
• STONE AND BANNER Radars for the Detection and Tracking of Ballistic Missiles, Satellites, and Planets
V O LU ME 12 , NU MBE R 2 , 2000 L INCO LN LA BORATO RY JO URNAL 243
Hyde, L.G. Kraft, R. Price, and W.B. Smith, “A Radar Inves-tigation of Venus,” Astron. J. 67 (4), 1962, pp. 181–190.
67. M.E. Ash, I.I. Shapiro, and W.B. Smith, “Astronomical Con-stants and Planetary Ephemerides Deduced from Radar andOptical Observations,” Astron. J. 72 (3), 1967, pp. 338–350.
68. I.I. Shapiro, “Planetary Radar Astronomy,” in Moon and Plan-
ets (North-Holland Publishing Co., Amsterdam, 1967), pp.103–125.
69. G.H. Pettengill, C.C. Counselman, L.P. Rainville, and I.I.Shapiro, “Radar Measurements of Martian Topography,”
Astron. J. 74 (3), 1969, pp. 461–482.70. I.I. Shapiro, G.H. Pettengill, M.E. Ash, M.L. Stone, W.B.
Smith, R.P. Ingalls, and R.A. Brockelman, “Fourth Test of General Relativity: Preliminary Results,” Phys. Rev. Lett. 20(22), 1968, pp. 1265–1269.
71. I.I. Shapiro, “Radar Determination of the Astronomical Unit,”Proc. Int. Astronomy Union, Paris, 20 Sept. 1965, pp. 177–215[submitted].
72. S. Weinreb, A.H. Barrett, M.L. Meeks, and J.C. Henry, “RadioObservations of OH in the Interstellar Medium,”Nature 200(4909), 1963, pp. 829–831.
73. H.F. Hinteregger, “A Long Baseline Interferometer System with Extended Bandwidth,” NEREM Record 1968, Boston, 6– 8 1968, pp. 66–67.
74. A.E.E. Rogers, “Very Long Baseline Interferometry with LargeEffective Bandwidth for Phase-Delay Measurements,” RadioSci. 5 (10), 1970, pp. 1239–1247.
75. I.I. Shapiro and C.A. Knight, “Geophysical Applications of Long-Baseline Radio Interferometry,” in Earthquake Displace-ment Fields and the Rotation of the Earth, L. Mansinha, D.E.Smylie, and A.E. Beck, eds. (Springer-Verlag, New York,1970), pp. 284–301.
76. I.I. Shapiro, D.S. Robertson, C.A. Knight, C.C. CounselmanIII, A.E.E. Rogers, H.F. Hinteregger, S. Lippincott, A.R.
Whitney, T.A. Clark, A.E. Niell, and D.J. Spitzmesser, “Trans-continental Baselines and the Rotation of the Earth Measured
by Radio Interferometry,” Science 186 (4167), 1974, pp. 920–922.77. T.A. Herring, I.I. Shapiro, T.A. Clark, C. Ma, J.W. Ryan, B.R.
Schupler, C.A. Knight, G. Lundqvist, D.B. Shaffer, N.R.Vandenberg, B.E. Corey, H.F. Hinteregger, A.E.E. Rogers,
J.C. Webber, A.R. Whitney, G. Elgered, B.O. Ronnang, and J.L. Davis, “Geodesy by Radio Interferometry: Evidence forContemporary Plate Motion,” J. Geophys. Res. 91 (B8), 1986,pp. 8341–8347.
78. G.H. Pettengill, “Measurements of Lunar Reflectivity Usingthe Millstone Radar,” Proc. IRE 48 (5), 1960, pp. 933–934.
79. S.J. Fricker, “Comparison of Measured and Computed Valuesof the Rapid Fading-Rate of Ultra High-Frequency Signals Re-flected from the Moon,” Nature (London) 182, 22 Nov. 1958,pp. 1438–1439.
80. J.C. James, L.E. Bird, R.P. Ingalls, M.L. Stone, J.W.B. Day,G.E.K. Lockwood, and R.I. Presnell, “Observed Characteris-tics of an Ultra-High-Frequency Signal Traversing an AuroralDisturbance,” Nature 185 (4172), 1960, pp. 510–512.
81. G.H. Pettengill and J.C. Henry, “Enhancement of Radar Re-flectivity Associated with the Lunar Crater Tycho,” J. Geophys.Res. 67 (12), pp. 4881–4885.
82. G.H. Pettengill and T.W. Thompson, “A Radar Study of theLunar Crater Tycho at 3.8-cm and 70-cm Wavelengths,” Icarus 8 (3), 1968, pp. 457–471.
83. J.V. Evans and T. Hagfors, “Radar Studies of the Moon,” in Advances in Astronomy and Astrophysics, vol. 8, Z. Kopal, ed.(Academic Press, London, U.K., 1971), pp. 29–106.
84. G.H. Pettengill and L.G. Kraft, Jr., “Earth Satellite Observa-tions Made with the Millstone Hill Radar,” AGARD Avionics Panel Mtg., Copenhagen, 20–25 Oct. 1958, pp. 125–134.
85. R.R. Silva, private communications.86. G.L. Guernsey and C.B. Slade, “Observations of a Synchro-
nous Satellite with the Haystack Radar,” Technical Note 1972-
41, Lincoln Laboratory (13 Dec. 1972), DTIC #AD-754937.87. G.P. Banner, private communications.88. L.B. Spence, A.F. Pensa, and T.E. Clark, “Radar Observations
of the IMP-6 Spacecraft at Very Long Range,” Proc. IEEE 62(12), 1974, pp. 1717–1718.
89. A.F. Pensa and R. Sridharan, private communications withG.P. Banner.
90. NASA Goddard Satellite Situation Report, Aug. 2000, <http://oig1.gsfc.nasa.gov>.
91. Jane’s Radar and Electronic Warfare Systems, 2000–2001, M.Streetly, ed. (Jane’s Information Group, Coulsdon, Surrey,U.K., 2000).
92. K.R. Roth, M.E. Austin, D.J. Frediani, G.H. Knittel, and A.V.Mrstik, “The Kiernan Reentry Measurements System onKwajalein Atoll,” Linc. Lab. J. 2 (2), 1989, pp. 247–276.
93. E.M. Gaposchkin and A.J. Coster, “Analysis of Satellite Drag,”Linc. Lab. J. 1 (2), 1988, pp. 203–224.
Page 28
8/3/2019 Radars for Detection and Tracking
http://slidepdf.com/reader/full/radars-for-detection-and-tracking 28/28
• STONE AND BANNER Radars for the Detection and Tracking of Ballistic Missiles, Satellites and Planets
.
is a senior staff member in the Air Traffic Control Systemsgroup, which develops tech-nology for monitoring andcontrolling aircraft operations.
Mel received an S.B. in electri-cal engineering from MIT in1951. He participated in thedevelopment of weather-radartechniques as a member of thestaff of the MIT Departmentof Meteorology Weather RadarLaboratory from 1948 to1951. Since he joined LincolnLaboratory, forty years ago, hisresearch interests have in-cluded weather radar, HFground-wave radar, the lunaralbedo at UHF, auroral back-scatter and propagation effects
related to ballistic missiledefense, and the perturbationof the ionosphere caused by missile exhaust. He played akey role in system engineeringduring the construction of theHaystack radar facility and inthe development of the 500-kW average power, X-bandradar used in the fourth test of general relativity. Mel was theleader of the group responsiblefor testing and demonstrationof the developmental air-to-ground radar that employed
the displaced phase centerconcept. This radar was theprogenitor of the U.S. AirForce/Army Joint Standoff Target Attack Radar System(Joint STARS). He serves as aconsultant to the Federal
Aviation Administration onradar systems for aircraft and
weather surveillance. He is amember of the IEEE, the
American Geophysical Union,Si Xi d E K N
.
received S.B., S.M., and E.E.degrees from MIT before
joining MIT Lincoln Labora-tory in 1972. He is currently the leader of the Space Control
Systems group, which focuseson the development of systemsand techniques primarily addressing space-surveillanceapplications. That effort in-volves deep-space radars atMillstone Hill, electro-opticssensors, and the operationaldemonstration of an orbitingSpace-Based Visible (SBV)sensor for space-surveillanceapplications. Previously he wasa principal in the developmentof the Millstone Hill radar asthe first deep-space tracking
radar and a contributor to theestablishment of the Experi-mental Test System (ETS) as aprototype for ground-basedelectro-optical space-surveil-lance system (GEODSS). Hehas also been a participant inseveral campaigns and studiesrelated to the measurementand estimation of space debris.Recently he has been involvedin several studies addressingthe architecture of futurespace-surveillance systems. Heis a member of the IEEE, Tau
Beta Pi, and Eta Kappa Nu.