Radiant City “ The cities will be part of the country; I shall live 30 miles from my office in one direction, under a pine tree; my secretary will live 30 miles away from it too, in the other direction, under another pine tree. We shall both have our own car. Weshalluseuptires,wearoutroadsurfacesandgears,andconsume oilandgasoline. Allofwhichwillnecessitateagreatdealofwork…enough for all. ” -- Le Corbusier, The Radiant City 1967
Transcript
Radiant City
“ The cities will be part of the country; I shall live 30 miles from my office in one direction, under a pine tree; my secretary will live 30 miles away from it too, in the other direction, under another pine tree. We shall both have our own car. We shall use up tires, wear out road surfaces and gears, and consume oil and gasoline. All of which will necessitate a great deal of work… enough for all. ”
-- Le Corbusier, The Radiant City 1967
0 10 20km
143 144
Regional Plan
Main Urban Connections
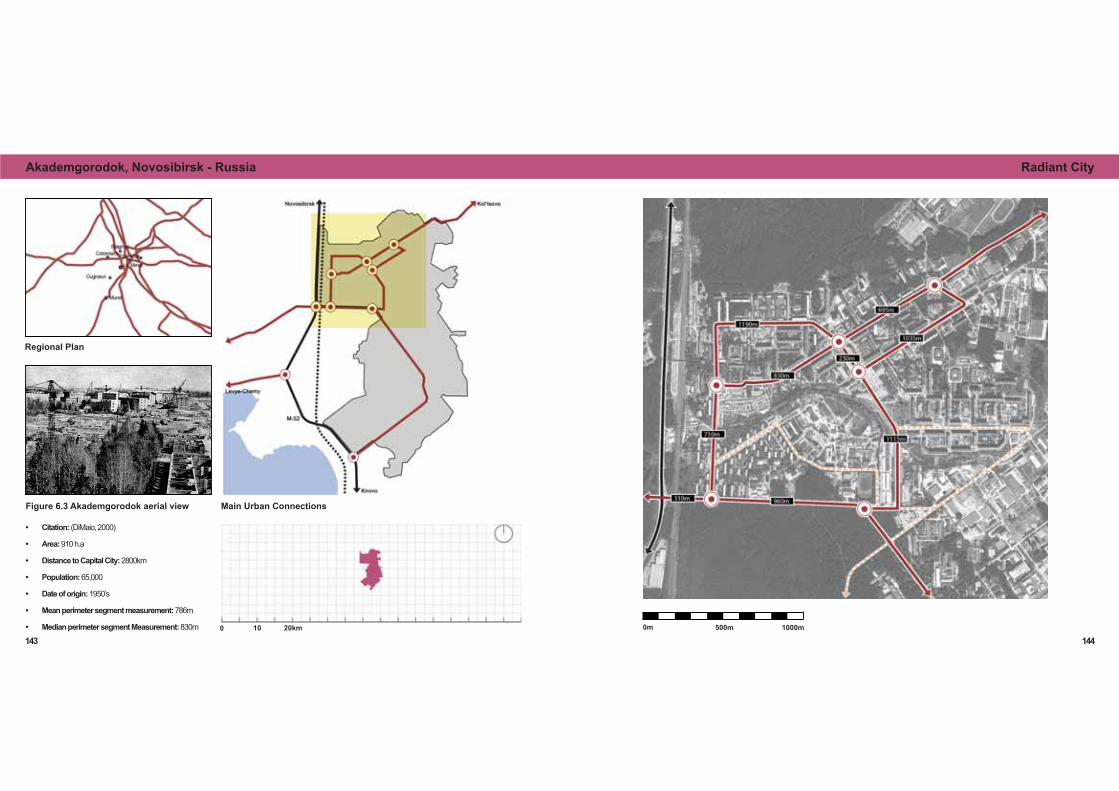
Akademgorodok, Novosibirsk - Russia Radiant City
Figure 6.3 Akademgorodok aerial view
0m 500m 1000m
Citation: • (DiMaio, 2000)
Area:• 910 h.a
Distance to Capital City: • 2800km
Population: • 65,000
Date of origin: • 1950’s
Mean perimeter segment measurement: • 786m
Median perimeter segment Measurement: • 830m
0 10 20km
145 146
Regional Plan
Main Urban Connections
Barbican Estate, London - UK Radiant City
Figure 6.4 Courtyard block in Barbican
0m 500m 1000m
Citation: • (Chant & Goodman, 1999)
Area:• 22.8 h.a
Distance to Capital City: • N/A
Population: • 4,000
Date of origin: • 1969
Mean perimeter segment measurement: • 218m
Median perimeter segment Measurement: • 175m
0 10 20km
147 148
Regional Plan
Main Urban Connections
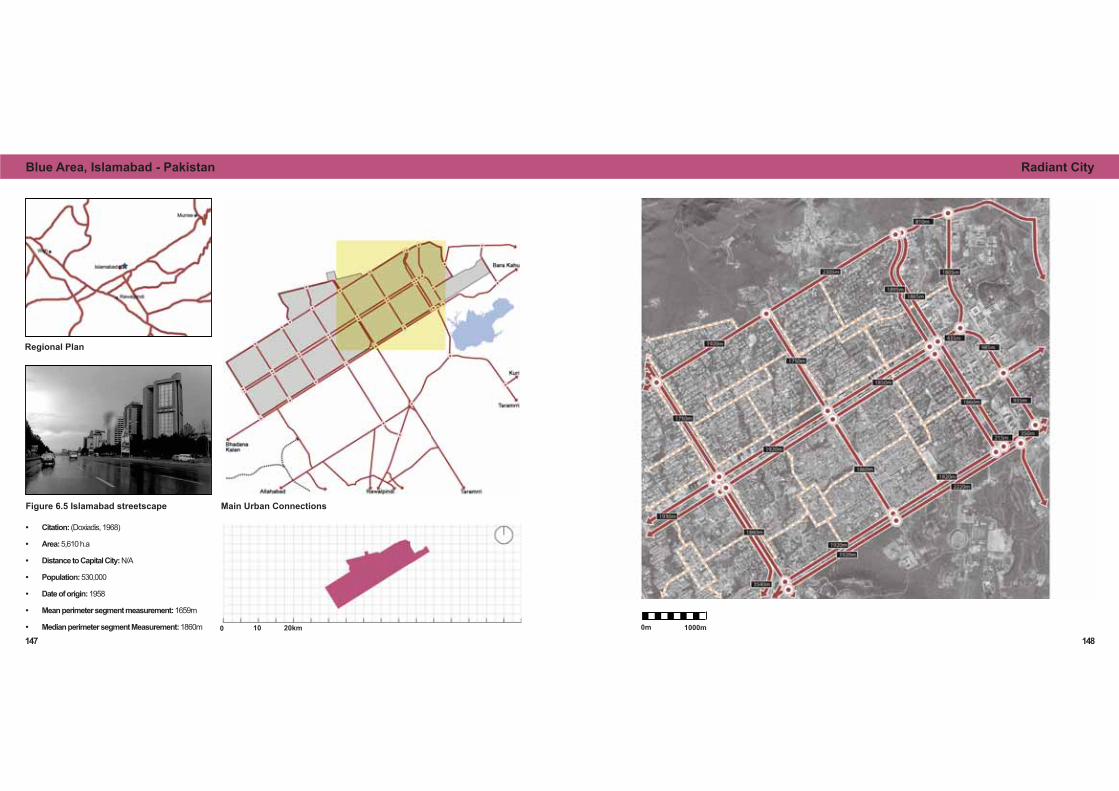
Blue Area, Islamabad - Pakistan Radiant City
Figure 6.5 Islamabad streetscape
0m 1000m
Citation: • (Doxiadis, 1968)
Area:• 5,610 h.a
Distance to Capital City: • N/A
Population: • 530,000
Date of origin: • 1958
Mean perimeter segment measurement: • 1659m
Median perimeter segment Measurement: • 1860m
0 10 20km
149 150
Regional Plan
Main Urban Connections
Brasilia, F.D. - Brasil Radiant City
Figure 6.6. Brasilia aerial view
0m 1000m
Citation: • (Hall, 2002)
Area:• 4,695 h.a
Distance to Capital City: • N/A
Population: • 2,600,000
Date of origin: • 1960
Mean perimeter segment measurement: • 1537m
Median perimeter segment Measurement: • 950m
0 10 20km
151 152
Regional Plan
Main Urban Connections
Cabrini Green, Chicago - USA Radiant City
Figure 6.7 Cabrini Green housing scheme
0m 500m 1000m
Citation: • (Miller, 2008)
Area:• 66.8 h.a
Distance to Capital City: • 968km
Population: • 15,000
Date of origin: • 1942 - 2008
Mean perimeter segment measurement: • 431m
Median perimeter segment Measurement: • 400m
0 10 20km
153 154
Regional Plan
Main Urban Connections
Chandigarh - India Radiant City
Figure 6.8 Chandigarh personal image
0m 500m 1000m
Citation: • (Evenson, 1966)
Area:• 12,267 h.a
Distance to Capital City: • 230km
Population: • 900,000
Date of origin: • 1953
Mean perimeter segment measurement: • 1065m
Median perimeter segment Measurement: • 1270m
0 10 20km
155 156
Regional Plan
Main Urban Connections
Co-op city, New York - USA Radiant City
Figure 6.9 Co-op City streetscape
0m 500m 1000m
Citation: • (Hall, 2002)
Area:• 97.6 h.a
Distance to Capital City: • 330km
Population: • 55,000+
Date of origin: • 1973
Mean perimeter segment measurement: • 776m
Median perimeter segment Measurement: • 839m
0 10 20km
157 158
Regional Plan
Main Urban Connections
Cumbernauld - UK Radiant City
Figure 7.0 Aerial view of Cumbernauld
0m 500m 1000m
Citation: • (Merlin, 1969)
Area:• 91.4 h.a
Distance to Capital City: • 560km
Population: • 49,664
Date of origin: • 1956
Mean perimeter segment measurement: • 799m
Median perimeter segment Measurement: • 500m
0 10 20km
159 160
Regional Plan
Main Urban Connections
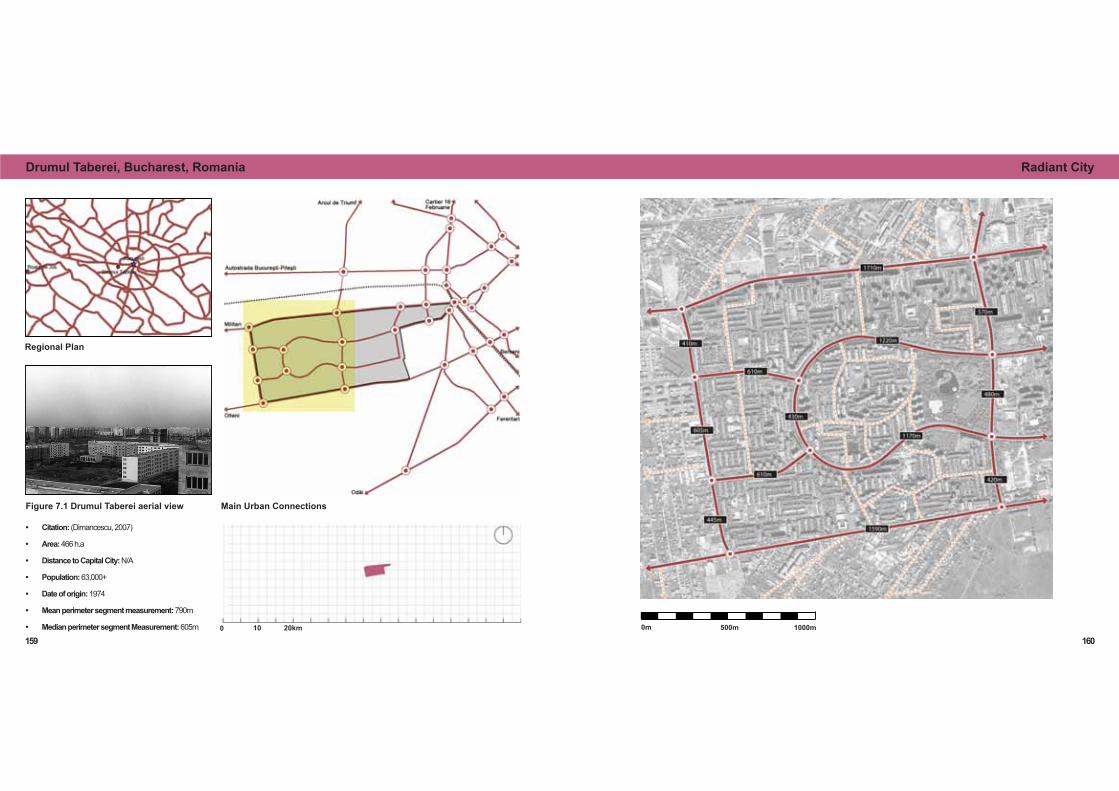
Drumul Taberei, Bucharest, Romania Radiant City
Figure 7.1 Drumul Taberei aerial view
0m 500m 1000m
Citation: • (Dimancescu, 2007)
Area:• 466 h.a
Distance to Capital City: • N/A
Population: • 63,000+
Date of origin: • 1974
Mean perimeter segment measurement: • 790m
Median perimeter segment Measurement: • 605m
0 10 20km
161 162
Regional Plan
Main Urban Connections
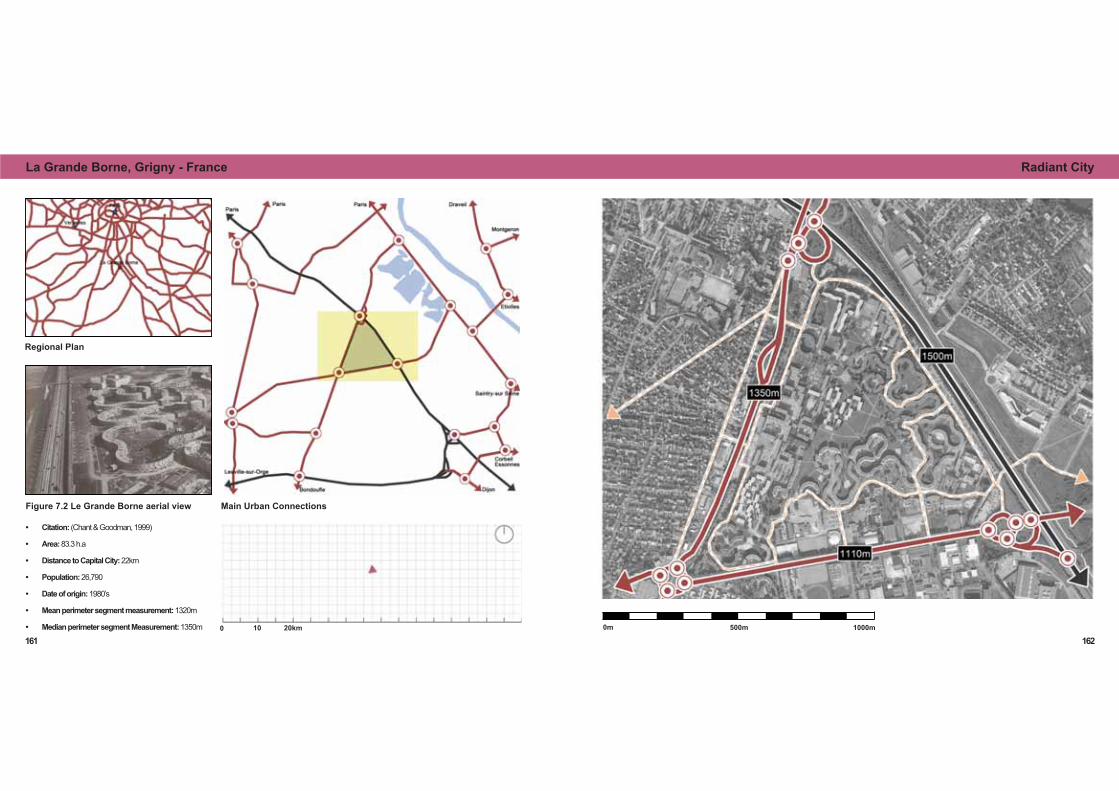
La Grande Borne, Grigny - France Radiant City
Figure 7.2 Le Grande Borne aerial view
0m 500m 1000m
Citation: • (Chant & Goodman, 1999)
Area:• 83.3 h.a
Distance to Capital City: • 22km
Population: • 26,790
Date of origin: • 1980’s
Mean perimeter segment measurement: • 1320m
Median perimeter segment Measurement: • 1350m
0 10 20km
163 164
Regional Plan
Main Urban Connections
Le Mirail, Toulouse - France Radiant City
Figure 7.3 Le Mirail aerial view
0m 500m 1000m
Citation: • (Chant & Goodman, 1999)
Area:• 239 h.a
Distance to Capital City: • 580km
Population: • 27,500
Date of origin: • 1968
Mean perimeter segment measurement: • 567m
Median perimeter segment Measurement: • 565m
0 10 20km
165 166
Regional Plan
Main Urban Connections
Marzahn, Berlin - Germany Radiant City
Figure 7.4 Aerial view of Marzhan
0m 500m 1000m
Citation: • (Appleyard, 1976)
Area:• 595 h.a
Distance to Capital City: • N/A
Population: • 102,309
Date of origin: • 1977
Mean perimeter segment measurement: • 1064m
Median perimeter segment Measurement: • 1125m
0 10 20km
167 168
Regional Plan
Main Urban Connections
Milton Keynes - UK Radiant City
Figure 7.5 Aerial view of Milton Keynes
0m 500m 1000m
Citation: • (Kostof, 1991)
Area:• 8,180 h.a
Distance to Capital City: • 70km
Population: • 195,687
Date of origin: • 1967
Mean perimeter segment measurement: • 1074m
Median perimeter segment Measurement: • 1030m
0 10 20km
169 170
Regional Plan
Main Urban Connections
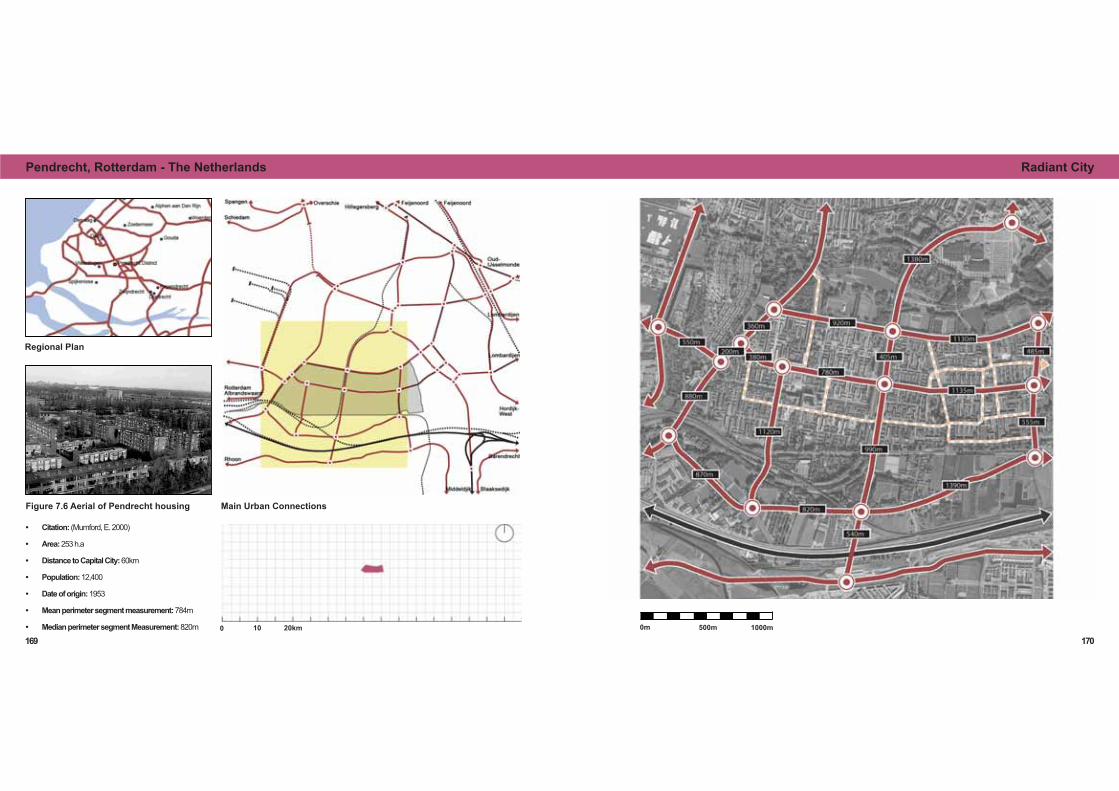
Pendrecht, Rotterdam - The Netherlands Radiant City
Figure 7.6 Aerial of Pendrecht housing
0m 500m 1000m
Citation: • (Mumford, E. 2000)
Area:• 253 h.a
Distance to Capital City: • 60km
Population: • 12,400
Date of origin: • 1953
Mean perimeter segment measurement: • 784m
Median perimeter segment Measurement: • 820m
0 10 20km
171 172
Regional Plan
Main Urban Connections
Pruitt-Igoe, St. Louis - USA Radiant City
Figure 7.7 Aerial of Pruitt - Igoe
0m 500m 1000m
Citation: • (Miller, 2008)
Area:• 49.3 h.a
Distance to Capital City: • 1146km
Population: • 2,740 units
Date of origin: • 1954 - 1972
Mean perimeter segment measurement: • 489m
Median perimeter segment Measurement: • 550m
0 10 20km
173 174
Regional Plan
Main Urban Connections
Regent Park, Toronto - Canada Radiant City
Figure 7.8 Regent Park aerial sketch
0m 500m 1000m
Citation: • (Littlewood, 1967)
Area:• 19 h.a
Distance to Capital City: • 352km
Population: • 10,385 units
Date of origin: • 1940’s
Mean perimeter segment measurement: • 383m
Median perimeter segment Measurement: • 360m
0 10 20km
175 176
Regional Plan
Main Urban Connections
Roehampton, London - UK Radiant City
Figure 7.9 Roehampton - 1953
0m 500m 1000m
Citation: • (Chant & Goodman, 1999)
Area:• 20.3 h.a
Distance to Capital City: • N/A
Population: • 13,000
Date of origin: • 1950’s
Mean perimeter segment measurement: • 705m
Median perimeter segment Measurement: • 1210m
0 10 20km
177 178
Regional Plan
Main Urban Connections
Stuyvesant Town, New York - USA Radiant City
Figure 8.0 Aerial of Stuyvesant Town
0m 500m 1000m
Citation: • (Hall, 2002)
Area:• 41 h.a
Distance to Capital City: • 330km
Population: • 25,000
Date of origin: • 1947
Mean perimeter segment measurement: • 484m
Median perimeter segment Measurement: • 490m
0 10 20km
179 180
Regional Plan
Main Urban Connections
The Grand Ensemble of Sarcelles, Paris - France Radiant City
Figure 8.1 Sarcelles - 1978
0m 500m 1000m
Citation: • (Chant & Goodman, 1999)
Area:• 275 h.a
Distance to Capital City: • N/A
Population: • 60,196
Date of origin: • 1960’s
Mean perimeter segment measurement: • 710m
Median perimeter segment Measurement: • 645m
0 10 20km
181 182
Regional Plan
Main Urban Connections
Tsukuba Science City - Japan Radiant City
Figure 8.2 Aerial view of Tsukuba
0m 500m 1000m
Citation: • (Burton, 2002)
Area:• 448 h.a
Distance to Capital City: • 50km
Population: • 207,000
Date of origin: • 1960’s
Mean perimeter segment measurement: • 797m
Median perimeter segment Measurement: • 840m
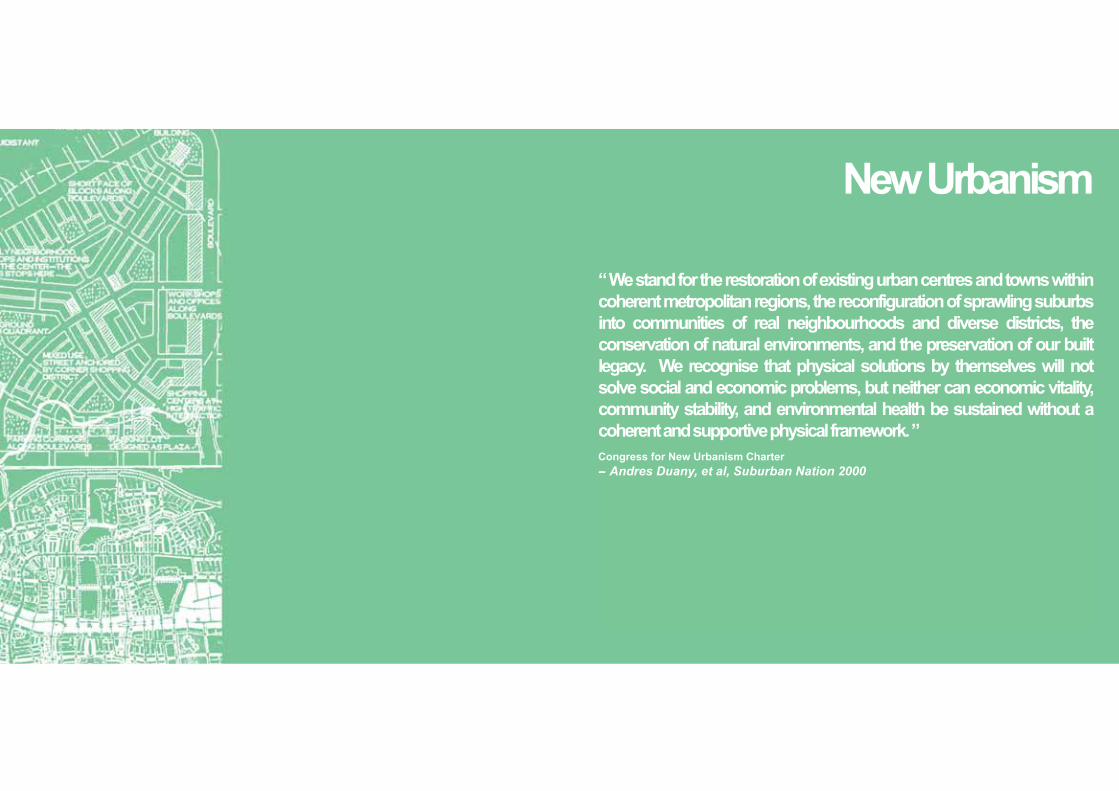
New Urbanism
“ We stand for the restoration of existing urban centres and towns within coherent metropolitan regions, the reconfiguration of sprawling suburbs into communities of real neighbourhoods and diverse districts, the conservation of natural environments, and the preservation of our built legacy. We recognise that physical solutions by themselves will not solve social and economic problems, but neither can economic vitality, community stability, and environmental health be sustained without a coherent and supportive physical framework. ”Congress for New Urbanism Charter-- Andres Duany, et al, Suburban Nation 2000
0 10 20km
185 186
Regional Plan
Main Urban Connections
Brentwood - USA New Urbanism
Figure 8.3 Brentwood neighbourhood
0m 500m 1000m
Citation: • (Katz,1994)
Area:• 3,286 h.a
Distance to Capital City: • 3700km
Population: • 4,200
Date of origin: • 2005
Mean perimeter segment measurement: • 1130m
Median perimeter segment Measurement: • 815m
0 10 20km
187 188
Regional Plan
Main Urban Connections
Celebration - USA New Urbanism
Figure 8.4 Celebration aerial view
0m 500m 1000m
Citation: • (Dunlop, 1998)
Area:• 511 h.a
Distance to Capital City: • 1200km
Population: • 11,860
Date of origin: • 1990
Mean perimeter segment measurement: • 414m
Median perimeter segment Measurement: • 430m
0 10 20km
189 190
Regional Plan
Main Urban Connections
Communications Hill, Sacramento - USA New Urbanism
Figure 8.5 Communications Hill masterplan
0m 500m 1000m
Citation: • (Katz, 1994)
Area:• 766 h.a
Distance to Capital City:• 3800km
Population: • 28,00 units
Date of origin: • 2010
Mean perimeter segment measurement: • 848m
Median perimeter segment Measurement: • 760m
0 10 20km
191 192
Regional Plan
Main Urban Connections
Kentlands, Gathiersburg - USA New Urbanism
Figure 8.6 Kentlands town centre
0m 500m 1000m
Citation: • (Duany & Plater-Zyberk, 1992)
Area:• 99.5 h.a
Distance to Capital City: • 30km
Population: • 2000 homes
Date of origin: • 1990
Mean perimeter segment measurement: • 739m
Median perimeter segment Measurement: • 665m
0 10 20km
193 194
Regional Plan
Main Urban Connections
Laguna West, Sacramento - USA New Urbanism
Figure 8.7. Laguna West residential street-
0m 500m 1000m
Citation: • (Katz, 1994)
Area:• 726 h.a
Distance to Capital City: • 3800km
Population: • 8,414
Date of origin: • 1991
Mean perimeter segment measurement: • 1280m
Median perimeter segment Measurement:• 1090m
0 10 20km
195 196
Regional Plan
Main Urban Connections
Orenco Station, Portland - United States New Urbanism
Figure 8.8 Orenco Station masterplan
0m 500m
Citation: • (Hulme, 2005)
Area:• 70 h.a
Distance to Capital City: • 3700km
Population: • >46,124
Date of origin: • 1997
Mean perimeter segment measurement: • 388m
Median perimeter segment Measurement: • 355m
0 10 20km
197 198
Regional Plan
Main Urban Connections
Poundbury - UK New Urbanism
Figure 8.9 Poundbury aerial view
0m 500m 1000m
Citation: • (Duany & Plater-Zyberk, 1992)
Area:• 38 h.a
Distance to Capital City: • 186km
Population: • 6,000
Date of origin: • 1993
Mean perimeter segment measurement: • 634m
Median perimeter segment Measurement: • 820m
0 10 20km
199 200
Regional Plan
Main Urban Connections
Rosemary Beach - USA New Urbanism
Figure 9.0 Rosemary Beach masterplan
0m 500m 1000m
Citation: • (Katz, 1994)
Area:• 38.8 h.a
Distance to Capital City: • 1250km
Population: • 500 homes
Date of origin: • 1995
Mean perimeter segment measurement: • 1723m
Median perimeter segment Measurement: • 1655m
0 10 20km
201 202
Regional Plan
Main Urban Connections
Seaside - USA New Urbanism
Figure 9.1 Seaside aerial view
0m 500m 1000m
Citation: • (Duany & Plater-Zyberk, 1992)
Area:• 26 h.a
Distance to Capital City: • 1250km
Population: • 2,000
Date of origin: • 1979
Mean perimeter segment measurement: • 1078m
Median perimeter segment Measurement: • 1030m
0 10 20km
203 204
Regional Plan
Main Urban Connections
Windsor, Vero Beach - USA New Urbanism
Figure 9.2 Windsor masterplan
0m 500m 1000m
Citation: • (Duany & Plater-Zyberk, 1992)
Area:• 175 h.a
Distance to Capital City: • 1286km
Population: • 350 homes
Date of origin: • 1989
Mean perimeter segment measurement: • 519m
Median perimeter segment Measurement: • 405m
Informal Settlement
“ Dharavi, a Mumbai slum where 600,000 residents are crammed into 520 acres, contains the attributes for environmentally and socially sustainable settlements for the world’s increasingly urban population, he said. The district’s use of local materials, its walkable neighbourhoods, and mix of employment and housing add up to “an underlying intuitive grammar of design that is totally absent from the faceless slab blocks that are still being built around the world to ‘warehouse’ the poor. ”
-- Prince Charles 2009
0 10 20km
207 208
Regional Plan
Main Urban Connections
Badli, New Dehli - India Informal Settlement
Figure 9.3 Typical Badli slum
0m 500m 1000m
Citation: • (UN Habitat, 1982)
Area:• 336 h.a
Distance to Capital City: • N/A
Population: • 45,200
Date of origin: • 1961
Mean perimeter segment measurement: • 352m
Median perimeter segment Measurement: • 330m
0 10 20km
209 210
Regional Plan
Main Urban Connections
Barrio La Union, Caracus - Venezuala
Figure 9.4 Aerial View of Barrio La Union
0m 500m 1000m
Informal Settlement
Citation: • (Juppenlats, 1970)
Area:• 468 h.a
Distance to Capital City: • N/A
Population: • Unknown
Date of origin: • 1940’s
Mean perimeter segment measurement: • 405m
Median perimeter segment Measurement: • 395m
0 10 20km
211 212
Regional Plan
Main Urban Connections
Cemetery Squatters, Port au Prince - Haiti
Figure 9.5 Port au Prince slum
0m 500m
Informal Settlement
Citation: • (Keerwin, 2010)
Area:• 9.3 h.a
Distance to Capital City: • N/A
Population: • 100,000
Date of origin: • 1960
Mean perimeter segment measurement: • 279m
Median perimeter segment Measurement: • 310m
0 10 20km
213 214
Regional Plan
Main Urban Connections
Dharavi, Mumbai - India
Figure 9.6 Dharavi slum
0m 500m 1000m
Informal Settlement
Citation: • (Neuwrith, 2005)
Area:• 534.8 h.a
Distance to Capital City: • 1140km
Population: • 1,000,000
Date of origin: • 1930
Mean perimeter segment measurement: • 308m
Median perimeter segment Measurement: • 290m
0 10 20km
215 216
Regional Plan
Main Urban Connections
Hanna Nassif, Dar-es-Salaam - Tanzania
Figure 9.7 Hanna Nassif Slum
0m 500m 1000m
Informal Settlement
Citation: • (Obudho & Mhlanga, 1988)
Area:• 35.8 h.a
Distance to Capital City: • 388km
Population: • 23,000
Date of origin: • 1960’s
Mean perimeter segment measurement: • 298m
Median perimeter segment Measurement: • 300m
0 10 20km
217 218
Regional Plan
Main Urban Connections
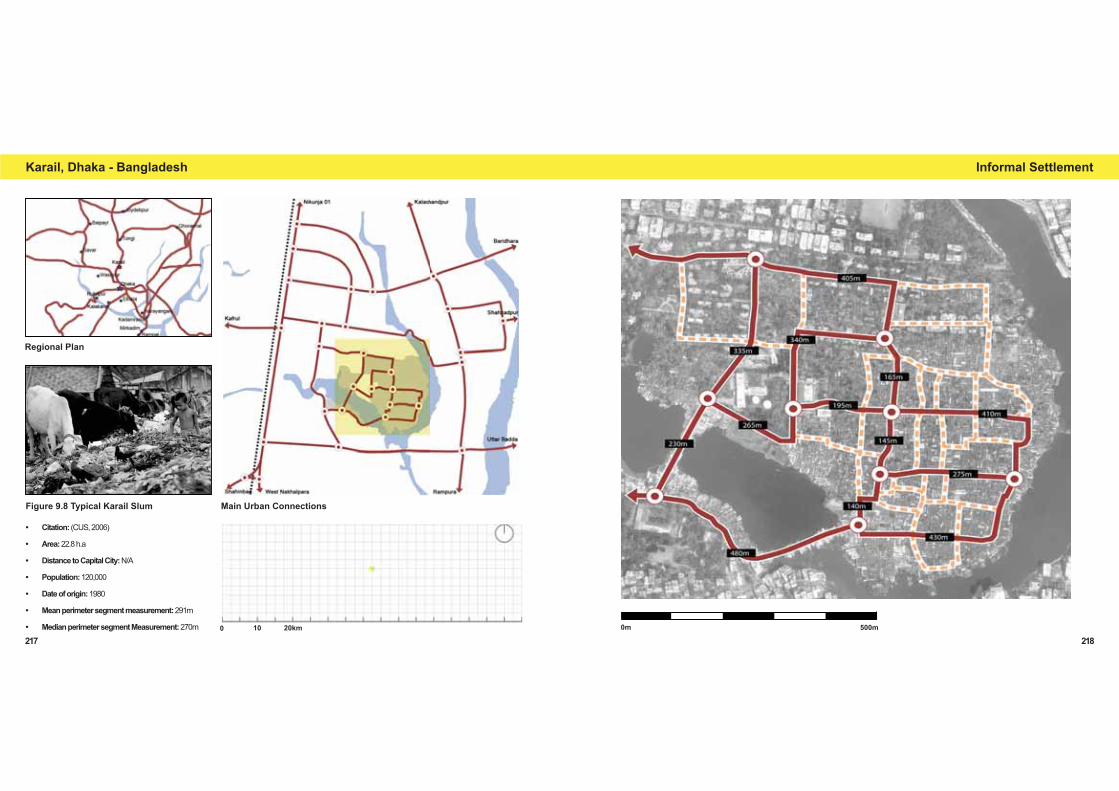
Karail, Dhaka - Bangladesh
Figure 9.8 Typical Karail Slum
0m 500m
Informal Settlement
Citation: • (CUS, 2006)
Area:• 22.8 h.a
Distance to Capital City: • N/A
Population:• 120,000
Date of origin: • 1980
Mean perimeter segment measurement: • 291m
Median perimeter segment Measurement: • 270m
0 10 20km
219 220
Regional Plan
Main Urban Connections
Khayelitsha, Cape town - South Africa
Figure 9.9 Streetscape of Khayelitsha slum
0m 500m 1000m
Informal Settlement
Citation: • (MCA Africa, 2006)
Area:• 2,312 h.a
Distance to Capital City: • 1300km
Population: • 406,779
Date of origin: • 1957
Mean perimeter segment measurement: • 1094m
Median perimeter segment Measurement: • 1060m
0 10 20km
221 222
Regional Plan
Main Urban Connections
Kibera, Nairobi - Kenya
Figure 10.0 Kibera Slum
0m 500m 1000m
Informal Settlement
Citation: • (Obudho & Mhlanga, 1988)
Area:• 143 h.a
Distance to Capital City: • N/A
Population: • 1,000,000
Date of origin: • 1960
Mean perimeter segment measurement: • 269m
Median perimeter segment Measurement: • 268m
223 224
Regional Plan
Main Urban Connections
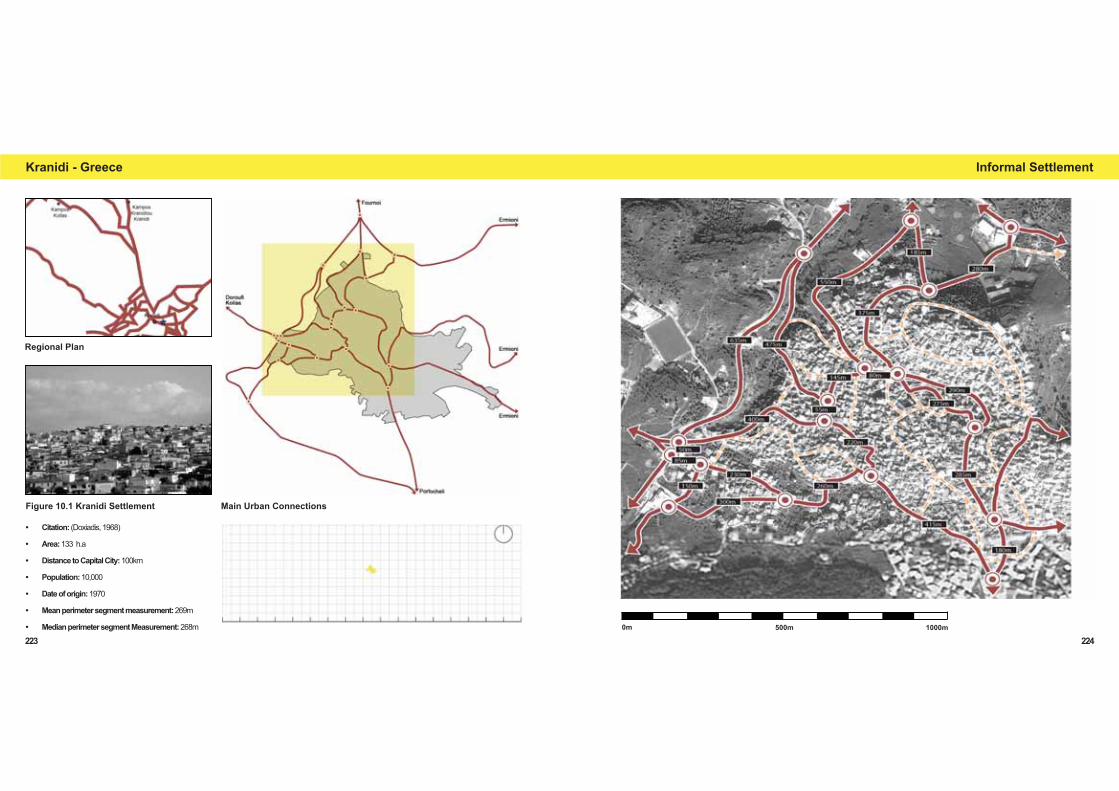
Kranidi - Greece
Figure 10.1 Kranidi Settlement
0m 500m 1000m
Informal Settlement
Citation: • (Doxiadis, 1968)
Area:• 133 h.a
Distance to Capital City: • 100km
Population: • 10,000
Date of origin: • 1970
Mean perimeter segment measurement: • 269m
Median perimeter segment Measurement: • 268m
0 10 20km
225 226
Regional Plan
Main Urban Connections
Kricak, Yogyakarta - Indonesia
Figure 10.2 Aerial view of Kricak slum
0m 500m 1000m
Informal Settlement
Citation: • (Duivesteijn & Van De Wal, 1994)
Area:• 174 h.a
Distance to Capital City: • 427km
Population: • 300,000
Date of origin: • 1950
Mean perimeter segment measurement: • 410m
Median perimeter segment Measurement: • 318m
0 10 20km
227 228
Regional Plan
Main Urban Connections
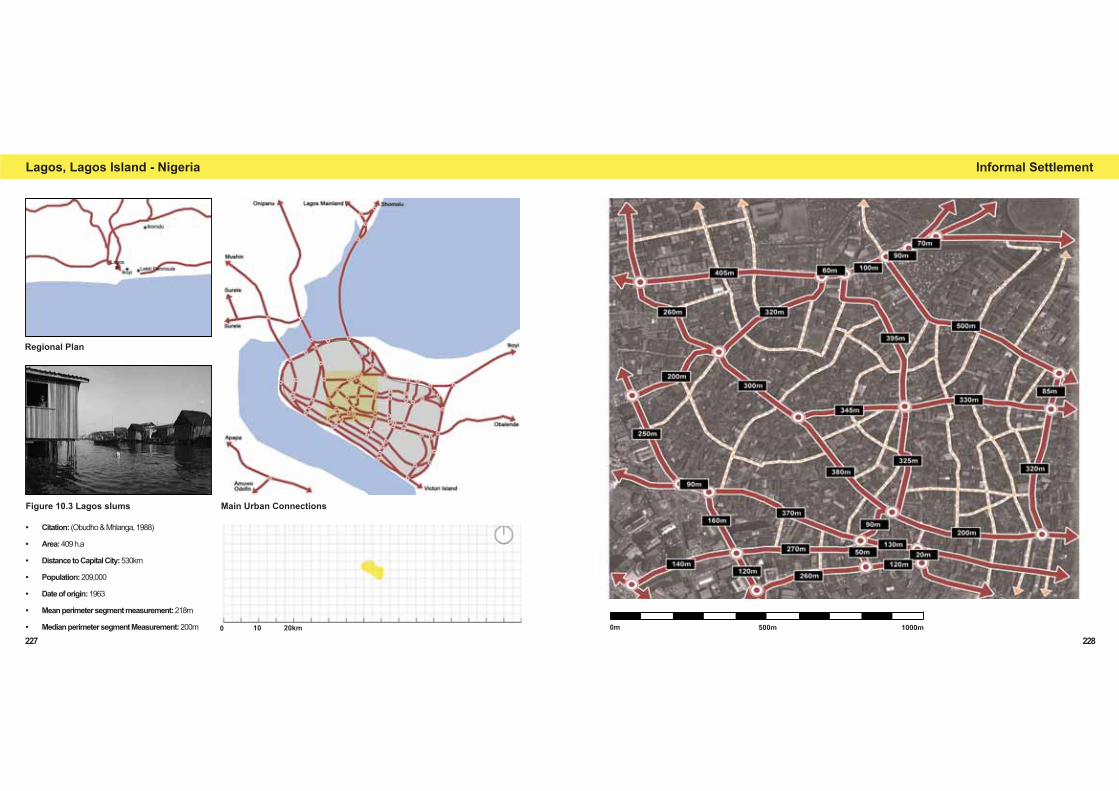
Lagos, Lagos Island - Nigeria
Figure 10.3 Lagos slums
0m 500m 1000m
Informal Settlement
Citation: • (Obudho & Mhlanga, 1988)
Area:• 409 h.a
Distance to Capital City: • 530km
Population: • 209,000
Date of origin: • 1963
Mean perimeter segment measurement: • 218m
Median perimeter segment Measurement: • 200m
0 10 20km
229 230
Regional Plan
Main Urban Connections
Las Colinas, Bogota - Columbia
Figure 10.4 Las Colinas slum
0m 500m 1000m
Informal Settlement
Citation: • (UN Habitat, 1982)
Area:• 489 h.a
Distance to Capital City: • N/A
Population: • 10,000
Date of origin: • 1960
Mean perimeter segment measurement: • 319m
Median perimeter segment Measurement: • 325m
0 10 20km
231 232
Regional Plan
Main Urban Connections
Hill Squatters, Lima - Peru
Figure 10.5 Lima aerial view
0m 500m 1000m
Informal Settlement
Citation: • (UN Habitat, 1982)
Area:• 228.4 h.a
Distance to Capital City: • N/A
Population: • Unknown
Date of origin: • 1960’s
Mean perimeter segment measurement: • 419m
Median perimeter segment Measurement: • 370m
0 10 20km
233 234
Regional Plan
Main Urban Connections
Mafalala, Maputo - Mozambique
Figure 10.6 Maputo slums
0m 500m
Informal Settlement
Citation: • (Obudho, Mhlanga, 1988)
Area:• 265 h.a
Distance to Capital City: • N/A
Population: • 22,000
Date of origin: • pre 1975
Mean perimeter segment measurement: • 375m
Median perimeter segment Measurement: • 440m
0 10 20km
235 236
Regional Plan
Main Urban Connections
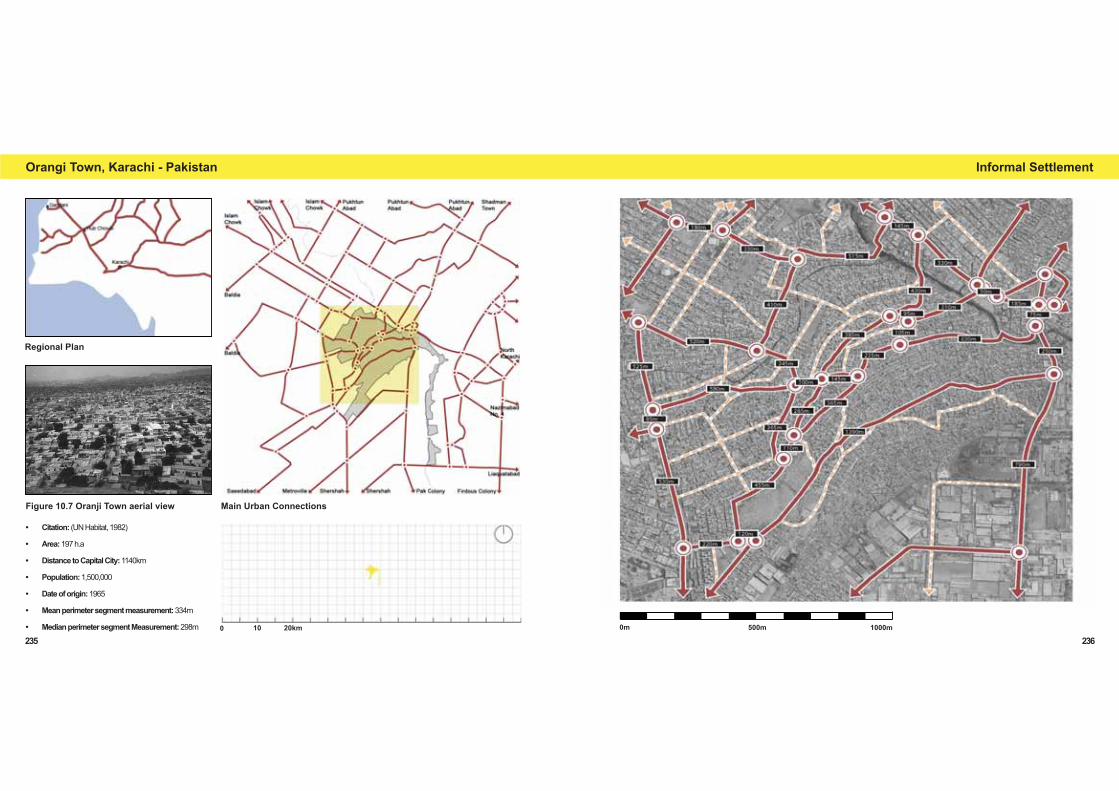
Orangi Town, Karachi - Pakistan
Figure 10.7 Oranji Town aerial view
0m 500m 1000m
Informal Settlement
Citation: • (UN Habitat, 1982)
Area:• 197 h.a
Distance to Capital City: • 1140km
Population: • 1,500,000
Date of origin: • 1965
Mean perimeter segment measurement: • 334m
Median perimeter segment Measurement: • 298m
0 10 20km
237 238
Regional Plan
Main Urban Connections
Rocinha, Rio De Janeiro - Brazil
Figure 10.8 Rocinha aerial view
0m 500m 1000m
Informal Settlement
Citation: • (Neuwirth, 2005)
Area:• 141 h.a
Distance to Capital City: • 930km
Population: • 250,000
Date of origin: • 1970’s
Mean perimeter segment measurement: • 337m
Median perimeter segment Measurement: • 360m
0 10 20km
239 240
Regional Plan
Main Urban Connections
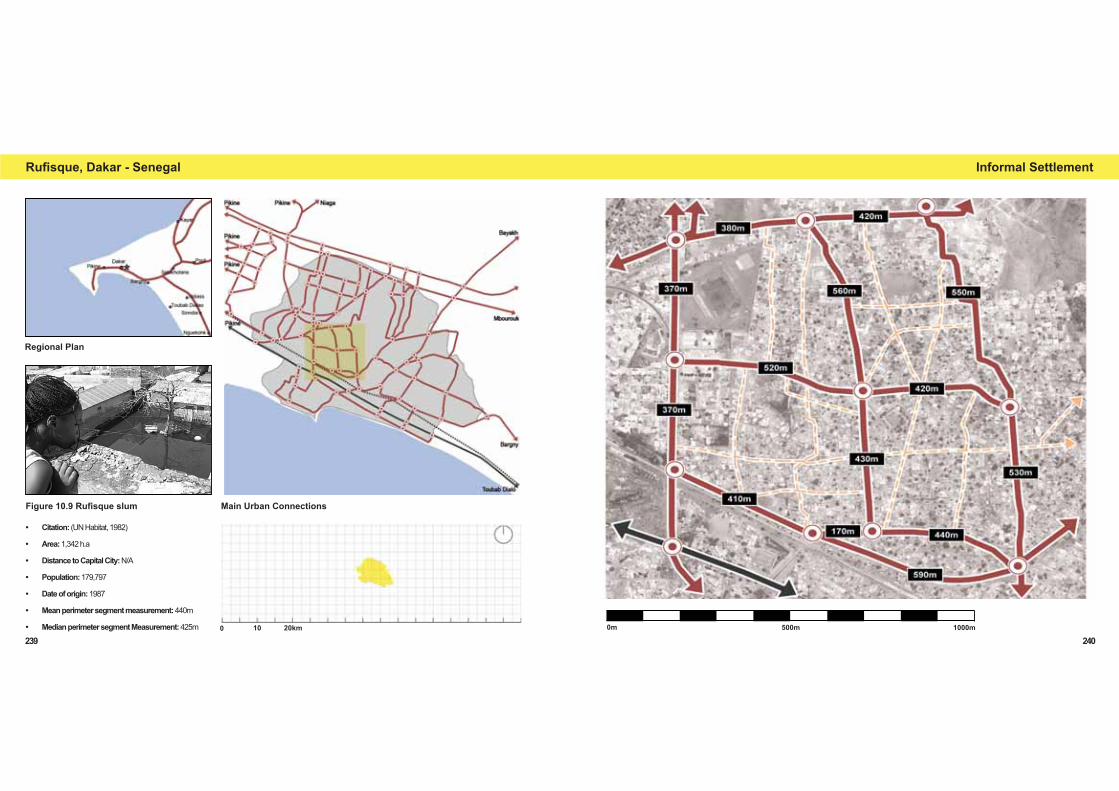
Rufisque, Dakar - Senegal
Figure 10.9 Rufisque slum
0m 500m 1000m
Informal Settlement
Citation: • (UN Habitat, 1982)
Area:• 1,342 h.a
Distance to Capital City: • N/A
Population: • 179,797
Date of origin: • 1987
Mean perimeter segment measurement: • 440m
Median perimeter segment Measurement: • 425m
0 10 20km
241 242
Regional Plan
Main Urban Connections
Tondo, Manila - Phillipiens
Figure 11.0 Tondo slum
0m 500m 1000m
Informal Settlement
Citation: • (UN Habitat, 1982)
Area:• 689 h.a
Distance to Capital City: • N/A
Population: • 630,000
Date of origin: • 900
Mean perimeter segment measurement: • 258m
Median perimeter segment Measurement: • 240m
0 10 20km
243 244
Regional Plan
Main Urban Connections
Urban Village, Shenzhen - China
Figure 11.1 Urban Village aerial view
0m 500m
Informal Settlement
Citation: • (Kiu, 2009 & Liu, 2009)
Area:• 237 h.a
Distance to Capital City: • 1930km
Population: • 70,000
Date of origin: • 1980’s
Mean perimeter segment measurement: • 205m
Median perimeter segment Measurement: • 180m
0 10 20km
245 246
Regional Plan
Main Urban Connections
West Point, Monrovia - Liberia
0m 500m 1000m
Informal Settlement
Citation: • (Obudho & Mhlanga, 1988)
Area:• 891 h.a
Distance to Capital City: • N/A
Population: • 75,000
Date of origin: • 1980’s
Mean perimeter segment measurement: • 310m
Median perimeter segment Measurement: • 320m
247 248
Comparative Scale Study: Historic Cities:
249 250
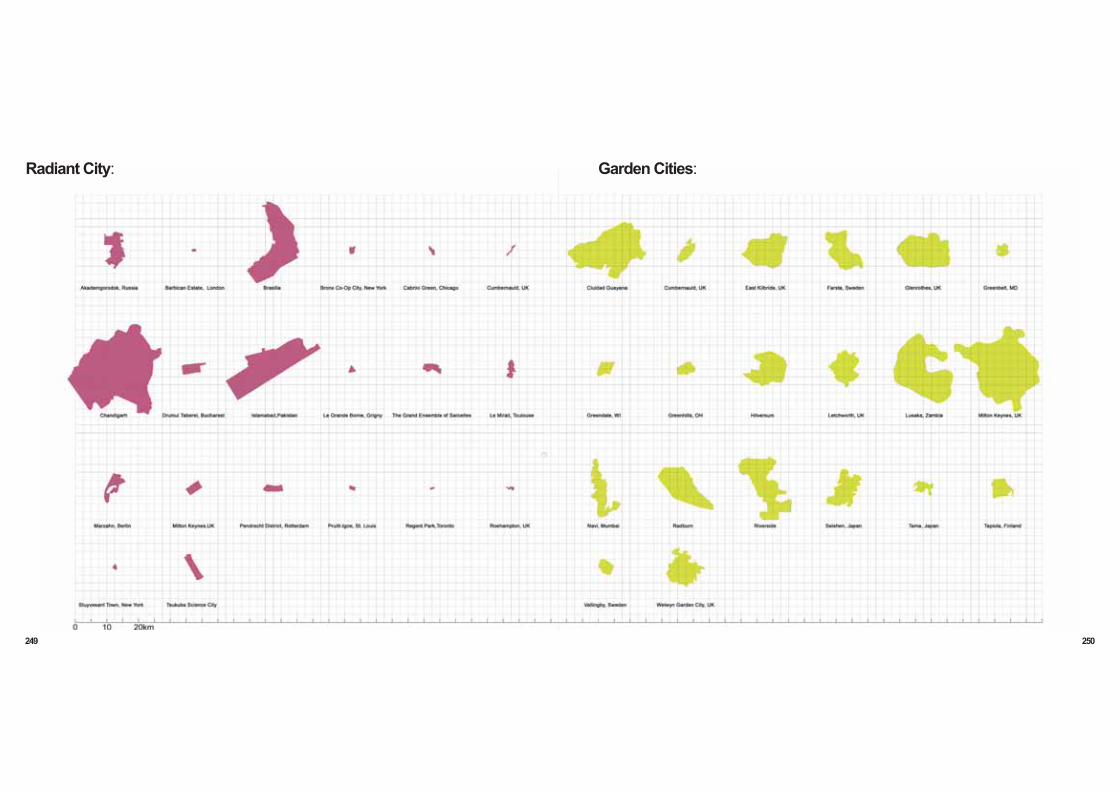
Radiant City: Garden Cities:
251 252
Informal Settlement: New Urbanism:
253 254
Akademgorodok
Brasilia
Barbican Estate
Ciudad Guayana
East Kilbride
Cumbernauld
Farsta
Greenbelt
Glenrothes
Delhi Brentwood
Caracus Communications Hill
Karachi Celebration
0m 0m
0m 0m
0m 0m
0m 0m
0m 0m
0m 0m
0m 0m
0m 0m
0m 0m
0m 0m
0m 0m
0m 0m
1000m 1000m
1000m 1000m
1000m 1000m
1000m 1000m
1000m 1000m
1000m 1000m
1000m 1000m
1000m 1000m
1000m 1000m
1000m 1000m
1000m 1000m
1000m 1000m
1000m 1000m
1000m 1000m
1000m 1000m
1000m 1000m
1000m 1000m
1000m 1000m
1000m 1000m
1000m 1000m
1000m 1000m
1000m 1000m
1000m 1000m
1000m 1000m
0m 0m
0m 0m
0m 0m
0m 0m
0m 0m
0m 0m
0m 0m
0m 0m
0m 0m
0m 0m
0m 0m
0m 0m
Radiant City Garden CityInformal Settlement Garden City
NON PTUD
Informal Settlement New Urbanism
PTUD
Barcelona
Boston
Bologna
Bremen
Chicago
Calcutta
Freudenstadt
Karlsruhe
Grammichelle
Historic Cities Historic Cities
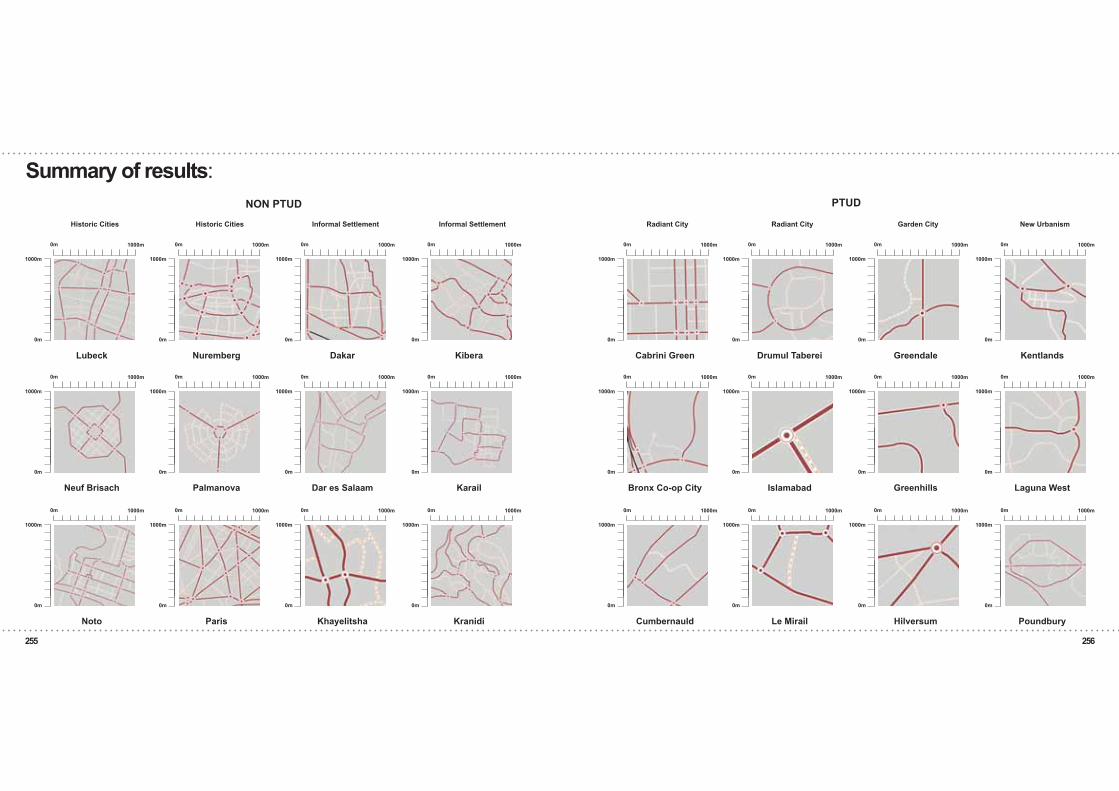
Summary of results:
255 256
Lubeck Cabrini Green
Noto Cumbernauld
Neuf Brisach Bronx Co-op City
Nuremberg Drumul Taberei
Paris Le Mirail
Palmanova Islamabad
Dakar Greendale
Khayelitsha Hilversum
Dar es Salaam Greenhills
Kibera Kentlands
Kranidi Poundbury
Karail Laguna West
0m 0m
0m 0m
0m 0m
0m 0m
0m 0m
0m 0m
0m 0m
0m 0m
0m 0m
0m 0m
0m 0m
0m 0m
1000m 1000m
1000m 1000m
1000m 1000m
1000m 1000m
1000m 1000m
1000m 1000m
1000m 1000m
1000m 1000m
1000m 1000m
1000m 1000m
1000m 1000m
1000m 1000m
1000m 1000m
1000m 1000m
1000m 1000m
1000m 1000m
1000m 1000m
1000m 1000m
1000m 1000m
1000m 1000m
1000m 1000m
1000m 1000m
1000m 1000m
1000m 1000m
0m 0m
0m 0m
0m 0m
0m 0m
0m 0m
0m 0m
0m 0m
0m 0m
0m 0m
0m 0m
0m 0m
0m 0m
Radiant City Radiant CityInformal Settlement Garden City
NON PTUD
Informal Settlement New Urbanism
PTUD
Historic Cities Historic Cities
Summary of results:
257 258
Pavia Regent Park
Pompeii Tsukuba
Piacenza Roehampton
Verdun Letchworth
Vienna Radburn
Verona Lusaka
Yogyakarta Riverside
Lima Welwyn
Lagos Vallingby
Manila Rosemary Beach
Rocinha Vero Beach
Maputo Seaside
0m 0m
0m 0m
0m 0m
0m 0m
0m 0m
0m 0m
0m 0m
0m 0m
0m 0m
0m 0m
0m 0m
0m 0m
1000m 1000m
1000m 1000m
1000m 1000m
1000m 1000m
1000m 1000m
1000m 1000m
1000m 1000m
1000m 1000m
1000m 1000m
1000m 1000m
1000m 1000m
1000m 1000m
1000m 1000m
1000m 1000m
1000m 1000m
1000m 1000m
1000m 1000m
1000m 1000m
1000m 1000m
1000m 1000m
1000m 1000m
1000m 1000m
1000m 1000m
1000m 1000m
0m 0m
0m 0m
0m 0m
0m 0m
0m 0m
0m 0m
0m 0m
0m 0m
0m 0m
0m 0m
0m 0m
0m 0m
Historic Cities Radiant CityHistoric Cities Garden CityInformal Settlement Garden City
NON PTUD
Informal Settlement New Urbanism
PTUD
Summary of results:
259 260
I. Findings
Cities classified as Pre-professional Urban Design Theory, have primary findings confirming the existence of the 400-meter scaled framework. Cities from antiquity through the industrial age can be seen, with little exception, to exemplify the 400-meter ‘rule’. Cities dating from the majority of human history are classified into this sub category, it was expected and has been shown that there is some of variation in the urban form of the case studies. The form of individual sanctuary areas has a significant variance over time and geography, yet as defined, the 400 meter rule manifests itself as a range from 300 to 500 meters. Also present in later North American examples is the presence of the Jeffersonian grid, which is larger than 400 meters in practice, but is often scaled down, or further bisected with main streets in the industrial city case studies from North America. Further findings are best represented as findings from a singular case study from each of the sub-categories in the Pre-Professional Theory era.
Ancient City, Lucca: pages 41 - 42The case study area at Lucca is shown with a map of the ancient settlement overlaid with the city’s existing form. The urban framework of Lucca is remarkably unchanged in its history, making it the ideal case study for an ancient city. The 400-meter scale is present with no sanctuary area perimeter segment being longer than 440 meters. The mean for perimeter segments is 274 meters, well below a 400-meter scale.
Medieval City, Nuremburg: pages 55 - 56The case study at Nuremburg has a much more varied form than the ancient city of Lucca. This is in part to its development in the medieval era, and in part to its riverside location requiring the urban framework to adapt and stretch to accommodate the river as is done with the a river crossing main road segment at 790 meters. This should be considered a statistical outlier, and can likely be explained as two segments being broken by the river, a useful transportation artery in medieval times. The average measurement taken from inside the walled portion of the medieval city is 329 meters, confirming the presence of the 400-meter scale.
Renaissance City, Palmanova: pages 67 - 68The city at Palmanova is largely identical to its renaissance origins. The case study exemplifies the 400-meter rule more clearly than any other settlement in this atlas. It is a small planned, walled city built in a radial pattern. The distance from the city centre and plaza is 400 meters exactly. There are three sanctuary areas, arranged around the piazza, with 400-meter main roads radiating from the centre to the edge of the city at the wall.
Baroque City, Noto Valley: pages 73 - 74The Noto Valley case study is an example of the pure Baroque city, built after the Sicilian Earthquake. The 400-meter scale is most evident by the three segments measured at 400 meters forming a repeating pattern in the city centre. The average measurement of perimeter segments in the Noto Valley study area is 241 meters. Much smaller than 400 meters; it is important to note a measurement greater than 400 meters only occurs twice, both the result of topographical challenges in city design.
Conclusions:Industrial City, Barcelona: pages 77 - 78The 400-meter scale is present in Barcelona, though larger than the Baroque example in Noto Valley. At Barcelona it is possible to see the firm and explicit return to a gridded system of streets in Cerda’s plan. When measured, the grid is implemented on a 410x410 meter square sanctuary area. This grid is broken occasionally, by major public buildings, topography, rail infrastructure, and diagonal roads, yet, the average segment is measured at 435 meters. The average measurement, though still within the suggested range of confirmation for the 400 meter scale, would be even more convincing if 3 outliers of 670 meters were disregarded.
The era of Professional Urban Design Theory ushers in the Garden City Movement and the Radiant City, and continues today with New Urbanism. All of these in one way or another have attempted to design the city while simultaneously driving social change for the better. They are committed to the designability of the neighbourhood unit and are basing the scale of the city as designed on the perimeter of a neighbourhood unit. Analysing these as a framework shows that the sanctuary area as defined by this research is overscaled and outgrown when compared to the historical cities.
The Garden City, Letchworth: pages 119 - 120The first garden city realised, and one developed with the direct influence of Ebenezer Howard, Letchworth is the closest the Garden City ever came to realising its theoretical idealism. The urban framework of Letchworth is a significant growth from the industrial era. The town centre of Letchworth, a non-residential, single use commercial and service part of the city has three segments that measure less than 300 meters. With the three segments included, the average distance for a perimeter segment of a sanctuary area in Letchworth is still 551 meters. In addition there is a significant disparity between the smallest (230 meters) and largest (1500 meters) segments. The entire settlement area of Letchworth divides into just 15 sanctuary areas, a fraction of a similarly sized city of the industrial era.
Radiant City, Chandigarh: pages 153 - 154The city of Chandigarh is the most puritanical representation of Le Corbusier’s ideals as it was designed and implemented by the master himself. Chandigarh represents an explosion in urban scale, which has yet to be replicated, a possible sign of its consequences. The city is laid out in a near perfect grid of superblocks, or sectors, as they are known locally. The majority of the sectors are a 1350 x 850 meter rectangle. Each rectangle is a sanctuary area, and neighbourhood unit as designed. The 3 sectors closest to the monumental government buildings are significantly smaller and have the only segments in the city shorter than 800 meters in length. Including these altered sectors the average for the detail area (and the city as a whole) is a segment length of 921 meters.
New Urbanism, Seaside: 201 - 202The town of Seaside, Florida in the United States is a hallmark of New Urbanism, award winning, under expansion, and often seen as the seminal work of New Urbanism. Seaside has easily discernable neighbourhoods; unfortunately these neighbourhoods are neither adjacent to one another, nor at the scale of the 400-meter framework. Seaside is a small settlement, with just six sanctuary area perimeter segments to measure. The average of these segments it 1078 meters, which is beyond even the 800 meters suggested by the Congress for New Urbansim Charter.
261 262
Informal settlements represent a return (or at least a lack of departure from) the 400-meter scale. Informal settlements emerge and grow as a response to other urban social problems. They often represent the only affordable housing for their inhabitants. The framework that emerges grows and alters not only with the size and population of the settlement, but also with the availability of land. The actual size, shape, and population of an informal settlement is difficult to discern, all figures regarding informal settlements being instantly outdated as the settlement itself remains in a state of flux. The geographical and cultural context of the settlements is of interest as they can affect the size and condition of the settlement.
In one special case, that of Khayelitsha, South Africa, we have a documented formally planned, informal settlement. This area developed out of the Apartheid system with the intention of the resettlement of the majority black population into government planned townships. These townships were little more than formalised shantytowns with similar conditions to those seen in other informal settlements analysed. The urban framework of this settlement is that of an overgrown professionally planned scale. The formality of the settlement led to this overgrown scale, whereas the emergent informal settlements studied clearly exhibit the 400-meter scales.
Informal Settlement, Rocinha: pages 237 - 238The settlement at Rocinha is a very well documented Brazilian favela. The framework of the favela is highly irregular, determined by the significant grade of the hills upon which it is built. The nature and shape is that of an unplanned shantytown, haphazard at best. The scale, however is that which has been consistent outside of the professional theory world. The average perimeter segment measures at 337 meters. The highest and lowest segment only measure 580 to 110 meters. The emergent and unplanned nature of the slum has resulted in a highly irregular urban framework that organically arrives at a similar scale as that of the majority of human history.
II. Implications
The findings expose the natural emergence and evolution of an urban scale over the course of human history. This scale is shown to exist everywhere professional theory is absent. Resulting is the permanent alteration of urban scale, implemented when professional urban design theory emerged and became the dominant form of conventional urbanism. The implications of this emergent and organic framework development are predominately exposed in the permeability and flexibility of the city. Historic urban frameworks have permeability for both automobiles (at lower speeds) and pedestrians due to their condensed urban framework, the 400-meter framework.
A condensed framework adds not only permeability to the city, but flexibility. It is assumed at this point, though further research is needed, that permeability of the 400-meter city is the driving factor behind its increased flexibility.
The flexibility of the 400 meter framework is demonstrated in the continual evolution of historic cities and the continued use of historical and existing frameworks, whereas the evolution of modernist and post modernist urban redevelopment often leads to a re-working or demolition of the framework of the area as is exemplified by the Pruitt-Igoe and Cabrini Green situations.
The flexibility and permeability benefits of the 400-meter framework are easily framed to support the argument of the sustainable city. Many arguments, including those of new urbanism make the argument suggesting that higher density; walkable, urban areas lead to a more sustainable human settlement and living pattern, than the automobile and land dependant models from the radiant city and garden city movements. The dense, pleasant, walkable neighbourhoods that foster a sustainable lifestyle already exist, as can be seen in the atlas, in cities conceived outside of professional urban design theory.
Historic cities are shown in the atlas to be highly adaptable. Much of the ancient and medieval cities are obviously not ancient, yet the framework of the cities remains largely unchanged from its conception. The adaptable nature of a 400-meter framework supports not only the flexible framework of a 400-meter city, but also furthers support for the settlement’s sustainability. A settlement that existed for 100 years before the industrial revolution, and continues to exist can be anecdotally referred to as a sustainable city.
The implications for the research of the 400-meter framework and the emergent neighbourhood model are less clear. This research does not suppose to assume which of the urban frameworks is better, than any other. It does highlight that the 400-meter framework is based in human history and has lasted for several thousand years, while others are based in logic, occasionally being significantly altered after 50 years. The value judgement of the framework cannot yet be made.
Further understanding the urban framework, and its implications, requires additional analysis of both a quantitative and qualitative nature. An understanding of the frameworks must not be based in logic and casual observation; it must be rooted in substantial high quality research. This will include (but not limited to) traffic pattern studies, economic value studies, income level studies, a socioeconomic portrait, land use analysis, and additional qualitative analysis about the human perception of urban spaces both from the frame of reference of the denizen and the outsider. The psychology of users and the sociology of different urban spaces must be compiled and compared to urban frameworks. Additionally, further research should add additional quantification of the space in terms of population and density studies. A comparison of land values tied to urban frameworks must be compiled to determine the presence of a statistically significant or causal relationship between land value and urban framework. Future research must answer the human questions of these spaces.
It is only with the compilation of this additional research that the current atlas of urban framework will begin to shoulder its full potential. This atlas is proof and documentation of the existence and subsequent alteration of urban frameworks, however any value judgements must be reserved for further research into the nature and perception of urban space.
263 264
III. Relevance
The relevance of the work complied in the atlas differs when considered for the fields of architecture and urban design. The relevance for urban design is much more apparent on the surface. The work clearly exposes the major change in urban form at the hands of the field of professional urban design theory. This change is most illustrated in the manner that urban designers (through the advancement and implementation of their theories) for better or for worse have drastically and permanently altered the organic human scale of urban settlement.
This urban framework study shows the physical representation of the end of the historically prevalent emergent neighbourhood development process. In cities developed and influenced under a professional theory there is a logical ordered urban framework and system of land use. These professionally planned cities remove the freedom for altering urban form. The grand logical design is all encompassing and controlling, limiting the flexibility and adaptability of the area.
The rigid use of an oversized framework was shown to have developed out of the designable neighbourhood unit. The neighbourhood unit is clearly visible in the framework of professional theory era cities and has been shown to be a very limiting basis for the development of an urban framework. The over-scaled framework removes, or makes more difficult, movement between two neighbourhood units. This attempt to control the users and citizens of the urban area is an overreach for urban design and resulted in an urban form shown in every map in this atlas in the Garden City, Radiant City, and New Urbanist chapters.
Showing the break of urban design with traditional urban scale, and all of the implications of this, highlights the importance of urban design in placemaking. It also can be used to infer the type of places that are created by urban designers when there is no consideration for anything other than an artfully conceived logical order. With further research into the nature of 400 meter and non 400-meter scaled cities, an understanding could be developed regarding the consequences of urban framework on the liveability of a city.
Also implied is the failure of the neighbourhood unit as a designable entity. The entire theory of the neighbourhood unit as a geographic entity based on a radius of 400 meters (i.e. 800mts of diameter) is inherently unfit to frame human scaled urbanism as expressed in the history of cities. This theory has constituted the backbone of twentieth century urban design as a discipline, and therefore has deeply informed all models produced by professional urban designers in the last century. This means re-thinking the methodology of practicing city designers and working for an entirely different technical and cultural foundation for the profession is necessary.
The relevance the 400-meter framework analysis to architecture as a profession is in the relationship of a city’s urban framework and its buildings, and in the relationship of architecture to urban design as a profession.
The architect can find value in the ascertaining of the profound difference in form a city takes when its design is not derived from the city and its people, rather imposed from a logic based theory. An architect can also begin to
imagine the profound effect on building in a city of a 400 meter scale, and the benefits and challenges this offers, however this is not any different than designing new spaces for a historical city.
At a general level this work is a call for an evidence-based approach to the study and design of the built environment, an attempt to expand the penetration of science into urban design and architecture, from setting up a hypothesis and testing it critically in rigorous conditions, making it widely testable within the disciplinary field. This research, even in its present somewhat preliminary form, is such a test. It is about constructing tested empirical knowledge. The relevance of that for architects refers to the need to bring the culture of architecture and urbanism out of the domain of expression (the domain of visual arts), and closer to that of usefulness (the domain of practical arts and experimental science). After many decades of fashionable and fascinating theories, theories are needed that work; this research is an investigation of the field of what has been working for centuries, which involves architecture as much as urbanism in the formation of feasible answers to the questions posed by contemporary global urbanisation.
Also of relevance to architecture is finding a place to embrace urban design and the strengths it offers. The harshest criticisms of new urbanism often come from the field of architecture. Architects often respond negatively to form based coding and any attempt on the part of urban designers to infringe on the creative freedom of an architect. The emergent neighbourhood theory and the 400-meter framework could have major implications on this relationship. Both the emergent neighbourhood model and the 400-meter scale dilute many of the draconian ideas of heavy-handed new urbanism, suggesting only that a framework for development be put in place and the neighbourhood be allowed to emerge. Architects that are opposed to the over design of space as new urbanism can occasionally be guilty of, will find a more amenable design paradigm in this approach to urban design.
265 266
1. Appleyard, Donald. 1976. “Planning a Pluralist City: Conflicting Realities in Ciudad Guayana [review].” The Hispanic American Historical Review vol. 57, 4. Pages 774-775.
2. Bailey, James. 1973. “New Towns in America.” Wasington D.C. The American Institute of Architects. MIT Press.
3. Ben-Joseph, Eran. 2005. “The Code of The City; Standards and the Hidden Language of Place Making.” Boston. MIT Press.
4. Bernhardt, Christoph. 2005. “Planning Urbanization and Urban Growth in the Socialist Period; The Case of East German New Towns, 1945-1989.” Journal of Urban History vol. 32. Pages 104-119.
5. Branch, Melville C. 1978. “An Atlas of Rare City Maps: Comparative Urban Design, 1830-1842.” New York. Princeton Architectural Press.
6. Buder, Stanley. 1990. “Visionaries and Planners; The Garden City Movement and the Modern Community.” Oxford. Oxford University Press.
7. Burnham, Daniel, H. and Bennett, Edward, H. 1908. “Plan of Chicago.” Chicago. Commercial Club of Chicago. New York : Princeton Architectural Press.
8. Burton, Anthony. Hartley, Joyce. 2002. “The New Towns Record: 1946 - 2002” CD ROM. IDOX Information service in association with Logical Innovations.
9. Centre for Urban Studies(CUS), National Institute of Population Research and training (NIPORT), Measure Evaluation, 2006. “Slums of Urban Bangladesh: Mapping and Census, 2005.” Dhaka, Bangladesh and Chapel Hill, USA. Retrieved August 22, 2010, from Measure Evaluation online database.
10. Chant. C, Goodman, D. Edited.1999. “European Cities & Technology: Industrial to Post-Industrial City.” London. Routledge.
11. Choay, Francoise. 1997. “The Rule and the Model: On the Theory of Architecture and Urbanism.” London. The MIT Press.
12. Clinard, Marshall B. 1966. “Slums and Community Development; Experiments in Self-Help.” New York. The Free Press.
14. Corbusier, Le. 1933. “The Radiant City.” London. Faber and Faber Limited.
Bibliography:15. Corbusier, Le. 1964. “The Radiant City.” London. Faber and Faber Limited.
16. Curl, James S. 1970. “European Cities and Societies: A study of the influence of Political Climate on Town Design.” London. Leonard Hill Books.
17. Cuthbert, Alexander R. 2007. “Urban Design: Requiem for an Era - Review and Critique of the Last 50 Years.” Urban Design International. Vol 12. Pages 177-223.
18. Davies, Hywel D. 1969. “Zambian Urban Studies; No. 2 The Myth of the Garden City.” Lusaka. University of Zambia.
19. Davies, Hywel D. and Collins John. 1969. “Zambian Urban Studies; No1. Lusaka, Zambia: Some Town Planning Problems in an African Capital City at Independence.” Lusaka. University of Zambia.
20. Dill, Jennifer. 2006. “Evaluating a New Urbanist Neighbourhood.” Berkley Planning Journal vol. 19. Pages 59-78.
21. DiMaio, Alfred. 2000. “New Atlantis Revisited: Akademgorodok, The Siberian City of Science [review].” Science & Society, vol. 64(1), pages 136-139.
22. Dimancescu, Dan 2007. “The Communist Experience with Urban Development: Romania in the 1960s.” Proceedings of the International Network for Traditional Building, Architecture & Urbanism, International Network for Traditional Building, Architecture & Urbanism, Cambridge, Massachusetts. Retrieved July 8, 2010, from INTBAU online database.
23. Doxiadis, C. A. 1968. “Ekistics: An Introduction to the Science of Human Settlements.” London. Hutchinson & Co. Ltd.
24. Duany, A. & Plater-Zyberk, E. 1992. “Towns and Town-making Principles.” Cambridge, Massachusetts, Harvard University Graduate School of Design.
25. Duany, Andres, et al. 2000. “Suburban Nation; The rise of Sprawl and The Decline of the American Dream.” New York. North Point Press.
26. Duany, Andres. Plater-Zyberk, Elizabeth. Speck, Jeff. (2000). “The Rise of Sprawl Suburban and the decline of Nation.” New York. North Point Press.
27. Duivesteijn, Adri, and van de Wal, Harmen. 1994. “The Hidden Assignment; At home in the City.” Rotterdam. NAi Uitgevers.
267 268
28. Dunlop, Beth. 1998. “From Fantasy to Traditional Planning” Places vol. 12. Pages 77-79.
29. Dutton, J.A. 2000. “New American Urbanism: Re-forming the Suburban Metropolis.” Milan, Skira editor.
30. Ellin, Nan. 1996. “Postmodern Urbanism.” Cambridge. Blackwell Publishers Inc.
31. Ennen Edith. 1979. “The Medieval Town: Europe in the Middle Ages - Selected Studies.” Vol15. Oxford. North - Holland.
32. Evans, Hazel. 1972. “New Towns: The British Expierence.” London. Charles Knight & Co. Ltd.
33. Evenson, Norma. 1966. “Chandigarh.” Los Angeles. University of California Press.
35. Fishman, Robert. 1977. “Urban Utopias in the Twentieth Century; Ebenezer Howard, Frank Lloyd Wright, and Le Corbusier.” New York. Basic Books, Inc.
36. Hall, Peter. 2002. “Cities of Tomorrow; An Intellectual History of Urban Planning and Design in the Twentieth Century, Third Edition.” Oxford. Blackewell.
49. Kostof, Spiro. 1991. “The City Shaped; Urban Patterns and Meanings Through History.” London. Thames and Hudson.
50. Kostof, Spiro. 1999. “The City Shaped: Urban Patterns and Meanings through History, second edition” New York, Thames & Hudson.
51. Lawton, R. 1989. “The Rise and Fall of Great Cities: Aspects of urbanization in the Western World”. London, Belhaven. 52. Levy, John M. 1997. “Contemporary Urban Planning.” Upper Saddle River, NJ. Simon and Schuster. Zucconi. 2001. “La Citta Dell’Ottocento.” Roma. Gius, Laterza & Figli.
53. Lindsay, Greg. 2010. “New Urbansim for the Apocalypse.” Website. http://www.fastcompany.com/1651619/ the-new-urbanism-meets-the-end-of-the-world 1st September, 2010.
54. Littlewood, Alan. 1999. “Chaos, Order and Values.” Ideas That Matter, A Quarterly Digest vol. 1,1. Page 18.
55. Liu, K, 2009. “China’s Urban Informal Settlements: Concepts and Sustainability Implications.” Proceedings of Universitas 21 International Graduate Research . Conference: Sustainable Cities for the Future. Universitas 21. Melbourne & Brisbane. Retrieved August 17, 2010, from Universitas 21 online database.
56. Liu, W, 2009. “Social Capital and Urbanization: the case of “villages within city” in Shenzhen, China.” Proceedings of Universitas 21 International Graduate Research Conference: Sustainable Cities for the Future. Universitas 21. Melbourne & Brisbane. Retrieved August 17, 2010, from Universitas 21 online database.
57. Mehaffy, Michael et al. 2010. “Urban Nuclei and the Geometry of Streets: The ‘Emergent Neighbourhoods’ Model.” Urban Design International. 15, 1. Pages 22-46.
59. Miami, City of. 2008. “Miami 21; your city, your plan.” Website. http://www.miami21.org/ 1st September 2010. 60. Miller, Brian J. 2008. “The Struggle Over Redevelopment at Cabrini-Green, 1989-2004.” Journal of Urban History. Vol. 34. 2008. Pages 944-960.
61. Mohl, R. A. 1985. “The New City: Urban America in the Industrial Age, 1860-1920.” Illinois. Harlan Davidson, Inc.
62. Morris, AEJ. 1972. “History of Urban Form: Prehistory of the Renaissance”. London. George Godwin Ltd.
63. Morris, AEJ. 1994. “History of Urban Form, Before the Industrial Revolutions, 3rd edition.” Essex. Longman Scientific & Technical.
64. Mumford, Eric. 2000. “The CIAM Discourse on Urbanism, 1928-1960.” Cambridge. MIT Press.
65. Mumford, Lewis. 1938. “The Culture of Cities.” London. Secker and Warburg Ltd.
66. Mumford, Lewis. 1966. “The City in History.” Harmondsworth. Penguin Books.
67. Munzer, Martha and Vogel, John Jr. 1974. “New Towns; Building Cities from Scratch.” New York. Alfred A. Knopf Inc.
68. Neuwirth, Robert. 2005. “Shadow Cities; A Billion Squatters, A New Urban World.” New York. Routledge.
69. Nicholas, D. 1997. “The Later Medieval City: 1300-1500.” Essex. Addison Wesley Longman Limited.
70. Obudho, R.A. and Mhlanga, Constance C. 1988. “Slum and Squatter Settlements in Sub-Saharan Africa.” New York. Praeger.
71. Palen, John J. 1995. “The Suburbs.” London. McGraw-Hill Inc.
72. Phillips, David R. and Yeh, Anthony G.O. 1987. “New Towns in East and South-east Asia; Planning and Development.” Oxford. Oxford University Press.
73. Pornchokchai, Sopon. 1992. “Bangkok Slums; Review and Recommendations.” Bangkok. School of Urban Community Research and Actions Agency for Real Estate Affaris.
74. Pornchokchai, Sopon. 1992. “Bangkok Slums; Review and Recommendations.” Bangkok. School of Urban Community Research and Actions Agency for Real Estate Affaris.
75. Rghei, Amer, S. and Nelson, J.G. 1994. “The Conservatoin and Use of the Walled City of Tripoli.” The Geographical Journal, vol.160, 2 pages 143-158.
78. Sarin, Madhu. 1982. “Urban Planning in the Third World, The Chadigarh Expierence.” London. Mansell Publishing.
79. Staubli, Willy. 1966. “Brasilia.” London. Leonard Hill Books.
80. Stave, Bruce M. 1981. “Modern Industrial Cities; History, Policy, and, Survival.” London. Sage Publications.
81. Stein, Clarence S. 1951. “Towards New Towns for America.” Liverpool. The University Press of Liverpool.
82. Talen, Emily. 2005. “New Urbanism and American Planning; The conflict of Cultures.” New York. Routledge.
83. The Milton Keynes Development Corporation. 1970. “The Plan for Milton Keynes Volume 1. Milton Keynes.” Milton Keynes Development Corporation.
84. The Milton Keynes Development Corporation. 1970. “The Plan for Milton Keynes Volume 2.” Milton Keynes. Milton Keynes Development Corporation.
85. Tsenkova, Sasha. 2008. “In Search for Sustainable Solutions for Informal Settlements in the ECE Region: Challenges and Policy Responses.” Economic commission for Europe Committee on Housing and Land Management. Unedited Draft. Retrieved 10 August, 2010, from http://www.unece.org/hlm/d ocuments/2008/informal.notice.1.pdf.
86. United Nations Centre for Human Settlements (Habitat). 1982. “Survey of Slum and Squatter Settlements.” Dublin. Tycooly International Publishing Ltd.
87. Vedula, Aparna. 2007. “Blueprint and Reality: Navi Mumbai, The City of the 21st Century*.” Habitat International, vol. 31. 2007. Pages 12-13.
271
88. Von Hertzen, Heikki, and Spreiregen, Paul D. 1971. “Building a New Town: Finland’s New Garden City; Tapiola.” Boston. MIT Press.
89. Ward, Stephen V. ed. 1992. “The Garden City; Past Present and Future.” London. Chapman and Hall.
90. Whitehand, J.W.R. 1987. “The Changing Face of Cities: A study of Development Cycles and Urban Form.” Oxford. Basil Blackwell Ltd.
273 274
Figure 1.0 Garden City Diagram - Ward, Stephen V. ed. 1992. “The Garden City; Past Present and Future.” London. Chapman and Hall. Page 4.
Figure 1.1 Le Corbusier’s 400m rule diagram - Corbusier, Le. 1964. “The Radiant City.” London. Faber and Faber Limited. Page 56.
Figure 1.2 Neighbourhood Unit diagrams - Farr, Douglas. 2008. “Sustainable Urbanism; Urban Design with Nature.” Hoboken, NJ. Wiley. Page 125.
Figure 1.3 Map of ancient Bologna - Cervent, Marta. 2004. “Citta Romane di Fondazione.” L’erma di Bretschneider. Roma. Page 68.
Figure 1.4 Map of ancient Lucca - Cervent, Marta. 2004. “Citta Romane di Fondazione.” L’erma di Bretschneider. Roma. Page 82.
Figure 1.5 Map of ancient Pavia - Cervent, Marta. 2004. “Citta Romane di Fondazione.” L’erma di Bretschneider. Roma. Page 110.
Figure 1.6 Map of ancient Piacenza - Cervent, Marta. 2004. “Citta Romane di Fondazione.” L’erma di Bretschneider. Roma. Page 57.
Figure 1.7 Map of Pompeii - Dutton, J.A. 2000. “New American Urbanism: Re-forming the Suburban Metropolis.” Milan, Skira editor. Page 52.
Figure 1.8 Map of ancient Verona - Cervent, Marta. 2004. “Citta Romane di Fondazione.” L’erma di Bretschneider. Roma. Page 39.
Figure 2.4 Map of Vienna - 1858 - Branch, Melville C. 1978. “An Atlas of Rare City Maps: Comparative Urban Design, 1830-1842.” New York. Princeton Architectural Press. Page 18.
Figure 2.5 Schickhardts plan - Curl, James S. 1970. “European Cities and Societies: A study of the influence of Political Climate on Town Design.” London. Leonard Hill Books. Page 98.
Figure 2.6 General Plan of Neuf Brisach - Morris, A. E. J. 1972. “History of Urban Form: Prehistory of the Renaissance.” London. George Godwin Ltd. Page 160.
Figure 2.7 Palmanova plan - 1593 - Morris, A. E. J. 1972. “History of Urban Form: Prehistory of the Renaissance.” London. George Godwin Ltd. Page 117.
Figure 2.9 Engraving of Karlshrue - 1740 - Whitehand, J.W.R. 1987. “The Changing Face of Cities: A study of Development Cycles and Urban Form.” Oxford. Basil Blackwell Ltd. Page 28.
Figure 3.0 Aerial view of Noto - http://www.msnbc.msn.com/id/23071331. [04/09/2010]. Figure 3.1 Aerial view of Ragusa - http://www.nozio.com/Europe/Italy/Sicily/Ragusa/destination_guides/Ragusa. htm/. [04/09/2010].
Figure 3.2 Cerda’s Barcelona plan - 1859 - Hall, T. 1997. “Planning Europe’s Capital Cities: Aspects of Nineteenth- Century Urban Development.” London. E & FN Spon. Page 136.
Figure 3.3 Map of Boston - 1842 - Branch, Melville C. 1978. “An Atlas of Rare City Maps: Comparative Urban Design, 1830-1842.” New York. Princeton Architectural Press. Page 24.
Figure 3.4 Map of Calcutta - 1842 - Branch, Melville C. 1978. “An Atlas of Rare City Maps: Comparative Urban Design, 1830-1842.” New York. Princeton Architectural Press. Page 26.
Figure 3.5 Lincoln Park Chicago - Personal Collection.
Figure 3.6 Aerial view of Manchester - http://www.aerial-manchester.co.uk/. [04/09/2010].
275 276
Figure 3.7 Glasgow’s Merchant City - http://www.glasgowarchitecture.co.uk/tron_theatre.htm. [04/09/2010].
Figure 3.8 Map of Middlesborough 1850 - Chant. C, Goodman, D. Edited.1999. “European Cities & Technology: Industrial to Post-Industrial City.” London. Routledge. Page 6.
Figure 3.9 Map of Milan - 1913 - http://www.mapcruzin.com/free-italy-maps.htm. [04/09/2010].
Figure 4.0 Haussman Plan - 1854 - Burnham, Daniel, H. and Bennett, Edward, H. 1908. “Plan of Chicago.” Chicago. Commercial Club of Chicago. Page 22.
Figure 4.1 Plan of Philadelphia - Branch, Melville C. 1978. “An Atlas of Rare City Maps: Comparative Urban Design, 1830-1842.” New York. Princeton Architectural Press. Page 109.
Figure 4.2 Plan of Stockholm - 1836 - Branch, Melville C. 1978. “An Atlas of Rare City Maps: Comparative Urban Design, 1830-1842.” New York. Princeton Architectural Press. Page 92.
Figure 4.3 Aerial of Ciudad Guyana - http://www.bancaynegocios.com/noticia_det.asp?id=10761. [08/09/2010].
Figure 4.4 Aerial of Cumbernauld - http://www.panoramio.com/photo/5579777. [04/09/2010].
Figure 4.5 Aerial view of East Kilbride - http://www.panoramio.com/photo/13552057. [18/08/2010].
Figure 4.6 Farsta satellite town - Von Hertzen, Heikki, and Spreiregen, Paul D. 1971. “Building a New Town: Finland’s New Garden City; Tapiola.” Boston. MIT Press. Page 21.
Figure 4.7. Aerial of Glenrothes - http://www.telegraph.co.uk/news/newstopics/politics/scotland/4386101/ Glenrothes-named-most-dismal-town-in-Scotland.html. [04/09/2010].
Figure 5.2 Aerial view of Letchworth - http://www.britannica.com/EBchecked/topic-art/225784/5624/Aerial-view- of-Letchworth-Hertfordshire-the-first-garden-city-in/. [04/09/2010].
Figure 5.3 Map of Lusaka 1968 - Davies, Hywel D. 1969. “Zambian Urban Studies; No. 2 The Myth of the Garden City.” Lusaka. University of Zambia. Page 4
Figure 5.4 Aerial view of Milton Keynes - Burton, Anthony. Hartley, Joyce. 2002. “The New Towns Record: 1946 - 2002.” CD ROM. IDOX Information service in association with Logical Innovations.
Figure 5.6 Map of Radburn - 1928 - http://www.radburn.org/geninfo/radburn-intro.html. [01/09/2010].
Figure 5.7 Map of Riverside - http://ocw.mit.edu/ans7870/11/11.001j/f01/lectureimages/8/image11.html. [01/09/2010].
Figure 5.8 Map of Seishin - 1970’s - Burton, Anthony. Hartley, Joyce. 2002. “The New Towns Record: 1946 - 2002.” CD ROM. IDOX Information service in association with Logical Innovations.
Figure 5.9 Aerial view of Tama - Burton, Anthony. Hartley, Joyce. 2002. “The New Towns Record: 1946 - 2002” CD ROM. IDOX Information service in association with Logical Innovations.
Figure 6.0 Tapiola satelite town plan - Von Hertzen, Heikki, and Spreiregen, Paul D. 1971. “Building a New Town: Finland’s New Garden City; Tapiola.” Boston. MIT Press. Page 20.
Figure 6.1 Aerial view of Vallingby - Von Hertzen, Heikki, and Spreiregen, Paul D. 1971. “Building a New Town: Finland’s New Garden City; Tapiola.” Boston. MIT Press. Page 21.
Figure 6.2 Aerial view of Welwyn - Burton, Anthony. Hartley, Joyce. 2002. “The New Towns Record: 1946 - 2002” CD ROM. IDOX Information service in association with Logical Innovations.
Figure 7.0 Aerial view of Cumbernauld - http://www.panoramio.com/photo/5579777. [04/08/2010].
Figure 7.1 Drumul Taberei aerial view - http://www.vet-twinning.eu/index.php?option=com_content&view=article &id=14&Itemid=23. [04/08/2010].
Figure 7.2 Le Grande Borne aerial view - Chant. C, Goodman, D. Edited.1999. European Cities & Technology: Industrial to Post-Industrial City”. London. Routledge. Page 215.
Figure 7.3 Le Mirail aerial view - http://www.ladepeche.fr/article/2008/12/10/505756-Le-reve-envole-du-Mirail. html. [04/08/2010].
Figure 7.4 Aerial view of Marzhan - http://www.photographersdirect.com/buyers/stockphoto. asp?imageid=1641598. [06/09/2010].
Figure 7.5 Aerial view of Milton Keynes - Burton, Anthony. Hartley, Joyce. 2002. “The New Towns Record: 1946 - 2002” CD ROM. IDOX Information service in association with Logical Innovations.