73
1 KENDRIYA VIDYALAYA SANGATHAN Raipur Region STYDY MATERIAL CLASS-XII ECONOMICS Session 2016-17
1
KENDRIYA VIDYALAYA SANGATHAN
Raipur Region
STYDY MATERIAL
CLASS-XII
ECONOMICS
Session 2016-17
2
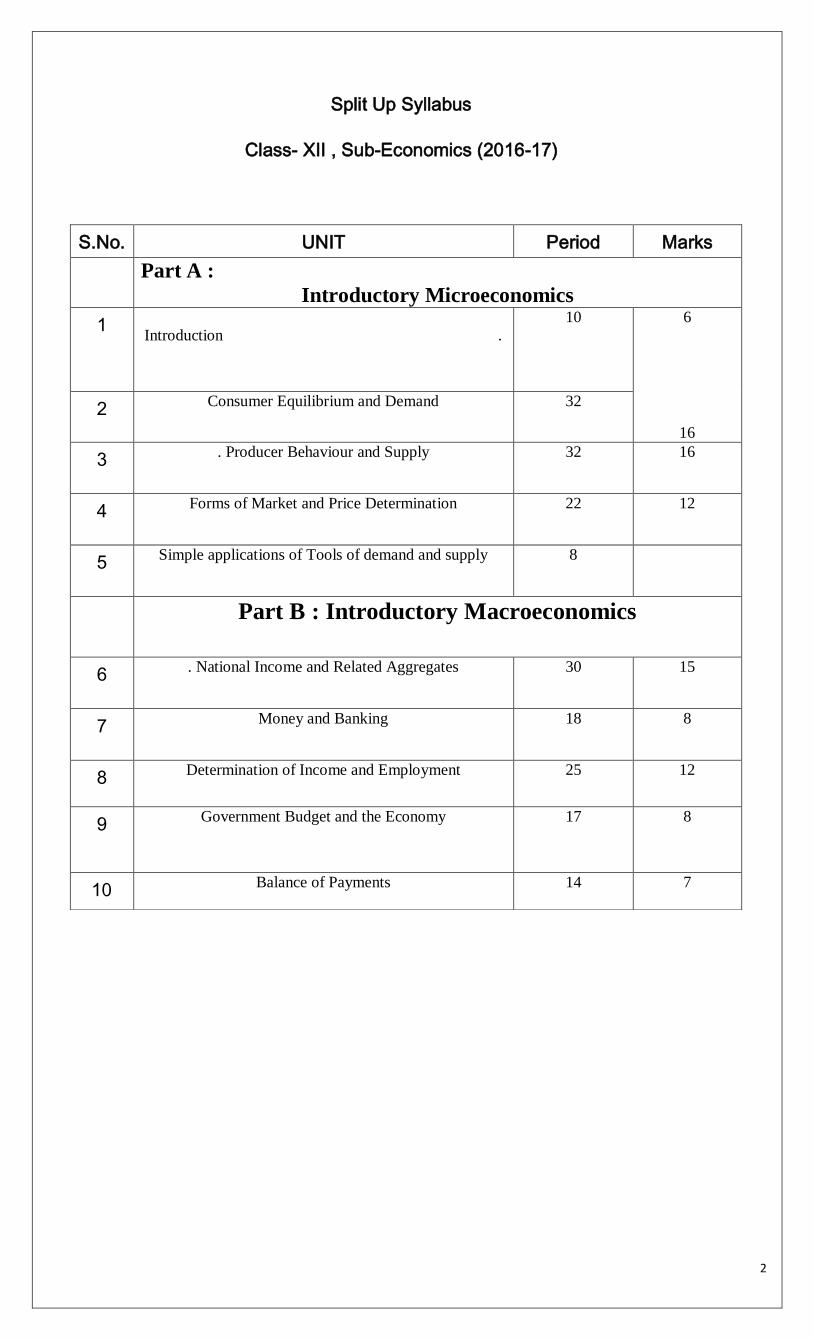
Split Up Syllabus
Class- XII , Sub-Economics (2016-17)
S.No. UNIT Period Marks
Part A :
Introductory Microeconomics
1
Introduction .
10
6
16
2 Consumer Equilibrium and Demand 32
3 . Producer Behaviour and Supply 32 16
4 Forms of Market and Price Determination 22 12
5 Simple applications of Tools of demand and supply 8
Part B : Introductory Macroeconomics
6 . National Income and Related Aggregates 30 15
7 Money and Banking 18 8
8 Determination of Income and Employment
25 12
9
Government Budget and the Economy 17 8
10 Balance of Payments 14 7
3
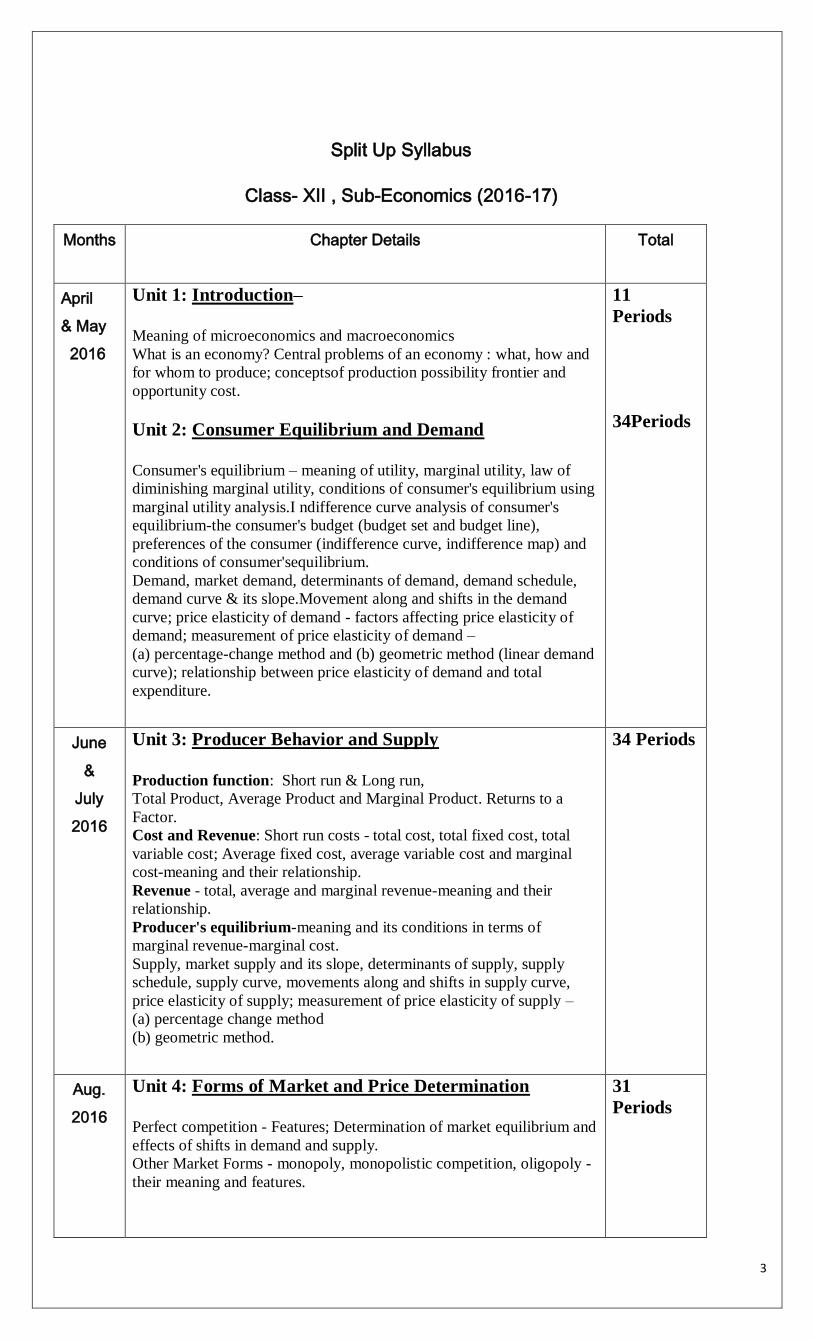
Split Up Syllabus
Class- XII , Sub-Economics (2016-17)
Months Chapter Details Total
April
& May
2016
Unit 1: Introduction–
Meaning of microeconomics and macroeconomics
What is an economy? Central problems of an economy : what, how and
for whom to produce; conceptsof production possibility frontier and
opportunity cost.
Unit 2: Consumer Equilibrium and Demand
Consumer's equilibrium – meaning of utility, marginal utility, law of
diminishing marginal utility, conditions of consumer's equilibrium using
marginal utility analysis.I ndifference curve analysis of consumer's
equilibrium-the consumer's budget (budget set and budget line),
preferences of the consumer (indifference curve, indifference map) and
conditions of consumer'sequilibrium.
Demand, market demand, determinants of demand, demand schedule,
demand curve & its slope.Movement along and shifts in the demand
curve; price elasticity of demand - factors affecting price elasticity of
demand; measurement of price elasticity of demand –
(a) percentage-change method and (b) geometric method (linear demand
curve); relationship between price elasticity of demand and total
expenditure.
11
Periods
34Periods
June
&
July
2016
Unit 3: Producer Behavior and Supply
Production function: Short run & Long run,
Total Product, Average Product and Marginal Product. Returns to a
Factor.
Cost and Revenue: Short run costs - total cost, total fixed cost, total
variable cost; Average fixed cost, average variable cost and marginal
cost-meaning and their relationship.
Revenue - total, average and marginal revenue-meaning and their
relationship.
Producer's equilibrium-meaning and its conditions in terms of
marginal revenue-marginal cost.
Supply, market supply and its slope, determinants of supply, supply
schedule, supply curve, movements along and shifts in supply curve,
price elasticity of supply; measurement of price elasticity of supply –
(a) percentage change method
(b) geometric method.
34 Periods
Aug.
2016
Unit 4: Forms of Market and Price Determination
Perfect competition - Features; Determination of market equilibrium and
effects of shifts in demand and supply.
Other Market Forms - monopoly, monopolistic competition, oligopoly -
their meaning and features.
31
Periods
4
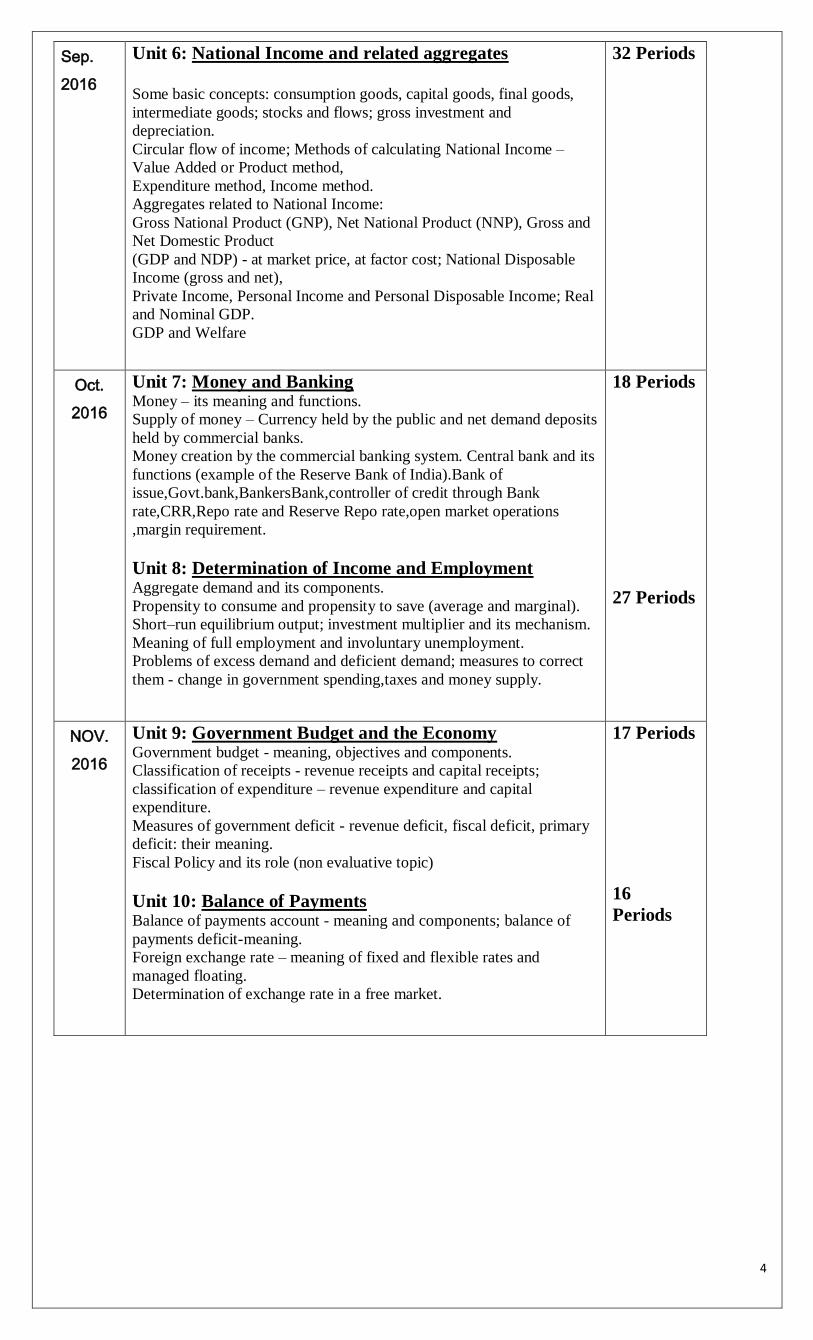
Sep.
2016
Unit 6: National Income and related aggregates
Some basic concepts: consumption goods, capital goods, final goods,
intermediate goods; stocks and flows; gross investment and
depreciation.
Circular flow of income; Methods of calculating National Income –
Value Added or Product method,
Expenditure method, Income method.
Aggregates related to National Income:
Gross National Product (GNP), Net National Product (NNP), Gross and
Net Domestic Product
(GDP and NDP) - at market price, at factor cost; National Disposable
Income (gross and net),
Private Income, Personal Income and Personal Disposable Income; Real
and Nominal GDP.
GDP and Welfare
32 Periods
Oct.
2016
Unit 7: Money and Banking Money – its meaning and functions.
Supply of money – Currency held by the public and net demand deposits
held by commercial banks.
Money creation by the commercial banking system. Central bank and its
functions (example of the Reserve Bank of India).Bank of
issue,Govt.bank,BankersBank,controller of credit through Bank
rate,CRR,Repo rate and Reserve Repo rate,open market operations
,margin requirement.
Unit 8: Determination of Income and Employment Aggregate demand and its components.
Propensity to consume and propensity to save (average and marginal).
Short–run equilibrium output; investment multiplier and its mechanism.
Meaning of full employment and involuntary unemployment.
Problems of excess demand and deficient demand; measures to correct
them - change in government spending,taxes and money supply.
18 Periods
27 Periods
NOV.
2016
Unit 9: Government Budget and the Economy Government budget - meaning, objectives and components.
Classification of receipts - revenue receipts and capital receipts;
classification of expenditure – revenue expenditure and capital
expenditure.
Measures of government deficit - revenue deficit, fiscal deficit, primary
deficit: their meaning.
Fiscal Policy and its role (non evaluative topic)
Unit 10: Balance of Payments Balance of payments account - meaning and components; balance of
payments deficit-meaning.
Foreign exchange rate – meaning of fixed and flexible rates and
managed floating.
Determination of exchange rate in a free market.
17 Periods
16
Periods
5
UNIT 1
INTRODUCTION
1. ECONOMY: An economy is a system by which people get their living.
2-Economics-is the study of the problem of choice arising out of scarcity of resources having alternative
uses.
3-TYPES OF ECONOMY:
(i) Capitalist economy / Market economy
(ii) Socialist economy / Planned economy
(iii)Mixed economy
4-MARKET ECONOMY: It is an economic system, in which all material means of production are
owned and operated by the private with profit motive.
5-PLANNED ECONOMY: In this economy all material means of production are owned by the government
or by a centrally planned authority. All important decisions regarding production, exchange and distributions,
consumptions of goods and services are made by the government or by a centrally planned authority
6-ECONOMIC PROBLEM: “An economic problem is basically the problem of choice” which arises due to
scarcity of resources having alternative uses”
7-CAUSES OF ECONOMIC PROBLEM :
i) Scarcity of resources
ii) Unlimited wants
iii) Limited resources having alternative uses
8-BASIC (CENTRAL) ECONOMIC PROBLEMS
(I)Allocation of resources
What to produce?:- It is the problem of choosing which goods and services should be produced in what
quantity For instance which of the consumer goods like sugar, cloth, wheat, ghee, etc. are to be
produced and which of the capital goods like machines, tractors etc,. Are to be produced. Similarly
choice has also to be made between the production of war time goods like rifles, guns, tanks and
peace time goods like bread and butter.
How to produce?-It is the problem of choosing technique of production of goods and services. For example,
production of cloth is possible either by handlooms or by modern machines this problem is to
concerned with the efficient use of resources. There are two technique of production:-
(a) Labour intensive technique:- Under this technique, labour is used more than capital. it creates employment for large amount of labour Also.
(b) Capital intensive technique:- Under this technique, capital is used more than labour. For whom to produce -The problem of for whom to produce refers to the distribution of goods and services
produced in the economy.
ii). Efficient Utilization of resources
iii.) Growth of resources
9-PRODUCTION POSSIBILITY CURVE (PPC):PP curve shows all the possible combination of two
goods that can be produced with the help of available resources and technology.
10-MARGINAL OPPORTUNITY COST: MOC of a particular good along PPC is the amount of other
good which is sacrificed for production of additional unit of another good
11-MARGINAL RATE OF TRANSWERFORMATION: MRT is the ratio of units of one good sacrificed
to produce one more unit of other good.
Unit of one good sacrificed ∆y
MRT = --------------------------------------------- = ----
More unit of other good produced ∆x
6
12-SCARCITY OF RESOURCES: Scarcity of resources means shortage of resources in relation to their
demand.
13-OPPORTUNITY COST: It is the cost of next best alternative foregone.
14-POSITIVE ECONOMICS: Positive economics deals with what is, what was (or) how an economic
problem facing the society is actually solved.
15-NORMATIVE ECONOMICS: It deals with what ought to be (or) how an economic problem
should be solved.
16-LABOUR INTENSIVE TECHNIQUE:- Under this technique, labour is used more than capital.it creates
employment for large amount of labour also goods produced are cheap. But the quality & quantity of goods
produced is less.
17-CAPITAL INTENSIVE TECHNIQUE:- Under this technique, capital is used more than labour.
18. production possibility frontier:- It is a boundary line which shows that maximum combination of
two goods which can be produced with the help of given resources and technology at a given period of time.
19 Attainable and unattainable combinations of output- Attainable combinations refer to those
combinations of output of goods which lie on or inside the PPC of an economy .If the economy is able to
make full and efficient utilization of its resources and technology then it will operating on the PPC .and if it
fails to make their best utilization, it will lead to a point inside PPC. Any point outside the PPC shows
unattainable combinations of output of two goods.
Questions Answers
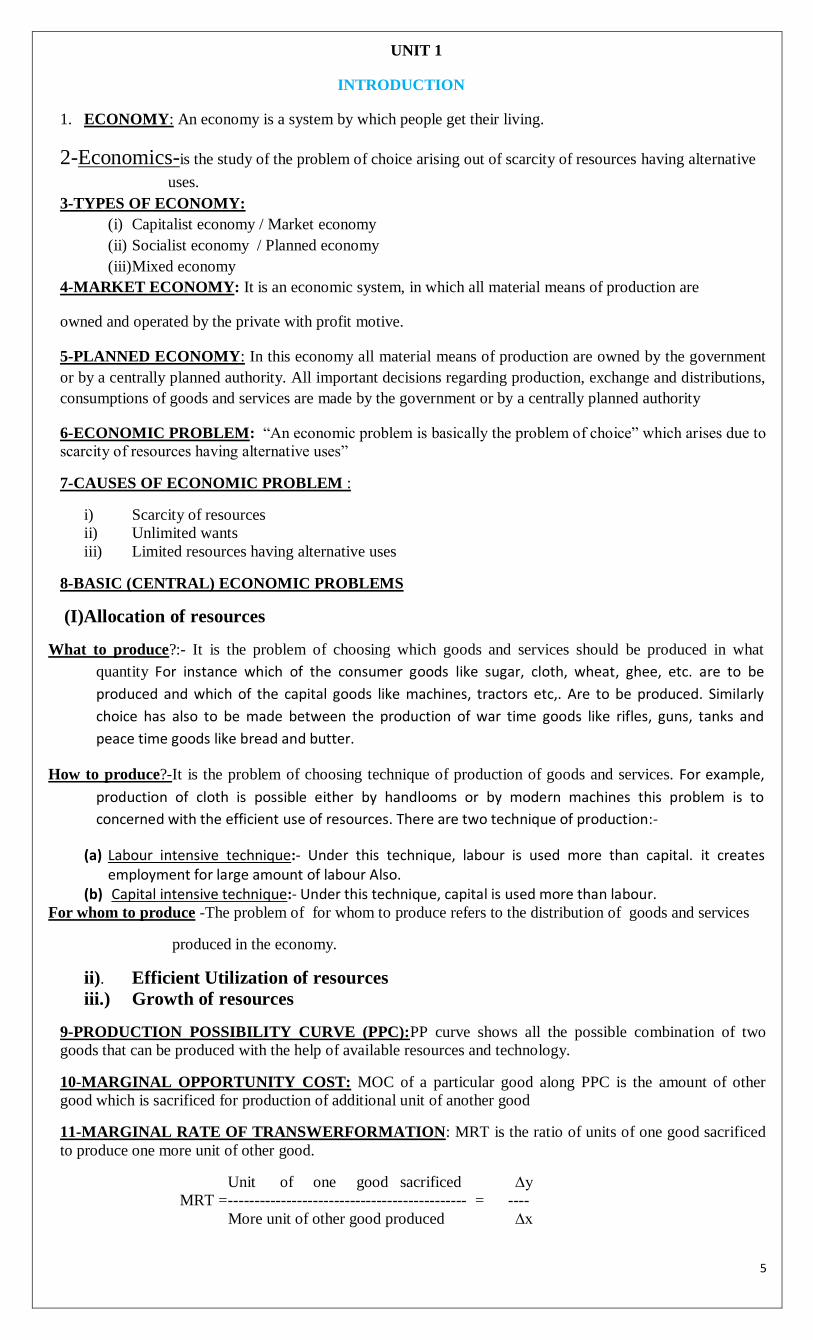
Q 1-.Draw a production possibility curve and mark the following situations:
a) underutilization of resources
b) full employment of resources
c) growth of resources
Every point on PP curve like ABCDEF indicates full employment and efficient uses of resources .Any point
below or inside PP curve like G underutilization of resources.
Any point above PP curves like H indicates growth of resources.
A
B H (Growth of resources)
C
Full employment of resources
D
G
E
0 1 2 3 4 5
Cloth
2
4
6
2
2
8
14
10
10 12
10
F
Under utilization
of resources
Wheat
x
P
7
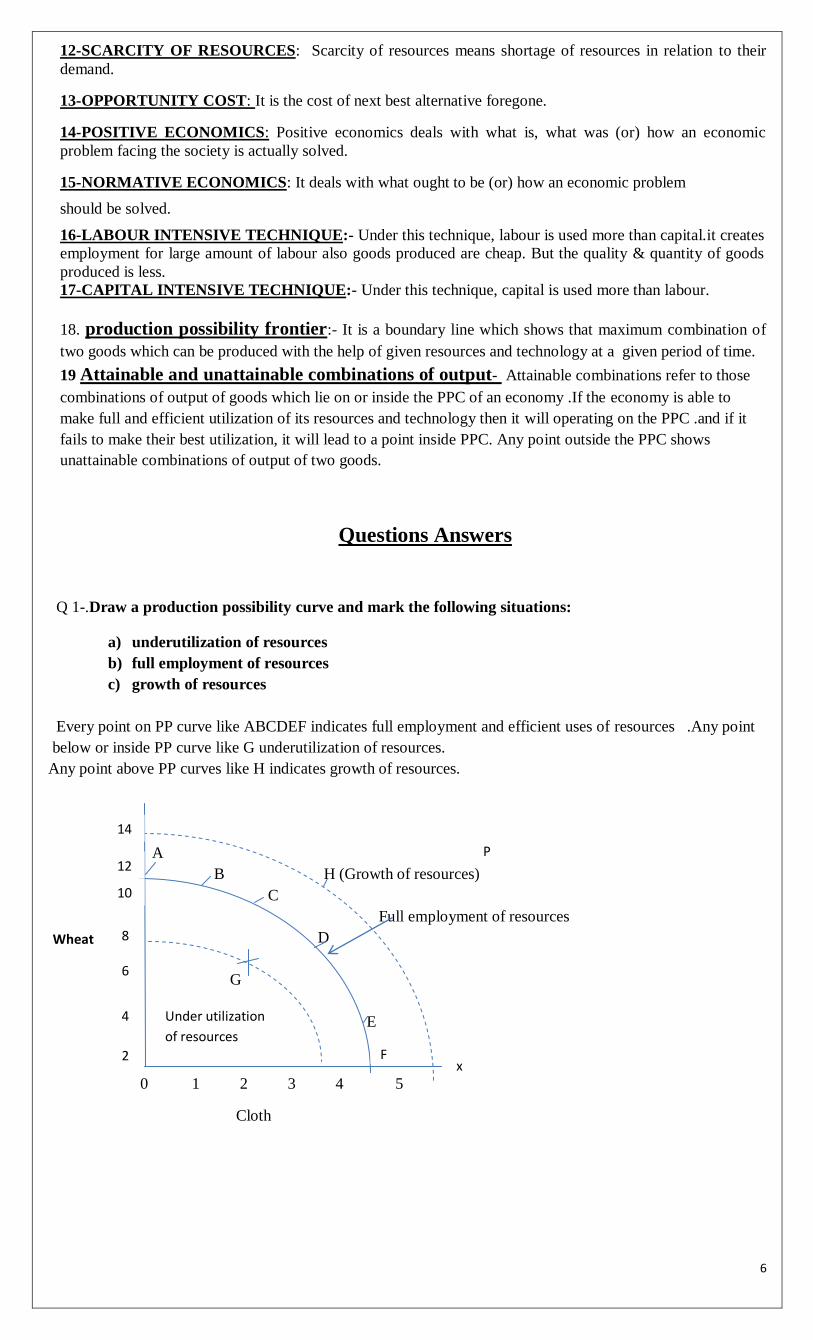
Q.2-Explain the concept of Production Possibility Curve And Opportunity Cost with the help of schedule
and diagram.
It refers to a curve which shows the various production possibilities that can be produced with given resources
and technology.
Production Possibilities Curve
Production
Possibility
Commodity
A
Commodity
B
Marginal opportunity
cost of commodity A
MRT
A 0 15 -
B 1 14 15-14=1 1:1
C 2 12 14-12=2 2:1
D 3 09 12-9=3 2:1
E 4 05 9-5=4 4:1
F 5 0 5-0=5 5:1
Commodity A
If the economy devotes all its resources to the production of commodity B, it can produce 15 units but then the
production of commodity A will be zero. There can be a number of production possibilities of commodity A & B.
If we want to produce more commodities B, we have to reduce the output of commodity A &vice versa.
Q.3.-Discuss the properties of PPC.
a) PP curve is a downward sloping curve.
In a full employment economy, more of one goods can be obtained only by giving up the production of other
goods. It is not possible to increase the production of both of them with the given resources.
b) The shape of the production possibility curve is concave to the origin.
The opportunity cost for a commodity is the amount of other commodity that has been forgone in order to
produce the first.
8
Q.4-What do you mean by marginal opportunity cost? Givean example.
-The marginal opportunity cost of a particular good along the PPC is defined as the amount sacrificed of the other goodfor
per unit increase in the production of an other good .
Example: Suppose a doctor having a private clinic in Delhi is earning Rs. 5lakhs annually. There are two other
alternatives for him.
1) Joining a Govt. hospital in Bangalore earning Rs. 4 lakhs annually.
2) Opening a clinic in his home town in Mysore and earning 3 lakhs annually.
The opportunity cost will be joining Govt. hospital in Bangalore.
Increasing marginal opportunity cost implies that PPC is concave.
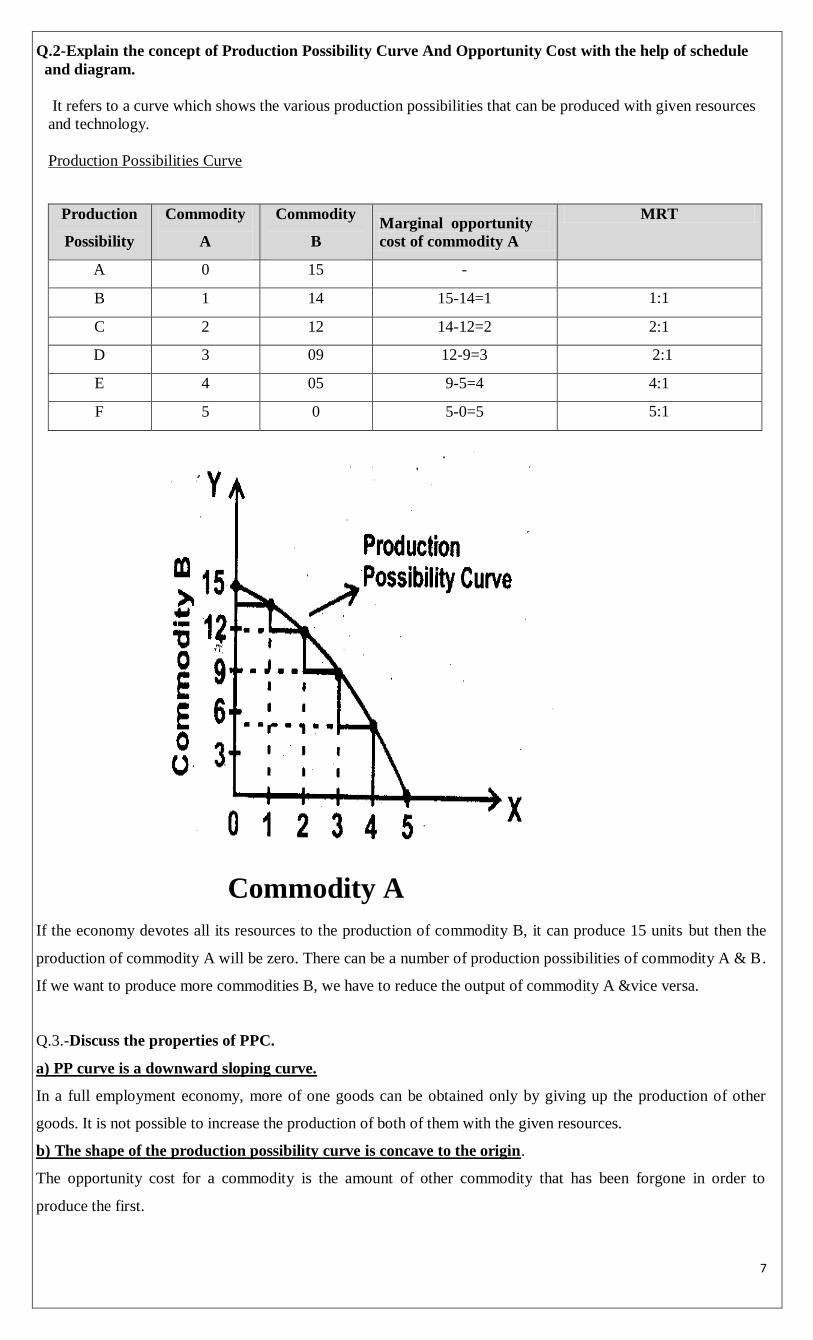
Q.5 -When does PPC Shifts rightward &leftward .
(1) Rightward (Upward shift)
(a) When there is improvement in technology.
(b) Increase in resources.
y
o x
(2) Leftward (Down ward shift)
When Resources depletes
y
O X
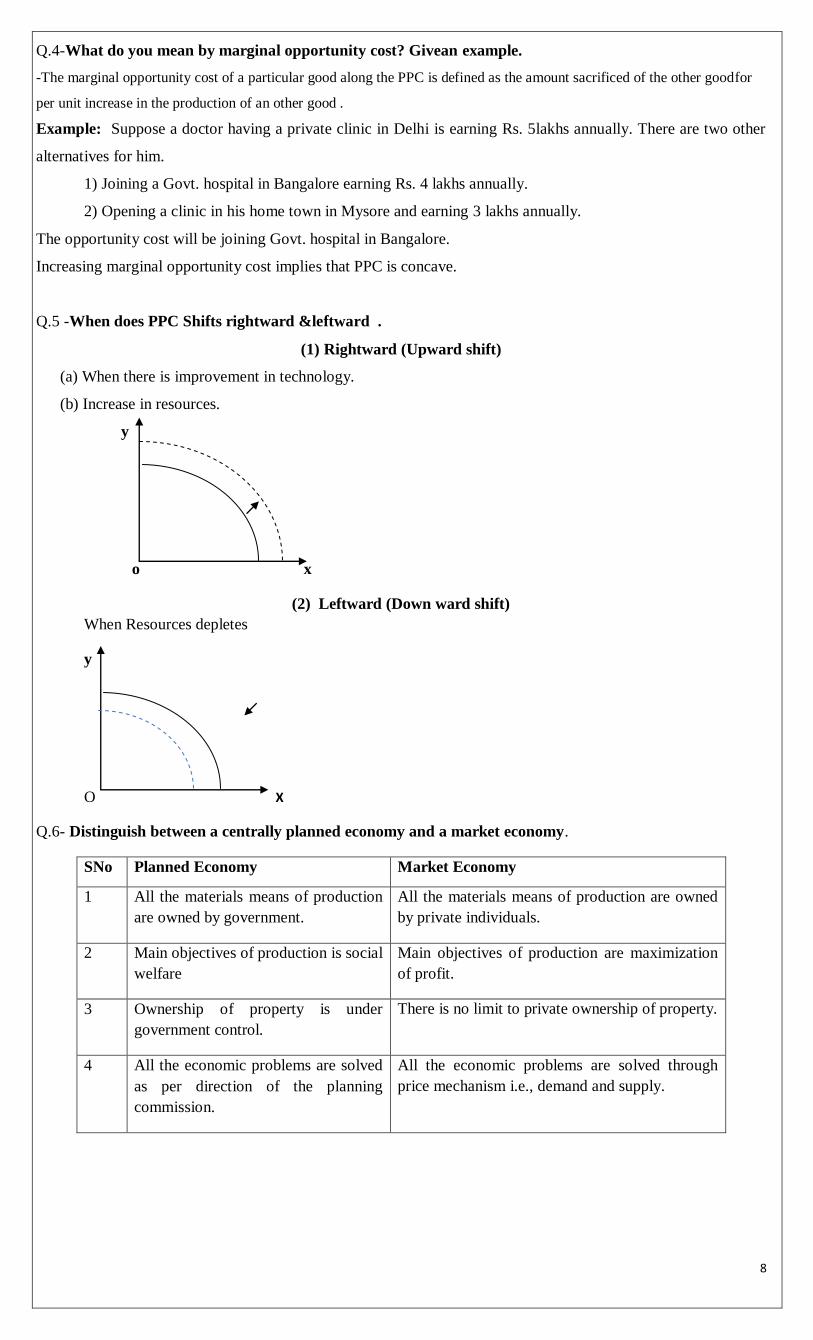
Q.6- Distinguish between a centrally planned economy and a market economy.
SNo Planned Economy Market Economy
1 All the materials means of production
are owned by government.
All the materials means of production are owned
by private individuals.
2 Main objectives of production is social
welfare
Main objectives of production are maximization
of profit.
3 Ownership of property is under
government control.
There is no limit to private ownership of property.
4 All the economic problems are solved
as per direction of the planning
commission.
All the economic problems are solved through
price mechanism i.e., demand and supply.
9
Q.7-Distinguish between micro economics and macroeconomics.
SN Micro economics Macro economics
1 It studies individual economic unit. It studies aggregate economic unit
2 It deals with determination of price
and output in individual markets
It deals with determination of general price
level and output in the economy.
3 Its central problems are price
determination and allocation of
resources.
Its central problem is determination of level of
Income and employment in the economy.
Q.8-Differencebetween positive and normative economics.
SN Positive Economics Normative Economics
1 It deals with what is what was. It deals with what ought to be.
2 It is based on cause and effect of
facts.
It is based on ethics.
3 It can be verified with actual data It cannot be verified with actual data.
4 In this value of judgments are not
given.
In this value of judgments are given.
HIGH ORDER TRHINKING QUESTIONS (HOTs)
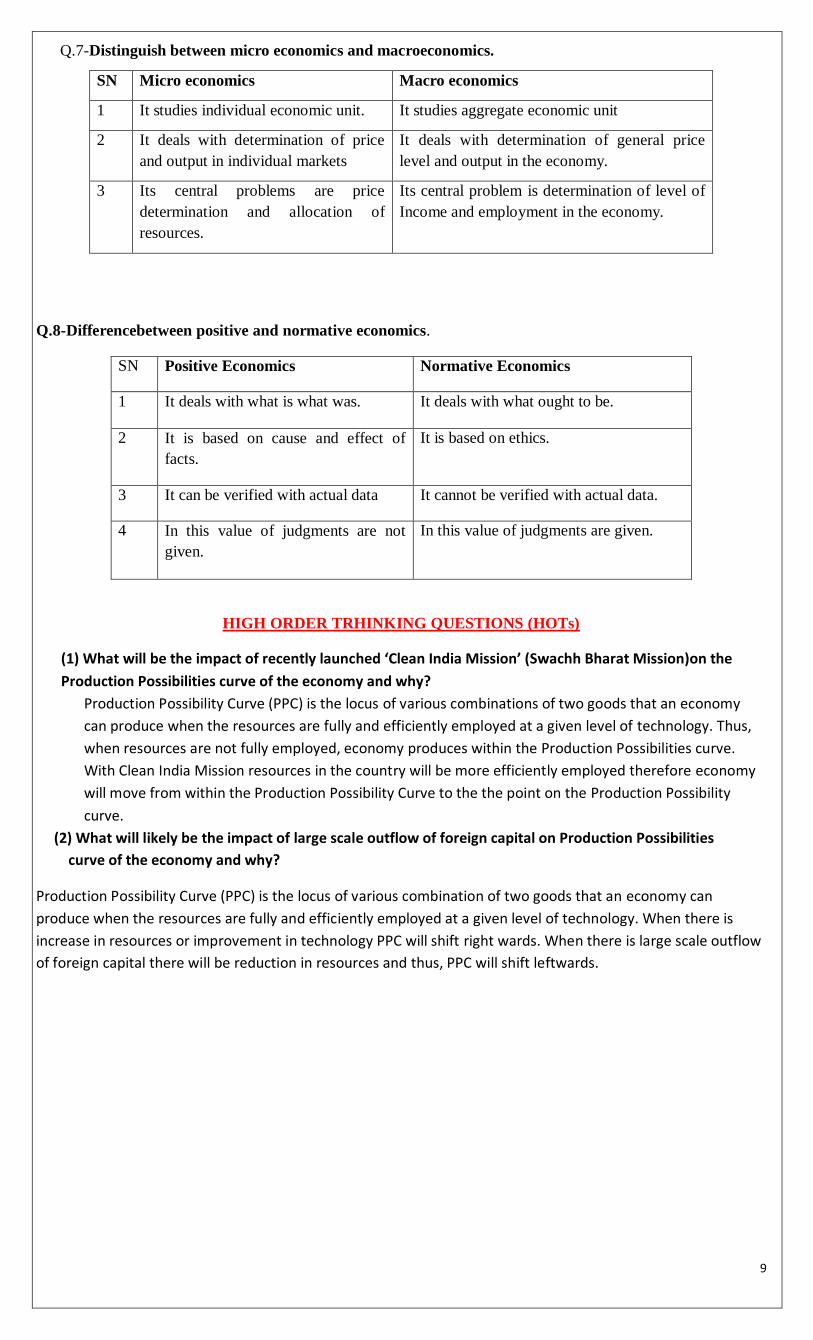
(1) What will be the impact of recently launched ‘Clean India Mission’ (Swachh Bharat Mission)on the
Production Possibilities curve of the economy and why?
Production Possibility Curve (PPC) is the locus of various combinations of two goods that an economy
can produce when the resources are fully and efficiently employed at a given level of technology. Thus,
when resources are not fully employed, economy produces within the Production Possibilities curve.
With Clean India Mission resources in the country will be more efficiently employed therefore economy
will move from within the Production Possibility Curve to the the point on the Production Possibility
curve.
(2) What will likely be the impact of large scale outflow of foreign capital on Production Possibilities
curve of the economy and why?
Production Possibility Curve (PPC) is the locus of various combination of two goods that an economy can
produce when the resources are fully and efficiently employed at a given level of technology. When there is
increase in resources or improvement in technology PPC will shift right wards. When there is large scale outflow
of foreign capital there will be reduction in resources and thus, PPC will shift leftwards.
10
UNIT 2
CONSUMER EQUILIBRIUM AND DEMAND
1. Budget set:- It refers to attainable combinations of a set of two goods, given prices of goods and income
of the consumer.
2. Budget line(price line):-It is a line showing different possible combinations of good-1 and good-2,Whicha
consumer can buy, given his budget and the prices of good-1 and good-2. Anywhere, on the budget line, a
consumer is spending his entire income either on good-1 or on good-2 or on both good-1 and good-2.PxX + PyY = M
3. Utility:- Want satisfying power of a good is called utility.
4. Marginal utility:- It refers to additional utility an account of consumption of an additional unit of a
commodity .
5. Consumer’s equilibrium:-The consumer is in equilibrium when, given his income and market prices, he
plan his expenditure (on different goods and services) in such a manner that he maximizes his total
satisfaction.
6. Indifference curve:- It is a locus of different combinations of two goods which give same level of
satisfaction to consumer. Consumer is indifferent between Each combination.
7. Law of Diminishing marginal utility:- Law of diminishing marginal utility states that as more and more
units of a commodity are consumed, marginal utility derived from every additional unit declines
8. Monotonic preferences: A consumer preferences are called monotonic when between any two bundles; one
bundle has more of at least one of the goods and no less of the other good as compared to another bundle.
9. Indifference map: various indifference curves shown in a diagram showing different level of satisfaction is
known as IC map
10. Demand:- It is the quantity Demanded of a commodity that a consumer is willing to buy and has
purchasing power to buy at a given price other things remaining constant like income , taste , preferences
etc.
11. Individual demand schedule:- It is tabular presentation of quantities demanded of a given commodity at
different prices, at a given time other things remaining constant like income , taste , preferences etc
12. market demand schedule:- Is a table showing different quantities of a commodity that all the buyers in the
market are ready to buy at different possible prices of the commodity at a point of time, other things
remaining constant like income , taste , preferences etc.
13. Demand curve:- The demand curve represent the maximum quantities per unit of time that consumers will
be willing to buy at various prices other things remaining constant like income , taste , preferences etc
14. Substitute goods- are those goods which can be used in place of each other. Ex. Tea and Coffee.
15. Complementary goods-are those goods which are used together to satisfy a given want. Ex :Car and petrol.
16. Demand function- A demand function shows the functional relationship between the quantity demanded
and the factors on which demand depends on.
17. Cross Demand -It is a situation, where in change in the price of one commodity results in the change in The
demand for other commodity and vice-versa.
3/4MARKS QUESTIONS &ANSWERWERS
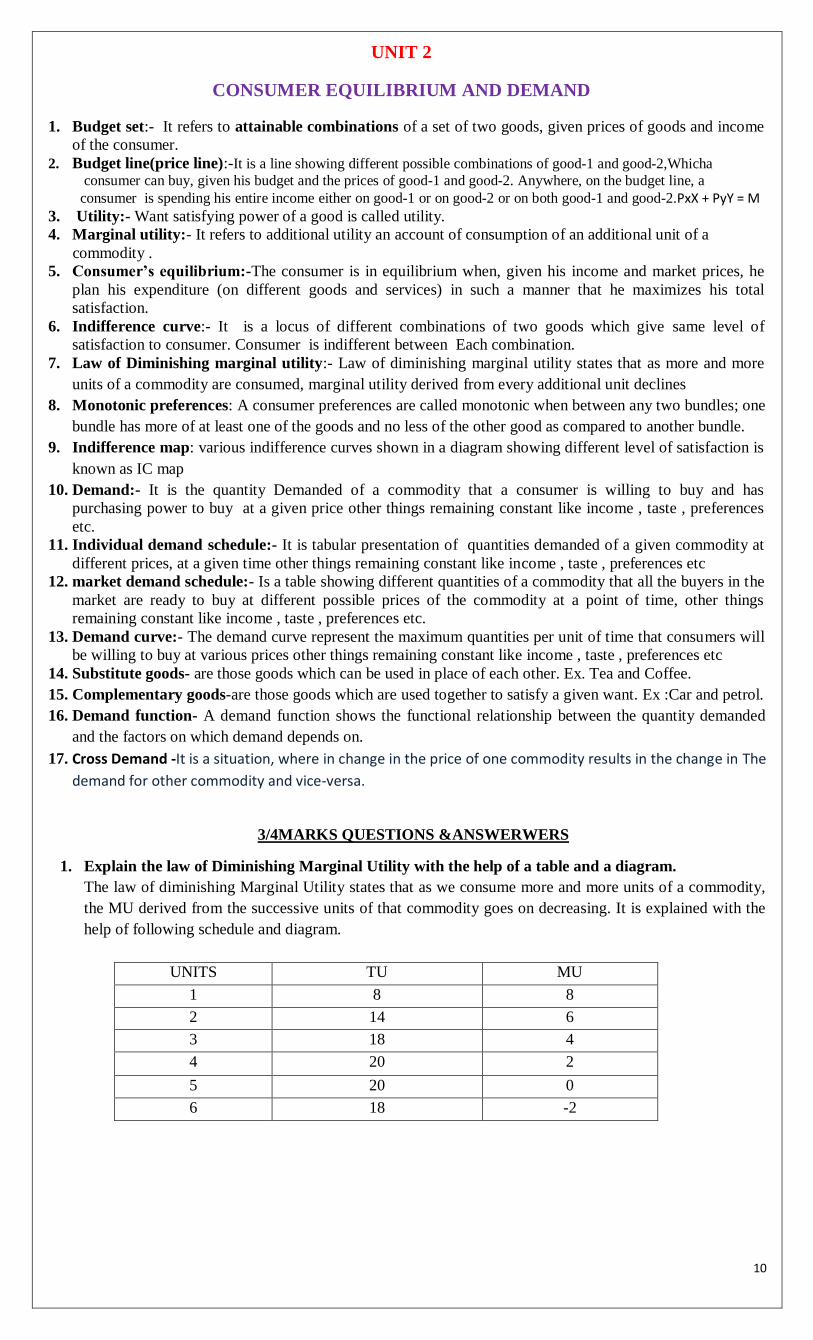
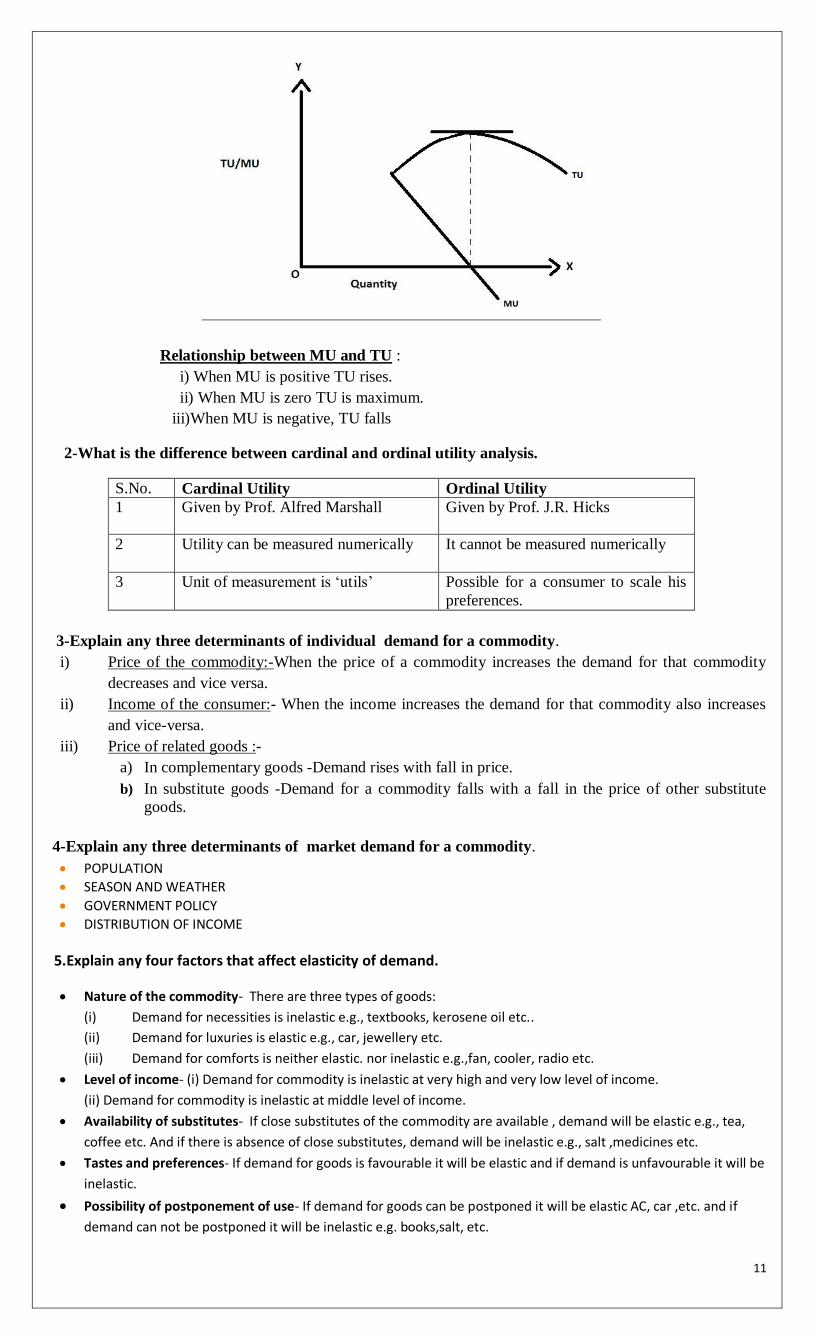
1. Explain the law of Diminishing Marginal Utility with the help of a table and a diagram.
The law of diminishing Marginal Utility states that as we consume more and more units of a commodity,
the MU derived from the successive units of that commodity goes on decreasing. It is explained with the
help of following schedule and diagram.
UNITS TU MU
1 8 8
2 14 6
3 18 4
4 20 2
5 20 0
6 18 -2
11
Relationship between MU and TU :
i) When MU is positive TU rises.
ii) When MU is zero TU is maximum.
iii)When MU is negative, TU falls
2-What is the difference between cardinal and ordinal utility analysis.
S.No. Cardinal Utility Ordinal Utility
1 Given by Prof. Alfred Marshall Given by Prof. J.R. Hicks
2 Utility can be measured numerically It cannot be measured numerically
3 Unit of measurement is „utils‟ Possible for a consumer to scale his
preferences.
3-Explain any three determinants of individual demand for a commodity.
i) Price of the commodity:-When the price of a commodity increases the demand for that commodity
decreases and vice versa.
ii) Income of the consumer:- When the income increases the demand for that commodity also increases
and vice-versa.
iii) Price of related goods :-
a) In complementary goods -Demand rises with fall in price.
b) In substitute goods -Demand for a commodity falls with a fall in the price of other substitute
goods.
4-Explain any three determinants of market demand for a commodity.
POPULATION
SEASON AND WEATHER
GOVERNMENT POLICY
DISTRIBUTION OF INCOME
5.Explain any four factors that affect elasticity of demand.
Nature of the commodity- There are three types of goods:
(i) Demand for necessities is inelastic e.g., textbooks, kerosene oil etc..
(ii) Demand for luxuries is elastic e.g., car, jewellery etc.
(iii) Demand for comforts is neither elastic. nor inelastic e.g.,fan, cooler, radio etc.
Level of income- (i) Demand for commodity is inelastic at very high and very low level of income.
(ii) Demand for commodity is inelastic at middle level of income.
Availability of substitutes- If close substitutes of the commodity are available , demand will be elastic e.g., tea,
coffee etc. And if there is absence of close substitutes, demand will be inelastic e.g., salt ,medicines etc.
Tastes and preferences- If demand for goods is favourable it will be elastic and if demand is unfavourable it will be
inelastic.
Possibility of postponement of use- If demand for goods can be postponed it will be elastic AC, car ,etc. and if
demand can not be postponed it will be inelastic e.g. books,salt, etc.
12
Various uses of the commodity- If a commodity can be put to many uses, demand will be elastic e.g.,
electricity,milk etc. And If a commodity can not be put to many uses, demand will be inelastic e.g., salt,pen etc.
6-Explain the effect of the following on the market demand of a commodity.
a. Change in price of related goods
b. Change in the number of its buyers.
a) Price of related goods :
i) Complementary goods :The demand for a commodity rises with a fall in the price of its
complementary good (Car and petrol)
ii) Substitute goods: Demand for a commodity falls with a fall in the price of other substitute good
(Tea& Coffee).
b) Consumer’s group: More the consumers more will be market demand and vice-versa
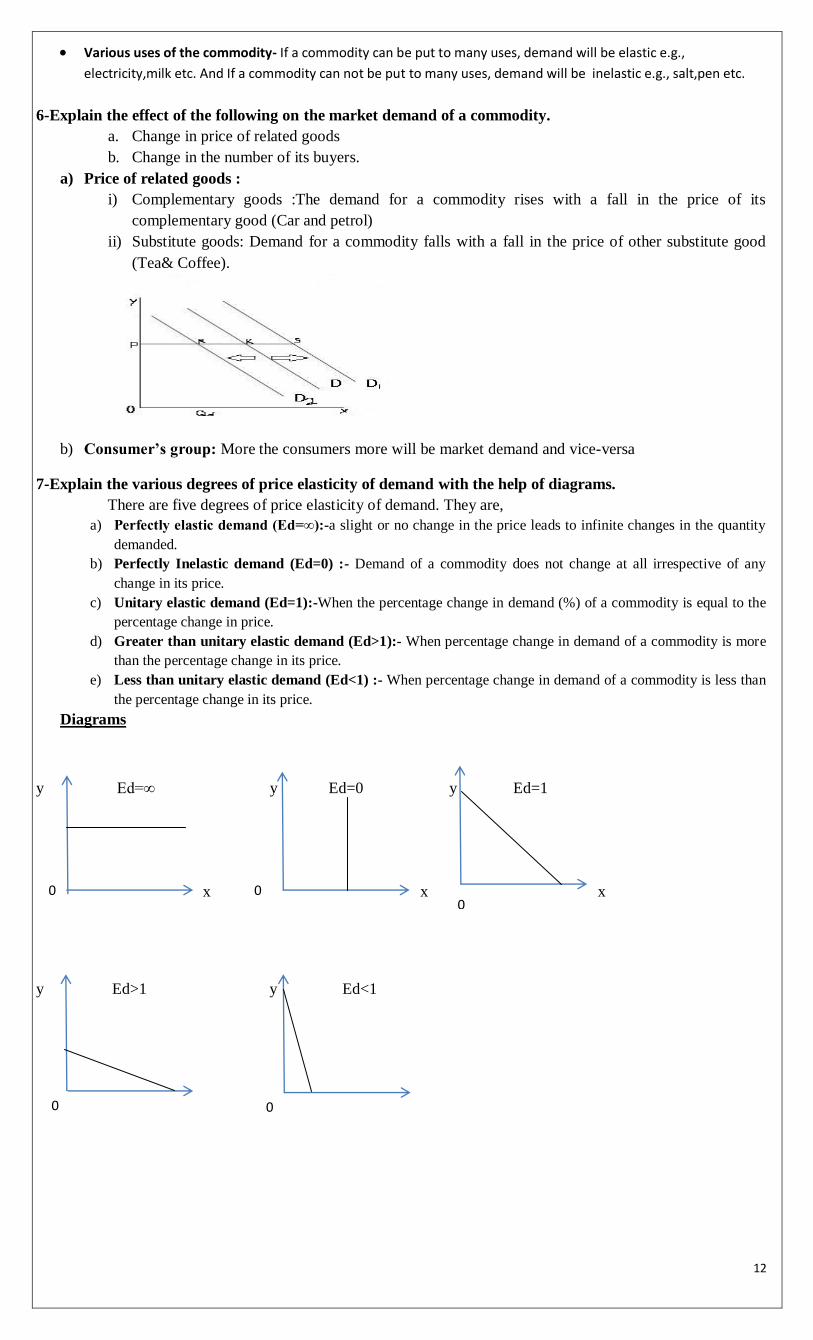
7-Explain the various degrees of price elasticity of demand with the help of diagrams.
There are five degrees of price elasticity of demand. They are,
a) Perfectly elastic demand (Ed=∞):-a slight or no change in the price leads to infinite changes in the quantity
demanded.
b) Perfectly Inelastic demand (Ed=0) :- Demand of a commodity does not change at all irrespective of any
change in its price.
c) Unitary elastic demand (Ed=1):-When the percentage change in demand (%) of a commodity is equal to the
percentage change in price.
d) Greater than unitary elastic demand (Ed>1):- When percentage change in demand of a commodity is more
than the percentage change in its price.
e) Less than unitary elastic demand (Ed<1) :- When percentage change in demand of a commodity is less than
the percentage change in its price.
Diagrams
y Ed=∞ y Ed=0 y Ed=1
x x x
y Ed>1 y Ed<1
0
0 0
0
0
13
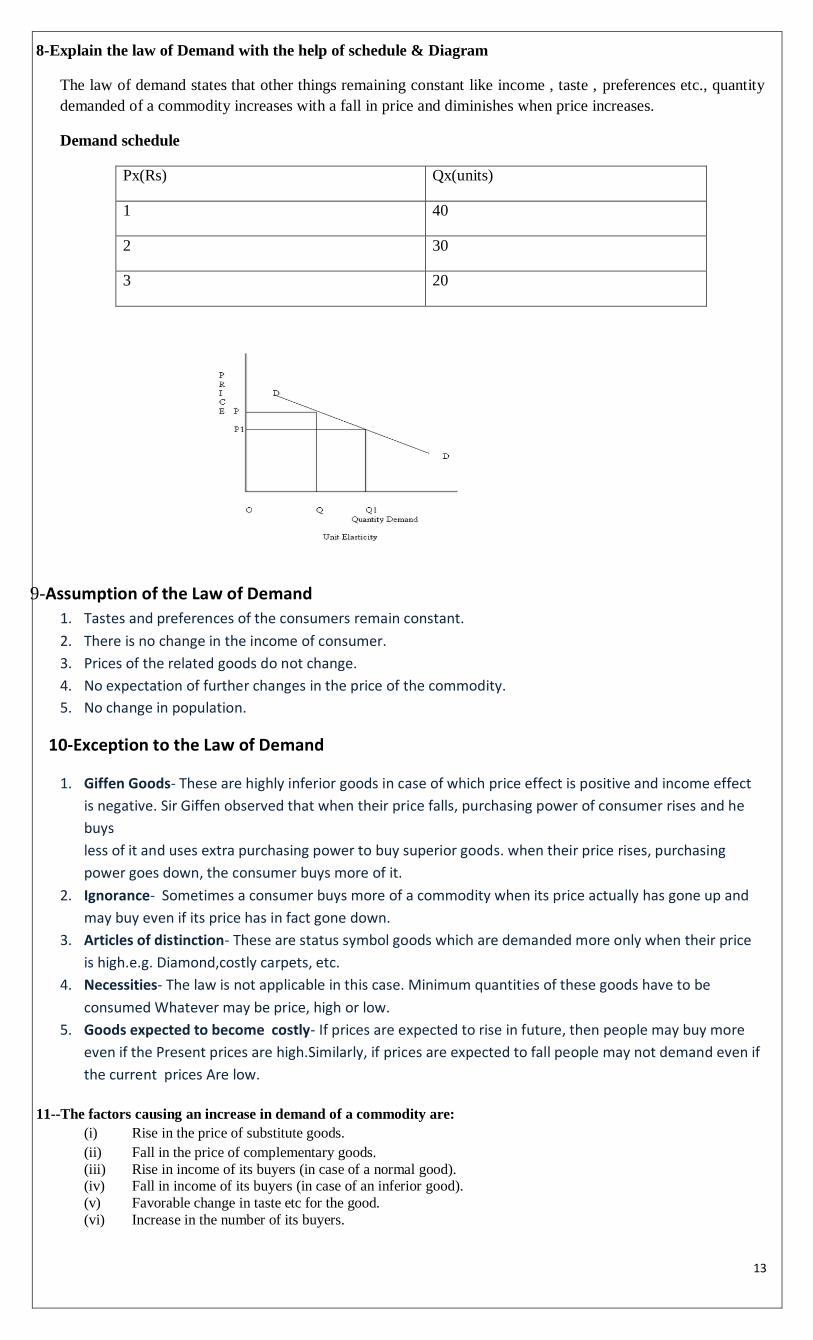
8-Explain the law of Demand with the help of schedule & Diagram
The law of demand states that other things remaining constant like income , taste , preferences etc., quantity
demanded of a commodity increases with a fall in price and diminishes when price increases.
Demand schedule
Px(Rs) Qx(units)
1 40
2 30
3 20
9-Assumption of the Law of Demand
1. Tastes and preferences of the consumers remain constant.
2. There is no change in the income of consumer.
3. Prices of the related goods do not change.
4. No expectation of further changes in the price of the commodity.
5. No change in population.
10-Exception to the Law of Demand
1. Giffen Goods- These are highly inferior goods in case of which price effect is positive and income effect
is negative. Sir Giffen observed that when their price falls, purchasing power of consumer rises and he
buys
less of it and uses extra purchasing power to buy superior goods. when their price rises, purchasing
power goes down, the consumer buys more of it.
2. Ignorance- Sometimes a consumer buys more of a commodity when its price actually has gone up and
may buy even if its price has in fact gone down.
3. Articles of distinction- These are status symbol goods which are demanded more only when their price
is high.e.g. Diamond,costly carpets, etc.
4. Necessities- The law is not applicable in this case. Minimum quantities of these goods have to be
consumed Whatever may be price, high or low.
5. Goods expected to become costly- If prices are expected to rise in future, then people may buy more
even if the Present prices are high.Similarly, if prices are expected to fall people may not demand even if
the current prices Are low.
11--The factors causing an increase in demand of a commodity are:
(i) Rise in the price of substitute goods.
(ii) Fall in the price of complementary goods.
(iii) Rise in income of its buyers (in case of a normal good). (iv) Fall in income of its buyers (in case of an inferior good).
(v) Favorable change in taste etc for the good.
(vi) Increase in the number of its buyers.
14
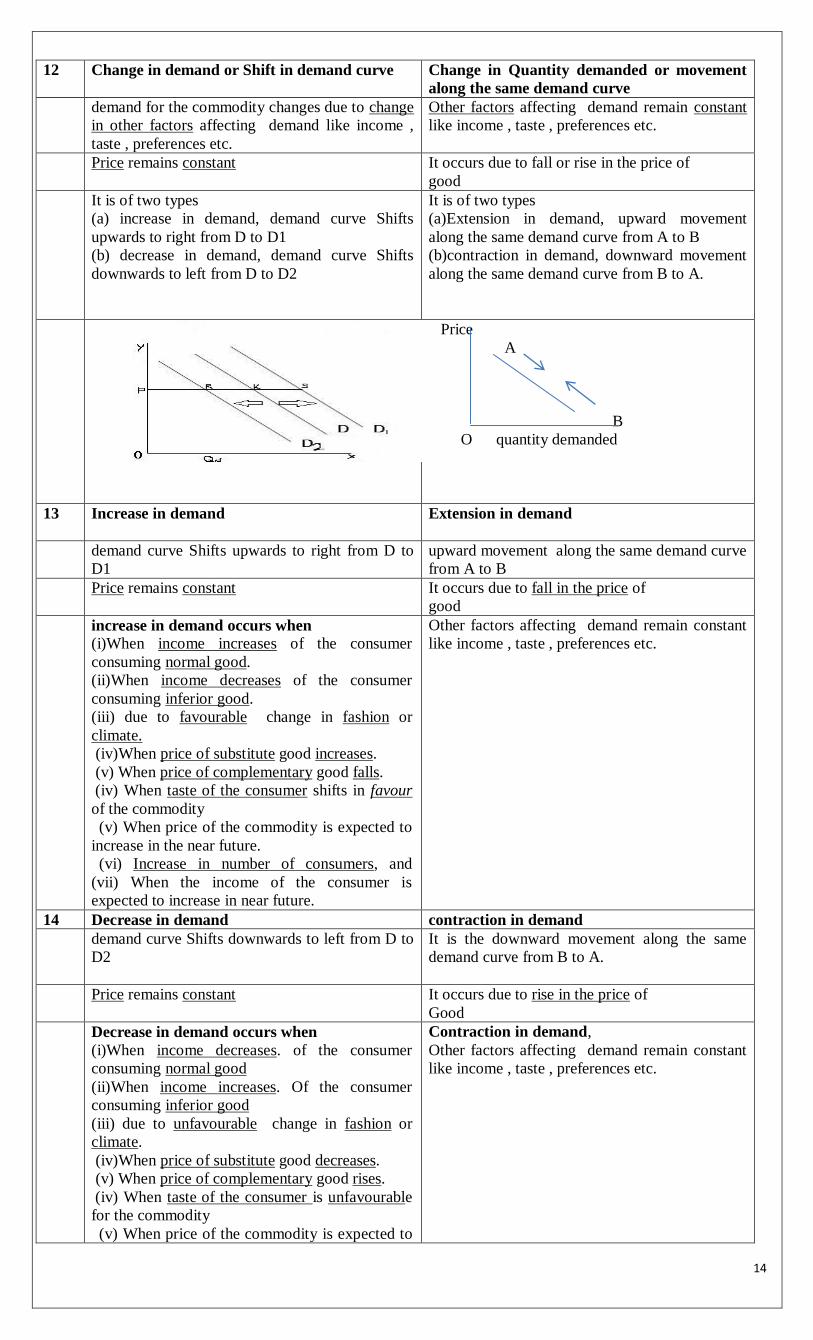
12 Change in demand or Shift in demand curve Change in Quantity demanded or movement
along the same demand curve
demand for the commodity changes due to change
in other factors affecting demand like income ,
taste , preferences etc.
Other factors affecting demand remain constant
like income , taste , preferences etc.
Price remains constant It occurs due to fall or rise in the price of
good
It is of two types
(a) increase in demand, demand curve Shifts
upwards to right from D to D1
(b) decrease in demand, demand curve Shifts
downwards to left from D to D2
It is of two types
(a)Extension in demand, upward movement
along the same demand curve from A to B
(b)contraction in demand, downward movement
along the same demand curve from B to A.
Price
A
B
O quantity demanded
13 Increase in demand
Extension in demand
demand curve Shifts upwards to right from D to
D1
upward movement along the same demand curve
from A to B
Price remains constant It occurs due to fall in the price of
good
increase in demand occurs when
(i)When income increases of the consumer
consuming normal good.
(ii)When income decreases of the consumer
consuming inferior good.
(iii) due to favourable change in fashion or
climate.
(iv)When price of substitute good increases.
(v) When price of complementary good falls.
(iv) When taste of the consumer shifts in favour
of the commodity
(v) When price of the commodity is expected to
increase in the near future.
(vi) Increase in number of consumers, and
(vii) When the income of the consumer is
expected to increase in near future.
Other factors affecting demand remain constant
like income , taste , preferences etc.
14 Decrease in demand contraction in demand
demand curve Shifts downwards to left from D to
D2
It is the downward movement along the same
demand curve from B to A.
Price remains constant It occurs due to rise in the price of
Good
Decrease in demand occurs when
(i)When income decreases. of the consumer
consuming normal good
(ii)When income increases. Of the consumer
consuming inferior good
(iii) due to unfavourable change in fashion or
climate.
(iv)When price of substitute good decreases.
(v) When price of complementary good rises.
(iv) When taste of the consumer is unfavourable
for the commodity
(v) When price of the commodity is expected to
Contraction in demand,
Other factors affecting demand remain constant
like income , taste , preferences etc.
15
decrease in the near future.
(vi) decrease in number of consumers, and
(vii) When the income of the consumer is
expected to decrease in near future.
6. MARKS QUESTIONS
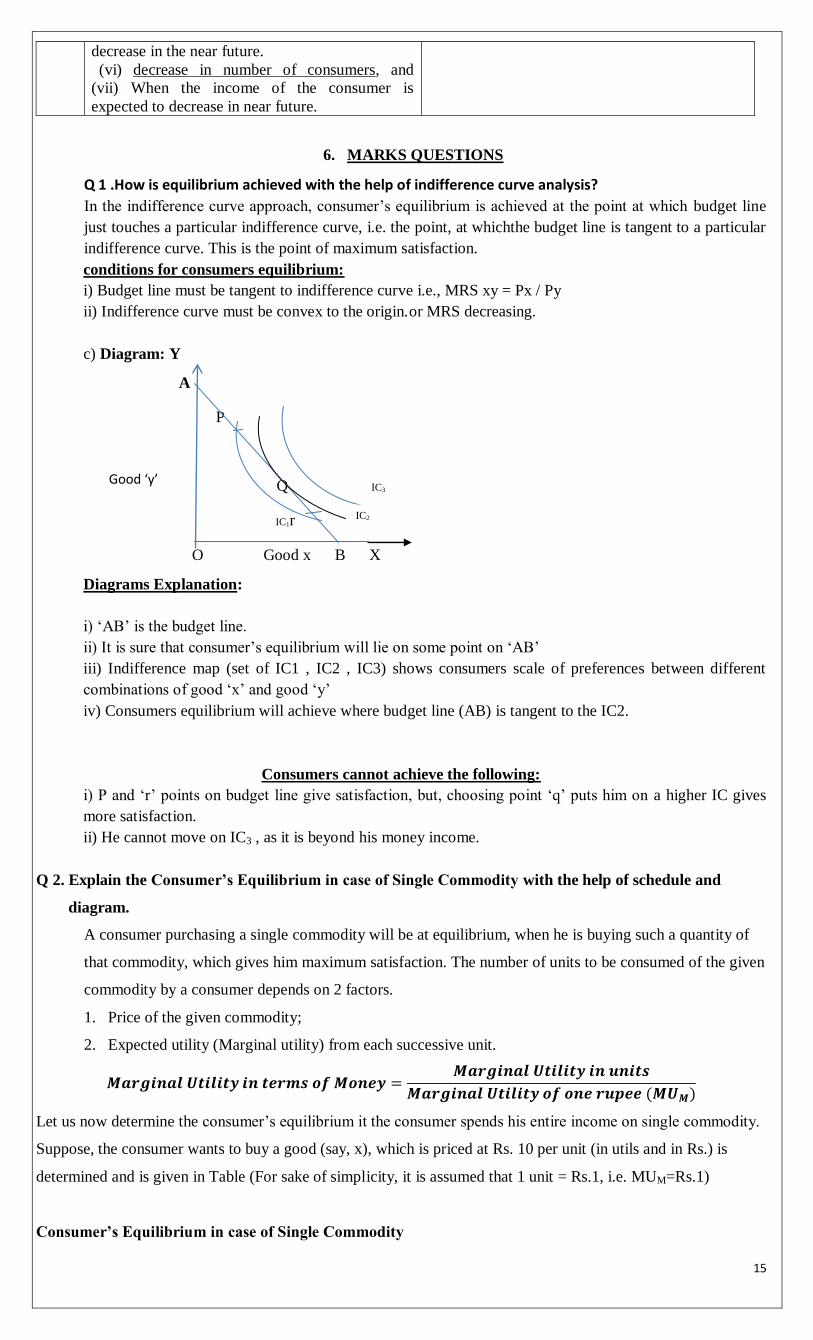
Q 1 .How is equilibrium achieved with the help of indifference curve analysis?
In the indifference curve approach, consumer‟s equilibrium is achieved at the point at which budget line
just touches a particular indifference curve, i.e. the point, at whichthe budget line is tangent to a particular
indifference curve. This is the point of maximum satisfaction.
conditions for consumers equilibrium:
i) Budget line must be tangent to indifference curve i.e., MRS xy = Px / Py
ii) Indifference curve must be convex to the origin.or MRS decreasing.
c) Diagram: Y
A
P
Q IC3
IC1r
O Good x B X
Diagrams Explanation:
i) „AB‟ is the budget line.
ii) It is sure that consumer‟s equilibrium will lie on some point on „AB‟
iii) Indifference map (set of IC1 , IC2 , IC3) shows consumers scale of preferences between different
combinations of good „x‟ and good „y‟
iv) Consumers equilibrium will achieve where budget line (AB) is tangent to the IC2.
Consumers cannot achieve the following:
i) P and „r‟ points on budget line give satisfaction, but, choosing point „q‟ puts him on a higher IC gives
more satisfaction.
ii) He cannot move on IC3 , as it is beyond his money income.
Q 2. Explain the Consumer’s Equilibrium in case of Single Commodity with the help of schedule and
diagram.
A consumer purchasing a single commodity will be at equilibrium, when he is buying such a quantity of
that commodity, which gives him maximum satisfaction. The number of units to be consumed of the given
commodity by a consumer depends on 2 factors.
1. Price of the given commodity;
2. Expected utility (Marginal utility) from each successive unit.
𝑴𝒂𝒓𝒈𝒊𝒏𝒂𝒍 𝑼𝒕𝒊𝒍𝒊𝒕𝒚 𝒊𝒏 𝒕𝒆𝒓𝒎𝒔 𝒐𝒇 𝑴𝒐𝒏𝒆𝒚 =𝑴𝒂𝒓𝒈𝒊𝒏𝒂𝒍 𝑼𝒕𝒊𝒍𝒊𝒕𝒚 𝒊𝒏 𝒖𝒏𝒊𝒕𝒔
𝑴𝒂𝒓𝒈𝒊𝒏𝒂𝒍 𝑼𝒕𝒊𝒍𝒊𝒕𝒚 𝒐𝒇 𝒐𝒏𝒆 𝒓𝒖𝒑𝒆𝒆 (𝑴𝑼𝑴)
Let us now determine the consumer‟s equilibrium it the consumer spends his entire income on single commodity.
Suppose, the consumer wants to buy a good (say, x), which is priced at Rs. 10 per unit (in utils and in Rs.) is
determined and is given in Table (For sake of simplicity, it is assumed that 1 unit = Rs.1, i.e. MUM=Rs.1)
Consumer’s Equilibrium in case of Single Commodity
Good ‘y’
IC2
16
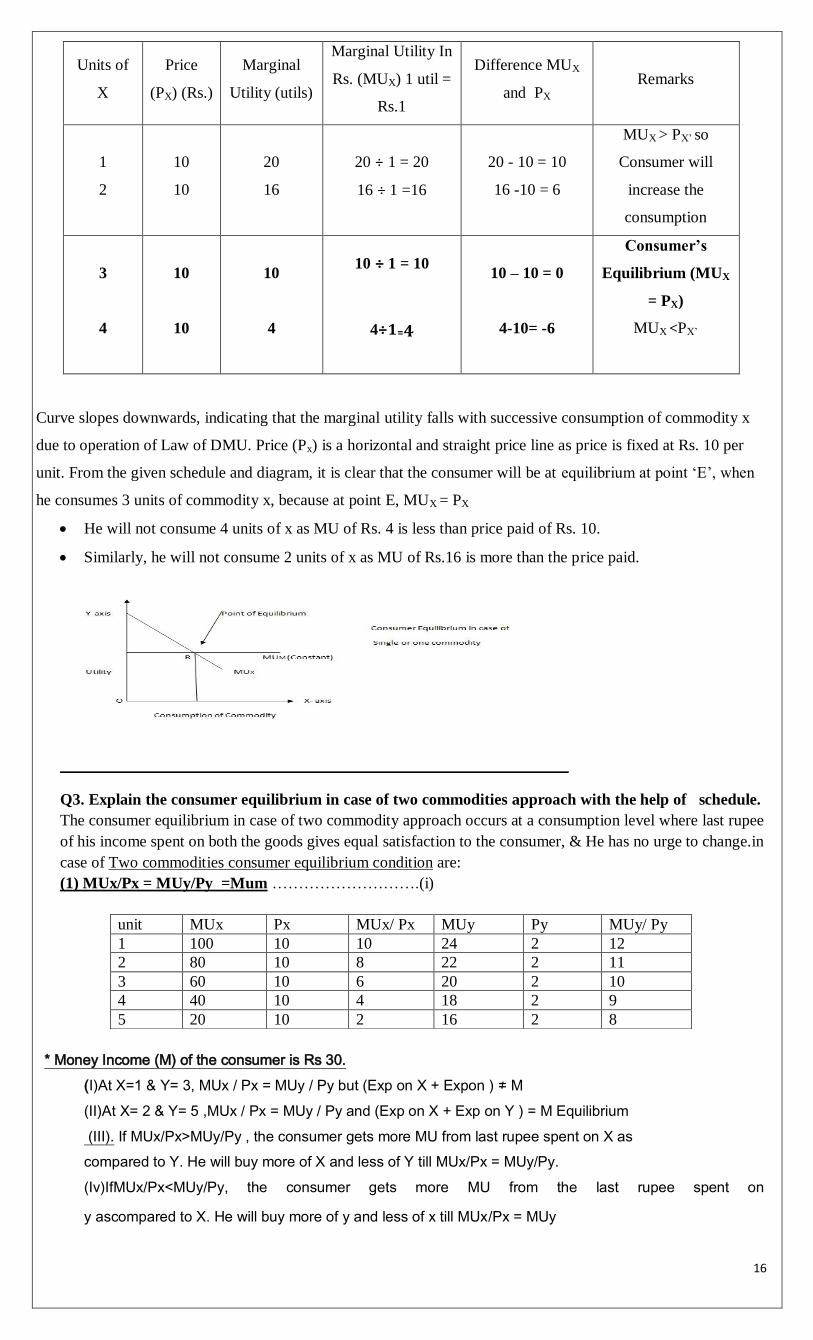
Units of
X
Price
(PX) (Rs.)
Marginal
Utility (utils)
Marginal Utility In
Rs. (MUX) 1 util =
Rs.1
Difference MUX
and PX Remarks
1
2
10
10
20
16
20 ÷ 1 = 20
16 ÷ 1 =16
20 - 10 = 10
16 -10 = 6
MUX > PX‟ so
Consumer will
increase the
consumption
3
4
10
10
10
4
10 ÷ 1 = 10
4÷1=4
10 – 10 = 0
4-10= -6
Consumer’s
Equilibrium (MUX
= PX)
MUX <PX‟
vvv
Curve slopes downwards, indicating that the marginal utility falls with successive consumption of commodity x
due to operation of Law of DMU. Price (Px) is a horizontal and straight price line as price is fixed at Rs. 10 per
unit. From the given schedule and diagram, it is clear that the consumer will be at equilibrium at point „E‟, when
he consumes 3 units of commodity x, because at point E, MUX = PX
He will not consume 4 units of x as MU of Rs. 4 is less than price paid of Rs. 10.
Similarly, he will not consume 2 units of x as MU of Rs.16 is more than the price paid.
Q3. Explain the consumer equilibrium in case of two commodities approach with the help of schedule.
The consumer equilibrium in case of two commodity approach occurs at a consumption level where last rupee
of his income spent on both the goods gives equal satisfaction to the consumer, & He has no urge to change.in
case of Two commodities consumer equilibrium condition are:
(1) MUx/Px = MUy/Py =Mum ……………………….(i)
* Money Income (M) of the consumer is Rs 30.
(I)At X=1 & Y= 3, MUx / Px = MUy / Py but (Exp on X + Expon ) ≠ M
(II)At X= 2 & Y= 5 ,MUx / Px = MUy / Py and (Exp on X + Exp on Y ) = M Equilibrium
(III). If MUx/Px>MUy/Py , the consumer gets more MU from last rupee spent on X as
compared to Y. He will buy more of X and less of Y till MUx/Px = MUy/Py.
(Iv)IfMUx/Px<MUy/Py, the consumer gets more MU from the last rupee spent on
y ascompared to X. He will buy more of y and less of x till MUx/Px = MUy
unit MUx Px MUx/ Px MUy Py MUy/ Py
1 100 10 10 24 2 12
2 80 10 8 22 2 11
3 60 10 6 20 2 10
4 40 10 4 18 2 9
5 20 10 2 16 2 8
17
(2) consumer spends all his income so consumer’s expenditure equals =QxPx+QyPy=M………..(2)
2x10+5x2=30
Q.4-Explain the concept of MRS with the help of a numerical example. Also explain its
behavior along an indifference curve.
MRS refers the rate of sacrifice of good Y for increase the unit of good X i.e .= -∆Y/∆X. It tends to decrease along an IC that implying –the consumer is willing to give up less and less unit of good Y for every
additional unit of good X. This is due to the law of diminishing marginal utility ( LDMU).
Combination Good X Good Y MRS= ∆Y/∆X. I 1 10 ---- II 2 7 3/1= 3 III 3 5 2/1 =2 IV 4 4 1/1=1
Q.5-A consumer consumes two goods X and Y. What will happen if MUx/Px is greaterthanMUy/Py?
If MUx/Px is greater than MUy/Py, then it means that the satisfaction a consumer derives from spending a rupee on Good x is greater than the satisfaction derived from spending a rupee on Good Y.
The consumer will relocate her income – substitute Good X for Good Y. As the consumption of Good X increases its marginal utility will fall. As the consumption of Good Y decreases, it marginal utility will increase. This is due to the law of diminishing marginal utility.
This process will continue till MUx/Px becomes equal to MUy/Py and the consumer is in equilibrium.
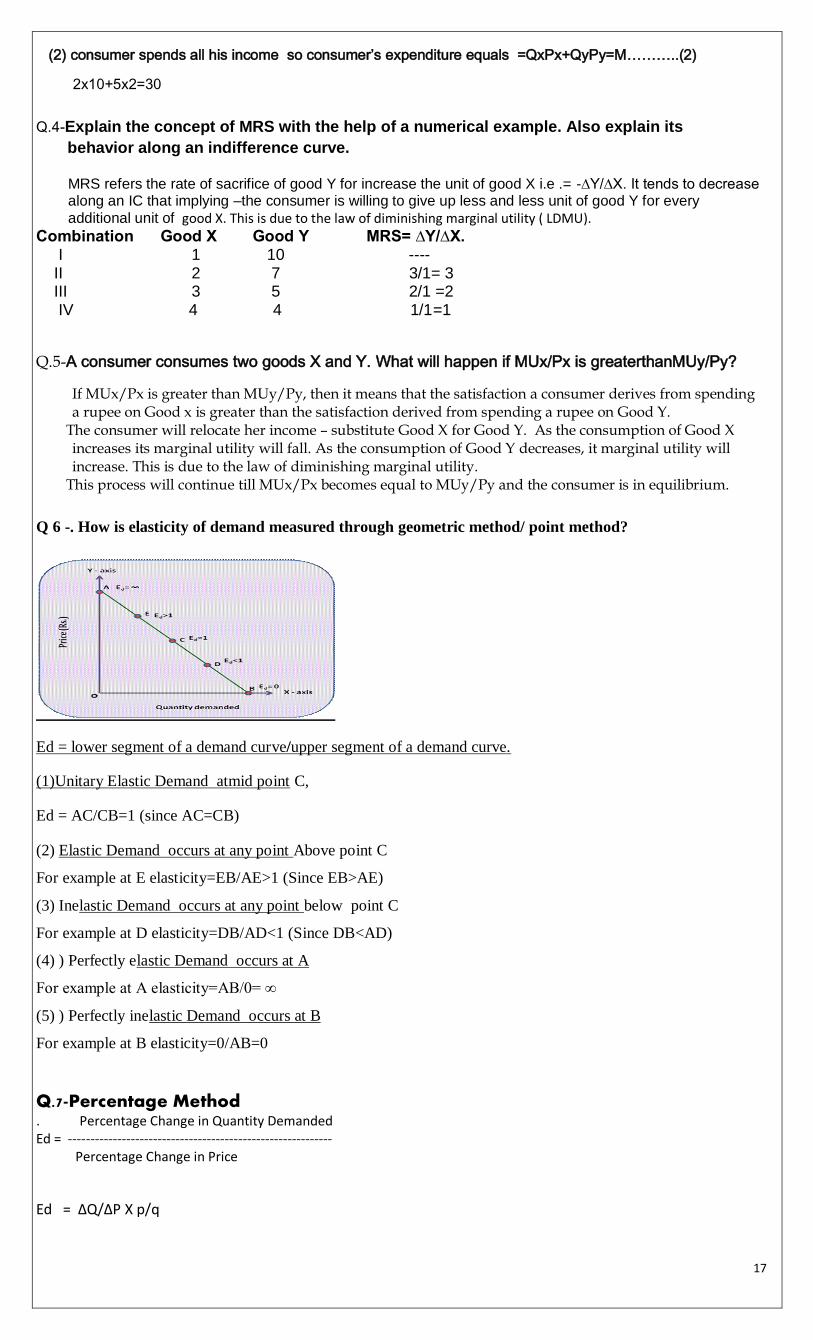
Q 6 -. How is elasticity of demand measured through geometric method/ point method?
Ed = lower segment of a demand curve/upper segment of a demand curve.
(1)Unitary Elastic Demand atmid point C,
Ed = AC/CB=1 (since AC=CB)
(2) Elastic Demand occurs at any point Above point C
For example at E elasticity=EB/AE>1 (Since EB>AE)
(3) Inelastic Demand occurs at any point below point C
For example at D elasticity=DB/AD<1 (Since DB<AD)
(4) ) Perfectly elastic Demand occurs at A
For example at A elasticity=AB/0= ∞
(5) ) Perfectly inelastic Demand occurs at B
For example at B elasticity=0/AB=0
Q.7-Percentage Method . Percentage Change in Quantity Demanded Ed = ----------------------------------------------------------- Percentage Change in Price
Ed = ∆Q/∆P X p/q
18
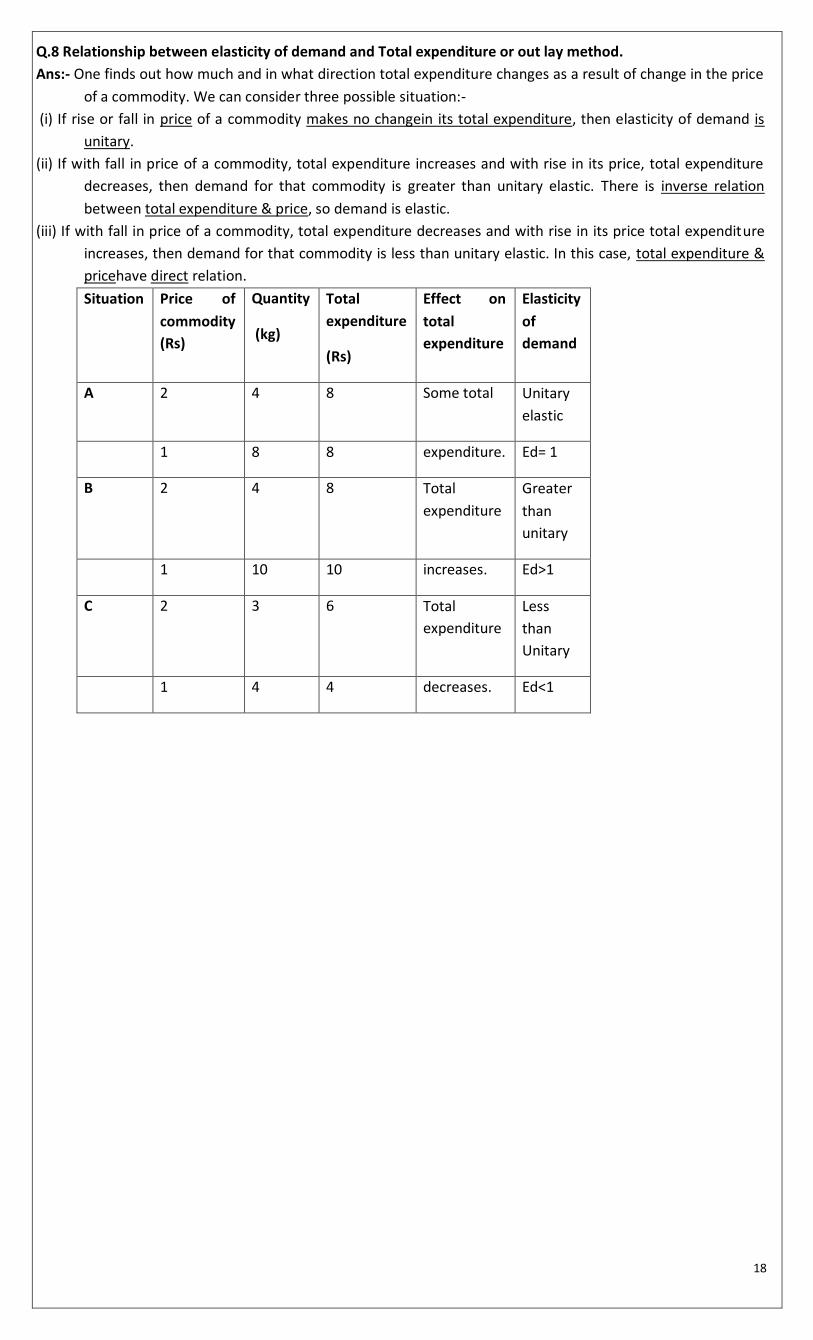
Q.8 Relationship between elasticity of demand and Total expenditure or out lay method.
Ans:- One finds out how much and in what direction total expenditure changes as a result of change in the price
of a commodity. We can consider three possible situation:-
(i) If rise or fall in price of a commodity makes no changein its total expenditure, then elasticity of demand is
unitary.
(ii) If with fall in price of a commodity, total expenditure increases and with rise in its price, total expenditure
decreases, then demand for that commodity is greater than unitary elastic. There is inverse relation
between total expenditure & price, so demand is elastic.
(iii) If with fall in price of a commodity, total expenditure decreases and with rise in its price total expenditure
increases, then demand for that commodity is less than unitary elastic. In this case, total expenditure &
pricehave direct relation.
Situation Price of
commodity
(Rs)
Quantity
(kg)
Total
expenditure
(Rs)
Effect on
total
expenditure
Elasticity
of
demand
A 2 4 8 Some total Unitary
elastic
1 8 8 expenditure. Ed= 1
B 2 4 8 Total
expenditure
Greater
than
unitary
1 10 10 increases. Ed>1
C 2 3 6 Total
expenditure
Less
than
Unitary
1 4 4 decreases. Ed<1
19
UNIT 3
PRODUCER BEHAVIOUR AND SUPPLY
Production function : refers to the functional relationship between inputs and output for a given state of
technology.Ox = f(i1,i2………..in)
Market period : is that period where supply / output cannot be altered or changed.
Short period / run : is that period where supply / output can be altered / changed by changing only variable
factors of production. In other words fixed factors of production remain fixed.
Long period : is that period where all factors of production are changed to bring about changes in output / supply.
No factor is fixed.
Fixed factors : These factors remain fixed or cannot be changed in the short run. Examples building, plant and
machinery, land etc.
Variable factors : These factors are varied to bring about changes in output.
Concept of product :- Refers to volume of goods produced by a firm or an industry during a specific period of
time.
Total Product- Total quantity of goods produced by a firm / industry during a given period of
time with given number of inputs.
Average product = output per unit of variable input.
APP =TPP / units of variable factor
Marginal product (MP): refers to addition to the total product, when one more unit of variable factor is
employed.
MPn = TPn– TPn-1
Point of Inflexion -It is a point from where slopes of TP curve changes, upto this point TP has been increasing
at the increasing rate from this point onwards TP increases, but only at the diminishing rate.
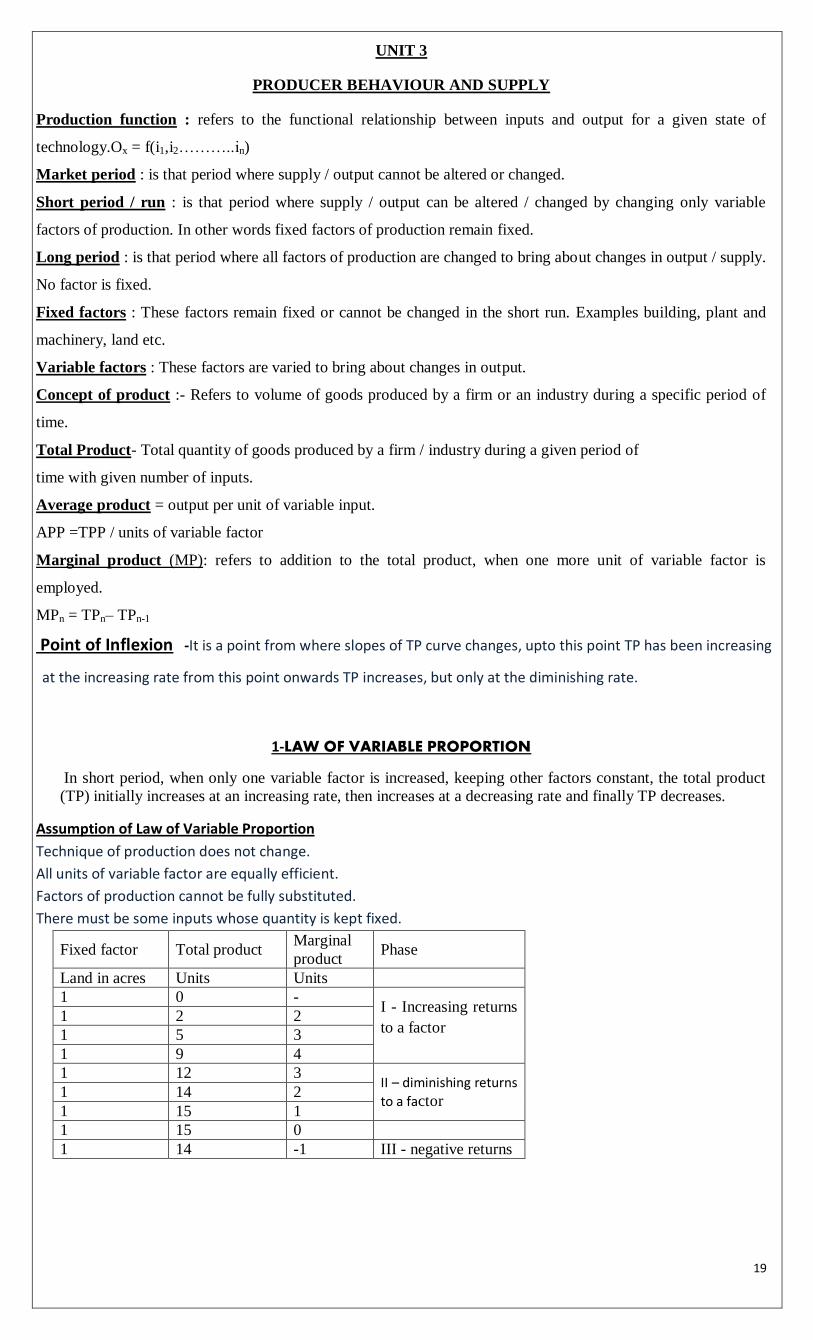
1-LAW OF VARIABLE PROPORTION
In short period, when only one variable factor is increased, keeping other factors constant, the total product
(TP) initially increases at an increasing rate, then increases at a decreasing rate and finally TP decreases.
Assumption of Law of Variable Proportion
Technique of production does not change.
All units of variable factor are equally efficient.
Factors of production cannot be fully substituted.
There must be some inputs whose quantity is kept fixed.
Fixed factor Total product Marginal
product Phase
Land in acres Units Units
1 0 - I - Increasing returns
to a factor 1 2 2
1 5 3
1 9 4
1 12 3 II – diminishing returns
to a factor 1 14 2
1 15 1
1 15 0
1 14 -1 III - negative returns
20
TPP
MP
P/T
PP
diagram
Units of variable factor
.
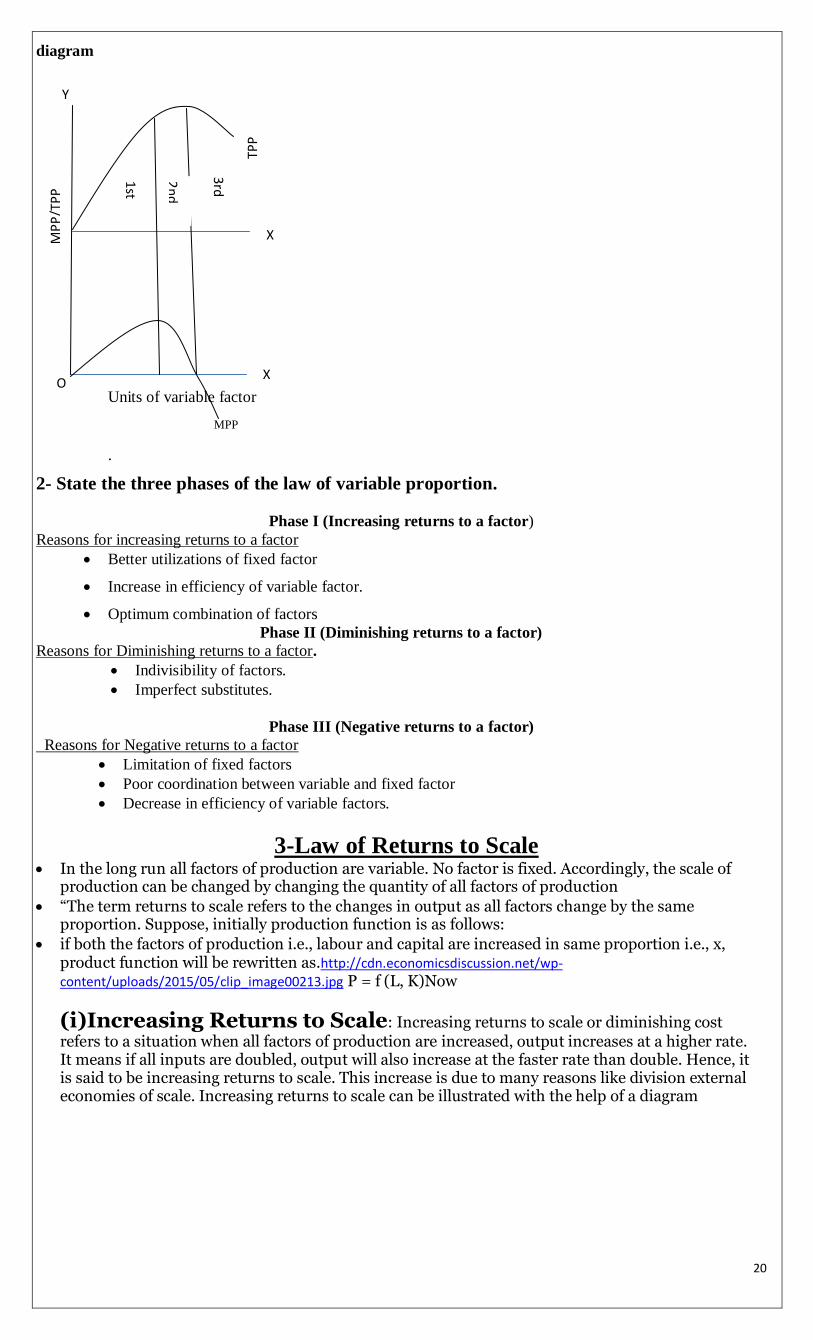
2- State the three phases of the law of variable proportion.
Phase I (Increasing returns to a factor)
Reasons for increasing returns to a factor
Better utilizations of fixed factor
Increase in efficiency of variable factor.
Optimum combination of factors
Phase II (Diminishing returns to a factor)
Reasons for Diminishing returns to a factor.
Indivisibility of factors.
Imperfect substitutes.
Phase III (Negative returns to a factor)
Reasons for Negative returns to a factor
Limitation of fixed factors
Poor coordination between variable and fixed factor
Decrease in efficiency of variable factors.
3-Law of Returns to Scale In the long run all factors of production are variable. No factor is fixed. Accordingly, the scale of
production can be changed by changing the quantity of all factors of production
“The term returns to scale refers to the changes in output as all factors change by the same proportion. Suppose, initially production function is as follows:
if both the factors of production i.e., labour and capital are increased in same proportion i.e., x, product function will be rewritten as.http://cdn.economicsdiscussion.net/wp-
content/uploads/2015/05/clip_image00213.jpg P = f (L, K)Now
(i)Increasing Returns to Scale: Increasing returns to scale or diminishing cost refers to a situation when all factors of production are increased, output increases at a higher rate. It means if all inputs are doubled, output will also increase at the faster rate than double. Hence, it is said to be increasing returns to scale. This increase is due to many reasons like division external economies of scale. Increasing returns to scale can be illustrated with the help of a diagram
MPP
X
X
O
Y
1st
2n
d
3rd
21
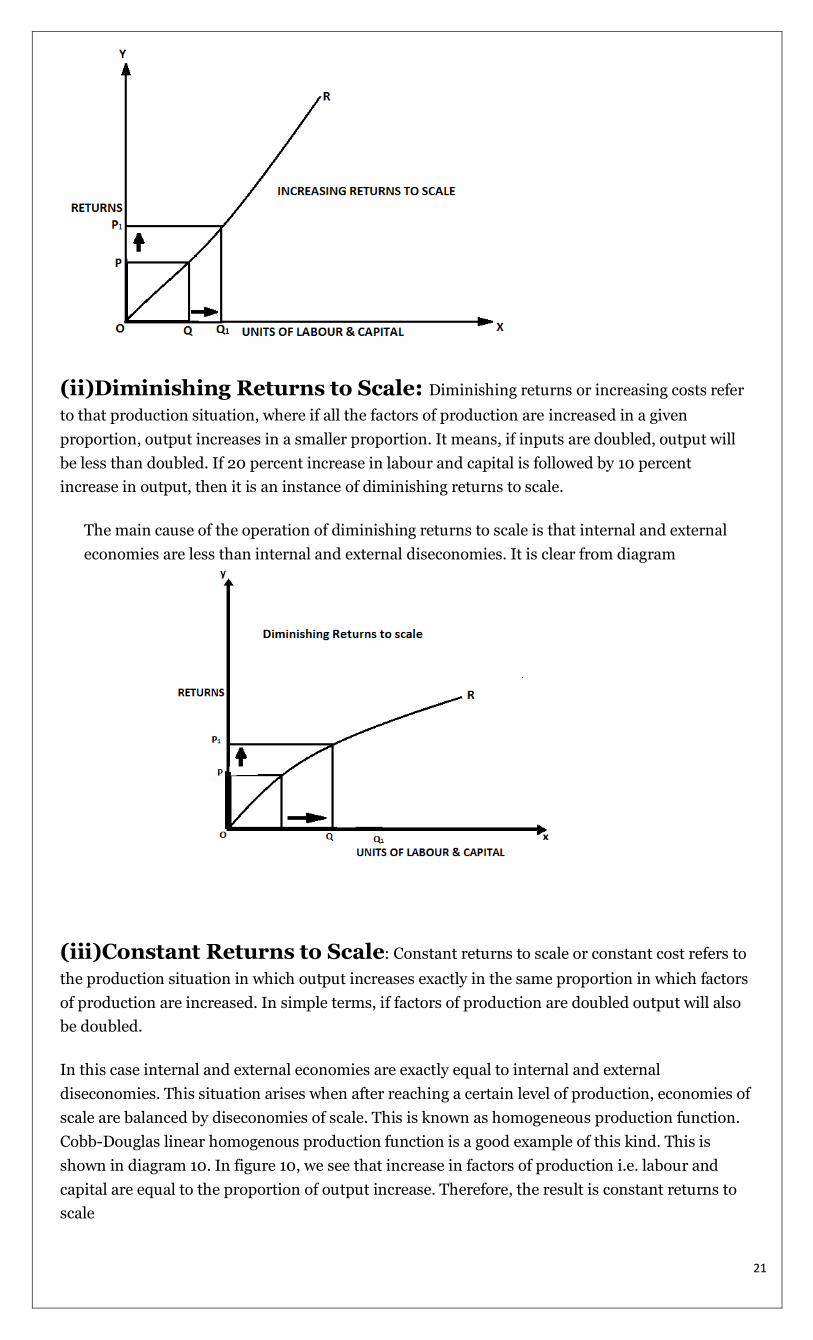
(ii)Diminishing Returns to Scale: Diminishing returns or increasing costs refer
to that production situation, where if all the factors of production are increased in a given
proportion, output increases in a smaller proportion. It means, if inputs are doubled, output will
be less than doubled. If 20 percent increase in labour and capital is followed by 10 percent
increase in output, then it is an instance of diminishing returns to scale.
The main cause of the operation of diminishing returns to scale is that internal and external
economies are less than internal and external diseconomies. It is clear from diagram
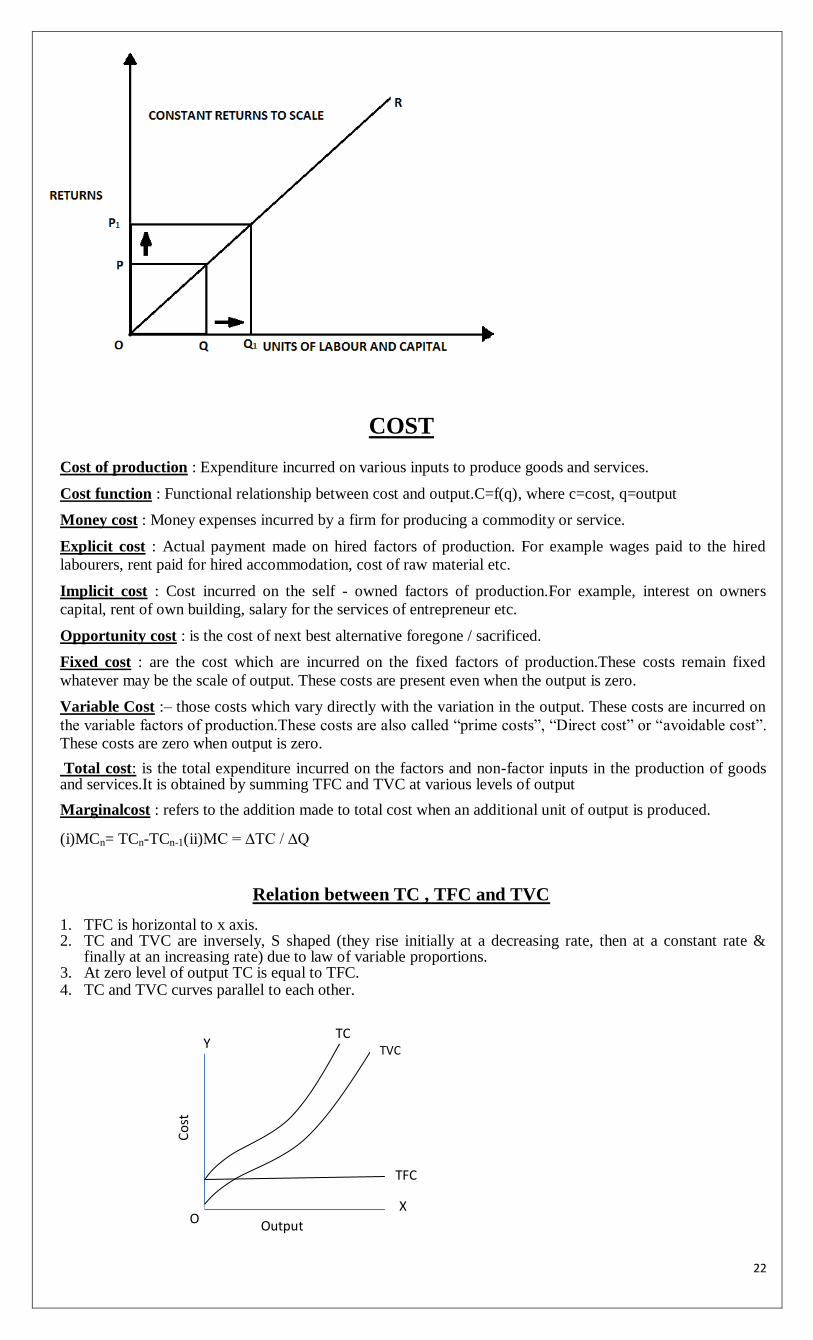
(iii)Constant Returns to Scale: Constant returns to scale or constant cost refers to
the production situation in which output increases exactly in the same proportion in which factors
of production are increased. In simple terms, if factors of production are doubled output will also
be doubled.
In this case internal and external economies are exactly equal to internal and external
diseconomies. This situation arises when after reaching a certain level of production, economies of
scale are balanced by diseconomies of scale. This is known as homogeneous production function.
Cobb-Douglas linear homogenous production function is a good example of this kind. This is
shown in diagram 10. In figure 10, we see that increase in factors of production i.e. labour and
capital are equal to the proportion of output increase. Therefore, the result is constant returns to
scale
22
COST
Cost of production : Expenditure incurred on various inputs to produce goods and services.
Cost function : Functional relationship between cost and output.C=f(q), where c=cost, q=output
Money cost : Money expenses incurred by a firm for producing a commodity or service.
Explicit cost : Actual payment made on hired factors of production. For example wages paid to the hired
labourers, rent paid for hired accommodation, cost of raw material etc.
Implicit cost : Cost incurred on the self - owned factors of production.For example, interest on owners
capital, rent of own building, salary for the services of entrepreneur etc.
Opportunity cost : is the cost of next best alternative foregone / sacrificed.
Fixed cost : are the cost which are incurred on the fixed factors of production.These costs remain fixed
whatever may be the scale of output. These costs are present even when the output is zero.
Variable Cost :– those costs which vary directly with the variation in the output. These costs are incurred on
the variable factors of production.These costs are also called “prime costs”, “Direct cost” or “avoidable cost”.
These costs are zero when output is zero.
Total cost: is the total expenditure incurred on the factors and non-factor inputs in the production of goods and services.It is obtained by summing TFC and TVC at various levels of output
Marginalcost : refers to the addition made to total cost when an additional unit of output is produced.
(i)MCn= TCn-TCn-1(ii)MC = ∆TC / ∆Q
Relation between TC , TFC and TVC
1. TFC is horizontal to x axis. 2. TC and TVC are inversely, S shaped (they rise initially at a decreasing rate, then at a constant rate &
finally at an increasing rate) due to law of variable proportions. 3. At zero level of output TC is equal to TFC. 4. TC and TVC curves parallel to each other.
Output
Co
st
X O
Y TVC TC
TFC
23
RELATIONSHIP BETWEEN AC,AVC&AFC
(a)Average cost-It is Total cost per unit of output. It is the sum of Average Fixed Cost & Average Variable Cost.
It curve is U shaped
AC=TC/Q
AC=AFC+AVC
(b) Average Fixed Cost- It refers to fixed cost per unit of output.TFC is never zero; it exists even when there is
no production as it is the payment to fixed factors like rent of land, salaries of permanent employees. So AFC
never touches X or Y axis.
( c) Average Variable Cost- It is the Total variable cost per unit of output. AVC curve is U shaped, due to law of
variable proportions.. It means that at first this curve falls and after reaching the minimum point it begins to rise.
Important formulae at a glance
1. TFC = TC – TVC or TFC=AFC x output or TFC = TC at 0 output.
2. TVC = TC – TFC or TVC = AVC x output or TVC =∑MC
3. TC = TVC + TFC or TC = AC x output or TC = ∑ MC + TFC
4. MCn=TCn – TCn-1 or MCn= TVCn – TVCn-1
5. AFC = TFC / Output or AFC = AC-AVC or ATC – AVC
6. AVC = TVC / Output or AVC = AC-AFC
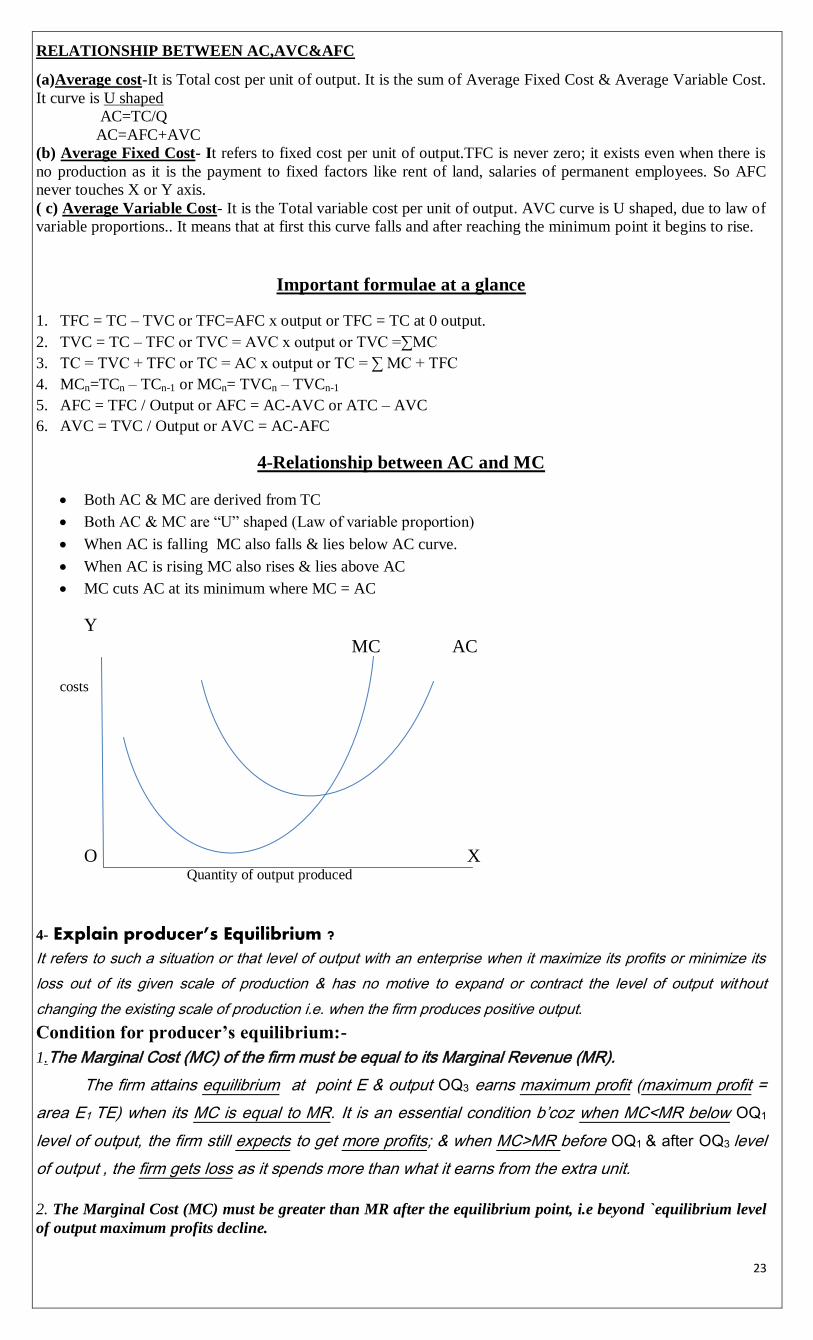
4-Relationship between AC and MC
Both AC & MC are derived from TC
Both AC & MC are “U” shaped (Law of variable proportion)
When AC is falling MC also falls & lies below AC curve.
When AC is rising MC also rises & lies above AC
MC cuts AC at its minimum where MC = AC
Y
MC AC
costs
O X Quantity of output produced
4- Explain producer’s Equilibrium ?
It refers to such a situation or that level of output with an enterprise when it maximize its profits or minimize its
loss out of its given scale of production & has no motive to expand or contract the level of output without
changing the existing scale of production i.e. when the firm produces positive output.
Condition for producer’s equilibrium:-
1.The Marginal Cost (MC) of the firm must be equal to its Marginal Revenue (MR).
The firm attains equilibrium at point E & output OQ3 earns maximum profit (maximum profit =
area E1 TE) when its MC is equal to MR. It is an essential condition b’coz when MC<MR below OQ1
level of output, the firm still expects to get more profits; & when MC>MR before OQ1 & after OQ3 level
of output , the firm gets loss as it spends more than what it earns from the extra unit.
2. The Marginal Cost (MC) must be greater than MR after the equilibrium point, i.e beyond `equilibrium level
of output maximum profits decline.
24
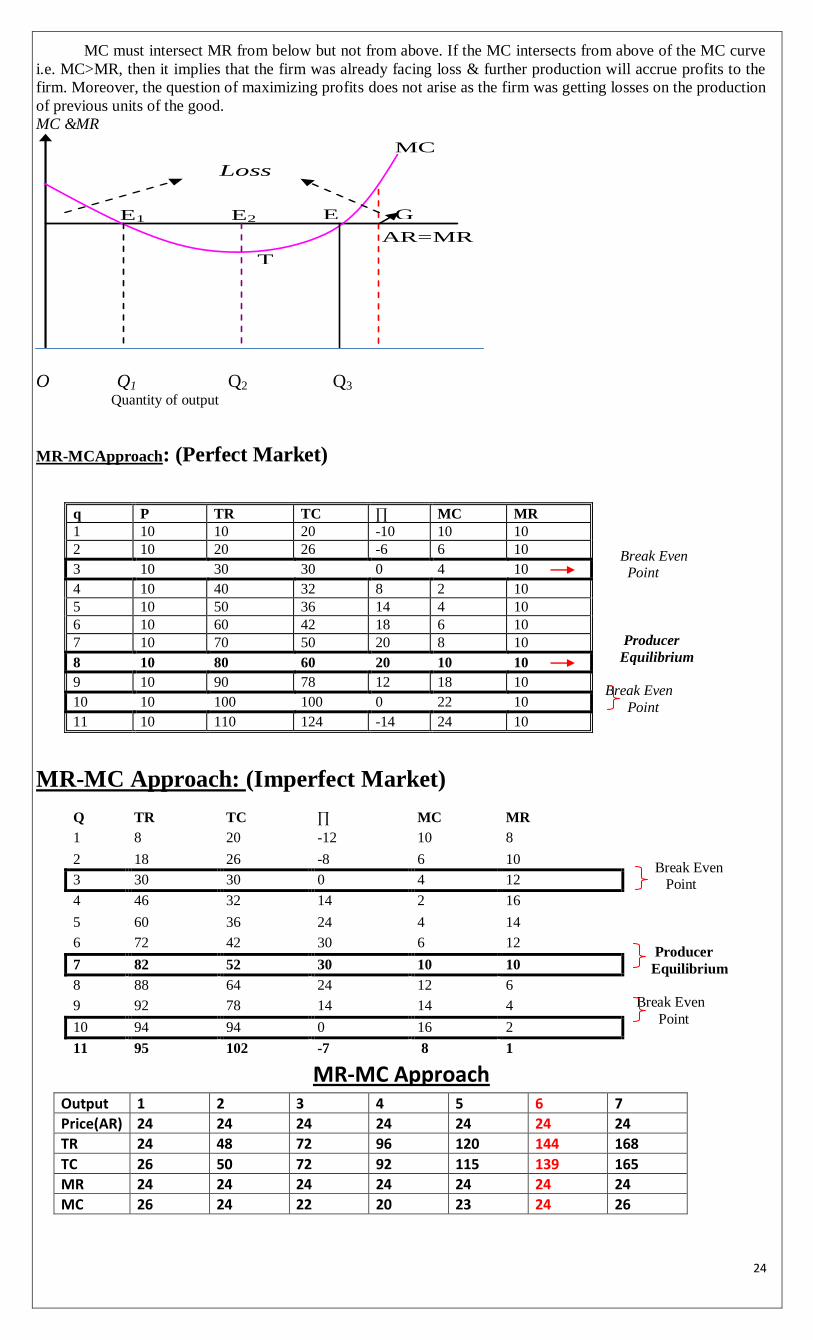
MC must intersect MR from below but not from above. If the MC intersects from above of the MC curve
i.e. MC>MR, then it implies that the firm was already facing loss & further production will accrue profits to the
firm. Moreover, the question of maximizing profits does not arise as the firm was getting losses on the production
of previous units of the good.
MC &MR
O Q1 Q2 Q3
Quantity of output
MR-MCApproach: (Perfect Market)
Break Even Point
Producer
Equilibrium
Break Even
Point
MR-MC Approach: (Imperfect Market)
Break Even Point
Producer
Equilibrium
Break Even
Point
MR-MC Approach
Output 1 2 3 4 5 6 7
Price(AR) 24 24 24 24 24 24 24
TR 24 48 72 96 120 144 168
TC 26 50 72 92 115 139 165
MR 24 24 24 24 24 24 24
MC 26 24 22 20 23 24 26
MC
AR=MR
E1 E E2
T
G
Loss
q P TR TC ∏ MC MR
1 10 10 20 -10 10 10
2 10 20 26 -6 6 10
3 10 30 30 0 4 10
4 10 40 32 8 2 10
5 10 50 36 14 4 10
6 10 60 42 18 6 10
7 10 70 50 20 8 10
8 10 80 60 20 10 10
9 10 90 78 12 18 10
10 10 100 100 0 22 10
11 10 110 124 -14 24 10
Q TR TC ∏ MC MR
1 8 20 -12 10 8
2 18 26 -8 6 10
3 30 30 0 4 12
4 46 32 14 2 16
5 60 36 24 4 14
6 72 42 30 6 12
7 82 52 30 10 10
8 88 64 24 12 6
9 92 78 14 14 4
10 94 94 0 16 2
11 95 102 -7 8 1
25
Revenue
Revenue:- Money received by a firm from the sale of a given output in the market.
Total Revenue: Total sale receipts or receipts from the sale of given output.
TR = Quantity sold × Price (or) output sold × price , AR x Q
Average Revenue: Revenue or Receipt received per unit of output sold.
o AR = TR / Output sold
.
Marginal Revenue: Additional revenue earned by the seller by selling an additional unit of output.
MRn = TR n - TR n-1
MR n = ∆ TR n / ∆ Q
TR = ∑ MR
Super Normal Profit- It is a situation in which P > AC or TR > TC or AR >AC .
Normal Profit- It is a situation in which P = AC or TR = TC.
Break – even Point- Break – even Point is defined as a situation when AR = AC. Under this situation, the firm
earns only normal profit.
Shut Down Point-shut down point occurs when firm is not able to cover its variable costs, incurring the loss of
fixed cost of production.
Shut down point
AR = AVC (P = AVC) or TR = TVC
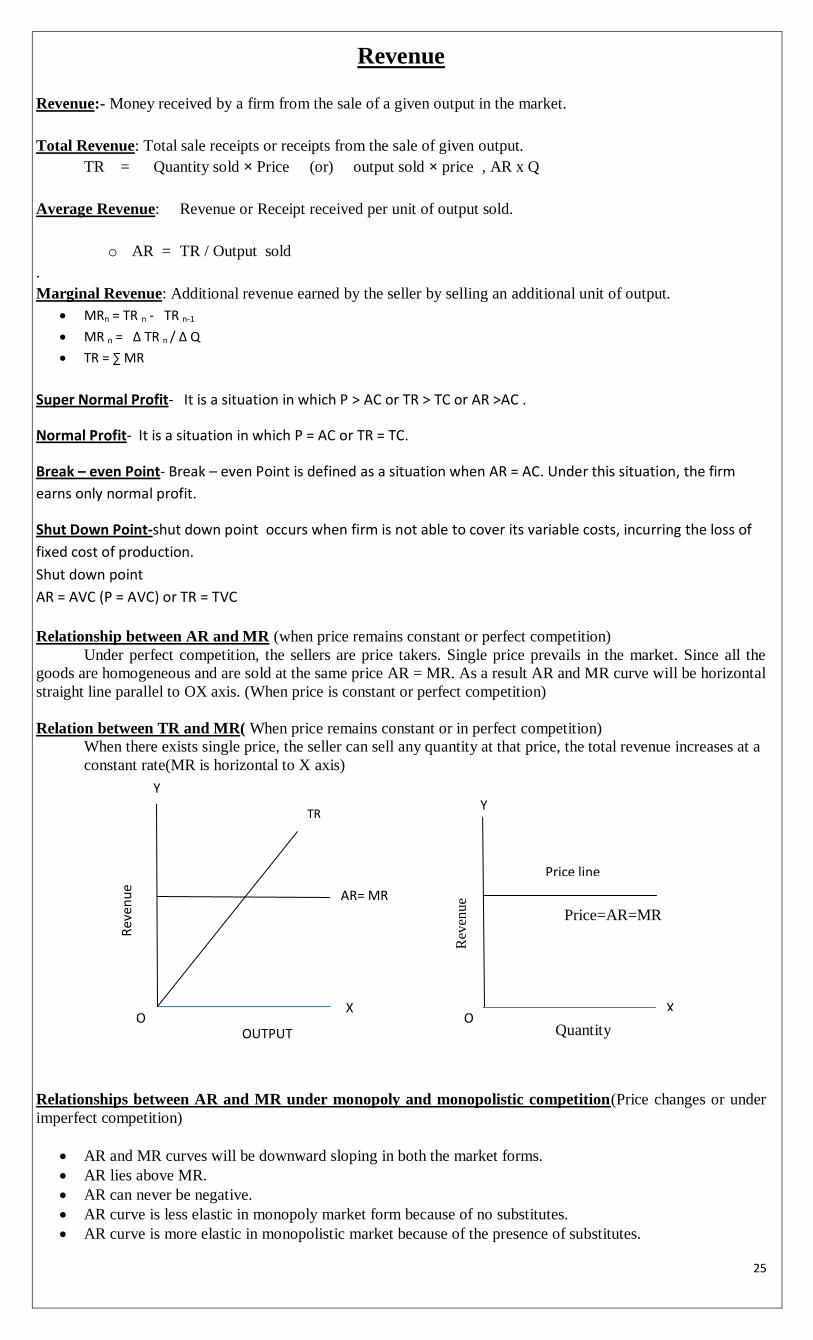
Relationship between AR and MR (when price remains constant or perfect competition)
Under perfect competition, the sellers are price takers. Single price prevails in the market. Since all the
goods are homogeneous and are sold at the same price AR = MR. As a result AR and MR curve will be horizontal
straight line parallel to OX axis. (When price is constant or perfect competition)
Relation between TR and MR( When price remains constant or in perfect competition)
When there exists single price, the seller can sell any quantity at that price, the total revenue increases at a
constant rate(MR is horizontal to X axis)
Relationships between AR and MR under monopoly and monopolistic competition(Price changes or under
imperfect competition)
AR and MR curves will be downward sloping in both the market forms.
AR lies above MR.
AR can never be negative.
AR curve is less elastic in monopoly market form because of no substitutes.
AR curve is more elastic in monopolistic market because of the presence of substitutes.
AR= MR
OUTPUT
Rev
enu
e
Price line
Rev
enue
Quantity
Price=AR=MR
Y Y
O O
TR
X X
26
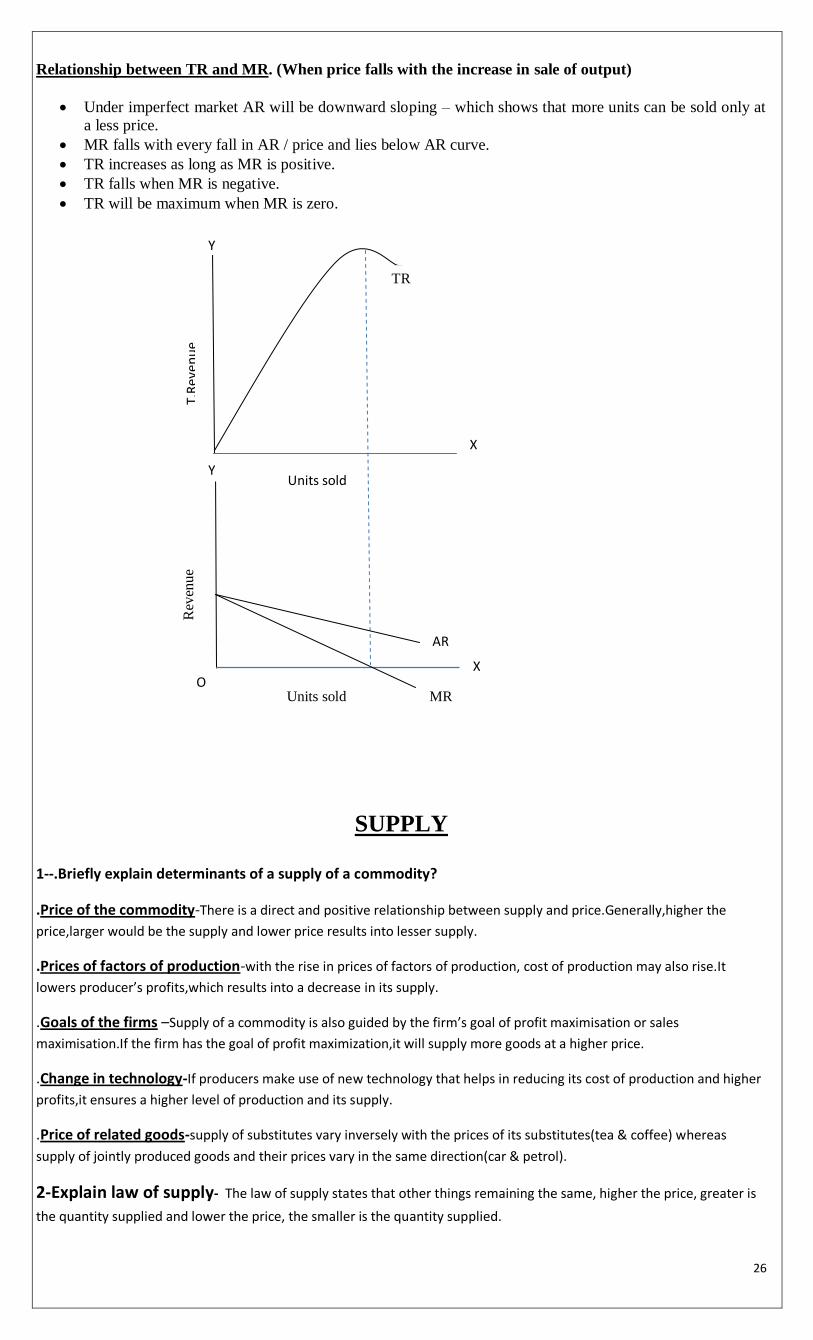
Relationship between TR and MR. (When price falls with the increase in sale of output)
Under imperfect market AR will be downward sloping – which shows that more units can be sold only at
a less price.
MR falls with every fall in AR / price and lies below AR curve.
TR increases as long as MR is positive.
TR falls when MR is negative.
TR will be maximum when MR is zero.
SUPPLY
1--.Briefly explain determinants of a supply of a commodity?
.Price of the commodity-There is a direct and positive relationship between supply and price.Generally,higher the
price,larger would be the supply and lower price results into lesser supply.
.Prices of factors of production-with the rise in prices of factors of production, cost of production may also rise.It
lowers producer’s profits,which results into a decrease in its supply.
.Goals of the firms –Supply of a commodity is also guided by the firm’s goal of profit maximisation or sales
maximisation.If the firm has the goal of profit maximization,it will supply more goods at a higher price.
.Change in technology-If producers make use of new technology that helps in reducing its cost of production and higher
profits,it ensures a higher level of production and its supply.
.Price of related goods-supply of substitutes vary inversely with the prices of its substitutes(tea & coffee) whereas
supply of jointly produced goods and their prices vary in the same direction(car & petrol).
2-Explain law of supply- The law of supply states that other things remaining the same, higher the price, greater is
the quantity supplied and lower the price, the smaller is the quantity supplied.
Units sold
T.R
even
ue
TR
Units sold
Rev
enu
e
MR
X
X
Y
O
AR
Y
27
Y S
2 B
P 1
O 2 4 x
Y S
2 A
P 1
O 2 4 x
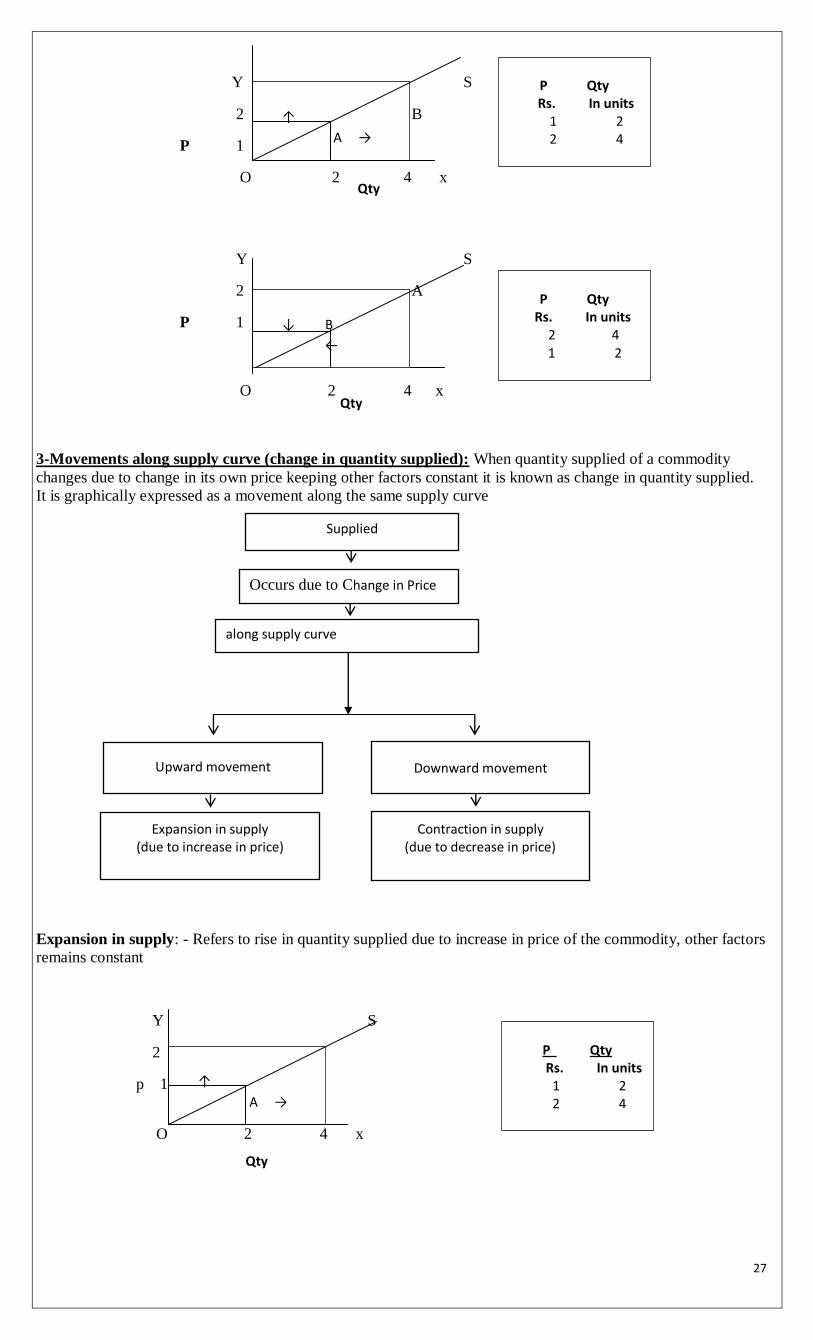
3-Movements along supply curve (change in quantity supplied): When quantity supplied of a commodity
changes due to change in its own price keeping other factors constant it is known as change in quantity supplied.
It is graphically expressed as a movement along the same supply curve
Expansion in supply: - Refers to rise in quantity supplied due to increase in price of the commodity, other factors
remains constant
Y S
2 B
p 1
O 2 4 x
Qty
Qty
Qty
↑
A →
↓ B
←
P Qty Rs. In units
1 2 2 4
P Qty Rs. In units
2 4 1 2
↑
A →
P Qty Rs. In units
1 2 2 4
Supplied
Occurs due to Change in Price
along supply curve
Expansion in supply (due to increase in price)
Contraction in supply (due to decrease in price)
Upward movement Downward movement
28
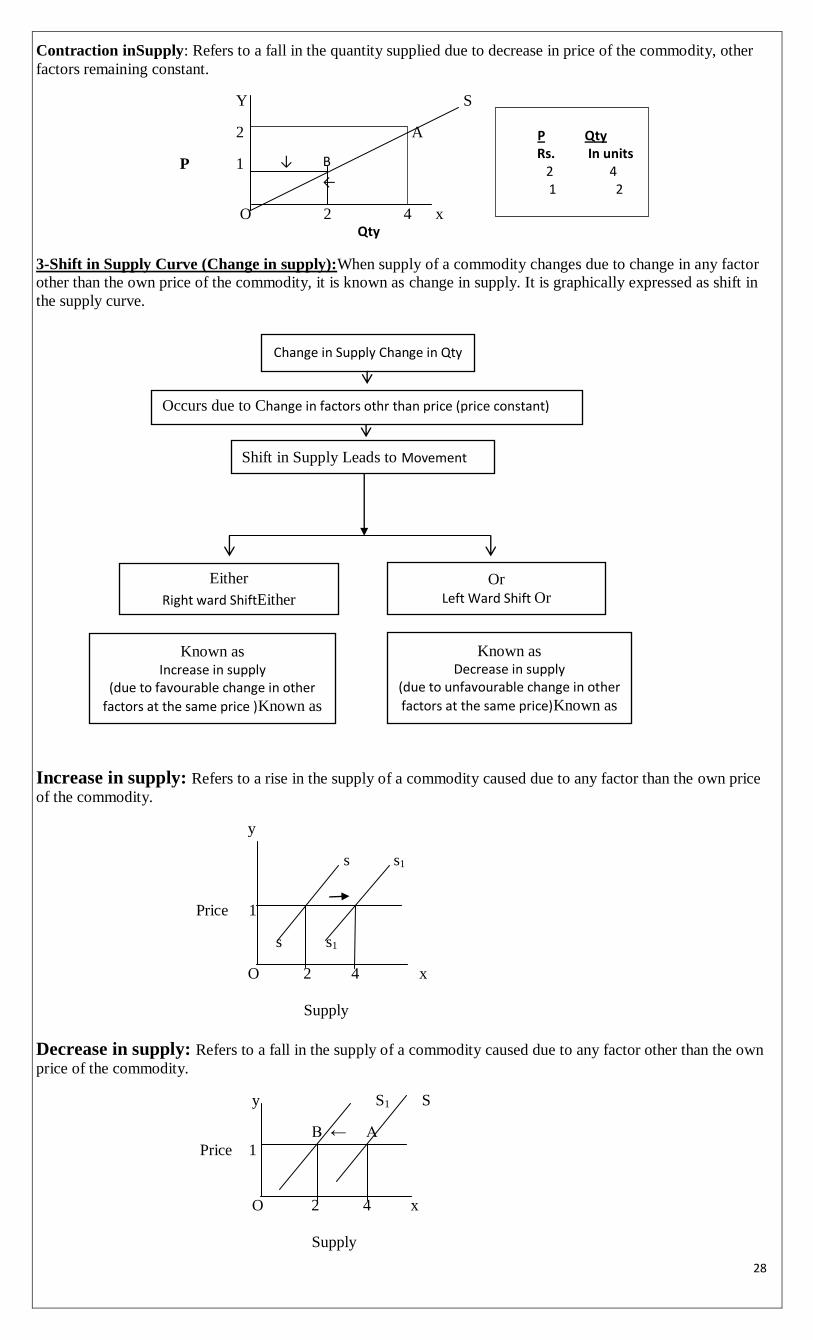
Contraction inSupply: Refers to a fall in the quantity supplied due to decrease in price of the commodity, other
factors remaining constant.
Y S
2 A
P 1
O 2 4 x
3-Shift in Supply Curve (Change in supply):When supply of a commodity changes due to change in any factor
other than the own price of the commodity, it is known as change in supply. It is graphically expressed as shift in
the supply curve.
Increase in supply: Refers to a rise in the supply of a commodity caused due to any factor than the own price
of the commodity.
y
s s1
Price 1
s s1
O 2 4 x
Supply
Decrease in supply: Refers to a fall in the supply of a commodity caused due to any factor other than the own
price of the commodity.
y S1 S
B ← A
Price 1
O 2 4 x
Supply
↓ B
←
P Qty Rs. In units
2 4 1 2
Qty
Change in Supply Change in Qty
Occurs due to Change in factors othr than price (price constant)
Shift in Supply Leads to Movement
Known as Increase in supply
(due to favourable change in other
factors at the same price )Known as
Known as Decrease in supply
(due to unfavourable change in other
factors at the same price)Known as
Either
Right ward ShiftEither
Or
Left Ward Shift Or
29
4-Methods of Measuring Elasticity of supply
1. Percentage method or Proportionate method.
Es = % Change in QS or
% change in price
Es = Proportionate change in Supply
Proportionate change in Price
2- 𝐸𝑠 =P
Q 𝑋
ΔQ
ΔP
3-Geometric method
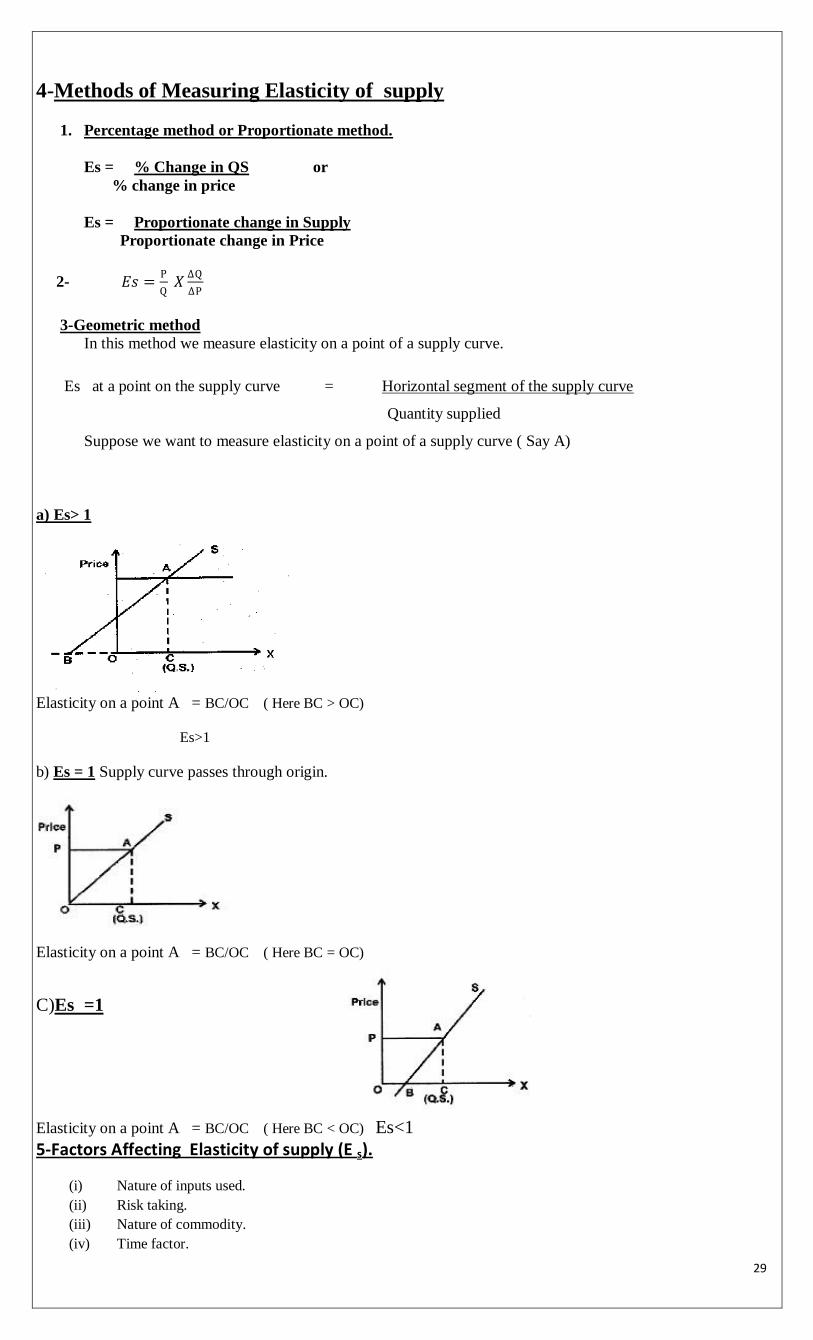
In this method we measure elasticity on a point of a supply curve.
Es at a point on the supply curve = Horizontal segment of the supply curve
Quantity supplied
Suppose we want to measure elasticity on a point of a supply curve ( Say A)
a) Es> 1
Elasticity on a point A = BC/OC ( Here BC > OC)
Es>1
b) Es = 1 Supply curve passes through origin.
Elasticity on a point A = BC/OC ( Here BC = OC)
C)Es =1
Elasticity on a point A = BC/OC ( Here BC < OC) Es<1 5-Factors Affecting Elasticity of supply (E s).
(i) Nature of inputs used.
(ii) Risk taking.
(iii) Nature of commodity.
(iv) Time factor.
30
(v) Technique of production.
(vi) Cost of production
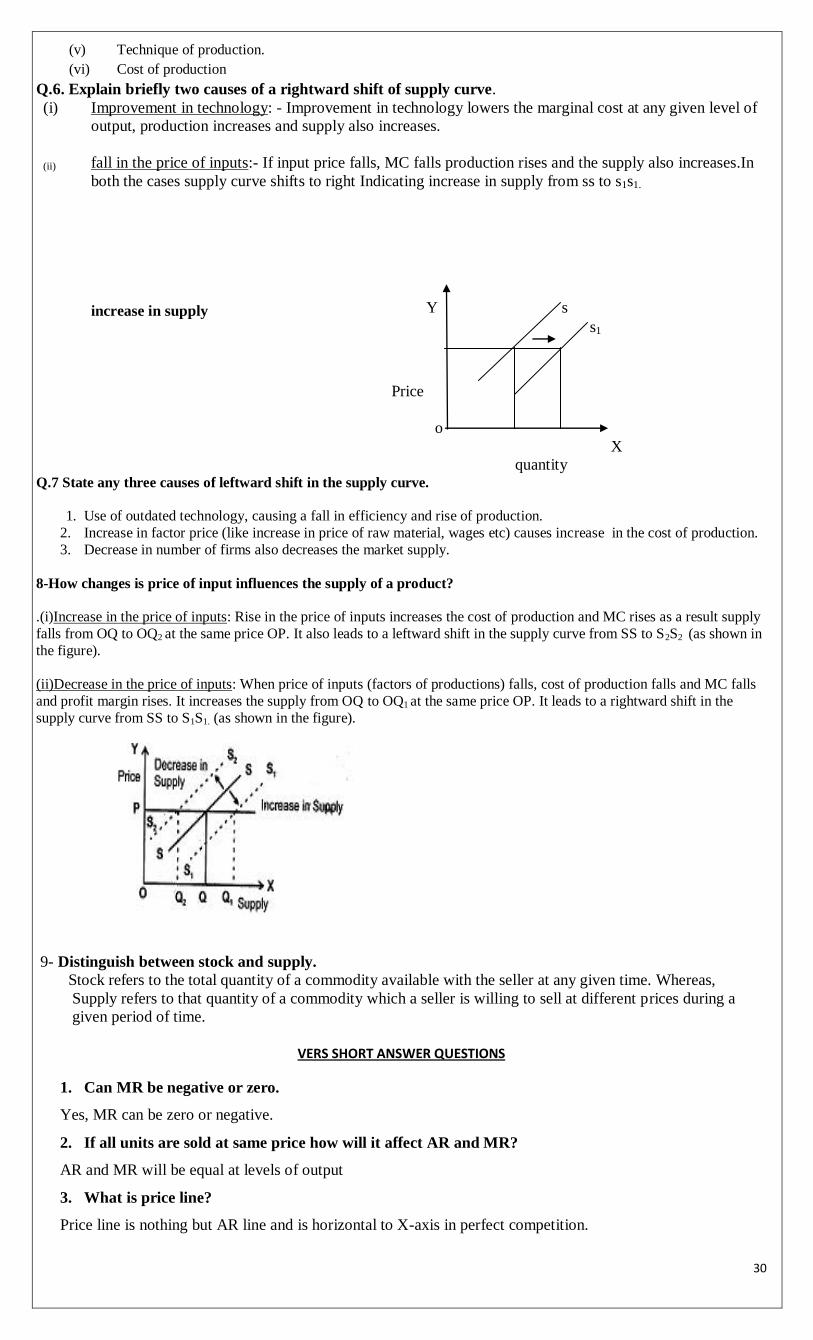
Q.6. Explain briefly two causes of a rightward shift of supply curve.
(i) Improvement in technology: - Improvement in technology lowers the marginal cost at any given level of
output, production increases and supply also increases.
(ii) fall in the price of inputs:- If input price falls, MC falls production rises and the supply also increases.In
both the cases supply curve shifts to right Indicating increase in supply from ss to s1s1.
increase in supply Y s
s1
Price
o
X
quantity Q.7 State any three causes of leftward shift in the supply curve.
1. Use of outdated technology, causing a fall in efficiency and rise of production.
2. Increase in factor price (like increase in price of raw material, wages etc) causes increase in the cost of production.
3. Decrease in number of firms also decreases the market supply.
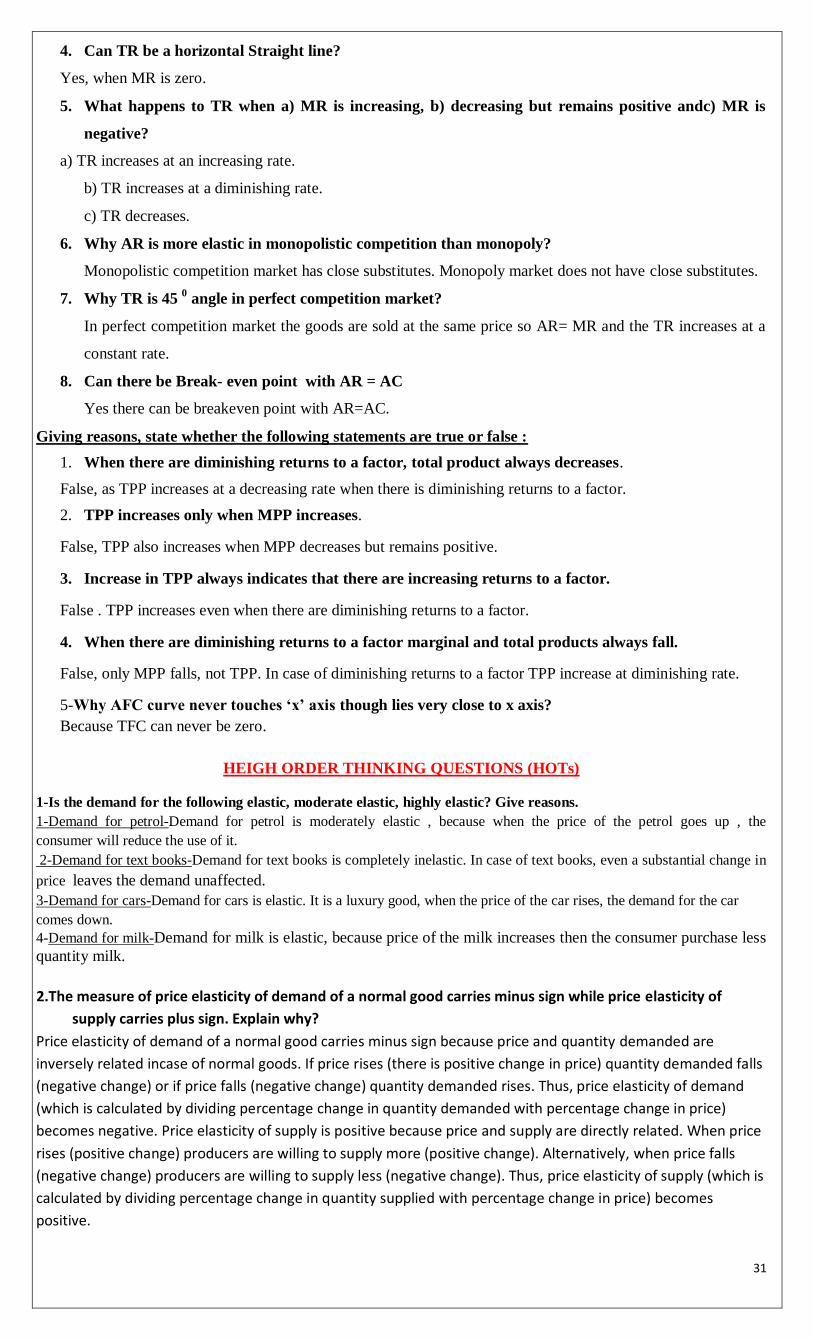
8-How changes is price of input influences the supply of a product?
.(i)Increase in the price of inputs: Rise in the price of inputs increases the cost of production and MC rises as a result supply
falls from OQ to OQ2 at the same price OP. It also leads to a leftward shift in the supply curve from SS to S2S2 (as shown in
the figure).
(ii)Decrease in the price of inputs: When price of inputs (factors of productions) falls, cost of production falls and MC falls
and profit margin rises. It increases the supply from OQ to OQ1 at the same price OP. It leads to a rightward shift in the
supply curve from SS to S1S1. (as shown in the figure).
9- Distinguish between stock and supply.
Stock refers to the total quantity of a commodity available with the seller at any given time. Whereas,
Supply refers to that quantity of a commodity which a seller is willing to sell at different prices during a
given period of time.
VERS SHORT ANSWER QUESTIONS
1. Can MR be negative or zero.
Yes, MR can be zero or negative.
2. If all units are sold at same price how will it affect AR and MR?
AR and MR will be equal at levels of output
3. What is price line?
Price line is nothing but AR line and is horizontal to X-axis in perfect competition.
31
4. Can TR be a horizontal Straight line?
Yes, when MR is zero.
5. What happens to TR when a) MR is increasing, b) decreasing but remains positive andc) MR is
negative?
a) TR increases at an increasing rate.
b) TR increases at a diminishing rate.
c) TR decreases.
6. Why AR is more elastic in monopolistic competition than monopoly?
Monopolistic competition market has close substitutes. Monopoly market does not have close substitutes.
7. Why TR is 45 0 angle in perfect competition market?
In perfect competition market the goods are sold at the same price so AR= MR and the TR increases at a
constant rate.
8. Can there be Break- even point with AR = AC
Yes there can be breakeven point with AR=AC.
Giving reasons, state whether the following statements are true or false :
1. When there are diminishing returns to a factor, total product always decreases.
False, as TPP increases at a decreasing rate when there is diminishing returns to a factor.
2. TPP increases only when MPP increases.
False, TPP also increases when MPP decreases but remains positive.
3. Increase in TPP always indicates that there are increasing returns to a factor.
False . TPP increases even when there are diminishing returns to a factor.
4. When there are diminishing returns to a factor marginal and total products always fall.
False, only MPP falls, not TPP. In case of diminishing returns to a factor TPP increase at diminishing rate.
5-Why AFC curve never touches ‘x’ axis though lies very close to x axis?
Because TFC can never be zero.
HEIGH ORDER THINKING QUESTIONS (HOTs)
1-Is the demand for the following elastic, moderate elastic, highly elastic? Give reasons.
1-Demand for petrol-Demand for petrol is moderately elastic , because when the price of the petrol goes up , the
consumer will reduce the use of it.
2-Demand for text books-Demand for text books is completely inelastic. In case of text books, even a substantial change in
price leaves the demand unaffected.
3-Demand for cars-Demand for cars is elastic. It is a luxury good, when the price of the car rises, the demand for the car
comes down.
4-Demand for milk-Demand for milk is elastic, because price of the milk increases then the consumer purchase less
quantity milk.
2.The measure of price elasticity of demand of a normal good carries minus sign while price elasticity of
supply carries plus sign. Explain why?
Price elasticity of demand of a normal good carries minus sign because price and quantity demanded are
inversely related incase of normal goods. If price rises (there is positive change in price) quantity demanded falls
(negative change) or if price falls (negative change) quantity demanded rises. Thus, price elasticity of demand
(which is calculated by dividing percentage change in quantity demanded with percentage change in price)
becomes negative. Price elasticity of supply is positive because price and supply are directly related. When price
rises (positive change) producers are willing to supply more (positive change). Alternatively, when price falls
(negative change) producers are willing to supply less (negative change). Thus, price elasticity of supply (which is
calculated by dividing percentage change in quantity supplied with percentage change in price) becomes
positive.
32
3-A consumer consumes only two goods X and Y both priced at 3 per unit. If the consumer chooses a
combination of these two goods with Marginal Rate of Substitution equal to 3, is the consumer in
equilibrium? Give reasons. What will a rational consumer do in this situation?Explain.
According to indifference curve approach, consumers equilibrium is determined if the following two conditions
are satisfied.
MRSxy= MRE = Px/ Py
MRSxy is declining.
MRSxy is the rate at which the consumer is willing to sacrifice Y to obtain one more unit of X.MRE is the rate at
which market requires a consumer to sacrifice units of Y to buy one more unit of X which is equal to ratio of
prices of X and Y good. MRE = Px/Py
In the given question MRSxy = 3 and Px/ Py = 3/3 = 1
MRSxy>Px/ Py
If MRSxy>Px/ Pyit implies that the consumer is willing to sacrifice more unit of Y than what market requires. This
induces the consumer to buy more of X and less of Y. When he buys more of x , utility derived from X falls and
he is willing to sacrifice less of Y. Thus MRSxy starts declining. He continues to consume more of X, till MRSxy =
MRE = Px/Py
4-.Explain the three properties of the indifference curves.
1-The indifference curve slopes downwards from left to right i.e. It is negatively sloped. This is because when
consumer increases consumption of X, he must reduce consumption of Y to keep the utility level unchanged. [IC
doesn’t touch either axis because the assumption of IC curve is that he consumes both the goods.
2-The indifference curve is strictly convex to the origin. This is because MRS declines as he moves downwards
along the indifference curve. This rate keeps on decreasing due to law of diminishing marginal utility. As a
consumer consumes more of X, the additional utility derived from every successive unit keeps on declining He is
willing to sacrifice less units of Y to obtain additional units of X as shown in the schedule.
3-Higher indifference curve represents higher utility. The higher indifference curve (I3) has higher utility (I2 or
I1). This is based on the assumption of ‘monotonic preferences’. As a consumer moves to higher indifference
curves, he is able to have more of both the goods. For eg. At point A, he can have OX and OY, but at point B, he
can have more of both X and Y i.e. OX2 and OY2. Thus he prefers to be on I2 than I1. Since, as consumption
increases, his utility also increases We conclude that higher indifference curve has higher utility.
4-In represent the same level of satisfaction, they cannot intersect each other. In the diagram, point A and B on
IC1 give the same level of satisfaction. difference curve can never intersect each other.
UNIT – IV
FORMS OF MARKET AND PRICE DETERMINATION
MARKET : Market is a mechanism in which buyers and sellers come into contact for the purchase and sale of
goods and services.
Market structure: refers to number of firms operating in an industry, nature of competition between them and
the nature of product.
Equilibrium: It means a position of rest, there is no tendency to change.
Market equilibrium: It means equality between quantity demanded and quantity Supplied of a commodity in the
market.
Equilibrium price: This is the price at which market demand of a commodity is exactly equal to the market
supply.
Market demand: It refers to the sum total demand for a commodity by all buyers in the market.
Market supply: It refers to supply of a commodity by all the firms in the market
selling cost- Cost incurred by a firm for the promotion of sale is known as selling cost.
33
product differentiation- It means close substitutes offered by different producers to show their output differ
from other output available in the market. Differentiation can be in color, size packing, brand name etc to attract
buyers.
patent rights-patent rights is an exclusive right or license granted to a company to produce a particular output
under a specific technology.
price discrimination- It refers to charging of different prices from different consumers for
different units of the same product.
Normal profit- Normal profit is the minimum amount of profit which is required to keep an entrepreneur in
production in the long run.
Break-even price-In a perfectly competitive market, break- even price is the price at which a firm earn normal
profit (Price=AC). In the long run, Break- even price is that price where P=AR=MC
Viable Industry- An industry is said to be viable in condition if corresponding to the minimum price, there is
some demand in the market. In such industries, demand and supply curve will intersect.
Non-Viable Industry- A non- viable industry is one which will not produce the product in an economy. E.g.,
commercial aircrafts is a non- viable industry in India. In this case, demand and supply curve will not intersect.
Control Price- It refers to the market price below the equilibrium price.
Support Price- It refers to the market price above the equilibrium price.
Black Marketing- It is a situation in which the controlled commodity is sold at a price higher than the price fixed
by the government illegally under the desk.
Market Price- Market price is the price that exists in the market at a particular point of time, no matter, forces
of supply and demand have adjusted themselves or not.
Normal Price- Normal price is the price that is expected to exist when the forces of supply and demand have
fully adjusted themselves.
Collusive oligopoly is one in which the firm cooperate with each other in deciding price and output.
Non collusive oligopoly is one in which firms compete with each other.
Few firms: There are few sellers of the commodity and each seller sells a substantial portion of the output of the
industry. The number of firm is so small that each seller knows that he can influence the price by his own action
and that he can provoke rival firms to react.
Non price competition: The firms are afraid of competition through lowering the price because it may start price
war. Therefore they complete through the non price factors like advertising, after sales service etc.
Price rigidity- is the price of the product fixed after deliberations and negotiations by the oligopolistic firms, to
which they generally stick with a view to avoid any sort of price war.
Price ceiling '-Price ceiling' is the maximum price that sellers can legally charge for a produce service
Price floor’ -Price floor’ is the minimum price fixed by the government at which sellers can legally sell
their product.
Types of market on the basis of competition
a) Perfect competition.
b) Monopoly.
c) Monopolistic Competition.
d) Oligopoly.
a) Perfect competition : refers to a market situation in which there are large number of buyers and sellers.
Firms sell homogeneous products at a uniform price.
b) Monopoly market : Monopoly is a market situation dominated by a single seller who has full control
over the price.
c) Monopolistic competition: It refers to a market situation in which there are many firms sell closely
related but differentiated products.
d) Oligopoly is a market structure in which there are few sellers of a commodity and large number of buyers.
e) perfect oligopoly- It refers to the type of oligopoly in which the firms are producing homogenous products like-
copper, iron and steel etc.
f) Duopoly:- refers to a market situation where there are only two sellers/producers selling a commodity
34
Features of perfect competition:
1. Very large number of buyers and sellers.
2. Homogeneous product.
3. Free entry and exit of firms.
4. Perfect knowledge.
5. Perfect mobility of factors of production.
6. Absence of transportation cost.
7. Absence of selling cost.
Features of monopoly:
1. Single seller of a commodity.
2. Absence of close substitute of the product.
3. Difficulty of entry of a new firm.
4. Negatively sloped demand curve.
5. Full control over price.
6. Price discrimination exists
7. Existence of abnormal profit.
Features of monopolistic competition
1. Large number of buyers and sellers but less than perfect competition.
2. Product differentiation.
3. Freedom of entry and exit.
4. Selling cost.
5. Lack of perfect knowledge.
6. High transportation cost.
7. Partial control over price.
Main features of Oligopoly.
1. Few dominant firms.
2. Mutual interdependence.
3. Barrier to entry.
4. Homogeneous or differentiated product.
5. Price rigidity.
Short Answer Questions: (3 / 4 Marks)
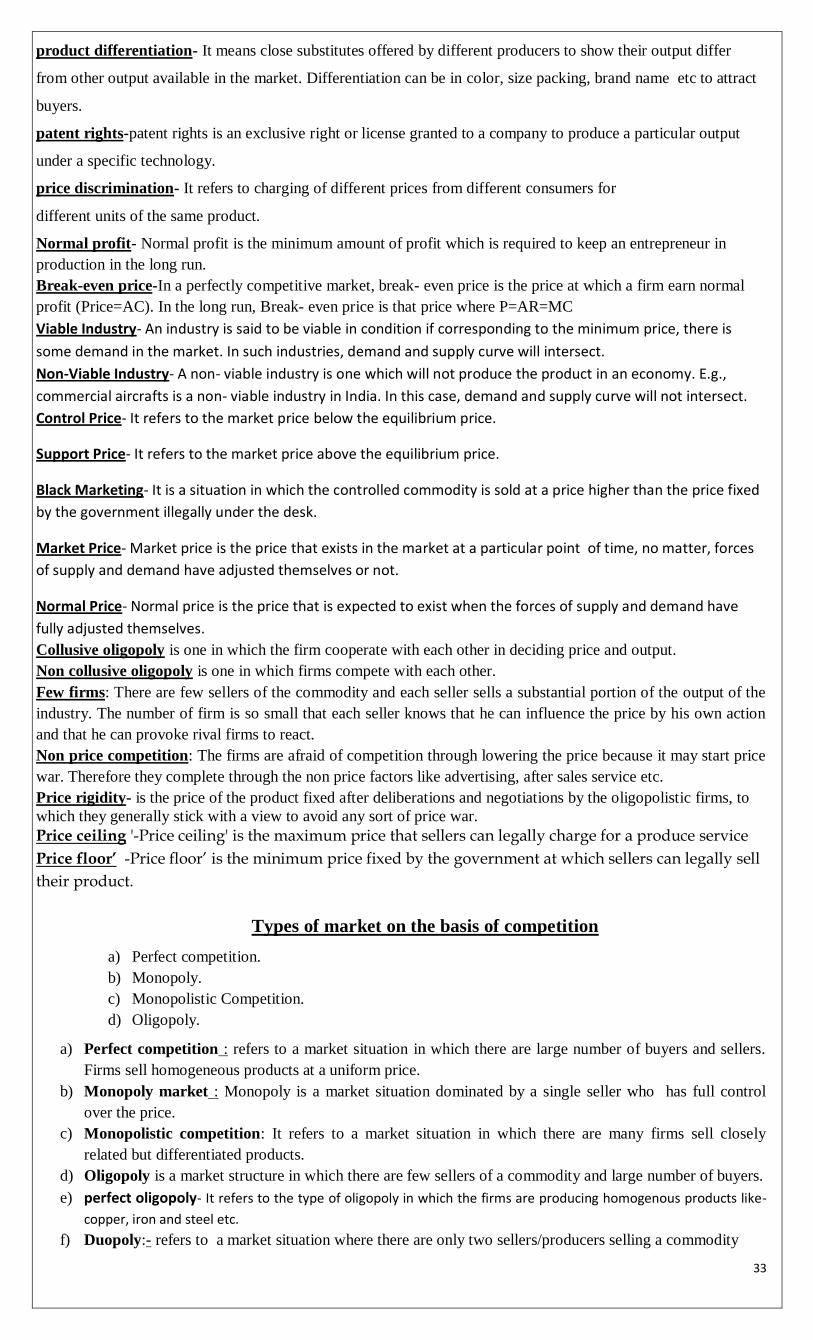
1-Explain briefly why a firm under perfect competition is a price taker not a price maker?
A firm under perfect competition is a price taker not a price maker because the price is determined by the market
forces of demand of supply. This price is known as equilibrium price. All the firms in the industry have to sell
their outputs at this equilibrium price. The reason is that, number of firms under perfect competition is so large.
So no firm can influence the price by its supply. All firms produce homogeneous product.
Industry
Firm
Pri
ce D
D
S
S
E
P P AR/MR
y y
x
O Output
X Q O
Demand & Supp.
35
2-Distinguish between monopoly and perfect competition.
Perfect Competition Monopoly
Very large number of buyers and sellers. Single seller of the product.
Products are homogenous Product has no close substitute
Firm is the price taker and not a maker Firm is price maker not price taker
Price is uniform in the market ie price =AC Due to price discrimination price is
not uniform.
Free entry and exit of firms. Very difficult entry of new firms.
3-What are the reasons which give emergence to the monopoly market?
i) Patent Rights: Patent rights are the authority given by the government to a particular firm to
produce a particular product for a specific time period.
ii) Formation of Cartel: Cartel refers to a collective decision taken by a group of firms to avoid
outside competition and securing monopoly right.
iii) Government licensing: Government provides the license to a particular firm to produce a
particular commodity exclusively.
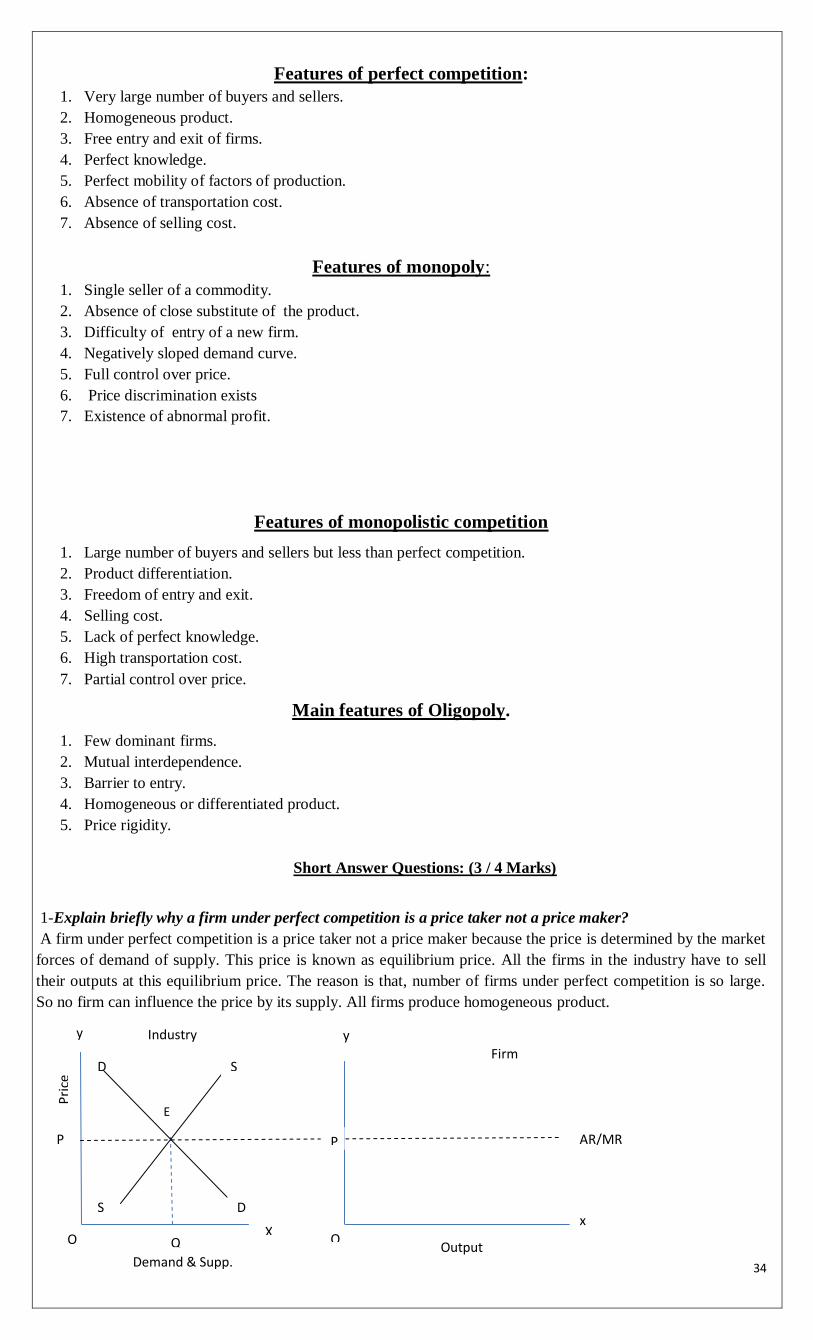
4-Explain the process of price determination under perfect competition with the help of schedule and a
diagram.
Equilibrium price is that price which is determined by market forces of demand and supply. At this price both
demand and supply are equal to each other. Diagrammatically it is determined at the point where demand
curve and supply curve intersect each other. At this point price is known as equilibrium price and quantity is
known as equilibrium quantity.
Assumptions of Equilibrium.
(i) Demand curve should always have a negative slope.
(ii) Supply curve should have a positive slope.
(iii) If demand increases at faster rate than the supply, the price will increase.
(iv) If supply increases at faster rate than the demand, the price will fall.
D S
E
S D
0 2 4 6 8
Price (Rs.) M.D (Units) M.S (Units)
1 10 2
2 8 4
3 6 6
4 4 8
5 2 10
1
2
3
Pri
ce
4
Mkt. Demand & Supply
36
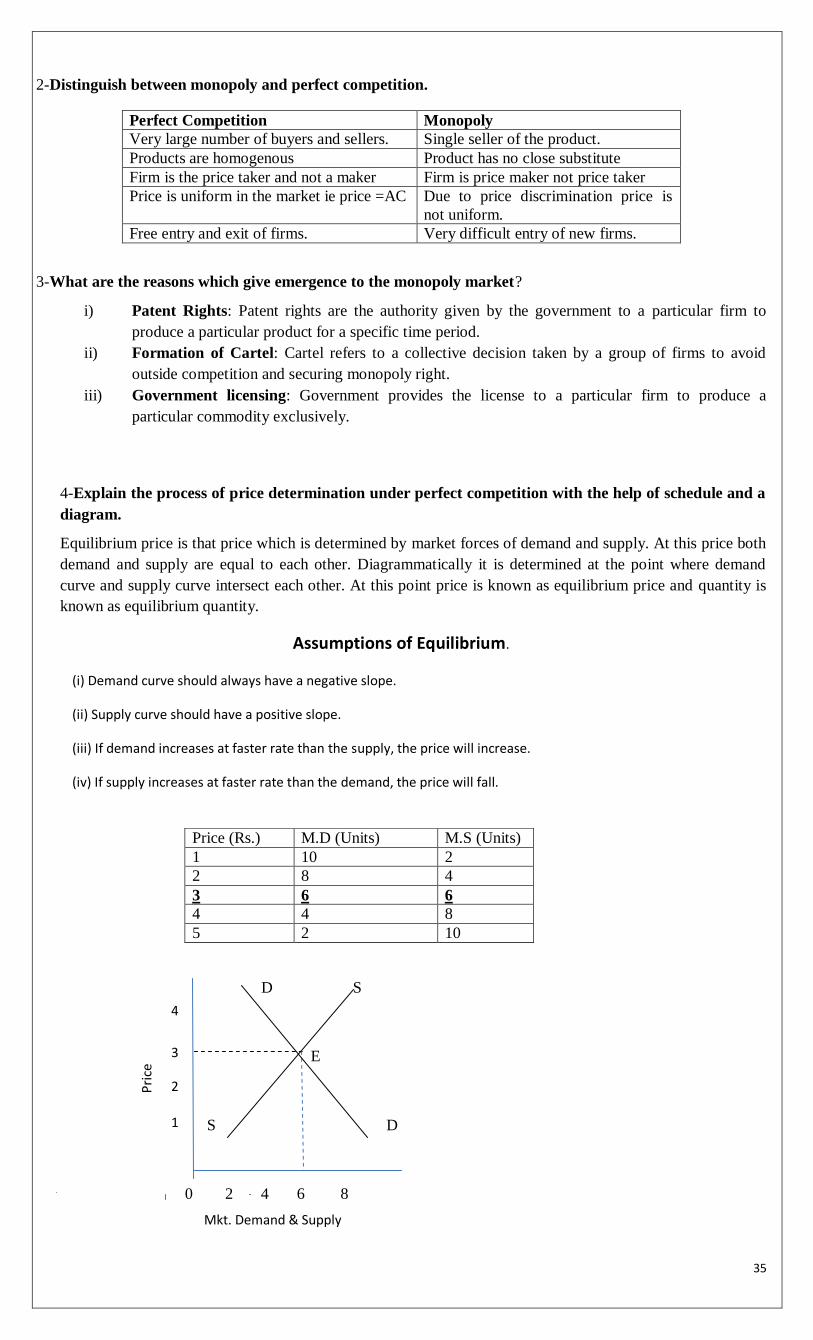
5-When will equilibrium price not change even if demand and supply increase?
When proportionate increase in demand is just equal to proportionate increase in supply. Equilibrium price
will not change. It can be shown in the following diagrams.
In the above diagram increase in demand is just equal to increase in supply. Demand curve shift from D to D1 and supply curve shift
from S to S1 which intersect at point E. Thus equilibrium price remain unchanged at OP though equilibrium quantity increased from
OQ to OQ1.
6-How does increase in price of substitute goods in consumption affect the equilibrium price of a good?
Explain with a diagram.
An increase in price of substitute goods (coke) will cause increase in demand for its related goods (Pepsi) .
The demand curve for Pepsi will shift to the right side. The supply curve of Pepsi remains the same. It will
lead to an increase in equilibrium price of Pepsi and increase in quantity also.
Result: Price increases
7-How does the equilibrium price of a normal commodity change when income of its buyers falls? Explain the chain effects. When income falls demand falls Supply remaining unchanged .There is excess supply at a given price This leads to competition among sellers to reduce the price. As a result demand starts rising and supply starts falling. These changes continue till a new equilibrium price is established where demand equal supply. Equilibrium price falls.
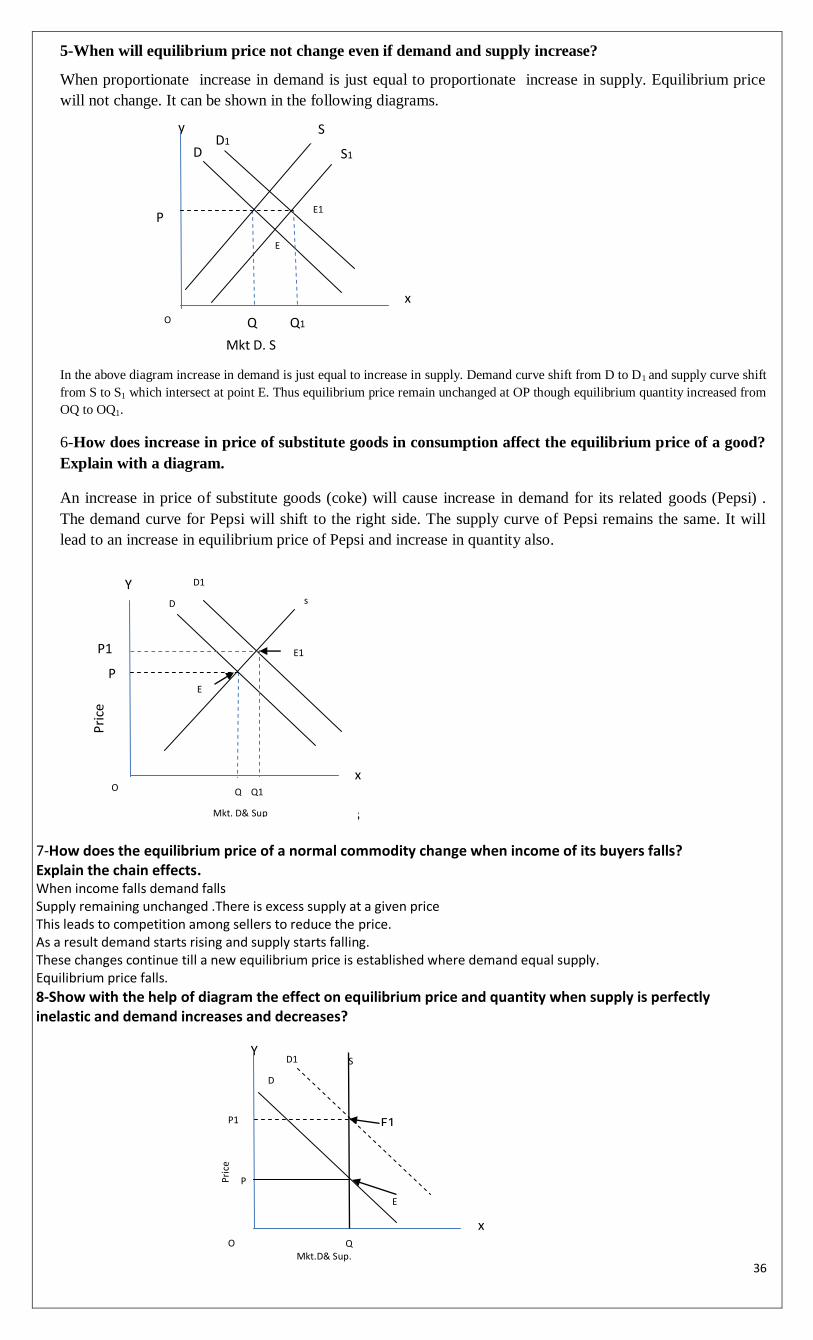
8-Show with the help of diagram the effect on equilibrium price and quantity when supply is perfectly inelastic and demand increases and decreases?
D
E
1
P
x
y
Pri
ce
P
x
Y
P1
x
Y
E1
S
S1
Q Q1
Mkt D. S
D1
E1
O
1
D1
D s
E1
E
O Q Q1
Mkt. D& Sup
S D1
D
E
O Mkt.D& Sup.
Pri
ce
P1
P
Q
37
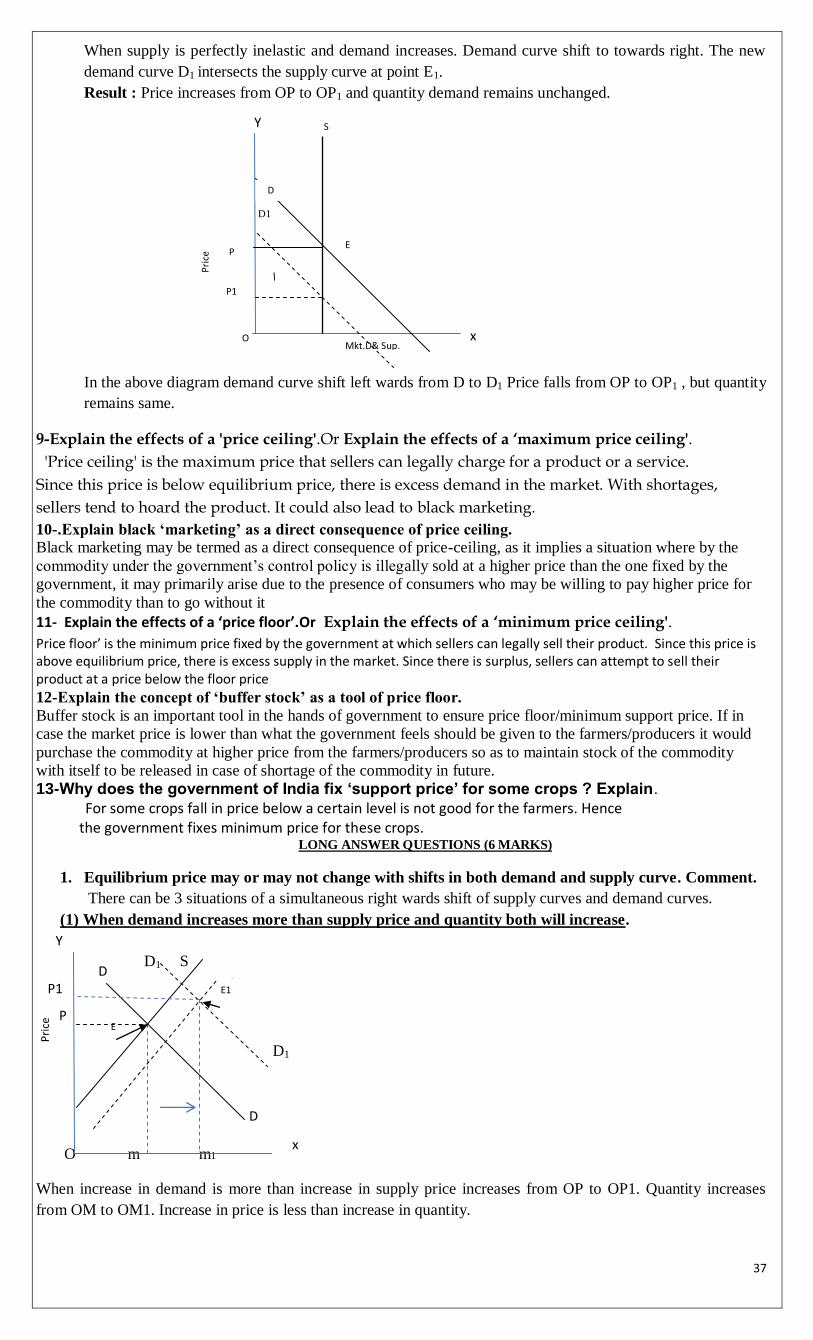
When supply is perfectly inelastic and demand increases. Demand curve shift to towards right. The new
demand curve D1 intersects the supply curve at point E1.
Result : Price increases from OP to OP1 and quantity demand remains unchanged.
D1
ا
In the above diagram demand curve shift left wards from D to D1 Price falls from OP to OP1 , but quantity
remains same.
9-Explain the effects of a 'price ceiling'.Or Explain the effects of a ‘maximum price ceiling'.
'Price ceiling' is the maximum price that sellers can legally charge for a product or a service.
Since this price is below equilibrium price, there is excess demand in the market. With shortages,
sellers tend to hoard the product. It could also lead to black marketing.
10-.Explain black ‘marketing’ as a direct consequence of price ceiling.
Black marketing may be termed as a direct consequence of price-ceiling, as it implies a situation where by the
commodity under the government‟s control policy is illegally sold at a higher price than the one fixed by the
government, it may primarily arise due to the presence of consumers who may be willing to pay higher price for
the commodity than to go without it
11- Explain the effects of a ‘price floor’.Or Explain the effects of a ‘minimum price ceiling'.
Price floor’ is the minimum price fixed by the government at which sellers can legally sell their product. Since this price is above equilibrium price, there is excess supply in the market. Since there is surplus, sellers can attempt to sell their product at a price below the floor price
12-Explain the concept of ‘buffer stock’ as a tool of price floor.
Buffer stock is an important tool in the hands of government to ensure price floor/minimum support price. If in
case the market price is lower than what the government feels should be given to the farmers/producers it would
purchase the commodity at higher price from the farmers/producers so as to maintain stock of the commodity
with itself to be released in case of shortage of the commodity in future.
13-Why does the government of India fix ‘support price’ for some crops ? Explain.
For some crops fall in price below a certain level is not good for the farmers. Hence the government fixes minimum price for these crops.
LONG ANSWER QUESTIONS (6 MARKS)
1. Equilibrium price may or may not change with shifts in both demand and supply curve. Comment.
There can be 3 situations of a simultaneous right wards shift of supply curves and demand curves.
(1) When demand increases more than supply price and quantity both will increase.
Y
D1 S
D1
O m m1
When increase in demand is more than increase in supply price increases from OP to OP1. Quantity increases
from OM to OM1. Increase in price is less than increase in quantity.
S1 P1
P
x
Y
O
E
E1
D
D
x
O
S
Mkt.D& Sup.
P
P1
D1 D
Pri
ce
E1
E
Pri
ce
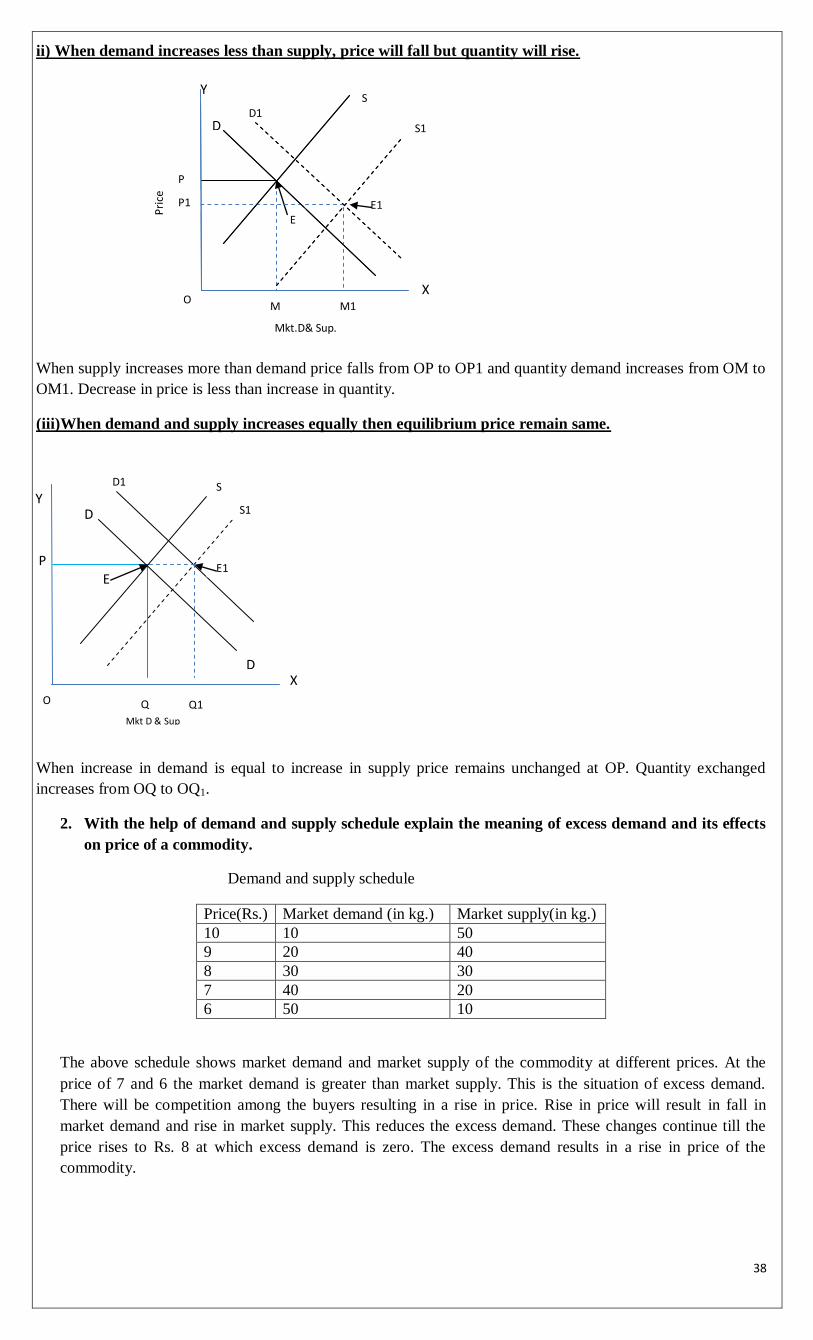
38
ii) When demand increases less than supply, price will fall but quantity will rise.
When supply increases more than demand price falls from OP to OP1 and quantity demand increases from OM to
OM1. Decrease in price is less than increase in quantity.
(iii)When demand and supply increases equally then equilibrium price remain same.
When increase in demand is equal to increase in supply price remains unchanged at OP. Quantity exchanged
increases from OQ to OQ1.
2. With the help of demand and supply schedule explain the meaning of excess demand and its effects
on price of a commodity.
Demand and supply schedule
Price(Rs.) Market demand (in kg.) Market supply(in kg.)
10 10 50
9 20 40
8 30 30
7 40 20
6 50 10
The above schedule shows market demand and market supply of the commodity at different prices. At the
price of 7 and 6 the market demand is greater than market supply. This is the situation of excess demand.
There will be competition among the buyers resulting in a rise in price. Rise in price will result in fall in
market demand and rise in market supply. This reduces the excess demand. These changes continue till the
price rises to Rs. 8 at which excess demand is zero. The excess demand results in a rise in price of the
commodity.
P
D
X
Y
D
D
E
X
Y
Mkt D & Sup
D1
S1
S
M M1 O
P
P1
E E1
Pri
ce
Mkt.D& Sup.
S1
S
E1
D1
O Q1 Q
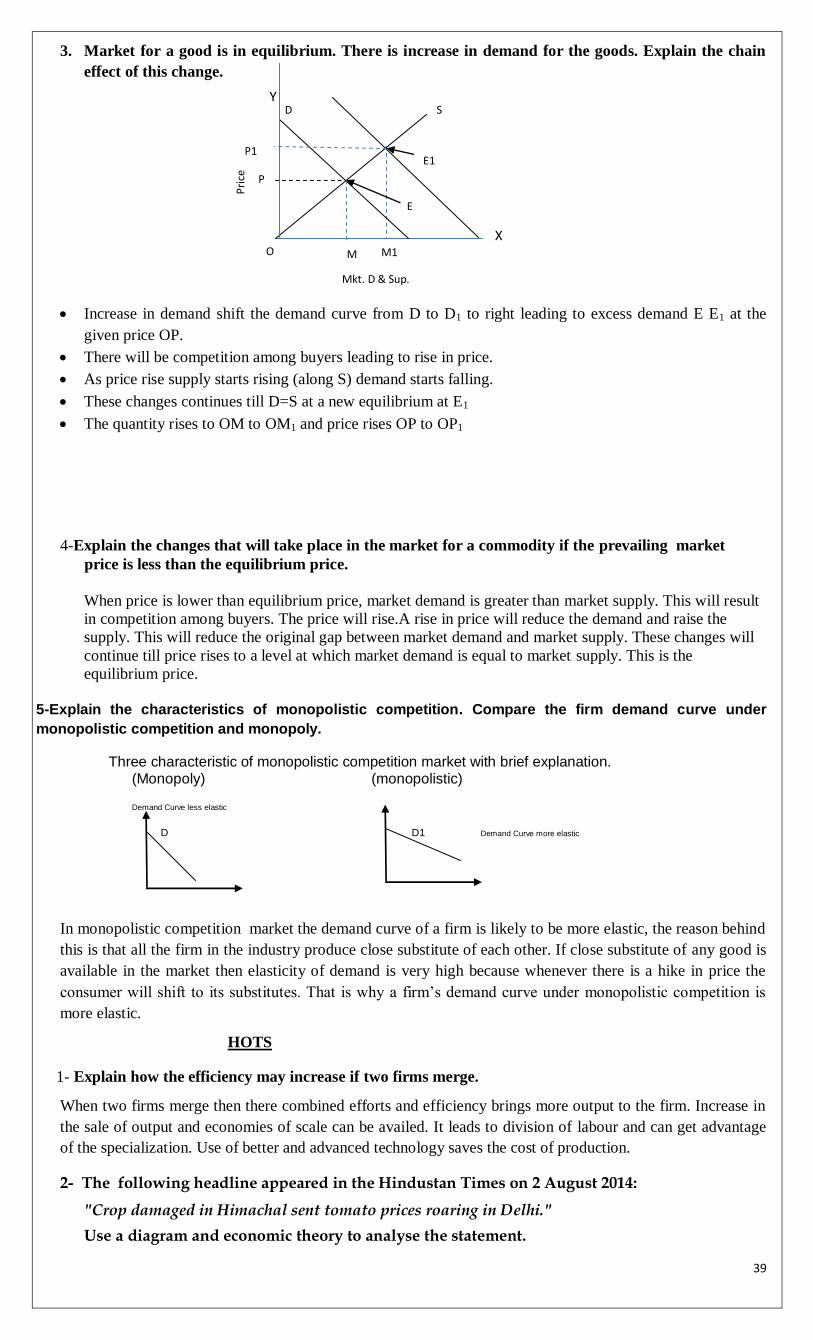
39
3. Market for a good is in equilibrium. There is increase in demand for the goods. Explain the chain
effect of this change.
Increase in demand shift the demand curve from D to D1 to right leading to excess demand E E1 at the
given price OP.
There will be competition among buyers leading to rise in price.
As price rise supply starts rising (along S) demand starts falling.
These changes continues till D=S at a new equilibrium at E1
The quantity rises to OM to OM1 and price rises OP to OP1
4-Explain the changes that will take place in the market for a commodity if the prevailing market
price is less than the equilibrium price.
When price is lower than equilibrium price, market demand is greater than market supply. This will result
in competition among buyers. The price will rise.A rise in price will reduce the demand and raise the
supply. This will reduce the original gap between market demand and market supply. These changes will
continue till price rises to a level at which market demand is equal to market supply. This is the
equilibrium price.
5-Explain the characteristics of monopolistic competition. Compare the firm demand curve under
monopolistic competition and monopoly.
Three characteristic of monopolistic competition market with brief explanation. (Monopoly) (monopolistic)
Demand Curve less elastic
D D1 Demand Curve more elastic
In monopolistic competition market the demand curve of a firm is likely to be more elastic, the reason behind
this is that all the firm in the industry produce close substitute of each other. If close substitute of any good is
available in the market then elasticity of demand is very high because whenever there is a hike in price the
consumer will shift to its substitutes. That is why a firm‟s demand curve under monopolistic competition is
more elastic.
HOTS
1- Explain how the efficiency may increase if two firms merge.
When two firms merge then there combined efforts and efficiency brings more output to the firm. Increase in
the sale of output and economies of scale can be availed. It leads to division of labour and can get advantage
of the specialization. Use of better and advanced technology saves the cost of production.
2- The following headline appeared in the Hindustan Times on 2 August 2014:
"Crop damaged in Himachal sent tomato prices roaring in Delhi."
Use a diagram and economic theory to analyse the statement.
X
Y S D
E1
E
P1
P
O M M1
Mkt. D & Sup.
Pri
ce

40
y
x
When the tomato crop was damaged in Himachal the supply of tomatoes
decreases. This means that the supply curve shifts leftward to S'S'.
At the prevailing market price (OP), there was an excess demand of AE. In this situation, buyers
would have competed to raise the market price. As market price would have risen, quantity
demanded of tomatoes would have contracted and the quantity supplied would have expanded.
This process would have continued till a new equilibrium price was reached at OP1, where market
demand is equal to market supply. OP1 is higher than the old price of tomatoes.
3-On 19 December 2013, the following news item was printed in the Economic Times:
Households in Southern India prefer to eat oranges for breakfast as banana plantations in
Kerala have been destroyed and price of apples and grapes have also risen.
Use a diagram and economic theory to analyse the impact of the rise in price of apples and
grapes on the market of oranges.
When the price of apples and grapes rises, consumers will substitute with these fruits with the
relatively cheaper oranges. Thus, demand for oranges will increase and the demand curve shifts
rightwards to D’D’.
At the prevailing market price (OP), there was an excess demand of AE. In this situation, buyers
would react by competing with each other and raise the market price. As market price rises,
quantity demanded of oranges contracts and the quantity supplied expands. This process will
continued till a new equilibrium price is reached at OP1, where market demand is equal to market
supply. OP1 is higher than the old price of oranges.
Therefore, the equilibrium price of oranges increases and the equilibrium quantity also increases
when the price of apples and grapes rises in Southern India.
4-Explain the feature ‘interdependence of firms’ in an oligopoly market.
41
(a)The most important characteristic feature of oligopoly is interdependence among its firms.The number of
sellers is small in this market and each of these firms contribute a significant proportion in the total sales.
(b)As a result when any one of them undertakes any measure to promote its sale it directly affects other firms
and they also immediately react.
(c)Hence every firm decides its policy after taking into consideration the possible reactions of its rival firms.
Thus every firm is affected by the activities of other firms and it affects others also.
UNIT-5
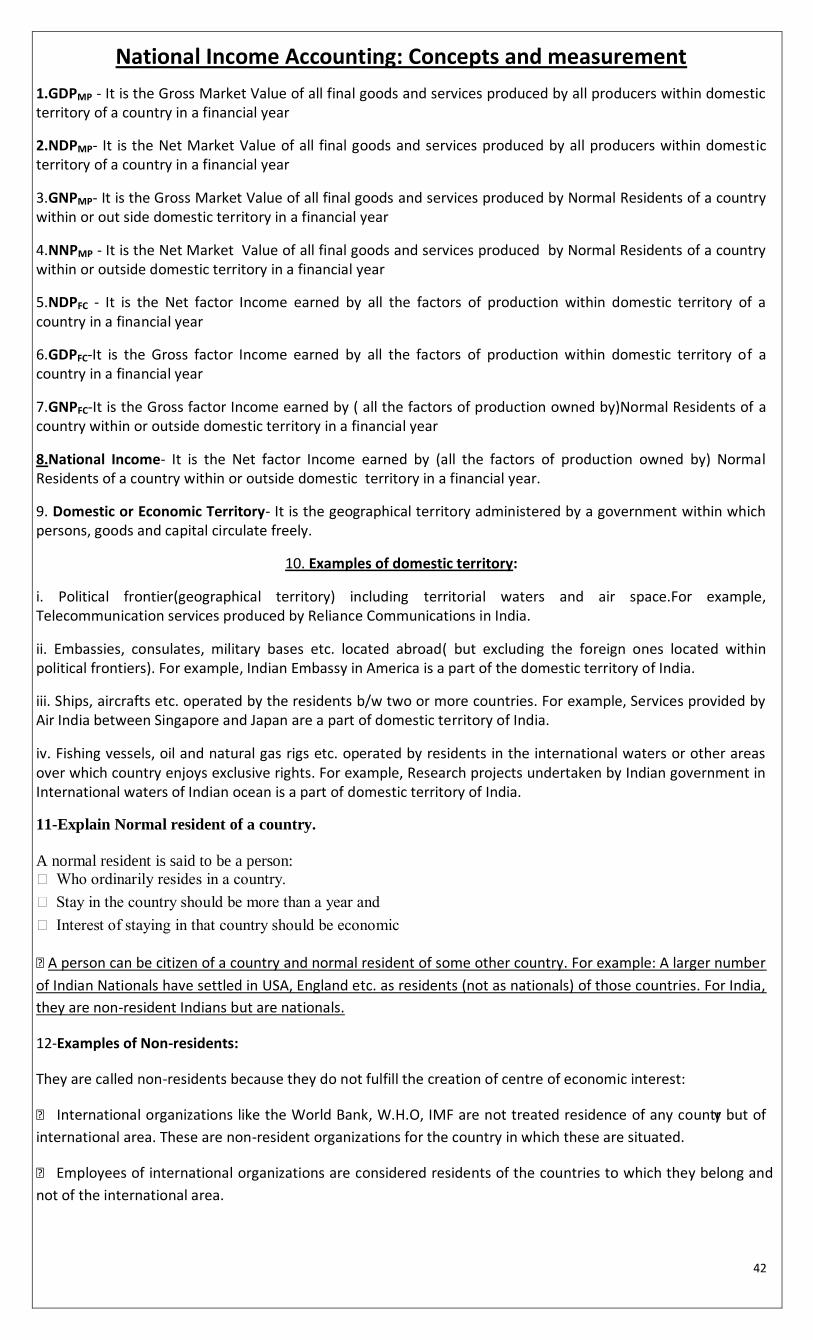
42
National Income Accounting: Concepts and measurement
1.GDPMP - It is the Gross Market Value of all final goods and services produced by all producers within domestic territory of a country in a financial year
2.NDPMP- It is the Net Market Value of all final goods and services produced by all producers within domestic territory of a country in a financial year
3.GNPMP- It is the Gross Market Value of all final goods and services produced by Normal Residents of a country within or out side domestic territory in a financial year
4.NNPMP - It is the Net Market Value of all final goods and services produced by Normal Residents of a country within or outside domestic territory in a financial year
5.NDPFC - It is the Net factor Income earned by all the factors of production within domestic territory of a country in a financial year
6.GDPFC-It is the Gross factor Income earned by all the factors of production within domestic territory of a country in a financial year
7.GNPFC-It is the Gross factor Income earned by ( all the factors of production owned by)Normal Residents of a country within or outside domestic territory in a financial year
8.National Income- It is the Net factor Income earned by (all the factors of production owned by) Normal Residents of a country within or outside domestic territory in a financial year.
9. Domestic or Economic Territory- It is the geographical territory administered by a government within which persons, goods and capital circulate freely.
10. Examples of domestic territory:
i. Political frontier(geographical territory) including territorial waters and air space.For example, Telecommunication services produced by Reliance Communications in India.
ii. Embassies, consulates, military bases etc. located abroad( but excluding the foreign ones located within political frontiers). For example, Indian Embassy in America is a part of the domestic territory of India.
iii. Ships, aircrafts etc. operated by the residents b/w two or more countries. For example, Services provided by Air India between Singapore and Japan are a part of domestic territory of India.
iv. Fishing vessels, oil and natural gas rigs etc. operated by residents in the international waters or other areas over which country enjoys exclusive rights. For example, Research projects undertaken by Indian government in International waters of Indian ocean is a part of domestic territory of India.
11-Explain Normal resident of a country.
A normal resident is said to be a person:
Who ordinarily resides in a country.
Stay in the country should be more than a year and
Interest of staying in that country should be economic
A person can be citizen of a country and normal resident of some other country. For example: A larger number
of Indian Nationals have settled in USA, England etc. as residents (not as nationals) of those countries. For India,
they are non-resident Indians but are nationals.
12-Examples of Non-residents:
They are called non-residents because they do not fulfill the creation of centre of economic interest:
International organizations like the World Bank, W.H.O, IMF are not treated residence of any country but of
international area. These are non-resident organizations for the country in which these are situated.
Employees of international organizations are considered residents of the countries to which they belong and
not of the international area.
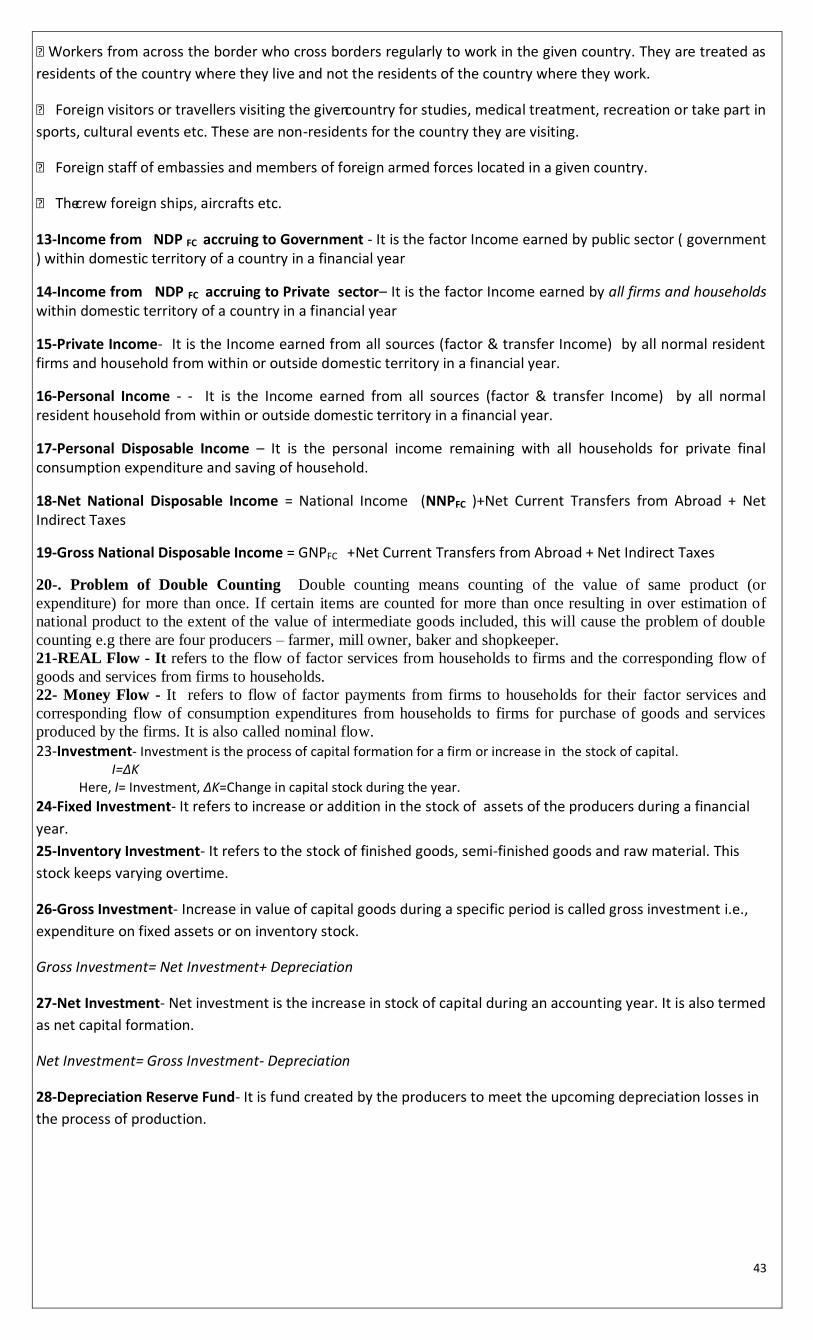
43
Workers from across the border who cross borders regularly to work in the given country. They are treated as
residents of the country where they live and not the residents of the country where they work.
Foreign visitors or travellers visiting the given country for studies, medical treatment, recreation or take part in
sports, cultural events etc. These are non-residents for the country they are visiting.
Foreign staff of embassies and members of foreign armed forces located in a given country.
The crew foreign ships, aircrafts etc.
13-Income from NDP FC accruing to Government - It is the factor Income earned by public sector ( government ) within domestic territory of a country in a financial year
14-Income from NDP FC accruing to Private sector– It is the factor Income earned by all firms and households within domestic territory of a country in a financial year
15-Private Income- It is the Income earned from all sources (factor & transfer Income) by all normal resident firms and household from within or outside domestic territory in a financial year.
16-Personal Income - - It is the Income earned from all sources (factor & transfer Income) by all normal resident household from within or outside domestic territory in a financial year.
17-Personal Disposable Income – It is the personal income remaining with all households for private final consumption expenditure and saving of household.
18-Net National Disposable Income = National Income (NNPFC )+Net Current Transfers from Abroad + Net Indirect Taxes
19-Gross National Disposable Income = GNPFC +Net Current Transfers from Abroad + Net Indirect Taxes
20-. Problem of Double Counting Double counting means counting of the value of same product (or
expenditure) for more than once. If certain items are counted for more than once resulting in over estimation of
national product to the extent of the value of intermediate goods included, this will cause the problem of double
counting e.g there are four producers – farmer, mill owner, baker and shopkeeper.
21-REAL Flow - It refers to the flow of factor services from households to firms and the corresponding flow of
goods and services from firms to households.
22- Money Flow - It refers to flow of factor payments from firms to households for their factor services and
corresponding flow of consumption expenditures from households to firms for purchase of goods and services
produced by the firms. It is also called nominal flow.
23-Investment- Investment is the process of capital formation for a firm or increase in the stock of capital. I=∆K Here, I= Investment, ∆K=Change in capital stock during the year.
24-Fixed Investment- It refers to increase or addition in the stock of assets of the producers during a financial
year.
25-Inventory Investment- It refers to the stock of finished goods, semi-finished goods and raw material. This
stock keeps varying overtime.
26-Gross Investment- Increase in value of capital goods during a specific period is called gross investment i.e.,
expenditure on fixed assets or on inventory stock.
Gross Investment= Net Investment+ Depreciation
27-Net Investment- Net investment is the increase in stock of capital during an accounting year. It is also termed
as net capital formation.
Net Investment= Gross Investment- Depreciation
28-Depreciation Reserve Fund- It is fund created by the producers to meet the upcoming depreciation losses in
the process of production.
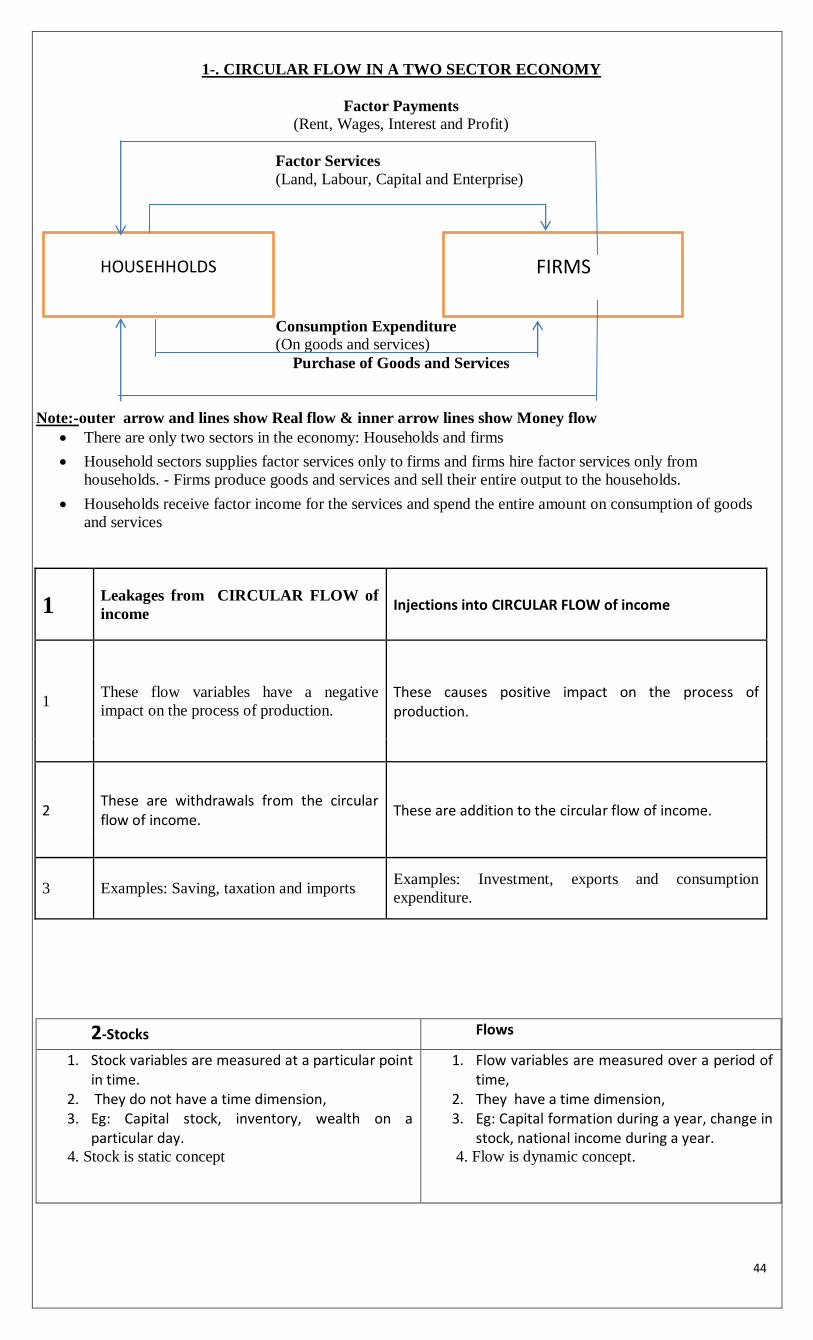
44
1-. CIRCULAR FLOW IN A TWO SECTOR ECONOMY
Factor Payments (Rent, Wages, Interest and Profit)
Factor Services
(Land, Labour, Capital and Enterprise)
Consumption Expenditure (On goods and services)
Purchase of Goods and Services
Note:-outer arrow and lines show Real flow & inner arrow lines show Money flow
There are only two sectors in the economy: Households and firms
Household sectors supplies factor services only to firms and firms hire factor services only from
households. - Firms produce goods and services and sell their entire output to the households.
Households receive factor income for the services and spend the entire amount on consumption of goods
and services
1 Leakages from CIRCULAR FLOW of
income Injections into CIRCULAR FLOW of income
1 These flow variables have a negative
impact on the process of production.
These causes positive impact on the process of production.
2 These are withdrawals from the circular flow of income.
These are addition to the circular flow of income.
3 Examples: Saving, taxation and imports Examples: Investment, exports and consumption
expenditure.
2-Stocks Flows
1. Stock variables are measured at a particular point in time.
2. They do not have a time dimension, 3. Eg: Capital stock, inventory, wealth on a
particular day. 4. Stock is static concept
1. Flow variables are measured over a period of time,
2. They have a time dimension, 3. Eg: Capital formation during a year, change in
stock, national income during a year. 4. Flow is dynamic concept.
HOUSEHHOLDS FIRMS
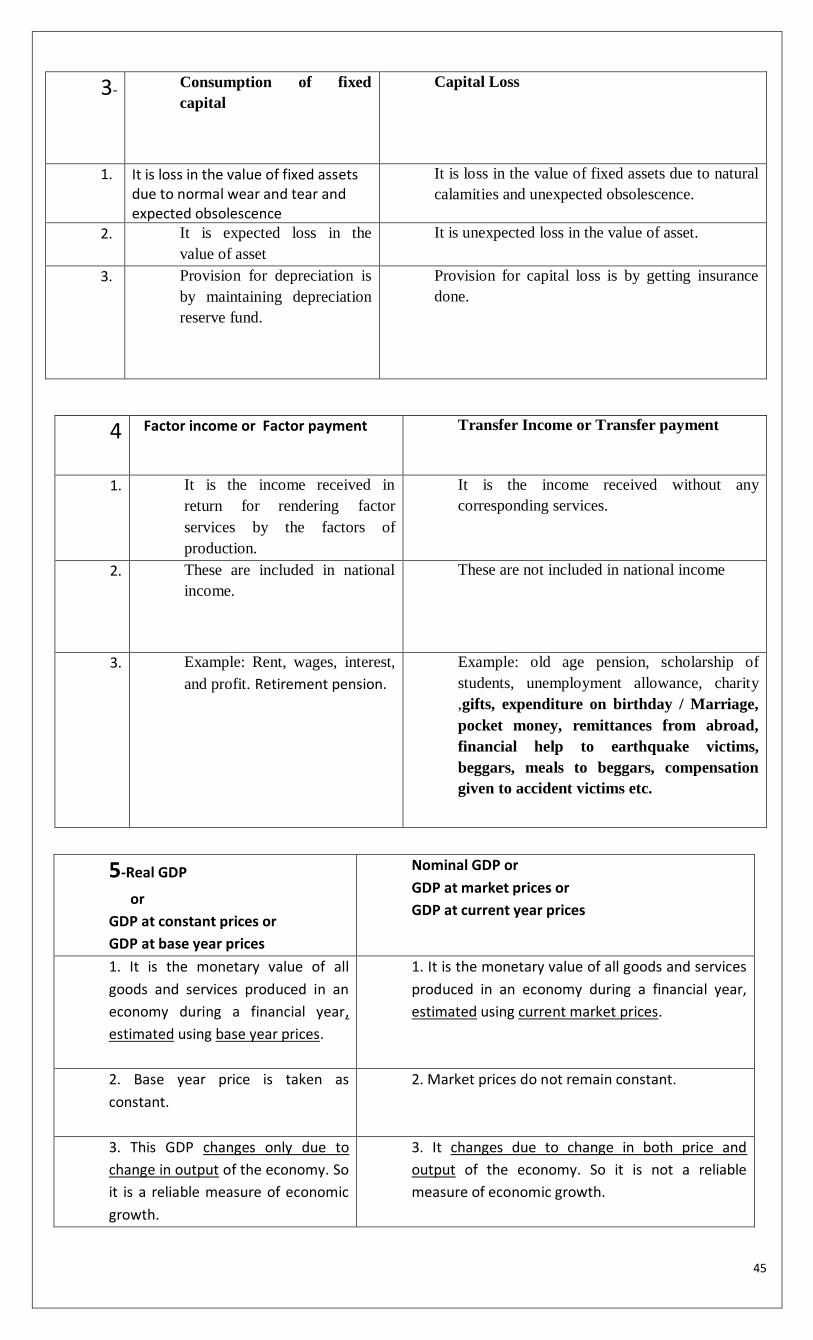
45
3- Consumption of fixed
capital
Capital Loss
1. It is loss in the value of fixed assets due to normal wear and tear and expected obsolescence
It is loss in the value of fixed assets due to natural
calamities and unexpected obsolescence.
2. It is expected loss in the
value of asset
It is unexpected loss in the value of asset.
3. Provision for depreciation is
by maintaining depreciation
reserve fund.
Provision for capital loss is by getting insurance
done.
4 Factor income or Factor payment
Transfer Income or Transfer payment
1. It is the income received in
return for rendering factor
services by the factors of
production.
It is the income received without any
corresponding services.
2. These are included in national
income.
These are not included in national income
3. Example: Rent, wages, interest,
and profit. Retirement pension.
Example: old age pension, scholarship of
students, unemployment allowance, charity
,gifts, expenditure on birthday / Marriage,
pocket money, remittances from abroad,
financial help to earthquake victims,
beggars, meals to beggars, compensation
given to accident victims etc.
5-Real GDP
or
GDP at constant prices or
GDP at base year prices
Nominal GDP or
GDP at market prices or
GDP at current year prices
1. It is the monetary value of all
goods and services produced in an
economy during a financial year,
estimated using base year prices.
1. It is the monetary value of all goods and services
produced in an economy during a financial year,
estimated using current market prices.
2. Base year price is taken as
constant.
2. Market prices do not remain constant.
3. This GDP changes only due to
change in output of the economy. So
it is a reliable measure of economic
growth.
3. It changes due to change in both price and
output of the economy. So it is not a reliable
measure of economic growth.
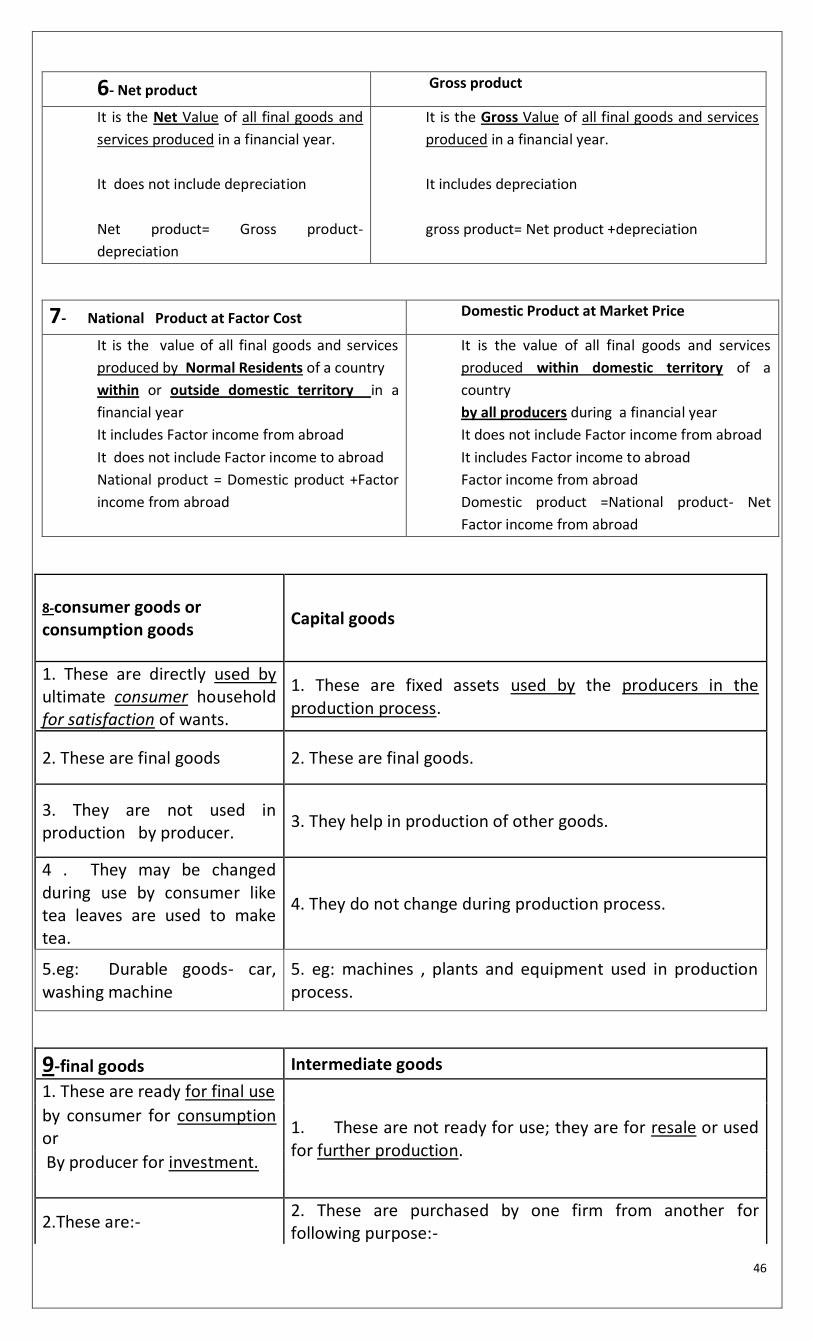
46
6- Net product Gross product
It is the Net Value of all final goods and
services produced in a financial year.
It does not include depreciation
Net product= Gross product-
depreciation
It is the Gross Value of all final goods and services
produced in a financial year.
It includes depreciation
gross product= Net product +depreciation
7- National Product at Factor Cost Domestic Product at Market Price
It is the value of all final goods and services
produced by Normal Residents of a country
within or outside domestic territory in a
financial year
It includes Factor income from abroad
It does not include Factor income to abroad
National product = Domestic product +Factor
income from abroad
It is the value of all final goods and services
produced within domestic territory of a
country
by all producers during a financial year
It does not include Factor income from abroad
It includes Factor income to abroad
Factor income from abroad
Domestic product =National product- Net
Factor income from abroad
8-consumer goods or consumption goods
Capital goods
1. These are directly used by ultimate consumer household for satisfaction of wants.
1. These are fixed assets used by the producers in the production process.
2. These are final goods 2. These are final goods.
3. They are not used in production by producer.
3. They help in production of other goods.
4 . They may be changed during use by consumer like tea leaves are used to make tea.
4. They do not change during production process.
5.eg: Durable goods- car, washing machine
5. eg: machines , plants and equipment used in production process.
9-final goods Intermediate goods
1. These are ready for final use
1. These are not ready for use; they are for resale or used for further production.
by consumer for consumption or
By producer for investment.
2.These are:- 2. These are purchased by one firm from another for following purpose:-
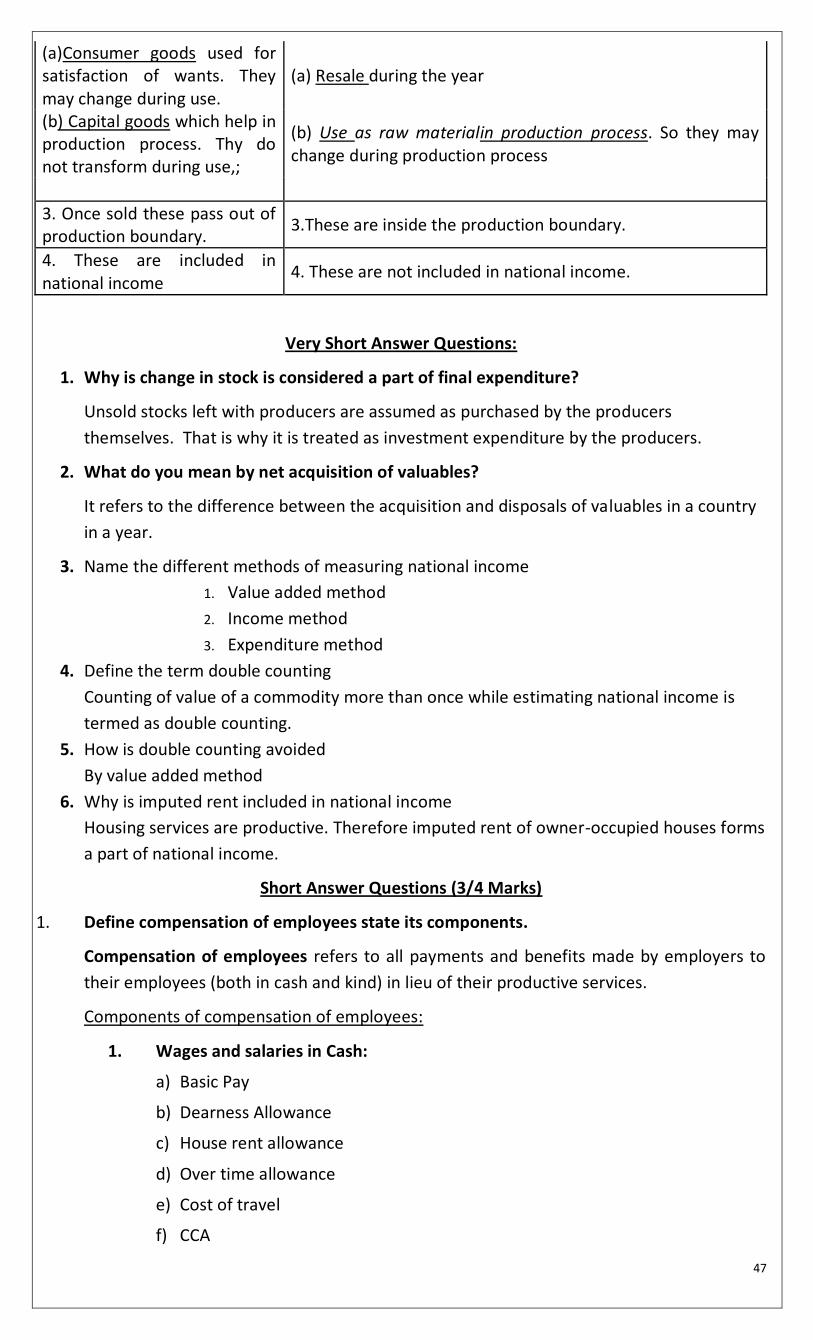
47
(a)Consumer goods used for satisfaction of wants. They may change during use.
(a) Resale during the year
(b) Capital goods which help in production process. Thy do not transform during use,;
(b) Use as raw materialin production process. So they may change during production process
3. Once sold these pass out of production boundary.
3.These are inside the production boundary.
4. These are included in national income
4. These are not included in national income.
Very Short Answer Questions:
1. Why is change in stock is considered a part of final expenditure?
Unsold stocks left with producers are assumed as purchased by the producers
themselves. That is why it is treated as investment expenditure by the producers.
2. What do you mean by net acquisition of valuables?
It refers to the difference between the acquisition and disposals of valuables in a country
in a year.
3. Name the different methods of measuring national income
1. Value added method
2. Income method
3. Expenditure method
4. Define the term double counting
Counting of value of a commodity more than once while estimating national income is
termed as double counting.
5. How is double counting avoided
By value added method
6. Why is imputed rent included in national income
Housing services are productive. Therefore imputed rent of owner-occupied houses forms
a part of national income.
Short Answer Questions (3/4 Marks)
1. Define compensation of employees state its components.
Compensation of employees refers to all payments and benefits made by employers to
their employees (both in cash and kind) in lieu of their productive services.
Components of compensation of employees:
1. Wages and salaries in Cash:
a) Basic Pay
b) Dearness Allowance
c) House rent allowance
d) Over time allowance
e) Cost of travel
f) CCA
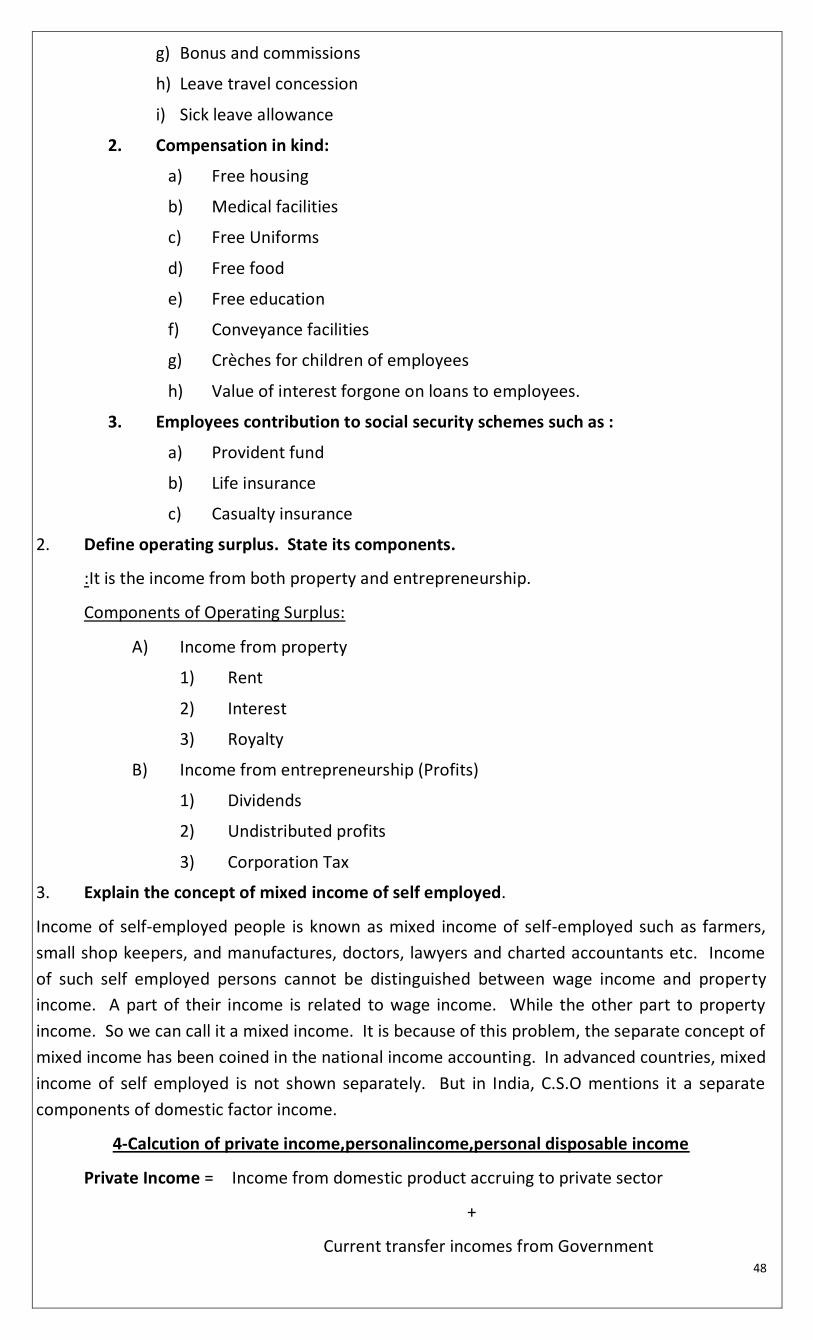
48
g) Bonus and commissions
h) Leave travel concession
i) Sick leave allowance
2. Compensation in kind:
a) Free housing
b) Medical facilities
c) Free Uniforms
d) Free food
e) Free education
f) Conveyance facilities
g) Crèches for children of employees
h) Value of interest forgone on loans to employees.
3. Employees contribution to social security schemes such as :
a) Provident fund
b) Life insurance
c) Casualty insurance
2. Define operating surplus. State its components.
:It is the income from both property and entrepreneurship.
Components of Operating Surplus:
A) Income from property
1) Rent
2) Interest
3) Royalty
B) Income from entrepreneurship (Profits)
1) Dividends
2) Undistributed profits
3) Corporation Tax
3. Explain the concept of mixed income of self employed.
Income of self-employed people is known as mixed income of self-employed such as farmers,
small shop keepers, and manufactures, doctors, lawyers and charted accountants etc. Income
of such self employed persons cannot be distinguished between wage income and property
income. A part of their income is related to wage income. While the other part to property
income. So we can call it a mixed income. It is because of this problem, the separate concept of
mixed income has been coined in the national income accounting. In advanced countries, mixed
income of self employed is not shown separately. But in India, C.S.O mentions it a separate
components of domestic factor income.
4-Calcution of private income,personalincome,personal disposable income
Private Income = Income from domestic product accruing to private sector
+
Current transfer incomes from Government
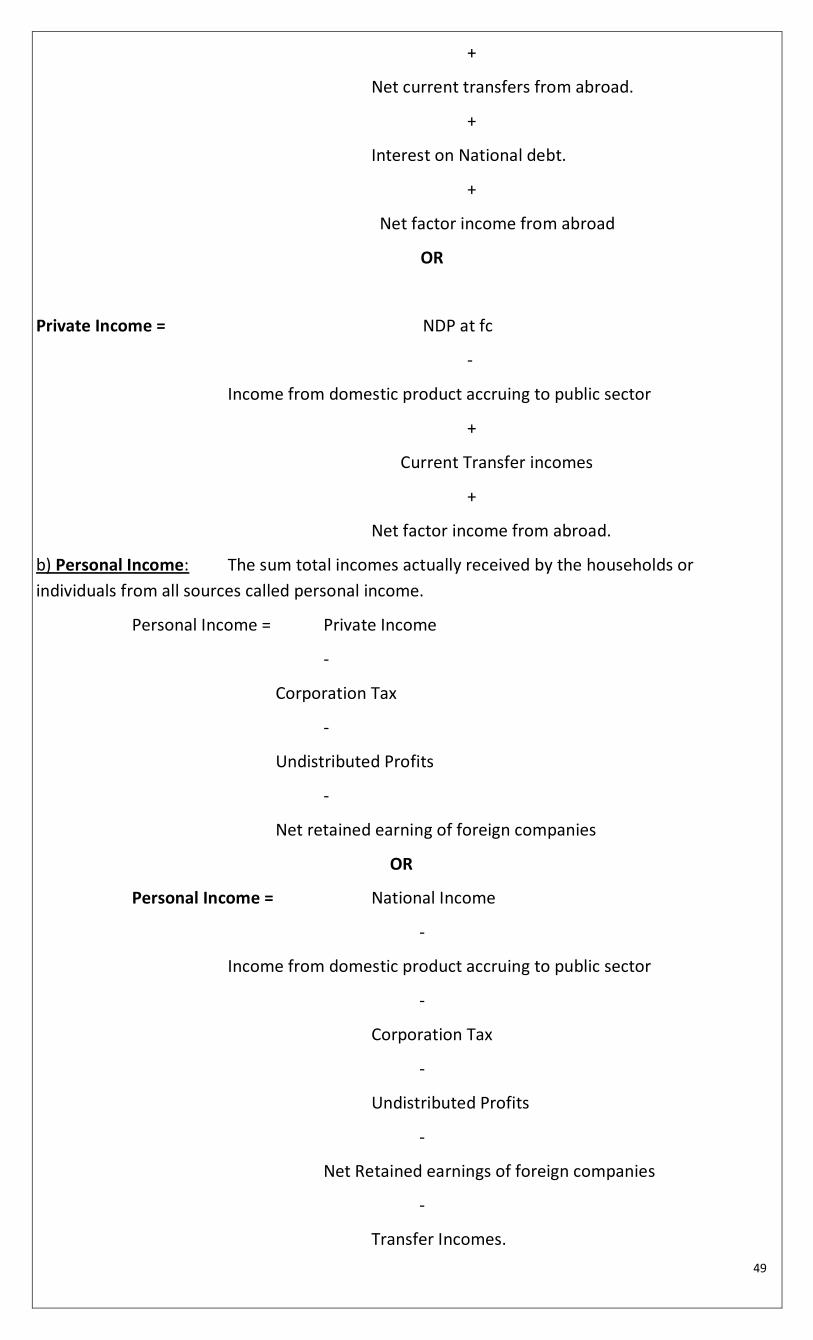
49
+
Net current transfers from abroad.
+
Interest on National debt.
+
Net factor income from abroad
OR
Private Income = NDP at fc
-
Income from domestic product accruing to public sector
+
Current Transfer incomes
+
Net factor income from abroad.
b) Personal Income: The sum total incomes actually received by the households or
individuals from all sources called personal income.
Personal Income = Private Income
-
Corporation Tax
-
Undistributed Profits
-
Net retained earning of foreign companies
OR
Personal Income = National Income
-
Income from domestic product accruing to public sector
-
Corporation Tax
-
Undistributed Profits
-
Net Retained earnings of foreign companies
-
Transfer Incomes.
50
c) Personal Disposable Income (PDI): Personal disposable income that part of personal income
which is either spent on consumption or saved by the households. It is the income which
actually is at the disposable of households. The households have to pay personal taxes like
income tax, wealth tax etc out of their personal income. They may also have to pay other
miscellaneous items like fines, fees etc to the government administrative departments.
Personal Disposable Income (PDI)= Personal Income
-
Direct Taxes
-
Miscellaneous receipts of goods
5-Why is GDP not a good measure of welfare?
1. 1.It does not consider level of prices in the country. If prices are high, even high income
will also not lead to high standard of living.
2. It does not show the composition of output. Increase of GDP could also be due to war goods or socially undesirable goods such as drugs etc. if share of wage goods does not increase it may not increase economic welfare.
3. Rise in GDP could be due to increase in industrialization & urbanisation which would lead to pollution, environmental degradation which reduces welfare.
4. Increase in GDP does not indicate distribution of income . Its increase may lead to increasing income inequalities & poverty, which reduces economic welfare,
5. It does not indicate unemployment in the country .Economic welfare will increase by removing unemployment & not just by increasing GDP.
6. It does not indicate the skills of population or resources which will indicate economic
welfare of people.
Long Answer Questions:
1. Give an outline of estimate national income by product method/ value added method
Under product/value added method, national income is estimated by taking and adding the money value
of final goods and services produced in an economy during a year.
Steps of product/value added method:
1) Identification and classification of productive enterprises.
2) Estimation of net value added.
3) Calculation of net factor income from abroad.
4) Estimation of national income.
Precautions:
1) Sale and purchase of second hand goods are not included. Because it is not a part of current production.
2) The value of intermediate goods should not be included. Because it will lead to the problem of double counting.
3) Production for self consumption should be included. Because it is a part of national income. Hence its imputed value should be included.
4) Services of owner occupied houses / imputed rent should be included in national income because these are part of the current years production.
5) Own account production of fixed capital should be included; it is a part of final investment expenditure.
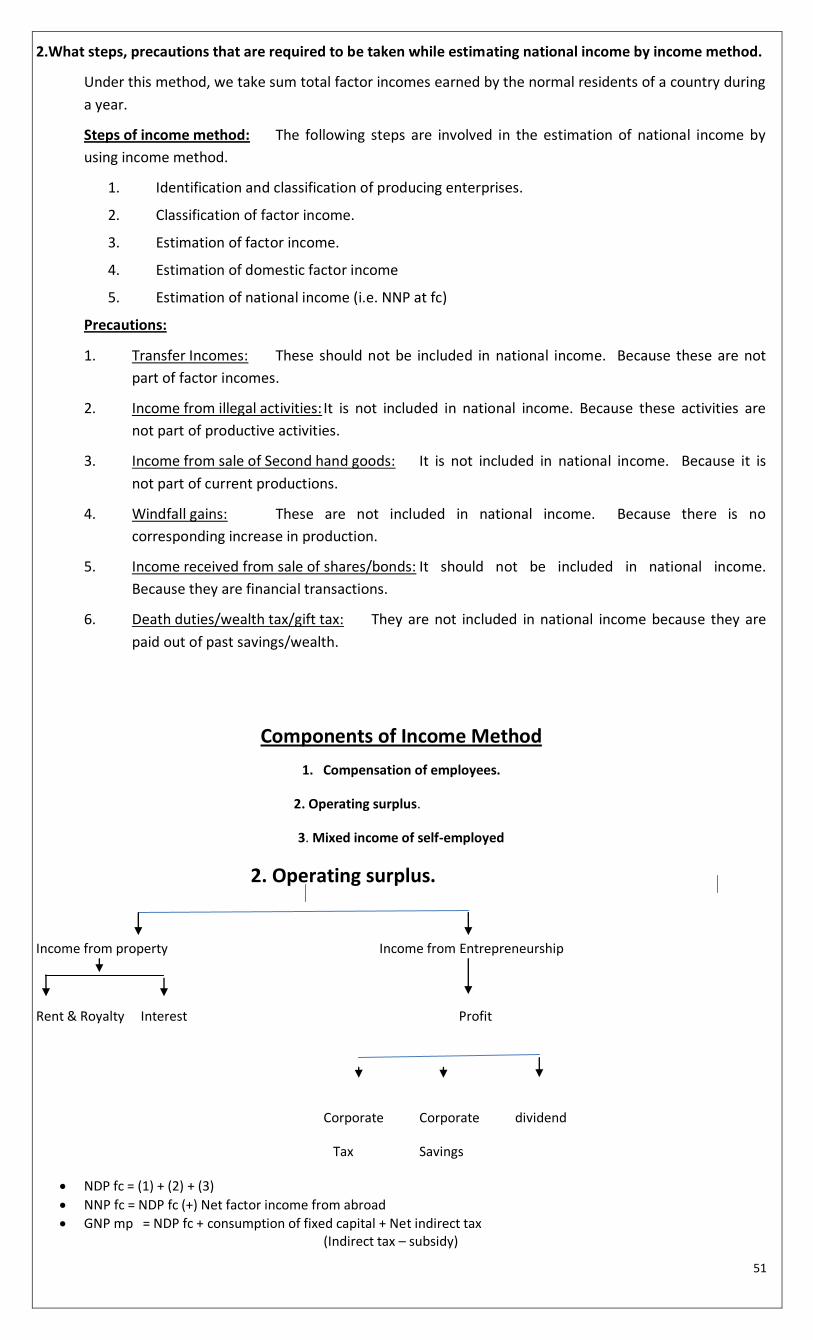
51
2.What steps, precautions that are required to be taken while estimating national income by income method.
Under this method, we take sum total factor incomes earned by the normal residents of a country during
a year.
Steps of income method: The following steps are involved in the estimation of national income by
using income method.
1. Identification and classification of producing enterprises.
2. Classification of factor income.
3. Estimation of factor income.
4. Estimation of domestic factor income
5. Estimation of national income (i.e. NNP at fc)
Precautions:
1. Transfer Incomes: These should not be included in national income. Because these are not
part of factor incomes.
2. Income from illegal activities: It is not included in national income. Because these activities are
not part of productive activities.
3. Income from sale of Second hand goods: It is not included in national income. Because it is
not part of current productions.
4. Windfall gains: These are not included in national income. Because there is no
corresponding increase in production.
5. Income received from sale of shares/bonds: It should not be included in national income.
Because they are financial transactions.
6. Death duties/wealth tax/gift tax: They are not included in national income because they are
paid out of past savings/wealth.
Components of Income Method
1. Compensation of employees.
2. Operating surplus.
3. Mixed income of self-employed
2. Operating surplus.
Income from property Income from Entrepreneurship
Rent & Royalty Interest Profit
Corporate Corporate dividend
Tax Savings
NDP fc = (1) + (2) + (3)
NNP fc = NDP fc (+) Net factor income from abroad
GNP mp = NDP fc + consumption of fixed capital + Net indirect tax (Indirect tax – subsidy)
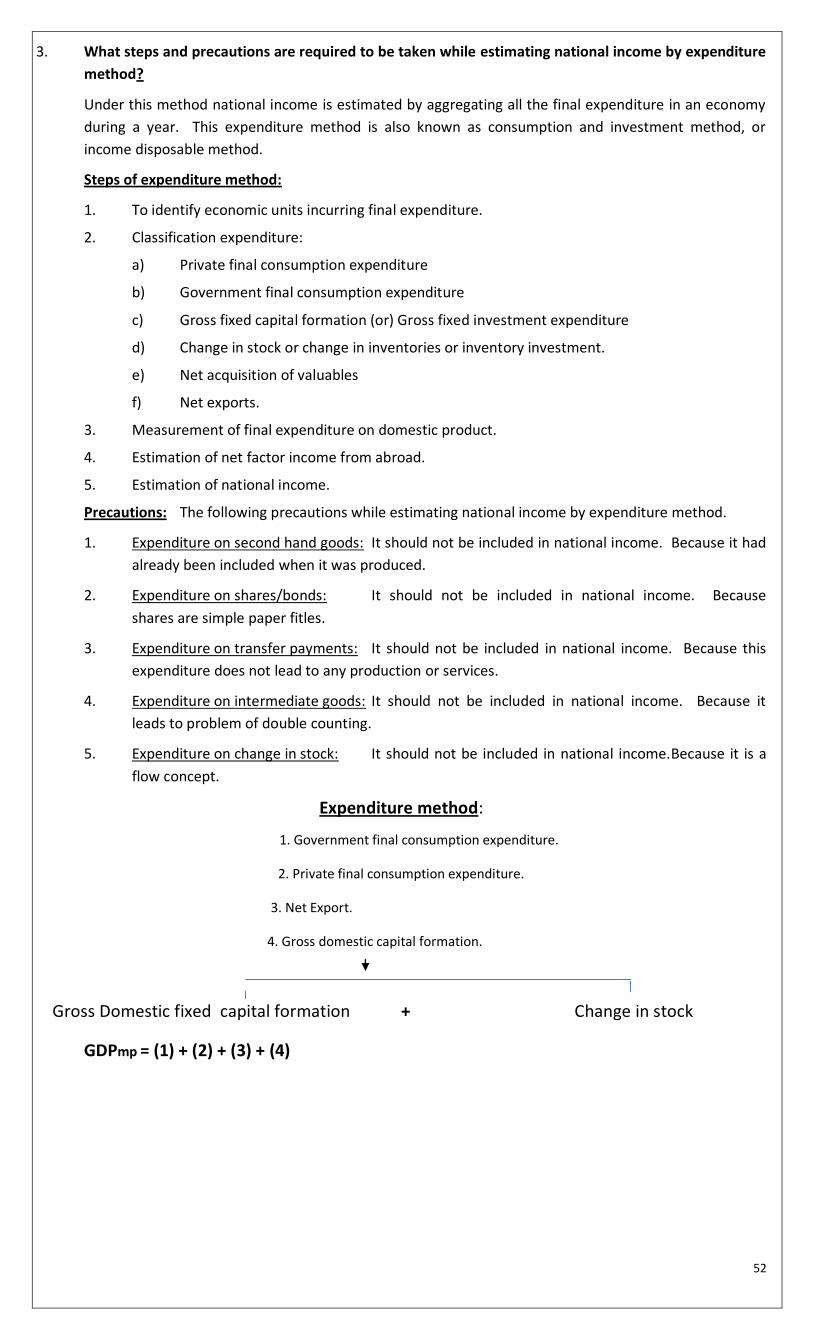
52
3. What steps and precautions are required to be taken while estimating national income by expenditure
method?
Under this method national income is estimated by aggregating all the final expenditure in an economy
during a year. This expenditure method is also known as consumption and investment method, or
income disposable method.
Steps of expenditure method:
1. To identify economic units incurring final expenditure.
2. Classification expenditure:
a) Private final consumption expenditure
b) Government final consumption expenditure
c) Gross fixed capital formation (or) Gross fixed investment expenditure
d) Change in stock or change in inventories or inventory investment.
e) Net acquisition of valuables
f) Net exports.
3. Measurement of final expenditure on domestic product.
4. Estimation of net factor income from abroad.
5. Estimation of national income.
Precautions: The following precautions while estimating national income by expenditure method.
1. Expenditure on second hand goods: It should not be included in national income. Because it had
already been included when it was produced.
2. Expenditure on shares/bonds: It should not be included in national income. Because
shares are simple paper fitles.
3. Expenditure on transfer payments: It should not be included in national income. Because this
expenditure does not lead to any production or services.
4. Expenditure on intermediate goods: It should not be included in national income. Because it
leads to problem of double counting.
5. Expenditure on change in stock: It should not be included in national income.Because it is a
flow concept.
Expenditure method:
1. Government final consumption expenditure.
2. Private final consumption expenditure.
3. Net Export.
4. Gross domestic capital formation.
Gross Domestic fixed capital formation + Change in stock
GDPmp = (1) + (2) + (3) + (4)
53
4-What are the items are excluded from GNP. Give reasons?
Purely financial transactions:
a) Buying and selling of securities: These should not be included in GNP. Because they
are financial transactions.
b) Government transfer payments: These should not be included in GNP. Because this
expenditure does not lead to any production or services.
c) Private transfer payments: These should not be included in GNP. Because they are
transfer payments.
1. Transfer of used goods / sale of second hand goods: These should not be included in GNP. Because these are not part current production.
2. Non-marketed goods and services: These include services of house-wife, growing vegetables in the back yard etc. These should not be included in GNP. Because they are not purchased / sold in the market at current prices.
3. Illegal activities: These should not be included in GNP. Because they are illegal.
4. The value of leisure: It should not be included in GNP. Because it is not part of a production.
5--Classify the following into factor income and transfer receipt. Give reason for your answer.
i)Employer’s contribution to social security schemes.
It is a factor income as it is earned because employees are rendered corresponding services to the employer.
ii)Scholarship given to students by the government.
It is transfer receipt as it is unearned because students are not rendered any corresponding services to the
government.
iii)Old age pension given by the government.
It is transfer receipt as it is unearned because pensioners are not rendered any corresponding services to the
government.
iv)Bonus given to employees by employer.
It is a factor income as it is earned because employees are rendered corresponding services to the employer.
6-Will the following be included or not in the domestic factor income of India? Give reasons for your
answer.
i) Salaries of non-residents working in India Embassies in Russia.
Yes it will be included because Indian embassy is a part of domestic territory of India.
ii) Salaries to Indian residents working in Indian embassy in Russia.
Yes it will be included in the domestic factor income as the Indian embassy is a part of domestic territory of
India.
iii) Salaries to Indian residents working in Russian Embassy in India.
No it will not be included in the domestic factor income as the Russian embassy is not a part of domestic territory
of India.
iv) Salaries received by Indian workings in American Embassy in India.
No it will not be included in the domestic factor income as the American embassy is not a part of domestic
territory of India.
vi) Salaries paid to Koreans working in Indian Embassy in Korea.
Yes it will be included in the domestic factor income as the Indian embassy is a part of domestic territory of
India.
vii) Salaries to India working in Japanese embassy in India.
54
No it will not be included in the domestic factor income as the Japenese embassy is not a part of domestic
territory of India.
viii) CEO to the residents of Japan working in Indian Embassy in Japan.
Yes it will be included in the domestic factor income as the Indian embassy is a part of domestic territory of
India.
ix) Profit earned by an Indian company from its branch in Singapore.
No it will not be included in domestic factor income of India because Singapore is not a part of domestic territory
of India.
X -Rent received by an Indian from his building in London.
No, it will not be included in the domestic factor income as the rent is earned outside the domestic territory of
India.
XI) Rent paid by the embassy of Japan in India to a resident Indian.
No, it will not be included in the domestic factor income as the Japanese embassy is not a part of the domestic
territory of India.
7. Giving reasons state whether the following are included in national Income.
i) Salary received by an Indian resident working in US embassy in New Delhi.
Yes, it will be included in national income as salary received by Indian resident working in US embassy in New
Delhi is a part of factor income from abroad.
ii) Salaries paid to non-resident Indians working in Indian embassy in America.
This is a exceptional case It is included in the national income of India as salaries paid to non-resident Indians
working in Indian embassy in America is a part of compensation of employees from abroad.
iii) Salaries received by an Indian resident working in Russian embassy in India.
Yes, it will be included in national income as it is a part of factor income from abroad.
Salaries paid to Russian working in Indian embassy in Russia.
(iv) Expenditure by a firm on payment of fees to a chartered accountant.
Yes,Expenditureby a firm on payment of fees to a chartered accountant will be intermediate consumption for
the firm as the services of the charted accountant are used in the process of producing the final output of a firm.
(v)Payment of a corporate tax by a firm.
NO,Payment of a corporate tax by a firm for is not included in national income as it is transfermade from the
firm to the government. However, corporate tax as a part of profits is included in finding out the income
generated by the firm
(vi)Purchase of refrigerator by a firm for own use.
Yes, Purchase of refrigerator by a firm own use is included as a part of gross domestic fixed capital formation in
the expenditure method of measuring national income as refrigerator is a capital good for a firm.
8-Giving reason explain how should the following be treated in estimating gross domestic
product at market price?
(i)Fees to a mechanic paid by a firm.
Fee to a mechanic paid by a firm is intermediate consumption expenditure of a firm.Since inclusion of
intermediate consumption expenditure leads to double counting, itwill not be included in estimating GDP at
market price.
(ii)Interest paid by an individual on a car loan taken from a bank
Interest paid by an individual on a car loan taken from a bank will not be included in estimating GDP at market
price since loan is used for consumption purpose and not for production purpose.
(iii) Expenditure on purchasing a car for use by a firm
A car is a capital good for a firm therefore expenditure on purchasing a car for use by a firm will be a part of
gross domestic fixed capital formation and will be included in estimating GDP at the market price.
of a country and normal resident of some other country. For example: A larger number of Indian Nationals have
settled in USA, England etc. as residents (not as nationals) of those countries. For India, they are non-resident
Indians but are nationals.
9. If Real GDP is 200 and Price Index (with base = 100) is 110, calculate Nominal GDP.
Real GDP = Nominal GDP x100
Price Index Nominal GDP= 220
55
10. Define externalities. Give an example of negative externality. What is its impact on welfare?
(a) When the activities of one result in benefits or harms to others with no payment received for the benefit
and no payment made for the harm done, such benefits and harms are called externalities. Activities resulting in
benefits to others are called positive externalities and increase welfare whereas those resulting in harm to
others are called negative externalities and thus decrease welfare.
(b) GDP does not take into account negative externalities. For example, factories produce goods but at the same
time create pollution of water and air. Due to pollution of water and air, people suffer from various diseases like
asthma, diarrhea, bronchitis etc which reduces welfare. Therefore, taking only GDP as an index of welfare
overstates welfare.
11-“All capital goods are producer goods but all producer goods are not capital goods.” Explain with the help
of example.
Capital good- Which are repetitively used in the process of production. Example- Machines.
Producer goods- All the goods used by the producer. Example- Machines, raw materials, plant, buildings
etc.Raw materials and low value goods such as screws, nuts & bolts are producer goods but not capital
goods.

56
UNIT-6
MONEY AND BANKING
Money: Money refers to a thing, which is generally accepted as a medium of exchange and act as
measure and store of value.
Barter System: The direct exchange of goods for goods without the use of money called barter system.
Bank A bank is on institution, which accepts deposits from the public and advances loans to others
High Powered Money-High powered money or monetary base refers to the total liability of the monetary
authority of the country i.e. Central Bank (RBI). It consists of currency (notes and coins in circulation with the
public and vault cash of commercial banks) and deposits held by Government of India and commercial banks
with RBI.
Money multiplier-Total deposits created due to a new deposit in bank is many times the initial deposit. The
multiple by which deposits can increase due to an initial deposit is called money multiplier.
Money multiplier =1/LRR, where LRR is legal reserve ratio.
Demand deposits-refers to the chequable deposits which are repayable by the banks on demand They do
not carry any interest and the depositor can make any number of transactions for deposit or withdrawal of
money.
Official reserves-Transactions by a central bank that cause changes in its official reservesThese are usually
purchases or sales of its own currency in the exchange marketin exchange for foreign currencies or other foreign-
currency-denominated assets. They may be Autonomous Receipts and Autonomous Payments, disequilibrium
between which may occur as deficit/surplus in balance of payment.
Marginal requirement- refers to the difference between market value of the
security offered for loans and the amount of loans offered by the commercial banks. The central bank fixes the
margin requirements and under deflationary conditions central bank reduces the margin requirements
1-What are the draw backs of barter system?
a)Lack of double coincidence of wants:The lack of double coincidence of wants is the major drawback of the barter
system. It is very rare when the owner of some goods of services could find someone who wanted his
goods and services and possessed that goods or services that the first person wanted. No exchange is
possible if the double coincidence of want is there.
b)Lack of common measure value:In the absence of common of a common unit of measurement, the value of goods &
services cannot be measured.
c)Lack of standard for deferred payment:Barter system lacks any satisfactory unit to engage in contracts involving future
payments. In such a system future payments would have to be stated in specific goods or services which
may involve disagreement over the quality of goods.
d)Lack of store of value:Barter system does not provide any method of storing purchasing power for future use. It can be
stored only in forms of commodities which is subject to many difficulties.
2.Explain the main functions of money in an economic system? How does money overcome
the draw backs of Barter system,
a)Money as a medium of exchange:-Money by serving as a medium of exchange has reduced the time and energy spent in
barter system. Money acting as an intermediary has facilitated trade and thus exchange between different group of
people.
b)Money as a unit of value:-Money services as a unit of value in terms of which the value of all goods and services are
measured. The prices of all goods & services can be fixed in terms of money and the problem of expressing of the value of
each commodity in terms of quantities of other goods can be avoided.
c)Money as a standard of deferred payments:-Money performs the function of being the unit in terms of which deferred
or future payments are stated. The value of money is more stable in comparison to value of other commodities.
Moreover it has the quality of general acceptability.
57
d)Money as a store of value:-Money also perform the function of serving as a store of value. The holders of money are holders of generalized purchasing power that can be spend in future.
3-Explain the Contingent functions of the money.
i-Distribution of National Income: Money facilitates the division of national income between people. Total output of the
country is jointly produced by a number of people as workers, land owners, capitalists, and entrepreneurs, and, in turn, will
have to be distributed among them. Money helps in the distribution of national product through the system of wage, rent,
interest and profit.
ii-Maximization of Satisfaction:Money helps consumers and producers to maximize their benefits. A consumer maximizes
his satisfaction by equating the prices of each commodity (expressed in terms of money) with its marginal utility. Similarly, a
producer maximizes his profit by equating the marginal productivity of a factor unit to its price.
iii-Basis of Credit System: Credit plays an important role in the modern economic system and money constitutes the basis
of credit. People deposit their money (saving) in the banks and on the basis of these deposits, the banks create credit.
iv-Liquidity to Wealth: Money imparts liquidity to various forms of wealth. When a person holds wealth in the form of
money, he makes it liquid. In fact, all forms of wealth (e.g., land, machinery, stocks, stores, etc.) can be converted into
money.
4. Difference between central bank and commercial bank.
Central bank Commercial bank
1. Central bank is an apex Institution of monetary and Banking structure of the country.
1. Commercial bank is a bank which deals in money and credit for the purpose of earning profit.
2. Its main objective is to promote social welfare.
2. Its main object is to earn profit.
3. It is generally owned by government. May be both privately owned or government owed institutions.
4. It has got the monopoly right of note issue.
Commercial banks do not have such rights.
5 Explain about the functions of Central Bank.
1. Issue of Currency: The Central Bank is given the monopoly of issuing currency in order to
secure control over volume currency and credit. These notes are circulated through out due
country as legal tender money. It has to keep a reserve in the form if gold and foreign securities
as per the statutory rules against the notes issued by it. It issues notes above Rs.2/-. One Rupee
coins and other small coins are issued by the mints of Government.
2. Bankers to Government: Central Bank acts as the bank of Central and State governments. It
carries out al banking business of Government. Government keep their cash balances in the
current account with Central Bank. Similarly central bank accepts receipts and makes the
payment on behalf of the Government. Also Central bank carries out exchange, remittances and
other banking operation on behalf of Government. Central Bank gives the loans and advances for
a short period to the Governments. It also manages the public debt of the country.
3. Bankers Bank & Supervisor: All the scheduled banks are controlled and supervised by the
Central Bank. These banks are required to keep certain percentage of their deposits with Central
Bank. They can take loans from the Central Bank.
4. Controller of Credit & Money Supply: Central Bank regulates the supply of money and
credit according to the interest of the country. It follows various instruments like (i) Bank rate, (ii)
Open Market operations (iii) Cash reserve ratio, (iv) Moral suasion (v) Marginal requirements.
They are the instruments of Monitory policy.
5. Exchange Control:It maintains the external value of currency. Every citizen should deposit
foreign currency they earn with RBI and they can get foreign currency from RBI with application.
6. Lender of Last Resort: Scheduled banks can take the loans by rediscounting first class bills or short
term approved securities, whenever they do not get funds from any other sources.
58
7. Custodian of Foreign Exchange Balance: Central Bank maintains the balance of foreign
exchange gold and bullions.
8. Clearing house function: Central Bank clears the cheques received by a bank belongs to other
banks issued by the customers without delay.
9. Collection and publication of data: It collects, completes the data regarding the other banks and
publishes this information.
6. What is money supply? Describe alternative measures of money supply used by R.B.I?
The supply of money means the total stock of all forms of money (Paper money, coins, and bank
deposits) which are held by the public at any particular point of time. It is a stock concept.
Measures of Money Supply: RBI uses four measures of money supply M1, M2, M3 & M4.
i) M1 = C+DD+OD
Where C is currency held with public
DD is Demand Deposits in banks
OD stands for Other Deposits with RBI of all RBI of all Economic units except Government and
bank.
Foreign Central Banks, Government, IMR, IBR etc.
ii) M2 = M1 + Saving deposits with post-office saving etc.
iii) M3 = M2 + Net time deposits of banks.
iv) M4 = M3 + Total deposits with Post-office saving organization (excluding NSC)
In fact a great deal of debate is still going on what constitutes money supply M1+M2 may be
treated as measures of Narrow money. Where as M3+M4 as measures of Board money. In
practice M3 is widely used as measure of money supply which is also called Aggregate monetary
resources of the society.
7. Explain Quantitative credit control measures used by Central Bank (RBI)
1. Cash Reserve Ratio (CRR) :- It is of certain ratio of commercial banks net demand deposits & times liabilities
which it has to keep with central bank RBI as cash. If RBI increases CRR, Banks have to keep larger percentage of
their deposits with RBI, their credit giving ability decreases and money supply decreases. Conversely, if RBI
decreases CRR, money supply Increases.
2, Statutory Liquidity Ratio (SLR) :- It is the ratio or percentage of net total demand & time liabilities of
commercial banks which they have to keep in form of liquid assets as excess reserves, they have to invest in
government securities or in securities approved by RBI and current account balances with other banks. If RBI
increases SLR then credit giving ability of bank decreases and money supply decreases. if RBI decreases SLR
banks credit giving ability and thus money supply increases.
3. Open Market Operations (OMO) :- It is the buying and selling of government security by the Central Bank
from/to the public and banks on its own account.
Sale of government securities will reduce reserves.
* RBI sells securities Bank gives RBI a cheque for the securities.
* The RBI collects the amount by reducing the bank’s reserves by the particular amount.
* This directly reduces bank’s ability to give credit.
* Therefore this decreases money supply in the economy.
When RBI buys securities from banks
* RBI gives the bank a cheque drawn on itself in the payment for the securities.
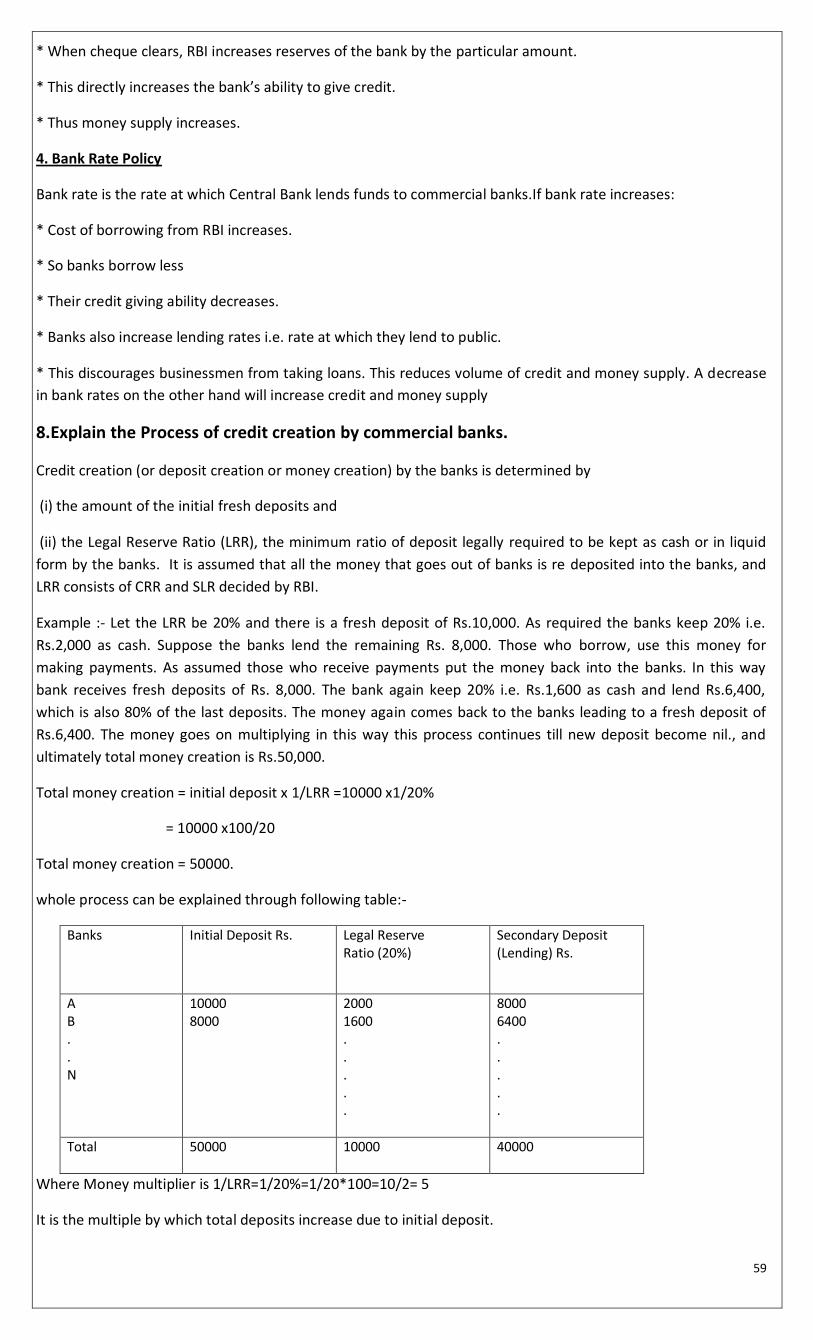
59
* When cheque clears, RBI increases reserves of the bank by the particular amount.
* This directly increases the bank’s ability to give credit.
* Thus money supply increases.
4. Bank Rate Policy
Bank rate is the rate at which Central Bank lends funds to commercial banks.If bank rate increases:
* Cost of borrowing from RBI increases.
* So banks borrow less
* Their credit giving ability decreases.
* Banks also increase lending rates i.e. rate at which they lend to public.
* This discourages businessmen from taking loans. This reduces volume of credit and money supply. A decrease
in bank rates on the other hand will increase credit and money supply
8.Explain the Process of credit creation by commercial banks.
Credit creation (or deposit creation or money creation) by the banks is determined by
(i) the amount of the initial fresh deposits and
(ii) the Legal Reserve Ratio (LRR), the minimum ratio of deposit legally required to be kept as cash or in liquid
form by the banks. It is assumed that all the money that goes out of banks is re deposited into the banks, and
LRR consists of CRR and SLR decided by RBI.
Example :- Let the LRR be 20% and there is a fresh deposit of Rs.10,000. As required the banks keep 20% i.e.
Rs.2,000 as cash. Suppose the banks lend the remaining Rs. 8,000. Those who borrow, use this money for
making payments. As assumed those who receive payments put the money back into the banks. In this way
bank receives fresh deposits of Rs. 8,000. The bank again keep 20% i.e. Rs.1,600 as cash and lend Rs.6,400,
which is also 80% of the last deposits. The money again comes back to the banks leading to a fresh deposit of
Rs.6,400. The money goes on multiplying in this way this process continues till new deposit become nil., and
ultimately total money creation is Rs.50,000.
Total money creation = initial deposit x 1/LRR =10000 x1/20%
= 10000 x100/20
Total money creation = 50000.
whole process can be explained through following table:-
Banks Initial Deposit Rs. Legal Reserve Ratio (20%)
Secondary Deposit (Lending) Rs.
A B . . N
10000 8000
2000 1600 . . . . .
8000 6400 . . . . .
Total 50000 10000 40000
Where Money multiplier is 1/LRR=1/20%=1/20*100=10/2= 5
It is the multiple by which total deposits increase due to initial deposit.
60
Unit-7
Determination of Income and Employment
Household consumption expenditure is the expenditure incurred by the household on the purchase of goods and
services to satisfy their wants.
Investment expenditure refers to the expenditure incurred by the private firms and government on the purchase
of capital goods such as plant and equipment.
Government consumption expenditure refers to the expenditure incurred by the government on the purchase of
goods and services.
Net export refers to the difference between export and import.
AD=C+I+G+(x-m).
In a two sector economy AD =C+I.
Aggregate supply is the sum total of consumption expenditure and saving.
AS=C+S
Ex ante investment-is the planned investment which the planner intends to invest at different level of income and
employment in the economy.
Ex post investment-may differ from ex ante investment when the actual sales differ from the planned sales and
the firms thus face unplanned addition or reduction of inventories.
Involuntary unemployment- refers to a situation in which people are ready to work at prevailing wage rate, but
do not find work.
Full employment- refers to a situation in which no one is unemployed i.e.…there is no involuntary
unemployment.
According to Keynes full employment signifies a level of employment where increase in aggregate demand does
not lead to an increase in the level of output and employment.
Excess demand -is a situation, where aggregate demand is more than aggregate supply at the level of full
employment. It creates inflationary gap
Deficient Demand- is a situation, where aggregate demand is less than aggregate supply at the level of full
employment. It creates deflationary gap
Investment- Investment means addition to the stock of capital good, in the nature of structures, equipment or
inventory.
Investment demand function- The relationship between investment demand and the rate of interest is called
investment demand function.
Paradox of Thrift :-It implies that if all the people of an economy increase the proportion of income they save,
then the total volume of savings in that economy will not increase. Total savings will either decrease or remain
same.
IMPORTANT FORMULAE.
AD=C+I (two sector economy).
APC=C/Y.
APS=S/Y.
APC+APS=1
MPC=∆C/∆Y
MPS=∆S/∆Y
MPS+MPC=1 AND 1-MPC=MPS
K=∆Y/∆C or K=1/MPS or K=I/I-MPC
C= ~c+b(Y)
S=-a+(1-b)Y
-a= negative saving
(1-b)=MPS
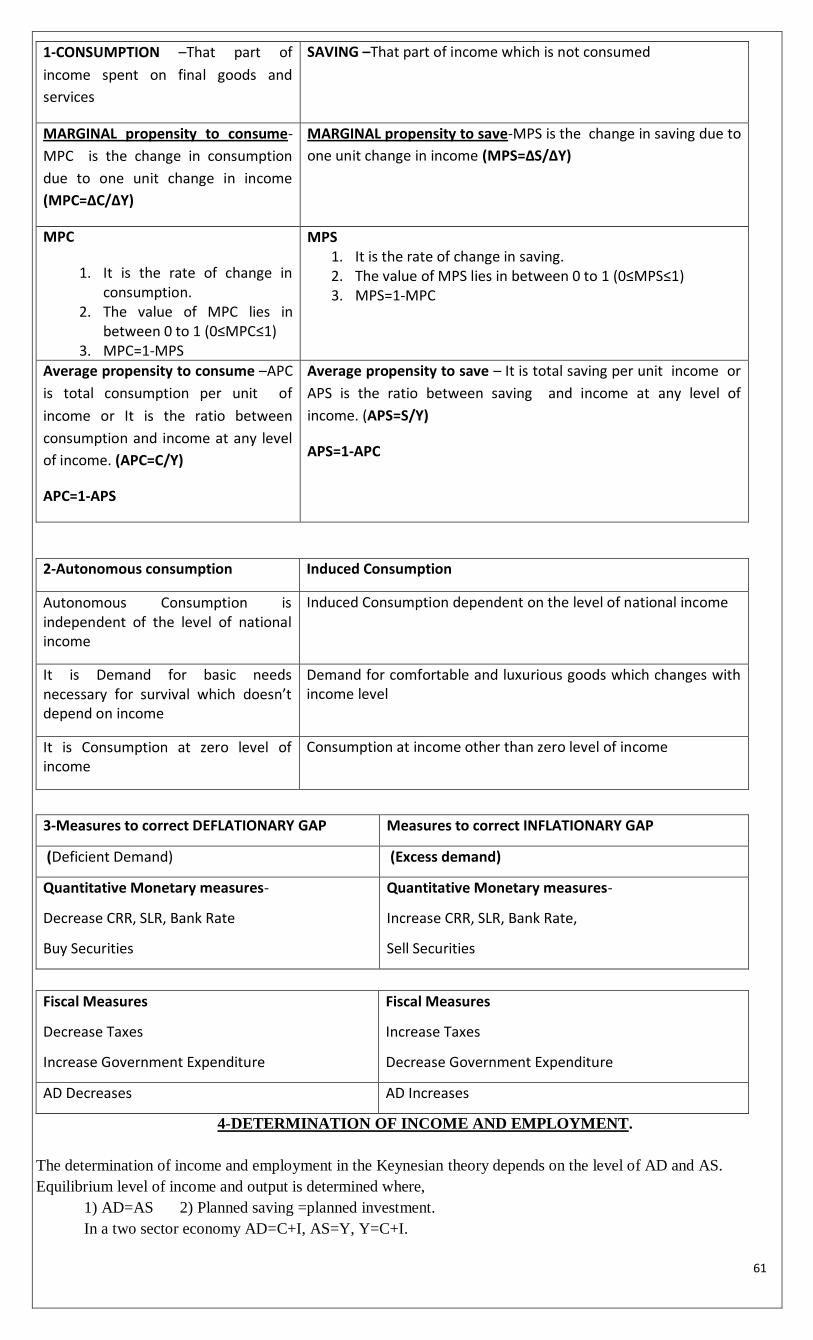
61
1-CONSUMPTION –That part of
income spent on final goods and
services
SAVING –That part of income which is not consumed
MARGINAL propensity to consume-
MPC is the change in consumption
due to one unit change in income
(MPC=∆C/∆Y)
MARGINAL propensity to save-MPS is the change in saving due to
one unit change in income (MPS=∆S/∆Y)
MPC
1. It is the rate of change in consumption.
2. The value of MPC lies in between 0 to 1 (0≤MPC≤1)
3. MPC=1-MPS
MPS 1. It is the rate of change in saving. 2. The value of MPS lies in between 0 to 1 (0≤MPS≤1) 3. MPS=1-MPC
Average propensity to consume –APC
is total consumption per unit of
income or It is the ratio between
consumption and income at any level
of income. (APC=C/Y)
APC=1-APS
Average propensity to save – It is total saving per unit income or
APS is the ratio between saving and income at any level of
income. (APS=S/Y)
APS=1-APC
2-Autonomous consumption Induced Consumption
Autonomous Consumption is independent of the level of national income
Induced Consumption dependent on the level of national income
It is Demand for basic needs necessary for survival which doesn’t depend on income
Demand for comfortable and luxurious goods which changes with income level
It is Consumption at zero level of income
Consumption at income other than zero level of income
3-Measures to correct DEFLATIONARY GAP Measures to correct INFLATIONARY GAP
(Deficient Demand) (Excess demand)
Quantitative Monetary measures-
Decrease CRR, SLR, Bank Rate
Buy Securities
Quantitative Monetary measures-
Increase CRR, SLR, Bank Rate,
Sell Securities
Fiscal Measures
Decrease Taxes
Increase Government Expenditure
Fiscal Measures
Increase Taxes
Decrease Government Expenditure
AD Decreases AD Increases
4-DETERMINATION OF INCOME AND EMPLOYMENT.
The determination of income and employment in the Keynesian theory depends on the level of AD and AS.
Equilibrium level of income and output is determined where,
1) AD=AS 2) Planned saving =planned investment.
In a two sector economy AD=C+I, AS=Y, Y=C+I.
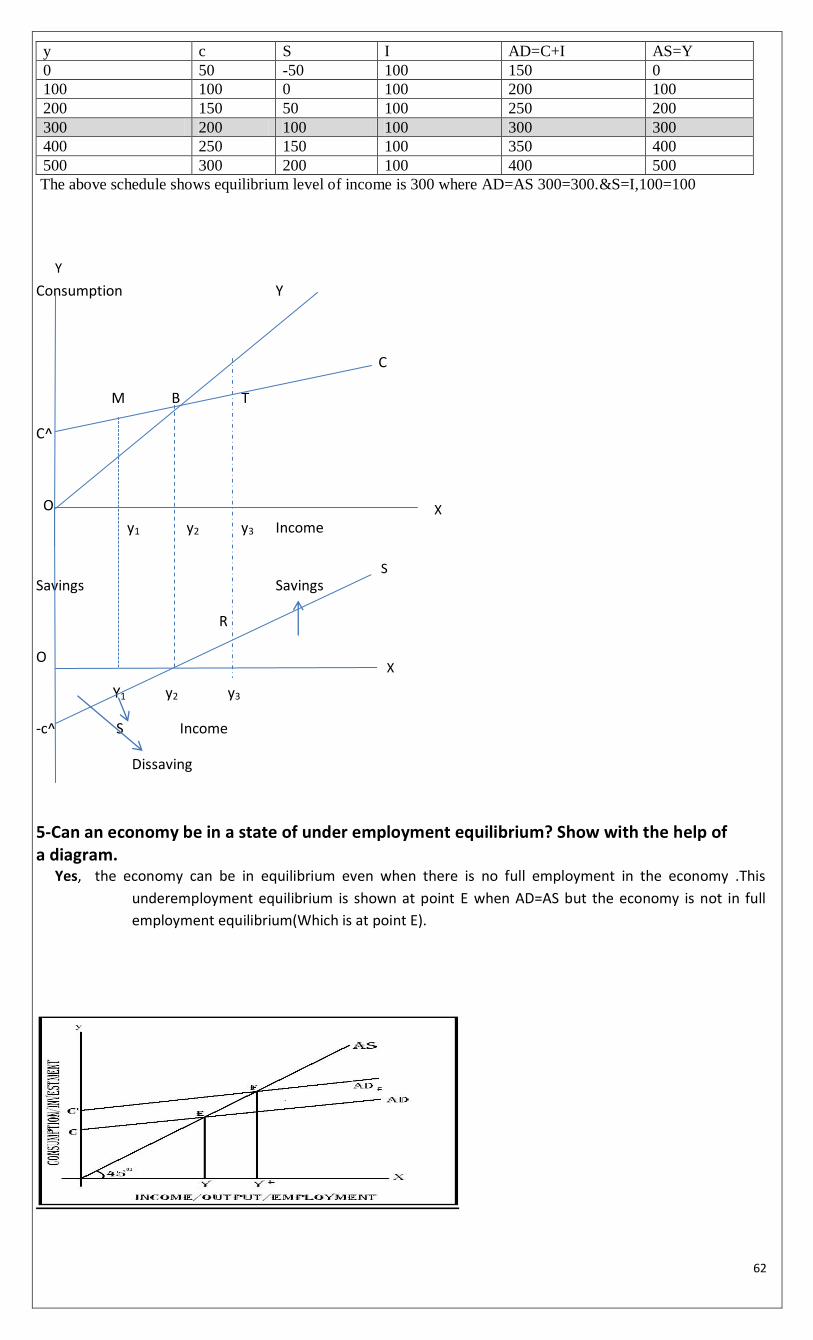
62
y c S I AD=C+I AS=Y
0 50 -50 100 150 0
100 100 0 100 200 100
200 150 50 100 250 200
300 200 100 100 300 300
400 250 150 100 350 400
500 300 200 100 400 500
The above schedule shows equilibrium level of income is 300 where AD=AS 300=300.&S=I,100=100
Consumption Y
C
M B T
C^
O
y1 y2 y3 Income
Savings Savings
R
O
Y1 y2 y3
-c^ S Income
Dissaving
5-Can an economy be in a state of under employment equilibrium? Show with the help of a diagram.
Yes, the economy can be in equilibrium even when there is no full employment in the economy .This
underemployment equilibrium is shown at point E when AD=AS but the economy is not in full
employment equilibrium(Which is at point E).
Y
X
X
S
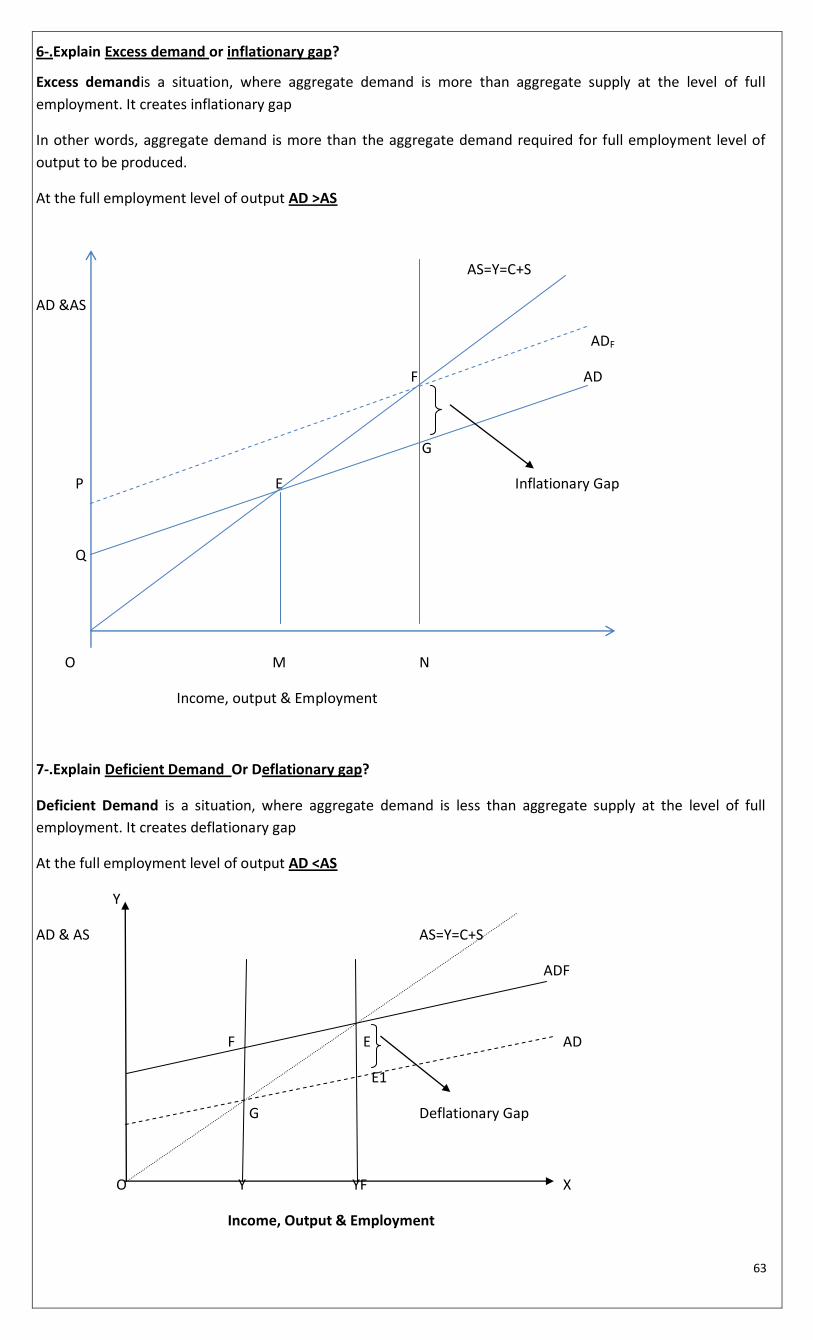
63
6-.Explain Excess demand or inflationary gap?
Excess demandis a situation, where aggregate demand is more than aggregate supply at the level of full
employment. It creates inflationary gap
In other words, aggregate demand is more than the aggregate demand required for full employment level of
output to be produced.
At the full employment level of output AD >AS
AS=Y=C+S
AD &AS
ADF
F AD
G
P E Inflationary Gap
Q
O M N
Income, output & Employment
7-.Explain Deficient Demand Or Deflationary gap?
Deficient Demand is a situation, where aggregate demand is less than aggregate supply at the level of full
employment. It creates deflationary gap
At the full employment level of output AD <AS
Y
AD & AS AS=Y=C+S
ADF
F E AD
E1
G Deflationary Gap
O Y YF X
Income, Output & Employment
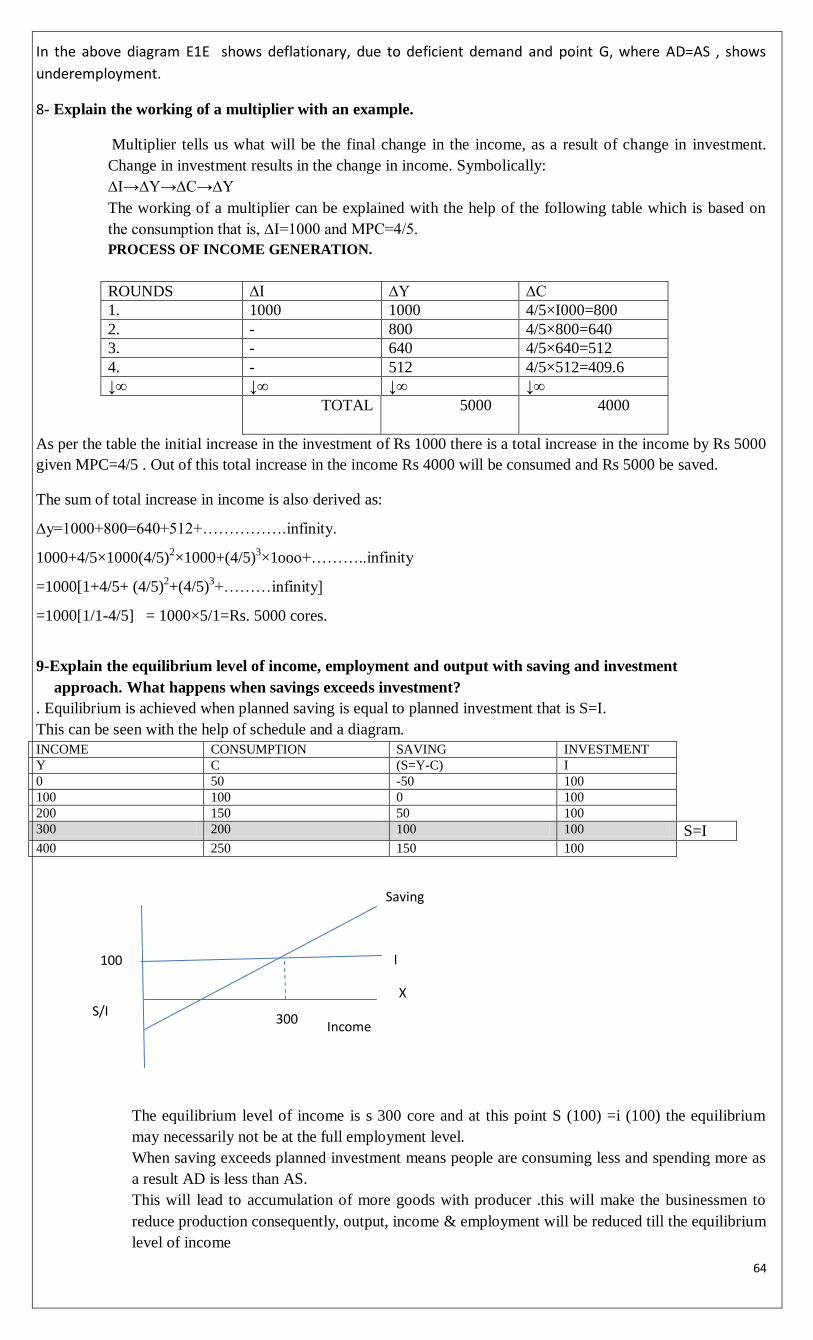
64
In the above diagram E1E shows deflationary, due to deficient demand and point G, where AD=AS , shows
underemployment.
8- Explain the working of a multiplier with an example.
Multiplier tells us what will be the final change in the income, as a result of change in investment.
Change in investment results in the change in income. Symbolically:
∆I→∆Y→∆C→∆Y
The working of a multiplier can be explained with the help of the following table which is based on
the consumption that is, ∆I=1000 and MPC=4/5.
PROCESS OF INCOME GENERATION.
ROUNDS ∆I ∆Y ∆C
1. 1000 1000 4/5×I000=800
2. - 800 4/5×800=640
3. - 640 4/5×640=512
4. - 512 4/5×512=409.6
↓∞ ↓∞ ↓∞ ↓∞
TOTAL 5000 4000
As per the table the initial increase in the investment of Rs 1000 there is a total increase in the income by Rs 5000
given MPC=4/5 . Out of this total increase in the income Rs 4000 will be consumed and Rs 5000 be saved.
The sum of total increase in income is also derived as:
∆y=1000+800=640+512+…………….infinity.
1000+4/5×1000(4/5)2×1000+(4/5)
3×1ooo+………..infinity
=1000[1+4/5+ (4/5)2+(4/5)
3+………infinity]
=1000[1/1-4/5] = 1000×5/1=Rs. 5000 cores.
9-Explain the equilibrium level of income, employment and output with saving and investment
approach. What happens when savings exceeds investment?
. Equilibrium is achieved when planned saving is equal to planned investment that is S=I.
This can be seen with the help of schedule and a diagram.
INCOME CONSUMPTION SAVING INVESTMENT
Y C (S=Y-C) I
0 50 -50 100
100 100 0 100
200 150 50 100
300 200 100 100 S=I 400 250 150 100
The equilibrium level of income is s 300 core and at this point S (100) =i (100) the equilibrium
may necessarily not be at the full employment level.
When saving exceeds planned investment means people are consuming less and spending more as
a result AD is less than AS.
This will lead to accumulation of more goods with producer .this will make the businessmen to
reduce production consequently, output, income & employment will be reduced till the equilibrium
level of income
Saving
100 I
X
300 Income
S/I
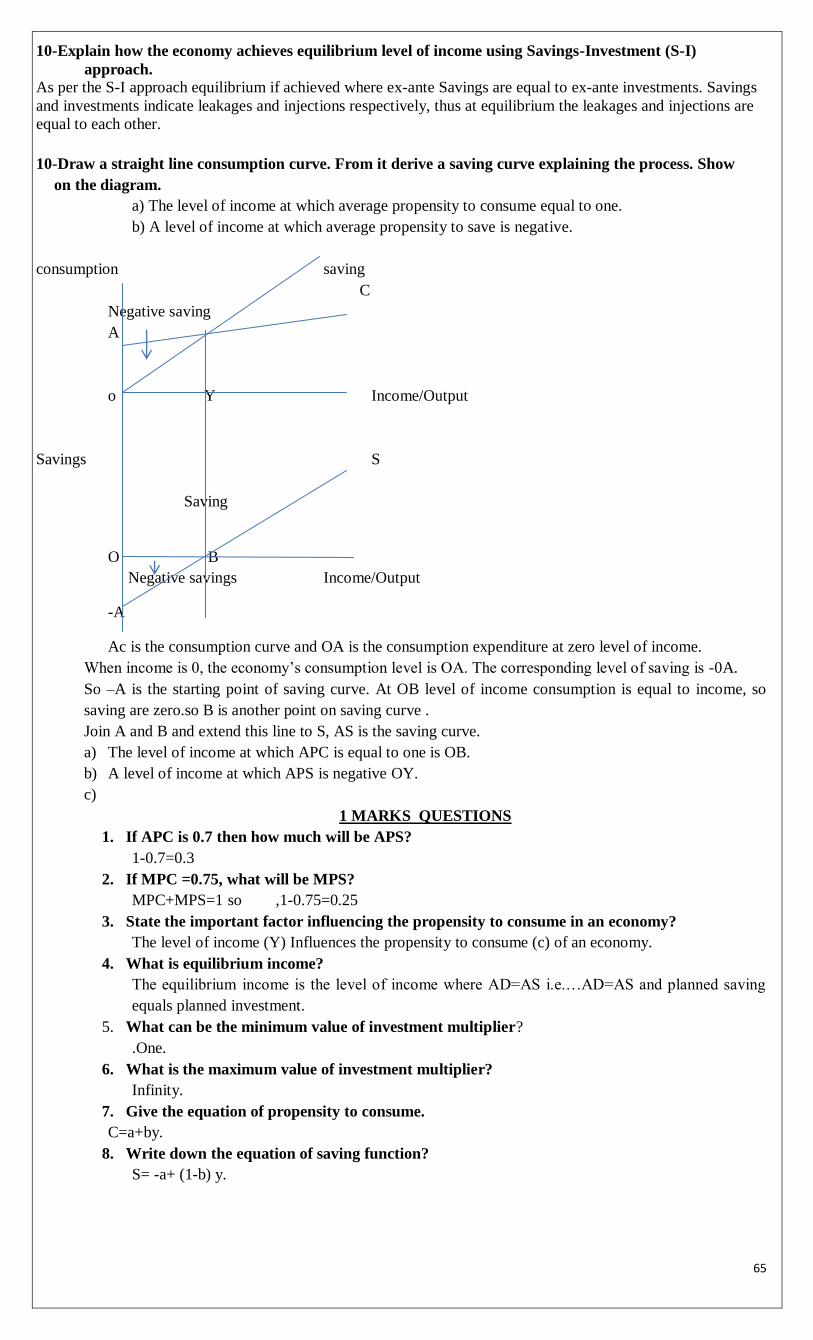
65
10-Explain how the economy achieves equilibrium level of income using Savings-Investment (S-I)
approach.
As per the S-I approach equilibrium if achieved where ex-ante Savings are equal to ex-ante investments. Savings
and investments indicate leakages and injections respectively, thus at equilibrium the leakages and injections are
equal to each other.
10-Draw a straight line consumption curve. From it derive a saving curve explaining the process. Show
on the diagram.
a) The level of income at which average propensity to consume equal to one.
b) A level of income at which average propensity to save is negative.
consumption saving
C
Negative saving
A
o Y Income/Output
Savings S
Saving
O B
Negative savings Income/Output
-A
Ac is the consumption curve and OA is the consumption expenditure at zero level of income.
When income is 0, the economy‟s consumption level is OA. The corresponding level of saving is -0A.
So –A is the starting point of saving curve. At OB level of income consumption is equal to income, so
saving are zero.so B is another point on saving curve .
Join A and B and extend this line to S, AS is the saving curve.
a) The level of income at which APC is equal to one is OB.
b) A level of income at which APS is negative OY.
c)
1 MARKS QUESTIONS
1. If APC is 0.7 then how much will be APS?
1-0.7=0.3
2. If MPC =0.75, what will be MPS?
MPC+MPS=1 so ,1-0.75=0.25
3. State the important factor influencing the propensity to consume in an economy?
The level of income (Y) Influences the propensity to consume (c) of an economy.
4. What is equilibrium income?
The equilibrium income is the level of income where AD=AS i.e.…AD=AS and planned saving
equals planned investment.
5. What can be the minimum value of investment multiplier?
.One.
6. What is the maximum value of investment multiplier?
Infinity.
7. Give the equation of propensity to consume.
C=a+by.
8. Write down the equation of saving function?
S= -a+ (1-b) y.
66
UNIT-8
GOVERNMENT BUDGET
1.Budget.It is an annual statement of the estimated Receipts and Expenditures of the Government over the fiscal
year which runs from April –I to March 31.
2-Direct Tax: - These are those taxes levied immediately on the property and Income of persons, and those that
are paid directly by the consumers to the state.
Examples: Income Tax, Wealth Tax, Corporation Tax etc.
3-Indirect Taxes:These are those taxes that affect the income and property of persons through their consumption
expenditure. Indirect taxes are those taxes levied on one person but paid by another person.
Examples: Customs duties, excise duties, sales tax, service tax etc.,
4- Revenue Expenditure:-It is the expenditure incurred for the normal running of government departments and
provision of various services like interest charges on debt, subsidies etc.,
5-Capital Expenditure:-It consists mainly of expenditure on acquisition of assets like land, building, machinery,
equipment etc., and loans and advances granted by the Central Government to States & Union Territories.
6- Budget Deficit:-It is the difference between the total expenditure, current revenue and net internal and external
capital receipts of the government.
Formulae: B.D = B.E > B.R (B.D= Budget Deficit, B.E. Budget Expenditure B.R= Budget Revenue
7-Fiscal Deficit:-It is the difference between the total expenditure of the government, the revenue receipts PLUS
those capital receipts which finally accrue to the government.
Formulae: F.D = B.E - B.R (B.E > B.R. other than borrowings) F.D=Fiscal Deficit,
B.E= Budget Expenditure, B.R. = Budget Receipts.
8-Revenue Deficit: - It is the excess of governments revenue expenditures over revenue receipts.
Formulae: R.D= R.E – R.R., When R.E > R.R., R.D= Revenue Deficit, R.E= Revenue Expenditure, R.R. =
Revenue Receipts.
9-Primary Deficit: - It is the fiscal deficit MINUS Interest payments.
Formulae: P.D= F.D – I.P, P.D= Primary Deficit, F.D= Fiscal Deficit, I.P= Interest Payment.
10-Balanced Budget:-It is one where the estimated revenue EQUALS the estimated expenditure.
11-Surplus Budget:-It is one where the estimated revenue is GREATER THAN the estimated expenditures.
12-Deficit Budget:-It is one where the estimated revenue is LESS THAN the estimated expenditure.
13-plan expenditures are estimated after discussions between each of the ministries concerned and the Planning
Commission.
14-Non-plan revenue expenditure is accounted for by interest payments, subsidies (mainly on food and
fertilizers), wage and salary payments to government employees, grants to States and Union Territories
governments, pensions, police, economic services in various sectors, other general services such as tax
collection, social services, and grants to foreign governments.
15-Non-plan capital expenditure mainly includes defence, loans to public enterprises, loans to 6-States, Union
Territories and foreign governments.
16. Developmental expenditure that promote economic growth and development are termed as development
expenditure. Expenditure on infrastructure development, public enterprises or development of agriculture increase
productive capacity in the economy and bring to the government.
17-Non-development expenditure- Expenditures in the nature of consumption such as Defence, interest
payments, expenditure on law and order, public administration, do not create any productive asset which can
bring income or returns to the government are non-development expenditure
18-Public Goods:-The goods which cannot be provided through the market mechanism and hence must be
provided by the government are called public goods
19-Private Goods:-The goods which can be provided through market mechanism i.e.,transaction between
individual consumers and producers are termed as private goods.e.g., food items ,clothes ,shoes, etc.
20 Progressive Tax :-It is a tax that causes relatively less burden on the poor and more on the rich.
21-Regressive tax-It is a tax that causes relatively more burden on the poor and less burden on the rich.
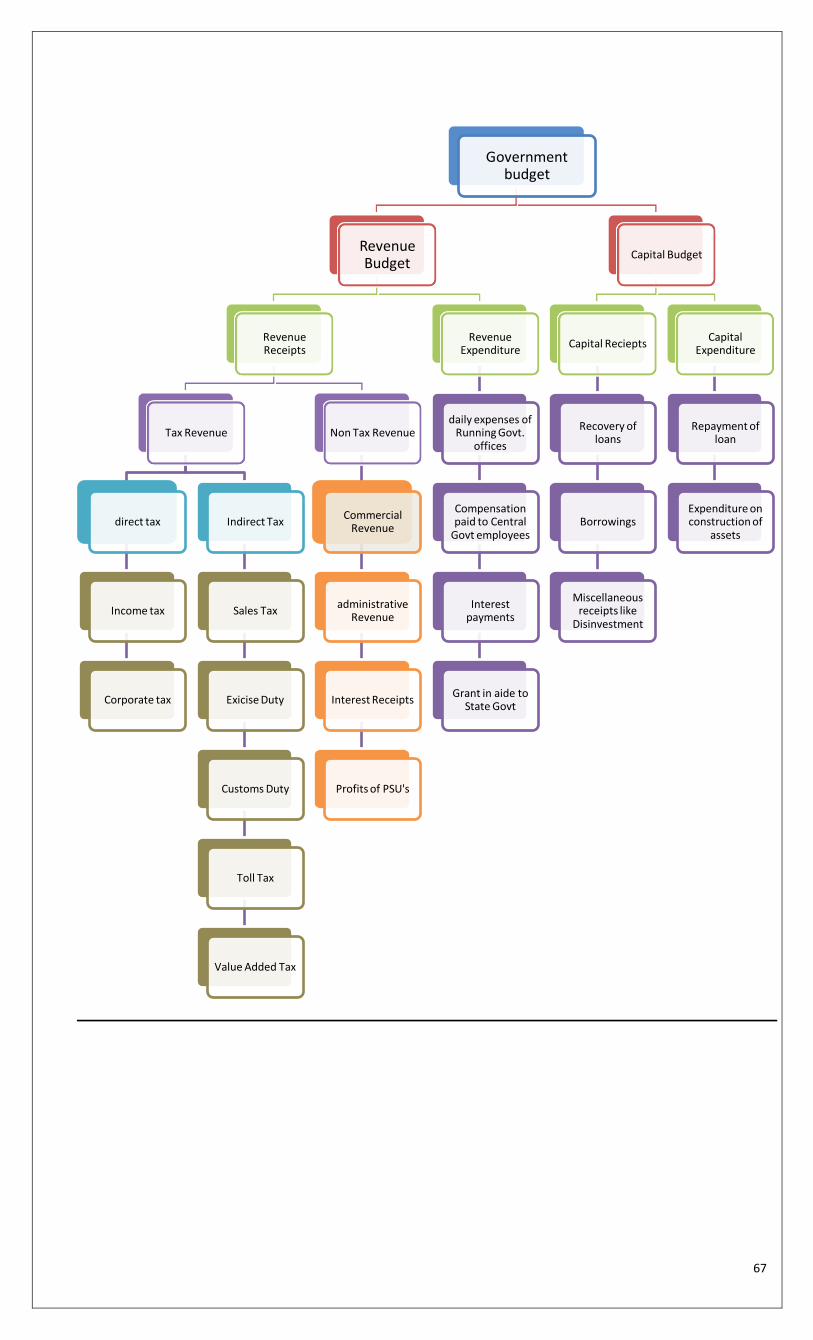
67
Government budget
Revenue Budget
Revenue Receipts
Tax Revenue
direct tax
Income tax
Corporate tax
Indirect Tax
Sales Tax
Exicise Duty
Customs Duty
Toll Tax
Value Added Tax
Non Tax Revenue
Commercial Revenue
administrative Revenue
Interest Receipts
Profits of PSU's
Revenue Expenditure
daily expenses of Running Govt.
offices
Compensation paid to Central
Govt employees
Interest payments
Grant in aide to State Govt
Capital Budget
Capital Reciepts
Recovery of loans
Borrowings
Miscellaneous receipts like
Disinvestment
Capital Expenditure
Repayment of loan
Expenditure on construction of
assets
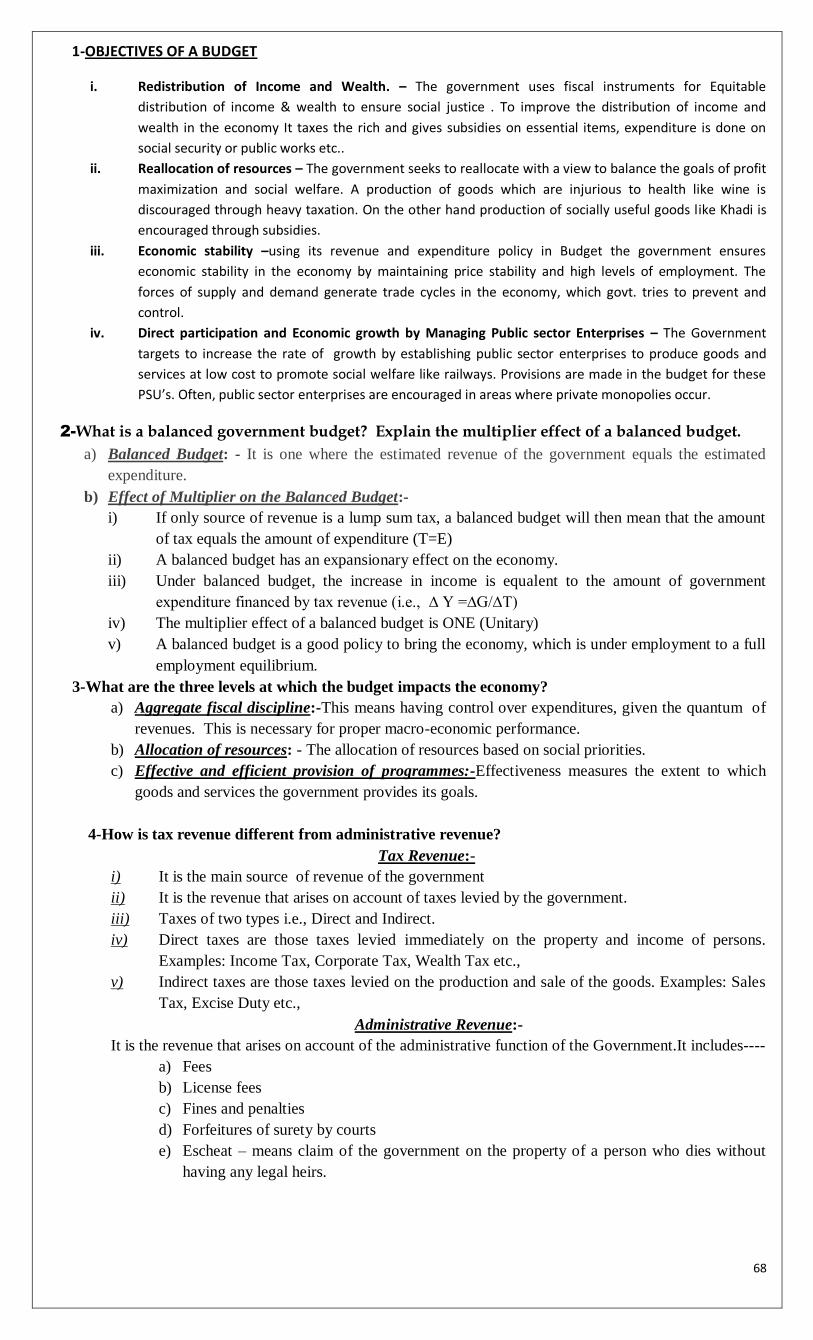
68
1-OBJECTIVES OF A BUDGET
i. Redistribution of Income and Wealth. – The government uses fiscal instruments for Equitable
distribution of income & wealth to ensure social justice . To improve the distribution of income and
wealth in the economy It taxes the rich and gives subsidies on essential items, expenditure is done on
social security or public works etc..
ii. Reallocation of resources – The government seeks to reallocate with a view to balance the goals of profit
maximization and social welfare. A production of goods which are injurious to health like wine is
discouraged through heavy taxation. On the other hand production of socially useful goods like Khadi is
encouraged through subsidies.
iii. Economic stability –using its revenue and expenditure policy in Budget the government ensures
economic stability in the economy by maintaining price stability and high levels of employment. The
forces of supply and demand generate trade cycles in the economy, which govt. tries to prevent and
control.
iv. Direct participation and Economic growth by Managing Public sector Enterprises – The Government
targets to increase the rate of growth by establishing public sector enterprises to produce goods and
services at low cost to promote social welfare like railways. Provisions are made in the budget for these
PSU’s. Often, public sector enterprises are encouraged in areas where private monopolies occur.
2-What is a balanced government budget? Explain the multiplier effect of a balanced budget.
a) Balanced Budget: - It is one where the estimated revenue of the government equals the estimated
expenditure.
b) Effect of Multiplier on the Balanced Budget:-
i) If only source of revenue is a lump sum tax, a balanced budget will then mean that the amount
of tax equals the amount of expenditure (T=E)
ii) A balanced budget has an expansionary effect on the economy.
iii) Under balanced budget, the increase in income is equalent to the amount of government
expenditure financed by tax revenue (i.e., ∆ Y =∆G/∆T)
iv) The multiplier effect of a balanced budget is ONE (Unitary)
v) A balanced budget is a good policy to bring the economy, which is under employment to a full
employment equilibrium.
3-What are the three levels at which the budget impacts the economy?
a) Aggregate fiscal discipline:-This means having control over expenditures, given the quantum of
revenues. This is necessary for proper macro-economic performance.
b) Allocation of resources: - The allocation of resources based on social priorities.
c) Effective and efficient provision of programmes:-Effectiveness measures the extent to which
goods and services the government provides its goals.
4-How is tax revenue different from administrative revenue?
Tax Revenue:-
i) It is the main source of revenue of the government
ii) It is the revenue that arises on account of taxes levied by the government.
iii) Taxes of two types i.e., Direct and Indirect.
iv) Direct taxes are those taxes levied immediately on the property and income of persons.
Examples: Income Tax, Corporate Tax, Wealth Tax etc.,
v) Indirect taxes are those taxes levied on the production and sale of the goods. Examples: Sales
Tax, Excise Duty etc.,
Administrative Revenue:-
It is the revenue that arises on account of the administrative function of the Government.It includes----
a) Fees
b) License fees
c) Fines and penalties
d) Forfeitures of surety by courts
e) Escheat – means claim of the government on the property of a person who dies without
having any legal heirs.
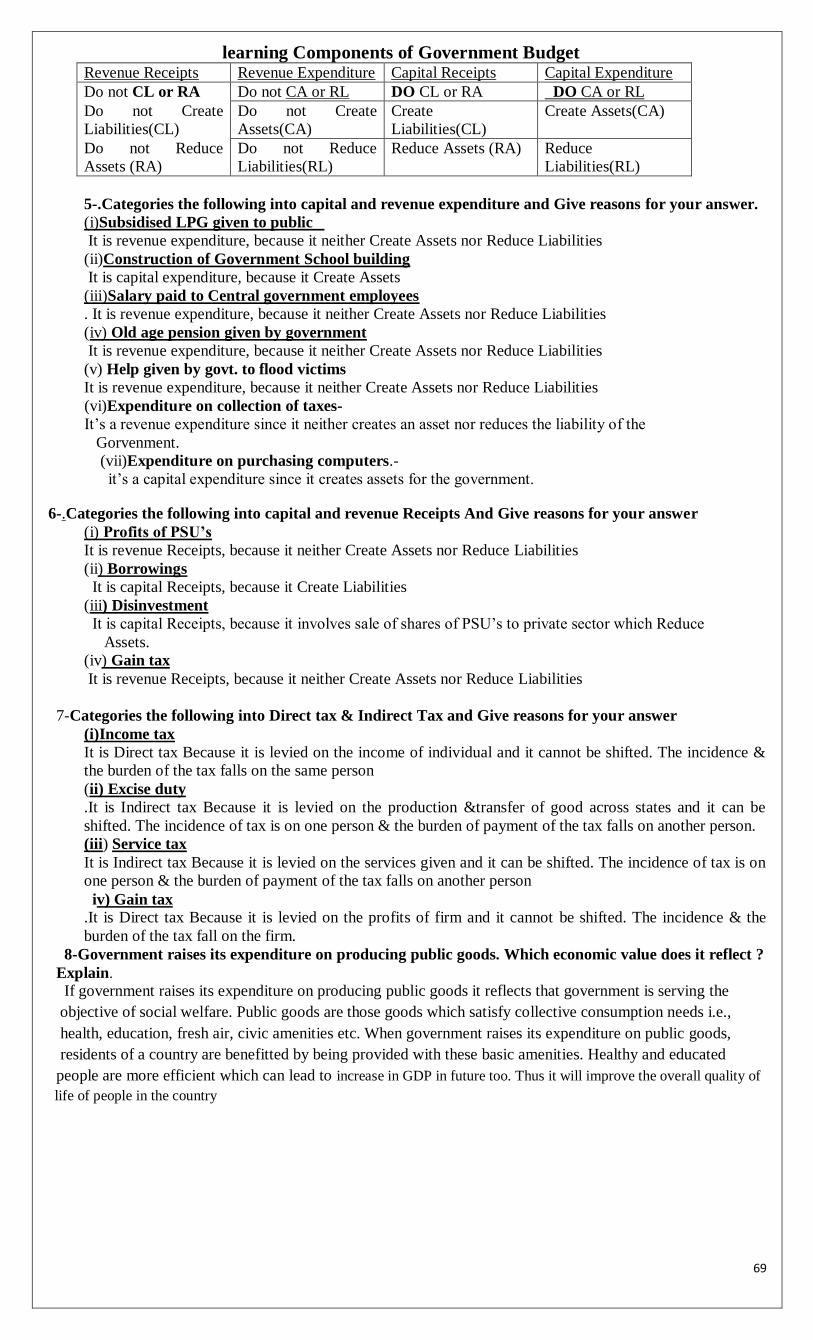
69
learning Components of Government Budget Revenue Receipts Revenue Expenditure Capital Receipts Capital Expenditure
Do not CL or RA Do not CA or RL DO CL or RA DO CA or RL
Do not Create
Liabilities(CL)
Do not Create
Assets(CA)
Create
Liabilities(CL)
Create Assets(CA)
Do not Reduce
Assets (RA)
Do not Reduce
Liabilities(RL)
Reduce Assets (RA) Reduce
Liabilities(RL)
5-.Categories the following into capital and revenue expenditure and Give reasons for your answer.
(i)Subsidised LPG given to public
It is revenue expenditure, because it neither Create Assets nor Reduce Liabilities
(ii)Construction of Government School building
It is capital expenditure, because it Create Assets
(iii)Salary paid to Central government employees
. It is revenue expenditure, because it neither Create Assets nor Reduce Liabilities
(iv) Old age pension given by government
It is revenue expenditure, because it neither Create Assets nor Reduce Liabilities
(v) Help given by govt. to flood victims
It is revenue expenditure, because it neither Create Assets nor Reduce Liabilities
(vi)Expenditure on collection of taxes-
It‟s a revenue expenditure since it neither creates an asset nor reduces the liability of the
Gorvenment.
(vii)Expenditure on purchasing computers.-
it‟s a capital expenditure since it creates assets for the government.
6-.Categories the following into capital and revenue Receipts And Give reasons for your answer
(i) Profits of PSU’s
It is revenue Receipts, because it neither Create Assets nor Reduce Liabilities
(ii) Borrowings
It is capital Receipts, because it Create Liabilities
(iii) Disinvestment
It is capital Receipts, because it involves sale of shares of PSU‟s to private sector which Reduce
Assets.
(iv) Gain tax
It is revenue Receipts, because it neither Create Assets nor Reduce Liabilities
7-Categories the following into Direct tax & Indirect Tax and Give reasons for your answer
(i)Income tax
It is Direct tax Because it is levied on the income of individual and it cannot be shifted. The incidence &
the burden of the tax falls on the same person
(ii) Excise duty
.It is Indirect tax Because it is levied on the production &transfer of good across states and it can be
shifted. The incidence of tax is on one person & the burden of payment of the tax falls on another person.
(iii) Service tax
It is Indirect tax Because it is levied on the services given and it can be shifted. The incidence of tax is on
one person & the burden of payment of the tax falls on another person
iv) Gain tax
.It is Direct tax Because it is levied on the profits of firm and it cannot be shifted. The incidence & the
burden of the tax fall on the firm.
8-Government raises its expenditure on producing public goods. Which economic value does it reflect ?
Explain.
If government raises its expenditure on producing public goods it reflects that government is serving the
objective of social welfare. Public goods are those goods which satisfy collective consumption needs i.e.,
health, education, fresh air, civic amenities etc. When government raises its expenditure on public goods,
residents of a country are benefitted by being provided with these basic amenities. Healthy and educated
people are more efficient which can lead to increase in GDP in future too. Thus it will improve the overall quality of
life of people in the country
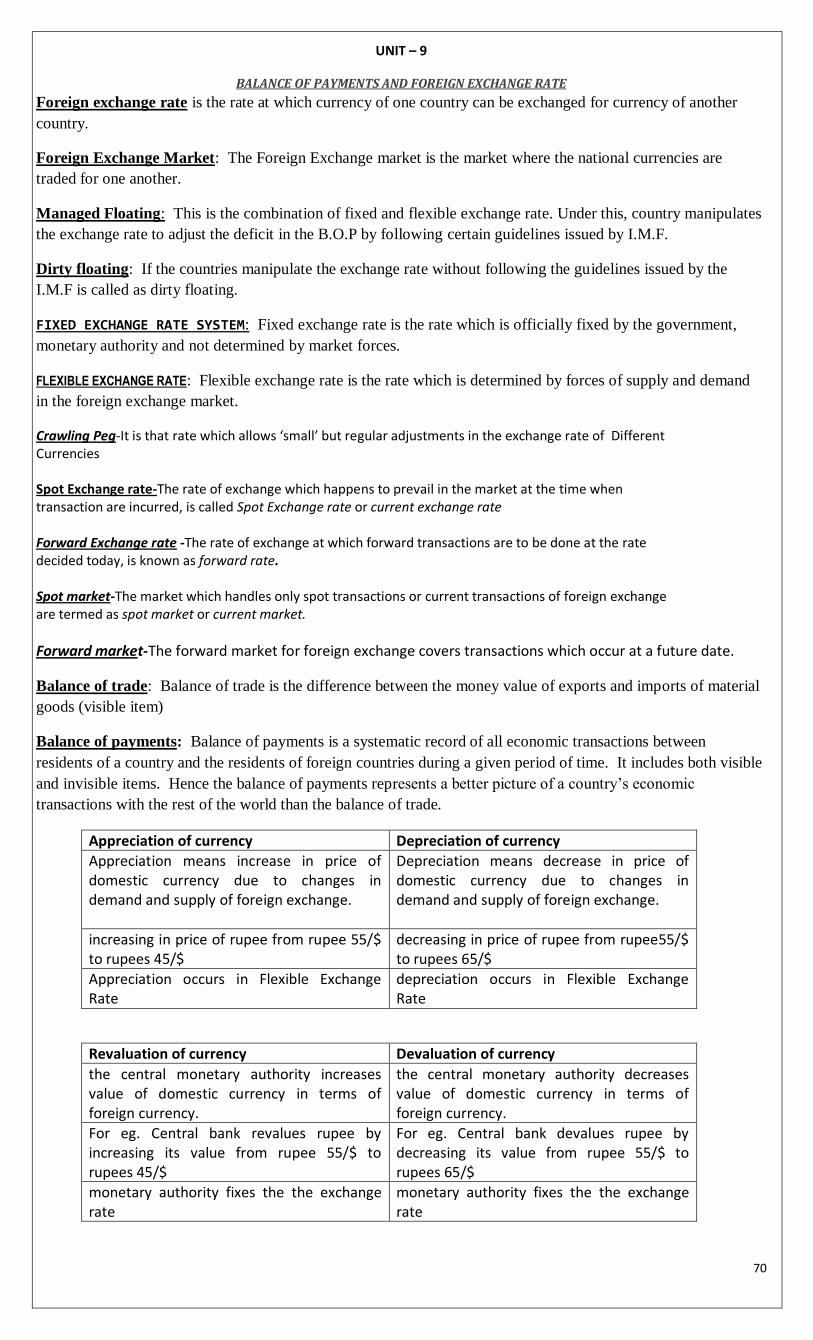
70
UNIT – 9
BALANCE OF PAYMENTS AND FOREIGN EXCHANGE RATE
Foreign exchange rate is the rate at which currency of one country can be exchanged for currency of another
country.
Foreign Exchange Market: The Foreign Exchange market is the market where the national currencies are
traded for one another.
Managed Floating: This is the combination of fixed and flexible exchange rate. Under this, country manipulates
the exchange rate to adjust the deficit in the B.O.P by following certain guidelines issued by I.M.F.
Dirty floating: If the countries manipulate the exchange rate without following the guidelines issued by the
I.M.F is called as dirty floating.
FIXED EXCHANGE RATE SYSTEM: Fixed exchange rate is the rate which is officially fixed by the government,
monetary authority and not determined by market forces.
FLEXIBLE EXCHANGE RATE: Flexible exchange rate is the rate which is determined by forces of supply and demand
in the foreign exchange market.
Crawling Peg-It is that rate which allows ‘small’ but regular adjustments in the exchange rate of Different Currencies Spot Exchange rate-The rate of exchange which happens to prevail in the market at the time when transaction are incurred, is called Spot Exchange rate or current exchange rate Forward Exchange rate -The rate of exchange at which forward transactions are to be done at the rate decided today, is known as forward rate. Spot market-The market which handles only spot transactions or current transactions of foreign exchange are termed as spot market or current market.
Forward market-The forward market for foreign exchange covers transactions which occur at a future date.
Balance of trade: Balance of trade is the difference between the money value of exports and imports of material
goods (visible item)
Balance of payments: Balance of payments is a systematic record of all economic transactions between
residents of a country and the residents of foreign countries during a given period of time. It includes both visible
and invisible items. Hence the balance of payments represents a better picture of a country‟s economic
transactions with the rest of the world than the balance of trade.
Appreciation of currency Depreciation of currency
Appreciation means increase in price of domestic currency due to changes in demand and supply of foreign exchange.
Depreciation means decrease in price of domestic currency due to changes in demand and supply of foreign exchange.
increasing in price of rupee from rupee 55/$ to rupees 45/$
decreasing in price of rupee from rupee55/$ to rupees 65/$
Appreciation occurs in Flexible Exchange Rate
depreciation occurs in Flexible Exchange Rate
Revaluation of currency Devaluation of currency
the central monetary authority increases value of domestic currency in terms of foreign currency.
the central monetary authority decreases value of domestic currency in terms of foreign currency.
For eg. Central bank revalues rupee by increasing its value from rupee 55/$ to rupees 45/$
For eg. Central bank devalues rupee by decreasing its value from rupee 55/$ to rupees 65/$
monetary authority fixes the the exchange rate
monetary authority fixes the the exchange rate
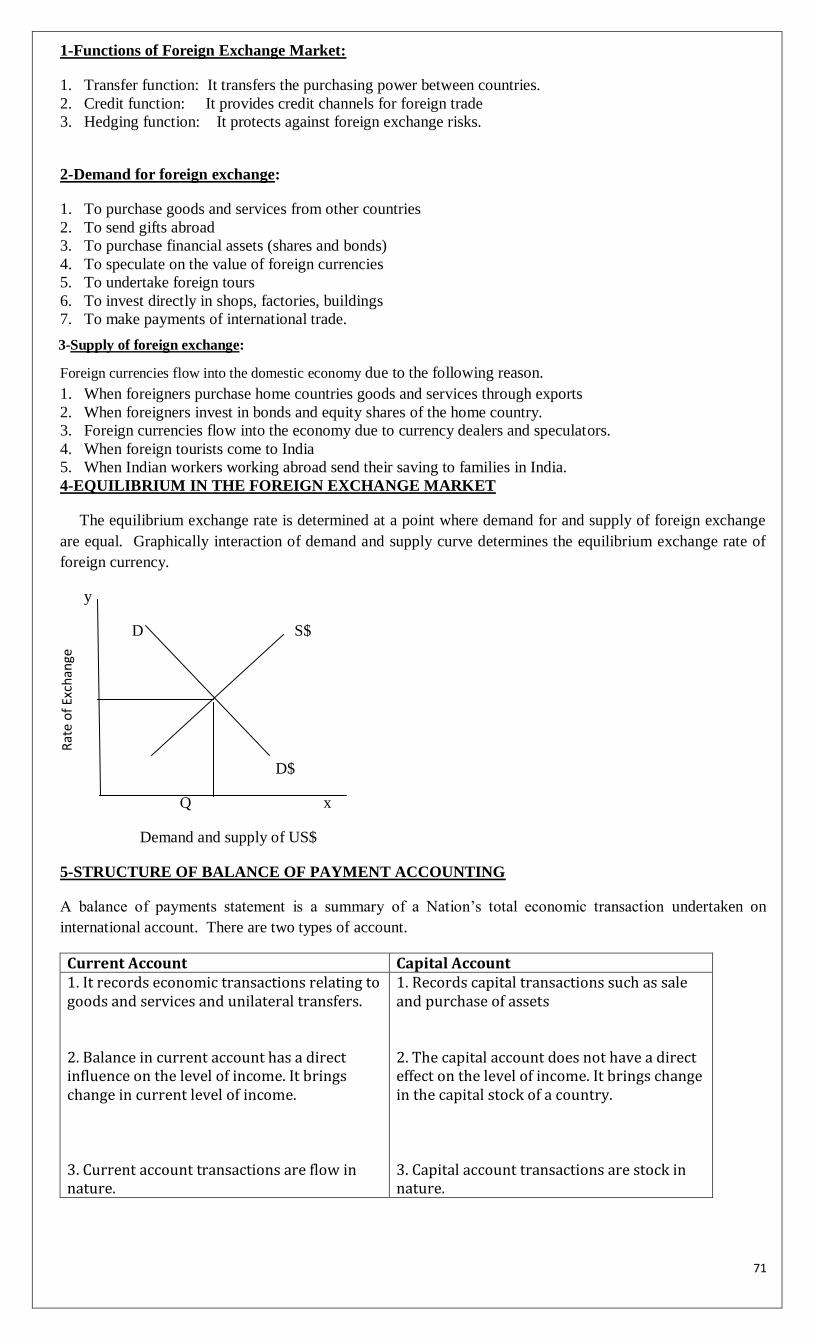
71
1-Functions of Foreign Exchange Market:
1. Transfer function: It transfers the purchasing power between countries.
2. Credit function: It provides credit channels for foreign trade
3. Hedging function: It protects against foreign exchange risks.
2-Demand for foreign exchange:
1. To purchase goods and services from other countries
2. To send gifts abroad
3. To purchase financial assets (shares and bonds)
4. To speculate on the value of foreign currencies
5. To undertake foreign tours
6. To invest directly in shops, factories, buildings
7. To make payments of international trade.
3-Supply of foreign exchange:
Foreign currencies flow into the domestic economy due to the following reason.
1. When foreigners purchase home countries goods and services through exports
2. When foreigners invest in bonds and equity shares of the home country.
3. Foreign currencies flow into the economy due to currency dealers and speculators.
4. When foreign tourists come to India
5. When Indian workers working abroad send their saving to families in India.
4-EQUILIBRIUM IN THE FOREIGN EXCHANGE MARKET
The equilibrium exchange rate is determined at a point where demand for and supply of foreign exchange
are equal. Graphically interaction of demand and supply curve determines the equilibrium exchange rate of
foreign currency.
y
D S$
PE
D$
Q x
Demand and supply of US$
5-STRUCTURE OF BALANCE OF PAYMENT ACCOUNTING
A balance of payments statement is a summary of a Nation‟s total economic transaction undertaken on
international account. There are two types of account.
Current Account Capital Account 1. It records economic transactions relating to goods and services and unilateral transfers. 2. Balance in current account has a direct influence on the level of income. It brings change in current level of income. 3. Current account transactions are flow in nature.
1. Records capital transactions such as sale and purchase of assets 2. The capital account does not have a direct effect on the level of income. It brings change in the capital stock of a country. 3. Capital account transactions are stock in nature.
Rat
e o
f Ex
chan
ge
72
1-Current Account- It records all the exports and imports of goods and services. These transactions do not
affect asset and liability position of a country. Exports and all receipts of foreign exchange from unilateral
transfers are recorded on the credit side with(+) sign.
The main components of Current Account are:
i) Export and import of goods ie. Visible trade or trade of Tangible items
ii) Export and import of Services i.e. Invisible trade or trade of intangible items:
a)Non factor services like shipping, banking, insurance etc.
b)Factor services like income from entrepreneurship i.e profit or payment for capital i.e. interest.
iii) Unilateral or Transfer payments: These refer to those receipts and payments,which take place without any
service in return. It includes gifts, donations,Personal remittances etc..
2-Capital Account- Any transaction between resident of a country and rest of the world which results in
change in asset and liability position of a country with rest of the world is recorded in capital A/c it includes long
term & short term borrowings; sale & purchase of physical and financial assets, changes in the official reserves
of foreign exchange, gold, SDR’s with the monetary authorities
Components of Capital account
i) Private capital transactions: Capital transactions undertaken by the private sector of the country in the form
of short-term and long-term foreign loans.
ii) Government capital transactions: It includes the transactions undertaken by the government with the rest of
the world. For example, govt. borrows from IMF.
iii) Banking capital: It refers to capital movements and investment by foreign branches of banks.
iv) Foreign direct investment: It refers to purchase of assets in the rest of the world such that it gives direct
control over the asset. For example, acquisition of foreign firm by an Indian firm.
v) Portfolio Investment: It refers to purchase of assets in the rest of the world such that it does not give direct
control over the asset. For example, purchase of shares of a foreign firm by an Indian firm.
vi)official reserve transactions- These include transactions by monetary authority i.e Central bank which causes
changes in reserves of gold, SDR’s , foreign Exchange etc. with central bank.
6-DISEQUILIBRIUM THE BALANCE OF PAYMENTS
There are a number of factors that cause disequilibrium in the balance of payments showing either a surplus or
deficit. These causes are categorized into 3 factors.
I -Economic factors: Large scale development expenditure that may cause large imports.
II- Cyclical fluctuations in general business activities such as recession or depression.
III-High domestic prices may result in imports.
Iv-Political factors: Political instability may cause large capital outflows and hamper the inflows of foreign
capital.
v-Social factors: Changes in tastes, preferences and fashions may affect imports and exports.
73
7-Merits of Fixed Exchange Rate System
(i) It prevents capital outflow
(ii) It stops speculation in foreign exchange market.
(iii) It forces the government to check inflation.
8-Demerits of Fixed Exchange Rate System
(i) It discourages the objective of having free markets
(ii) It may involve undervaluation or overvaluation of currency
9-Merits of flexible exchange rate
(i) It enhances efficiency in resources allocation
(ii) It promotes venture capital in the foreign exchange market
(iii) It eliminates the problems of undervaluation or overvaluation of currency
10-Demerits of flexible exchange rate
(i) It creates the situation of market instability
(ii) It encourages speculation
(iii) It discourages International Trade
QUESTIONS&Answers(3 / 4 MARKS)
1. Why does the demand for foreign exchange rise, when it price falls?
With a fall in price of foreign exchange , the exchange value of domestic currency increases and that of foreign
currency falls. This implies that foreign goods become cheaper and their domestic demand increases. The rising
domestic demand for foreign goods implies higher demand for foreign exchange. So there is inverse relationship
between price and demand for foreign exchange.
2. When price of a foreign currency falls, the supply of that foreign currency also fall why?
When price of a foreign currency falls it makes exports, investment by foreign residents costlier as a result supply of foreign currency falls.
3. Distinguish between autonomous and accommodating transaction of balance of payment account.
Autonomous transactions are done for some economic consideration such as profit, such transactions are independent
of the state of B.O.P. Accommodating transactions are under taken to cover the deficit/surplus in balance of payments.
4--Explain the effect of depreciation of domestic currency on exports.
Domestic currency depreciates when there is a rise in foreign exchange rate With the rise in foreign exchange rate the foreign counties can now purchase more quantity of goods and services from the same amount of foreign currency from the domestic economy. As a result exports rise.
5- Explain the effect of appreciation of domestic currency on imports.
-Domestic currency appreciates when there is a fall in foreign exchange rate With the fall in foreign exchange rate the domestic economy can now buy more quantity of goods and services from foreign countries from the less amount of domestic currency. As a result imports rise.
6-.Where will sale of machinery to abroad be recorded in the Balance of Payments Accounts? Give reasons. Sale of machinery to abroad will be recorded in the credit side on the current account under visible items. Since, machinery is a visible item and its export will result in inflow of foreign exchange it will be recorded as a credit item under visible items in the current account.
7-What is ‘current account deficit’ in the balance of payments? When the sum of credits is less than the sum of debits in the current account, it is negative and this is called current account deficit.


