Page 1
CHARACTERISATION OF CROSS-LINKING AND MOISTURE INGRESS DETECTION IN AN EPOXY/AMINE RESIN USING
FIBRE-OPTIC SENSORS
by
RAMANI SALMALEE MAHENDRAN
A thesis submitted to The University of Birmingham
for the degree of
DOCTOR OF PHILOSOPHY
School of Metallurgy and Materials College of Engineering and Physical Science The University of Birmingham November 2010
Page 2
University of Birmingham Research Archive
e-theses repository This unpublished thesis/dissertation is copyright of the author and/or third parties. The intellectual property rights of the author or third parties in respect of this work are as defined by The Copyright Designs and Patents Act 1988 or as modified by any successor legislation. Any use made of information contained in this thesis/dissertation must be in accordance with that legislation and must be properly acknowledged. Further distribution or reproduction in any format is prohibited without the permission of the copyright holder.
Page 3
i
ABSTRACT
Themosetting resins are being used increasingly as matrix materials in advanced fibre-reinforced
composites. It is well known that the processing conditions used to manufacture the composite
can have a major influence on its mechanical integrity in service. In addition, the processing
parameters can also affect the ingress of moisture in thermosetting resin and composites. The
feasibility of using optical fibre-based sensor systems for monitoring cross-linking reaction has
been demonstrated previously. However, little work has been reported on the deployment of a
single sensor to study the cross-linking kinetics and the diffusion of moisture.
In the current work, four low-cost sensor designs were evaluated for in situ monitoring of the
cross-linking reactions of an epoxy/amine resin system. One of these sensor designs was selected
and used to investigate in detail the cross-linking kinetics. Excellent correlation was observed
between the cross-linking data obtained from the sensors and conventional transmission
spectroscopy. Semi-empirical models were used successfully to describe the cross-linking
behaviour of the epoxy/amine resin system that was used in this study.
Subsequent to monitoring the cross-linking reactions, the fibre-optic sensors were used to study
the diffusion of moisture in the cross-linked resin system. Conventional gravimetric
measurements were also carried out to enable the correlation with the data obtained from the
fibre optic sensors. It was demonstrated that the fibre-optic sensors were capable of giving
information on the “localised” diffusion of moisture in the neat-resin plaques. Three previously
published models were investigated and localised diffusion of moisture in the neat-resin showed
non-Fickian behaviour.
Page 4
ii
ACKNOWLEDGEMENTS
I am deeply grateful to my research supervisors Dr S N Kukureka and Prof G F Fernando,
without whose enthusiasm, kindness, knowledge, support and continuous guidance, none of this
work would have been possible.
I also grateful and special appreciation must be due to Dr R Badcock without whose constructive
criticism and valuable guidance, completing this work would not be possible.
Appreciation must also go to the following members of the academic staff of the University of
Moratuwa, Sri Lanka for their knowledge, encouragement and guidance: Dr N Munasignhe
(former head of department, Materials Engineering), Dr Y Gunapala (former senior lecturer,
Materials Engineering) and Dr O Gunapala (senior lecturer, Chemical Engineering). I would be
remiss if I did not acknowledge the influence on my early career by Mr K Dherasekara (Director
– Operations), Mr S Wijesinghe (Chief Operations Officer) and Mr L Peiris (Director –
Administration) of Agro Marine Group, Sri Lanka, who shaped my professional career and were
role models of my past and for the future.
I also like to acknowledge senior and former members of the Sensors and Composites Group, Dr
R Chen, Dr L Wang, Dr V R Machavaram and Dr S D Pandita for all the support, bringing new
ideas and for sharing research experience and expertise in their respective fields during my
research. I would also like to thank Mr F Biddlestone for his technical assistance, guidance and
input on various aspects of experimental methods, instrumentation and data analysis. I would
also like to acknowledge Mr C Barrow and Mr P Turner of Bruker UK Limited for their
Page 5
iii
continual assistance and support on hardware and software issues related to Fourier transform
infrared spectroscopy. Appreciation must also due to my colleagues in the Sensors and
Composites Group for their help and support during my study. Special thanks are due to Mr
AKR Nair and Mr M Shafiq Irfan for their valuable help on completing my thesis.
I would also like to thank the current and former staff members of the school of Metallurgy and
Materials for their valuable assistance through out my research: Mrs. A Cabezas, Mrs. J Corbett,
Mr D Boole, Mr J Lane, Mr P Stanley, Mr M T Cunningham, and Ms. A Rogers.
Finally, the largest debt is due to my husband who made many sacrifices in his career in order to
help me to realise my goal of completing my PhD and for his dedication in helping me in every
way possible during my study. I would like to express my deepest gratitude and love for my
mum, dad, my brother and my daughter for their never-ending love, guidance and
encouragement. I could not have completed this work without their support.
Page 6
iv
CONTENTS
CHAPTER 1. INTRODUCTION
1.1 MOTIVATION……………………………………………………………….…. 1
1.2 AIMS AND OBJECTIVES……………………………………………………… 4
1.3 OUTLINE OF THE THESIS..…………………………………………………… 4
CHAPTER 2. CROSS-LINKING AND HYGROTHERMAL
AGEING OF THERMOSETTING RESINS
2.1 INTRODUCTION……………………………………………………………. 6
2.2 CHEMISTRY OF EPOXY/AMINE RESIN SYSTEMS…………………….. 7
2.2.1 Reaction mechanism during cross-linking……………………………………. 10
2.2.2 Cross-linking kinetics…………………………………………………………. 18
2.3 MONITORING OF CROSS-LINKING IN EPOXY/AMINE RESIN
SYSTEMS……………………………………………………………………… 27
2.3.1 Conventional analytical techniques…………………………………………… 27
2.3.1.1 Fourier transform infrared spectroscopy…………………………………. 29
2.3.1.2 Differential scanning calorimetry………………………………………… 40
2.3.2 In situ fibre-optic based techniques…………………………………………… 43
2.3.2.1 Absorption-based fibre-optic techniques…………………………………. 44
2.3.2.2 Intensity-based fibre-optic techniques……………………………………. 52
2.3.2.3 Other fibre-optic techniques………………………………………………. 53
2.4 HYGROTHERMAL AGEING IN EPOXY/AMINE RESIN
SYSTEMS………………………………………………………………………. 55
2.4.1 Nature of water in epoxy resins due to
moisture absorption……………………………………………………… 55
2.4.2 Fundamental laws of diffusion in polymers……………………………………. 57
2.4.2.1 Fickian diffusion…………………………………………………………... 57
Page 7
v
2.4.2.2 Non – Fickian diffusion…………………………………………………… 59
2.4.3 Parameters affecting diffusion kinetics of water………………………………. 66
2.4.3.1 Influence of temperature…………………………………………………... 66
2.4.3.2 Influence of processing conditions………………………………………… 66
2.4.3.3 Influence of hygrothermal history…………………………………………. 67
2.4.3.4 Influence of mixing ration of epoxy/amine formulations…………………. 68
2.4.3.5 Influence of microstructure……………………………………….………... 69
2.5 MONITORING OF HYGROTHERMAL AGEING IN
EPOXY/AMINE RESIN SYSTEMS………………………………………..….. 69
2.5.1 Conventional analytical techniques……………………………………………. 69
2.5.1.1 Differential scanning calorimetry…………………………………………. 70
2.5.1.2 Thermo gravimetric analysis…………………………………………...…. 72
2.5.1.3 Dynamic mechanical thermal analysis…………………………………….. 72
2.5.1.4 Fourier transform infrared spectroscopy…………………………………... 74
2.5.2 In situ Fibre-optic based techniques……………………………………………. 77
2.5.2.1 Absorption-based fibre-optic techniques…………………………………... 79
2.5.2.2 Other fibre-optic techniques……………………………………………….. 80
2.6 CONCLUSIONS………………………………………………………………… 81
CHAPTER 3. EXPERIMENTAL METHODS
3.1 INTRODUCTION………………………………………………………….…... 82
3.2 MATERIALS…………………………………………….…………………………... 83
3.2.1 Resins…………………………………………………………………………. 83
3.2.2 Fibres………………………………………………………………………….. 84
3.3 SENSOR INTERROGATION……………………………………………..………. 84
3.4 FIBRE-OPTIC SENSOR FABRICATION…………………………………..... 84
3.4.1 Single-fibre transmission sensor……………………………………………… 85
3.4.1.1 Basic sensing concept……………………………………………….….... 85
3.4.1.2 Epoxy substrate sensor design……………………………………………. 86
3.4.1.3 Capillary support sensor design ………………………………….………. 90
3.4.1.4 Abraded capillary sensor design …………………………………………. 92
Page 8
vi
3.4.2 Single-ended reflectance sensor………………………………………………. 94
3.4.2.1 Basic sensing concept…………………………………………….……… 94
3.4.2.2 Capillary reflector sensor design ...……………………………….……… 96
3.5 PREPARATION OF FIBRE CONNECTORS..…………………………..………. 98
3.6 DETERMINATION OF OPTIMUM GAP AT THE SENSING REGION……. 100
3.6.1 Single-fibre transmission sensor………………………………………………. 100
3.6.2 Single-ended reflection sensor………………………………………………… 101
3.7 CHARACTERISATION OF CROSS-LINKING KINETICS OF
THE EPOXY/AMINE RESIN SYSTEM.…………………………………………. 103
3.7.1 Temperature monitoring………………………………………………………. 103
3.7.2 In-situ monitoring of cross-linking reactions…………………………………... 104
3.7.2.1 Fibre-optic transmission spectroscopy……………………………………. 104
3.7.2.2 Fibre-optic reflectance spectroscopy……………………………………… 106
3.8 CHARACTERISATION OF DIFFUSION KINEITCS OF WATER
IN THE EPOXY/AMINE RESIN SYSTEM………………………………………. 107
3.8.1 Conventional analytical techniques……………………………………………. 107
3.8.1.1 Sample fabrication for conventional diffusion analysis…………………… 108
3.8.1.2 Environmental conditioning of the cast resin for diffusion
experiments………………………………………….…………………….. 109
3.8.1.3 Diffusion experiments……………………………………………………... 109
3.8.1.4 Gravimetric analysis………………………………………………………. 110
3.8.1.5 Thermo-mechanical analysis……………………………………………… 110
3.8.1.6 Dynamic scanning calorimetry……………………………………………. 111
3.8.1.7 Thermo-gravimetric analysis……………………………………………… 112
3.8.1.8 Fourier transform infrared spectroscopy……..……………………………. 112
3.8.2 Fibre-optic transmission spectroscopy………………..……………………….. 112
3.8.2.1 Sensor interrogation for monitoring moisture ingress……….……………. 120
3.9 PROOF-OF-CONCEPT OF MULTI-FUNCTIONAL SENSOR………….…… 121
3.9.1 Sensor design………………………………………………………………….. 121
3.9.2 Sensor fabrication……………………………………………………………… 123
3.9.3 Sensor interrogation and monitoring of cross-linking reaction………………... 124
3.9.4 Characterization of EFPI and FBG Sensors…………………………………… 126
Page 9
vii
3.10 CONCLUSIONS……………………………………………… …………………... 128
CHAPTER 4. FIBRE-OPTIC NEAR-INFRARED SPECTROSCOPY
AND OPTIMISATION OF SENSOR DESIGNS
4.1 INTRODUCTION……………………………………………………………… 130
4.2 RAY-OPTIC CONSIDERATIONS FOR FIBRE-OPTIC
SPECTROSCOPY……………………………………………………………… 131
4.2.1 Fibre-optic transmission spectroscopy………………………………….. 131
4.2.2 Fibre-optic reflectance spectroscopy……………………………………. 134
4.3 FIBRE-OPTIC SENSOR DESIGNS………………………………………………… 137
4.3.1 Fibre-optic transmission spectroscopy………….……………………………… 137
4.3.1.1 Epoxy substrate sensor design…………………………………………… 138
4.3.1.2 Capillary support sensor design.………………………………….……… 139
4.3.1.3 Abraded capillary sensor design ………………………………………… 141
4.4 OPTIMUM CAVITY LENGTH FOR FIBRE-OPTIC SPECTROSOCPY……... 145
4.4.1 Fibre-optic transmission spectroscopy…………………………………………. 145
4.4.2 Fibre-optic reflectance spectroscopy...…………………………………………. 148
4.5 CONCLUSIONS………………………………………………………………….…… 153
CHAPTER 5. MONITORING CROSS-LINKING USING FIBRE-OPTIC
SPECTROSCOPY
5.1 INTRODUCTION……………………………………………………………… 155
5.2 PEAK ASSIGNMENTS FOR THE EPOXY/AMINE RESIN SYSTEM……… 156
5.2.1 Analysis of absorption bands during cross-linking……………………………. 160
5.3 QUANTITATIVE ANALYSIS OF CHANGE IN FUNCTIONAL
GROUPS DURING CROSS-LINKING……………………………………………….. 169
5.3.1 Deconvolution of epoxy absorption band……………………………………… 170
5.3.2 Quantitative analysis of functional groups using fibre-optic
transmission spectroscopy……………………………………………………… 184
5.3.2.1 Epoxy group analysis……………………………………………………. 184
Page 10
viii
5.3.2.2 Primary amine group analysis…………………………………………. 186
5.3.2.3 Secondary amine group analysis………………………………………. 187
5.3.2.4 Tertiary amine group analysis…………………………………………. 191
5.3.2.5 Hydroxyl group analysis………………………………………………. 192
5.3.2.6 Summary of functional group analysis………………………………… 194
5.3.3 Quantitative analysis of functional groups using fibre-optic
reflectance spectroscopy……………………………………………………… 199
5.4 EMPIRICAL MODELLING OF CROSS-LINKING KINETICS USING
FIBRE-OPTIC SPECTROSCOPY…………………………………………………. 205
5.4.1 Fibre-optic transmission spectroscopy……………………………………….. 205
5.4.2 Fibre-optic reflectance spectroscopy…………………………………………. 211
5.4.3 Comparison of cross-linking kinetics obtained using
fibre-optic spectroscopy………………………………………………………. 214
5.4.4 Relationship of degree of cross-linking and refractive index…………………. 216
5.4.4.1 Ray optics of fibre-optic transmission spectroscopy……………………… 216
5.4.4.2 Ray optics of fibre-optic reflectance spectroscopy………………………... 220
5.4.4.3 Comparison of ray optics of different fibre-optic techniques……………... 223
5.5 CONCLUSIONS………………………………………………………………… 226
CHAPTER 6. PROOF-OF-CONCEPT OF MULTI-FUNCTIONAL SENSOR
DESIGN
6.1 INTRODUCTION…………………………………………………………………….. 228
6.2 TEMPERATURE AND STRAIN SENSITIVITY OF THE SENSOR
DESIGN……………………………………………………………………………….. 229
6.2.1 Temperature sensitivity of Fabry-Perot interference sensor and
fibre Bragg grating sensor…………………………………………………….. 229
6.2.2 Strain sensitivity of Fabry-Perot interference sensor and fibre
Bragg grating sensor………………………………………………………….. 236
6.3 MONITORING OF CROSS-LINKING REACTIONS.…………………………. 239
6.3.1 Quantitative monitoring of cross-linking reactions…………………………… 239
6.3.2 Qualitative monitoring of cross-linking reactions……………………………. 241
Page 11
ix
6.3.3 Simultaneous strain and temperature monitoring…………………………….. 243
6.4 CONCLUSIONS ……………………………………………………………………. 246
CHAPTER 7. MOISTURE INGRESS MONITORING USING
CONVENTIONAL TECHNIQUES
7.1 INTRODUCTION……………………………………………………………… 248
7.2 GRAVIMETRIC METHOD…………………………………………………… 249
7.2.1 Kinetics of water absorption………………………………………………….. 249
7.2.2 Determination of the through-thickness concentration profile of the
absorbed moisture…………………………………………………………….. 256
7.3 EFFECT OF HYGROTHERMAL CONDITIONING ON THE
PROPERTIES OF THE EPOXY/AMINE RESIN SYSTEM………………….. 262
7.3.1 Thermo gravimentric analysis…………………………………………... 264
7.3.2 Differential scanning calorimetry……………………………………….. 266
7.3.3 Dynamic mechanical thermal analysis………………………………….. 272
7.3.4 Fourier transform near-infrared spectroscopy…………………………... 282
7.4 CONCLUSIONS………………………………………………………………… 285
CHAPTER 8. MONITORING OF MOISTURE INGRESS USING FIBRE-
OPTIC TRANSMISSION SPECTROSCOPY
8.1 INTRODUCTION……………………………………………………………... 287
8.2 QUANTITATIVE ANALYSIS OF CHANGES IN FUNCTIONAL
GROUPS DURING HYGROTHERMAL CONDITIONING..……………….. 288
8.2.1 Specimen configuration – I…………………………………………….. 288
8.2.2 Specimen configurations –II and –III…………………………………... 304
8.2.2.1 Absorption kinetics: specimen configuration – II………………….. 307
8.2.2.2 Absorption kinetics: specimen configuration – III…………………. 314
8.3 CONCLUSIONS……………………………………………………………….. 320
Page 12
x
CHAPTER 9. GENERAL CONCLUSIONS AND FUTURE
RECOMMENDATIONS
8.1 INTRODUCTION.…………………………………………………………….. 321
8.2 CONCLUSIONS………………………………………………………………. 321
8.3 FUTURE RECOMMENDATIONS…………………………………………… 326
REFERENCES………………………………………………………………………… 330
APPENDIX – I ………………………………………………………………………... 376
APPENDIX – II………………………………………………………………………… 379
APPENDIX – III………………………………………………………………………… 383
APPENDIX – IV…………………………………………………………………………. 386
Page 13
1
Chapter 1
Introduction
Overview
1.1 Motivation
Epoxy resins are widely used as a matrix material in fibre-reinforced composites (FRC)
[1,2,3,4,5]. Generally, liquid and semi-solid epoxy resin systems are cross-linked using heat,
light or e-beam to form a rigid irreversible network polymer. This transition involves the
formation of a three-dimensional chemical network within the resin system. The ultimate
physical and mechanical performance of a cross-linked resin and its applications in service
environments are strongly dependent on the kinetics of cross-linking reactions.
Reaction kinetics is the study of the reaction rate and the factors that affect this rate. The
reaction speed or the rate of reaction is the change of concentration of a reacting constituent in
a given time. Cross-linking kinetics is important in the process optimisation of FRC with
thermosetting resins as the matrix. In commercial high-performance FRC, the processing of
matrix resins takes place at elevated temperatures (80 – 180 oC). The exothermic heat
released during the cross-linking reactions can cause an increase in temperature in the interior
of thick resin sections [6]. The presence of temperature gradients within the resin greatly
Page 14
2
affects the uniformity of the reaction kinetics and extent of conversion of the reactants across
the thickness of the resin [7,8]. Under extreme processing conditions, this may lead to
permanent mechanical failure due to excessive resin shrinkage and/or the development of
residual stresses when the resin cooled down to ambient temperature. Hence, a good
understanding of the relationship between processing conditions and the reaction kinetics of
the resin is one of the critical requirements for overall process optimisation. Numerous
studies have been carried out to predict the reaction kinetics of thermosetting resins using
various mathematical models.
For many years, significant attention has been focused on monitoring of cross-linking
reactions using conventional off-line techniques. With reference to various on-line techniques
developed for monitoring of cross-linking reactions, fibre-optic sensors attracted wide
acceptance in engineering applications where robustness and cost of the sensing techniques
are paramount. In comparison with other in situ sensing techniques, the relatively small size
of fibre-optic sensors is suitable for embedded sensing applications within high-performance
FRC structures.
In addition to process-related issues associated with epoxy-based systems, their behaviour
under deleterious environmental conditions is also one of the major concerns [9,10].
Mechanical properties of thermosetting resin systems are strongly influenced by various
weathering conditions. In many engineering applications, structural polymers are exposed to
varying weathering conditions such as high temperature, lightning and electric discharge,
ozone, moisture and contact with organic liquids such as fuels, lubricants and de-icing fluids.
Amongst these harsh media, water is the most commonly encountered and epoxies show
considerable affinity to absorbed moisture due to the polar nature of the cross-linked
Page 15
3
structure. Research in the diffusion of moisture in polymers is continues to be of interest
[11,12,13] and numerous efforts have been paid to predict absorption behaviour related to
various types of epoxy resins and FRC using analytical methods [14,15,16,17,18]. Reduction
in physical, thermal and mechanical properties, especially at elevated temperatures due to the
absorbed moisture in epoxy resins has been reported.
In order to predict and enhance the lifetime of these glassy polymers in service environments,
it is necessary to have an understanding of the internal chemical changes that take place in
polymers due to absorbed moisture. The effect of processing conditions, residual stresses and
resin shrinkage on the diffusion kinetics of water also needs to be understood. The majority
of research in this current respect has been focussed on the influence of hygrothermal ageing
on bulk properties of the cross-linked resin.
In situ sensing techniques can be used as an alternative solution for in-depth investigation of
localised moisture diffusion phenomena in thermosetting polymers. Fibre-optic sensing
techniques are ideally suited for remote monitoring of moisture diffusion [19,20]. However,
the inherent characteristics of fibre-optic sensors for monitoring of moisture ingress in
composites have not been explored fully. A limited amount of research has reported using
embedded fibre-optic sensors for in situ monitoring of moisture diffusion in thermosetting
resins [21,22,23]. However, the demonstrated sensing techniques have their own limitations
that need to be addressed.
Page 16
4
1.2 Aims and objectives
The overall aim of this research was to design and develop low-cost fibre-optic sensors for in
situ monitoring of cross-linking reactions and monitoring of moisture diffusion in an epoxy
resin system. The specific aims of the research were as follows:
(i) To design and demonstrate the feasibility of using fibre-optic chemical sensors for
performing in situ near-infrared spectroscopy;
(ii) To monitor the cross-linking reactions of an epoxy resin system via fibre-optic
near-infrared spectroscopy and to compare the reaction kinetics of the resin system
obtained using different sensing concepts;
(iii) To investigate the effect of hygrothermal ageing on the thermal, chemical and
viscoelastic properties of the epoxy resin system using conventional analytical
techniques;
(iv) To monitor and predict the moisture transport phenomena in the epoxy resin using
fibre-optic near-infrared spectroscopy.
1.3 Outline of the thesis
This thesis consists of nine chapters. The first part of Chapter Two provides a review of
monitoring and modelling of cross-linking kinetics using conventional and fibre-optic based
sensing techniques. The second part provides a literature survey on predicting diffusion of
water in thermosetting resin systems.
Page 17
5
Chapter Three presents a detailed description of the material and experimental procedures
used in this study. Two main streams of experiments were carried out: (i) monitoring of
cross-linking reactions of LY3505/XB3403 epoxy/amine resin system and (ii) monitoring of
diffusion of moisture in the cross-linked resin system using conventional and fibre-optic
techniques.
In Chapter Four, the feasibility of using different sensor designs for embedded applications is
assessed and a discussion on the theory of optics involved in the sensing concepts is provided.
Chapter Five presents the results of monitoring of cross-linking reactions of the epoxy/amine
resin system via fibre-optic near-infrared spectroscopy. In particular, the chapter contains a
detailed description of peak assignments of the resin system, and spectral analysis for
predicting reaction kinetics as a function of cross-linking time and temperature. Both
phenomenological and mechanistic approaches for explaining the reaction kinetics are
discussed. Chapter Six describes proof-of-concept of a new multi-functional sensor design
for in situ monitoring of the cross-linking reactions.
Chapter Seven considers the diffusion kinetics of water in the epoxy/amine resin system using
traditional analytical techniques. The influence of absorbed moisture on the physical,
thermal, chemical and viscoelastic properties of the bulk resin is also characterised. In situ
monitoring of diffusion of moisture using fibre-optic near-infrared spectroscopy is
demonstrated in Chapter Eight. Anomalies associated with localised diffusion behaviour of
water in the resin system are discussed in detail. Finally, in Chapter Nine, overall
conclusions of the research and recommendations for further work are presented.
Page 18
6
Chapter 2
Cross-linking and hygrothermal ageing
of thermosetting resins
2 Overview
2.1 Introduction
The first part of this chapter contains a literature survey on reaction mechanism of
epoxy/amine resin systems, cross-linking kinetics and various techniques used for monitoring
of cross-linking reactions. The second part reviews diffusion kinetics of water in
epoxy/amine resin systems and conventional and in situ techniques used for monitoring
hygrothermal ageing in the resin systems.
Page 19
7
2.2 Chemistry of epoxy/amine resin systems
Epoxy resins are widely used as adhesives, coatings, encapsulants and more importantly as
matrix materials for high performance FRC [24,25,26,27,28,29]. “Epoxy” is a term
describing an oxygen atom bound to two linked carbon atoms. The term is commonly applied
to a three-membered ring called an oxirane (see Figure 2.1). Examples of common epoxy
resins used in engineering applications are shown in Figure 2.1.
Epoxies require cross-linking agents and/or catalysts to promote cross-linking [26].
Addition of a hardener or a cross-linking agent containing hydrogen atoms opens the three-
membered ring with formation of a hydroxyl group. Application characteristics and ultimate
physical, thermal and chemical properties of the resulting cross-linked network can be tailored
by the selection of appropriate cross-linking agents. These properties include pot life,
impregnation and wettability of the resin system. Commonly used cross-linking agents in
commercial epoxy formulations are aliphatic and aromatic amines, anhydrides and
polyamides [30]. The current review is focused on amine-based cross-linking agents.
Generally, amines can be categorised into two main classes: aliphatic and aromatic amines
according to the types of hydrocarbon backbones involved and chemical structures of
commonly used amines are shown in Figure 2.2. Numerous variations of aliphatic
polyamines that contain a linear chemical chain between the amine groups have been
synthesised and reported in the literature. Among them, widely used aliphatic amines are
ethylenediamine (EDA), diethylenetriamine (DETA) and triethylenetriamine (TETA).
Epoxies that polymerise with aliphatic amines exhibit highly cross-linked layers with good
Page 20
8
thermal and chemical resistance. However, they are rather brittle and possess poor flexibility
and impact resistance. Also they show high affinity to moisture and humidity, which make
them unsuitable for use under damp conditions.
H
H
O
O
O
OH
H
O
OH
O
n
(iii) Diglycidyl ether of Bisphenol-F
CH2
O
O
n
O
O
O
(iv) Polyglycidyl ethers of novolac
H
H
N
O
N
(ii) N,N,N’,N’-tetraglycidyl-4,4’-diaminodiphenylmethane (TGDDM)
O
O
O
(i) Diglycidyl ether of bisphenol-A
CH3
CH3
O
O
O
OCH3
CH3
O
OH
O
nThree-membered
epoxide ring
H
H
O
O
O
OH
H
O
OH
O
n
(iii) Diglycidyl ether of Bisphenol-F
CH2
O
O
n
O
O
O
(iv) Polyglycidyl ethers of novolac
H
H
N
O
N
(ii) N,N,N’,N’-tetraglycidyl-4,4’-diaminodiphenylmethane (TGDDM)
O
O
O
(i) Diglycidyl ether of bisphenol-A
CH3
CH3
O
O
O
OCH3
CH3
O
OH
O
nThree-membered
epoxide ring
H
H
O
O
O
OH
H
O
OH
O
n
(iii) Diglycidyl ether of Bisphenol-F
CH2
O
O
n
O
O
O
(iv) Polyglycidyl ethers of novolac
H
H
N
O
N
(ii) N,N,N’,N’-tetraglycidyl-4,4’-diaminodiphenylmethane (TGDDM)
O
O
O
(i) Diglycidyl ether of bisphenol-A
CH3
CH3
O
O
O
OCH3
CH3
O
OH
O
n
H
H
O
O
O
OH
H
O
OH
O
n
H
H
O
OO
O
OOH
H
O
OH
O
n
(iii) Diglycidyl ether of Bisphenol-F
CH2
O
O
n
O
O
O
CH2
O
OOO
n
O
O
O
(iv) Polyglycidyl ethers of novolac
H
H
N
OO
N
(ii) N,N,N’,N’-tetraglycidyl-4,4’-diaminodiphenylmethane (TGDDM)
OO
OO
OO
(i) Diglycidyl ether of bisphenol-A
CH3
CH3
O
O
O
OCH3
CH3
O
OH
O
n
CH3
CH3
O
O
O
OCH3
CH3
O
OH
O
CH3
CH3
O
OO
O
OOCH3
CH3
O
OH
O
nThree-membered
epoxide ring
Figure 2.1 Main commercial epoxy resins, which are identified by monomer structure.
Page 21
9
(iii) N,N’-Diamino diphenylmethane (DDM)
(ii) Diethylenetriamine (DETA)
(iv) m-phenylenediamine (MPDA)
NH2
(v) N,N’-diamino diphenyl sulfone (DDS)
(vi) N,N’-methylenebis-(3-chloro 2,6-diethylaniline) (MCDEA)
(i) Poly(oxypropylene)diamine (POP)
H2N
X
CH3
O
CH3
NH2H2N
H
NNH2
(ii) Triethylenetetramine (TETA)
H2N
H
N NH2
H
N
O
O
H2N NH2S
H2N NH2
C2H5
C2H5
C2H5
C2H5 Cl
Cl
CH2
H2N NH2CH2
H2N
(iii) N,N’-Diamino diphenylmethane (DDM)
(ii) Diethylenetriamine (DETA)
(iv) m-phenylenediamine (MPDA)
NH2
(v) N,N’-diamino diphenyl sulfone (DDS)
(vi) N,N’-methylenebis-(3-chloro 2,6-diethylaniline) (MCDEA)
(i) Poly(oxypropylene)diamine (POP)
H2N
X
CH3
O
CH3
NH2H2N
X
CH3
O
CH3
NH2H2N
H
NNH2H2N
H
NNH2
(ii) Triethylenetetramine (TETA)
H2N
H
N NH2
H
NH2N
H
N NH2
H
N
O
O
H2N NH2S
O
O
H2N NH2S
H2N NH2
C2H5
C2H5
C2H5
C2H5 Cl
Cl
CH2H2N NH2
C2H5
C2H5
C2H5
C2H5 Cl
Cl
CH2
H2N NH2CH2H2N NH2CH2
H2N
Figure 2.2 Main commercial amine-based cross-linking agents [30].
In the aromatic amines, the amine group is separated from the main backbone by rigid
benzene rings. Most common aromatic amines are diamino diphenyl sulphone (DDS),
diaminodiphenyl methane (DDM) and metaphenylenediamine (MPDA). The cross-linked
epoxies with aromatic amines have high impact resistance as well as high thermal and
chemical resistance compared to that possessed by epoxies cross-linked with aliphatic amines
[31,32]. The aromatic ring unit with the newly-created hydroxyl as a result of cross-linking,
improves the thermal and corrosion properties of the epoxy [33,34]. Furthermore, FRC
Page 22
10
containing epoxies cross-linked with aromatic amines possess better mechanical properties
compared with aliphatic amines [35,36].
Amine compounds are again sub-divided into primary, secondary, and tertiary amines, in
which one, two, and three molecule(s) of ammonia (NH3) have been substituted for hydrogen,
respectively. The active hydrogen atoms attached to primary and secondary amines react
with the oxirane (epoxy group) ring unit on the ends of the epoxy molecule. The reaction
creates an OH (hydroxyl) pendant group. Tertiary amines are generally used as catalysts,
commonly known as accelerators for cross-linking reactions.
2.2.1 Reaction mechanisms during cross-linking
The reaction mechanism involving cyclic compounds such as epoxides is identified as ring-
opening polymerisation [37]. In the current research, attention is focussed only on the
reaction mechanism and kinetics of cross-linking reactions of epoxy/amine systems. A
review of cross-linking mechanism and reaction kinetics of epoxy/amine systems was
reported by Rozenberg [38]. In cross-linking of an epoxy resin with an amine hardener, the
epoxy group can react either with primary or secondary amine. Figure 2.3 shows the reaction
mechanism for a primary amine with an epoxy group yielding a β-hydroxyl secondary amine,
which in turn is able to react with another epoxy to give a chemical network cross-linked by
three bonds around the nitrogen atom (tertiary amine). As the reaction proceeds, further
branching reactions lead to the formation of a three-dimensional network molecule.
Page 23
11
R’
O
RH N
H
R
N
H
R’
OH
R’
OR
N
R’
OH
R’
OH
Epoxy Primary amine Secondary amine + hydroxyl
Secondary amineEpoxy Tertiary amine + hydroxyl
(i) Primary amine – epoxy addition
(ii) Secondary amine – epoxy addition
R
N
H
R’
OH
R’
O
R’
OO
RH N
H
R
N
H
R’
OH
R
N
H
R’
OH
R’
O
R’
OOR
N
R’
OH
R’
OH
Epoxy Primary amine Secondary amine + hydroxyl
Secondary amineEpoxy Tertiary amine + hydroxyl
(i) Primary amine – epoxy addition
(ii) Secondary amine – epoxy addition
R
N
H
R’
OH
R
N
H
R’
OH
Figure 2.3 Reaction mechanism of epoxy-amine ring-opening polymerisation [39].
Generally, the above reactions take place under two conditions: catalytic and autocatalytic
[40]. Absorbed moisture in constituent materials, residual hydroxyl groups present in epoxy
resins and solvents catalyse the epoxy/amine reaction in its early stage and known as catalytic
reaction. In addition, the hydroxyl groups generated by epoxy/amine reactions also act as
active catalysts. Rozenberg [38] explained the activation of carbon atoms of the epoxy ring
for nucleophilic attack by hydroxyl-containing molecules as shown in Figure 2.4, which was
identified as a “termolecular transition state”. These secondary hydroxyl groups catalyse the
reaction through the formation of a termolecular complex, which facilitates the nucleophilic
attack of the amino groups. Therefore, as the reaction progresses the cross-linking reaction
shows an accelerating rate, which is known as an autocatalytic reaction [41,42,43].
Page 24
12
R’
O
R”OH
N
..
..
R’
O
R’
OO
R”OH
N
..
..
Figure 2.4 Termolecular transition state of the Epoxy-amine addition in the presence of hydroxyl-
containing groups [44].
The above mentioned reaction mechanisms for epoxy amine systems are the general scheme
of consecutive and competitive reactions, which take place during cross-linking. However,
the exact reaction mechanism is dependent on the chemistry of the constituent materials and
the reaction temperature [45,46,47]. Attention has been focused on investigating the effect of
chemical structure on the relative reactivity of cross-linking agents, the reaction mechanism
and the reaction kinetics of epoxy/amine resin systems [44,48]. Girard-Reydet et al. [44]
studied the effect of chemical structure of different aromatic amines on the reactivity of the
amine groups and proposed that electron-withdrawing groups such as sulphones (–SO2–) and
electronegative groups such as chloride ions attached to a phenyl ring affect the reactivity as
illustrated in Figure 2.5. Their findings were based on DSC and high-pressure liquid
chromatography (HPLC) techniques. Based on dynamic DSC analyses of DGEBA with
aromatic amines, Gupta and Warma [48] observed reduced nucleophilicity with amines
containing carbonyl groups (–CO–). Mijovic and Wijaya [49] found relatively lower
reactivity of amines with a nitro group (–NO2), which has a stronger electron-withdrawing
effect compared with that of amines containing sulphone groups. The authors investigated the
nucleophelicity of different aromatic amines with PGE using quantitative functional group
analyses based on HPLC. Furthermore, they observed an improved reactivity of aromatic
Page 25
13
amines containing methoxy groups (–OCH3), which have a strong electron-donating nature.
The amine with a methoxy group that used for their investigation was p-anisidine, an aniline
with the methoxy group in the para position.
In alternative research, Soni et al. [34] investigated the effect of aliphatic and aromatic amines
on the cross-linking kinetics of epoxy/amine resin systems using DSC analysis. By
considering the characteristics of the DSC isotherms obtained, they concluded that the
aliphatic amines are more reactive than the aromatic amines. They explained the low
reactivity of aromatic amines based on the electron-withdrawing groups available in their
chemical structure. In addition, the reported values of pre-exponential factor (A) for different
amines also give an indication of steric hindrance of aromatic amines compared with that of
aliphatic amines. A is a term which includes factors such as the frequency of collisions of
constituent molecules and their orientation and the value depends on the complexity of the
reacting molecules [50,51].
O
O
H2N NH2S. .
O
O
H2N NH2S
O
O
H2N NH2S. .
Figure 2.5 The electron-withdrawing effect of sulphone group in DDS [44].
Generally, empirical kinetic models consider the primary amine – epoxy (PA-E) reaction and
the secondary amine – epoxy (SA-E) reaction as a single step and interpret as a combined
reaction using a single activation energy and rate of reaction. However, the relative
reactivities of the primary and secondary amino groups towards the epoxide ring-opening
Page 26
14
reaction are not clear and conflicting results have been published [38,39,52]. Cole and co-
workers [39,52] predicted the reaction scheme of cross-linking of epoxy/amine resin systems
assuming the reactivity of PA-E reaction is the same as that of SA-E reaction. The model was
validated for isothermal data obtained via differential scanning calorimetry (DSC). Different
formulations of neat TGDDM/DGEBA/DDS system were studied. A method of integration
by partial fractions was used to solve the kinetic equations and the evolution of cross-linking
reaction was described in terms of the degree of overall epoxy conversion and the extent of
epoxy-amine reaction at a given time.
In contrast, Chiao [46] reported that for cross-linking of commercial TGDDM/DDS epoxy
systems, the reactivity of the PA-E reaction is an order of magnitude higher than that of the
SA-E reaction. The conclusions were based on quantitative results obtained based on Fourier
transform infrared (FTIR) spectroscopic data and isothermal DSC data. Furthermore, the
author highlighted that the relative reactivities predicted based on FTIR spectroscopy gives
more meaningful evidence of real chemical change taking place during the cross-linking
reaction compared with that obtained based on empirical assumptions. Considering cross-
linking of a tri-functional epoxy with different aromatic amines, Girard-Reydet et al. [44]
came to a similar conclusion. Although the nucliophilicity of different amines were different,
reactivity ratios and reaction rates of SA-E reaction and PA-E reaction showed similar values.
In spite of the relative reactivity of primary and secondary amines, solvents used in the resin
formulations were also found to have a considerable influence on the reaction rate of
epoxy/amine addition [40,53,54]. Shechter et al. [54] observed a distinct influence of the
chemical structure and the concentration of solvents in an epoxy/amine resin system on the
reaction rates of amine-epoxy addition. They studied the reaction of phenyl glycidyl (PGE)
Page 27
15
ether with diethylamine and observed that benzene or acetone decelerates the reaction while
isopropanol, nitromethane and water accelerate the epoxy-amine addition. The authors
proposed that the effect is dependent on the polarity or the ability of a given solvent to donate
or accept a proton and the same catalytic effect takes place as explained in Figure 2.4 by
making a termolecular intermediate state of epoxy and amine molecules with the solvents.
Hong and Wu [55] analysed cross-linking behaviour of the epoxy/dicyandiamide/solvent
system. They investigated the effect of solvents by means of isothermal DSC and Fourier
transform infrared (FTIR) spectroscopy. The DSC analyses revealed that the presence of
solvent results in decreases in the cross-linking exotherm, the initial cross-linking rate, the
glass transition temperature, the reaction rate and the reaction order of the epoxy resin. The
FTIR spectroscopy analyses confirmed that the composition of the cross-linked resin was
affected by the solvent, the cross-linking temperature and the specimen configuration.
The lack of general agreement of relative reactivities of PA-E and SA-E reactions can be
attributed to the effects of the chemistry of the constituent materials including impurities,
catalysts and solvents available in the resin system. On the other hand, the discrepancy may
also be due to the different experimental techniques used and use of different mathematical
models used for calculating the kinetic parameters [38]. Mijovic et al. [56] summarised and
highlighted the variation in reactivity ratio as a function of resin chemistry, reaction medium
used and analytical technique employed. Rozenberg [38], Smith [40] and Mijovic et al. [56]
reviewed published results for reactivity ratios of a wide range of epoxy/amine formulations
and stated that defining a general relationship for reactivities of the primary and secondary
amino groups in amine based cross-linking agents is difficult since even a minor amount of
impurities available in the reactants makes a considerable difference on the reaction rates.
Page 28
16
(ii) Homopolymerization
(i) Hydroxyl – epoxy addition (etherification)
R’
O
Epoxy
R’
O
OH
R”O
hydroxyl
R”
hydroxyl
H
EpoxyTertiary amine anion
R’
O
N
R”
R
..
-
N
R”
R
+
R’
O
Stage-I
R’
O
Epoxy Ester
-
N
R”
R
+
R’
O -
N
R”
R
+
R’ O
O R’
anion
Stage-II
(ii) Homopolymerization
(i) Hydroxyl – epoxy addition (etherification)
R’
O
R’
OO
Epoxy
R’
O
OH
R”O
hydroxyl
R”
hydroxyl
H
EpoxyTertiary amine anion
R’
O
N
R”
R
..
-
N
R”
R
+
R’
O
Stage-I
EpoxyTertiary amine anion
R’
O
R’
OO
N
R”
R
..N
R”
R
..
-
N
R”
R
+
R’
O
Stage-I
R’
O
Epoxy Ester
-
N
R”
R
+
R’
O -
N
R”
R
+
R’ O
O R’
anion
Stage-II
R’
O
R’
OO
Epoxy Ester
-
N
R”
R
+
R’
O -
N
R”
R
+
R’ O
O R’
anion
Stage-II
Figure 2.6 Reaction mechanism of etherification and homopolymerisation of epoxy resin [39,47].
In spite of the main ring-opening reaction between epoxy and amine, slow side reactions such
as homopolymerisation of epoxides and epoxy-hydroxyl reaction (etherification) take place at
elevated temperatures as shown in Figure 2.6(i) [57]. Progression of the epoxy-amine cross-
linking also activates the homopolymerisation of epoxy resin by tertiary amine that is
produced during the epoxy/amine reaction. Tertiary amines are the general class of anionic
catalysts commercially used for cross-linking of epoxy resins. The tertiary amine is an
organic base containing an atom with an unpaired electron in its outer orbital [58]. The
tertiary amine approaches one of the carbon atoms of the epoxide group as shown in Figure
2.6(ii) and, in the presence of a hydroxyl group, bonds to the oxygen atom of the epoxy [59].
Page 29
17
The anion generated from this reaction is capable of opening a second epoxy ring and thus
continuing the cross-linking reaction. Nevertheless, Rozenberg [38] suggested that the
homopolymerization that catalysed by tertiary amines (Figure 2.6(ii)) may not possible when
aromatic amines are used as cross-linking agents. This could be attributed to the steric
hindrance and electron-withdrawing groups attached to the main chain and to phenyl rings
[34,44].
The contribution of the etherification reaction towards the overall epoxy conversion depends
on the resin chemistry, resin formulation and reaction temperature. Based on FTIR
spectroscopic data published by Morgan and Mones [60], Chao [46] reported that in
TGDDM/DDS resin systems the etherification reaction becomes significant at cross-linking
temperatures above 150 oC. This appears to be in satisfactory agreement with the
temperature dependence of vitrification published by other researchers [31,47]. Jiawu et al.
[31] observed a decrease in vitrification time at reaction temperatures above 158 oC and
below the glass transition temperature of fully cross-linked resin (Tg∞). Their work was based
on torsional braid analysis (TBA) (see Section 2.3.1) and DSC of a TGDDM/DDS resin
system at a range of isothermal cross-linking temperatures. The vitrification time was defined
based on loss tangent curves obtained from TBA analyses. Xu and Schulp [47] observed a
considerable increase in the reaction rate corresponding to vitrification above 160 oC for a
TGDDM/methylaniline resin system. The analysis was based on FTIR spectroscopy and the
concentration of ether groups formed during etherification was determined using the
concentrations of epoxide and secondary amine groups obtained from FTIR spectral data. In
addition to the temperature dependence, the authors observed that the etherification reaction is
more apparent in formulations with excess epoxy compared with that observed in
formulations with correct stoichiometry. However, in both cases the observed reaction rates
Page 30
18
of etherification was much slower than that of amine-epoxy addition reaction within the range
of reaction temperatures studied.
2.2.2 Cross-linking kinetics
The extent of reaction or degree of conversion of reactants at any stage of the cross-linking
reaction can be expressed by the percentage of total reactant concentration that has been
consumed. In addition, the rates of reaction are determined by the chemical kinetics of the
specific reactions involved [61].
Considerable attention has been paid of investigating the cross-linking kinetics of epoxy resin
systems, and a number of different kinetic models have been proposed in the literature.
Generally, researchers have studied the connection of the chemical reactions with the other
independent variables, such as time and temperature. Cross-linking kinetic models can be
classified into two categories: phenomenological models and mechanistic models.
Mechanistic models are made from the balance of chemical species taking part in the
chemical reaction [62]. These models are used to represent the actual chemical reactions
occurring in the cross-linking process of epoxy resins [63] and are able to account for the
variation in a resin formulation. On the other hand, phenomenological models are based on
an empirical relation between reaction kinetics and are only applicable to a specific class of
thermosets [64]. However, a detailed knowledge of the chemical formulae of epoxy resins is
necessary to set up a mechanistic model. Therefore, efforts have been directed towards
establishing phenomenological models for epoxy resins using thermal analysis techniques or
spectroscopic measurements. These equations can be very simple, although they do not
supply direct mechanistic information.
Page 31
19
For thermosetting polymers, cross-linking mechanism can be divided into two general
categories: nth
order and autocatalytic. Many empirical forms have been suggested for rate
equations and they show a dependence on the resin system used [62,65].
The general kinetic equation for the case of nth
-order kinetics is given by [66]:
nkdt
d)1(
Equation 2.1
where is the the fractional conversion of epoxy groups with respect to the concentration of
epoxy groups present in the system at the start of the reaction, k is the reaction rate constant, n
is the reaction order and t is the reaction time. At the start of the reaction is assumed to be
equal to zero. There are two characteristics for an nth
order type cross-linking mechanism: the
relationship between ln( )d dt and ln(1 ) should be linear and the maximum cross-
linking rate ( )d dt should be reached at 0 .
Fuller et al. [66] observed that the cross-linking behaviour can be modelled with a second-
order kinetic model. They found good correlation between experimental results and the
conversion calculated based on Equation 2.1 where the reaction is not diffusion-controlled.
They also observed that the thermal properties of the resin were cure-path independent, that
is, irrespective of the cross-linking conditions, for a given conversion, the resin had a constant
glass transition temperature.
Acitelli et al. [67] predicted the cross-linking kinetics of a DGEBA/m-phenylene diamine
resin system using the same model. In another investigation, the authors applied the nth
order
Page 32
20
model successfully for DSC data obtained for the cross-linking of DGEBA/dicyandiamide
(dicy) systems [68]. The applicability of the kinetic model was explained in terms of
molecular weight of the DGEBA resin, particle size of dicyandiamide and effect of
surfactants on the reaction order and the activation energy for cross-linking.
However, an nth
-order equation cannot realistically describe the progress of the entire reaction
because the material undergoes different transitions (gelation and vitrification) during cross-
linking [69,70]. The gel point is the point in the polymerisation reaction at which a polymer
network just begins to form as a result of cross-linking. If the cross-linking temperature (Tc)
is above the glass transition temperature (Tg) of the resin system, the reaction continues
beyond the gel point to complete the network formation. However, the rate of reaction
become slower as the kinetics become diffusion-controlled due to the reactants in the un-
reacted mixture having to diffuse through the rubbery gel to react with functional groups
attached to the network. The cross-linking reaction will cease as the Tg of the network
increases to such an extent that the system vitrifies [38]. Vitrification is known as glass
formation due to Tg increasing from below Tc to above Tc as a result of the cross-linking
reaction, and is defined as the point where Tg = Tc [61,62,66].
Tai and Chou [71]
reported that a simple n
th order reaction kinetic equation does not fit the
experimental data effectively. Instead, a kinetic equation for the autocatalytic type was
proposed. An expression for an autocatalytic reaction is given by [72]:
Page 33
21
nmkdt
d)1(
Equation 2.2
where n and m are reaction orders and k is the rate constant.
The rate constant can be expressed by Arrhenius function. The empirical relationship
between the rate of a reaction, temperature and the activation energy of the reaction is called
Arrhenius equation. The Arrhenius equation is based on collision theory, which states that in
a chemical system the molecules must collide with both the correct orientation and with
sufficient kinetic energy for converting reactants into products. In simple form, the
relationship between temperature and rate constant for a reaction has the following equation
[50]:
aERTk Ae
Equation 2.3
where A is a pre-exponential factor which accounts factors such as the frequency of collisions
and their orientation, Ea is the activation energy for the reaction, R is the universal gas
constant in J mol-1
K-1
, and T is the temperature in Kelvin.
By taking into account the autocatalytic reaction, where initial reaction rate of a reaction is
not zero, the generalized autocatalytic equation proposed by Sourour and Kamal [70] is given
below:
nmkkdt
d)1)(( 21
Equation 2.4
Page 34
22
RT
EAk 1
11 exp Equation 2.5
RT
EAk 2
22 exp Equation 2.6
where is the conversion, T the temperature, R universal gas constant and m, n, A1, A2, E1, E2
are constants, k1 and k2 are rate constants which have an Arrhenius form and are dependent on
temperature; m and n are reaction orders and dependent on the resin system. The reaction
order, n, and rate constant, k1 are related to the consumption of epoxy functional groups due to
both general epoxy-amine addition and homopolymerisation reactions as shown in Figure 2.3
and Figure 2.6. The constant, m and k2 are related to the concentration of hydroxyl groups
that are being generated as the cross-linking reaction proceeds [73,74].
The applicability of the empirical model for different resin systems has been widely explored
and the dependency of the kinetic parameters on resin chemistry and processing conditions
have been investigated. Table 2.1 gives a summary of kinetic models that have been used to
analyse the cross-linking kinetics of relevant epoxy-based resin systems.
Table 2.1 Summary of kinetic models used for epoxy/amine resin systems.
Resin system Kinetic model Kinetic parameters
DGEBA/poly(oxypropelene)
diamine (POP) [42]
nmkkdt
d)1)(( 21
2m n
E1 = 67.2 kJ mol-1
E2 = 22.5 kJ mol-1
Page 35
23
DGEBA/POP [75] 1
dk B r
dt
where
kB – initial rate of reaction
r – initial ratio of amine to epoxide
E1 = 65.1 kJ mol-1
, E2 = 31.3 kJ mol-1
ln A1 = 14.39, ln A2 = 4.54
DGEBA/MDA (4,4‟-
methylene diamine)/MN
(malononitrile) [76]
nmkkdt
d)1)(( 21
2m n
E = 37.58 kJ mol-1
A = 2.37 min-1
DGEBA/DDS [73]
1nd
kdt
E = 46.4 kJ mol
-1
DGEBA/ m-phenylene
diamine (m-PDA) [67] 1nd
kdt
n = 0.47 – 2.3
E = 51.5 kJ mol-1
DGEBA/DDM [73]
1nmd
kdt
3m n
E = 47.2 kJ mol-1
Structural fibreglass/epoxy
prepreg [77]
nmkkdt
d)1)(( 21
m = 0.593, n = 1.269
E1/R = 1687.886, E2/R = 561.192
DGEBA/m-PDA [78] nmkk
dt
d)1)(( 21
2m n
E = 4.56 x 10⁷ J/kgmol
DGEBA/m-PDA [79] ( )(1 )m nd
K Bdt
m = 1, n = 2
E = 50.5 kJ mol-1
TGDDM/DDS [80]
1 2 max( )( )m ndk k
dt
m + n = 2
E = 80.4 kJ mol-1
DGEBA/1,6-diaminohexane
[81] 1 2 max( )( )m ndk k
dt
m = 1.060, n = 0.898
E1 = 70.0 kJ mol-1
, E2 = 27.0 kJ mol-1
A1 = 3.72 x 10⁹ min
-1, A2 = 898 min
-1
DGEBA/1,6-diaminohexane
[82] nmkk
dt
d)1)(( 21
m = 0.853, n = 1.390
E1 = 40.75 kJ mol-1
,
E2 = 65.43 kJmol-1
ln A1 = 9.51, ln A2 = 22.0
However, there are partially conflicting relations observed in recent years for the reaction
orders, m and n obtained for different epoxy resin systems using general autocatalytic models
[42,73,78,83]. Costa et al. [73] investigated a DGEBA/4,4‟-diamine-diphenylmethane
(DDM) epoxy system based on isothermal DSC analysis. They proposed an autocatalytic
Page 36
24
reaction mechanism for the resin system and observed that the rate constant and the reaction
order, n increase proportionally as a function of temperature. On the other hand the reaction
order, m decreased as the temperature increases satisfying the overall reaction order, n + m =
3. They suggested that these observations are due to the fact that as the reaction temperature
increases, higher numbers of molecules acquires enough energy for successful collision by
increasing n. Hence the reaction rate and rate constant increase accordingly. Also the authors
hypothesised that as the reaction temperature increases, the thermal catalysis prevails the
autocatalytic effect of m.
Macan et al. [42] investigated the cross-linking kinetics of a DGEBA/poly(oxypropelene)
diamine (POP) resin system. In their study, isothermal DSC data was analysed using the
Sourour and Kamal model assuming m + n = 2. Based on the kinetic parameters obtained, m
and n found to be insensitive to temperature while the rate constants follow Arrhenius
temperature dependence. Larranaga et al. [83] observed the same insensitivity of reaction
orders to cross-linking temperature. They investigated the cross-linking kinetics of a
DGEBA-DDM epoxy-amine system and reported that the reaction orders did not seem to vary
very much with the cross-linking temperature. However, it is necessary to emphasis that the
kinetic models discussed in the above studies are based on empirical relations and may not be
able to interpret the exact reaction scheme for cross-linking of thermosetting resin systems.
Therefore, in-depth investigation of the influence of resin chemistry and the reaction
conditions on the reaction mechanism is crucial for developing general trends of reaction
orders as a function of reaction temperature.
There have been several efforts to improve the correlation between kinetic models and
experimental data [70]. Some of the modified models are discussed. Sourour and Kamal [70]
Page 37
25
investigated a DGEBA/m-phenylene diamine (m-PDA) resin system using isothermal DSC
analysis. Epoxy conversion was assumed based on two simultaneous reactions: initially the
reaction is initialised and catalysed by hydrogen-bonded electron-donating HX molecules
present in the system and secondly the reaction autocatalysed by the hydroxyl groups
generated during the reaction. Then the total rate of epoxy conversion was expressed as
below:
1 21 1d
k C B K Bdt
Equation 2.7
where C is the concentration of the HX molecules, B is the initial ratio of diamine equivalents
to epoxide equivalents and k1 and K2 are rate constants. The model showed good correlation
at lower epoxy conversions while a deviation was observed at higher epoxy conversions. The
authors suggested that the observed trend was due to the dependence of the rate constants on
the degree of conversion, which was not considered in the model.
Zhao et al. [84] also reported a discrepancy between the autocatalytic model and the
experimental data at a later stage of cross-linking with a DGEBF/3-methyl-1,2,3,6-tetra-
hydrophthalic anhydride (MeTHPA) system. As the reaction progresses, the model tends to
deviate due to the onset of gelation and vitrification. The authors proposed that the deviation
of the general autocatalytic model from the experimental data is due to the reduction in
reaction rate as a result of diffusion-controlled reaction rather than the effect of kinetic
factors. The investigators interpreted this trend based on free-volume theory. They used a
modified autocatalytic model by introducing a diffusion factor, d(), as shown below:
1 2 1nmd
k k ddt
Equation 2.8
Page 38
26
1( )
1 exp c
dC
Equation 2.9
where C is the diffusion coefficient and c is the critical conversion depending on the curing
temperatures. They found good correlation between the modified kinetic model and the
experimental data for the resin system suggesting diffusion-controlled effects at a later stage
of the cross-linking reaction.
In addition, the ultimate degree of conversion of thermosetting resins is dependent on the
cross-linking temperature. However, the Sourour and Kamal model does not consider
incomplete cross-linking reaction due to vitrification. It always gives the results that
conversion continues to unity or complete reaction when the prediction is performed. Several
studies have been discussed using the ultimate degree of conversion (max) achieved at a given
Tc to reflect the effect of vitrification in the kinetic models [80,81,85]. Kenny and Trivisano
[86] proposed a modified extended Kamal model and Equation 2.4 can be rewritten as:
1 2 max
nmdk k
dt
Equation 2.10
Musto et al. [80] investigated the reaction kinetics of a TGDDM/DDS epoxy resin system
using the general Sourour and Kamal model and Equation 2.10 and found good agreement
between the modified model and the experimental data. Their investigation was based on
FTIR spectroscopy in the near-infrared (NIR) and the mid-infrared (MIR) regions.
Page 39
27
2.3 Monitoring of cross-linking reaction in epoxy/amine
resin systems
The cross-linking of thermosetting matrix resins plays a key role in polymer-matrix composite
manufacturing. For many years, great attention has been paid to understanding the potential
impact of processing of thermosetting resin systems on the performance of related
engineering materials against mechanical and environmental conditions
[87,88,89,90,91,92,93]. The shrinkage associated with the cross-linking of thermosetting
resins contributes to a reduction in performance of the finished composite product [94,95,96].
Furthermore, storage conditions of thermosetting resins, cross-linking agents, prepreg
materials as well as of the reinforcing materials before processing, greatly affect the cross-
linking kinetics [97,98,99,100]. Therefore, it is commonly accepted that the optimisation of
processing parameters leads not only to optimise the mechanical performance of composites
but also reduces cycle time, energy requirements and hence reduces manufacturing and
maintenance costs [94,101,102].
2.3.1 Conventional analytical techniques
In general, numerous studies have been performed to monitor the cross-linking kinetics and
predict the effect of chemical, thermal and rheological changes associated with processing of
composites [103,104,105,106]. The most commonly used analytical techniques include FTIR
spectroscopy, DSC, Fourier transform Raman spectroscopy, fluorescence spectroscopy, high-
pressure liquid chromatography [49,107], gel permeation chromatography [63], nuclear
Page 40
28
magnetic resonance (NMR), tortional braid analysis (TBA) [84,108] and chemical titration of
the functional groups [107]. In torsional braid analysis, a glass braid consisting of woven
glass fibre yarns is impregnated with the unreacted resin to be analysed. The technique is a
complementary method to the DMTA technique and has been used to study polymer systems
that are liquids at the beginning of the reaction [109,110,111]. The impregnated braid is used
under a sinusoidal torsional mode of mechanical excitation to monitor the change in
viscoelastic properties of the resin due to cross-linking as a function of temperature or time.
The change in complex modulus as a function of cross-linking time can be used to determine
the gelation and vitrification of the resin system at the specified reaction temperature. The
dimensions of the supporting braid, number of glass yarns and the type of the weave are
dependent on the viscoelastic properties of the resin system. The stiffness of the braid under
torsion should not dominate the change in relatively weak stiffness of the resin during the
reaction [109]. Compared to cross-linking monitoring techniques such as DSC and FTIR,
dynamic mechanical themal analysis (DMTA) has the unique advantage of being able to track
the gelation and vitrification during cross-linking [112,113]. Rheological and dielectric
measurements have also been deployed to study the reaction kinetics of thermosets
[114,115,116,117,118,119].
This review is focussed only on the techniques those related to the current research project.
Fibre-optic sensing techniques that are demonstrated in this research were mainly based on
FTIR spectroscopy. Therefore, applications of FTIR spectroscopy for monitoring of cross-
linking will be discussed in detail. However, a brief review of using DSC for monitoring
cross-linking of epoxy resins will be given since the technique has been widely deployed for
characterisation of the cross-linking kinetics of thermosetting resins.
Page 41
29
2.3.1.1 Fourier transform infrared spectroscopy
Infrared spectroscopy is one of the main analytical techniques used in chemical analysis. The
technique has many advantages over other analytical techniques such as being able to give
quantitative comparison of functional groups in materials [120,121]. Various modes of
interaction between IR radiation and specimens are used; namely transmission, specular
reflection, diffuse reflectance, attenuated total reflection, emission and photo acoustics [122].
The advantages and disadvantages of using different modes of interaction of radiation with
the specimen, especially the choice of appropriate mode, instrumentation, sampling
techniques and spectral analysis have been discussed extensively [123,124,125,126]. Li et al.
[125] demonstrated using a non-contact diffuse reflectance attachment for quality control of
manufacturing prepreg cloth by the solution impregnation method. The technique was used
for determining the resin content, volatile content of ethanol and extent of pre-cure during
prepreg manufacturing. Calibration and validation of the measurement technique were carried
out using a principal regression components algorithm and reasonable agreement was
observed between predicted results and the online measurements. Occhiello et al. [127]
reviewed a range of spectroscopy techniques, which were used to characterise interfaces in
polymer composites.
In the recent past, demand for the technique was further broadened with hyphenated-FTIR
instruments with thermal characterisation techniques [103,128,129,130]. Hyphenated
techniques combined with FTIR spectroscopy reveal useful information compared with
individual analytical methods due to several inherent advantages of combined systems: (i) the
test specimen is same for both experiments; (ii) thermal and chemical properties of the
specimen are subjected to the same test environment and (iii) direct cross-correlation of the
thermal and chemical changes is possible due to the above-mentioned features. De Bakker et
Page 42
30
al. [103] demonstrated using a hyphenated system in which a DSC attachment was used to
achieve thermal and chemical properties of a TGDDM/DDS resin system during cross-
linking. Simultaneous monitoring of the cross-linking reaction was carried out on a resin
sample in a glass DSC pan and an empty glass pan was used as a reference for DSC
experiments. FTIR spectra were recorded under emission mode and good spectral sensitivity
was achieved with approximately 20 mg of resin, which creates a resin layer of 1 mm path-
length. The influence of instrumental baseline on the isothermal results showed marked effect
on the heat flow measurements. However, the deviation between experimental DSC values
and predicted results was used to define a correct baseline for isothermal DSC experiments
and good reproducibility of the experimental results was obtained. Reasonable agreement
was observed between cross-linking kinetics obtained using DSC and FTIR spectroscopy.
The infrared spectrum of a material contains absorption bands that appear at the natural
frequencies due to the vibration of atomic bonds in molecules. The atoms in the molecules
oscillate at specific frequencies unique for the bond strength and the masses of the atoms
bonded together [131]. The same atomic bond may have different oscillation modes at
different frequencies. Therefore at that particular frequency, the atoms absorb infrared
radiation and jump from the lowest quantum level to a higher excited quantum level.
Depending on the mode of atomic vibrations, characteristic absorbance bands appear in the
infrared spectrum showing the absorbance of IR radiation at the specified frequencies.
Peak assignments of epoxy/amine resin systems
Characteristic absorption bands of epoxy/amine resin systems in mid- and near-IR ranges
have been assigned. Since the fibre-optic sensor designs developed in the current study were
based on near-IR spectroscopy, attention of the review was only focussed on identification of
Page 43
31
epoxy/amine based resin systems in the near-IR range. A summary of peak assignments for
epoxy resins and amine-based cross-linking agents in the near-IR range is given in Table 2.2
and Table 2.3.
Table 2.2 Summary of peak assignments for epoxy resins in the near-IR range
[47,80,82,103,131,132,133,134,135,136,137,138,139,140].
Chemical group Peak assignment (nm)
Epoxy ring combination 2nd
overtone (epoxy ring stretching and C-H bending
vibration) 2205
Terminal epoxy group 1st overtone (–CH stretching vibration) 1650
Terminal epoxy group 2nd
overtone (C-H stretching vibration) 1131-1160
Hydroxyl combination (stretching and bending vibrations) 2042
Hydroxyl 1st overtone (O-H stretching vibration) 1428
Hydroxyl 2nd
overtone (O-H stretching vibration) 981
Hydroxyl combination (-OH vibration modes) 2090
Hydroxyl combination (-OH absorption/interactions) 2325
Hydroxyl due to moisture (- OH stretching vibration) 1908
Aromatic 1st overtone (C-H stretching vibration) 1670-1698
Aromatic ring combination (-CH stretching vibration) 2138, 2165
Aliphatic 1st overtone (C-H stretching vibration) 1732, 1773
Aliphatic 3rd
overtone (-CH asymmetric bending vibration) 1720
-CH overtones of –CH2, -CH3 1700-1770
Methyl symmetric bending “umbrella” vibration 2410-4260
Aromatic conjugated combination (C=C stretching vibration) 2136
Page 44
32
Table 2.3 Summary of peak assignments for amine-based cross-linking agents in the near-IR range
[47,80,82,103,131,132,133,134,135,136,137,138,139,140,141].
Chemical group Peak assignment (nm)
Primary amine combination band (N-H symmetric stretching and deformation
vibrations) 2024
Primary amine combination (-NH2 asymmetric stretching and bending
vibration) 1973
Aromatic amines – primary amine combination (N-H symmetric stretching and
C-N stretching vibrations) 2194
Combination band of secondary amine and overtones of symmetric and
asymmetric stretching vibrations of primary amine 1495-1535
Primary amine 1st overtone (N-H symmetric stretching vibration) 1521
Primary amine 1st overtone (N-H asymmetric stretching vibration) 1454
Primary amine 2nd
overtone (N-H asymmetric stretching vibration) 1020
Secondary amine 1st overtone (N-H stretching vibration) 1538
Functional group analysis of epoxy/amine resin systems during cross-linking
In addition, for qualitative identification of chemicals, FTIR spectroscopy is a useful tool for
determining relative concentrations of functional groups. The basis for quantitative analysis
of functional groups using the infrared absorbance spectrum is each functional group has its
characteristic frequency. The Beer–Lambert law relates absorbance to concentration of
specified functional groups or chemical species [120]. For a single compound in a
homogeneous medium, the absorbance at a frequency is proportional to the fractional change
in concentration of the compound and can be expressed as below [120]:
)exp(1 lcA Equation 2.11
For low thickness and low concentrations, the equation 2.11 can be reduced to:
Page 45
33
lcA Equation 2.12
where Aλ is peak area of absorption band at the wave length, λ, ελ is molar absorptivity at
wavelength, λ, l is the thickness of the sample and c is the fractional concentration. The molar
absorptivity is a function of the functional group as well as the wavelength at which the
characteristic absorbance band appears. The Beer–Lambert law can be extended for a
mixture of compounds at a specified wavelength. In general, for a mixture of n number of
different functional groups, the total absorbance, AT of the mixture at a given wavelength can
be written as [128]:
, 1 1 2 2 ...T n nA lc lc lc Equation 2.13
where ε1, ε2, …, εn and c1 , c2, …, cn are molar absorptivity values and concentrations of different
functional groups, respectively.
FTIR spectroscopy has been extensively employed not only for quantitative analysis but also
for quantitative analysis of monitoring of cross-linking reaction of epoxy/amine resin systems
[55,60,142,143,144,145]. In monitoring of cross-linking reaction of an epoxy/amine system,
the degree of conversion of a specific functional group as a function of reaction time can be
determined using the change in concentration of the functional group in the mixture. It was
shown that the peak area related to an absorption band is linearly proportional to the
concentration of the corresponding functional group in the mixture (see Equation 2.12)
[146,148]. Therefore using infrared spectroscopy, the degree of conversion of epoxide groups
with respect to a non-reacting chemical group (in most epoxy systems, aromatic C-H group)
can be determined using the equation below:
Page 46
34
, ,0
,0 ,
1EP t CH
EP CH t
A A
A A
Equation 2.14
where α is degree of conversion, AEP,0 and AEP,t are peak area related to t = 0 and t = t
respectively and ACH,0 and ACH,t are peak area related to t = 0 and t = t respectively.
Attention has been also paid to determining the change in concentration of other chemical
groups during cross-linking for predicting reaction kinetics and overall thermal and physical
properties of cross-linked resin systems. Among chemical reactions taking place during
cross-linking, reaction kinetics of primary amine, secondary amine, tertiary amine, hydroxyl
groups and ether links are of major importance. Different spectral manipulation methods
have been developed to investigate the contribution of different functional groups to
combination absorption bands [103,129,147,148,149,150]. Lohman and Norteman [141]
developed a method for determining primary and secondary amine concentrations using
characteristic absorption bands appear at 2023 nm and 1538 nm. Their method involved
using a series of concentration solutions of desired primary and secondary amines using
chloroform as a solvent and analysing near-IR absorbance spectra of each solution.
Calibration curves obtained for primary amines using the absorption band at 2023 nm were
used to determine secondary amine absorption by subtracting primary amine contribution.
Furthermore, molar absorptivities of the absorption bands also determined. The Beer-
Lambert law was validated for low concentrations of tetradecylamine in CHCl3. Crosby [149]
also reported using a similar chemical analysis to determine the contribution of primary and
secondary amine concentrations for the combination band at 1538 nm. In his work, different
solutions of dibutylamine and 1,6-hexanediamine in chloroform were used and near-IR
spectra were obtained for each primary amine/chloroform and primary amine/secondary
Page 47
35
amine/chloroform solution. Concentration of the secondary amine was determined by
subtracting the absorbance of primary amine from the absorbance of the combination band.
Alternatively, the author used Fourier self-deconvolution to determine the individual
concentrations of primary and secondary amines.
However, discrepancies were observed when applying predetermined molar absorptivities at
absorbance frequencies of primary and secondary amine using the above methods for
monitoring of cross-linking of epoxy/amine resin systems. Considerable influence of the
solvent used for making different concentration solutions of amines on the peak shift and the
peak intensity of the characteristic peaks was reported. Difficulties of using the molar
absorptivities obtained using the former method for cross-linking monitoring of epoxy/amine
resin systems were discussed. A negative absorption due to secondary amine groups was
observed in the early stage of cross-linking reaction of a TGDDM/DDS resin system [149].
Lohman and Norteman [141] hypothesised that the influence of type of solvent on the peak
intensity of the individual peaks contributing to the amine combination band at 1538 nm was
mainly due to the concentration or the purity of the solvent. In addition, the authors proposed
that the effect of solvent on the peak separation and peak broadening is due to amine-solvent
interactions. Therefore, the method showed less accuracy in determining the change in
concentration of primary and secondary amines during cross-linking. On the other hand,
although Fourier self-deconvolution splits the combination band into two separate absorption
peaks, the deconvoluted secondary amine peak still showed the combined effect of secondary
and primary amine [149]. To overcome these discrepancies, a mechanistic approach has been
deployed in which weight balance equations were used to determine the concentrations of
unknown chemical groups in the resin system using known concentrations
[46,53,80,132,148,151,152].
Page 48
36
Chiao [46] proposed a weight balance equation based on well-resolved epoxy and primary
amine absorption bands related to a TGDDM/DDS resin system and the equation is given
below:
0 0 0[ ] 2([ ] [ ] ) ([ ] [ ] )t tSA PA PA EP EP Equation 2.15
where [EP], [PA] and [SA] are molar concentration of epoxy groups, primary amine and
secondary amine, respectively. Subscripts 0 and t represent the start of reaction and a
particular time t, respectively. St John and George [151] proposed a method based on the
Beer-Lambert law for a mixture of chemicals and applied it to determine the change in
secondary amine concentration based on the combination band from 1507 – 1572 nm. In
general, for a mixture of n number of different functional groups, the total absorbance at
wavelength is given in Equation 2.13 [153]. For the combination band of primary and
secondary amine groups, Equation 2.13 can be rewritten as [80,148,151,152]:
1 2[ ] [ ]t tA E PA E SA Equation 2.16
where A is the area of the peak from 1507 – 1572 nm, and E1 and E2 are constants for the
primary amine groups and secondary amine groups, respectively.
For cross-linking of an epoxy/amine system, two main epoxy/amine reactions have been
identified (see Section 2.1.1) and the mass balance equation can be written as [151]:
0[ ] [ ] [ ] [ ]t t tPA PA SA TA Equation 2.17
Page 49
37
where [TA] is the concentration of tertiary amine groups. It was assumed that during early
stage of cross-linking, there is no reaction between the secondary amine and epoxy groups.
Then Equation 2.17 can be simplified as below:
0[ ] [ ] [ ]t tPA PA SA Equation 2.18
Xu et al. [53] discussed possible reaction mechanisms to satisfy the weight balance equations
proposed by both Chiao [46] and St John and George [151] and reported that Equation 2.15 is
only valid if etherification reactions are negligible. A method for defining the time period in
which Equation 2.18 is valid was proposed by Crosby [149]. The study involved employing
various techniques for determining secondary amine concentration using the combination
band from 1507 – 1572 nm. The findings have shown that a plot of primary amine
concentration based on the absorption peak at 2026 nm against epoxy concentration can be
used to find out the time period within which Equation 2.18 explains the state of the reaction.
The author concluded that the method proposed by St John and George [148,151,152] gives a
more accurate approximation compared with the alternative techniques assessed.
Monitoring of cross-linking of epoxy/amine resin systems
The mid-infrared (MIR) range, which extends from about 2500 to 25000 nm, consists of
fundamental absorptions of chemical groups such as C-H, N-H and O-H. However, the MIR
spectra of epoxy/amine systems are very complex, with the epoxy peak at 915 cm-1
, which is
difficult to follow as described by several authors [103,135,140]. Mijovic and Andjelic [154]
employed remote MIR spectroscopy to study the cure of a multifunctional epoxy/amine
formulation composed of diglycidyl ether of bisphenol-F (DGEBF) and 4,4‟-methylene
dianiline. They utilized a pair of gold-coated, hollow nickel tubes with NaCl windows bonded
on to each ends of the tubes for guiding IR beam across the resin sample, which contained in a
Page 50
38
disposable reaction vessel. The incoming IR beam travels along the receiving gold-coated
nickel tube by internal reflection, travels through the mixed resin sample and then guides
along the second reflective wave-guide towards the detector. Intensities of characteristic
absorption bands of epoxy/amine resin systems were monitored and used to evaluate the
degree of conversion. Good agreement was obtained between NIR data [155] and MIR data
up to about 60% conversion, after which point the MIR data quickly level off without
exceeding 75% conversion. The authors proposed that the discrepancy is due to the
interference of peaks appeared at 11049 nm and 10928 nm; however, they were unable to
develop a method to determine the actual conversion using MIR data.
Investigations on the use of remote near-infrared (NIR) spectroscopy to study reactive
polymeric systems have appeared in recent years [132]. The NIR wavelength region extends
from about 700 to 2500 nm and consists of overtones and combination bands that appear from
fundamental absorption bands found in the MIR region. In the NIR region, the frequency
range has one major advantage in that it can be transmitted through glass, which is a common
material used for containing chemical samples and also used for in situ spectroscopic
monitoring using silica multimode optical fibres [135,154]. The NIR spectral range mainly
contains overtones and combinations of stretching and bending vibrations of N–H, C–H, and
O–H groups and therefore NIR spectroscopy is a useful technique in mapping cross-linking
reactions in epoxy/amine resin systems [103].
As the epoxy peak at 2208 nm and the primary amine peak at 2024 nm appear in the region
between 1960 – 2500 nm, satisfactory quantitative information has been obtained for
epoxy/aliphatic amine resins. Mijovic et al. [136] investigated the use of NIR spectroscopy
for in situ monitoring of cross-linking reaction of commercial epoxy/amine resin systems and
Page 51
39
detailed band assignments for the epoxy/amine systems were presented. Xu and Schlup [47]
used an in situ NIR spectroscopic method to study the relative rates of reaction of
etherification and non-catalytic reactions of a TGDDM/methylaniline system. They reported
that even with excess epoxy in the epoxy/amine mixture, the non-catalytic amine reaction is
several times faster than the autocatalytic etherification reaction. Rigail-Cedeño and Sung
[132] used fluorescence, mid-IR and near-IR spectroscopic techniques to study the degree of
conversion of different formulations of DGEBA and low molecular-weight aliphatic
diamines. The cross-linking agents that used for the study were polyoxyethylenediamine
(POE) and POP. Good correlation was observed between the degree of conversion achieved
based on NIR spectroscopy with that achieved based on MIR spectroscopy. The change in
concentration of primary, secondary and tertiary bands based on absorption of primary amine
and epoxide bands were also plotted as a function of cross-linking time. DGEBA/POE
showed faster rate of amine conversion compared with that of DGEBA/POP resin system.
However, no attempt was made to correlate this information with kinetic models.
Min et al. [156] studied the influence of cross-linking reactions of DGEBA/DDS on the
development of glass transition temperature, Tg. The degree of conversion as a function of
time was monitored using NIR spectroscopy. Assuming Tg is linearly proportional to the
degree of conversion, a relationship was established between the extent of reaction based on
NIR spectroscopy and the Tg of the system. The Tg of a cross-linked polymer was expressed
as a function of the Tg of unreacted resin mixture (Tg0), the limiting Tg of cross-linked resin
(Tg∞), the degree of conversions of linear polymerisation reaction (L) and the cross-linking
reactions (C):
0 0( ) ( )g g L g L g C g g LT T T T T T Equation 2.19
Page 52
40
where (Tg∞)L is the limiting Tg of linear polymer of infinite molecular weight. In their study,
epoxy-primary amine reaction was considered as linear polymerisation with the epoxy-
secondary amine reaction contributing for branching and cross-linking. The change in
concentration of epoxy, primary amine and secondary amine groups was achieved using NIR
spectroscopy. Good correlation was observed between the predicted Tg during cross-linking
and that measured via DSC.
2.3.1.2 Differential scanning calorimetry
One of the widely accepted means of determining resin cross-linking kinetics is through the
application of DSC [74,76,157,158,159]. In DSC analysis, the released heat during the
reaction is measured and quantified to determine the degree of chemical reaction or
conversion. A detailed review has been done on kinetic analysis for a number of epoxy
systems based on DSC [160].
Analysis of reaction kinetics under DSC is mainly divided into two categories; one is
isothermal scanning and the other is dynamic scanning [157]. There are advantages and
disadvantages of each different approach [157,161]. Many workers have investigated
quantitative and qualitative comparisons between an isothermal scan and dynamic scan of
epoxy resins. In an isothermal scan, both rate of cure and conversion change at a constant
temperature as the reaction proceeds can be monitored. The curve-fitting to determine
reaction kinetics is performed by correlating conversion and rate of reaction measured at an
isothermal temperature and it can be done successively for another isothermal temperature.
Then, the effect of temperature can be found from the parameters determined at the former
Page 53
41
stage. Therefore, most empirical rate equations are suitable for quantifying isothermal DSC
data. The isothermal approach is equally valid for standard (nth
order) and autocatalysed
resins. However, isothermal experiments clearly showed possible errors in both the initial
and final stages of reaction [161,162]. Fava [162] observed reliable repeatability of
isothermal results at low reaction temperatures. However, at higher isothermal temperatures a
shift of the conversion curve along the time axis was noticed due to unavoidable temperature
lags in the early stage of reaction. In addition, at higher reaction temperatures a lower HT was
observed due to the interference of the heat absorbed during sample equilibrating at the
isothermal temperature and the exothermic cross-linking reaction. Therefore at higher
reaction temperatures, the total heat of reaction that can be calculated using the thermogram is
not accurate because there can be a significant progress of the chemical reaction before
reaching the temperature of the isothermal scan. In other words, initial isothermal data are not
sufficiently accurate. To overcome this problem, Brnardic et al. [75] proposed a method in
which the value of the heat flow was extrapolated to time = 0. Their investigation was based
on a DGEBA/POP resin system. In an alternative study, the sample cell was preheated to a
desired reaction temperature before insert the resin sample to overcome the temperature lag in
the early stage of reaction [163]; however, the authors concluded that the lower conversions
achieved with increasing reaction temperature may be due to the increasing error in
determining the initial reaction.
In contrast, direct manipulation of dynamic temperature scans is identified as a time-efficient
method for studying reaction kinetics. Especially, the dynamic scanning mode can be used to
achieve more accurate results for fast cross-linking resins if a suitable model is given. For
kinetic analysis, the measured heat flow at time, t was assumed to be proportional to the rate
of conversion at the specified time [85,164,165]. As the compound reaches a high degree of
Page 54
42
conversion at higher temperatures, the diffusion of the unreacted groups involves the
movement of the highly cross-linked network and the reaction cannot achieve a complete
conversion within a short period of time [71]. Therefore, lower HT in dynamic DSC scan was
reported compared with that obtained in isothermal scan at reaction temperatures above Tg of
the resin system. Kim et al. [85] revealed that the total heat of reaction (HT) under dynamic
scans is sensitive to heating rate and decreases with increasing scan rate and suggested this
trend is due to the use of a linear baseline. In their work, the baseline was approximated by a
straight line connecting the assumed starting point and ending point of the chemical reaction.
Nevertheless, they were unable to predict the effect of heating rate on HT using baseline
correction. Lu et al. [165] demonstrated using a modified Avrami equation for predicting
cross-linking kinetics of a DGEBA/4,4‟-methylene dianiline (MDA) using DSC dynamic
scanning mode. The modified model was capable of explaining the whole cross-linking
process; however, the dynamic data revealed two reaction mechanisms depending on the
reaction temperature. The activation energy obtained for the lower reaction temperatures
agreed well with the isothermal data and the authors hypothesised that this could be due to
similar reaction mechanism under isothermal conditions and the primary stage of dynamic
conditions during which the reaction is kinetic-controlled. Zvetkov [79] investigated a
DGEBA/m-PDA resin system using dynamic DSC scans. The author proposed a four-stage
kinetic analysis in which following were considered: (i) effect of heating rate; (ii) peak
temperature of the dynamic DSC thermograms; (iii) integral and differential curve fitting for
single DSC curves and (iv) comparison of predicted model and the experimental data. The
approach showed good correlation at lower heating rates and he hypothesised that the
deviation of the model at higher heating rates may occur due to side reactions taking place at
higher degree of conversion.
Page 55
43
It is known that both isothermal and dynamic scan modes may be applied independently, but a
combination consisting of the use of the isothermal method to determine the reaction degree
and the dynamic method to evaluate the maximum enthalpy involved in the process can be
more useful [166,167,168].
2.3.2 In situ fibre-optic based techniques
It is important to note that most of the analytical investigations mentioned in Section 2.3.1
were carried out in laboratory environment. This can underestimate the real effect of
processing conditions in industrial manufacturing techniques such as autoclave processing,
filament winding, pultrusion and resin transfer moulding [169]. Among in situ cross-linking
monitoring methods, electrical-based sensing techniques attracted considerable demand over
the last decade as reliable process monitoring solutions in composites [170]. Dielectrometry
[171,172,173,174] and electrical resistivity [115,175,176] are known to be well-established
sensing technique used in the composites process monitoring.
None of these direct methods may be used to measure the extent of reaction at specific
locations within a large structure during fabrication. Also cross-correlation of dielectric data
with other measurement methods such as spectroscopy and thermal analysis (DSC) seems to
be difficult as the dielectric properties depend on frequency. Therefore further data
processing is required to reduce the dielectric data to cross-linking kinetics that are free from
frequency effects. However, attempts have been made to quantify cure kinetics using
dielectric parameters those can provide absolute values of viscosity, reaction rate and degree
of conversion [115,177,178]. Experimental studies are also reported on Hall Effect sensing
[179] and electromagnetic wave monitoring [180], which are capable of measuring localised
Page 56
44
reaction kinetics. These methods give a qualitative interpretation of cross-linking, which
involves complex measurement systems and require frequent calibration [181].
Increased attention has been paid to using fibre-optic sensing techniques for monitoring of
cross-linking reaction of thermosets, due to their outstanding sensing capabilities compared
with that of other electrical-based sensing techniques [170,182,183]. They are capable of
monitoring chemical reactions continuously even in harsh environments in which most of the
electrical-based sensors fail to exhibit their sensing performance. Smart composite
applications with embedded fibre-optic sensors with in the structure for process monitoring
have been proposed and investigated [181,170,184,185].
One of the advantages of choosing optical fibre-based sensors is that the dimensions of
sensors are small compared with the electrical-based sensing techniques [186]. For example,
in the case of biomedical sensing, sensors must be small and can utilise only a fairly restricted
set of biocompatible materials [187,188]. On the other hand, low cost, multi-sensing
capabilities [189,190] and long life with minimum maintenance are important requirements
for process and/or health monitoring of smart composite structures.
2.3.2.1 Absorption-based fibre-optic techniques
Among the wide range of fibre-optic techniques developed for remote sensing, absorption-
based sensors have attracted considerable interest due to their low-cost, robustness, ease of
use and low requirements for sample preparation [191,192]. Examples of these types of fibre
sensors include those based on absorption and fluorescence [193]. Two general groups of
spectral-based optical sensors are available, those that directly probe a spectro-chemical
Page 57
45
property of the sample [21] and those that indicate or infer the presence/absence of a chemical
species of interest [194].
Fibre-optic Fourier transform infrared spectroscopy
George et al. [147] and Rogers et al. [195] studied the effect of microwave and thermal
processing on cross-linking kinetics of TGDDM/DDS epoxy resin systems using a fibre-optic
sensor design in transmission mode. In addition, the effect of cell geometry on the cross-
linking kinetics of microwave processing was investigated using rectangular and cylindrical
cell in comparison with the thermal processing. Fluorine-doped silica-clad silica fibre was
used for sensing and two cleaved fibres were aligned facing each other using a micro-
capillary as shown in Figure 2.7. The cavity was filled with resin and near-IR spectra were
recorded on-line during cross-linking.
Figure 2.7 Schematic diagram of the NIR transmission cell used for process monitoring [147,195].
The change in peak area of absorption bands due to primary amine and epoxy groups was
analysed and an anomalous trend of rate of chemical conversion was observed with
microwave processing compared with that observed with thermal processing. The observed
behaviour was explained in terms of thermal gradient in two different cell geometries used for
microwave processing. Mijović et al. [136] proposed a similar fibre-optic transmission cell
Page 58
46
design for in situ process monitoring in which transmitting and receiving fibres are aligned in
a capillary. Reaction kinetics of selected epoxy/amine resin systems were investigated using
remote near-infrared transmission spectroscopy and reproducible spectral quality was
achieved with the sensor design. A slower initial rate of reaction was observed in a
DGEBA/DDM resin system compared with that of a DGEBF/DDM resin system and the
authors hypothesised that the trend was due to the presence of [-C-(CH3)2] group in the former
epoxy resin system.
Powell and co-workers [196] reported fibre-optic transmission spectroscopy for monitoring
reaction kinetics of a DGEBA/1,6-diaminohexane resin system. A transmission cell was
constructed by holding two cleaved silica optical fibres on a pre-cured epoxy alignment V-
groove as shown in Figure 2.8.
Figure 2.8 Schematic diagram of transmission spectroscopic sensor [196].
Page 59
47
Figure 2.9 Schematic diagram of optical fibre evanescent absorption sensor/stripped cladding
refractive index sensor [196].
The authors also carried out a comparative investigation on monitoring of cross-linking
reaction based on both evanescent wave absorption spectroscopy and intensity modulation of
evanescent excitation using high-refractive index optical fibre. A schematic illustration of the
stripped section of an optical fibre for evanescent sensing is shown in Figure 2.9. Good
spectral quality was observed with the single-fibre transmission spectroscopy. Several other
on-line and off-line sensor design configurations for cross-linking monitoring based on
transmission spectroscopy have been successfully demonstrated [81,82].
Calvert et al. [21] reported on another sensing configuration in which a single embedded fibre
was used for obtaining near-infrared spectroscopy. A cleaved silica-clad silica fibre was
embedded in a free-formed epoxy substrate facing perpendicular to a flat edge of the substrate
as shown in Figure 2.10.
Page 60
48
Light
Optical fibre
To spectrometer
Resin block
Light
Optical fibre
To spectrometer
Resin block
Figure 2.10 Schematic diagram of an optical fibre embedded in a resin block. [21].
The gap between the substrate edge and the fibre end face was approximately 2 mm. The
substrate edge was illuminated while the free end of the fibre was connected to a near-infrared
spectrometer for spectral acquisition. Infrared radiation coupled in to the fibre through the
thin layer of resin was used for spectroscopic measurements. However, the feasibility of
using this sensor design for on-line process monitoring is restricted due to the following
limitations: (i) strict requirements of sensor location, (ii) the surface of the substrate edge
needs to be smooth in order to reduce radiation loss due to scattering and diffuse reflections
and (iii) external illumination is required which may not be possible with most industrial
processing techniques.
Liu and Fernando [197] proposed and investigated a method for measuring homogeneity of
mixed multi-component thermoset resin system using absorbance spectroscopy under
transmission mode. A two-wavelength optical fibre-based sensor system was successfully
demonstrated for on-line monitoring of amine concentration in commercial epoxy/amine-
based resin systems. Furthermore, the feasibility of using fibre-optic spectroscopic sensor
designs in reflection mode for in situ cross-linking monitoring was demonstrated. The
Page 61
49
majority of research work in the literature has been focussed on designing non-contact
reflection spectroscopy [129,130,138,198].
Fibre-optic evanescent wave spectroscopy
Fibre-optic evanescent wave spectroscopy has been extensively used as absorption-based
sensing technique where absorption characteristics of excited evanescent wave at the
fibre/analyte medium are monitored [ 137,199,200,201,202]. The sensing technique has also
been successfully demonstrated using industrial reinforcing glass fibres for cross-linking
monitoring of composites [203,204,205] and issues related to using reinforcing fibres as a
sensor have been discussed in detail [206]. Hence this technique possesses major advantage
of eliminating dimensional mismatch among reinforcing fibres and conventional optical
fibres.
Fibre-optic fluorescence spectroscopy
Fluorescence spectroscopy involves analysing fluorescence from a sample, which contains
fluorescence-emitting compounds. It involves using a beam of light, usually ultraviolet light,
that excites the electrons in molecules of certain compounds and causes them to emit light of
a lower energy, typically, but not necessarily, visible light. In fluorescence spectroscopy, a
molecule of the fluorescence-emitting compound absorbs a photon and jumps from its ground
electronic state to an excited electronic state. The molecule drops down to the ground
electronic level again emitting a photon due to collisions with other molecules. Depending on
the vibrational energy level in the ground state, the photon may have different energies and
thus frequencies. Therefore, fluorescence spectroscopy involves analysing the emitted light at
different frequencies and relative intensities.
Page 62
50
Use of fibre-optic fluorescence spectroscopy for monitoring the cross-linking reactions of
thermosetting resins was based on the shift of fluorescence peak due to the change in resin
viscosity during cross-linking. In situ fibre-optic fluorescence spectroscopy was deployed for
the investigation of cross-linking process of epoxy resins [207,208,209,210,211]. In more
detailed studies, evanescent wave fluorescence spectroscopy was applied for process control
of resin transfer moulding (RTM) [212,213]. The evanescent fluorescent sensor design is
based on the monitoring of the fluorescence wavelength shift that can be monitored upon
evanescent excitation at the fibre/analyte surface.
Fibre-optic Raman spectroscopy
When electromagnetic radiation interacts with a vibrating molecule in matter and the scattered
photon is lower in energy by an amount equal to a vibrational transition, Raman scattering
occurs. Raman spectroscopy has become a very popular in in situ process monitoring
technique in composites due to recent advancements in associated instrumentation [214].
Cooney et al. [215] discussed the effect of optical properties of optical fibres on Raman probe
designs and probe performance. Different fibre-optic Raman probe designs were evaluated in
terms of probe geometry for laser transmission and collection of backscattered light. They
concluded that the degree of sensitivity and relative sample location can be optimised by
varying probe design parameters such as fibre radius, number of fibres, fibre separation,
numerical aperture and presence or absence of focussing lenses. Fibre-optic Raman
spectroscopic techniques also had a significant advancement in assessing reaction kinetics in
composite processing [216,217,218]. Aust and co-workers [219] used fibre-optic Raman
spectroscopy for in situ cross-linking monitoring of a DGEBA/POP epoxy resin system.
They were capable of resolving polymer cracking at the fibre/resin interface with their sensor
Page 63
51
configuration in which the distal end of an optical fibre was inserted into a Teflon®
tube that
has been filled with an epoxy resin system to be examined.
Optical fibre Teflon tube filled with polymerOptical fibre Teflon tube filled with polymer
Figure 2.11 Schematic diagram of the fibre-optic Raman probe tip. [219].
Lyon et al. [217] employed a pair of 250 m quartz, step-index fibres for acquiring in situ
fibre-optic Raman spectroscopy of a PEG/diethylamine (DEA) resin system during cross-
linking. The fibre-optic probe consists of two polished optical fibres bonded side-by-side into
a SMA connector for immersing into the epoxy/amine resin system. A GaAlAs diode laser
was used with a bandpass filter and a microscope for illuminating the resin sample at the
probe tip and the second fibre in the probe was used to collect the scattered light. A
holographic filter and collimating lenses were used to focus the scattered light to a charge-
coupled device (CCD) detector. Spectral calibration of Raman spectra was carried out in the
MIR region using different concentrations of DGEBA dissolved in DGEBA-DEA adduct.
Cross-linking kinetics of the epoxy/amine resin system at room temperature was investigated
using the change in ratio of Raman scattered intensity of the characteristic peak at 1245 cm-1
due to epoxide groups. Good agreement was observed between the data obtained using fibre-
optic Raman spectroscopy and FTIR spectroscopy.
Page 64
52
2.3.2.2 Intensity-based fibre-optic techniques
Zimmermann et al. [220] and Lam and Afromowitz [221,222] reported a fibre-optic sensing
technique where modulation of transmitted light intensity through a sensing fibre was used as
a measure of the extent of cross-linking. The sensing fibre was fabricated using the same
resin system that was used as matrix in the composite prepreg to avoid the possible negative
influence of embedded fibre-optic sensors on the structural integrity of the composite. It was
observed that the transmitted light intensity is a function of the refractive index of the resin.
Conventional multimode fibres were used to guide light to and from the epoxy-sensing
element. In addition, the sensing concept was also demonstrated under two modes of
operation; reflection and higher-order launch modes and feasibility of operating the sensor
under each mode was discussed [181]. Lam and Afromowitz [223] derived a model for
optical transmission characteristics of the sensor design. Moreover, the model can be used
successfully to describe reaction kinetics of the cross-linking process based on the sensor
response. The same sensing principle was applied for composite process monitoring based on
intensity modulation of transmitted light through de-cladded optical fibre [224]. In an
alternative approach, the sensing concept was demonstrated for monitoring of cross-linking
reaction in hot-press, model autoclave and also in a large industrial autoclave [225] and for
flow control and cross-linking monitoring of resin transfer moulding [226].
A simple fibre optic technique for cross-linking monitoring of epoxies based on the principle
of Fresnel reflections has been studied. When light travels from one medium to another
medium which has a different refractive index from that of the first, it undergoes both
reflection and refraction at the interface. The fraction of the incident light reflected back to
the incident medium at the interface is known as the Fresnel reflection [227]. The sensor
configuration consists of cleaved fibre inserted in to the composite structure where the
Page 65
53
reflected light intensity is measured as a function of cross-linking [82,149,228,229,230]. The
sensing principle is based on the refractive index mismatch between resin and the fibre core at
the resin/fibre interface and the sensor configuration has inherent advantages such as simple
and inexpensive design and less induced effects within the composite structure due to the
sensor dimensions. The same phenomenon of Fresnel reflection is used in a different fibre-
optic design, which can be used not only for process monitoring but also for structural health
monitoring [231]. In this sensor design, a conventional extrinsic Fabry-Perot interferometer
(EFPI) was used with a modified reflector fibre to monitor degree of conversion based on
reflectometry. In the modified sensor design, the free end of the reflector fibre was cleaved.
The fibre illumination source and the Fabry-Perot cavity length were chosen such that
reflected light intensity at the cleaved reflector fibre was used for process monitoring while
the EFPI sensor can be used for strain measurements after processing.
Surface plasmon resonance has also been exploited in various forms to study surface and bulk
chemical reactions. Fibre-optic sensors based on this phenomenon demonstrate high
sensitivity to refractive index changes and allow cross-linking reactions to be monitored
directly, without the need for a reagent [232].
2.3.2.3 Other fibre-optic techniques
Recently, a considerable research effort has been focused on using fibre Bragg grating (FBG)
sensors for chemical sensing [233,234]. These sensors have a number of distinct advantages
over other sensing schemes; one of the most important of which is that the sensed information
is encoded directly into wavelength, which is an absolute parameter [235,236]. Therefore the
Page 66
54
output does not depend directly on the total light levels, losses in the connecting fibres and
couplers, or recalibration or re-initialisation of the system.
Because a FBG is compact and simple in fabrication, it has become an important component
for optical sensing devices in measuring process monitoring in composites
[237,238,239,240,169]. Long-period gratings (LPG) have been used for flow monitoring and
cross-linking monitoring in resin transfer moulding (RTM) [241]. Buggy et al. [237]
presented a methodology to obtain a change in refractive index of resin during processing
using LPG and tapered fibre Bragg gratings (TFBG). Furthermore, FBG sensors also can be
used for monitoring real-time strain development in composites during processing [242].
In addition to multiplexed FBG sensor arrays, fibre-optic sensors based on optical time
domain refractometry (OTDR) are also used for process monitoring where multiplexing of
sensors is required [243].
Page 67
55
2.4 Hygrothermal ageing in epoxy/amine resin systems
2.4.1 Nature of water in epoxy resins due to moisture absorption
The importance of understanding the absorption mechanisms and the nature of water in epoxy
resins has been widely emphasised and investigated. Water is said to be present in two forms
in cross-linked thermosetting resins [15,244]: bound and unbound water. Water molecules
occupying the free volume present in polymers are referred as unbound/free water. On the
other hand, water molecules that are chemically attached to hydrophilic functional groups in
polymers such as hydroxyl and amine groups are considered as bound water [245].
A systematic approach was reported by Soles et al. [246] to quantify the contributions of free
volume and polar interactions on equilibrium moisture content in various epoxy amine
systems using positron annihilation lifetime spectroscopy (PALS). They summarised that the
existence of free and bound water is interactive and competitive and the dominating factor
strongly depends on the network topology of the epoxy/amine system and the cross-linking
density. However, the same authors [247] reported that the absorption kinetics of water in the
resin systems studied is independent of the free volume present in the resin. Furthermore,
they postulated that the free volume present in the polymer only takes part in the initial stage
of diffusion in the dry polymer and the polar interactions govern the absorption kinetics in
epoxy/amine resin systems. They also have given a graphical interpretation to explain the
above contradictory conclusions and suggested that in epoxy/amine systems, nanopores
associated with cross-linked junctions assist water molecules to be transported in to the
membrane but the association/disassociation of hydrogen bonding between polar sites in the
Page 68
56
epoxy and water molecules regulates the diffusion kinetics [248]. In other research, Li et al.
[249] observed a similar absorption mechanism and stated that the equilibrium moisture
content of a polyetherimide (PEI) modified DGEBA/DDS epoxy system is insensitive to the
free volume.
Zhou and Lucas [250] suggested that there are two main types of absorbed water in epoxies
while Apicella and co-workers [251] proposed that there may be three types of absorbed
water in epoxy resins: (i) formation of a solution of polymer and solute, (ii) adsorption to
hydrophilic groups via hydrogen bonding, and (iii) absorption into the “holes” of the glassy
structure. In the former work, the authors investigated the sorption characteristics of
DGEBA/meta-phenylene diamine (mPDA) and TGDDM/DDS systems based on nuclear
magnetic resonance (NMR). They suggested that the absorbed water can adhere to the epoxy
main chain via single hydrogen bonds (Type-I), which posses low activation energy or
multiple interconnecting hydrogen bonding (Type-II) at higher conditioning temperatures and
longer exposure time. They postulated that the Type-I water breaks the original van der Waals
forces presented in the polymer network dominating plasticisation while the Type-II bond
complexes dominate secondary cross-linking between polymer chains. Apicella et al. [251]
studied DGEBA/TETA and TGDDM/DDS systems based on gravimetry and DSC analysis
and discussed possible absorption mechanisms in both resin systems.
Page 69
57
2.4.2 Fundamental laws of diffusion in polymers
2.4.2.1 Fickian diffusion
Peppas and Meadows [252] and Frisch [253] reviewed theories involved in water diffusion in
glassy polymers. They discussed two main approaches that have been employed for
describing transport phenomenon of low-molecular weight substances in polymers. One
approach is based on the principles of irreversible thermodynamics that employs
phenomenological coefficients to correlate the diffusion gradient across the membrane [254].
The most popular approach is based on the generalised Fickian diffusion equations derived for
steady-state diffusion of binary systems [255,256,257,258]. The moisture absorption
behaviour of polymeric materials has been treated as a steady-state or diffusion-controlled
process as described by Fick‟s first law [259,260]:
cj D
x
Equation 2.20
where j is flux in the x direction, which is along the thickness of a specimen and the only
direction in which mass transfer is taking place, D is diffusivity/diffusion coefficient and c is
the concentration of diffusing species.
The conservation of species equation in one dimension is given by:
cj
t x
Equation 2.21
where t is time.
Page 70
58
Combining Equation 2.20 and 2.21, the one-dimensional diffusion in a specimen of thickness
L and with constant diffusivity is expressed as:
c cD
t x x
Equation 2.22
Assuming the temperature and the diffusion constant are constant inside the material, based
on Fick‟s second law Equation 2.22 can be written as:
2
2
c cD
t x
Equation 2.23
Applying appropriate boundary conditions for a specimen exposed to water on both sides and
for constant D, the solution to Equation 2.23 leads to the following expression [260]:
2 2
20
2 18 11 exp
2 1
t
m
D m tM
M m L
Equation 2.24
where Mt is absorbed moisture at time, t and M∞ is the equilibrium moisture content.
For 2
0.05Dt
L , Equation 2.24 can be approximated to
12
1 22
4tM Dt
M L
Equation 2.25
Shen and Springer and co-workers [255,261] demonstrated the absorption kinetics of
unidirectional and quasi-isotropic Fiberite T-300/1034 and woven Fiberite T-300/976
Page 71
59
composites based on a Fickian model. Effects of different hygrothermal conditions were
investigated and good correlation was observed with the model and experimental results
[262].
2.4.2.2 Non-Fickian diffusion
It has been found that in practical situations, the accuracy and validity of considering the
diffusion coefficient as a constant is dependent on the chemical composition of the polymer
and the hygrothermal exposure conditions [252,263,264]. Deviations from Fickian diffusion
towards anomalous transport behaviour have been observed for many polymers
[246,247,249,265]. Some of the basic assumptions made for deriving Fickian diffusion
models about mass transfer break down in glassy polymers. Glassy polymers are not at
equilibrium, but they relax slowly towards it. Due to this viscoelastic relaxation of polymers,
the Boltzmann scaling in absorption is no longer satisfied [266]. In these cases the diffusion
coefficient becomes dependent not only on the temperature, but also on the exposure time and
the concentration [267,268]. Furthermore, moisture uptake does not reach saturation, but
increases slowly with time. Therefore the prediction of diffusion phenomenon in complex
systems including multi-components systems such as composites is not possible with simple
kinetic models. In case of composites, the absorption kinetics of water depends on the
diffusivities of fibres and matrices, fibre volume fraction, void content, residual stresses and
the geometry of the reinforcing fibres [269,270,271].
Carter and Kibler [272] suggested a dual-mode sorption model to explain the anomalous
diffusion behaviour of water in epoxy resins. Their model is based on the existence and
interactions of mobile and bound water molecules within a material and derived expressions
for explaining diffusion behaviour of water are summarised below. The model assumes the
Page 72
60
mobile water molecules diffuse with a concentration-independent diffusion coefficient, D and
become bound with a probability per unit time and the bound molecules become mobile,
with a probability per unit time . Also at time t, the number of mobile molecules per unit
volume of the material is n and the number of bound molecules per unit volume is N. A value
was defined as the parameter that determines the rate of saturation of absorbed moisture in
the material based on one-dimensional Fickian diffusion theory and is given below:
2
2(2 )
D
Equation 2.26
where 2 is the thickness of the specimen. Furthermore, assuming the diffusion of mobile
molecules obeys the simple diffusion theory, for the one-dimensional case, the molecular
number densities at position z along the thickness and time t satisfy the coupled pair of
equations:
2
2
n n ND
z t t
Equation 2.27
Nn N
t
Equation 2.28
Solutions for Equation 2.27 and 2.28 can be obtained by considering boundary conditions for
an initially dry specimen exposed to a constant hygrothermal conditions on both sides. At t =
0, the appropriate boundary and initial conditions are:
n(z,0) = 0 and N(z,0) = 0 for z
and
Page 73
61
n(,t) = n∞ and n(-,t) = n∞ for all t.
Using the above boundary conditions, expressions for the spatial distribution of the bound
molecules N(z,t) and the mobile molecules n(z,t) can be expressed as:
( 1) 2( )
0
4 ( 1)1
( , )
exp exp cos2
lodd
l l l
l l l l
l r rN z t n
lzr r t r r t
Equation 2.29
( 1) 2( )
1
( 1) 2( )
1
4 ( 1)1
( , )
exp exp cos2
4 ( 1)
exp exp cos2
lodd
l l l
l l l
lodd
l l
l l l
l l l
l r rn z t n
lzr r t r r t
n r rl r r
lzr t r r t
Equation 2.30
where
2
2 2 214
2lr l l l
Integration of the above results along the specimen thickness gives the moisture uptake (Mt)
in an initially dry one-dimensional specimen after exposure time t, is given by:
Page 74
62
( )
21
( )
1
exp exp81
exp exp8
oddl l l l
l l l
t
oddl l l l
l l l
r r t r r t
l r r
M M
r r t r r t
r r
Equation 2.31
The above equation can be simplified when 2 and 2 are both smaller compared with , as
follows:
2( )
21
81
1
l toddt
l
t
t t t
ee
l
M M
e e e
; ; 2,2 Equation 2.32
When = 0, Equation 2.31 reduces to one-dimensional Fickian diffusion. For short exposure
times where t is approximately less than 0.7, Equation 2.31 can be approximated as follows:
23
4tM M t
; ; 2,2 , 0.7t
Equation 2.33
Also, for longer exposure times when t is large compared with unity, Equation 2.31 can be
approximated as follows:
1 t
tM M e
2,2 ,
1t Equation 2.34
Page 75
63
Furthermore, the moisture uptake seems to be consistent with a quasi-equilibrium moisture
content which appears at times, t = 5 and is given by:
tM M
; 5t
Equation 2.35
Popineau et al. [273] observed the same absorption phenomenon in an ambient-temperature,
flexible epoxy adhesive confirming the validity of the Carter and Kibler model [272] that
explains the dual-mode/Langmuir-type absorption. They employed deuterium NMR analysis
to study the mobility of water absorbed. They have postulated the water transport in the
epoxy system in four steps assuming two types of absorbed water, “free/mobile” and
“bound/clustered” water:
“(i) at the beginning of absorption, molecular water with strong interactions
diffuses into the polymer. These are „solo‟ molecules and thus quite free or
mobile; (ii) after a given absorption time (depending on the temperature), the
interaction sites for molecular water become saturated: absorption reaches a
quasi-equilibrium; (iii) water absorption recommences, but water molecules can
only stay in micro voids, and form clusters. These are large, inertial and thus, to
all intents and purposes, bound and (iv) water absorption reaches a real
equilibrium when all the micro voids are filled”.
They highlighted that the terms, mobile and bound used were referred to the kinetics of the
types of water and not directly to interactions of water with the polymer molecules.
Reasonable correlation was observed between NMR results and the Carter and Kibler model.
Page 76
64
Marsh et al. [274] observed multi-stage diffusion behaviour of water in neat epoxy and glass-
epoxy composites. Epoxy resin system used was a blend of a brominated bisphenol A and
Cresol Novolac, with dicyanamide as the cross-linking agent. They investigated the
applicability of the Carter-Kibler model and the relationship of the conditioning temperature
and the kinetic parameters, and . Furthermore, they proposed a method of modelling
multi-stage diffusion characteristics of water considering time-dependent diffusion
coefficient. The diffusion coefficient was obtained using a simplified one-dimensional
Fickian diffusion model proposed by Shen and Springer [255] and given below:
34
21 exp 7.3t i i
DtM M M M
L
Equation 2.36
where Mi is initial moisture content. Equation 2.36 can be rearranged as follows:
432 1
ln7.3
t
i
M MLD
t M M
Equation 2.37
Different stages of sorption isotherms were analysed in terms of the diffusion coefficients
corresponding to each stage. They observed a decrease in diffusion coefficient as a function
of immersion time due to the endothermic nature of the sorption process within the epoxy
system.
Roy et al. [268] proposed and validated a new methodology based on finite element analysis
(FEA) for characterising non-Fickian diffusion in an epoxy adhesive. The model was based
on history-dependent diffusion related to viscoelastic relaxation of polymers. They modified
Page 77
65
the one-dimensional Fickian diffusion model considering time-varying diffusivity of water.
Assuming that the diffusivity can be expressed in the form of a Prony Series:
0
1
( ) 1 r
Rt
r
r
D t D D e
Equation 2.38
where D(t) is time-varying diffusivity, D0, Dr are unknown temperature-dependent Prony
coefficients, r are the corresponding retardation times and R is the number of terms in the
Prony series.
Substituting Equation 2.38 in Equation 2.24 results in an expression for fraction of moisture
uptake as a function of time:
2 2
2
2 20
0
0
(2 1)
8 11 exp
(2 1)
1r
t i
mi Rt
r r
r
m
hM M
M M m
D D t e
Equation 2.39
where Mi is the initial moisture content. Good agreement between the predicted model and
test data was observed at all temperatures that were considered. However, it was stated that
defining a universal model to describe all types of moisture sorption phenomena may not be
practical as the diffusion and absorption mechanism is complex and specific to molecular
interactions between the water and polymer network of interest [272,274].
Page 78
66
2.4.3 Parameters affecting the diffusion kinetics of water
2.4.3.1 Influence of temperature
Temperature has a most profound influence on the absorption kinetics. The temperature
dependence of the diffusion coefficient assumed to be followed the Arrhenius relation and is
given as follows [275]:
0 exp dQD D
RT
Equation 2.40
where D0 is a temperature-independent pre-exponential factor, Qd is the activation energy for
diffusion, R is the universal gas constant and T is the temperature in oK.
Apicella et al. [267] studied the effect of immersion temperature on the diffusion constant in a
DGEBA/TETA resin system. The diffusion behaviour of the resin system was studied at 23,
45 and 75oC and Arrhenius temperature dependence of the diffusion coefficient was observed
at the immersion temperatures studied. Based on an analysis of absorption data of over
seventy resin formulations, Wright [12] summarised that the diffusion coefficient is very
much dependent upon the temperature of exposure.
2.4.3.2 Influence of processing conditions
It is a well-established fact that the extent of cross-linking and network relaxation has
considerable influence on the effects of absorbed water in epoxy resin systems [276,277,278].
The presence of water has been found to have an influence on the reaction mechanisms and
therefore on the cross-linking kinetics of epoxy/amine systems and visa versa. Wu et al.
[279] observed that the absorbed moisture alters the reaction rate and degree of cross-linking
Page 79
67
of two epoxy/amine resin systems. Cross-linking kinetics of the resin systems was
characterised using isothermal DSC analysis and the effect of absorbed moisture was
investigated with 2, 4 and 6 % water of total weight of resin/hardener mixture. Epoxy resin
without water showed typical autocatalytic behaviour and when the water was added, the
initial reaction rate increased and the reaction mechanism showed nth
order reaction
behaviour. Chen et al. [280] studied the effect of absorbed moisture on the reaction kinetics of
a DGEBA/POP resin system using near-IR FTIR spectroscopy. The effect of the absorbed
moisture on the reaction kinetics of the resin system was studied varying the ratio of the
weight of water to the hardener, w = 0 to 0.1. Increase in reaction rate was observed with
increase in moisture up to w = 0.06.
2.4.3.3 Influence of hygrothermal history
Published work on water absorption in epoxy resins showed that both the absorption kinetics
and the equilibrium moisture content could be strongly influenced by the history of
hygrothermal conditions that the sample has undergone in service [281,282]. A
DGEBA/TETA epoxy system that was conditioned in water at 60 oC and cooled back down to
20 oC has shown higher equilibrium moisture content than that conditioned at 20
oC [251].
Similar history-dependent apparent equilibria have been reported in the literature [267] and
this has been attributed to hygrothermally-induced microcavitation or irreversible physical
damage at higher conditioning temperatures [283]. It was also reported that the extent of
irreversible damage is a function of both temperature and exposure time.
Xiao and Shanahan [284] investigated hygrothermal ageing of a DGEBA/DDA epoxy resin
system using gravimetry. Epoxy systems that show dual-mode sorption behaviour have
shown single-stage sorption in the subsequent conditioning after drying above their glass
Page 80
68
transition temperature. Residual moisture within the aged and subsequently dried specimens
at lower drying temperatures was observed when the specimens were dried after the resin
reached to first transition stage. Lin and Chen [285] studied the effect of cyclic hygrothermal
ageing on properties of a DGEBA/DDA resin system based on molecular dynamic (MD)
simulation. Considering MD simulation results of absorption and desorption process in
epoxy resins, the residual moisture present in the aged epoxy specimens was attributed to the
requirement of higher activation energy for removing bound water from the molecular
structure.
2.4.3.4 Influence of mixing ratio of epoxy/amine formulations
The mixing ratio of epoxy/amine formulations has been found to have an influence on the
absorption behaviour of the cross-linked resin system. Wu et al. [279] studied the effect of
mixing ratio on the diffusion kinetics of water in a DGEBA/TETA resin system using density
measurements, dynamic mechanical analysis (DMA) and FTIR spectroscopy. An increase in
the mixing ratio of cross-linking agent showed an increase in the equilibrium moisture
content. They postulated that the difference in cross-linked epoxy network and the
concentration of polar groups with change in epoxy/amine mixing ratio affects the diffusion
kinetics of water.
Papanicolaou et al. [286] investigated the effect of mixing ratio of a DGEBA/DETA system
as a function of the mixing ratio of resin/hardener formulation using gravimetry. They
observed an increase in diffusivity and equilibrium moisture content as the amine content
decreases. The authors hypothesised that in non-stoichiometric epoxy formulations, there is
either an excess of unreacted epoxy or excess of unreacted amine. This means that in the
sample there are regions of high cross-linking density and regions with less density. These
Page 81
69
two phases of the material may show quite different properties. Thus, the rate of diffusion into
the lower density phase is much higher than that of the higher density phase.
2.4.3.5 Influence of microstructure
The absorption kinetics and equilibrium moisture content of epoxy systems are governed not
only by the hygrothermal environmental conditions but also by the chemical structure of the
resin and the cross-linking agent [246,247,287]. A study conducted by VanLandingham et al.
[288] confirmed that the rate of interaction of epoxy resin with water molecules is markedly
dependent on the polarity of the epoxy molecules. Furthermore, the microstructure of epoxy
resin systems has been found to have an influence on the free volume and also on the size of
voids present in the polymer [289]. Epoxy resins modified with halogen-containing groups
have shown reduced absorption [290] compared with that reported for unmodified systems
[291]. However, an in-depth investigation is required on the effect of halogen-containing
groups on the cross-linking reaction kinetics and on the optimum cross-linking density with
typical stoichoimetric ratios.
2.5 Monitoring of hygrothermal ageing in epoxy/amine
resin systems
2.5.1 Conventional analytical techniques
An essential part of predicting the influence of absorbed moisture on the basic engineering
properties of polymers is acquiring their physical, chemical, thermal, viscoelastic and
mechanical properties as a function of exposure to humidity and temperature. Without these
Page 82
70
fundamental data, lifetime predictions of engineering polymers may not be realistic and cost-
effective. Vesely [13] reviewed various analytical techniques that are used for characterising
the absorption kinetics of polymers. Among these techniques, conventional gravimetry, DSC,
DMTA, FTIR spectroscopy, thermogravimetric analysis (TGA), scanning electron
microscopy (SEM) [278,292,293,294,295], Raman spectroscopy, fluorescence spectroscopy
are widely used.
In the current study, conventional gravimetry analysis was used as the basic method for
determining absorption kinetics of an epoxy/amine system and also used to cross correlate
with results obtained using other analytical and fibre-optic sensing techniques. Furthermore,
the thermal and viscoelastic properties of the resin system under accelerated ageing conditions
were characterised based on DSC, TGA, DMTA and FTIR spectroscopy. The DSC, TGA and
DMTA techniques were uses to investigate the types of water in the epoxy system and type of
molecular interactions during the sorption process. Conventional FTIR spectroscopy was
used mainly to analyse possible chemical changes occur during hygrothermal ageing such as
post-curing, presence of unreacted monomers, types of water in the epoxy network and also to
relate the conventional data with the data obtained using fibre-optic near-infrared transmission
spectroscopy. Therefore the review focussed on using the above-mentioned conventional
analytical techniques for assessing effect of hygrorthermal ageing of epoxy resin systems.
2.5.1.1 Differential scanning calorimetry
Differenctial scanning calorimetry (DSC) is a technique that provides changes in thermal
characteristics of materials associated with both physical and chemical processes.
Experimental techniques and the advantages and disadvantages of using DSC for cross-
linking monitoring of epoxy resin systems have been discussed previously (see Section
Page 83
71
2.3.1.2). The technique is also used widely for characterising the effect of absorbed water in
epoxy resin systems on their thermal properties [296,297,298,299]. A DSC thormogram of an
aged polymer is a useful means of interpreting change in Tg due to the plasticization of the
polymer network, possible post-curing taking place during hygrothermal ageing, physical
aging due to prolong exposure to conditioning temperatures [296].
Zhou and Lucas [297] investigated the influence of hygrothermal conditioning on the Tg of a
series of epoxy amine resin systems using TMA and DSC analyses. Their study revealed the
following results: (i) the change in Tg does not depend only on the equilibrium moisture
content, (ii) Tg depends on the hygrothermal history of the polymer, (iii) at longer immersion
times and higher exposure temperature result higher Tg. Decrease in Tg was observed
followed by an increase in Tg at longer immersion times for all the resin systems studied.
Lowest Tg was observed when the specimen first reached saturation. The trend was explained
in terms of different types of water/polymer interactions observed based on NMR analyses
[250. A mathematical model was also used to predict the change in Tg as a function of
immersion time and temperature:
(1 )
(1 )
e e ge w e gw
gwet
e e w e
V T V TT
V V
Equation 2.41
where 1
1 0.01e
em
w
V
M
Equation 2.42
Tgwet is of water saturated epoxy, Tge is of dry epoxy, Tgw is of water, e is epoxy volumetric
expansion coefficient, w is water expansion coefficient, Mm is equilibrium water content, e,
w is the density of water. However, a deviation was observed between the experimental
Page 84
72
results and the predicted Tg using Equation 2.41. The authors concluded that the model is not
capable of explaining the change in Tg of resin systems containing strong polar sites such as
hydroxyl groups.
2.5.1.2 Thermo gravimetric analysis
Thermo gravimetric analysis (TGA) of polymers provides important information on their
thermal stability and thermal degradation behaviour as a function of time or temperature
[267,300,301]. A TGA trace of a material shows the weight changes arising from both
physical processes such as evaporation or chemical processes such as decomposition or
oxidation. Moisture ingress into a polymer matrix leads to a range of effects including
plasticization through interaction of the water molecules with polar groups in the matrix,
creation of micro crazes through environmental stress cracking, leaching of unreacted
monomer and in certain cases degradation of the resin [302,303]. TGA analysis is a useful
tool for analysing possible reversible and irreversible changes take place during hygrothermal
ageing. The analysis can be optimised by choosing an inert atmosphere to study the absolute
reactions taking place with in the polymer sample or by choosing an oxidising atmosphere
that stimulate the effect of real environment on the reactions involved [244].
2.5.1.3 Dynamic mechanical thermal analysis
Dynamic mechanical thermal analysis (DMTA) is a technique that used to characterise
polymers in terms of their visco-elastic response either as a function of a linear heating rate,
function of frequency or as a function of time at a constant temperature.
Most polymers are viscoelastic and their mechanical properties show a marked time- and
temperature-dependence. Viscoelastic materials respond to an applied displacement or force
Page 85
73
by exhibiting either elastic or viscous behaviour, or a combination of both. The elastic and
viscous stresses are related to material properties through the modulus, which is the ratio of
stress to strain. The ratio of the elastic stress to strain is the storage (or elastic) modulus E’
and the ratio of the viscous stress to strain is the loss (or viscous) Modulus E”. E’ represents
the elastic or fully recoverable energy during deformation while E” represents the viscous or
net energy dissipated. The tangent of is the ratio of loss modulus to storage modulus, which
combines the viscous and elastic components into a single term. In dynamic mechanical
analysis, Tg can either be defined as the temperature where the maximum loss tangent or the
maximum loss modulus is observed, or as the inflexion point at which a significant drop of
the storage modulus occurs [304,305]. However, the respective peaks or points usually occur
at different temperatures, which results in a broad transition region for polymeric resins
[306,307,308].
DMTA is widely used to investigate the absorption behaviour of water in polymers. The
technique has found to be very useful for understanding the mechanical behaviour of epoxy
resin systems under hygrothermal ageing conditions [271,294,309]. The unique advantage of
using this technique is that the possibility of converting rheological data generated in minutes
or hours into information on long-term material performance based on time-temperature
superposition, time-strain superposition, or time-concentration superposition using the
Boltzmann superposition principle [310,311].
Among common features encountered with the storage modulus, loss modulus and loss
tangent traces of aged epoxy resins, peak splitting of the loss tangent has been highlighted.
The splitting of the loss tangent peak has been attributed to different chemical [244,301] and
physical [15,278,302,312,313,314] phenomena depending on the chemical nature of the
Page 86
74
material analysed. It was argued that the heterogeneous (nodular) structure of epoxy/amine
based resins not necessarily imply the presence of a multi-phase molecular structure [315].
However deviations from the general amorphous nature have been discussed. Chateauminois
et al. [316] and Xian and Karbhari [14] have postulated that the peak splitting under dynamic
temperature scan is attributed to the dry skin and wet core of the specimen.
2.5.1.4 Fourier transform infrared spectroscopy
In terms of characterising the diffusion behaviour of water in polymers, FTIR spectroscopy
provides a strong link between the mechanical and thermal behaviour of the aged material
with the chemical modifications occurring at the molecular level [317,318]. In addition, this
technique is capable of distinguishing multi-component diffusion. A detailed introduction to
the technique and also to the quantitative analysis of chemical groups was given previously
(see Section 2.3.1.1). The FTIR technique has been extensively used to postulate the types of
chemical interaction between the water and epoxy systems [319,320,321] and also to
investigate the leaching taking place in epoxy resin systems under hot-wet conditions [312].
The majority of the moisture ingress characterisation of epoxy systems has been carried out
under attenuated total reflection (ATR) mode [322]. Attention has been paid to deriving
general expressions for evaluating spectroscopic data based on ATR evanescent field
spectroscopy [320,323]. Philippe et al. [17] investigated an in situ ATR-FTIR technique for
determining the absorption kinetics of a series of epoxy-based paints and the hygrothermal
conditioning was carried out at room temperature. The absorption band in the range of 3000 –
3700 cm-1
was used to achieve the extent of moisture uptake as a function of immersion time.
The one dimensional Fickian diffusion model (see Equation 2.24) was modified to take
Page 87
75
account of the evanescent electric field with the diffusion profile and the modified equation is
given below:
Equation 2.43
where A0 is absorbance of a dried polymer specimen, At is the absorbance at time t, A∞ is the
absorbance at saturation, L is thickness of the specimen and D is the diffusion coefficient.
12
2 12
2
2 sinn
nn
Equation 2.44
where n1 and n2 are refractive indices of the polymer specimen and the ATR crystal,
respectively and is the angle of incident of the infrared radiation.
Spectral data were successfully used to predict the absorption behaviour of water in the resin
systems and observed dual-mode diffusion behaviour. This anomalous diffusion behaviour
was attributed to
“two different water hydrogen bonding distributions. One resulted from rapidly
sorbed, strongly hydrogen-bonded water at polymer „active‟ sites. The second
distribution was connected with the (slower) sorption into microvoids in the cured
polymer network”.
DtL
n
Ln
LtD
LAA
AA
n
n
t
2
0
2
2
2
2
0
0
2
12exp
42
)12(
2)1(2
exp
2exp1
81
Page 88
76
Cotugno and co-workers [324,325] discussed disadvantages associated with determining
absorption kinetics using ATR- FTIR and proposed a novel in situ spectroscopic technique
under transmission mode in MIR region.
The technique has been successfully used to develop absorption and desorption isotherms in a
TGDDM/DDS resin system. Conditioning experiments were carried out at different water
vapour activities (0.08 – 0.8) and at 24 oC. The spectral analysis was carried out in the
frequency range of 3800 – 2800 cm-1
. Spectral subtraction and curve-fitting techniques were
used to deconvolute the absorption bands due to different water/polymer interactions (see
Figure 2.13) and the resultant spectra with the original absorption band are shown in Figure
2.12.
Figure 2.12 Four resolved peaks, simulated profile and the experimental line shape [324].
The peak at 3623 cm-1
was identified as the asymmetric O-H stretching vibration of un-
associated water (S0). The peak at 3555 cm-1
was said to be due to S1 or with weakly
interacting S2 molecules. The peaks at 3419 and 3264 cm-1
were attributed S2 molecules
Page 89
77
having stronger hydrogen bonded interactions with proton acceptors (PA). However, the
authors were unable to evaluate the peak change quantitatively as a function of immersion
time.
Figure 2.13 Different hydrogen-bonding schemes [324].
Musto et al. [326] reported using FT-NIR spectroscopy in transmission mode for water
absorption monitoring in a TGDDM/DDS resin system. The authors assumed that moisture
absorption in the cross-linked resin system is proportional to moisture desorption and
spectroscopic measurements were carried out on a saturated epoxy specimen during
desorption at 22 oC in a N2 atmosphere. Quantitative analysis of moisture desorption in the
resin system was carried out using the absorption band appeared at 5209 cm-1
due to
combination of O-H stretching and bending vibrations. Good correlation was observed
between gravimetric data obtained during moisture absorption and spectral data obtained
during desorption process.
2.5.2 In situ fibre-optic based techniques
As humidity and moisture are very common in our environment, measurements and/or control
of relative humidity and moisture levels are important for a wide range of industrial
applications. Among different types of humidity and moisture sensors, the majority is based
on electrical properties such as impedance (or resistance) and capacitance of humidity-
Page 90
78
sensitive materials such as electrolytes, polymers and porous ceramics [327]. However it
was highlighted above that the electrical-based humidity and moisture sensors cannot be used
for in situ monitoring due to their poor response to environmental and EM interference [20].
For example, the sensitivity of capacitance-based moisture sensors showed decay upon
exposure to high temperatures and storage [19].
Apart from remote sensing capabilities, optical fibre based humidity and moisture sensors
have attracted increasing interest in recent years due to their inherent characteristics such as
immunity to lightening and electric discharge, low sensitivity to deleterious media such as
water, fuel, seawater and solvents. These features make them a powerful tool for
environmental and industrial process monitoring.
A number of authors have reported on the use of optical fibre-based sensor designs for
sensing humidity. A wide range of fibre-optic sensor systems have been used for monitoring
moisture and humidity and these can be classified into qualitative and quantitative techniques.
The qualitative techniques include intensity-based sensor designs
[328,329,330,331,332,333,334]. Quantitative analysis of the absorption kinetics is obtained
using sensor designs based on UV-visible [335,336,337,338,339,340], infrared and
evanescent wave [341,342,343,344,345,346,347] spectroscopy. A novel humidity sensor
design based on the extrinsic Fabry-Perot interferometry (EFPI) has been demonstrated [348].
In situ monitoring of relative humidity based on the shift in the resonance wavelength of long
period gratings (LPG) has also been demonstrated [349,350,351]. Furthermore, chemical
sensing capability of fibre Bragg gratings (FBG) has been exploited for humidity and
moisture detection in range of applications [352]. Yeo et al. [353,354] observed linear and
Page 91
79
reversible Bragg wavelength shift due to swelling strain induced on the polyimide-coated
FBG sensor due to absorbed moisture.
However, only a limited number of publications have reported the use of optical-fibre sensors
to study the diffusion of water in thermosetting resins [355,356,357,358]. Generally, optical
fibre-based sensor designs for detecting moisture ingress are based on polymer-coatings on a
de-clad portion of the waveguide via evanescent wave spectroscopy.
2.5.2.1 Absorption-based fibre-optic techniques
Sensors based on infrared absorption spectroscopy exhibit distinct features over the other
techniques due to their capability of detection and quantification of related chemical
variations with in the material due to absorbed moisture. Fernando et al. [81] demonstrated a
simple sensor design for process monitoring and water ingress monitoring. The sensing
concept was based on near-infrared transmission spectroscopy and was capable of monitoring
water diffusion in a cross-linked epoxy/amine resin system. Calvert et al. [21] also proposed
and investigated a simple single-fibre spectroscopic sensor for water ingress monitoring in
epoxy resins. However, restrictions associated with using the sensor design for remote
sensing in real structural applications need to be addressed.
Real-time moisture absorption monitoring in polymeric materials based on fibre-optic
evanescent wave spectroscopy (FEWS) has been proposed and investigated [22,359]. The
authors demonstrated using uncladded AgClBr fibres for acquiring infrared spectroscopy
during ageing. The fibres were coated with a thin layer of polymer to be assessed. Good
spectral sensitivity was observed and absorption kinetics was derived for water transport in
the polymeric layers. Typically, chemical FBG sensors reported so far have been based on
Page 92
80
the use of a swelling sensing material that can either be coated directly on the optical fibre or
arranged in a way in which the volume expansion of the material can have direct effect on the
FBG. Karakekas et al. [23] demonstrated the feasibility of using FBG sensors for monitoring
moisture ingress in epoxy resins. The axial strain built up in epoxy due to absorbed moisture
was used to predict the diffusion kinetics. Good correlation was observed with sensor
response and the weight uptake measurements. However, debonding of the sensing fibre and
the epoxy matrix was observed after prolonged exposure to water.
2.5.2.2 Other fibre-optic techniques
In contrast, Texier and Pamukcu [360] developed a fibre optic sensor for humidity
monitoring in subsurface environments. The sensor is based on Brillouin scattering and
optical time domain reflectometry (OTDR) and demands low optical power loss in distributed
sensing arrays over “optical interaction/loss” based fibre optic sensors. However, the optical
signals arising from the OTDR are highly complex due to interfering effects from external
parameters such as localised fibre straining and temperature changes. Lyons et al. [361]
overcome this disadvantage by using an artificial neural network signal processing techniques
which allow the sensor to be addressed using an optical time domain reflectometer (OTDR)
and the resulting signals to be characterised using pattern recognition. The optical fibre
sensor is capable of detecting the presence of water at any axial position along the fibre
length. The sensor is based on detection of water in the evanescent wave of a 200 m polymer
clad silica fibre which had its cladding removed in the sensing regions.
Page 93
81
2.6 Conclusions
In order to achieve optimum processing quality of epoxy/amine resin systems, it is necessary
to have an in-depth understanding of chemical structure of the constituent materials, the
reaction mechanism involved and the rate of reactions during cross-linking. Various
mathematical models have been proposed and investigated for determining cross-linking
kinetics of epoxy resin systems. Conventional and in situ fibre-optic techniques used for
monitoring of cross-linking reaction were reviewed with an emphasis on spectroscopy-based
techniques.
The second part of the review was focused on the effect of hygrothermal conditioning on the
properties of epoxy/amine resin systems. Proposed transport phenomena of water in epoxy
resin systems were discussed and various models used for describing diffusion kinetics of
water in polymers were reviewed and summarised. Although traditional analytical techniques
have been widely used for characterising moisture absorption in epoxy/amine resin systems,
less attention paid on developing in situ fibre-optic techniques for moisture ingress
monitoring in the resin systems.
Page 94
82
Chapter 3
Experimental Methods
3 Overview
3.1 Introduction
This chapter gives details of the materials and experimental procedures used under three main
sections:
Sensor fabrication and characterisation;
Monitoring of cross-linking reaction in an epoxy/amine resin system; and
Monitoring of hygrothermal conditioning of a cross-linked epoxy/amine system.
Page 95
83
3.2 Materials
3.2.1 Resins
The research was carried out on two-part epoxy/amine resin system, LY3505® epoxy resin
and XB3403®
aliphatic amine-based hardener as a cross-linking agent, which was supplied by
Huntsman Advanced Materials, UK. Chemical information for the two components is shown
in Table 3.1. The resin and the cross-linking agent were mixed thoroughly in the ratio of
100:35 respectively by weight followed by degassing in a vacuum chamber at 18.5 inches of
mercury (62648 Pa) pressure for 15 minutes.
Table 3.1 Chemical structure of the epoxy system.
Component Chemical structure
LY3505
Diglycidyl ether of bisphenol A
(DGEBA)
Diglycidyl ether of bisphenol F
(DGEBF)
XB3403
polyoxypropylene diamine (POP)
The flexible moulds used for fabricating sensor fixtures and test specimens were made using
Silastic M RTV two-part silicone rubber (Dow Corning Co.). UV 304-T UV-curable resin
was used for fabricating sensor fixtures and also for securing sensing fibres on to sensor
fixtures.
CH3
CH3
O
O
O
OCH3
CH3
O
OH
O
n
CH3
CH3
O
OO
O
OCH3
CH3
O
OH
O
n
H
H
O
O
O
OH
H
O
OH
O
m
H
H
O
OO
O
OH
H
O
OH
O
m
H2N
X
CH3
O
CH3
NH2H2N
X
CH3
O
CH3
NH2
Page 96
84
3.2.2 Fibres
Two types of optical fibres were used in this study for constructing fibre-optic sensors: (i)
multi-mode step-index silica core (105±3 m) and fluorine-doped silica cladding (125±4 m)
optical fibres (Aomolin Ltd, China) and (ii) single-mode (9/125±1 m) Germania-Boron (Ge-
B) co-doped optical fibre (PS1250/1500, Fibercore Ltd., UK). Quartz capillaries having inner
and outer diameters of 128±13 μm and 300±30 μm, respectively (VitroCom, USA) were used
for fabricating the sensor designs investigated in this study.
3.3 Sensor interrogation
A Bruker MATRIX™-F duplex 6-channel fibre-coupled FT-NIR spectrometer (Bruker
Optics, UK) was used for interrogating the sensors. The FTIR spectrometer was operated in
the range of 1000 – 2500 nm at a resolution of 0.025 nm and 64 scans. The 6-channel fibre-
coupled FTIR spectrometer used in these experiments was equipped with a near-infrared (IR)
tungsten light source, a near-IR beam splitter (T401) and an InGaAs detector.
3.4 Fibre-optic sensor fabrication
Several fibre-optic chemical sensors were designed for in situ monitoring of cross-linking
reaction and/or moisture ingress in epoxy resin system based on spectral analysis of specified
chemical species. Broadband light was transmitted through the optical fibres and the light
that was transmitted through the resin was analysed using FTIR spectroscopy. Sensors were
Page 97
85
constructed using multi-mode (105/125 m) step-index silica core and fluorine-doped silica
cladding optical fibres (Aomolin Ltd, China).
3.4.1 Single-fibre transmission sensor – sensor designs
3.4.1.1 Basic sensing concept
The basic sensing principle for this sensor is shown schematically in Figure 3.1. The input
fibre transmits the broadband infrared light from the spectrometer to the sensing region. Here
the sensor element consists of a cleaved optical fibre that is aligned and secured in position
with a defined gap. The gap allows the analyte solution to flow in to the cavity through which
the light from the input fibre passes and proceeds to the second fibre, which transmits the
light to the detector. A FTIR spectrometer is used for interrogation.
1 2 3 4 5 6
Spectrometer
Broadband light
sourceSensing region
Transmitted lightIncident light
1 2 3 4 5 6
Spectrometer
Broadband light
sourceSensing region
Transmitted lightIncident light
Figure 3.1 Schematic illustration of the sensor concept with enlarged sensing region: [1]: incident
light, [2]: first cleaved fibre, [3]: gap between cleaved fibre ends, [4]: analyte solution, [5]: second
cleaved fibre and [6]: transmitted light.
Page 98
86
In order to convert this sensing concept to a real sensor configuration, it was necessary to
develop a method to align the two fibres. A feasibility study was carried out with three
different sensor fixtures to assess these fixtures for sensor fabrication methodology and the
development of these devices for monitoring of the cross-linking reactions. Subsequently,
one of these sensor fixtures was chosen for an in-depth behaviour characterisation study for
monitoring the cross-linking reaction and moisture ingress behaviour. Consideration was also
given to issues related to robustness during fabrication, ease of handling and cost-
effectiveness.
3.4.1.2 Epoxy substrate sensor design
In this sensor fixture, a capillary, which holds the fibre sensor, was embedded in a thin layer
of neat epoxy resin. Thin cross-linked neat-epoxy substrates with embedded quartz capillaries
having inner and outer diameters of 128 m and 300 m, respectively (VitroCom, USA) were
used to hold and position optical fibres precisely to create the transmission sensor. A flexible
mould was fabricated using Silastic M RTV two-part silicone rubber (Dow Corning Co.) to
make strips of epoxy substrates with embedded capillaries. A schematic diagram of the
mould is shown in Figure 3.2(a). A single capillary with stripped fibre in it was embedded in
thin cross-linked neat epoxy as shown Figure 3.2(b). A sacrificial fibre inside the capillary
was used to keep the capillary bore clear during the fabrication process. A V-shaped groove
at the centre of the short-side of the mould cavities was used (as shown in Figure 3.2(a)) to
hold the capillaries in place until the resin cross-links.
Page 99
87
(a) (b)
2
1
2
1
(a) (b)
2
1
2
1
Figure 3.2 Schematic views of the custom-made silicone mould for making strips of sensor substrates:
(a) silicone mould with an expanded end-view of the v-groove region for holding quartz
capillaries; (b) 3-dimensional view of the mould with an array of mould cavities and a capillary at
the middle of a cavity; [1]: precision-bore capillary with a sacrificial fibre and [2]: silicone mould.
These substrates were made out of the same resin system. The dimensions of the mould
cavities were 40 mm in length, 5 mm in width and the depth was 0.5 mm.
With reference to Figure 3.3, a single strip of the cross-linked resin was used to make several
sensor substrates by cutting them to the required length. In this study the substrates were cut
into lengths of 16 mm using a 0.5 mm thick and 22 mm in diameter diamond-tipped blade
(RS Components, UK) followed by polishing the edges with 800 grit and 1200 grit SiC
grinding papers using water as a lubricant. The sequence of steps for converting a cured
epoxy strip, with an embedded capillary, to a sensor is shown in Figure 3.3(a-c). The
Page 100
88
previously mentioned diamond-tipped blade was used to introduce a groove perpendicular to
the length of the capillary. A vertical translation stage was used to move the cross-linked
resin fixture towards the fixed diamond-tipped blade so that groove depth could be controlled.
(a) Cured resin with
an embedded
capillary.
(c) Epoxy substrate with a
transverse groove for creating the
sensing region.
(b) Short sections cut
from the cured strips.
(a) Cured resin with
an embedded
capillary.
(c) Epoxy substrate with a
transverse groove for creating the
sensing region.
(b) Short sections cut
from the cured strips.
Figure 3.3 Fabrication steps of the sensor substrate.
The purpose of having a groove across the substrate was two-fold: the first was to expose the
sensing fibres to the analyte medium, in the current case, an epoxy/amine resin mixture. The
second reason was to create a “cell” to enable the resin system to flow into the gap in between
cleaved fibre ends to enable transmission spectroscopy through the resin.
The fibre that was originally inserted into the capillary was removed and the bore of the
capillary was cleaned using 125 m diameter tungsten wire. An optical image of the actual
sensor substrate is shown in Figure 3.4(a) together with the cross-sectional view across the
capillary in Figure 3.4(b).
Page 101
89
(a) (b)(a) (b)
Figure 3.4 Optical images of the sensor substrate: (a) an epoxy substrate, (b) a cross-sectional view of
the sensor substrate across the embedded capillary for holding the sensing fibres; A sacrificial
fibre inside the capillary represents the location of the sensing fibres.
(a)
(b)
(a)
(b)
Figure 3.5 (a) Optical image of a transmission sensor fabricated using an epoxy substrate; (b) Enlarged
view of the sensing region.
The fixture for conducting transmission infrared spectroscopy was constructed by securing
two ends of a cleaved multi-mode step-index silica optical fibre in the resin capillary
Page 102
90
assembly. The stripped and cleaved fibres were inserted into the capillaries using a precision
translation stage. The sensing region was created at the groove across the substrate by leaving
a pre-determined gap in between the cleaved fibre ends as shown in Figure 3.5(b). The
cleaved optical fibres were secured in position using a UV 304-T UV-curable resin. This
resin was cured using a UV light source (UV75, Thorlabs Inc. UK).
3.4.1.3 Capillary support sensor design
The second fixture was constructed using only the quartz capillaries mentioned in Section
3.1.1.2. The sequence of the fixture fabrication is shown in Figure 3.6. Here, a stripped
optical fibre: [C] was inserted into the precision bore of a “supporting” capillary: [A] of
length 10 mm. Another supporting capillary: [A‟] of the same length was inserted on to the
optical fibre and this assembly was bonded onto a third short “substrate” capillary: [B] using
UV-curable epoxy with a defined gap between the capillary end-faces. The third capillary
supports the first two capillaries that hold the sensing fibres and also maintains the alignment
of the sensing fibres. A stripped fibre was used to keep the two supporting capillaries aligned
whilst fixing them on to the third substrate capillary. This fibre was removed before making
the transmission sensor and stripped and cleaved sensing fibres were inserted along two
aligned capillaries. The pre-determined gap between the cleaved fibre ends was obtained by
fixing the fibres on to far ends of the supporting capillaries.
Page 103
91
(a)
(c)
(b)
A A’
BC
A A’
BC
A A’
B
(a)
(c)
(b)
A A’
BC
A A’
BC
A A’
B
Figure 3.6 Main steps of fabrication of the sensor fixture: (a) aligning two supporting capillaries using
a sacrificial optical fibre; (b) bonding the aligned supporting capillaries on to a substrate capillary
and (c) resultant sensor fixture; [A and A‟]: supporting capillaries, [B]: substrate capillary and [C]:
sacrificial optical fibre.
A schematic illustration of the capillary support is shown in Figure 3.7(a) along with an
optical image of the sensing region of the design in Figure 3.7(b).
Page 104
92
(a) (b)
Gap between fibre
ends
Sensing fibres
Substrate
capillary
Supporting capillaries
Sensing fibres
Substrate
capillary
(a) (b)
Gap between fibre
ends
Sensing fibres
Gap between fibre
ends
Sensing fibres
Substrate
capillary
Supporting capillaries
Sensing fibres
Substrate
capillary
Figure 3.7 (a) Schematic illustration of the sensor design and (b) a micrograph of the sensing region of
a transmission sensor that was fabricated with the capillary support.
3.4.1.4 Abraded capillary sensor design
The third sensor design consists of a precision-bore capillary tube that was ground along its
length to create a U-groove. The ground section of the capillary creates a U-groove on which
the stripped and cleaved fibre ends can be aligned. The approximate length of the ground
capillary is 15 mm. Hence in this case a single capillary was used as a fixture for the
transmission sensor.
The procedure for grinding and polishing the capillary involved mounting it on to a V-groove
of 0.375 mm depth and inclusive angle of 45o using low-melt mounting wax (Contamac Ltd,
UK) as shown in Figure 3.8(a). A sacrificial optical fibre was inserted into the precision bore
during the grinding operation to provide support for the capillary. This also helped to prevent
debris entering the cavity hole of the capillary while mounting and polishing. The capillary
Page 105
93
was ground and polished using 2400 grit silicon carbide (SiC) grinding paper using water as a
lubricant followed by polishing using 3 m diamond paste on MD NapTM
polishing cloth
(Struers Ltd., UK). The ground capillaries were cleaned with isopropanol in an ultrasonic
bath for one minute to remove any trapped debris. A schematic view of the sensor substrate
is shown in Figure 3.8(b).
0.375 mm1
2
3
(a) (b)
0.375 mm1
2
3
(a)
0.375 mm1
2
3
(a) (b)(b)
Figure 3.8 (a) schematic illustration of a capillary mounted on to the V-groove: [1]: V-groove mount,
[2]: a quartz capillary and [3]: low-melting wax and (b) 3-dimensional view of ground and
polished U-section of an abraded capillary fixture.
The sensor was constructed by positioning and securing the cleaved ends of an optical fibre in
the ground capillary using the UV-curable adhesive mentioned previously. A schematic
illustration of the sensor design and an optical image of the sensing region are shown in
Figure 3.9(a and b), respectively.
Page 106
94
(a) (b)
(a)
U-shape
ground capillary
Sensing fibres
U-shape
ground capillary
Sensing fibres
450 m
(a) (b)
(a)
U-shape
ground capillary
Sensing fibres
(a)
U-shape
ground capillary
Sensing fibres
U-shape
ground capillary
Sensing fibres
U-shape
ground capillary
Sensing fibres
450 m
Figure 3.9 (a) Schematic illustrations of the sensor design fabricated with an abraded capillary and (b)
a micrograph of the sensing region.
3.4.2 Single-ended reflectance sensor – sensor designs
3.4.2.1 Basic sensing concept
In this design, fibre-optic near-infrared reflectance spectroscopy was carried out using a
multi-mode fibre. Here, a cleaved fibre was simply mounted perpendicular to a reflective
surface having approximately 500 m separation in between the cleaved fibre face and the
reflective surface as shown in Figure 3.10. One fibre of one side of the 2 x 2 coupler carries
light from the broadband light source to the coupler. Then the coupler splits and transmits the
light to two fibres on the other side. The light leaves the fibre at the fibre/analyte interface,
travels through the analyte, reflects back at the reflector surface and enters in to the sensing
Page 107
95
fibre again. The reflected light transmits back to the detector of the FTIR spectrometer via the
coupler.
Broadband
light source
Sensing region
reflected lightIncident light
2 x 2
Coupler
1
Reflective surface
Index
matching
gel D
etec
tor
2
4
3
5
Broadband
light source
Sensing region
reflected lightIncident light
2 x 2
Coupler
1
Reflective surfaceReflective surface
Index
matching
gel D
etec
tor
2
4
3
5
Figure 3.10 Schematic diagram of the sensor concept for the single-fibre reflectance sensor: [1]:
stripped and cleaved fibre end, [2]: incident light, [3]: reflected light, [4]: analyte solution and
[5]: gap between cleaved fibre end and the reflector.
Near-infrared reflectance spectroscopy can be obtained either with one fibre or with both
fibres. If one fibre for sensing (as shown in Figure 3.10), the second fibre should be left in
Page 108
96
refractive index-matching gel to minimize spectral noise due to interference of reflected light
from both fibres.
3.4.2.2 Capillary reflector sensor design
In this sensor design a polished and gold sputter-coated end face of a short quartz capillary
section was used as a reflector for the sensing fibre. The one end-face of the capillary used
for the sensor design was polished as oppose to cleaving to obtain a flat and smooth surface
finish. Inner and outer diameters of the quartz capillary were 128±13 m and 300±30 m,
respectively. Thereby the overall thickness of the sensor was reduced down to 300 m and
the length of the sensor depends on the length of the capillary section, which has to be
polished, and gold sputter-coated for use as a reflector. Due to practical difficulties of
mounting capillaries for polishing, in the current research, the capillary length for sensor
fabrication was chosen as 10.0±0.5 mm.
The quartz precision-bore capillary was potted in a 1 mm bore SMA fibre connectors using a
high viscosity adhesive (2-component Araldite® rapid, Bostik Ltd., UK) as shown in Figure
3.11 (a). A sacrificial optical fibre was inserted into the bore of the capillary tube prior to
potting to offer mechanical stability and to reduce contaminant ingress into the capillary
during polishing. The connectors were polished using a Senko APC8000 high-volume fibre-
optic connector polisher. The polished capillary was then de-mounted from the connector by
burning off the adhesive in a furnace at 400oC for 4 hours. This capillary was then cleaned
with isopropanol in an ultrasonic bath. The polished end of the capillary was sputter-coated
with gold using an Emscope SC500A gold coater (Emscope Laboratories Ltd., UK). Sputter
coating at 27.5 mV and 1 kV for 4 minutes in vacuum (p = 8 x 10⁻²
mbar) yields a gold layer
of approximately 12-15 nm in thickness. The coated end-faces of these polished capillaries
Page 109
97
were found to produce spectra with a good signal-to-noise ratio at path lengths that were
optimised for tracking the progress of cross-linking reaction. During this operation, the bore
of the capillary was protected using a sacrificial optical fibre (see Figure 3.11(b)). A
schematic illustration of a polished and gold-sputter coated reflector capillary is shown in
Figure 3.11 (c).
SMA
connector
Grinding/
Polishing pads
Precision-bore
capillary
Sacrificial
fibre
Bore of the capillary
Polished and gold-sputter
coated end face
Gold-sputter coater
Gold target
Polished
capillary face
Sacrificial
fibre
(a) (b) (c)
SMA
connector
Grinding/
Polishing pads
Precision-bore
capillary
Sacrificial
fibre
Bore of the capillary
Polished and gold-sputter
coated end face
Bore of the capillary
Polished and gold-sputter
coated end face
Gold-sputter coater
Gold target
Polished
capillary face
Sacrificial
fibre
(a) (b) (c)
Figure 3.11 Fabrication steps of the reflector capillary: (a) a mounted capillary for polishing, (b) gold-
sputter coating of the polished capillary and (c) capillary reflector with polished and gold-coated
end face.
The sensor design is illustrated in Figure 3.12. A sacrificial fibre: [B] was inserted and
bonded: [D] into the precision bore of the capillary: [A] using UV-curable resin for
supporting and holding the sensing fibres in place. Sensing fibres: [E] were fixed onto the
supporting fibre using UV-curable resin: [F]. Care was taken to avoid contaminating the
cleaved sensing fibre ends during bonding. The gap: [G] between the reflector surface and the
cleaved fibre ends were adjusted using a precision translation stage prior fixing on to the
supporting fibre. In this sensor design, the reflector and sensing fibres were attached to each
other before embedding and sensing. Hence unlike the initial design, the sensor can be used
for through-thickness sensing.
Page 110
98
B C
G
E
D
Light source
Detector
F
HA IB C
G
E
D
Light source
Detector
F
HA I
Figure 3.12 Schematic illustration of the single-ended reflectance sensor: [A] capillary with a
reflective coating, [B] supporting fibre, [C] polished and sputter gold-coated face, [D] bonding
between capillary reflector and supporting fibre, [E] multi-mode sensing fibres, [F] bonding
between sensing fibres and supporting fibre, [G] cavity between cleaved fibre tip and the reflector,
[H] 2 x 2 multi-mode coupler and [I] FTIR spectrometer.
3.5 Preparation of fibre connectors
Connection between fibre optic sensors and the spectrometer was achieved using sub-
miniature A-type (SMA) connectors. Commercially available fibre optic SMA connectors
(Amphenol fiber Optic Products) were used to connect multi-mode silica fibres to the
spectrometer. Connectors with a 125 m diameter bore were used with the fibres with a
diameter 125 m. The parts of the connector were assembled with fibres as shown in Figure
3.13. The stripped fibre was potted in to the connector bore using a fast-curable two-part
fibre optic connector epoxy (ThorLabs, UK).
1 2 3 41 2 3 4
Figure 3.13 Schematic diagram of the fibre connector assembly: [1]: optical fibre, [2]: rubber
protective cover, [3]: metal protective sleeve and [4]: SMA connector.
Page 111
99
After the fibre was fixed into the connector, the end was ground and polished to achieve
optimum light coupling with the spectrometer. An APC 8000 bulk-connector polisher
(SENKO Advanced Components Ltd) was used with metal plate for grinding and polishing
using 3 m and 0.5 m polishing papers, respectively. Preliminary work was carried out to
establish the optimum grinding and polishing procedure to obtain a good surface finish of the
connector ends.
A special disc holder, which can accommodate up to twelve SMA connectors, was used for
grinding and polishing (Figure 3.14). Figure 3.15 shows a micrograph of a polished end of a
multi-mode step-index silica fibre.
SMA connector
Holder
Grinding/polishing pads
SMA connector
Holder
Grinding/polishing pads
Figure 3.14 Schematic diagram of grinding/polishing set-up for fibre optic connectors.
Page 112
100
Figure 3.15 Micrograph of a polished end of the silica fibre, which potted into a SMA connector.
3.6 Determination of the optimum gap at the sensing
region
3.6.1 Single-fibre transmission sensor
The capillary support sensor design mentioned above was used to determine the optimum
cavity length for the fibre-optic near-infrared transmission spectroscopy. For this experiment,
one of the sensing fibres inserted into one arm of the capillary support was attached on to a
precision translation stage to change the gap between sensing fibre ends (Figure 3.16).
1 2 3 4 51 2 3 4 5
Figure 3.16 Sensor set-up for gap calibration: [1]: fixed sensing fibre, [2]: UV adhesive, [3]: capillary
substrate, [4]: variable gap between sensing fibres and [5] movable sensing fibre that was attached
to a translation stage.
Page 113
101
1 2 3 4 51 2 3 4 5
Figure 3.17 Experiment set-up for calibration of cavity length: [1]: fixed sensing fibre, [2]: capillary
substrate, [3]: translation stage, [4]: movable sensing fibre that attached to a translation stage and
[5] micrometer.
The experimental set-up is illustrated in Figure 3.17. A piece of thin PTFE® sheet was
positioned under the sensing region to enable the resin to be introduced to the cavity.
LY3505® epoxy resin was used as the analyte. Spectra of resin with different gaps between
the cleaved fibre ends, were recorded and investigated to determine the optimum gap for
subsequent cross-linking monitoring and moisture ingress experiments. The gap was changed
from 100 to 1500 m in 100 m steps. The experiment was repeated three times to obtain the
average absorbance corresponding to different gaps between the sensing fibre ends.
3.6.2 Single-ended reflectance sensor
The optimisation of the gap for the single-ended reflectance sensor was done using the
capillary reflector design mentioned in Section 3.4.2.2. Investigations were also carried out
using the single and both lead-out fibres of the 2 x 2 coupler for sensing purposes. As
mentioned in Section 3.4.2.2, it is possible to obtain trans-reflectance spectroscopy either via
a single or both lead-out fibres of the 2 x 2 couple. Hence experiments were performed to
Page 114
102
find out best sensor configuration for sensing in terms of signal-to-noise ratio and spectral
resolution. In this experiment two single-ended reflectance sensors were used as shown in
Figure 3.18. In set-up A, one lead-out fibre was used for sensing while the other fibre was
immersed in refractive index matching gel (ThorLabs Inc., UK). In set-up B both fibres were
used for sensing. Spectral analysis on LY3505® resin system using both configurations with
different gaps between the cleaved fibre ends and the reflectors was carried out.
Set-up B Spectrometer
Set-up A Spectrometer
1 2 3 4 5 6 7
Set-up B SpectrometerSpectrometer
Set-up A SpectrometerSet-up A Spectrometer
1 2 3 4 5 6 7
Figure 3.18 Schematic illustration of two sensor configurations: [1]: quartz capillary, [2]: polished and
gold-sputter coated end face, [3]: gap between sensors and reflectors, [4]: supporting fibre; [5]:
sensing fibres those attached to translation stage, [6]: refractive index-matching gel and [7]: 2 x 2
coupler.
A similar experimental set-up (explained in Section 3.6.1) was used in which the sensing
fibres of the sensor were fixed on to a horizontal translation stage to facilitate movement of
cleaved fibre end relative to the reflective capillary face. The sensing cavity length was
changed from 100 m up to 1500 m in 100 m steps.
Page 115
103
3.7 Characterisation of cross-linking kinetics of the
epoxy/amine resin system
Cross-linking kinetics of the LY3505/XB3403 resin system was characterised using single-
fibre transmission sensor and single-ended reflectance sensor. The resin system was cross-
linked at four different temperatures according to the manufacturer‟s recommended
processing schedules as summarised in Table 3.2.
Table 3.2 Recommended processing schedules for the LY3505/XB3403 resin system.
Isothermal processing temperature (oC) Processing time (hours)
40 20
50 18
60 8
70 7
3.7.1 Temperature monitoring
The exothermic reactions taking place during cross-linking in thermosetting resin systems
lead to the generation of higher temperatures within the resin sample especially during the
initial part of the cross-linking process. Therefore monitoring the effective temperature
within the resin is vital for understanding and predicting actual cross-linking kinetics of the
resin system.
Page 116
104
For all cross-linking monitoring experiments, an independent temperature monitoring system
was used in order to track the temperature in the resin during the experiment. A K-type
thermocouple was used to monitor actual resin temperature over the cross-linking period. A
custom-written LabView data acquisition program with a SCXI-1100 data conditioning unit
(National Instruments, UK) was used for recording and acquiring the temperature profile.
3.7.2 In situ monitoring of the cross-linking reactions
3.7.2.1 Fibre-optic transmission spectroscopy
For all the process monitoring experiments, the gap between the cleaved fibre ends was set to
500 m. Detailed cross-linking kinetic modelling was performed on the data obtained using
the capillary support sensor fixture assembly (Section 3.2.1.3). This sensor configuration was
used for monitoring the cross-linking reactions in the resin system at four isothermal
temperatures mentioned above.
A thermo-regulated cell holder (Ocean Optics, UK) was used to control the temperature of the
resin during cross-linking and a schematic diagram of the cell holder is shown in Figure 3.19.
The temperature controller of the cell holder is capable of controlling the temperature within
±0.01oC. A 1 mm path-length demountable glass cuvette (Starna Scientific Ltd., UK) was
used to contain the mixed resin system. The transmission sensor was fixed on to the inner
wall of the demountable cell as shown in Figure 3.20, using UV 304-T UV-curable epoxy
resin.
Page 117
105
The resin and cross-linking agent were weighed, mixed and de-gassed as mentioned in
Section 3.3.2. The background spectrum was taken in air at room-temperature before
introducing the resin system into the demountable cuvette cell. The resin mixture was
injected into the cuvette using a disposable syringe. The sample was then heated from room
temperature up to the cross-linking temperature; spectra were recorded from the time when
the resin system was introduced into the cuvette where the cross-linking was deemed to be
completed. Unless otherwise stated, the above-mentioned procedure for spectral acquisition
and heating was followed for all the cross-linking experiments.
Data Acquisition Temperature
monitoring
Water circulation for the
themoelectric controller
Insulation
Demountable
glass cuvette
Resin system
K-type thermocouple
Data Acquisition Temperature
monitoring
Water circulation for the
themoelectric controller
Insulation
Demountable
glass cuvette
Resin system
K-type thermocouple
Figure 3.19 Schematic illustration of the thermo-regulated cell holder used for monitoring the cross-
linking of the epoxy/amine resin system.
Care was taken to maintain the highest radius of curvature of the fibre at the U-bend as multi-
mode fibres show high light attenuation at bends. A schematic illustration of the
experimental set-up and sensor interrogation is shown in Figure 3.20. The time between two
Page 118
106
consecutive absorbance spectra during cure was decided according to the approximate
conversion rate of epoxy groups at different isothermal cure temperatures.
Sensor
interrogation
3
21
Temperature monitoring
4
(a) (b)
Transmission
sensor
Sensor
interrogation
3
21
Temperature monitoring
4
(a)
3
21
Temperature monitoring
4
(a) (b)
Transmission
sensor
(b)
Transmission
sensor
Figure 3.20 Schematic illustration of the experimental set-up: (a) thermo-regulated cell holder and the
sensor interrogation: [1]: uncross-linked resin, [2]: demountable cuvette cell, [3]: thermo-regulated
cell holder and [4]: transmission sensor; and (b) enlarged description of the sensor location inside
the demountable glass cuvette.
3.7.2.2 Fibre-optic reflectance spectroscopy
Monitoring of cross-linking reaction and cross-linking kinetic modelling was performed using
a reflectance sensor fabricated with a capillary reflector sensor design (Section 3.2.2.2). Both
lead-out fibres from the coupler were used for sensing and the gap between both cleaved fibre
ends and the reflective capillary end face was set to 500 m. The gap was adjusted with an
aid of precision translation stage. Cross-linking kinetics at all four processing temperatures
was investigated and compared with results obtained via fibre-optic transmission
Page 119
107
spectroscopy. A schematic illustration of the sensor interrogation is shown in Figure 3.21
along with the sensor location inside the demountable cuvette cell.
Sensor
interrogation
(a)
2
1
Temperature monitoring
Single-ended
reflection sensor
(b)
Sensor
interrogation
(a)
2
1
Temperature monitoring Sensor
interrogation
(a)
2
1
Temperature monitoring
Single-ended
reflection sensor
(b)
Single-ended
reflection sensor
(b)
Figure 3.21 Schematic illustration of the experimental set-up; (a) sensor configuration inside the
thermo-regulated holder and interrogation: [1] 2 x 2 coupler and [2] single-ended reflectance
sensor and (b) enlarged view of the demountable cell with the single-ended reflectance sensor.
3.8 Characterisation of diffusion kinetics of water in the
epoxy/amine resin system
3.8.1 Conventional analytical techniques
Moisture absorption characterisation of the cross-linked LY3505/XB3403 epoxy/amine
system was carried out at 30, 50 and 70 oC and 100% relative humidity (RH). Neat epoxy
Page 120
108
samples for the diffusion experiments were fabricated by cross-linking the resin system at 60
°C for 8 hours.
3.8.1.1 Sample fabrication for conventional diffusion studies
Neat-epoxy specimens for diffusion experiments were fabricated by casting the resin mixture
in between glass mould plates as shown in Figure 3.22. Toughened-float glass plates were
used to obtain a good surface finish on the specimens. The glass plates were coated with
Frekote NC-700 (Aerovac, UK) release agent to enable easy removal of the cross-linked
epoxy plaques from the glass plates. Aluminium plates with 2 mm thickness were used as
spacer.
Epoxy and amine were mixed as described in Section 3.2.1. The aluminium spacer was
placed on one of the glass plate and the inside edge was lined with vacuum sealant tape as
shown in Figure 3.22. The second glass plate was sprayed with the release agent and was
placed over this assembly. The sandwich structure was clamped together with G-clamps. The
degassed resin mixture was poured on to the glass mould assembly. The epoxy plaques were
cross-linked in a Memmert laboratory oven with thermal controller with ±0.1 oC accuracy.
The cast resin plaques were cut to the required dimensions, for the diffusion experiments.
The dimensions of the specimens were in accordance to BS ISO standards. A hand-held
diamond-tipped cutting wheel was used to cut the cast resin plaques. The edges of the
specimens were ground using 1200 grit and 2400 grit SiC papers with water acting as a
lubricant.
Page 121
109
Spacer
Vacuum sealant tape
Glass plates
Resin mixture
Spacer
Vacuum sealant tape
Glass plates
Resin mixture
Figure 3.22 Schematic diagram of mould plates used for casting resin plaques.
3.8.1.2 Environmental conditioning of the cast resin for diffusion experiments
The cross-linked epoxy specimens were dried until reach to constant mass before starting
moisture ingress experiments. The drying was carried out in an environmental chamber
maintained at 50 oC. The drying temperature was chosen to be 10
oC below the isothermal
cross-linking temperature that was used to cross-link the original specimens. Dry silica gel–
Grade II (Sigma-Aldrich) was used to minimise the interaction of atmospheric moisture with
the resin during the drying period. The specimens were taken out from the chamber at pre-
determined time intervals for weight measurement. Before recording the mass of the test
specimens, the samples were left in a desiccator for 2 minutes to enable the samples to
equilibrate to room temperature. The mass of the specimens was recorded using an Ohaus
electronic analytical balance.
3.8.1.3 Diffusion experiments
Before starting the diffusion experiments, the mass and the thickness of each specimen were
recorded. The diffusion experiments were carried out in distilled water using individual
Page 122
110
water-baths. The diffusion experiments were carried out at 30, 50 and 70 oC. Individual test
specimens were used for each set temperature. The water baths were equipped with thermo-
controllers that enabled the temperature to be controlled with in ±0.1oC. Custom-made PTFE
racks were used to hold samples in the water-baths.
3.8.1.4 Gravimetric analysis
Gravimetric measurements of the samples were carried out at pre-determined time intervals.
The samples were removed from the water bath, blotted with lint-free tissue and kept in a
dessiccator for two minutes before measurements. Their masses were recorded individually
using an Ohaus weighing balance. The samples were returned to the water baths as soon as
after the weighing operation; the samples were returned to the water-bath approximately in
five minutes.
The possibility of desorption of absorbed moisture with in the test specimens during the
weighing operation was also investigated. A specimen from each of the conditioning
temperatures was measured continuously for 15 minutes. These measurements were recorded
using an Ohaus analytical balance via LabView software.
3.8.1.5 Thermo-mechanical analysis
Dynamic mechanical thermal analysis (DMTA) of the cross-linked epoxy resin system was
performed using a dynamic mechanical analyser (Metzsch DMA 242, Metzsch Scientific,
UK). The dimensions of the test specimen for the DMTA experiments were 10 mm x 50 mm
x 2 mm thickness. The sample was loaded sinusoidally using a dual-cantilever beam set-up
where 32 mm dynamic displacement amplitude was imposed on the test specimen. The tests
were carried out in the dynamic temperature mode from 20 °C to 140 °C at a heating rate of 1
Page 123
111
°C/min. The storage modulus (E'), loss modulus (E”) and loss tangent (tan δ) were measured
at test frequencies corresponding to 1, 10 and 30 Hz. The DMTA experiments were carried
out on samples that were un-conditioned and pre-conditioned in the water bath at 30°, 50° and
70°C for specified immersion times.
3.8.1.6 Dynamic scanning calorimetry
A Perkin Elmer DSC7 (Perkin Elmer, UK) was used to measure the glass transition
temperature of the neat epoxy resin specimens as a function of immersion time in the water
bath. Since the analysis requires approximately 15 mg of the material for testing, a corner
piece of an aged DMTA specimen was cut out from a free-end as shown in Figure 3.23.
Positions of the clamps of
the dual-cantilever bending ring
2 mm
10 mm
50 mm
Specimen
for TGA
Specimen
for DSC
Positions of the clamps of
the dual-cantilever bending ring
2 mm
10 mm
50 mm
Specimen
for TGA
Specimen
for DSC
Figure 3.23 A schematic illustration of a DMTA specimen, that were used for a series of experiments
involving TGA, DSC, DMTA and FTIR spectroscopy.
The DSC was operated in the dynamic mode using a heating rate of 10 °C/min, from 30 °C to
140 °C in a dry-nitrogen atmosphere. Three consecutive scans were carried out without
Page 124
112
removing the sample from the DSC. In order to establish the repeatability of the Tg
measurements, three individual test specimens were used per immersion time.
3.8.1.7 Thermo gravimetric analysis
Moisture desorption after hygrothermal ageing was investigated by thermogravimetric
analysis (TGA) using a thermal analyser (Metzsch STA 449C, Metzsch Scientific, UK) with a
thermo controller (Metzsch TASC 414/3 A, Metzsch Scientific, UK). Similar to the
methodology explained in Section 3.6.1.6, approximately 15 mg of the un-conditioned and
pre-conditioned specimens were tested under dynamic temperature mode using a heating rate
of 5 °C/min, from 30 °C to 180 °C in an air atmosphere.
3.8.1.8 Fourier transform infrared spectroscopy
Conventional FTIR spectroscopy was performed on un-conditioned and pre-conditioned
DMTA specimens using the Bruker MATRIX™-F duplex FT-NIR spectrometer and the
temperature-regulated cell holder. Spectra were acquired using commercial fibre optic light
guides (Ocean Optics, UK) connected to the thermo-regulated cell holder. Spectra were
obtained in the wavelength range of 1000 – 2500 nm at a resolution of 0.025 nm and 64 scans
using the internal near-infrared light source on the spectrometer and an InGaAs detector.
3.8.2 Fibre-optic transmission spectroscopy
In situ monitoring of moisture ingress was carried out using the capillary support sensor
design (Section 3.2.1.3). The rationale for using the fibre-optic transmission sensor inside
cross-linked epoxy specimens were; (i) to compare the absorption kinetics obtained using the
Page 125
113
fibre optic sensors with that obtained via conventional gravimetry; and (ii) to predict the
through-thickness diffusion front inside the specimen at the conditioning temperature.
The diffusion experiments involving the embedded single-fibre transmission sensors were
carried out at 50 oC in water baths with the thermo-regulators as mentioned in Section 3.6.1.3.
The resin specimens that were used for the diffusion studies with the embedded sensors were
previously cross-linked at 60 oC for 8 hours. The dimensions of the specimens were similar to
those used for conventional gravimetry experiment (50 mm x 50 mm x 2 mm thickness). The
cross-linking of the test specimens was carried out in a Memmert laboratory oven that was
custom-modified to accommodate the lead in/lead out optical fibres for online monitoring.
Spectra were also recorded during cross-linking to investigate effect of using this
conventional oven on the cross-linking kinetics.
Silicone rubber
mould
Mould cavity
Glass plate
PTFE spacers
Lead-out fibres
Sensors
50 mm
2 mm
50 mm
Silicone rubber
mould
Mould cavity
Glass plate
PTFE spacers
Lead-out fibres
Sensors
50 mm
2 mm
50 mm
Figure 3.24 Schematic illustration of the silicone mould to fabricate epoxy specimens for in situ
monitoring of moisture ingress.
Custom-made silicone rubber moulds were used on toughened-float glass mould plates for
fabricating epoxy specimens with embedded optical sensors as shown in Figure 3.24.
Reference specimens were also fabricated for gravimetric measurements with and without
Page 126
114
embedded sensors. These reference specimens were subjected to the same hygrothermal
conditions as those with the embedded sensors for cross-comparison with the conventional
gravimetric results. The cross-linked specimens were dried to constant mass at 50oC followed
by immersion in distilled water at 50 oC.
For hygrothermal conditioning at 50 oC, three different specimen configurations were
considered and summarised in Table 3.3. With reference to specimen numbering, the first
letter refers to the type of the specimen; „S‟ for specimens with embedded sensors and „R‟ for
reference specimens that used for gravimetric measurements. The second digit refers to the
specimen configuration and the third digit followed by dash refers to the number of each
specimen with in the specified specimen configuration.
A schematic illustration of the first specimen configuration used in this study is shown in
Figure 3.25. Here the sensors were secured in place using spacers positioned outside the
mould during cross-linking process. Six sensors were embedded and PTFE adhesive spacers
were used to locate the sensors at different heights with reference to the thickness of the
epoxy specimen. All but one of the surfaces were coated with a silicone sealant. Hence water
can only enter from one side of the specimen. As shown in Figure 3.26, sensor-1 was located
on the surface of the specimen that was exposed to water. Sensors -2 to -6 were equally-
spaced across the thickness of the specimen from the exposed surface and the approximate
separation between the two sensors was 0.22 mm.
Page 127
115
Table 3.3 Summary of different specimen configurations used for moisture diffusion experiments.
Specimen
identification Description Schematic illustration of the specimens
Specimen configuration
– I
Six embedded sensors were
equally spaced across the
thickness of a neat epoxy
specimen and only one side of
the specimen was exposed to
water.
S1-1 R1-2
R1-3 R1-4
S1-1 R1-2
R1-3 R1-4
Specimen configuration
– II
Three sensors were embedded
across the thickness of an epoxy
specimen and only one side of
the specimen was exposed to
water.
S2-1 R2-2
R2-3
S2-1 R2-2
R2-3
Specimen configuration
– III
Three sensors were embedded
across the thickness of the
specimen and both sides of the
specimen were exposed to water.
R3-2S3-1
R3-3
R3-2S3-1
R3-3
Specimen configuration – I
Schematic illustrations of the specimens that were used for the hygrothermal conditioning
experiments are shown in Figure 3.27 (a-d). The set includes:
a) S1-1: In situ monitoring of moisture ingress – An epoxy specimen with six sensors
embedded at different heights and only one side is exposed to water;
b) R1-2: Reference specimen – A neat-epoxy specimen where two sides were exposed to
water;
Page 128
116
c) R1-3: Reference specimen– A neat-epoxy specimen were only one side was exposed
to water; and
d) R1-4: Reference specimen – An epoxy specimen with six (dummy) sensors and only
one side was exposed to water.
Embedded sensor
Lead-out sensing fibres
supported on the spacers
Mould cavity
Silicone mould
PTFE spacers
Embedded sensor
Lead-out sensing fibres
supported on the spacers
Mould cavity
Silicone mould
PTFE spacers
Figure 3.25 Schematic illustration of the mould set-up with a sensor secured outside the mould cavity.
Sensor locations
Silicone sealant
Exposure to water at 50°C
Epoxy resin specimen
1 2 3 4 5 6
Sensor locations
Silicone sealant
Exposure to water at 50°C
Epoxy resin specimen
1 2 3 4 5 6
Figure 3.26 Schematic illustration of the relative locations of the embedded sensors across the
thickness of the epoxy specimen.
Page 129
117
(a) S1-1 (b) R1-2
(c) R1-3 (d) R1-4
(a) S1-1 (b) R1-2
(c) R1-3 (d) R1-4
Figure 3.27 Schematic illustration of the set of specimens used for hygrothermal conditioning at 50oC;
Hatched sides of the specimens represent the surfaces with silicone sealant to eliminate the
ingress of moisture through those sides.
Specimen S1-1 was used for real-time monitoring of moisture ingress using fibre-optic near-
infrared transmission spectroscopy. Specimen R1-2 was used to correlate with the previously
mentioned gravimetric measurements, and to investigate the repeatability when using
specimens fabricated at different periods. Specimen R1-3 was used to study the effect of
thickness on the absorption kinetics by exposing only one surface of the specimen. The
specimen coded R1-4 was used to investigate the effect of the embedded sensors on the
sorption kinetics of the epoxy/amine resin system in terms of weight-gain.
However in specimen configuration – I, it was not possible to guarantee the location of the
sensors across the thickness due to movement during cross-linking. This will be discussed in
more detail in Chapter 8. In order to overcome this possibility, with reference to specimen
configurations – II and – III, sensors were located and secured at desired depths inside the
mould using the PTFE spacers as shown in Figure 3.28. In the specimen configurations
Page 130
118
discussed here, only three sensors were embedded. In the specimen configuration – II, only
one side of the specimens was exposed to water at 50 oC while both sides of the specimens
were exposed to water in the configuration – III.
Embedded sensor
Lead-out sensing fibres
supported on the spacers
Mould cavity
Silicone mould
PTFE spacers
Embedded sensor
Lead-out sensing fibres
supported on the spacers
Mould cavity
Silicone mould
PTFE spacers
Figure 3.28 Schematic illustration of the mould set-up with a sensor secured inside the mould cavity.
As mentioned previously, a set of specimens were fabricated for in situ moisture ingress
monitoring as well as for conducting independent gravimetric analysis. Schematic
representation of the specimen configurations – II and – III are shown in Figure 3.29, and the
sets include:
Specimen configuration – II
a) S2-1: In situ moisture ingress monitoring – An epoxy specimen with three embedded
sensors and only one side exposed to water;
b) R2-2: Reference specimen – A neat-epoxy specimen where only one side was exposed
to water; and
c) R2-3: Reference specimen – A neat-epoxy specimen with three dummy embedded
sensors; here only one side was exposed to water.
Page 131
119
Specimen configuration – III
a) S3-1: In situ moisture ingress monitoring – An epoxy specimen with three sensors
embedded at different depths; here both sides were exposed to water,
b) R3-2: Reference specimen – A neat-epoxy specimen where both sides were exposed
to water; and
c) R3-3: Reference specimen – A neat-epoxy specimen with three dummy embedded
sensors where both sides were exposed to water.
Figure 3.30 shows a schematic illustration of the relative locations of the sensors that were
embedded at specified depth in the cast neat-epoxy resin. These specimens were used for in
situ monitoring of moisture ingress.
(a) S2-1 (b) R2-2
(e) R3-2
(c) R2-3
(d) S3-1 (f) R3-3
Specimen configuration-II
Specimen configuration-III
(a) S2-1 (b) R2-2
(e) R3-2
(c) R2-3
(d) S3-1 (f) R3-3
Specimen configuration-II
Specimen configuration-III
Figure 3.29 Schematic illustration of the set of specimens used for moisture ingress experiments at 50
oC; hatched faces represent the surfaces, that were sealed with silicone sealant to eliminate
moisture ingress through during hygrothermal conditioning.
Page 132
120
Sensor locations
Epoxy resin specimen1
23 1.32 mm
0.66 mm
Sensor locations
Epoxy resin specimen1
23 1.32 mm
0.66 mm
Figure 3.30 Schematic illustration of the relative locations of the embedded sensors that were located
at specified depths in the cast neat-epoxy specimen of the epoxy specimens.
3.8.2.1 Sensor interrogation for monitoring moisture ingress
The Bruker MATRIX™
-F FT-NIR spectrometer is capable of recording spectra via a
maximum of six channels. Frequent scanning though specified channels is possible via a
process control script using the OPUS 5.0 spectral acquisition software. A photograph of a
mould cavity with multiple sensors that was ready for specimen fabrication is shown in Figure
3.31(a) together with a schematic illustration of a cross-linked specimen with embedded
sensors and interrogation set-up for moisture ingress monitoring (Figure 3.31(b)). Sensing
fibres were connected to the spectrometer via SMA connectors.
Page 133
121
Spectrometer
Anti-corrosive
sealant
Cross-linked epoxy
specimen
Input channels
Output channels
Water at 50 oC
(a) (b)
Spectrometer
Anti-corrosive
sealant
Cross-linked epoxy
specimen
Input channels
Output channels
Water at 50 oC
SpectrometerSpectrometerSpectrometer
Anti-corrosive
sealant
Cross-linked epoxy
specimen
Input channels
Output channels
Water at 50 oC
(a) (b)
Figure 3.31 (a) photograph of the complete interrogation set-up and (b) Schematic illustration of the
sensor interrogation via the Bruker MatrixTM
-F FT-NIR spectrometer.
3.9 Proof-of-concept of multi-functional sensor
3.9.1 Sensor design
A schematic illustration of the conventional extrinsic Fabry-Perot interferometry (EFPI) -
based multifunctional sensor design is presented in Figure 3.32. The sensor consists of a
cleaved optical fibre [B and B‟] that is secured within a precision-bore capillary tube [A].
The cleaved fibre is secured to the capillary tube via two fusion joints [D and D‟]. The air-gap
between the cleaved fibres constitutes a Fabry-Perot (FP) cavity. The gauge length is defined
as the distance between the fusion joints.
Page 134
122
AD D‟
C E F H I
B B‟
G
G‟
G”
AD D‟
C E F H I
B B‟
G
G‟
G”
B B‟
G
G‟
G”
Figure 3.32 Schematic illustration of the multi-functional sensor design.
In this new design, the precision-bore quartz capillary tube was used to house the cleaved
optical fibre but in addition, the end-faces of the capillary are used as a reflective surface. The
elements that transform the primary EFPI sensor into the “multi-functional sensor” are: (i) the
fibre Bragg grating (FBG): [E] that is inscribed in the end-region of the primary optical fibre
[B‟], (ii) the fibre reflective coating on the end-face of the capillary: [F] and (iii) the
secondary optical fibres: [G, G‟ and G‟‟] that are located around the primary optical fibre:
[B‟]. The secondary fibres are arranged and secured in position to create secondary cavities:
[H].
The secondary fibres [G and G‟‟] illustrated in Figure 3.32 are multi-mode optical fibres. The
cavity between the cleaved end-faces and the reflective coating serves as a “cell” for
conducting trans-reflectance near-infrared spectroscopy of the resin (see Section 3.4.2.2).
Sensing fibres [B‟] and [G‟] both are single mode-fibres. However, the Bragg gratings that are
inscribed on the secondary fibre [G‟] can be used to monitor the combined effects of strain
and temperature. In contrast, the FBG sensor [E] on the primary optical fibre is in a strain-
free condition and thus responds only to temperature. The EFPI sensor can be used to
determine the axial strain along the capillary due to process-induced stresses develop during
cross-linking of the epoxy resin. Any changes in the cavity length [C] will enable the strain to
Page 135
123
be calculated. With regard to qualitative process monitoring, cleaved lead-out fibres from a 2
x 2 coupler can be attached as secondary fibres. These fibres can be attached on to the
primary fibre at a suitable distance away from the reflective coating of the capillary end-face
to serve as Fresnel reflection-based refractive index sensors.
3.9.2 Sensor fabrication
The conventional EFPI sensor consists of cleaved optical fibres that are secured within a
precision-bore capillary tube. The cleaved fibres are secured to the capillary tube via two
fusion joints. The gap between the cleaved fibres constitutes a FP cavity. The gauge length is
defined as the distance between the fusion joints. Before making the EFPI sensor, the
reflective end-face of the capillary was prepared as explained in Section 3.4.2.2.
Germania-Boron (Ge-B) co-doped single-mode fibre (PS1250/1500, Fibercore Ltd., UK) was
used for fabricating the primary FP cavity. FBG sensor was inscribed in the Ge-B co-doped
primary optical fibre using the phase-mask technique and an excimer laser (Braggstar,
Coherent, UK) operating at 248 nm. The FBG sensor was produced using pulse energy of 10
mJ and 1500 pulses. The fibre with the FBG sensor was cleaved ensuring that the grating was
located in close proximity to the cleaved-end (see Figure 3.32). The cleaved fibre was
secured to the capillary via a fusion joint. With reference to Figure 3.32, secondary fibres
were attached around the “primary” optical fibre using a UV curable resin (UV 304-T). This
resin was cured using a UV light source (UV75, Thorlabs Inc. UK). The approximate length
of 10.0±0.5 mm PTFE sleeve (Adtech Polymer Engineering, UK) was used for locating the
secondary fibres around the primary optical fibre before bonding. Internal and outer
diameters of the PTFE sleeve are 0.40±0.05 mm and 0.84±0.05 mm, respectively.
Page 136
124
3.9.3 Sensor interrogation and monitoring of the cross-linking
reaction
A schematic illustration of the experimental set-up that was used for monitoring the cross-
linking reaction is shown in Figure 3.33(a). With reference to Figure 3.33(a), the Bruker
MATRIX™
-F FT-NIR spectrometer was used for sensor interrogation. Conventional
transmission FTIR spectroscopy and the experiments involving the multi-functional sensors
were carried out simultaneously. The conventional transmission FTIR spectroscopy was
carried out using a 1 mm path-length de-mountable cuvette: [D]. A commercially-available
near-infrared transmitting fibre optic probe: [A] was connected to one of the light output
channels of the spectrometer and the other end was attached to a temperature-controlled
cuvette holder: [B] via collimating optics: [C]. The transmitted light from [C] and through the
de-mountable cuvette cell: [D] and the mixed resin: [E], was collect via collimating optics:
[C‟] and returned to the corresponding input detector port on the spectrometer. Due care was
taken to ensure that the sensor did not obstruct the light-path of the conventional transmission
experiment via the collimated optics.
The multi-functional sensor was secured to an internal side-wall of the de-mountable cuvette
mentioned above using a UV curable resin (UV 304-T). As discussed previously, the
secondary cavities were formed in between the secondary multi-mode fibres (105/125 mm)
and the gold-coated end-face of the capillary. The secondary cavity for monitoring the cross-
linking reactions and the Fresnel-based (refractive index) sensors, [G] and [I], respectively,
were connected to the spectrometer via individual custom-made multi-mode 2 x 2 couplers:
[K]. Spectra were obtained using a resolution of 0.025 nm and 64 scans via the chemical
Page 137
125
sensor and the cavity length between the reflective end-face and the cleaved fibres was 250
m. With respect to the FTIR-based interrogation of Fresnel reflection fibre sensor, the
amplitude of the interferogram signal corresponding to the reflection from the two lead-out
fibres immersed in the medium was monitored. The spare output arm of the coupler: [J] was
immersed in index-matching gel. In Figure 3.33, [L] represents the spare channels on the
spectrometer that can be used to interrogate additional secondary sensor such as evanescent
wave-based sensor or additional FBG sensors for combined temperature and strain
measurements. [M] represents a K-type thermocouple for independent monitoring of actual
temperature with in the mixed resin during cross-linking.
A
C
E
F
DB
C‟
J
K
Spectrometer
Input channels
Output channels
G
I
H
L
M
L
ASE light
source
A
C
E
F
DB
C‟
J
K
Spectrometer
Input channels
Output channels
G
I
H
L
M
L
ASE light
source
Figure 3.33 Schematic illustration of the experimental set-up and combined EFPI/FBG sensor
interrogation using an external light source.
Page 138
126
With reference to the combined strain/temperature (EFPI/FBG) sensor: [H], this device can be
illuminated by an external light source or the internal light source of the FTIR spectrometer.
In the proof-of-concept experiments, the sensor was illuminated by an external light source
and also by the internal light source. Difficulties associated with sensor interrogation using
the internal light source of the spectrometer will be discussed (Section 6.3.3).
The resin system used for monitoring the cross-linking reaction was LY3505 epoxy resin and
XB3403 amine-based cross-linking agent. The mixed resin was injected into the cell at 30 oC
and processed at 60 oC for 8 hours. The system was then cooled naturally to 30
oC.
3.9.4 Characterisation of EFPI and FBG Sensors
Two EFPI and five fibre Bragg grating (FBG) sensors (Figure 3.34) was employed to verify
the consistency of the response of the EFPI and FBG sensor for temperature and resin
shrinkage during cross-linking. Two EFPI sensors and five FBG sensors were attached on to a
de-mountable cell and interrogated simultaneously. The EFPI were fabricated in the following
manner. Two single-mode fibres were cleaved and secured inside a precision-bore capillary
via two fusion joints. The ends of the capillaries with the optical fibres were sealed using a
high-temperature resistant epoxy adhesive. This was done to prevent resin seeping into the
EFPI cavity during processing and also to reinforce the fusion joints of the sensors [362].
Gauge length of the sensors was measured using an optical microscope.
Three out of five gratings have been sealed into precision-bore fused-silica capillaries, to
isolate them from mechanical loads transmitted to the fibre when they are embedded in the
epoxy resin. One end of the capillary was sealed completely using fusion arc and the other
Page 139
127
side was fused on to the FBG fibre. The fibre-capillary splice was also reinforced with high-
temperature resistant epoxy adhesive. These gratings (FBG-T) operate in a strain-free
condition and behave as optical fibre thermometers, allowing the measurement of actual
temperature. One of these sealed gratings (FBG-T3) was attached outside the cell, while other
two gratings (FBG-T1 and FBG-T2) embedded within the epoxy resin. Two remaining
unsealed gratings (FBG-S1 and FBG-S2) were embedded in the resin to monitor the
combined effect of temperature and strain with in the resin. All the EFPI and FBG sensors
were attached to the inner wall of the de-mountable cell as shown in Figure 3.34; however,
sensing regions of the sensors were not bonded onto the cell wall. A K-type thermocouple
was placed nearby the FBG-T3 optical sensor, outside the 1mm path-length cuvette and used
as an independent reference.
Two sensor-interrogation systems were used to cross correlate the sensitivity of the systems
against each other and a schematic illustration of the experimental set-up is shown in Figure
3.34. Two EFPI sensors (EFPI-1 and EFPI-2), one embedded FBG (FBG-S1) and one sealed
FBG (FBG-T1) that attached inside the de-mountable cell were interrogated using a
broadband light source (Lumen Photonics, LPB-1550-D) and an optical spectrum analyser
(OSA) (Anritsu MS9710B) via an optical channel selector (Anritsu MN9674A). The sensors
were recorded with 0.07 nm resolution. Out of remaining three FBG sensors, one embedded
FBG (FBG-S2) and one sealed FBG (FBG-T2) that attached inside the cell and one sealed
FBG (FBG-T3) that attached outside the cell, were monitored via a FBG interrogation system
(FiberPro IS7000).
The sensor characterisation was carried out in a temperature-controlled cuvette holder (Ocean
Optics) with ±0.02oC accuracy. Temperature sensitivity of the EFPI and FBG sensors (in air)
Page 140
128
was investigated by monitoring the FP cavity length and Bragg peak shift, respectively at
fixed temperatures with in the range of 30 – 80 oC. The same sensor set-up was used for
measurement of resin shrinkage during cross-linking of an epoxy/amine resin system. Cross-
linking of the resin was carried out at 60 oC for 8 hours. The experiment set-up was
maintained at 30 oC before starting the experiment, injected the resin into the cell, heated the
system up to 60 oC followed by cross-linking the resin isothermally for 8 hours. The system
was then naturally cooled back down to 30 oC.
De-mountable cell
De-mountable
cell
(cover slide)
Thermocouple
FBG-S2
FBG-T3
FBG-T2FiberPro
FBG
Interrogation
Unit
EFPI-1
FBG-S1
FBG-T1
Optical
Channel
Selector
Broadband
Light
Source
Optical Spectrum
Analyser
EFPI-2
De-mountable cell
De-mountable
cell
(cover slide)
ThermocoupleThermocouple
FBG-S2
FBG-T3
FBG-T2FiberPro
FBG
Interrogation
Unit FBG-S2
FBG-T3
FBG-T2FiberPro
FBG
Interrogation
Unit
EFPI-1
FBG-S1
FBG-T1
Optical
Channel
Selector
Broadband
Light
Source
Optical Spectrum
Analyser
EFPI-2
EFPI-1
FBG-S1
FBG-T1
Optical
Channel
Selector
Broadband
Light
Source
Optical Spectrum
Analyser
EFPI-2
Figure 3.34 Schematic illustration of the experimental set-up and sensor interrogation.
3.10 Conclusions
Two fibre-optic sensing techniques were demonstrated for in situ monitoring of cross-linking
reaction and moisture ingress in the LY3505/XB3403 epoxy resin system: near-infrared
transmission spectroscopy and near-infrared reflection spectroscopy.
Page 141
129
In situ monitoring of cross-linking reaction in the epoxy resin system was conducted using the
fibre-optic near-infrared spectroscopy under transmission and reflection mode. Cross-linking
kinetics of the resin system was evaluated at four isothermal reaction temperatures, 40, 50, 60
and 70 oC.
Influence of hygrothermal conditioning of the cross-linked epoxy resin system was studied
using conventional techniques and fibre-optic transmission spectroscopy. Experimental
procedures and specimen fabrication techniques associated with the conventional
characterisation techniques as well as fibre-optic transmission spectroscopy were discussed.
Absorption kinetics of water in the resin system was characterised using conventional
techniques at three immersion temperature 30, 50 and 70 oC and 100 % RH. Fibre-optic near-
infrared transmission spectroscopy was employed for in situ monitoring of moisture ingress at
50 oC and 100 % RH.
In addition, proof-of-concept experiments carried out to demonstrate the feasibility of using a
new multi-functional sensor design were explained. The experiments include characterisation
of the sensing elements for temperature and strain monitoring as well as using the sensor
design for on-line monitoring of multiple parameters during cross-linking of the epoxy resin
system.
Page 142
130
Chapter 4
Fibre-optic near-infrared spectroscopy
and optimisation of sensor designs
4 Overview
4.1 Introduction
Fibre-optic sensors were designed for monitoring the cross-linking reactions and diffusion of
moisture in an epoxy/amine resin system using near-infrared spectroscopy. The following
issues will be discussed in this chapter:
The basis for conventional infrared spectroscopy for quantitative analysis using fibre-
optic infrared spectroscopy.
Effectiveness of different sensor designs in terms of reproducibility, dimensions and
ease of handling.
Page 143
131
Investigation of the selection of appropriate path-length for constructing fibre-optic
sensors.
4.2 Ray-optic considerations for fibre-optic spectroscopy
4.2.1 Fibre-optic transmission spectroscopy
Fabrication of the single-fibre transmission sensor involves holding two cleaved multi-mode
fibres aligned and facing each other with a gap in between as shown in Figure 3.1. The cavity
between the cleaved fibres serves as a cell to contain an analyte solution. In the current study,
the analyte solution was either uncured epoxy/amine resin system in the case of monitoring of
cross-linking reaction or cross-linked epoxy/amine resin system in case of moisture-ingress
monitoring.
The input fibre that transmits the infrared (IR) light to the sensing region and the output fibre
that carries the transmitted light through the resin to the FTIR spectrometer are connected to
the light source and the detector, respectively. As shown in Figure 3.1, incident light intensity
at the cleaved fibre surface is denoted as Io and the intensity of the light at the receiving fibre
end is denoted as I. The background/reference measurement of this sensor arrangement was
recorded with air in between the cleaved fibre faces. The ratio of the sample spectrum of the
epoxy resin system to the background spectrum is used to generate the absorbance spectrum
of the resin according to the relationship given below:
Page 144
132
10
0
logI
AI
Equation 4.1
According to the Beer-Lambert law, the absorbance, A can also be defined as shown in
Equation 2.12. The same theory is said to be valid for using fibre-optics for IR transmission
spectroscopy [363]. However, for conventional transmission FTIR spectroscopy, absorbance
was derived for a parallel beam transmitted through an analyte. Then with air as an analyte, at
any wavelength, absorbance, A→ 0 as I/Io → 1. The theory is also valid for commercial
infrared fibre-optic spectroscopy, where high-precision beam aligning and beam collimating
techniques are used [191,364,365]. But in the case of fibre-optic transmission spectroscopy
discussed in this study, the ray-optics of IR radiation at the sensing cavity are different from
that mentioned above and can be drawn schematically as shown in Figure 4.1. IR radiation
diverges at the fibre/analyte interface due to the difference in refractive indices of the fibre
core and the analyte in the sensing cavity. According to the ray optic theory of fibre
transmission and considering bound rays, the half-angle of cone of acceptance ( o) at the fibre
interface can be expressed using Snell’s law of refraction, [227,366]:
1 0 0sin sincoren n Equation 4.2
1
0
0
sinNA
n Equation 4.3
where ncore and no are refractive indices of the fibre core and the analyte, respectively. θ is the
angle between the bound rays and an imaginary line drawn perpendicular to the cleaved fibre
end and subscripts 1 and 0 represent the incident and transmission media, respectively. NA is
the numerical aperture of the step-index multimode fibre (see Appendix – I).
Page 145
133
o
1
1
Fibre core
Fibre cladding
ncore
ncladding
n0
rcore
Output fibreInput fibre
d
ao
rcore
o
1
1
Fibre core
Fibre cladding
ncore
ncladding
n0
rcore
Output fibreInput fibre
d
ao
rcore
Figure 4.1 Schematic illustration of ray-optic approach for transmission of IR radiation at the fibre-optic
sensing cavity.
Then the power of IR radiation that enters into the output fibre, P3(λ) can be represented as a
fraction of the power that is leaving the input fibre interface, P0(λ) as below (see Appendix –
I) [367]:
2
03 0
0 0
1( ) 1 ( )
10 tan
core core
A
core core
n n rP P
n n r d Equation 4.4
According to the Equation 4.4, the power of IR radiation that couples in to the output fibre is
a function of refractive index of the analyte, absorbance at a wavelength, λ and the distance
between fibre ends. This can be written as below:
3 0 0( ) , , ( )P f n A d P Equation 4.5
Page 146
134
Therefore for monitoring of cross-linking reaction of an epoxy/amine resin system, P3(λ)
changes throughout the cross-linking reaction as the refractive index of the resin system
increases. The change in P3(λ) during cross-linking of the epoxy resin system used in this
study will be discussed in more detail in Section 5.4.4.1.
4.2.2 Fibre-optic reflectance spectroscopy
Near-infrared reflectance spectroscopy using multimode fibres involves transmitting light to
the sensing region and reflected light from the analyte to the detector using a single fibre. The
sensor was constructed using capillary reflector design (see Section 3.4.2.2).
In infrared spectroscopy, the mode of operation used in the fibre-optic design is generally
called as trans-reflection spectroscopy. When IR radiation is directed on to an analyte as
shown in Figure 4.2, reflected radiation from the analyte consists of “specular”
reflections/trans-reflections where the angle of reflection is equal to that of incident and
“diffuse” reflections; those reflected in all other directions [368]. For an optically clear, thin
layer of analyte placed on a mirror-like surface, the major portion of the radiation transmits in
to the medium and reflects back at the reflective surface. Therefore the fibre-optic reflectance
sensor explained in this study, can be classified as trans-reflectance spectroscopy (TRS)
[122,191,368].
The reflecting face of the capillary reflector was coated with a thin layer of gold,
approximately 12 – 15 nm in thickness using a sputter coater (see Figure 4.2). In trans-
reflection spectroscopy, the infrared spectrum is generated by calculating the ratio of the
single-channel spectrum of an analyte to that of the reference. A bright, optically flat surface
Page 147
135
is required to obtain the reference spectrum. Materials that can be used as a reference
substrates for different regions in IR spectrum were discussed by Griffiths [369] and
recommended that a gold substrate is most suitable for taking a reference spectrum compared
with sintered ceramic discs and PTFE® discs commonly used in the near-IR range.
Incident IR
radiation
Specular/trans-reflected
IR radiation
Radiation transmitted
in to the analyte
Diffuse IR
radiation
Reflective substrate
Analyte
Incident IR
radiation
Specular/trans-reflected
IR radiation
Radiation transmitted
in to the analyte
Diffuse IR
radiation
Reflective substrate
Analyte
Figure 4.2 Schematic diagram of trans-reflectance (specular) and diffuse reflection; the incident beam is
drawn at an arbitrary incident angle.
The fraction of trans-reflection depends on the angle of incidence, refractive index of the
analyte, surface roughness of the substrate and absorption characteristics of the analyte. For
a thin layer of clear analyte and IR radiation that enters into the sample with an incident angle
between 0 – 88o, the radiation passes through the thin layer, reflects back at the reflective
substrate and exits from the analyte after passing through the film for second time. Then the
exit radiation from the analyte film is considered as trans-reflectance (specular) radiation and
if the analyte layer is thin enough so that the radiation is not totally absorbed by the film,
spectral data is equivalent to that obtained using transmission spectroscopy [368,195]. It can
be shown that the half-angle of cone of acceptance, o emerging at the cleaved step-index
Page 148
136
multimode fibre (considering air as the medium in the sensing cavity) is 12.709o
(Equation
4.2). The diameters of the core and the cladding were 105±3 m and 125±4 m, respectively.
Numerical aperture and the refractive index of the core of step-index multi-mode fibre are
0.22 and 1.46, respectively. Schematic illustration of ray optic path of IR beam at the sensing
region is shown in Figure 4.3. Therefore according to the law of reflection, the maximum
angle of reflection at the reflective substrate is equal to o and the sensing concept of the
fibre-optic reflectance spectroscopy is analogous to that of fibre-optic transmission
spectroscopy. However, the path-length for reflection spectroscopy will be twice as that for
transmission spectroscopy with the same cavity length, d (see Figure 4.3).
Refl
ecti
ng s
ub
stra
te
o
1
1
Fibre core
Fibre cladding
ncore
ncladding
n0
rcore
Input/output fibre
d
a
o
o
o
Refl
ecti
ng s
ub
stra
te
o
1
1
Fibre core
Fibre cladding
ncore
ncladding
n0
rcore
Input/output fibre
d
a
o
o
o
Figure 4.3 Schematic illustration of ray-optic approach for trans-reflectance reflection of IR radiation at
the fibre-optic sensing cavity.
Page 149
137
Considering the ray optic approach that was used for the fibre-optic transmission
spectroscopy, the power of IR radiation that is coupled back to the fibre, P5(λ) in fibre-optic
reflectance spectroscopy can be expressed as below (see Appendix – II):
22
10 05 0
0 0
( ) 10 1 ( )2 tan
reflAA
core core
core core
n n rP P
n n r d Equation 4.6
5 0 0( ) , , ( )P f n A d P Equation 4.7
Assuming constant reflectivity at the reflector, f(no,A,d) can be expressed as the fraction P0(λ)
and is a function of refractive index of the analyte, absorbance at λ and distance between the
cleaved fibre and the reflective surface. The change in fraction of power coupled back to the
detector in fibre-optic reflectance spectroscopy during cross-linking and a comparison of the
efficiency of light coupling under transmission and reflection modes will be discussed in
Section 5.4.4.2.
4.3 Fibre-optic sensor designs
4.3.1 Fibre-optic transmission spectroscopy
Fibre-optic transmission spectroscopy was performed using 105/125 m step-index
multimode silica optical fibre. Three different types of sensor fixtures were designed for
Page 150
138
constructing the single-fibre transmission sensor and the feasibility of using each sensor
design was investigated [357,370].
4.3.1.1 Epoxy substrate sensor design
In this sensor design, precision-bore quartz capillary, which holds the sensing fibres, was
embedded in a thin layer of neat-epoxy resin (see Figure 4.4). The approximate dimensions
of these rectangular sections were 15 mm (length), 4.2 mm (width) and 0.5 mm (thickness).
A groove was cut across the rectangular section using a diamond-tipped cutting wheel to
create the sensing region. A similar sensor design was proposed and investigated by Powell
et al. [196] in which sensing fibres were axially aligned on a cross-linked epoxy v-groove.
Figure 4.4 Schematic illustration of the epoxy substrate sensor design.
In the epoxy substrate sensor design, it is necessary to embed the capillary in a material,
which is compatible with the structure in which the sensor will be embedded. This is to
minimise the influence of the embedded sensor on the physical and mechanical performance
of the structure. Generally, embedding a foreign object within a composite structure has a
major influence on issues related to mechanical and physical integrity of the structure.
Therefore ideally, the best option is to use the same resin as the base structure to fabricate the
sensor fixture. In the case of epoxy resin matrices, it is necessary to use the same processing
Page 151
139
schedule, which is used for composite manufacturing, for the sensor fabrication. Otherwise
different processing conditions increase the possibility of building up stresses at the resin/
fixture interface.
The dimensions of the sensor fixture also may have an influence on the properties of the base
structure. In continuous fibre-reinforced composites, this has a considerable impact on the
relative orientation of the reinforcement. Also it may create resin-rich areas due to induced
waviness between the prepreg layers. The effects due to the dimensions can be minimised by
miniaturising the sensor design. The thickness and the width of the cross-linked resin layer
around the capillary were larger compared to the dimensions of the other sensor designs,
which will be discussed in Sections 4.3.1.2 and 4.3.1.3. In terms of sensor fabrication, care is
required during making the groove across the capillary in order to maintain rigidity of the
substrate. Also it was observed that maintaining the dimensional consistency of the sensor
fixture is difficult. Therefore, making a good quality sensor considerably depends on the
experience of the operator.
4.3.1.2 Capillary support sensor design
The approximate dimensions of the capillary support fixture were 22 mm (length), 0.6 mm
(width) and 0.3 mm (thickness). In terms of width and thickness of the sensor fixture, this
sensor design is smaller than that of the epoxy substrate sensor design (see Figure 4.5). The
length of the fixture can be minimised by using shorter capillaries for supporting capillaries
and also for the substrate capillary. However, in order to feed the sensing fibres through the
capillaries, care must be taken to keep the bore of the supporting capillaries free from
adhesive. Therefore in the current study, the overall length of the sensor design was kept
around 20 – 25 mm.
Page 152
140
Figure 4.5 Schematic illustration of the capillary support sensor design.
In fibre-reinforced composites, defects within the structure due to the embedded sensors could
be reduced using this sensor design. The influence could be further minimised by choosing
the correct sensor angle with respect to the direction of the reinforcing fibres. For example,
sensors can be embedded along the axis of the reinforcing fibres to reduce fibre waviness and
resin-rich regions [220,364]. The problems associated with embedded optical fibres on the
mechanical properties of advanced fibre-reinforced composites have been reviewed in
references [371,372,372]. From a sensing point-of-view, the sensor design is more stable and
rigid compared with the epoxy substrate sensor design. The substrate capillary was fixed on
to the supporting capillaries while the sacrificial fibre was kept across the both supporting
capillaries. In addition, the substrate capillary is more rigid and stable than the resin layer in
the epoxy substrate sensor design and hence required level of fibre alignment can be achieved.
Sensor fabrication is more robust and time-efficient compared to the epoxy substrate sensor
design. The quality of this sensor fixture does not depend on skill and experience and also
reasonable dimensional consistency can be achieved. The only disadvantage of this design is
the brittleness of the fixture design compared with the epoxy substrate sensor design.
Nevertheless, the brittleness of the fixture had less influence on handling during sensor
fabrication as well as during embedding.
Page 153
141
4.3.1.3 Abraded capillary sensor design
The third sensor design (abraded capillary) was constructed by partially abrading a quartz
capillary along its length. An attempt was made to minimise the fixture dimensions by using
only a single precision-bore capillary as a support to hold the sensing fibres (see Figure 4.6).
Figure 4.6 Schematic illustration of the abraded capillary sensor design.
George et al. [147] demonstrated using a single-fibre sensing concept for fibre-optic near-
infrared spectroscopy in transmission mode. In that sensor design, plastic-clad silica optical
fibres were aligned with a gap in between the cleaved fibre faces using a glass micro-
capillary. Two different diameters of the sensing fibres were used: 600 m and 1000 m.
However they were unable to observe absorption bands down to 2500 nm due to cut-off
wavelength range of the optical fibres. Therefore the authors were unable to use the
absorption band due to epoxy ring vibration at 2207 nm for quantitative analysis. Rogers et
al. [195] deployed the same sensor design for monitoring of cross-linking reaction of a
TGDDM/DDS resin system. In this study, fluorine-doped silica-clad silica fibre was used for
sensing and two cleaved fibres were aligned facing each other using PTFE micro-bore tubing.
The cavity length between two fibre faces was 2 mm. Mijović et al. [136] reported a similar
transmission cell design for in situ monitoring of cross-linking reaction using near-infrared
Page 154
142
transmission spectroscopy. The sensor design consists of two 600/630 m fused silica
multimode fibres aligned in a short section of capillary. Good spectral quality was obtained
with 2-3 mm cavity length. However, in all investigations mentioned above, the method of
inserting the resin system into the sensing cavity, which was created inside the capillary has
not been discussed clearly. Fernando et al. [81] proposed a sensor design for chemical
sensing where two multimode fibres were aligned in a metal capillary. A slot was introduced
to the metal capillary to inject resin into the sensing cavity. The reaction mechanism of an
epoxy resin system was successfully modelled based on fibre-optic spectroscopy. Only
disadvantage associated with their sensor design is that the metal aligning capillary may cause
materials mismatch within the composite structure [185].
Although the structural integrity of the composite structure can be less influenced by using the
abraded capillary sensor design, there are several disadvantages associated with the sensor
fabrication and handling. Due to the brittleness of quartz and very low thickness of the
ground section, the sensor fixture was more fragile than the other sensor designs discussed.
The approximate thickness of the capillary after grinding was approximately 170 μm. Also
difficulties were experienced during feeding the sensing fibres through the abraded bore due
to the very-low strength of the capillary after abrading.
Fixture fabrication also is more complicated compared with the fabrication of the other two
sensor designs. A metal holder with a precision v-groove was used to grind the capillary
along its axis. Non-uniform grinding along the axis (see Figure 4.7) was observed which lead
to insufficient depth of the U-shape capillary section for holding the sensing fibres. In Figure
4.7, the dotted grey line shows the expected level of the capillary face after grinding and the
dark continuous line shows the angled-flat face due to non-uniform grinding. This may be
Page 155
143
attributed to non-uniform pressure applied on the metal support during grinding. This also
causes a reduction in the strength of the sensor fixture.
Insufficient capillary
height due to
excessive grinding
Desired capillary
height after
grinding
Insufficient capillary
height due to
excessive grinding
Desired capillary
height after
grinding
Figure 4.7 Schematic illustrations of an abraded capillary with non-uniform grinding
along its axis.
In addition, fracture across the capillary was observed during grinding as well as during
cleaning after grinding. Therefore wastage associated with the sensor fabrication process is
high compared with the epoxy substrate and capillary support sensor designs.
Several approaches can be used to address above-mentioned issues related to the sensor
design and a few suggestions are given below. Fabrication and handling difficulties can be
minimised by using a capillary with thicker wall. Also the quartz capillary can be replaced
with a rigid polymeric capillary, which is less brittle compared with quartz. However, a
polymeric capillary as a substitute may affect the sensor alignment due to bending and
warping at elevated temperatures. On the other hand, precision equipment can be used to
minimise the issues related to fabrication. However, such alternative measures increase the
cost of sensor fabrication.
Page 156
144
The advantages and disadvantages associated with each sensor design has been summarised
in. With reference to Table 4.1, the selection criteria for identifying the “best” sensor design
for the subsequent experiments was based on the following:
(i) Fixture fabrication – robustness, reproducibility, dimensional consistency;
(ii) Sensor fabrication – ease of handling, degree of alignment of sensing fibres,
stability of the fibre alignment; and
(iii) Impact on the embedding structure – dimensions of the sensor design,
compatibility with the base composite structure.
Table 4.1 Advantages and disadvantages of sensor designs constructed in this study.
Sensor design Comments
Epoxy substrate Advantages:
Ease of sensor fabrication.
Low cost.
Can be mass-produced.
Disadvantages:
Relatively large dimensions of the sensor fixture. This may cause resin rich
regions and waviness between the prepreg layers.
Degree of fibre alignment of the sensor is highly dependent on the thickness
of the resin layer at the sensing region.
Dimensional consistency of sensor fixture is low.
Quality of the sensor fixture is considerably dependent on the experience of
the operator.
Capillary support Advantages:
Sensor fabrication is straightforward.
Sensor fixture is more stable and rigid compared with the epoxy substrate
sensor design.
Good reproducibility of the quality of the sensor in terms of fibre alignment.
Reasonable dimensional accuracy can be achieved.
Less dependency of the quality of the sensor on operator skills.
Disadvantages:
Sensor fixture is brittle when compared with the epoxy substrate.
The relative dimensions are smaller than the design based on the epoxy
substrate. But the overall thickness is 300 m.
Abraded capillary Advantages:
Sensor design is smaller in size compared with the above-mentioned designs
and hence less influence on the relative orientation of the reinforcing fibres.
Disadvantages:
Fabrication of the fixture is more complicated and required a custom-made
rig to abrade and polish the capillary.
Page 157
145
Dimensions of the fixture are highly dependent on operator skills.
Sensor fixture is more fragile than other sensors.
Wastage associated with the sensor fabrication process is high compared
with other sensor designs.
The issues associated with the fabrication of the fixture and the sensor were concluded.
Although the relative dimensions of the sensors are important during embedding in
composites, their size did not pose any problem when deployed for studies involving
thermosetting resins.
Accordingly, it was decided to use capillary support sensor design for fabricating the single-
fibre transmission sensor for monitoring the cross-linking reactions and diffusion of moisture
in the epoxy/amine resin system.
4.4 Optimum cavity length for fibre-optic spectroscopy
4.4.1 Fibre-optic transmission spectroscopy
The capillary support sensor design was used to determine the optimum cavity length for
fibre-optic transmission spectroscopy. For this experiment, one of the sensing fibres was
inserted into one supporting capillary of the sensor fixture and was attached on to a precision
translation stage to change the gap between cleaved sensing fibres (see Section 3.6.1).
Absorbance spectra obtained with different cavity lengths are shown in Figure 4.8. Well-
resolved combination band, due to second overtone of the epoxy ring stretching and C-H
bending vibration peak at 2207 nm, was used to investigate the spectral quality as a function
of cavity length (detailed peak assignments of LY3505/XB3403 resin system is given in
Page 158
146
Table 5.1). According to Figure 4.8, the epoxy peak height increases as the cavity length
increases. This is in accordance with Equation 2.12. However, the objective of determining
appropriate path length for the sensor is not only to maximise the absorption but also to
optimise the intensity of the light coupling into the receiving fibre and hence to obtain good
signal-to-noise ratio.
According to Figure 4.9, it can be clearly seen that the peak area increases linearly as the
cavity length increases.
100 m
200 m
300 m
400 m
500 m
600 m
700 m
800 m
900 m
1000 m
Nanometres
100 m
200 m
300 m
400 m
500 m
600 m
700 m
800 m
900 m
1000 m
100 m
200 m
300 m
400 m
500 m
600 m
700 m
800 m
900 m
1000 m
Nanometres
Figure 4.8 Near-infrared spectra of LY3505 bisphenol-A epoxy resin as a function of sensing cavity
length. Absorption peak at 2207 nm is due to the absorption band of epoxy.
Page 159
147
y = 0.0107x + 0.4927,
R2 = 0.9978
0.0
2.0
4.0
6.0
8.0
10.0
12.0
0 200 400 600 800 1000 1200
Cavity length (micrometres)
Peak a
rea o
f epoxy
absorp
tion a
t 2207 n
m
Sensor design
y = 0.0107x + 0.4927,
R2 = 0.9978
0.0
2.0
4.0
6.0
8.0
10.0
12.0
0 200 400 600 800 1000 1200
Cavity length (micrometres)
Peak a
rea o
f epoxy
absorp
tion a
t 2207 n
m
Sensor design
Figure 4.9 Relationship between the epoxy peak area and the cavity length.
100 m
500 m
1500 m
Nanometres
100 m
500 m
1500 m
100 m
500 m
1500 m
Nanometres
Figure 4.10 Comparison of single-channel spectra obtained for cavity lengths of 100, 500 and 1500
μm using fibre-optic transmission spectroscopy.
Page 160
148
It can be shown that with constant refractive index, no of an analyte in the sensing cavity, as
the cavity length, d increases, “d tan θo” increases and therefore the fraction of power of IR
beam couple into the output fibre decreases (see Appendix – I). The increase in power loss of
IR beam with increasing cavity length also can be evident from single-channel sample spectra
obtained with different cavity lengths as shown in Figure 4.10. As shown in Figure 4.10, a
sample signal acquired with a 1500 μm cavity length is very weak compared with that
recorded for 100 μm cavity length [365]. Therefore according to Equation 4.1, it can be
shown that for 0I I= and 0 1I I = , absorbance > 1. However as shown Figure 4.8, peak
resolution with 100 μm cavity is very low as the thickness of the analyte within the cavity is
not enough to show strong absorption bands. On the other hand, infrared detectors have a
threshold light intensity below which the detector is not capable of producing acceptable level
of signal-to-noise ratio. Therefore to obtain a reasonable signal without losing spectral
resolution, the cavity length for fibre-optic near-infrared transmission spectroscopy was kept
approximately as 500 μm.
4.4.2 Fibre-optic reflectance spectroscopy
Two sensor configurations were investigated to optimise the sensor design as shown in Figure
3.17: in set-up A, one fibre was used for sensing whilst the other fibre end was immersed in a
refractive index-matching gel to minimise reflections at the fibre end. In set-up B, both lead-
out fibres on the sensing side of the coupler were used for sensing. The LY3505® epoxy resin
was used as an analyte medium. Spectra of resin with different cavity lengths between the
cleaved fibre ends were recorded and investigated to determine optimum gap for monitoring
Page 161
149
of cross-linking reaction. The gap was changed from 100 to 1500 m in 100 m steps. The
experiment was repeated three times to obtain an average absorbance.
Capillary reflector sensor design – Set-up A
Figure 4.11 shows absorbance spectra obtained using Set-up A with different cavity lengths.
A combination band due to the second overtone of the epoxy ring stretching and C-H bending
vibration peak at 2209 nm was used to investigate the spectral quality as a function of cavity
length. According to Figure 4.11, the signal-to-noise ratio increases and peak height reduces
as the cavity length increases beyond 700 m.
100 m 200 m 300 m 400 m 500 m
600 m 700 m 800 m 900 m 1000 m
Nanometres
100 m 200 m 300 m 400 m 500 m
600 m 700 m 800 m 900 m 1000 m
Nanometres
Figure 4.11 Near-infrared spectra of LY3505 bisphenol-A epoxy resin as a function of cavity length
obtained using the capillary reflector Set-up A; absorption peak at 2209 nm is due to
combination band of epoxy; spectra obtained with cavity lengths greater than 700 m were
expanded along the y-axis to improve the clarity of individual spectra.
Page 162
150
Capillary reflector sensor design – Set-up B
Absorbance spectra obtained using Set-up B with different cavity lengths are shown in Figure
4.12. The same combination band due to the epoxy peak at 2209 nm that was used for
analysing the spectral data obtained via Set-up B was used to quantify the effect of the cavity
length on spectral quality. According to Figure 4.12, the spectral resolution and peak
intensity reduce as the cavity length increases beyond 800 m.
100 m 200 m 300 m 400 m 500 m
600 m 700 m 800 m 900 m 1000 m
Nanometres
100 m 200 m 300 m 400 m 500 m
600 m 700 m 800 m 900 m 1000 m
Nanometres
Figure 4.12 Near-infrared spectra of LY3505 bisphenol-A epoxy resin as a function of cavity length
obtained using the capillary reflector Set-up B; Absorption peak at 2209 nm is due to
combination band of epoxy; spectra obtained with cavity lengths greater than 800 m were
expanded along the y-axis to improve the clarity of individual spectra.
Page 163
151
Comparison of capillary reflector – Set-up A and Set-up B
Spectra obtained from both set-ups show an increase in peak height for a cavity length of 700
m. However, it can be seen from Figure 4.12 and Figure 4.11 that for the 100 – 700 m
cavity length range, the peak intensity of spectra acquired via Set-up B is higher compared to
that recorded using Set-up A. Figure 4.13 shows the relationship of epoxy peak area and
sensing cavity length. The spectral responses acquired using capillary reflector; Set-up A and
B are cross-plotted as a function of cavity length. As the cavity length increases, the
difference in peak area obtained with two design configurations increases. Set-up B gives
slightly higher peak area compared with the peak area recorded using Set-up A for the same
cavity length. According to Figure 4.13, a linear relationship between epoxy peak area and
cavity length can be seen up to around 500 m cavity length irrespective of the sensing
configuration.
0.00
2.00
4.00
6.00
8.00
10.00
12.00
14.00
16.00
18.00
0 200 400 600 800 1000 1200
Cavity length (micrometres)
Pe
ak a
rea
of
ep
oxy a
bso
rptio
n @
22
07
nm
Set-up A - one lead-out fibre
Set-up B - two lead-out fibres
Set-up A
Set-up B
Set-up A
Set-up B
0.00
2.00
4.00
6.00
8.00
10.00
12.00
14.00
16.00
18.00
0 200 400 600 800 1000 1200
Cavity length (micrometres)
Pe
ak a
rea
of
ep
oxy a
bso
rptio
n @
22
07
nm
Set-up A - one lead-out fibre
Set-up B - two lead-out fibres
Set-up A
Set-up B
Set-up A
Set-up B
Figure 4.13 Relationship between the epoxy peak area and the cavity length.
Page 164
152
However, beyond 600 m cavity length, the peak area as well as spectral resolution of Set-up
A decreases gradually where as Set-up B started losing signal strength beyond 800 m. The
spectral characteristics associated with the sensor Set-up A mentioned above can be attributed
to the insufficient IR signal that is transmitted back to the detector with a single sensing fibre,
compared with the IR signal coupled back to the detector with two sensing fibres.
Furthermore, in Set-up A, one of the lead-out fibres on the sensing side of the 2 x 2 coupler
was immersed in refractive index matching gel to reduce Fresnel reflections at the fibre
interface. However the refractive index matching gel may not be effective enough to stop
reflections in step-index multimode fibres those having broad near-infrared transmission
range. Therefore in Set-up A, the reflected signal from the sensing fibre may have an
influence of interference of Fresnal reflections from the other fibre end, which could affect the
spectral resolution. On the other hand, in Set-up B, the sensing region was illuminated with
both lead-out fibres and the reflected IR radiation coupled back to the detector is greater.
Taking the above-mentioned issues in to consideration, the capillary reflector Set-up B was
chosen for remote monitoring of cross-linking reaction via fibre-optic reflectance
spectroscopy. As stated above, spectral resolution remains linear with respect to cavity length
only up to 500 m. The decrease in reflected IR signal with increase in cavity length can be
clearly seen from the sample signal obtained for different cavity lengths as shown in Figure
4.14. Although decrease in cavity length increases the signal intensity of the reflected light,
intensities of absorption peaks observed with 100 m cavity length are not strong enough
compared with that obtained with 500 m as explained in Section 4.4.1. Therefore the
Page 165
153
approximate sensing cavity length between the gold-coated capillary face and the sensing
fibres was kept as 500 m for on-line monitoring of the cross-linking reaction.
100 m
500 m
900 m
Nanometres
100 m
500 m
900 m
100 m
500 m
900 m
Nanometres
Figure 4.14 Comparison of single-channel spectra obtained for cavity lengths of 100, 500 and 900 μm
using fibre-optic reflectance spectroscopy.
4.5 Conclusions
Applicability of the Beer-Lambert law was demonstrated for quantitative analysis of spectral
data obtained using fibre-optic near-infrared spectroscopy. A model was developed to explain
the light transmission characteristics at the sensing regions of the fibre-optic sensors using a
ray-optics approach.
Different sensor designs were developed which can be used to acquire remote fibre-optic
near-infrared spectroscopy. The sensor designs were evaluated in terms of reproducibility,
Page 166
154
dimensions and ease of handling and difficulties associated with sensor fabrication techniques
were discussed. The capillary support and the capillary reflector sensor designs were chosen
for in situ monitoring of cross-linking reaction in the LY3505/XB3403 epoxy resin system.
Peak area of the absorption band at 2207 nm obtained with different path-lengths was used to
determine the appropriate cavity length to obtain good spectral quality using the sensor
designs investigated.
Page 167
155
Chapter 5
Monitoring cross-linking using fibre-
optic spectroscopy
5 Overview
5.1 Introduction
The chapter discusses in detail the use of fibre-optic near-infrared spectroscopy for in situ
monitoring of the cross-linking reactions in the LY3505/XB3403 epoxy/amine resin system.
The discussion is focused on the following:
Identification of absorption bands related to the LY3505/XB3403 epoxy/amine resin
system.
Investigation of appropriate spectral analysis techniques for quantitative chemical
analysis.
Page 168
156
Determination of the change in concentration of specific functional groups in the resin
system as a function of cross-linking.
Cross-linking monitoring using different fibre-optic sensor designs.
Application of a semi-empirical kinetic model for describing the cross-linking process.
5.2 Peak assignments for the epoxy/amine resin system
The epoxy/amine resin system that was investigated in this study contains LY3505 epoxy
resin and XB3403 amine-based cross-linking agent (Huntsman Advanced Materials).
LY3505 resin is a mixture of diglycidyl ether of bisphenol-A (DGEBA) and diglycidyl ether
of bisphenol-F (DGEBF) and XB3403 is polyoxypropelenediamine (POP), which is an
aliphatic diamine.
Typical near-IR absorption spectra of the mixed resin system that were acquired before and
after cross-linking at 70oC are shown in Figure 5.1. Figure 5.2 and Figure 5.3 show expanded
spectral regions, 1850 – 2500 nm (Figure 5.1a) and 1000 – 1850 nm (Figure 5.1b),
respectively for detailed band assignments.
Page 169
157
Before cross-linking
After cross-linking
Nanometres
Abso
rbance
units (b)(a)
Before cross-linking
After cross-linking
Nanometres
Abso
rbance
units
Before cross-linking
After cross-linking
Before cross-linking
After cross-linking
Nanometres
Abso
rbance
units (b)(a)
Figure 5.1 Typical Near-IR absorption spectra of the LY3505/XB3403 resin system before and after
cross-linking at 70 oC for 7 hours.
1
2 34 5
6
8
9
10
11
7
Before cross-linking
After cross-linking
Nanometres
Abso
rbance
units
1
2 34 5
6
8
9
10
11
7
Before cross-linking
After cross-linking
Before cross-linking
After cross-linking
Nanometres
Abso
rbance
units
Figure 5.2 Expanded spectral range (1850-2500 nm) of the LY3505/XB3403 resin system before and
after cross-linking at 70 oC for 7 hours.
Page 170
158
12
13
14
15
16
1718
19
20
21
Before cross-linking
After cross-linking
Nanometres
Abso
rbance
units
12
13
14
15
16
1718
19
20
21
Before cross-linking
After cross-linking
Before cross-linking
After cross-linking
Nanometres
Abso
rbance
units
Figure 5.3 Expanded spectral range (1000 - 1850 nm) of the LY3505/XB3403 resin system before and
after cross-linking at 70 oC for 7 hours.
Table 5.1 Band assignments for near-infrared spectrum of LY3505/XB3403 resin system (see Figure 5.2
and Figure 5.3) [140,136,133,138,103,131,132,147,82,47,80,135,139,137,374].
Peak identification
Code Wavelength (nm) Peak assignment
Refer to Figure 5.2
1 2464 Aromatic ring fundamental (-CH stretching vibration)
2 2400 Methyl fundamental (C-H symmetric bending “umbrella”
vibration)
3 2358 Unknown peak
4 2304 -OH absorption/interactions of –OH with reactive groups
in the resin system
5 2270 Methyl overtone (C-H symmetric bending mode)
6 2207 Epoxy combination (C-H stretching and epoxy ring
breathing modes)
Page 171
159
7 2190
Aromatic ring combination (C-H stretching fundamental
of aromatic ring at 3276 nm and aromatic C=C conjugated
stretching overtone at 6653 nm)
8 2164 Aromatic ring combination (C-H stretching)
9 2137 Aromatic ring combination (C-H stretching fundamental
at 6154 nm)
10 2026 Primary amine combination (N-H stretching and bending
modes)
11 1905 -OH due to moisture (O-H asymmetric stretching and
bending modes)
Refer to Figure 5.3
12 1764 Aliphatic, terminal R-CH3 overtone (stretching mode)
13 1734 Methyl 1st overtone (C-H stretching mode)
14 1723 Methyl 3rd
overtone (C-H asymmetric bending mode)
15 1698 Combination band of epoxy and primary amine overtones
16 1683 Aliphatic terminal –CH3, branched –CH2 and –CH
(stretching modes)
17 1648 Terminal epoxy 1st overtone (C-H stretching vibration)
18 1532 Primary and secondary amine combination (overtones of
N-H stretching modes)
19 1492 Primary amine 1
st overtone (N-H asymmetric stretching
mode)
20 1430 Alcoholic OH 1
st overtone (O-H symmetric stretching
mode)
21 1160 Terminal epoxy 2nd
overtone (C-H stretching mode)
The absorption peaks observed for the epoxy resin and the aliphatic diamine were similar to
those reported by previous researchers [103,133,136,138,140] and are summarised in Table
5.1. The wavelength range, 2200 - 2222 nm (4500-4545 cm-1
) includes combinations of C-H
stretching vibrations. An absorption band due to an overtone of methyl asymmetric bending
mode has been reported to be located around 2270 nm [131]. A detailed discussion of the
peak assignments in this region will be presented in Section 5.2.1. With reference to Figure
5.3, the peak at 1160 nm can be assigned to the second overtone of C-H stretching of the
Page 172
160
terminal epoxy group [132]. The first overtone of the same vibration mode appears at 2207
nm [131].
5.2.1 Analysis of absorption bands during cross-linking
Monitoring of cross-linking reaction in the LY3505/XB3403 resin system was carried out
using fibre-optic sensing techniques. The cross-linking kinetics of the resin system was
obtained based on both fibre-optic transmission spectroscopy [356,357,370,375] and fibre-
optic reflectance spectroscopy [376].
Monitoring of the cross-linking reactions in the epoxy/amine resin system was carried out at
40, 50, 60 and 70 oC. A typical series of spectra acquired using fibre-optic transmission
spectroscopy at 70 oC was used for the analysis of spectral evolution during cross-linking.
However, the same spectral features were observed via fibre-optic reflectance spectroscopy.
A series of typical near-IR spectra within the range of 1400-2250 nm is shown in Figure 5.4.
Peak evolution of the main characteristic absorption bands of the resin system during cross-
linking can be seen clearly: (i) decrease in epoxy absorptions at 1648 and 2207nm; (ii)
decrease in primary and secondary amine absorptions at 1532 and 2026 nm; (iii) non-reacting
aromatic ring absorptions at 2137 and 2164 nm and (iv) increase in hydroxyl absorption at
1430 nm. The spectra shown in Figure 5.4 were expanded in Figure 5.5, Figure 5.6, Figure
5.7 and Figure 5.8 will be discussed in sequence.
Page 173
161
Nanometres
Ab
sorb
ance u
nits
0 minutes
6 minutes
17 minutes
22 minutes
29 minutes
36 minutes
48 minutes
70 minutes
97 minutes
151 minutes
374 minutes
6
12
13
8
9
18
19
10
11
15
17
Nanometres
Ab
sorb
ance u
nits
0 minutes
6 minutes
17 minutes
22 minutes
29 minutes
36 minutes
48 minutes
70 minutes
97 minutes
151 minutes
374 minutes
0 minutes
6 minutes
17 minutes
22 minutes
29 minutes
36 minutes
48 minutes
70 minutes
97 minutes
151 minutes
374 minutes
0 minutes
6 minutes
17 minutes
22 minutes
29 minutes
36 minutes
48 minutes
70 minutes
97 minutes
151 minutes
374 minutes
6
12
13
8
9
18
19
10
11
15
17
Figure 5.4 Near-IR contour spectra of LY3505/XB3403 resin system during cross-linking at 70 oC.
In Figure 5.5, the following absorption bands were observed:
i. Absorption band at 2207 nm (Peak no. 6): Combination band due to C-H stretching
and epoxy ring vibration is appeared within the range of 2180 – 2226 nm and
[47,103,136,140]. This peak has been identified as a well-resolved peak in the near-IR
range and has been used extensively for quantitative analysis of epoxy resin systems
[132,136].
Page 174
162
Ab
sorb
ance u
nits
0 minutes
6 minutes
17 minutes
22 minutes
29 minutes
36 minutes
48 minutes
70 minutes
97 minutes
151 minutes
374 minutes
Nanometres
6
7
8
9Ab
sorb
ance u
nits
0 minutes
6 minutes
17 minutes
22 minutes
29 minutes
36 minutes
48 minutes
70 minutes
97 minutes
151 minutes
374 minutes
0 minutes
6 minutes
17 minutes
22 minutes
29 minutes
36 minutes
48 minutes
70 minutes
97 minutes
151 minutes
374 minutes
0 minutes
6 minutes
17 minutes
22 minutes
29 minutes
36 minutes
48 minutes
70 minutes
97 minutes
151 minutes
374 minutes
Nanometres
6
7
8
9
Figure 5.5 Near-IR contour spectra of LY3505/XB3403 resin system during cross-linking at 70 oC.
ii. Absorption band at 2190 nm (Peak no. 7): It can be seen that, as the epoxy peak is
consumed during cross-linking, a minor peak at 2190 nm attains more prominence as
the cross-linking reaction progresses. For resin systems with aromatic amines such as
DDS and DDM, an absorption band at 2194 nm (4557 cm-1
) has been observed due to
the N-H vibration of the primary amine [103,135]. This is clearly not the case for the
aliphatic amine that was used in the current study. A peak at similar wavelength was
also observed with aliphatic amines but the peak assignment was not reported
[131,136]. The current study, an attempt was made to identify the unknown peaks.
This peak could be due to a combination band related to the aromatic C-H stretching
vibration near 3278 nm and an aromatic ring stretching vibration band near 6650 nm.
Page 175
163
Maxwell and Pethrick [134] investigated a DGEBA/TETA resin system using mid-
infrared FTIR spectroscopy and reported a stretching vibration of the aromatic C=C
conjugated bond at 6653 nm (1503 cm-1
) and a C-H stretching vibration of aromatic
ring at 3276 nm (3053 cm-1
). For a N,N-diglycidyl-4-glycidyloxyaniline (DGOA)
based resin system, the band assignment near 6605 nm (1514 cm-1
) was assigned as a
stretching vibration of the aromatic ring [145]. However, the epoxy/amine resin
system that was reported in the former study is more related to the LY3505/XB3403
resin system and therefore the peak appeared at 2190 nm could be due to a
combination band of C-H stretching vibration of aromatic ring and aromatic C=C
conjugated stretching vibration.
iii. Absorption bands at 2164 nm (Peak no. 8) and 2137 nm (Peak no. 9): Aromatic C-H
stretching combination bands also appear at 2164 nm and 2137 nm and it can be
clearly seen that the peak area does not change during cross-linking.
In Figure 5.6, the following absorption bands were observed:
iv. Absorption band at 2026 nm (Peak no. 10): This absorption band, centred at 2026 nm,
is characteristic of the primary amine combination band due to N-H stretching and
bending vibrations. The band was used for quantitative analysis of aliphatic amine-
based resin systems [82,132].
v. Absorption band at 1905 nm (Peak no. 11): The absorption band at 1905 nm has been
assigned to O-H asymmetric stretching and bending vibrations of hydroxyl groups. It
was reported that this band is not due to the alchoholic hydroxyl that is generated
Page 176
164
during the epoxy/amine cross-linking but is a characteristic band for the hydroxyl
groups due to absorbed moisture [136].
Absorb
ance u
nits
0 minutes
6 minutes
17 minutes
22 minutes
29 minutes
36 minutes
48 minutes
70 minutes
97 minutes
151 minutes
374 minutes
11
10
Nanometres
Absorb
ance u
nits
0 minutes
6 minutes
17 minutes
22 minutes
29 minutes
36 minutes
48 minutes
70 minutes
97 minutes
151 minutes
374 minutes
0 minutes
6 minutes
17 minutes
22 minutes
29 minutes
36 minutes
48 minutes
70 minutes
97 minutes
151 minutes
374 minutes
0 minutes
6 minutes
17 minutes
22 minutes
29 minutes
36 minutes
48 minutes
70 minutes
97 minutes
151 minutes
374 minutes
11
10
Nanometres
Figure 5.6 Near-IR contour spectra of the LY3505/XB3403 resin system during cross-linking at
70 oC.
In Figure 5.7, the following absorption bands were observed:
vi. Absorption bands at 1764 nm (Peak no. 12) and 1734 nm (Peak no. 13): These peaks
can be attributed to aliphatic, terminal R-CH3 overtones and the methyl 1st overtone of
the C-H stretching mode, respectively. These peak areas were found to remain
constant throughout the cross-linking reaction. The third overtone of the C-H
asymmetric bending vibration was suggested near 1720 nm (5814 cm-1
) [131].
Page 177
165
vii. Absorption bands at 1698 nm (Peak no. 15) and 1683 nm (Peak no. 16): With
reference to the Figure 5.7, two overlapped peaks can be seen at 1698 nm and 1683
nm and the former peak decreases with respect to the second peak during cross-
linking. Mijović et al. [136] observed similar overlapped peaks for a PEG/aniline
resin system and they assigned these as an overtone of the epoxy ring at 1698 nm and
an overtone of the primary amine stretching vibration at 1683 nm. However, in the
current study no major changes in the peak at 1683 nm was observed during the cross-
linking reaction. The peak was also assigned as stretching vibrations of aliphatic
terminal –CH3, branched –CH2 and branched –CH [131]. Therefore given the
uncertainty over the peak assignment for the absorbance peak at 1689 nm & 1683 nm,
no firm conclusion can be drawn on the origin of these overtones.
viii. Absorption band at 1648 nm (Peak no. 17): The peak at 1648 nm is said to be
associated with the first overtone of C-H stretching vibration of the terminal epoxy,
and it decreases over the course of the cross-linking reaction. The original band
appears approximately around 1623 nm (6158 cm-1
) and shifts towards the lower
frequency due to the strained epoxy ring structure and the oxygen atom [131]. The
peak overlapped with the other peaks and spectral manipulation is required in order to
use it for quantitative analysis. Nevertheless, this peak has been used widely for
determining the degree of conversion of epoxy/amine resin systems [80,147,148,152].
Page 178
166
Absorb
ance u
nits
0 minutes
6 minutes
17 minutes
22 minutes
29 minutes
36 minutes
48 minutes
70 minutes
97 minutes
151 minutes
374 minutes
12
13
14
17
Nanometres
Absorb
ance u
nits
0 minutes
6 minutes
17 minutes
22 minutes
29 minutes
36 minutes
48 minutes
70 minutes
97 minutes
151 minutes
374 minutes
0 minutes
6 minutes
17 minutes
22 minutes
29 minutes
36 minutes
48 minutes
70 minutes
97 minutes
151 minutes
374 minutes
0 minutes
6 minutes
17 minutes
22 minutes
29 minutes
36 minutes
48 minutes
70 minutes
97 minutes
151 minutes
374 minutes
12
13
14
17
Nanometres
Figure 5.7 Near-IR contour spectra of LY3505/XB3403 resin system during cross-linking at 70 oC.
In Figure 5.8, the following absorption bands were observed:
ix. Absorption band at 1532 nm (Peak no. 18): The overlapped peak in the range of 1507
– 1572 nm is related to primary and secondary amine functional groups. Therefore,
the change in this peak during cross-linking is more complex. As can be seen from
Figure 5.8, at the start of the cross-linking reaction, the primary amine peak appears
around 1532 nm and then decreases during cross-linking. At the same time, the
prominence of the peak at 1545 nm increases due to the generation of the secondary
amine groups. This peak then disappears towards end of the cross-linking reaction.
This can be attributed to the secondary amine consumption at the later stage of cross-
linking. It is also evident from Figure 5.8 that the “clarity” of these peaks gets
Page 179
167
significantly poorer at the later stages of the cross-linking reaction. Further research
should consider techniques for addressing this issue.
Ab
sorb
ance u
nits
0 minutes
6 minutes
17 minutes
22 minutes
29 minutes
36 minutes
48 minutes
70 minutes
97 minutes
151 minutes
374 minutes
18
20
Nanometres
Ab
sorb
ance u
nits
0 minutes
6 minutes
17 minutes
22 minutes
29 minutes
36 minutes
48 minutes
70 minutes
97 minutes
151 minutes
374 minutes
0 minutes
6 minutes
17 minutes
22 minutes
29 minutes
36 minutes
48 minutes
70 minutes
97 minutes
151 minutes
374 minutes
0 minutes
6 minutes
17 minutes
22 minutes
29 minutes
36 minutes
48 minutes
70 minutes
97 minutes
151 minutes
374 minutes
18
20
Nanometres
Figure 5.8 Near-IR contour spectra of LY3505/XB3403 resin system during cross-linking at 70 oC.
Absorption band at 1430 nm (Peak no. 20): The weak band that appeared around 1430 nm at
the beginning of the cross-linking reaction is due to an O-H stretching vibration of the
alcoholic hydroxyl groups. This peak increases as the epoxy is consumed during the reaction.
Peak broadening and an upward shift with respect to the peak position before cross-linking
can be seen. This feature has been related to complex and extended intramolecular and
intermolecular hydrogen bonding among OH--OH groups and nucleophelic interactions
between hydroxyl and nitrogen atoms, OH--N [38,47,80,103,136,147,377]. The peak was
Page 180
168
identified as less usable for quantitative analysis due to the influence of above-mentioned
spectral features.
Two discrepancies were noted in the current study. In previous works, the absorption peaks at
2400 nm and 2358 nm have been assigned as unknown peaks (see Figure 5.2) [131,136].
Nevertheless, Mijović et al. [136] observed a decrease in these peaks during cross-linking of
PEG/N-mehyl aniline. Workman and Weyer quoted that the peak at 2400 nm may be due to
the symmetric methyl bending “umbrella” vibration in the wavelength range of 2410-2460 nm
[131]. It has also been reported that there is an increase in the absorption band at 2304 nm
due to the O-H groups and interactions of the O-H groups with the reactive groups in the resin
mixture [133,136]. Again, with the LY3505/XB3403 resin system, no change was observed
within the wavelength range during the cross-linking reaction.
The expanded views of the spectra show a repetitive fringe pattern imposed on the spectra.
The fringe pattern is more apparent in the non-absorbing wavelength domain (see Figure 5.6,
Figure 5.7 and Figure 5.8) and is due to a design artefact related to the fibre-optic sensors.
These interference fringes can be attributed to Fabry-Pérot interference via the multiple-beam
reflections at the cleaved fibre interfaces. Multiple-beam reflection of the IR radiation is
possible at the sensing cavity before coupling into the receiving fibre. An attempt was made
to determine the path length related to the observed interference fringe pattern. The free
spectral range (FSR) and the average path length related to the interference fringe pattern
were calculated to be 4 nm and 513±9 m, respectively. FSR is the wavelength separation
between adjacent maxima of the interference fringe pattern. In case of fibre-optic
transmission sensor design, a separation of 500 m between the cleaved multi-mode fibres
Page 181
169
was set using a translation stage. This shows that the manually set-gap between the cleaved
fibres agrees well with the interferometrically measured gap.
5.3 Quantitative analysis of change in functional groups
during cross-linking
Quantitative analysis of the functional groups of interest was carried out based on the changes
in peak areas of specified absorption bands. According to the Beer-Lambert law, for low
path-length and low concentrations, the peak area is linearly proportional to the concentration
of the related functional group. A baseline was constructed by joining two points either side
of an absorption band. The baseline was adjusted manually in order to account for any peak
shifts during the cross-linking process. In order to eliminate effects related to the change in
path-length during cross-linking, the peak area of a non-reacting functional group was used to
normalise the peak area of the reactive functional group. The peak at 2164 nm is due to an
aromatic C-H stretching vibration and since it does not take part in the cross-linking reaction.
This can be seen from Figure 5.9, where the change in epoxy peak area at 2207 nm and that of
the aromatic CH peak at 2164 nm is plotted as a function of time for the cross-linking of the
epoxy/amine resin system at 70 oC. Therefore this peak at 2164 nm was selected as an
internal reference for normalising the peak area of other functional groups 357,370.375,378].
The following absorption bands were analysed for interpreting the cross-linking kinetics of
the LY3505/XB3403 resin system:
(i) Epoxy peak (2180 - 2226 nm);
(ii) Primary amine peak (1964 - 2060 nm); and
Page 182
170
(iii) Combination band of primary and secondary amine peak (1507 – 1572 nm)
0
2
4
6
8
10
0 100 200 300 400 500
Cross-linking time (minutes)
Pe
ak a
rea
Aromatic CH peak at 2164 nm
Epoxy peak at 2207 nm
Figure 5.9 Change in peak area of epoxy peak (2207 nm) and aromatic C-H peak (2164 nm) for the
LY3505/XB3403 resin system during cross-linking at 70 oC.
5.3.1 Deconvolution of the epoxy absorption band
It was mentioned before that the epoxy absorption peak is overlapped with a weak
combination band at 2190 nm, which is related to aromatic ring vibrations (see Section 5.2.1).
Previous researchers have used data processing techniques to investigate and isolate the epoxy
peak [131,136,149]. In the current study, three different approaches were deployed to
investigate the most suitable method to account for “hidden” absorption band at 2190 nm, and
to determine the change in concentration of the epoxy groups during cross-linking. A series
of spectra was obtained for the LY3505/XB3403 resin system that was cross-linked at 50 oC
for 15 hours. The spectra were recorded using capillary support sensor design.
Page 183
171
Method-I: determination of epoxy peak area using the total (overlapped) peak area
Figure 5.10 shows a typical set of original near-IR spectra obtained during cross-linking at 50
oC. A baseline was constructed such that the peak area covered the epoxy and the hidden
peaks throughout the reaction. Figure 5.11 highlights the calculated peak area before and
after cross-linking. Shaded areas in Figure 5.11 represent the peak area based on the baseline
as defined. The calculated peak area represents the contributions from both the epoxy peak
and hidden peak.
Nanometres
Abso
rbance
units
0 minutes
21 minutes47 minutes 72 minutes
124 minutes 201 minutes 354 minutes
955 minutes
Nanometres
Abso
rbance
units
0 minutes
21 minutes47 minutes 72 minutes
124 minutes 201 minutes 354 minutes
955 minutes
0 minutes
21 minutes47 minutes 72 minutes
124 minutes 201 minutes 354 minutes
955 minutes
Figure 5.10 Original near-IR contour spectra of the LY3505/XB3403 resin system during cross-linking
at 50 oC.
Page 184
172
Nanometres
Before cross-linking
After cross-linking
Figure 5.11 Original near-IR spectra of the LY3505/XB3403 resin system before and after cross-linking
at 50 oC. The peak areas were calculated according to the Method-I are highlighted.
Method-II: determination of epoxy peak area by eliminating hidden peak
The baseline of the epoxy peak was adjusted in order to eliminate the interference of the
hidden peak. In this method, defining the baseline at the beginning of the cross-linking
reaction was difficult as the contribution from the epoxy peak is higher compared with that of
the hidden peak. Therefore it was difficult to define the boundaries of the baseline during
early stage of cross-linking. Nevertheless, a shoulder, which appeared due to the overlapping
of the hidden peak was taken as one boundary for the baseline. However, the accuracy of this
method cannot be guaranteed because determination of the baseline with high accuracy was
difficult. Therefore the errors involved in calculating the epoxy peak area based on Method-II
can be higher compared with that of Method-I. The shaded areas in Figure 5.12 show the
Page 185
173
calculated epoxy peak area corresponding to the spectra obtained before and after cross-
linking based on Method-II.
Nanometres
Before cross-linking
After cross-linking
Figure 5.12 Original near-IR spectra of the LY3505/XB3403 resin system before and after cross-linking
at 50 oC. The calculated peak areas according to Method-II are highlighted.
Method-III: Fourier self-deconvolution – determination of epoxy peak area by subtracting the
hidden peak area
In this method, A Fourier self-deconvolution was used to resolve the hidden peak from the
overlapped epoxy peak. The method gives an insight into the evolution of the hidden peak
during the cross-linking reaction. Deconvolution is the process of enhancing spectral
bandwidth in order to resolve overlapping bands. It is necessary to note that instrumental
resolution is not increased by spectral deconvolution. Instead, Fourier self-deconvolution
involves multiplication of the original interferogram by using a smoothing function and also
using a function consists of Gaussian, Lorentzian or Gaussian-Lorentzian band shape [120].
Page 186
174
In other words, the technique mathematically enhances the peak resolution. However peak
shapes and peak areas are altered during the spectral manipulation using Fourier self-
deconvolution.
Nanometres
Abso
rbance
units
Original spectrum
Deconvoluted spectrum
2226 nm 2194 nm 2178 nm 2151 nm
Nanometres
Abso
rbance
units
Original spectrum
Deconvoluted spectrum
Original spectrum
Deconvoluted spectrum
2226 nm 2194 nm 2178 nm 2151 nm
Figure 5.13 An original near-IR spectrum and corresponding deconvoluted spectrum of the
LY3505/XB3403 resin system before cross-linking. Baseline wavelengths of the deconvoluted
peaks are highlighted; (i) epoxy peak 2194 – 2226 nm; (ii) hidden peak 2178 – 1294 nm and (iii)
aromatic reference peak 2151 – 2178 nm.
Bruker OPUS 6.5 software (Bruker Optics, UK) was used for Fourier self-deconvolution of
the original spectra. The software allowed three variables to be specified: a function of the
line shapes, the noise reduction factor (NRF), and the deconvolution factor (DF). For the
current analysis, a Lorentzian line shape function was used. NRF is a function of resolution
enhancement and bandwidth of the peak to be deconvoluted. Therefore NRF was taken as 0.5
for spectral deconvolution to retain and enhance the weak and narrow absorption bands.
Page 187
175
Figure 5.13 compares the spectral line shape of an original spectrum of the LY3505/XB3403
resin system before cross-linking with a deconvoluted spectrum of the original interferogram.
It can be seen that after deconvolution, the baseline of the hidden peak can be clearly defined
more clearly.
Original spectrum
Nanometres
Abso
rbance
units
2226 nm2194 nm 2178 nm 2151 nm
DF = 50
DF = 100
DF = 1000
DF = 5000
Original spectrum
Nanometres
Abso
rbance
units
2226 nm2194 nm 2178 nm 2151 nm
DF = 50
DF = 100
DF = 1000
DF = 5000
Figure 5.14 An original near-IR spectrum and deconvoluted spectra of the LY3505/XB3403 resin
system before cross-linking. Baseline wavelengths of the deconvoluted peaks are highlighted.
Page 188
176
Original spectrum
Nanometres
Abso
rbance
units
2226 nm
2199 nm 2179 nm
2153 nm
DF = 50
DF = 100
DF = 1000
DF = 5000
Original spectrum
Nanometres
Abso
rbance
units
2226 nm
2199 nm 2179 nm
2153 nm
DF = 50
DF = 100
DF = 1000
DF = 5000
Figure 5.15 An original near-IR spectrum and deconvoluted spectra of the LY3505/XB3403 resin
system after cross-linking at 50 oC; the relative position of the baseline wavelengths selected for
the deconvoluted peaks are highlighted.
DF is a function of bandwidth and the relationship varies according to the line-shape. DF
determines the extent of deconvolution. If DF is too low, the spectral enhancement is low.
When DF is too high, artefacts due to the line shape function reduce the resolution of the
peak. The distortion of absorption bands is higher with a higher DF, especially when the
overlapped original bands are very weak compared with other peaks in the region. This can
be clearly seen from Figure 5.14 and Figure 5.15. As shown in Figure 5.14, before cross-
linking, the hidden band is less apparent. Therefore, a higher DF was needed to enhance the
peak resolution. As the cross-linking reaction approaches completion, the epoxy peak area
decreases and the hidden peak becomes more apparent. In this case, choosing a higher DF
Page 189
177
distorts the peak shape as shown in Figure 5.15. Therefore a trial-and-error method was used
to select the most appropriate DF to analyse the spectra. Figure 5.16 shows a series of
deconvoluted spectra for the LY3503/XB3403 resin system during cross-linking at 50 oC for
15 hours. The Lorentzian line shape was used with NRF of 0.5. In order to get adequate
peak resolution, the spectral deconvolution was carried out in three consecutive steps. Firstly
the raw absorption spectrum was deconvoluted using a DF of 50 and the resulting spectrum
was subsequently subjected to a deconvolution at a DF of 100. The result of the second
deconvolution was deconvoluted again using a DF of 1000.
Nanometres
Abso
rbance
units
0 minutes
21 minutes47 minutes 72 minutes
124 minutes 201 minutes 354 minutes
955 minutes
Nanometres
Abso
rbance
units
0 minutes
21 minutes47 minutes 72 minutes
124 minutes 201 minutes 354 minutes
955 minutes
0 minutes
21 minutes47 minutes 72 minutes
124 minutes 201 minutes 354 minutes
955 minutes
Figure 5.16 Deconvoluted near-IR contour spectra of the LY3505/XB3403 resin system during cross-
linking at 50 oC; DF was used up to 1000.
Page 190
178
Figure 5.17 shows the change in the peak area of the deconvoluted absorption bands during
cross-linking. With reference to Figure 5.17, no remarkable change in the hidden peak area
was observed when compared with the change in epoxy peak area.
0
5
10
15
20
25
30
35
40
0 120 240 360 480 600 720 840 960
Cross-linking time (minutes)
Deconvolu
ted p
eak a
rea
Deconvoluted aromatic CH peak
Deconvoluted hidden peak
Deconvoluted epoxy peak
Figure 5.17 Change in deconvoluted peak area of epoxy peak (2207 nm), hidden peak (2190 nm) and
aromatic C-H peak (2164 nm) of the LY3505/XB3403 resin system during cross-linking at 50 oC.
However, spectral deconvolution was found to be inconvenient for quantitative spectral
analysis as data processing required different DFs to achieve optimum spectral enhancement.
Therefore the aim of using this technique was to determine the trend in the evolution of the
hidden peak during cross-linking.
As shown previously in Figure 5.10, the hidden band starts to appear after about 200 minutes
during cross-linking at 50 oC. Therefore as soon as the hidden peak appeared as a separate
band, the area under this band was recorded separately. In order to determine only the epoxy
Page 191
179
peak contribution, the hidden peak area was subtracted from the total peak area of the whole
set of spectra.
Comparison of spectral analysis techniques
In this case, the isothermal cure at 50 oC was repeated three times and the average and
standard deviation of instantaneous epoxy peak area was obtained by employing each method.
In these methods, the error involved in determining the epoxy peak area was mainly due to the
accuracy of defining the boundaries of the baseline of the epoxy peak. This was due to the
fact that during the initial stage of reaction the apparent epoxy peak is an overlapped
absorption band that represents the „true‟ epoxy peak and a weak hidden peak. During cross-
linking, the hidden peak area remained fairly constant over the entire period of reaction and
was found to have an average of 0.455±0.008. The overlapped epoxy peak area, which
includes that of the hidden peak, evolves as the cure progresses and decreases with the
reaction time. In other words, the depletion of epoxy towards the end of the reaction manifests
as if the relative contribution of the hidden peak is higher at the end of the reaction (~40 %) in
comparison to that at the start of the reaction (~2 %). Nevertheless, the contribution of the
hidden peak area is constant through out the reaction.
Figure 5.18 shows the change in original peak area related to the epoxy groups during cross-
linking of the LY3505/XB3403 resin system at 50oC based on Method-I and -II. The change
in peak area related to the aromatic C-H absorption band and the hidden absorption band were
also cross-plotted as a function of cross-linking time.
Page 192
180
0
2
4
6
8
10
12
14
16
0 120 240 360 480 600 720 840 960
Cross-linking time (minutes)
Ori
gin
al p
ea
k a
rea
Epoxy peak (based on Method-I)
Aromatic CH peak
Hidden peak
Epoxy peak (based on Method-II)
Figure 5.18 Change in original peak area of epoxy peak (2207 nm), hidden peak (2190 nm) and
aromatic C-H peak (2164 nm) of the LY3505/XB3403 resin system during cross-linking at 50 oC.
It can be seen that the epoxy peak area calculated using Method-I shows higher residual
epoxy groups throughout the cross-linking reaction compared with that calculated based on
Method-II. The reason for the difference is that, in Method-I the total overlapped peak area
was considered that accounts area of both epoxy and hidden peaks. But based on Method-II,
at the later stage of reaction, the baseline of the resolved epoxy peak can be clearly defined
and hence the epoxy peak area can be calculated more accurately.
Furthermore, it was observed based on Method-III that the hidden peak behaved similarly to
that of the aromatic C-H peak (reference peak), which appeared around 2164 nm. Therefore it
can be concluded that the peak assignment made for the hidden peak is more appropriate and
the peak appearing around 2190 nm could be a combination band of C-H stretching vibration
Page 193
181
of aromatic ring (3276 nm) and aromatic C=C conjugated stretching vibration (6653 nm).
Good correlation was found between the spectral evolution of original and deconvoluted peak
areas related to the aromatic C-H peak and the hidden peak (see Figure 5.17 and Figure 5.18).
Therefore it was assumed that the contribution of the hidden peak towards the overlapped
peak area approximately remains constant compared with that of the epoxy peak during cross-
linking. The mean peak area of the hidden band was calculated considering the linear region
with respect to cross-linking time. The epoxy peak area was then determined by subtracting
the mean peak area of the hidden band from the total overlapped peak area.
Figure 5.19 compares the change in normalised epoxy peak area based on three different
techniques as a function of cross-linking time. The epoxy peak area was nomalised to the
area of the aromatic C-H reference peak. As mentioned above, again the area based on
Method-I shows a higher peak area compared with Method-II and –III. During the early
stages of cross-linking, the area based on Method-II shows lower values compared with that
obtained using Method-III while the areas based on both techniques overlapped during later
stages of the reaction. This can be attributed to the over-estimation of the baseline of the
absorption peak in Method-II. Based on these observations, Method-III was identified as the
most suitable technique for determining the change in epoxy peak area of the
LY3505/XB3403 resin system during cross-linking.
Page 194
182
0
0.2
0.4
0.6
0.8
1
1.2
0 120 240 360 480 600 720 840 960
Cross-linking time (minutes)
No
rma
lise
d e
po
xy p
ea
k a
rea
Epoxy peak (based on Method-I)
Epoxy peak (based on Method-II)
Epoxy peak (based on Method-III)
Figure 5.19 Change in the normalised epoxy peak area of the LY3505/XB3403 resin system during
cross-linking at 50 oC. Peak area based on three spectral analysis methods is compared.
With reference to Figure 5.20, the standard deviation of the instantaneous peak area with in
the first 300 minutes of cure was found to be the largest in the case of Method-II, whilst the
Method-III yielded smallest deviation of instantaneous peak area through out the reaction.
The average peak areas obtained at the end of the reaction using the Methods -II and -III were
found to be equal. The measurement of peak areas using the Methods -II and -III is more
accurate in comparison to the Method-I because they account for the hidden peak area. As the
epoxy and the hidden peaks are distinctly visible at the end of the cross-linking reaction, the
average values of the corresponding epoxy peak area measured using the Methods -II and -III
represent the true nature of the completion of the reaction. The smallest standard deviation
observed with the method-III was thought to be the correct method to be employed. The
Page 195
183
advantages and disadvantages associated with using each method for determining the epoxy
peak area are summarised in Table 5.2.
0 200 400 600 800 1000
0.0
0.2
0.4
0.6
0.8
1.00 200 400 600 800 1000
0.0
0.2
0.4
0.6
0.8
1.0
0 200 400 600 800 1000
0.0
0.2
0.4
0.6
0.8
1.0
Cross-linking time (minutes)
Method-III
Norm
alis
ed e
poxy p
eak a
rea
Method-II
Method-I
Figure 5.20 Standard deviation of peak area based on each method discussed above as a function of
reaction time.
Page 196
184
Table 5.2 Advantages and disadvantages of different methods.
Method used Comments
Method-I Advantages:
Lower error involved in defining boundaries of the baseline for the epoxy peak.
Reasonable reproducibility of calculating the peak area.
Disadvantages:
The peak area includes the area of hidden peak and hence shows a higher amount
of residual epoxy compared with the actual residual epoxy content present in the
system towards the end of the reaction.
Method-II Advantages:
The peak area is closer to the expected area of the epoxy peak.
Disadvantages:
Higher error involved in defining baseline of the epoxy peak during early stages of
cross-linking.
Method-III Advantages:
Good reproducibility of calculating the peak area throughout the reaction.
Calculated peak area is closer to the expected area of the epoxy peak.
5.3.2 Quantitative analysis of functional groups using fibre-optic
transmission spectroscopy
5.3.2.1 Epoxy group analysis
The change in epoxy concentration during cross-linking was calculated based on the
combination band due to the epoxy ring at 2207 nm using the equation below:
0
0
EP
CH t
tEP
CH
AA
EP EPA
A
Equation 5.1
Page 197
185
where [EP] is the concentration of epoxy, AEP is the epoxy peak area and ACH is the peak area
of aromatic reference band. Subscripts 0 and t represent the start of reaction and time t,
respectively. The epoxy peak area was calculated by subtracting the mean peak area of the
hidden peak using methods-III as described in Section 5.3.1. The mean concentration of the
epoxy groups, in a stoichiometric mixture of the LY3505/XB3403 resin system before cross-
linking, was calculated to be 2.0301 ± 0.0043 mol kg-1
. Figure 5.21 shows the change in
epoxy concentration at 70 oC as a function of cross-linking time. The peak areas calculated
for three repeat experiments are shown and good repeatability of the results can be seen.
0.0
0.4
0.8
1.2
1.6
2.0
0 100 200 300 400 500
Cross-linking time (minute)
Epo
xy c
on
ce
ntr
atio
n (
mo
l kg
-1)
Repeat test-1
Repeat test-2
Repeat test-3
Figure 5.21 Change in the epoxy concentration in the LY3505/XB3403 resin system during cross-
linking at 70 oC.
Page 198
186
5.3.2.2 Primary amine group analysis
The change in the concentration of primary amine was calculated using Equation 5.1 but by
replacing the peak area of epoxy with that of the primary amine absorbance band at 2026 nm.
Equation 5.1 was modified as:
0
0
PA
CH t
tPA
CH
AA
PA PAA
A
Equation 5.2
where [PA] is the concentration of primary amine, APA is the primary amine peak area and
ACH is the peak area of reference C-H absorption band at 2164 nm. Subscripts 0 and t
represent the start of reaction and time t, respectively.
The concentration of primary amine groups in the epoxy/amine resin mixture before cross-
linking was found to be 1.1349 ± 0.0068 mol kg-1
. Figure 5.22 shows the change in primary
amine concentration at 70oC with respect to cross-linking time. Results obtained from three
identical fibre-optic transmission sensors show good repeatability. It can be seen that the
primary amine groups were completely consumed within approximately the first 100 minutes
of the cross-linking reaction at 70oC. It is assumed that this is due to the cross-linking
reaction not due to any evaporation.
Page 199
187
0
0.2
0.4
0.6
0.8
1
1.2
0 100 200 300 400 500
Cross-linking time (minute)
Prim
ay a
min
e c
oncentr
ation (
mol kg
-1)
Repeat test-1
Repeat test-2
Repeat test-3
Figure 5.22 Change in the primary amine concentration of the LY3505/XB3403 resin system during
cross-linking at 70 oC.
5.3.2.3 Secondary amine group analysis
The change in secondary amine concentration cannot be determined directly in the same way
as the concentration of the epoxy and primary amine groups. Well-resolved absorption bands
related to secondary amines do not appear in the wavelength range of 1000 – 2500 nm. The
only band appearing around 1530 nm overlaps with the primary amine absorption band at
1532 nm. Various methods have been investigated to determine the secondary amine
concentration [53,131,148,149,151,152].
Crosby [149] developed a method of determining the secondary amine concentration using
the change in concentration of primary amine during cross-linking based on the mechanistic
approach proposed by St John and George [148]. Therefore in the current study, secondary
Page 200
188
amine concentration was calculated using the method proposed by St John and co-workers
[103,148,151,152]. Figure 5.23 shows the relationship of primary amine concentration and
epoxy concentration during cross-linking at 70 oC. To satisfy Equation 2.18, the rate of
change in epoxy concentration should be same as that of primary amine. Crosby [149]
proposed that according to the stoichiometry of the mixture, if only primary amine groups can
react with epoxy groups then when [PA] = 0, half of the epoxy concentration should be
available in the system [149]. The solid line in Figure 5.23 represents the simulated
relationship between epoxy and primary amine concentrations. To satisfy this relation, data
from the first 15 minutes of cross-linking reaction were considered. For determining the
constants, E1 and E2, Equation 2.16 can be rearranged as follows [148,151]:
1 2
[ ]
[ ] [ ]
t
t t
SAAE E
PA PA Equation 5.3
0
0.5
1
1.5
2
2.5
0 0.2 0.4 0.6 0.8 1 1.2
Primary amine concentration (mol kg-1)
Epoxy c
oncentr
ation (
mol kg
-1)
Repeat test-1
Repeat test-2
Repeat test-3
y = x + 1.0150
15 minutes
Start of
Cross-linking
0
0.5
1
1.5
2
2.5
0 0.2 0.4 0.6 0.8 1 1.2
Primary amine concentration (mol kg-1)
Epoxy c
oncentr
ation (
mol kg
-1)
Repeat test-1
Repeat test-2
Repeat test-3
y = x + 1.0150
15 minutes
Start of
Cross-linking
Figure 5.23 Plot of primary amine concentration, [PA]t and epoxy concentration, [EP]t of the
LY3505/XB3403 resin system during cross-linking at 70 oC.
Page 201
189
0.8
1
1.2
1.4
1.6
0 0.2 0.4 0.6 0.8 1
[SA]t/[PA]t
Pt
Repeat test-1
Repeat test-2
Repeat test-3
y = 0.6209 x + 0.9266
A/[
PA
] t
Std. Dev. = 0.0020,
R2 = 0.9990.8
1
1.2
1.4
1.6
0 0.2 0.4 0.6 0.8 1
[SA]t/[PA]t
Pt
Repeat test-1
Repeat test-2
Repeat test-3
y = 0.6209 x + 0.9266
A/[
PA
] t
Std. Dev. = 0.0020,
R2 = 0.999
Figure 5.24 Change in A/[PA]t as a function of [SA]t /[PA]t for the LY3505/XB3403 resin system at
70 oC.
Figure 5.24 represents the relationship between A / [PA]t against [SA]t / [PA]t for cross-
linking reactions at 70oC and E1 and E2 can be found from the intercept and gradient of the
linear fit. With reference to the linear fit shown in Figure 5.24, E1 and E2 were obtained to be
0.9266 and 0.6209, respectively. By substituting these values in Equation 2.16, the
contribution of the secondary amine concentration towards the combination band can be
determined [148].
Figure 5.25 shows the change in normalised peak area of combination bands from 1507 –
1572 nm as a function of cross-linking time at 70 oC. The aromatic reference peak at 2164
nm was used for normalisation. The combination band decreases towards the end of the
cross-linking reaction and reasonable repeatability was observed with the data obtained from
three repeat experiments at 70 oC.
Page 202
190
0
0.2
0.4
0.6
0.8
1
1.2
0 100 200 300 400 500
Time (minutes)
Norm
alis
ed p
eak a
rea o
f com
bin
ation b
and
(1507 –
1572 n
m)
Repeat test-1
Repeat test-2
Repeat test-3
Figure 5.25 Change in normalised combination band of primary and secondary amine during cross-
linking of the LY3505/XB3403 resin system at 70 oC.
0
0.2
0.4
0.6
0.8
0 100 200 300 400 500
Cross-linking time (minutes)
Se
co
nd
ary
am
ine
co
nce
ntr
atio
n (
mo
l kg-1
)
Repeat test-1
Repeat test-2
Repeat test-3
Figure 5.26 Change in secondary amine concentration during cross-linking of the LY3505/XB3403
resin system at 70 oC (see Equation 2.16).
Page 203
191
The change in secondary amine concentration was obtained using Equation 2.16 and the
results are shown in Figure 5.26. It can be seen that the secondary amine concentration
increases for approximately the first 60 minutes at 70 oC before it starts to decrease gradually.
5.3.2.4 Tertiary amine group analysis
Characteristic absorption bands due to tertiary amine groups are not available in the near-IR
range. Therefore a relationship between primary amine, secondary amine and tertiary amine
was established for a TGDDM/DDS resin system based on mass-balance [148].
0[ ] [ ] [ ] [ ]t t tTA PA PA SA Equation 5.4
where [TA] is the concentration of tertiary amine groups. The above equation has been
extensively used for determining tertiary amine concentration for different epoxy/amine resin
systems [53,80,148,149,151].
The change in tertiary amine concentration obtained using Equation 5.4 against cross-linking
time at 70oC can be seen in Figure 5.27. It can be seen that during approximately the first 25
minutes, the concentration of tertiary amine groups remained zero at 70oC. This correlates
well with the initial assumption made of zero contribution of secondary amine groups to the
cross-linking reaction during this time period.
Page 204
192
0
0.2
0.4
0.6
0.8
1
0 100 200 300 400 500
Cross-linking time (minutes)
Te
rtia
ry a
min
e c
on
ce
ntr
atio
n (
mo
l kg-1
)
Repeat test-1
Repeat test-2
Repeat test-3
Figure 5.27 Change in tertiary amine concentration during cross-linking of the LY3505/XB3403 resin
system at 70 oC (see Equation 5.4).
5.3.2.5 Hydroxyl group analysis
Even though absorption bands due to hydroxyl groups appeared at 1905 nm and 1492 nm,
quantitative analysis is difficult due to complex spectral changes associated with the peaks
[136,147]. Therefore the following mass balance relationship can be used for determining the
change in hydroxyl group concentration [148,151,53]:
0[ ] [ ] [ ] [ ]t t tOH PA PA TA Equation 5.5
where [OH] is hydroxyl group concentration. Equation 5.5 was used to determine hydroxyl
group concentration by assuming there are no hydroxyl groups present in the epoxy/amine
mixture before cross-linking and the reaction between epoxy and amine groups is the only
Page 205
193
source for creating hydroxyl groups. With reference to Figure 5.28, the hydroxyl
concentration increases as the degree of cross-linking increases.
The same equation was employed by Rigail-Cedeño and Sung [132] for
DGEBA/polyoxypropelenediamine (POP) and DGEBA/polyoxyethelenediamine (POE) resin
systems. Xu et al. [53] studied a PGE/m-phenylenediamine system and similar trends in the
change in secondary and tertiary amine concentrations were reported. Most of the previous
studies on functional group analysis have been focused on using the mass balance approach
for determining hydroxyl concentration due to the complex nature of hydroxyl peak evolution
during cross-linking.
0
0.4
0.8
1.2
1.6
2
2.4
0 100 200 300 400 500
Cross-linking time (minutes)
Hydro
xyl c
oncentr
atio
n (
mol k
g-1)
Repeat test-1
Repeat test-2
Repeat test-3
Figure 5.28 Change in hydroxyl concentration during cross-linking of the LY3505/XB3403 resin
system at 70 oC (see Equation 5.5).
Page 206
194
5.3.2.6 Summary of functional group analysis
A summary of consumption of specified functional groups in the LY3505/XB3403 resin
system during cross-linking at 70 oC is shown in Figure 5.29. The results are based on the
average of three repeat experiments at the same isothermal temperature. The analysis was
also performed for spectral data obtained at 60, 50 and 40 oC using fibre-optic transmission
spectroscopy and a similar trend in changing concentration of the functional groups was
observed.
0 100 200 300 400 500
0.0
0.5
1.0
1.5
2.0
Concentr
ation (
mol kg
-1)
Cross-linking time (minutes)
[EP]
[PA]
[SA]
[TA]
[OH]
Figure 5.29 A summary of the change in concentration of functional groups during cross-linking at
70oC. [EP], [PA], [SA], [TA] and [OH] are concentrations of epoxy, primary amine, secondary
amine, tertiary amine and hydroxyl groups, respectively.
Similar results were reported on changing the concentration of functional groups for
DGEBA/POP and DGEBA/POE resin systems [132] and also for PEG/aniline resin systems
[53]. Compared with TGDDM/DDS resin systems, a higher percentage of secondary amine
Page 207
195
conversion was observed with the resin system that was investigated in this study
[103,148,151]. With reference to Figure 5.29 in later stage of reaction, the concentration of
tertiary amine groups and hydroxyl groups increases at a comparable rate with the rate of
decrease in concentration of epoxy groups. Based on previous research findings, this
observation suggested that the contribution of etherification reaction towards the total degree
of conversion of the resin system is insignificant at the conditions studied [103,151]. This
also evident from the fact that the concentration of hydroxyl groups approaches the original
concentration of epoxy groups at the start of the reaction [53].
Figure 5.30 represents the effect of cross-linking temperature on the consumption of epoxy
groups during the reaction. At higher temperatures, the rate of epoxy conversion is higher and
also the optimum epoxy conversion is higher. In other words, the free epoxy groups
remaining in the system at the end of the reaction decrease as the cross-linking temperature
increases. Figure 5.31 shows the change in primary amines during the reaction as a function
of cross-linking temperature. An increase in the temperature increases the rate of depletion of
the primary amine with respect to reaction time.
The change in secondary amine concentration as a function of cross-linking temperature is
presented in Figure 5.32. The rate of production of secondary amine groups during the early
stages of the reaction increased with cross-linking temperature. Furthermore, the maximum
secondary amine concentration increased with reaction temperature.
Page 208
196
0 200 400 600 800 1000 1200 1400
0.0
0.5
1.0
1.5
2.0
Concentr
ation (
mol kg
-1)
Cross-linking time (minutes)
40oC
50oC
60oC
70oC
Figure 5.30 Comparison of change in epoxy group concentration during cross-linking of the
LY3505/XB3403 resin system at 40, 50, 60 and 70 oC.
0 200 400 600 800 1000 1200 1400
0.00
0.25
0.50
0.75
1.00
1.25
Co
nce
ntr
atio
n (
mo
l kg
-1)
Cross-linking time (minutes)
40oC
50oC
60oC
70oC
Figure 5.31 Comparison of change in primary amine group concentration during cross-linking of
LY3505/XB3403 resin system at 40, 50, 60 and 70 oC.
Page 209
197
0 200 400 600 800 1000 1200 1400
0.00
0.25
0.50
0.75
1.00
Concentr
ation (
mol kg
-1)
Cross-linking time (minutes)
40oC
50oC
60oC
70oC
Figure 5.32 Comparison of change in secondary amine group concentration during cross-linking of the
LY3505/XB3403 resin system at 40, 50, 60 and 70 oC.
With reference to Figure 5.33, the concentration of tertiary amine groups increased as a
function of reaction time following an incubation period at the beginning of the reaction.
This may be attributed to the period where only the primary amine groups take part in the
cross-linking reaction. The observed increase in highest tertiary amine concentration with
increase in cross-linking temperature confirms the increase in secondary amine conversion
and hence overall increase in degree of conversion of the resin system.
Page 210
198
0 200 400 600 800 1000 1200 1400
0.00
0.25
0.50
0.75
1.00
Con
cen
tra
tio
n (
mo
l kg
-1)
Cross-linking time (minutes)
40oC
50oC
60oC
70oC
Figure 5.33 Comparison of change in tertiary amine group concentration during cross-linking of
LY3505/XB3403 resin system at 40, 50, 60 and 70 oC.
Figure 5.34 shows the change in hydroxyl group concentration as a function of time and
reaction temperature. As expected, an increase in hydroxyl concentration throughout the
cross-linking reaction can be seen and this is due to the reaction of epoxy with primary and
secondary amines and the rate of change of the OH concentration increased with increasing
reaction temperature. With respect to Figure 5.30 and Figure 5.34, at all reaction
temperatures investigated, the hydroxyl concentration at the end of the reaction approached to
a similar value to that of the initial concentration of the epoxy groups in the uncured resin
mixture. Since the initial hydroxyl group concentration in the resin mixture was assumed to
be negligible, in the epoxy/amine resin system at the reaction conditions used, the
etherification reaction may have less influence on the reaction mechanism.
Page 211
199
0 200 400 600 800 1000 1200 1400
0.0
0.5
1.0
1.5
2.0
Concentr
ation (
mol kg
-1)
Cross-linking time (minutes)
40oC
50oC
60oC
70oC
Figure 5.34 Comparison of change in hydroxyl group concentration during cross-linking of
LY3505/XB3403 resin system at 40, 50, 60 and 70 oC.
5.3.3 Quantitative analysis of functional groups using fibre-optic
reflectance spectroscopy
A typical series of spectra obtained during cross-linking of the LY3505/XB3403 resin system
at 40 oC using fibre-optic reflectance spectroscopy is shown in Figure 5.35. The same
spectral characteristics discussed in Section 5.2.1 are clearly visible. Cross-linking
monitoring of the epoxy/amine resin system was also carried out at 50, 60 and 70 oC using
fibre-optic reflectance sensors.
Page 212
200
Nanometres
Abso
rbance
units
0 minutes
15 minutes32 minutes 85 minutes
138 minutes 4 hours6 hours
9 hours 11 hours20 hours
12
13
7
15
1117
1819
10
9
8
Nanometres
Abso
rbance
units
0 minutes
15 minutes32 minutes 85 minutes
138 minutes 4 hours6 hours
9 hours 11 hours20 hours
Nanometres
Abso
rbance
units
0 minutes
15 minutes32 minutes 85 minutes
138 minutes 4 hours6 hours
9 hours 11 hours20 hours
0 minutes
15 minutes32 minutes 85 minutes
138 minutes 4 hours6 hours
9 hours 11 hours20 hours
12
13
7
15
1117
1819
10
9
8
Figure 5.35 Contour spectra recorded during cross-linking of the LY3505/XB3403 resin system at 40
oC using the fibre-optic reflectance spectroscopy.
The same spectral investigation that discussed in Section 5.3.2 was carried out with the
spectral data obtained in reflection mode during cross-linking at different reaction
temperatures. Figure 5.36 represents the change in concentration of the epoxy, primary
amine, secondary amine, tertiary amine and hydroxyl groups at 40 oC. The results are based
on the average of three repeat experiments carried out at the same isothermal temperature.
The analysis was also performed for spectral data obtained at 50, 60 and 70 oC using fibre-
optic reflectance spectroscopy and a similar trend in changing concentration of the functional
groups were observed.
Page 213
201
0 200 400 600 800 1000 1200 1400
0.0
0.5
1.0
1.5
2.0
Co
nce
ntr
atio
n (
mo
l kg
-1)
Cross-linking time (minutes)
[EP]
[PA]
[SA]
[TA]
[OH]
Figure 5.36 Summary of change in the functional group concentrations during cross-linking at 40 oC.
[EP], [PA], [SA], [TA] and [OH] are concentration of epoxy, primary amine, secondary amine,
tertiary amine and hydroxyl groups, respectively.
Figure 5.37 shows the change in epoxy group concentration during cross-linking as a function
of reaction temperature. The rate of epoxy consumption increased as the cross-linking
temperature increases. In addition, free epoxy groups remaining in the system at the end of
the reaction decreased as the optimum epoxy conversion increased at higher reaction
temperatures. The same trend was observed with the data recorded using the fibre-optic
transmission spectroscopy. Figure 5.38 represents the change in primary amine concentration
during cross-linking at different reaction temperatures. At higher temperatures, primary
amines were consumed at a faster rate compared with that at lower cross-linking
temperatures.
Page 214
202
0 200 400 600 800 1000 1200
0.0
0.5
1.0
1.5
2.0
2.5
Concentr
ation (
mol kg
-1)
Cross-linking time (minutes)
40oC
50oC
60oC
70oC
Figure 5.37 Comparison of the change in epoxy group concentration during cross-linking of the
LY3505/XB3403 resin system at 40, 50, 60 and 70 oC.
Figure 5.39 shows a plot of the observed changes in the concentration of secondary amine
groups during cross-linking as a function of reaction time. It can be seen that the residual
secondary amine concentration at the end of the reaction decreased with increase in reaction
temperature whereas maximum concentration increased as the reaction temperature increases.
Page 215
203
0 200 400 600 800 1000 1200
0.00
0.25
0.50
0.75
1.00
1.25
Co
nce
ntr
atio
n (
mo
l kg
-1)
Cross-linking time (minutes)
40oC
50oC
60oC
70oC
Figure 5.38 Comparison of change in primary amine group concentration during cross-linking of
LY3505/XB3403 resin system at 40, 50, 60 and 70 oC.
0 200 400 600 800 1000 1200
0.00
0.25
0.50
0.75
1.00
Co
ncen
tra
tio
n (
mo
l kg
-1)
Cross-linking time (minutes)
40oC
50oC
60oC
70oC
Figure 5.39 Comparison of change in secondary amine group concentration during cross-linking of
LY3505/XB3403 resin system at 40, 50, 60 and 70 oC.
Page 216
204
Figure 5.40 shows the change in tertiary amine concentration against the reaction time at
different cross-linking temperatures. Similarly to the trend obtained using fibre-optic
transmission spectroscopy, a dwell time was observed at the start of the reaction followed by
an increase in the concentration towards the end of the reaction. The rate of formation of
tertiary amine groups as well as the optimum concentration attained increased with increase in
reaction temperature.
0 200 400 600 800 1000 1200
0.00
0.25
0.50
0.75
1.00
1.25
Con
ce
ntr
atio
n (
mo
l kg
-1)
Cross-linking time (minutes)
40oC
50oC
60oC
70oC
Figure 5.40 Comparison of change in tertiary amine group concentration during cross-linking of the
LY3505/XB3403 resin system at 40, 50, 60 and 70 oC.
Figure 5.41 represents the change in hydroxyl concentration as a function of cross-linking
time at different reaction temperatures. The rate of hydroxyl formation increased as the cross-
linking temperature increases due to the increase in overall epoxy conversion. At higher
cross-linking temperatures, the optimum hydroxyl concentration approached the initial
Page 217
205
concentration of epoxy groups at the start of the cross-linking confirming that insignificant
etherification reactions take place within the resin system.
0 200 400 600 800 1000 1200
0.0
0.5
1.0
1.5
2.0
2.5
Co
nce
ntr
atio
n (
mo
l kg
-1)
Cross-linking time (minutes)
40oC
50oC
60oC
70oC
Figure 5.41 Comparison of change in hydroxyl group concentration during cross-linking of the
LY3505/XB3403 resin system at 40, 50, 60 and 70 oC.
5.4 Empirical modelling of cross-linking kinetics using
fibre-optic spectroscopy
5.4.1 Fibre-optic transmission spectroscopy
The mostly accepted method of obtaining degree of cross-linking is based on change in epoxy
group concentration with respect to time and temperature [136,147]. In the current study, the
epoxy absorption band at 2207 nm was used for determining the degree of conversion and the
Page 218
206
spectral data were normalised against the peak area of aromatic CH at 2164 nm. The degree
of conversion at a given cross-linking temperature was calculated as follows:
0
1 tEP
EP Equation 5.6
where α is the degree of conversion, [EP]0 and [EP]t are epoxy concentration at = 0 and t = t
respectively.
0 200 400 600 800 1000 1200
0.0
0.2
0.4
0.6
0.8
1.0
Degre
e o
f epoxy c
onvers
ion (
)
Cross-linking time (minutes)
40°C
50°C
60°C
70°C
Figure 5.42 Comparison of the degree of epoxy conversion during cross-linking of the
LY3505/XB3403 resin system at 40, 50, 60 and 70 oC. Results are based on fibre-optic
transmission spectroscopy.
Figure 5.42 shows a comparison of the degree of epoxy conversion as a function of
temperature. Both the rate of conversion and the optimum epoxy conversion of the
Page 219
207
LY3505/XB3403 resin system increase as cross-linking temperature increases at the
conditions used in the study [357,370,375].
The empirical approach for modelling cross-linking kinetics of thermosetting systems is a
widely accepted method [66,70,72] and the models commonly employed for epoxy/amine
resin systems were highlighted in Section 2.1.2.
In the current study, the model proposed by Kenny and Trivisano [86] was used for
determining the cross-linking kinetics of the LY3505/XB3403 resin system. In order to
determine the reaction rate as a function of time, the derivative of the plot of degree of
conversion versus time, was obtained. For cross-linking reaction at each reaction
temperature, Equation 2.10 was fitted to graphs of d /dt against using the Origin 7.0
software. A non-linear least-squares curve fitting approach was used in which the best fit is
generated by choosing the unknown parameters (i.e. k1 k2, m and n) so that the sum of the
squares of the deviations of the model from the experimental points is minimum for a range of
independent variables.
For curve fitting, m and n were assumed to be constants and n + m = 2. Reasonable fits were
obtained with m = 0.5 and n = 1.5 and the values seemed to be independent of the reaction
temperature. Therefore Equation 2.10 (see Section 2.1.2) can be written for the
LY3505/XB3403 resin system as follows:
5.1
max
5.0
21 ))(( kkdt
d Equation 5.7
Page 220
208
According to the results obtained, Figure 5.43 illustrates the optimum epoxy conversion
( max) as a function of cross-linking temperature and linear regression can be performed for
the range of reaction temperatures studied. According to the best linear fit, the relationship
between max and the reaction temperature can be defined as follows:
max 0.00244 0.811T Equation 5.8
where T is the cross-linking temperature. According to the correlation coefficient for the
linear fit (R2), a linear relationship was observed between amax and the reaction temperature
in the temperature range of 40 – 70 oC. The standard deviation of the slope of the regression
line from the experimental data set was calculated as 0.004. However, there is not enough
evidence to extrapolate the linear relationship beyond the temperature range studied.
Therefore it may not be valid to use the linear regression to predict the optimum epoxy
conversion below and above 40 oC and 70
oC, respectively. The rate constants, k1 and k2 were
obtained by fitting Equation 2.10 to the experimental data.
30 40 50 60 70 80
0.90
0.92
0.94
0.96
0.98
1.00
Op
tim
um
ep
oxy c
on
ve
rsio
n (
ma
x)
Cross-linking temperature (oC)
y = 0.00244 x + 0.811
R2 = 0.99, Std. dev. = 0.004
Figure 5.43 Relationship between the optimum epoxy conversion and the cross-linking temperature for
the LY3505/XB3403 resin system.
Page 221
209
0 100 200 300 400 500 600
0.000
0.002
0.004
0.006
0.008
0.010
0.012
d/d
t
Cross-linking time (mintues)
Repeat test-1
Repeat test-2
Repeat test-3
Model
Figure 5.44 Comparison of the experimental data and the kinetic model (see Equation 2.10) for cross-
linking monitoring of the LY3505/XB3403 resin system at 60oC.
Figure 5.44 shows a typical plot of d /dt against cross-linking time for the experiments
carried out at 60oC using fibre-optic transmission spectroscopy. Three repeat experiments at
the same reaction temperature were cross-plotted with the model. The same procedure was
followed for all the cross-linking temperatures and the Arrhenius temperature dependence was
observed from the rate constants, k1 and k2 as shown in Figure 5.45 and Figure 5.46.
Therefore Equations 2.5 and 2.6 can be re-written for k1 and k2 related to the LY3505/XB3403
resin system as follows:
1
1ln 4094.70 6.101k
T Equation 5.9
491.151
66.6382ln 2T
k Equation 5.10
Page 222
210
0.0029 0.0030 0.0031 0.0032
-7.0
-6.5
-6.0
-5.5
ln(k
1)
1/T (oK
-1)
y = -4094.70 x + 6.10
R2 = 0.99, Std. dev. = 0.03
Figure 5.45 Arrhenius temperature dependence of the rate constant, k1 for the LY3505/XB3403 resin
system based on fibre-optic transmission spectroscopy.
0.0029 0.0030 0.0031 0.0032
-5.0
-4.5
-4.0
-3.5
-3.0
ln(k
2)
1/T (oK
-1)
y = -6382.66 x + 15.49
R2 = 0.98, Std. dev. = 0.10
Figure 5.46 Arrhenius temperature dependence of the rate constant, k2 for the LY3505/XB3403 resin
system based on fibre-optic transmission spectroscopy.
Page 223
211
The activation energies for cross-linking and the pre-exponential factors relating to k1 and k2
can be obtained using Equations 2.5 and 2.6.
5.4.2 Fibre-optic reflectance spectroscopy
Figure 5.47 shows a summary of results obtained for the degree of epoxy conversion at
different cross-linking temperatures using fibre-optic reflectance spectroscopy. The
conversion is based on the normalised peak area of epoxy absorbance band at 2209 nm
against the aromatic reference peak area at 2164 nm.
0 200 400 600 800 1000 1200
0.0
0.2
0.4
0.6
0.8
1.0
De
gre
e o
f e
po
xy c
on
ve
rsio
n (
)
Cross-linking time (minutes)
40oC
50oC
60oC
70oC
Figure 5.47 Comparison of the degree of epoxy conversion during cross-linking of the
LY3505/XB3403 resin system at 40, 50, 60 and 70 oC. Results are based on the fibre-optic
reflectance spectroscopy.
Page 224
212
The degree of conversion was obtained using Equation 5.6. With reference to Figure 5.47, the
degree of epoxy conversion determined using fibre-optic reflectance spectroscopy highlights a
characteristic trend of the increase in degree of conversion with increase in reaction
temperature.
The same empirical approach was used for the spectral data obtained using fibre-optic
reflectance spectroscopy. In order to obtain kinetic parameters, Equation 2.10 was fitted to
the experimental data and the Arrhenius relation was observed for k1 and k2 as shown in
Figure 5.48 and Figure 5.49, respectively. The standard deviation shown in the plots is the
deviation of the slope of the linear regression line from the experimental data set. Using
linear fits, the Arrhenius temperature dependence of rate constants where obtained based on
reflection spectroscopy can be expressed as follows:
1
1ln 3818.00 4.546k
T Equation 5.11
970.131
23.5857ln 2T
k Equation 5.12
Page 225
213
0.0029 0.0030 0.0031 0.0032
-7.0
-6.5
-6.0
-5.5
ln(k
1)
1/T (oK
-1)
y = -3818.00 x + 4.546
R2 = 0.95, Std. dev. = 0.16
Figure 5.48 Arrhenius temperature dependence of the rate constant, k1 for the LY3505/XB3403 resin
system based on fibre-optic reflectance spectroscopy.
0.0029 0.0030 0.0031 0.0032
-5.0
-4.5
-4.0
-3.5
-3.0
ln(k
2)
1/T (oK
-1)
y = -5857.23 x + 13.970
R2 = 0.99, Std. dev. = 0.10
Figure 5.49 Arrhenius temperature dependence of the rate constant, k2 for the LY3505/XB3403 resin
system based on the fibre-optic reflectance spectroscopy.
Page 226
214
5.4.3 Comparison of cross-linking kinetics obtained using fibre-
optic spectroscopy
The kinetic parameters obtained for cross-linking of LY3505/XB3403 resin system based on
fibre-optic transmission and reflectance spectroscopy are summarised in Table 5.3. Values
obtained for activation energy for cross-linking using different sensing techniques show a
slight variation. However, this difference is well within the scatter of data. The applicability
of the model (see Equation 2.10) was investigated for DGEBA/POP [379] and DGEBA/1,6-
diaminohexane [149,81] resin systems. The kinetic parameters reported in Table 5.3 are in
reasonable agreement with the published data for similar epoxy systems. Values for m and n
have been reported as 0.58 and 1.42, respectively for DGEBA/POP based on DSC
measurements [379]. In that study, the activation energies corresponding to k1 and k2 were
quoted as 67.7 and 51.4 kJ mol-1
, respectively. Other authors who studied the cross-linking
kinetics of DGEBA/POP resin system include Rigail-Cedeño and Sung [132]. However, in
their study value for the activation energy was not reported. Results for a DGEBA/1,6-
diaminohexane resin system based on near-infrared spectroscopy reported by Crosby [149]
and Fernando et al. [81] include values for the activation energies between 27 – 70 kJ mol-1
.
The general Kamal model (Equation 2.4) was also used for kinetic analysis of the resin system
used in this study [356,357]. The activation energies reported were in the range of 50 – 52 kJ
mol-1
. Figure 5.50 shows a comparison of the degree of conversion based on the experimental
data obtained using fibre-optic transmission & reflection techniques; the prediction based on
the kinetic model developed for the LY3505/XB3404 resin system at 40, 50, 60 and 70 oC are
assumed. Equation 5.7 was integrated to obtain the degree of conversion as a function of time
Page 227
215
(see Appendix – III). The model shows excellent correlation with the experimental results.
The cross-linking reactions follow typical autocatalytic behaviour and can be explained using
the modified Kamal model (Equation 5.7).
Table 5.3 Comparison of values obtained for activation energy, Ea and the pre-exponential factor, ln
A related to k1 and k2.
Fibre-optic transmission spectroscopy Fibre-optic reflectance spectroscopy
Activation energy
(Ea)
(kJ mol-1
)
Pre-exponential
factor (ln A)
Activation energy
(Ea)
(kJ mol-1
)
Pre-exponential
factor (ln A)
k1 34±1 6.10±0.40 32±6 4.54±0.33
k2 53±4 15.49±1.54 49±4 13.97±1.40
n = 1.5, m = 0.5
0 200 400 600 800 1000 1200
-0.2
0.0
0.2
0.4
0.6
0.8
1.0
Degre
e o
f epoxy c
onvers
ion (
)
Cross-linking time (minutes)
Fibre-optic transmission
spectroscopy
Fibre-optic reflection
spectroscopy
Model
40oC
50oC60oC70oC
0 200 400 600 800 1000 1200
-0.2
0.0
0.2
0.4
0.6
0.8
1.0
Degre
e o
f epoxy c
onvers
ion (
)
Cross-linking time (minutes)
Fibre-optic transmission
spectroscopy
Fibre-optic reflection
spectroscopy
Model
40oC
50oC60oC70oC
Figure 5.50 Comparison of the kinetic cure model to the experimental data obtained using different
fibre-optic techniques for the LY3505/XB3403 resin system at 40, 50, 60 and 70 oC.
Page 228
216
5.4.4 Relationship of degree of cross-linking and refractive index
Refractive indices of uncross-linked resin mixture and a cross-linked resin at 60 oC for 8
hours were measured to be 1.5408 and 1.5719, respectively. The measurements were taken at
22.3 oC using the sodium D-line at 589 nm.
Crosby [149] investigated a relationship between concentration and the refractive index of a
bisphenol-A/1,6-hexadiamine resin system. The author modelled the degree of conversion
based on refractive index data and good correlation was observed with that obtained using
change in chemical concentration. The validity of the model for the resin system was studied
using data obtained at isothermal reaction temperatures ranging from 30 – 60 oC.
An attempt was made to predict the refractive index of the Y3505/XB3403 resin system
during cross-linking using the model proposed by Crosby [149]. The model was modified for
cross-linking reaction of LY3505/XB3403 epoxy/amine resin system at 60 oC for 8 hours
using off-line measurements of refractive index of the resin system before and after cross-
linking [149,222,380]. The modified relationship between the refractive index, no and degree
of conversion, α is given below:
0 0.0444 1.5275n Equation 5.13
5.4.4.1 Ray optics of Fibre-optic transmission spectroscopy
The degree of conversion based on epoxy absorption at 2207 nm was calculated using fibre-
optic near-infrared transmission spectroscopy at the same cross-linking temperature and the
data set was used for predicting the change in refractive index during the cross-linking
Page 229
217
reaction. For in situ monitoring of cross-linking reaction, the cavity length of a single-fibre
transmission sensor was set to be 500 μm. The predicted refractive index as a function of
cross-linking time and also as a function of degree of conversion obtained at 60 oC is plotted
in Figure 5.51. As the viscosity of the resin system increases with degree of cross-linking, the
density of the resin also increases. Therefore the refractive index of the resin system
increases with increasing degree of conversion. As the system approaches the gel point, rate
of cross-linking decreases and the rate of increase in refractive index also decreases. Good
correlation was observed with the measured and predicted refractive index after cross-linking
at 60 oC for 8 hours (see Table 5.4).
Using predicted refractive index of the resin system as a function of cross-linking; it is
possible to predict the change in half-angle of cone of acceptance, θo with respect to refractive
index using Equation 5.13. Figure 5.52 shows the relationship of refractive index and θo as a
function of cross-linking time. From Figure 5.52 it can be seen that, θo decreases as the
refractive index of the resin within the sensing cavity, increases. This shows the trend of
convergence of cone of acceptance of IR beam emerging at the fibre/resin interface as a
function of cross-linking time. Figure 5.53 schematically represents the decrease in θo of IR
beam towards the end of cross-linking; no and θo are refractive index of the resin and the half
angle of cone of acceptance at input fibre/resin interface. Subscripts “start” and “end”
represent before and after cross-linking, respectively.
Furthermore, the power of IR beam that enters into the output fibre, P3(λ) is a function of
refractive index and can be predicted using Equation 4.4. In Equation 4.5, P3(λ) is expressed
as a fraction of the power emerging at the input fibre interface, P0(λ).
Page 230
218
0 100 200 300 400 500
1.53
1.54
1.55
1.56
1.57
0.0
0.2
0.4
0.6
0.8
1.0
Degre
e o
f epoxy c
onvers
ion,
Refr
active index,
no
Cross-linking time (minutes)
Refractive index
Degree of conversion
0 100 200 300 400 500
1.53
1.54
1.55
1.56
1.57
0.0
0.2
0.4
0.6
0.8
1.0
Degre
e o
f epoxy c
onvers
ion,
Refr
active index,
no
Cross-linking time (minutes)
Refractive index
Degree of conversion
Figure 5.51 Comparison of predicted refractive index (see Equation 4.6) and degree of conversion of
LY3505/XB3403 resin system obtained at 60 °C for 8 hours.
0 100 200 300 400 500
8.05
8.10
8.15
8.20
8.25
8.30
1.52
1.53
1.54
1.55
1.56
1.57
Re
fra
ctive
in
de
x,
no
Ha
lf-a
ng
le o
f th
e
co
ne
of
acce
pta
nce
, o (
de
gre
e)
Cross-linking time (minutes)
Half angle, o
Refractive index
0 100 200 300 400 500
8.05
8.10
8.15
8.20
8.25
8.30
1.52
1.53
1.54
1.55
1.56
1.57
Re
fra
ctive
in
de
x,
no
Ha
lf-a
ng
le o
f th
e
co
ne
of
acce
pta
nce
, o (
de
gre
e)
Cross-linking time (minutes)
Half angle, o
Refractive index
Figure 5.52 Comparison of change in refractive index (see Equation 5.13) of LY3505/XB3403 resin
system cross-linked at 60 oC for 8 hours and half-angle of cone of acceptance, θo (see Equation
4.3) at the input fibre/resin interface.
Page 231
219
Figure 5.54 represents the change in the fractional component, f(no,A,d) at 2207 nm as a
function of cross-linking time. Absorbance, A was calculated using epoxy absorption band at
2207 nm and d = 500 μm (see Appendix – I). It is obvious that, as θo decreases with increase
in refractive index of the resin, the fraction of P0(λ) coupling into the output fibre increases.
Table 5.4 Summary of results obtained for ray optics of fibre-optic transmission spectroscopy for the
LY3505/XB3403 resin system with in the sensing cavity.
Before cross-linking
After cross-linking at 60oC for 8
hours
Refractive index (at 60oC) 1.5275 1.5699
Half-angle of cone of acceptance, θo
(degree) 8.281 8.056
Fraction of input power, f(no,A,d) 0.042 0.368
o,start
Fibre core
Fibre cladding
ncore
ncladding
n0,start
Output fibreInput fibre
d
o,end
n0,end
o,start
Fibre core
Fibre cladding
ncore
ncladding
n0,start
Output fibreInput fibre
d
o,end
n0,end
Figure 5.53 Schematic illustration of change in half-angle of cone of acceptance, θo at the input
fibre/resin interface as a function of change in refractive index of LY3505/XB3403 resin system.
Page 232
220
0 100 200 300 400 500
0.0
0.1
0.2
0.3
0.4
f (n
0,A
,d)
Cross-linking time (minutes)
b 500micro
Figure 5.54 Change in f(no,A,d) for fibre-optic transmission spectroscopy at 2207 nm and d = 500 μm as
a function of cross-linking time.
5.4.4.2 Ray optics of Fibre-optic reflectance spectroscopy
Fibre-optic near-infrared reflectance spectroscopy was also used to predict the refractive
index of the epoxy/amine resin during cross-linking using the model proposed by Crosby
[149]. Spectral data obtained for monitoring of cross-linking reaction of the LY3505/XB3404
resin system at 60oC using fibre-optic reflectance spectroscopy was used. In Figure 5.55, the
predicted refractive index of resin during cross-linking reaction is compared with degree of
conversion. The predicted refractive indices of resin, before and after cross-linking show a
reasonable fit with the measured values and also with those predicted using fibre-optic near-
infrared transmission spectroscopy.
Page 233
221
0 100 200 300 400 500
1.53
1.54
1.55
1.56
1.57
0.0
0.2
0.4
0.6
0.8
1.0
De
gre
e o
f e
po
xy c
on
ve
rsio
n,
Re
fra
ctive
in
de
x,
no
Cross-linking time (minutes)
Refractive index
Degree of conversion
0 100 200 300 400 500
1.53
1.54
1.55
1.56
1.57
0.0
0.2
0.4
0.6
0.8
1.0
De
gre
e o
f e
po
xy c
on
ve
rsio
n,
Re
fra
ctive
in
de
x,
no
Cross-linking time (minutes)
Refractive index
Degree of conversion
Figure 5.55 Comparison of predicted refractive index (see Equation 5.13) and degree of conversion of
LY3505/XB3403 resin system obtained at 60 oC for 8 hours.
0 100 200 300 400 500
8.05
8.10
8.15
8.20
8.25
8.30
1.52
1.53
1.54
1.55
1.56
1.57
Re
fractive
ind
ex,
no
Ha
lf-a
ngle
of
the
co
ne o
f a
cce
pta
nce
, o (
de
gre
e)
Cross-linking time (minutes)
Half angle, o
Refractive index
0 100 200 300 400 500
8.05
8.10
8.15
8.20
8.25
8.30
1.52
1.53
1.54
1.55
1.56
1.57
Re
fractive
ind
ex,
no
Ha
lf-a
ngle
of
the
co
ne o
f a
cce
pta
nce
, o (
de
gre
e)
Cross-linking time (minutes)
Half angle, o
Refractive index
Figure 5.56 Comparison of change in refractive index (see Equation 5.13) of LY3505/XB3403 resin
system cross-linked at 60 oC for 8 hours and half-angle of cone of acceptance, θo (see Equation
4.3) at the input fibre/resin interface.
Page 234
222
Furthermore, the relationship of refractive index of the resin and half-angle of cone of
acceptance, o shows a similar trend with that observed with the fibre optic near-infrared
transmission spectroscopy (see Figure 5.52 and Figure 5.56). The predicted results of optical
parameters before and after cross-linking of LY3505/XB3403 resin system are given in Table
5.5.
The fraction of power of IR radiation that couples back to the sensing fibre as a function of
cross-linking time at 60 oC was modelled using Equation 4.7. Spectral data obtained during
in situ cross-linking using fibre-optic reflectance spectroscopy were used for absorbance
calculations. The absorption peak related to the epoxy group at 2209 nm was considered to
obtain the change in absorbance during cross-linking. Here, the loss of power due to the
reflection of light at the sputter-gold coated reflector was also considered. The reflectance
from a thin gold coating in the near-IR region was reported in the range of 95 – 98 %
depending on deposition technique used, deposition conditions and the thickness of the
sputter-coated gold layer [381,382,383]. Therefore, to stimulate the highest possible loss at
the reflector, the reflectance at the sputter-gold coating was considered as 95% of the incident
light. As can be seen from the Figure 5.57, the change in fractional component, f(n0,A,d) that
enters back to the fibre increases as refractive index of the resin increases.
Page 235
223
0 100 200 300 400 500
0.0
0.1
0.2
f (n
0,A
,d)
Cross-linking time (minutes)
H
Figure 5.57 Change in f(no,A,d) for fibre-optic reflectance spectroscopy at 2209 nm and d = 500 μm as a
function of cross-linking time.
Table 5.5 Summary of results obtained for ray optics of fibre-optic reflectance for LY3505/XB3403
resin system with in the sensing cavity.
Before cross-linking After cross-linking at 60
oC for
8 hours
Refractive index (at 60 oC) 1.5275 1.5702
Half-angle of cone of acceptance, θo
(degree) 8.281 8.054
Fraction of input power, f(no,A,d) 0.003 0.211
5.4.4.3 Comparison of ray optics of different fibre-optic techniques
Figure 5.58 compares the change in f(n0,A,d) during cross-linking of the epoxy resin system
under transmission and reflectance modes. It was observed that for same cavity length, d,
fibre-optic reflection spectroscopy shows a low coupling ratio of reflected IR radiation back
to the detector compared with that observed from fibre-optic transmission spectroscopy (see
Page 236
224
Figure 5.58). According to Equation 4.6, this is mainly due to three reasons: the absorption of
the IR beam at the reflector, divergence of the IR beam, and the power loss due to the
doubling effect of path-length in reflection mode as IR beam travels twice across the sensing
cavity (see Figure 4.3).
Nevertheless, in reflectance mode the coupling ratio of reflected IR radiation could be
improved by decreasing the cavity length, d (see Equation 4.6). Therefore, the effect of
decrease in cavity length on the quality of near-IR spectra obtained via fibre-optic reflectance
spectroscopy was investigated and the results will be discussed in Sections 6.3.1.
0 100 200 300 400 500
0.0
0.1
0.2
0.3
0.4
f (n
0,A
,d)
Cross-linking time (minutes)
Fibre-optic reflectance
spectroscopy
Fibre-optic transmission
spectroscopy0 100 200 300 400 500
0.0
0.1
0.2
0.3
0.4
f (n
0,A
,d)
Cross-linking time (minutes)
Fibre-optic reflectance
spectroscopy
Fibre-optic transmission
spectroscopy
0 100 200 300 400 500
0.0
0.1
0.2
0.3
0.4
f (n
0,A
,d)
Cross-linking time (minutes)
Fibre-optic reflectance
spectroscopy
Fibre-optic transmission
spectroscopy0 100 200 300 400 500
0.0
0.1
0.2
0.3
0.4
f (n
0,A
,d)
Cross-linking time (minutes)
Fibre-optic reflectance
spectroscopy
Fibre-optic transmission
spectroscopy0 100 200 300 400 500
0.0
0.1
0.2
0.3
0.4
f (n
0,A
,d)
Cross-linking time (minutes)
Fibre-optic reflectance
spectroscopy
Fibre-optic transmission
spectroscopy
0 100 200 300 400 500
0.0
0.1
0.2
0.3
0.4
f (n
0,A
,d)
Cross-linking time (minutes)
Fibre-optic reflectance
spectroscopy
Fibre-optic transmission
spectroscopy
Figure 5.58 Comparison of the change in f(no,A,d) at 2207 nm and d = 500 μm as a function of cross-
linking time, that predicted using fibre-optic transmission spectroscopy and fibre-optic reflectance
spectroscopy.
The increase in light coupling efficiency with increase in refractive index during cross-linking
of the resin system also can be evident from near-infrared spectra obtained using fibre-optic
Page 237
225
spectroscopy. It was also observed that the baseline of the absorbance spectrum that was
acquired using fibre-optic sensors shifts below zero absorbance (see Figure 5.59). The
corresponding background spectrum, which was taken in air and the sample spectrum of the
LY3505/XB3403 resin system, is shown in Figure 5.60. It can be seen that within 950 – 2160
nm, the signal intensity of the sample spectrum is higher than that of the background
spectrum. According to Equation 2.25, absorbance, Aλ become negative because for I/Io > 1,
0 < log (I/Io) < 1.
NanometresNanometres
Figure 5.59 Near-infrared spectrum of the LY3505/XB3403 resin system obtained using a single-fibre
transmission spectroscopy with 500 μm sensing cavity.
Page 238
226
Nanometres
Background spectrum
Sample spectrum
NanometresNanometres
Background spectrum
Sample spectrum
Figure 5.60 Background and sample spectra of the LY3505/XB3403 resin system obtained using a
single-fibre transmission spectroscopy with 500 μm sensing cavity length.
The increase in intensity of the sample signal is attributed to the decrease in half-angle of
cone of acceptance, θo at the input fibre end. During background measurement, the sensing
cavity was in air and θo was calculated to be 12.709o. This angle converges to 8.281
o when
the sensing cavity was filled with resin. Therefore, the fraction of the IR beam coupling into
the output fibre is higher when the resin was placed in the cavity compared to the case where
the background was taken in air.
5.5 Conclusions
Quantitative analysis of the reactive functional groups in the LY3505/XB3404 resin system
was carried out using fibre-optic spectroscopy. In order to determine the peak area of the
Page 239
227
absorbance band due to epoxy ring at 2207 nm, a method was proposed to deconvolute the
overlapped absorbance peak that appeared at 2190 nm.
In situ monitoring of cross-linking reactions in the epoxy/amine resin system was carried out
using two fibre-optic sensing techniques: transmission spectroscopy and reflectance
spectroscopy. The cross-linking process was evaluated at four reaction temperatures, 40, 50,
60 and 70 oC. The change in concentrations of epoxy, primary amine and secondary amine
groups during cross-linking was determined based on the absorption bands at 2207 nm, 2026
nm and 1532 nm, respectively. Absorption bands due to tertiary amine groups are not present
in near-infrared region. Although absorption band due to hydroxyl groups was observed at
1430 nm, analysis of this peak is complicated by the presence of hydrogen bonding.
Therefore the concentration of tertiary amine and hydroxyl groups were determined using
mass-balance equations.
Kinetic modelling of the cross-linking process was carried out based on the results obtained
for the degree of epoxy conversion as a function of reaction time and reaction temperature.
An autocatalytic model was used to predict the reaction mechanism in the epoxy/amine resin
system. Good correlation was observed between the model fits to the experimental data
during the cross-linking process.
Spectral data obtained under transmission and reflection modes during cross-linking of the
epoxy resin system were used to predict the ray-optic model. The change in light
transmission characteristics at the sensing region during cross-linking of the resin system
were obtained as a function of absorption of epoxy peak at 2207 nm, refractive index of the
resin and the cavity length of the sensor.
Page 240
228
Chapter 6
Proof-of-concept of multi-functional
sensor design
6 Overview
6.1 Introduction
This chapter presents proof-of-concept of multi-functional sensor design for monitoring the
cross-linking reactions of the LY3505/XB3403 resin system. First part of the chapter
discusses preliminary results of monitoring strain and temperature sensitivity of the primary
EFPI/FBG sensor will be discussed. The second part investigates the feasibility of using a
multi-functional sensor design for in situ monitoring of multiple parameters during cross-
linking of the epoxy/amine resin system was also will be presented.
Page 241
229
6.2 Temperature and strain sensitivity of the sensor design
With reference to Figure 3.32, the basic sensor design is based on a conventional extrinsic
fibre Fabry-Perot interferometric (EFPI) sensor. Since the gauge length of the EFPI sensor is
known (distance between the two fusion joints [D and D’], any changes in the cavity length
[C] will enable the strain to be calculated. An array of EFPI and fibre Bragg grating (FBG)
sensors (see Figure 3.34) was employed to verify the consistency of EFPI and FBG sensor
responses for both temperature and resin shrinkage during cross-linking. Two sensor-
interrogation systems were used to cross-correlate the sensitivity of the systems against each
other (see Section 3.9.4).
6.2.1 Temperature sensitivity of Fabry-Perot interference sensor
and fibre Bragg grating sensor
The sensing principles and relevant equations for strain and temperature measurements using
the primary EFPI and FBG sensors are summarised as follows. The primary Fabry-Perot (FP)
cavity length, d, can be determined from the interference fringe separation across a spectral
width of using the following equation:
1 2
2000
nd Equation 6.1
where 1, 2 are optical wavelengths (in nm) that are 2 in the phase separation between
adjacent maxima. The cavity length of the EFPI sensor depends on the external strain and
thermal effect. Thus the change in FP cavity length, d can be represented as [384]:
Page 242
230
. .d L A T Equation 6.2
where is applied longitudinal strain, L is gauge length, T is change in temperature. A is the
change in length of the sensor due to change in temperature and is expressed as
( )q fA L . Here, q and f are the linear thermal expansion coefficient (TEC) of the
quartz capillary and the optical fibres respectively. According to the experimental data
obtained within the temperature range 30 – 80 oC, no clear relationship was found between
the cavity length and the temperature (see Figure 6.1). However an attempt was made to
calculate the linear TEC of the optical fibre equivalent to the observed variation in cavity
length within the test temperature range. The calculated value is of the order of 10-7
oC
-1,
which is less than the typical TEC of quartz capillary and optical fibre, 0.55 x 10⁻⁶
oC
-1 [384].
This is in good agreement with the previous investigations [385,386] and it was suggested
that, as the linear TEC of the quartz capillary and the optical fibre are very similar, Equation
6.2 can be rearranged as [384]:
L
d Equation 6.3
In the case of FBG sensors, the Bragg wavelength shift, B, caused by the change in applied
strain ( ) and change of temperature ( T) can be expressed as below [387]:
. .B T Equation 6.4
Page 243
231
where (1 )B ep and ( )B n , pe is effective strain-optic constant, Λ is the
linear TEC for silica, n is the thermo-optic coefficient, and are the relevant wavelength-
strain sensitive factor and wavelength-temperature sensitive factor, respectively.
0 50 100 150 200 250 300
-10
-8
-6
-4
-2
0
2
4
6
8
10
FP
ca
vity le
ngth
ch
ang
e (
m)
Time (minutes)
EFPI-1
EFPI-2
30
40
50
60
70
80
90
Thermocouple
Th
erm
oco
up
le t
em
pe
ratu
re (
oC
)
0 50 100 150 200 250 300
-10
-8
-6
-4
-2
0
2
4
6
8
10
FP
ca
vity le
ngth
ch
ang
e (
m)
Time (minutes)
EFPI-1
EFPI-2
30
40
50
60
70
80
90
Thermocouple
Th
erm
oco
up
le t
em
pe
ratu
re (
oC
)
Figure 6.1 EFPI sensor response to temperature when subjected to a series of step/ramp temperature
experiments in a temperature-regulated cuvette holder.
Temperature sensitivity of FBG sensors inscribed on Ge-B co-doped single-mode fibre was
investigated using sealed gratings. Bragg wavelength shift, B as a function of temperature
was measured using sealed FBGs. Here the FBG sensor was sealed in a precision-bore
capillary. The experiment was carried out in a temperature-regulated cuvette holder and the
temperature of the system was increased from 30 oC to 80
oC in 10
oC steps. The temperature
in the vicinity of the sealed FBG sensor was also measured using a K-type thermocouple.
The Bragg wavelength shift with temperature was linear over the test temperature range as
Page 244
232
shown in Figure 6.2 and the temperature sensitivity factor, was calculated as 8.91 pm oC
-1
and 9.86 pm oC
-1 for FBG-T1 and FBG-T2 interrogated via OSA and FiberPro interrogation
unit, respectively. Good correlation was obtained between the results obtained and that
published in literature [388]. The difference in obtained using FiberPro and OSA could be
due to specifications of the measurement systems and the sensor packaging.
-10 0 10 20 30 40 50 60
-0.1
0.0
0.1
0.2
0.3
0.4
0.5
0.6
B = 0.00891. T, R
2=0.99
B = 0.00986. T, R
2=0.99
Temperature difference ( T)
Bra
gg
pe
ak s
hift
(B)
FBG-T1 (OSA)
FBG-T2 (FiberPro)
Figure 6.2 Bragg peak shift due to dynamic-step temperature scan that monitored via OSA and FibrePro
interrogation unit.
The resolution of the OSA and Fibrepro interrogation units are 0.07 nm [389] and 0.001 nm
[390], respectively. Therefore measurements based on the Fiberpro possess higher
measurement accuracy in defining the peak wavelength of the FBG. But this only explains
the error of the peak maximum determined from the measured data rather than the wavelength
accuracy of the data. The OSA wavelength scale has a wavelength accuracy of ±0.05 nm in
the wavelength range of 1530 – 1570 nm [389]. In contrast, the wavelength accuracy of the
Fibrepro system is ±0.005 nm [390]. Based on these specifications, the measurement error
involved in determining change in wavelength as a function of temperature using each system
Page 245
233
was plotted as shown in Figure 6.2. It can be clearly seen that the overall error associated
with the measurements (FBG-T1) based on OSA is higher compared with that observed based
on Fibrepro Interrogation system (FBG-T2).
On the other hand, sensor packaging may have an influence on the sensor response. The same
procedure that was used for manufacturing the EFPI in terms of fusing and sealing was used
here. It is possible that packaging was different in the two sensors but every effort was taken
to keep the dimensions and fabrication procedures similar. The procedure used was as
follows.
A precision-bore quartz capillary with 128 m internal diameter was used for packaging the
FBG sensors. Approximately 35 mm long capillary was used and one end was sealed using a
fibre-optic splicer. The FBG sensor was then inserted into the capillary using the fibre-optic
splicer. The capillary and the fibre were fused together as shown in Figure 6.3 and care was
taken to keep the splice well away from the FBG. Approximate distance between the sealed
end of the capillary and the end of the sensing fibre was 10 mm.
1 2 3
4 5
35 mm
10 mm5 mm
1 2 3
4 5
35 mm
10 mm5 mm
Figure 6.3 Schematic illustration of sealed FBGs [1] fused silica capillary. [2] FBG sensor. [3] fused end
of the capillary. [4] high-temperature epoxy adhesive and [5] fusion arc between capillary and the
sensing fibre.
Page 246
234
Since the same fibre was used to inscribe the gratings, the only possible explanation is that the
packaged sensors were different. Possible reasons for this included the following:
(a) Obstructions/defects in the capillary that preventing ‘free’ thermal expansion of
the fibres; and
(b) Cantilevered sensor where the end of the optical fibre was in contact with the
capillary.
Table 6.1 presents a summary of the temperature sensitivity for FBGs inscribed in photo-
sensitive fibre. With reference to Table 6.1, it is apparent that the values quoted for the
temperature sensitivity of the PS1250/1500 fibre range between 7.37 –9.37 pm oC
-1. The
values obtained in the current study were 9.86 and 8.91 pm oC
-1 for the OSA and Fiberpro,
respectively. No obvious explanation can be stated for the divergent behaviour of the two
data sets in Figure 6.2. This aspect needs a further detailed study.
Page 247
235
Table 6.1 Summary of values reported in the literature for the temperature sensitivity of single-mode
Germania-Boron (Ge-B) co-doped optical fibre (PS1250/1500, Fibercore Ltd.).
Reference (pm oC
-1) B
(nm)
KT x 10-6
(oC
-1)
Instrument used
Cavaleiro et al.
[391] 7.37 1280 5.76*
Optical spectrum analyser.
Pal et al. [392] 8.59 1536 5.59*
HP 86140A (Agilent) optical spectrum analyser.
(Based on technical specifications of the model,
minimum resolution is reported as ±0.07 nm.)
Pal et al. [388] 8.99 1534 5.86* Optical spectrum analyser with a resolution of
0.1 nm.
Yeo et al. [393] 9.3 - -
si720 swept-laser FBG interrogation unit
(Micron Optics).
(Based on manufacturer’s specifications, typical
resolution of the unit is reported as ±0.001 nm).
Yoon et al. [394] 9.19* 1532 6.00
A tunable laser, a photo detector and a
wavelength meter was used at ±0.1 pm
resolution.
De Oliveira et al.
[395] 9.37* 1561 6.00 Manufacturer’s specifications.
Rysman et al.
[396] 8.03 1548 5.19*
AQ6317C optical spectrum analyser and
AQ4222 EE LED source.
(According to the instrument specifications the
resolution is ±0.1 nm for the range of 600 –
1750 nm).
Harris and
Fernando [397] 9.2 1542 5.97*
IS7000 FBG interrogation system with a
resolution of ±0.001 nm.
Park et al. [398] 9.35 1532 6.10*
IS7000 FBG interrogation system with a
resolution of ±0.001 nm.
Current study
9.86 1540 6.40
Optical spectrum analyser with a resolution of
±0.07 nm
8.91 1540 5.78
FiberPro 7000 FBG interrogation system at
±0.001 nm resolution.
*Calculated values using BTK on the data reported.
Page 248
236
6.2.2 Strain sensitivity of Fabry-Perot interference sensor and
fibre Bragg grating sensor
The same sensor configuration was used to determine the resin shrinkage of the epoxy/amine
resin system. The experiment started at 30°C in air, mixed resin was injected at 30°C and
heated up to 60°C using the themo-control holder and cross-linking was carried out
isothermally at 60°C for 8 hours. After 8 hours, the system was cooled down to 30°C. The
resin shrinkage was measured using both embedded EFPI and FBG sensors.
1520 1530 1540 1550 1560 1570
0.0
2.0x10⁻⁶
4.0x10⁻⁶
6.0x10⁻⁶
8.0x10⁻⁶
1.0x10⁻⁵
Inte
nsity (
a.u
.)
Wave length (nm)
Before cross-linking at 30°C
After cross-linking at 30°C
Wavelength (nm)1520 1530 1540 1550 1560 1570
0.0
2.0x10⁻⁶
4.0x10⁻⁶
6.0x10⁻⁶
8.0x10⁻⁶
1.0x10⁻⁵
Inte
nsity (
a.u
.)
Wave length (nm)
Before cross-linking at 30°C
After cross-linking at 30°C
Wavelength (nm)
Figure 6.4 Typical EFPI fringes before and after cross-linking of LY3505/XB3403 resin system at 60oC
for 8 hours.
The change in FP cavity length due to resin shrinkage is clearly seen from the shift of fringe
pattern shown in Figure 6.4. The spectra were obtained using OSA and the longitudinal strain
applied on the EFPI sensor was determined using Equation 6.3. Based on EFPI-1 and EFPI-2
Page 249
237
sensors, measured compressive strain built up during processing of the epoxy/amine resin
system at 60 °C were 178 microstrain and 129 microstrain, respectively.
Figure 6.5 shows the Bragg peak shift of sealed and embedded sensors those located inside
the resin and recorded using the FibrePro interrogation unit. It can be clearly seen that the
embedded sensor (FBG-S2) shows Bragg peak shift due to both temperature and the stresses
built up in the resin during cross-linking reaction. On the other hand, the sealed sensors
(FBG-T2 and -T3) were sensitive only for the temperature of the system and the
corresponding Bragg peaks reverted back to the initial wavelength upon cooling back down to
30oC. Similar responses were recorded using the OSA. Equation 6.4 was used to obtained
strain measured using embedded FBG sensors. Response from the sealed FBG sensors was
used to determine the temperature effect on the Bragg peak shift of embedded FBG sensors
[169].
Strain build up during cross-linking was monitored via the OSA (FBG-S1) and the FibrePro
interrogation unit (FBG-S2) are shown in Figure 6.6. In comparison with the thermocouple
reading, it can be clearly seen that the resin shrinkage during cooling has major contribution
toward the total residual strain developed with in the cross-linked resin. The total resin
shrinkage after cooling down to 30°C was determined using FBG-S1 and FBG-S2 and the
residual compressive strain was calculated to be 320 microstrain and 309 microstrain,
respectively.
Page 250
238
0 120 240 360 480 600
-0.30
-0.15
0.00
0.15
0.30
Bra
gg p
eak s
hift
(B)
Time (minutes)
FBG-T2 (Bragg peak shift)
FBG-T3 (Bragg peak shift)
FBG-S2 (Bragg peak shift)
Cross-linking
Cooling
0 120 240 360 480 600
-0.30
-0.15
0.00
0.15
0.30
Bra
gg p
eak s
hift
(B)
Time (minutes)
FBG-T2 (Bragg peak shift)
FBG-T3 (Bragg peak shift)
FBG-S2 (Bragg peak shift)
Cross-linking
Cooling
Figure 6.5 Bragg peak shift of sealed and embedded FBGs those monitored via FibrePro interrogation
unit. The traces are recorded during cross-linking of LY3505/XB3403 resin system at 60oC for 8
hours and cooling down to 30oC.
0 120 240 360 480 600
-400
-300
-200
-100
0
100
30
35
40
45
50
55
60
65
Mic
rostr
ain
s (
)
Time (minutes)
FBG-S1 (OSA)
FBG-S2 (FiberPro)
Thermocouple
Term
ocouple
tem
pera
ture
(oC
)
Mic
rostr
ain
()
0 120 240 360 480 600
-400
-300
-200
-100
0
100
30
35
40
45
50
55
60
65
Mic
rostr
ain
s (
)
Time (minutes)
FBG-S1 (OSA)
FBG-S2 (FiberPro)
Thermocouple
Term
ocouple
tem
pera
ture
(oC
)
Mic
rostr
ain
()
Figure 6.6 Strain due to resin shrinkage in LY3505/XB3403 resin system during cross-linking at 60oC
for 8 hours and cooling down to 30oC. Temperature recorded using an independent thermocouple
is also presented.
Page 251
239
6.3 Monitoring of the cross-linking reactions
In situ monitoring of cross-linking reaction in the LY3505/XB3403 resin system was
performed using the multi-functional sensor design. This sensor design is capable of
monitoring the relative concentration of specified functional groups using near-infrared
spectroscopy, temperature, refractive index and strain during cross-linking of the resin system
[375,399,400]. The proof-of-concept for in situ monitoring of cross-linking reaction using the
fibre-optic multi-functional sensor was carried out at 60 oC for 8 hours.
6.3.1 Quantitative monitoring of the cross-linking reactions
Quantitative analysis of the cross-linking reaction was carried out using fibre-optic reflectance
spectroscopy. With reference to Section 3.7.3, one of the secondary fibres that was attached
to the multi-functional sensor was used as a fibre-optic reflectance sensor and the cavity
length of was 250 m. The evolution of the near-infrared spectra of the LY3505/XB3403
resin system during cross-linking at 60 oC is shown in Figure 6.7. All the relevant peaks are
similar to those described in Section 5.2. For example, the combination band of epoxy at
2207 nm, the combination band of primary amine at 2026 nm and the reference absorption
band of aromatic CH at 2164 nm, can be clearly seen. The depletion of the amine and the
epoxy functional groups is also readily apparent in Figure 6.7 as the cross-linking reaction
proceeds. The degree of conversion based on the concentration of epoxy groups was obtained
using Equation 5.11.
Page 252
240
However, it is apparent that repetitive fringe pattern is superimposed on the spectra due to the
multiple-beam reflections (see Section 5.2). The intensity of the fringes is higher than that
was observed from the spectral data presented previously and using fibre-optic reflection
spectroscopy with a cavity length of 500 m (see Figure 5.35). In the multi-functional sensor
design, the cavity length was set to be 250 m; as the cavity length decreases the intensity of
the Fabry-Perot interference increases. Although the light-coupling ratio of the sensor design
could be improved with decreasing cavity length, spectral quality decreases due to the
interference of the multiple-beam reflection at the sensing cavity. Further work is necessary
to optimise the cavity length for the sensor design.
Nanometres
Abso
rbance
units
0 minutes
18 minutes33 minutes 56 minutes
78 minutes 108 minutes146 minutes
221 minutes314 minutes480 minutes
12
13
7
15
11
17
1819
10
9
8
Nanometres
Abso
rbance
units
0 minutes
18 minutes33 minutes 56 minutes
78 minutes 108 minutes146 minutes
221 minutes314 minutes480 minutes
Nanometres
Abso
rbance
units
0 minutes
18 minutes33 minutes 56 minutes
78 minutes 108 minutes146 minutes
221 minutes314 minutes480 minutes
0 minutes
18 minutes33 minutes 56 minutes
78 minutes 108 minutes146 minutes
221 minutes314 minutes480 minutes
12
13
7
15
11
17
1819
10
9
8
Figure 6.7 Contour spectra recorded during cross-linking of the LY3505/XB3403 resin system at 60 oC
using a fibre-optic multi-functional sensor; see Table 5.1 for peak assignments.
Page 253
241
Figure 6.8 shows a comparison of the degree of epoxy conversion based on conventional
transmission FTIR spectroscopy and that obtained using the multi-functional sensor design
(secondary cavities). The data from the multi-functional sensor represents the average of two
repeat experiments. Good agreement was observed between the data obtained from the multi-
functional sensor and that from the conventional transmission FTIR spectroscopy.
0 120 240 360 480
0
20
40
60
80
100
De
gre
e o
f co
nve
rsio
n (
%)
Time (minutes)
Conventional transmission
FTIR spectroscopy
Secondary chemical sensor
(Multi-functional sensor)
Cross-linking time (minutes)
0 120 240 360 480
0
20
40
60
80
100
De
gre
e o
f co
nve
rsio
n (
%)
Time (minutes)
Conventional transmission
FTIR spectroscopy
Secondary chemical sensor
(Multi-functional sensor)
Cross-linking time (minutes)
Figure 6.8 a comparison of the degree of conversion of the LY3505/XB3403 resin system at 60 oC
based on the multi-functional sensor and the conventional transmission FTIR spectroscopy.
6.3.2 Qualitative monitoring of the cross-linking reactions
With reference to the multi functional sensor, as described in Figure 3.31, the intensity of the
reflected light from a pair of cleaved multi-mode optical fibres (distal ends of a 2 x 2 coupler)
was used to as a qualitative measure of the changes in the refractive index of the resin during
cross-linking. One of the secondary fibres that was mounted on the primary optical fibre of
Page 254
242
the multi-functional sensor was used as a Fresnel-based refractive index sensor. The
magnitude of the light reflects back due to Fresnel reflection at normal incidence to the
cleaved ends of the fibres is a function of the refractive index of the surrounding resin and this
can be expressed as:
2
sin
sin
core re
core re
n nR
n n Equation 6.5
where ncore and nresin are the refractive indices of the fibre core and the resin, respectively.
With respect to the FTIR-based interrogation of the Fresnel-based reflection sensor, the peak
amplitude of the interferogram corresponds to the intensity of the reflected light at the two
cleaved fibres immersed in the epoxy resin. The intensity of the reflected light at the
fibre/resin interface is a function of the difference between the refractive indices of the fibre
core and the resin system. The peak amplitude of the interferogram signal was used as a
measure of the intensity of reflected light and this was assumed to be equivalent to the change
in the refractive index of the resin during cross-linking.
Qualitative monitoring of the cross-linking reaction using the Fresnel-based reflection sensor
is presented in Figure 6.9. The Fresnel-based signal was compared with the degree of
conversion obtained using conventional transmission FTIR spectroscopy. The initial decrease
of signal amplitude can be attributed to a decrease in the refractive index of the resin mixture
when the system was heated from ambient to the required isothermal temperature. Cross-
linking of the epoxy/amine resin leads to an increase in the molecular weight, density and the
refractive index. The gradual increase followed by stabilization can be attributed to a gradual
increase and stabilization of refractive index as the extent of cross-linking approached near-
Page 255
243
completion. However, it is important to note that prior calibration is required to determine the
degree of conversion. The Fresnel-based sensor can only indicate the reaction rate and the end
point of the cross-linking reaction, at a specified temperature. Therefore the sensor can be
used to obtain qualitative information on the cross-linking reaction.
0 100 200 300 400 500
0
20
40
60
80
100
0 100 200 300 400 500
0.8
0.9
1.0
1.1
1.2
1.3
1.4
1.5
1.6
Degre
e o
f convers
ion (
%)
Time (minutes)
Conventional transmission
FTIR spectroscopy
Time (minutes)
Norm
alis
ed lig
ht
inte
nsity (
a.u
.)
Secondary Fresnel-based sensor
(Multi-functional sensor)
Cross-linking time (minutes)
Cross-linking time (minutes)
0 100 200 300 400 500
0
20
40
60
80
100
0 100 200 300 400 500
0.8
0.9
1.0
1.1
1.2
1.3
1.4
1.5
1.6
Degre
e o
f convers
ion (
%)
Time (minutes)
Conventional transmission
FTIR spectroscopy
Time (minutes)
Norm
alis
ed lig
ht
inte
nsity (
a.u
.)
Secondary Fresnel-based sensor
(Multi-functional sensor)
Cross-linking time (minutes)
Cross-linking time (minutes)
Figure 6.9 comparison of degree of conversion of LY3505/XB3403 resin system at 60 oC obtained
using the secondary Fresnel-based sensor and conventional transmission FTIR spectroscopy.
6.3.3 Simultaneous strain and temperature monitoring
One of the main objectives of using the multi-functional sensor design was interrogating the
whole sensor assembly using a single interrogation unit. Therefore the attention was also
focussed on the light-coupling efficiency of the internal light source of the FTIR spectrometer
in the EFPI/FBG sensor. In this set-up, the input fibre was connected to the internal light
source of the spectrometer. The response of the combined EFPI/FBG sensor, before and after
Page 256
244
cross-linking, at 60 oC is shown in Figure 6.10. It can be clearly seen that the spectral
resolution of the fringe pattern is relatively low. It was difficult to define the baseline of the
fringes due to spectral noise. This can be attributed to the insufficient light coupling from the
internal light source into the single-mode fibres. The optics of the spectrometer is designed
for focusing radiation into 600 m diameter optical fibres. Therefore the percentage of light
coupled into a single-mode fibre can be very low. This problem can be solved by using an
external light source.
Nanometres
Sin
gle
channe
l
1800 1700 1600 1500 1400 1300
0.0
00
15
0.0
00
05
0.0
00
10
0.0
00
20
0.0
00
25
Before cross-linking(at 30oC)
After cross-linking(at 60oC)
Nanometres
Sin
gle
channe
l
1800 1700 1600 1500 1400 1300
0.0
00
15
0.0
00
05
0.0
00
10
0.0
00
20
0.0
00
25
Nanometres
Sin
gle
channe
l
1800 1700 1600 1500 1400 1300
0.0
00
15
0.0
00
05
0.0
00
10
0.0
00
20
0.0
00
25
Before cross-linking(at 30oC)
After cross-linking(at 60oC)
Before cross-linking(at 30oC)
After cross-linking(at 60oC)
Figure 6.10 Response of a combined EFPI/FBG sensor before and after cross-linking of the
LY3505/XB3403 resin system at 60 oC obtained using the internal light source of the FTIR
spectrometer.
In an alternative set-up, the combined EFPI/FBG sensor was illuminated using an external
ASE light source. Interrogation was carried out using the InGaAs detector on the
Page 257
245
spectrometer. The spectral response of the primary FP cavity and the Bragg grating at the
start and end of cross-linking reaction at room temperature are shown in Figure 6.11. The
inset shows an expanded view where the superimposed FBG peaks are readily visible. It can
be seen that the visibility of the fringe pattern is higher compared with that obtained using the
internal light source of the spectrometer.
1450 1500 1550 1600
0.000
0.005
0.010
0.015
0.020
0.025
0.030
Inte
nsity (
a.u
.)
Wavelength (nm)
Before cross-linking
After cross-linking
1530 1540 1550
0.0200
0.0225
0.0250
0.0275
Before cross-linking
After cross-linking
Wavelength (nm)
Inte
nsity (
a.u
.)
Bragg
peak
1450 1500 1550 1600
0.000
0.005
0.010
0.015
0.020
0.025
0.030
Inte
nsity (
a.u
.)
Wavelength (nm)
Before cross-linking
After cross-linking
1530 1540 1550
0.0200
0.0225
0.0250
0.0275
Before cross-linking
After cross-linking
Wavelength (nm)
Inte
nsity (
a.u
.)
Bragg
peak
Figure 6.11 Response of a combined EFPI/FBG sensor before and after cross-linking of the
LY3505/XB3403 resin system at 60 oC obtained using the external ASE light source.
With reference to the Figure 3.32, the Bragg grating that was inscribed in the primary fibre
(located within the cavity) is in a strain-free condition and therefore any shift in the Bragg
reflection peak corresponds only to a change in the temperature. This can be clearly seen
from Figure 6.11, where no peak shift was observed before and after cross-linking of the resin
at room temperature.
Page 258
246
A Bragg reflection peak shift of 0.3 nm towards a longer wavelength was observed when the
temperature of the resin was raised by 34.6 °C to the isothermal reaction temperature of 60°C.
This shift was found to be in good agreement with the Ge-B co-doped Bragg grating
temperature sensitivity of 8.59 pm K-1
[388]. The Bragg reflection peak was restored to its
initial wavelength when the cross-linked resin was cooled back to room temperature. This
demonstrates that the Bragg grating was maintained in a strain-free state during the cross-
linking reaction. Figure 6.11 shows the shift of FP interference fringe pattern as a result of
the change in the primary FP cavity length due to residual strain and resin shrinkage. The
cavity lengths corresponding to before and after cross-linking of the resin system at room
temperature were found to be 55.72 mm and 50.15 mm, respectively (see Equation 6.2). The
gauge length of the sensors was approximately 36 mm and the compressive residual strain due
to process-induced shrinkage of the resin was estimated to be in the range of 150 - 200
microstrain.
6.4 Conclusions
Feasibility of using a new multi-functional sensor design was investigated for monitoring of
the cross-linking reactions of thermosetting resins. An attempt was also made to characterise
the temperature and strain sensitivity of the EFPI and FBG sensors that were used in the
multi-functional sensor design as a combined strain and temperature sensor. The temperature
and strain sensitivity during step-temperature ramp in air and also during the cross-linking of
the LY3505/XB3403 resin system at 60 oC was investigated. However, in-depth study of the
interference of the individual sensor responses on each other is essential in order to generate
accurate results using the combined sensor design.
Page 259
247
In addition, the multi-functional sensor design was used for monitoring of the cross-linking
reactions of the epoxy/amine resin system. Issues related to sensor interrogation of combined
FBG/EFPI sensor was also discussed. The degree of conversion obtained based on secondary
chemical sensor and secondary Fresnal-based sensor showed good correlation with that
obtained using conventional transmission spectroscopy. Residual resin shrinkage developed
in the cross-linked resin due to cooling down from reaction temperature to ambient
temperature was also determined using the primary EFPI sensor.
Page 260
248
Chapter 7
Moisture ingress monitoring using
conventional techniques
7 Overview
7.1 Introduction
A wide range of analytical techniques has been used for monitoring the absorption kinetics of
epoxy/amine resin systems. In the current study, gravimetry, thermo gravimetric analysis
(TGA), differential scanning calorimetry (DSC), dynamic mechanical thermal analysis
(DMTA) and conventional transmission Fourier transform near-infrared (FTIR) spectroscopy
were used to characterise the absorption of water in the LY3505/XB3403 epoxy/amine resin
system. The experiments were carried out at different immersion temperatures and 100%
relative humidity (RH). The aims of this study were as follows:
To determine absorption behaviour and equilibrium moisture content in a cross-linked
epoxy/amine resin system using gravimetry as a function of immersion time and
temperature.
Page 261
249
To predict the sorption kinetics of the cross-linked epoxy/amine resin system using an
appropriate diffusion model.
To determine the effect of hygrothermal ageing on the thermal, physical, viscoelastic
and chemical properties of the cross-linked epoxy/amine resin system.
7.2 Gravimetric method
7.2.1 Kinetics of water absorption
Primary absorption experiments were carried out in order to obtain the overall characteristics
of the absorption behaviour of water in the LY3505/XB3403 resin system at different
immersion times and temperatures and at 100 % RH. The hygrothermal ageing experiments
were carried out in distilled water at 30, 50 and 70 °C. The epoxy resin system was cast
between glass plates and cross-linked at 60 °C for 8 hours (see Section 3.8.1.1). Prior to
immersion, the as-cast specimens were dried in a dessiccator oven at 50 °C. The drying
period was set to approximately eight weeks. The percentage weight loss of the specimens,
ΔM was calculated using the following equation:
%1000
0
W
WWM t
Equation 7.1
where W0 is the initial weight of the specimen and Wt is the weight of the specimen at a given
drying time. Typical weight losses observed with five specimens during the drying process
are shown in Figure 7.1. The change in weight of cross-linked epoxy at temperatures below
Tg could be mainly due to two reasons, evaporation of absorbed moisture and loss of low-
Page 262
250
molecular weight components. Due to time constraints, the drying experiments were
terminated when the recorded mass-loss was approximately 0.03 % over two consecutive
weeks. A similar trend was observed for all the other specimens used in this study. The
samples with this preconditioned state were used for all the water uptake experiments.
-0.4
-0.3
-0.2
-0.1
0.0
0 5 10 15 20 25 30 35 40
Time1/2
(hours1/2
)
Pe
rce
nta
ge
we
igh
t
ch
an
ge (
%)
Specimen-1
Specimen-2
Specimen-3
Specimen-4
Specimen-5
Figure 7.1 Percentage weight change of specimens of the LY3505/XB3403 resin system that conditioned
at 50 °C for 8 weeks. The specimens were cross-linked at 60 °C for 8 hours.
The absorption behaviour of the cross-linked epoxy resin after immersion in distilled water at
70 °C is shown in Figure 7.2. The percentage weight gain was plotted against the square root
of immersion time (normalised to the thickness, L of the specimen). A negligible weight
change was observed during the weighing process of the conditioned specimens; this
operation took approximately 5 minutes. An attempt was taken to quantify the weight change
whilst the specimens were left at room temperature, in air, for periodic weighing. A sample
each was removed from the water-baths that were set at 30, 50 and 70 °C. These samples
were transferred to a dessicator for approximately 2 minutes prior recording their individual
Page 263
251
masses. The results from these experiments are presented in Figure 7.3. Maximum weight-
loss was observed with the specimen that was conditioned at 30 °C and was found to be
0.00015% after 16 minutes of exposure to air at room temperature. Therefore the weight-loss
during the weighing process can be neglected.
0.000
0.500
1.000
1.500
2.000
2.500
3.000
3.500
0 5 10 15 20 25 30
Time1/2
/thickness (hours1/2
/mm)
Perc
en
tage
weig
ht ga
in (
%)
Specimen-1
Specimen-2
Specimen-3
Specimen-4
Specimen-5
Figure 7.2 Absorption isotherms of water in the LY3505/XB3403 resin system at 70 °C for 20 weeks.
The thickness of the test specimen was made small when compared to the width and length;
the dimensions of the specimens were 50 x 50 x 2 mm. The ratio of the edge surface area to
the total surface area was only 7%. Therefore, the edge effects can be ignored and simple one-
dimensional diffusion can be assumed without incurring significant error [250].
Page 264
252
0 2 4 6 8 10 12 14 16 18
-0.00002
0.00000
0.00002
0.00004
0.00006
0.00008
0.00010
0.00012
0.00014
0.00016
Room temprature:
22.8 - 22.6oC
30oC
50oC
70oC
Perc
enta
ge w
eig
ht
loss (
%)
Time (minutes)t =
10
min
ute
s
Figure 7.3 Percentage weight-loss of the hygrothermally conditioned specimens during weighing
measurements at room temperature.
Figure 7.4 shows the sorption isotherms obtained for the diffusion of water in to the
epoxy/amine resin system at different immersion temperatures. Each isotherm represents the
average weight gain from five specimens, which were conditioned under identical conditions.
The equilibrium moisture contents (M∞) achieved over 2, 9 and 33 weeks, at 70, 50 and 30 oC,
respectively were found to be similar irrespective of the immersion temperatures. However,
in the case of the samples that were conditioned at 30 °C, the weight gain was seen to increase
slowly with immersion time. This may be indicative of the fact that equilibrium moisture
content was not achieved at this temperature. However, at longer immersion times at 30 oC, a
slow positive deviation from Fickian equilibrium state was observed. At lower temperatures,
such continuous slow absorption processes were reported [17] and this could be attributed to
either slow relaxation processes of the glassy epoxy network or a more complex, absorption
Page 265
253
mechanism which involves an interchange of water „cluster‟ sizes in the free volume as a
function of time and amount of water uptake [401]. The M∞ values of the epoxy resin system
at each immersion temperature are given in Table 7.1. This absorption behaviour illustrated
in Figure 7.4 indicates that the moisture diffusion in the LY3505/XB3403 resin system is
Fickian in nature [250,402]. This is in good agreement with the absorption model applied for
epoxy/diamine systems [263].
0
0.5
1
1.5
2
2.5
3
3.5
0 10 20 30 40 50 60 70
Time1/2
/thickness (hour1/2
/mm)
Perc
enta
ge w
eig
ht
ga
in (
%)
30°C
50°C
70°C
Figure 7.4 Absorption isotherms of water in the LY3505/XB3403 epoxy system at 30, 50 and 70 oC.
Equilibrium moisture content obtained for the epoxy/amine resin system is in good agreement
with the values reported by Apicella et al. [267], Soles et al. [246], Wu et al. [279], Maggana
and Pissis [403], Abdelkadar and White [277] and DéNève and Shanahan [312] for similar
resin systems and for similar hygrothermal conditions. Li et al. [249] also observed similar
equilibrium moisture content for a DGEBA/DDS system at 40 oC and 100 % RH.
Page 266
254
Fick's second law of diffusion has been widely used to model the sorption kinetics of epoxy
resin systems. The diffusion coefficients of the epoxy/amine resin system related to each
immersion temperature can be calculated using the Fickian diffusion equation. In the case of
isotropic thin plates where L<<width and L<<length, the moisture entering the parallelepiped
specimen through the edges can be neglected. Using appropriate boundary conditions, a one-
dimensional analytical solution proposed by Shen and Springer [255] can be applied to
explain the absorption kinetics of the epoxy/amine resin system (see Equation 2.24). For
short times, Equation 2.24 can be approximated to Equation 2.25. In Figure 7.5, tM M was
plotted against t L for the epoxy/amine system at different immersion temperatures. D can
then be experimentally obtained from the initial slope of the curves and the values for
absorption of water at each immersion temperature are given in Table 7.1. These results are
in reasonable agreement with the values reported in the literature [257,249].
0
0.2
0.4
0.6
0.8
1
0 10 20 30 40 50 60 70
Time1/2
/Thickness (hours1/2
/mm)
Mt /
M∞
30°C
50°C
70°C
Figure 7.5 Plots of tM M versus t L for moisture absorption in the LY3505/XB3403 epoxy system
conditioned at 30, 50 and 70 oC.
Page 267
255
It can be seen that D varies with temperature, and is expected to follow the classic Arrhenius
behaviour:
0 exp dQD D
RT Equation 7.2
where D0 is the temperature-independent pre-exponential factor, Qd is the activation energy
for diffusion, R is the universal gas constant and T is the temperature in K.
Figure 7.6 shows the Arrhenius plot for the diffusion coefficients where a linear relationship
was observed. The activation energy for the diffusion of water in to the epoxy/amine resin
system was obtained to be 67.89 kJmol-1
. These results are in good agreement with the values
published in the literature [404,312].
Table 7.1 Summary of sorption kinetics of water in LY3505/XB3403 resin system at different immersion
temperatures.
Immersion temperature
(oC)
Equilibrium moisture
Content (%)
Diffusion constant,
D x 10-6
(mm2 sec
-1)
30 3.028±0.030 0.127±0.008
50 3.071±0.022 0.629±0.013
70 3.126±0.055 3.006±0.017
Page 268
256
0.0028 0.0029 0.0030 0.0031 0.0032 0.0033 0.0034
-17
-16
-15
-14
-13
-12
ln(D
)
1/T (oK
-1)
Test data
Y = -8218.99 x + 11.21,
Std. dev. = 0.07, R2 = 0.99
Figure 7.6 Arrhenius dependence of the diffusion coefficients of the LY3505/XB3403 epoxy resin
system conditioned at 30, 50 and 70 oC.
7.2.2 Determination of the through-thickness concentration profile
of the absorbed moisture
Understanding the distribution of absorbed moisture in polymers as a function of time is
important, especially in coating and adhesive applications where design optimisation is
paramount to achieve desired physical and mechanical properties [405,406,407,408]. Even
though through-thickness moisture diffusion phenomena in polymers have been explored
widely, less attention has been paid on modelling the profile of a diffusion front within a
material. Mathematical models that have been used for predicting the moisture diffusion
profiles in epoxy resins include: integral solutions [409,410,411,292], finite element analysis
Page 269
257
[412,413,268] and numerical methods [405,414,415]. Deuterium has also been used to track
the concentration profiles in an epoxy-based composite [406].
Crank [260] discussed a wide range of mathematical approaches for predicting the water
concentration profiles with in a material depending on the sorption kinetics and initial and
boundary conditions. In solving mass transfer problems, numerical solutions said to offer
many advantages such as accurate modelling of experimental and practical situations [416].
In this study, the Crank-Nicolson implicit method based on a finite-difference solution was
used to model the through-thickness concentration profiles within the epoxy/amine resin
system. The one-dimensional Fickian diffusion in the resin with constant diffusivity was
considered (see Section 2.4.2.1). Equation 2.23 can be generalised by substituting non-
dimensional variables and the modified equation is given by:
2
2
C CD
T X Equation 7.3
where 0
cC
c ,
2
DtT
L,
xX
L, x is the distance along the thickness of a membrane, D is
diffusivity/diffusion coefficient, c is the concentration of diffusing species and t is time and L
is the thickness of the epoxy specimen.
Equation 7.2 forms a linear parabolic differential equation and the Crank-Nicolson implicit
method gives a more accurate solution with no restrictions on the size of the time step
compared with other finite-difference solutions [120,260,416]. As shown in Figure 7.7, the
Page 270
258
thickness of the specimen was divided into equal slices of thickness x and the co-ordinates
(x,t) of the representative mesh point P were considered as:
x iL ; 2L
t jD
Hence using the Crank-Nicolson implicit method, the finite-difference approximation for
Equation 7.2 is given by:
, 1 1, 1 1, 1 1, , 1,(2 2 ) (2 2 )i j i j i j i j i j i jr C rC rC rC r C rC Equation 7.4
where 2( )
Tr
X
By assuming 1
10X and
1
100T , Equation 7.3 can be simplified as below [417]:
1, 1 , 1 1, 1 1, 1,4i j i j i j i j i jC C C C C Equation 7.5
where
(i) t = 0, C = 1 for x = 0 and C = 0 for x > 0,
(ii) t ≥ 0, C = 1 for x = 0 and x = 1
Page 271
259
P
i,j i+1,ji-1,j
i,j+1
x
t
x
t
P
i,j i+1,ji-1,j
i,j+1
P
i,j i+1,ji-1,j
i,j+1
x
t
x
t
Figure 7.7 A representative mesh along the thickness of the specimen used for the Crank-Nicolson
method.
This approach was used to generate the concentration profiles (iso-time lines) for absorption
at 30o, 50
o and 70
oC as shown in Figure 7.8, Figure 7.9 and Figure 7.10, respectively. A steep
water concentration gradient was observed next to the surface at the beginning of the ageing
process. Table 7.2 presents a summary of the predicted and experimentally derived (based on
gravimetric measurements) immersion times for the resin system to attain 90% saturation at
30, 50 and 70 °C. A good correlation was observed between the two techniques for the three
temperatures investigated.
Page 272
260
0
0.2
0.4
0.6
0.8
1
0 0.2 0.4 0.6 0.8 1
x/L
Fra
ctional m
ois
ture
concentr
ation, C
97.6 hours
195.1 hours
292.7 hours
390.2 hours
487.8 hours
585.4 hours
683 hours
780.5 hours
975.6 hours
1268.3 hours
1561 hours
1951.2 hours
2146.3 hours
Figure 7.8 The fractional concentration profiles through the thickness of the epoxy/amine resin system at
30 oC.
0
0.2
0.4
0.6
0.8
1
0 0.2 0.4 0.6 0.8 1
x/L
Fra
ctional m
ois
ture
concentr
ation, C
20 hours
40.2 hours
60.3 hours
80.4 hours
100.6 hours
120.7 hours
140.8 hours
161 hours
201.1 hours
261.4 hours
321.8 hours
402.2 hours
442.4 hours
Figure 7.9 The fractional concentration profiles through the thickness of the epoxy/amine resin system at
50 oC.
Page 273
261
0
0.2
0.4
0.6
0.8
1
0 0.2 0.4 0.6 0.8 1
x/L
Fra
ctional m
ois
ture
concentr
ation, C
4.67 hours
9.34 hours
14 hours
18.68 hours
23.35 hours
28 hours
32.69 hours
37.36 hours
46.7 hours
60.71 hours
74.2 hours
93.4 hours
102.74 hours
Figure 7.10 The fractional concentration profiles through the thickness of the epoxy/amine resin system
at 70 oC.
Table 7.2 Comparison of experimental and predicted immersion times for the LY3505/XB3403
epoxy/amine resin system to attain 90% saturation.
Immersion temperature
(oC)
Time taken to reached to 90 % saturation (hours)
Experimental data Predicted data
(Equation 7.4)
30 119.0 116.8
50 521.0 502.8
70 2937.0 2439.1
Page 274
262
7.3 Effect of hygrothermal conditioning on the properties
of the epoxy/amine resin system
Absorption isotherms obtained using preliminary gravimetric measurements at 30, 50 and 70
oC were used as a basis for subsequent measurements based on TGA, DSC, DMTA and FTIR
spectroscopy. DMTA specimens of dimension 10 mm x 50 mm x 2 mm were used for all
the experiments. With reference to Figure 6.11, the effect of hygrothermal ageing on thermal,
chemical and viscoelastic properties was measured at eight points along the absorption
isotherms for each immersion temperature. The gravimetric experiments were also carried
out for the DMTA specimens and also for a set of reference specimens, which have the same
dimensions (50 x 50 x 2 mm) as previous gravimetric specimens, in order to correlate water
uptake at the three temperatures directly with the two sets of experiments. Figure 7.11 shows
a typical representation of the spread of measurements along the absorption isotherm at 70 oC.
Emphasis was given to test more points along the initial linear portion of the absorption curve.
It can be clearly seen that the gravimetric measurements of two sets of experiments fit very
well. The slight deviation of the percentage weight increase of the DMTA specimens could
be attributed to edge effects in the specimens. The data points corresponding to DMTA and
reference gravimetric data show the average weight gain of three specimens. The same
procedure was followed for choosing measurement points along the sorption isotherms at 30o
and 50 oC and the spread of measurement points are shown in Figure 7.12 and Figure 7.13,
respectively.
Page 275
263
0
0.5
1
1.5
2
2.5
3
3.5
0 5 10 15 20 25
Time1/2
/Thickness (hour1/2
/mm)
Pe
rce
nta
ge
we
igh
t g
ain
(%
)
DMTA specimens
Gravimetric measurements
Reference specimens
2 hours
24.5 hours
0 hour
48.5 hours
72.5 hours
16 days 35 days 98 days
0
0.5
1
1.5
2
2.5
3
3.5
0 5 10 15 20 25
Time1/2
/Thickness (hour1/2
/mm)
Pe
rce
nta
ge
we
igh
t g
ain
(%
)
DMTA specimens
Gravimetric measurements
Reference specimens
2 hours
24.5 hours
0 hour
48.5 hours
72.5 hours
16 days 35 days 98 days
Figure 7.11 Spread of measurements along the sorption isotherm of the LY3505/XB3403 epoxy resin
system conditioned at 70 oC.
0
0.5
1
1.5
2
2.5
3
3.5
0 5 10 15 20 25 30 35
Time1/2
/Thickness (hour1/2
/mm)
Perc
enta
ge w
eig
ht gain
(%
)
DMTA specimens
Gravimetric measurements
Reference specimens
24 hours
4 days
0 hour
8 days
11 days
33 days
68 days 134 days
0
0.5
1
1.5
2
2.5
3
3.5
0 5 10 15 20 25 30 35
Time1/2
/Thickness (hour1/2
/mm)
Perc
enta
ge w
eig
ht gain
(%
)
DMTA specimens
Gravimetric measurements
Reference specimens
24 hours
4 days
0 hour
8 days
11 days
33 days
68 days 134 days
Figure 7.12 Spread of measurements along the sorption isotherm of the LY3505/XB3403 epoxy resin
system conditioned at 50 oC.
Page 276
264
0
0.5
1
1.5
2
2.5
3
3.5
0 10 20 30 40 50
Time1/2
/Thickness (hour1/2
/mm)
Perc
enta
ge w
eig
ht gain
(%
)
DMTA specimens
Gravimetric measurements
Reference specimens
3 days
10 days
0 hour
20 days
39 days
119 days
209 days
320 days
0
0.5
1
1.5
2
2.5
3
3.5
0 10 20 30 40 50
Time1/2
/Thickness (hour1/2
/mm)
Perc
enta
ge w
eig
ht gain
(%
)
DMTA specimens
Gravimetric measurements
Reference specimens
3 days
10 days
0 hour
20 days
39 days
119 days
209 days
320 days
Figure 7.13 Spread of measurements along the sorption isotherm of the LY3505/XB3403 epoxy resin
system conditioned at 30 oC.
7.3.1 Thermo gravimetric analysis
TGA of the aged specimens was performed after predetermined immersion times at 30, 50
and 70 °C as explained in the previous section. Since the analysis requires approximately 15
mg of the material, a corner piece of an aged DMTA specimen was cut as shown in Figure
3.23. The TGA experiments were performed to obtain information on desorption behaviour
of the epoxy/amine resin after isothermal conditioning at specified temperatures. The sample
was heated from 30 to 180 °C at 5 °C/minute in air. Figure 7.14(a) shows the percentage
weight-loss obtained from the sample as a function of the immersion time and the
temperature. Only one specimen per immersion time at each immersion temperature was
tested. A comparison between the amount of absorbed moisture during isothermal immersion
Page 277
265
experiments (Figure 7.14(b)) and the corresponding amount of desorbed water at 180 °C
during TGA measurements (Figure 7.14(a)) is shown for ease of analysis.
0 10 20 30 40
0
1
2
3
0 10 20 30 40
-4
-3
-2
-1
0
Perc
enta
ge w
eig
ht
gain
(%
)
Time1/2
/thickness (hours1/2
/mm)
30oC
50oC
70oC
Perc
enta
ge w
eig
ht
ch
an
ge
(%
)
30oC
50oC
70oC
(a) TGA
(b) Gravimetry
0 10 20 30 40
0
1
2
3
0 10 20 30 40
-4
-3
-2
-1
0
Perc
enta
ge w
eig
ht
gain
(%
)
Time1/2
/thickness (hours1/2
/mm)
30oC
50oC
70oC
Perc
enta
ge w
eig
ht
ch
an
ge
(%
)
30oC
50oC
70oC
(a) TGA
(b) Gravimetry
Figure 7.14 (a) Percentage weight loss obtained from TGA traces at 180oC for the LY3505/XB3403
resin system that conditioned at 30o, 50
o and 70
oC and (b) corresponding gravimetric sorption
isotherms; data points were joined to highlight the trend.
With reference to the specimens that were conditioned at 30 and 50 °C, the weight losses
from the TGA scans measured at 180 °C were similar to the weight uptake of the
epoxy/amine resin system at respective immersion times. However, higher weight losses at
180 °C were observed with the epoxy/amine resin conditioned at 70°C for longer immersion
times. This could be due to the thermal degradation of the resin or due to the leaching of low
molecular-weight species at elevated temperatures [267,312,164]. Water ingress into a
Page 278
266
polymer matrix leads to a range of effects such as plasticisation through interaction of the
water molecules with polar groups in the cross-linked network, creation of micro-crazes,
leaching of unreacted monomer and in certain cases degradation of the resin [302].
However, it was highlighted that the discrepancies involved in specimen dimensions and
sample preparation for TGA may lead to different desorption rates during thermal scanning
[314]. In addition, in the current study, evaporation of absorbed moisture during temperature
scanning may interfere with the weight losses due to hygrothermal degradation. In particular,
due to the small sample size, different specimen dimensions may show a considerable
deviation from the real desorption behaviour of the bulk material under the same desorption
conditions. Therefore predicting the actual weight losses and/or thermal degradation of the
aged epoxy/amine resin under elevated temperatures in terms of the weight losses obtained
using TGA, may not be accurate.
7.3.2 Differential scanning calorimetry
DSC is an accepted method for studying changes in the thermal properties of materials due to
physical and chemical processes. In this study, DSC analyses were used to investigate the
effect of conditioning temperature and immersion time on the glass transition temperature (Tg)
of the LY3505/XB3403 epoxy/amine system. The test specimens used in the DSC
experiments were similar to that described in Section 7.3.1 (see Figure 3.23) for the TGA
experiments. However, each data point presented in the DSC analysis is an average of three
independent experiments.
Page 279
267
Figure 7.15(a) shows typical DSC traces obtained for the un-aged epoxy/amine resin before
immersion. Figure 7.15(b) illustrates typical DSC traces for the specimens that were
conditioned at 70 oC for different immersion times. The approximate moisture content in the
specimens at specified immersion times can be inferred from Figure 7.11. The data points
were taken every 0.4 s. This is equivalent to 16 data points/oC. The temperature range studied
was 30 - 140 oC.
(a)
20 40 60 80 100 120 140 160
0
2
4
6
20 40 60 80 100 120 140 160
0.0
0.5
1.0
Heat flow
(endo u
pw
ard
)
Temperature (oC)
Point-2
Point-3
Point-4
Point-5
Point-6
Point-7
Point-8
Point-1
Temperature (oC)
(b)2 hours
24.5 hours
48.5 hours
72.5 hours
16 days
35 days
98 days
0 hours
1st scan
(a)
20 40 60 80 100 120 140 160
0
2
4
6
20 40 60 80 100 120 140 160
0.0
0.5
1.0
Heat flow
(endo u
pw
ard
)
Temperature (oC)
Point-2
Point-3
Point-4
Point-5
Point-6
Point-7
Point-8
Point-1
Temperature (oC)20 40 60 80 100 120 140 160
0
2
4
6
20 40 60 80 100 120 140 160
0.0
0.5
1.0
Heat flow
(endo u
pw
ard
)
Temperature (oC)
Point-2
Point-3
Point-4
Point-5
Point-6
Point-7
Point-8
Point-1
Temperature (oC)
(b)2 hours
24.5 hours
48.5 hours
72.5 hours
16 days
35 days
98 days
0 hours
1st scan
Figure 7.15 Dynamic thermograms from DSC for the LY3505/XB3403 resin system: (a) DSC trace for
un-aged epoxy resin and (b) DSC traces for aged epoxy resin that were conditioned at 70 oC for
different immersion time.
Page 280
268
With reference to Figure 7.15, it is apparent that defining the Tg on the basis of the inflection
point of the endothermic-step transition is not possible. The un-aged specimens show an
endothermic “physical aging” peak due to network relaxation related to the preconditioning
before the hygrothermal ageing experiments. In the case of the environmentally conditioned
specimens, the endothermic step transition associated with glass transition of the resin
overlapped with the onset of a broad endothermic peak. This peak could be attributed to the
evaporation of absorbed moisture in the epoxy/amine resin. The same features have observed
with the DSC traces recorded for the epoxy/amine resin conditioned at 30 and 50 oC.
Therefore in this study, the onset of the glass transition of DSC traces was defined as the
temperature corresponding to un-aged or aged epoxy/amine resin [297].
The analyses indicated that the Tg varies, depending on the hygrothermal ageing conditions, as
shown in Figure 7.16. It was seen that the Tg decreases due to absorbed moisture followed by
a steady increase at all the conditioning temperatures. The main decrease in Tg can attributed
to plasticisation of the matrix. The formation of intermolecular hydrogen bonds between
water and polymer molecules, and interruption of intramolecular bonds between polymer
chains, can reduce the glass transition temperature [297,298,302,418,419,251]. The initial
rate of depression of the Tg is higher at high immersion temperatures. The Tg is seen to reduce
from 70.1 °C – 53.2 °C for the samples that were conditioned in water at 70 °C. Similar
trends have been reported in the literature [297,14].
Page 281
269
(a) DSC
(b) Gravimetry
0 10 20 30 40
0
1
2
3
0 10 20 30 40
50
55
60
65
70
75
80
Perc
enta
ge w
eig
ht
gain
(%
)
Time1/2
/thickness (hours1/2
/mm)
30oC
50oC
70oC
Gla
ss t
ransitio
n t
em
pera
ture
,
Tg (
oC
)
30oC
50oC
70oC
(a) DSC
(b) Gravimetry
0 10 20 30 40
0
1
2
3
0 10 20 30 40
50
55
60
65
70
75
80
Perc
enta
ge w
eig
ht
gain
(%
)
Time1/2
/thickness (hours1/2
/mm)
30oC
50oC
70oC
Gla
ss t
ransitio
n t
em
pera
ture
,
Tg (
oC
)
30oC
50oC
70oC
Figure 7.16 (a) Change in Tg of the LY3505/XB3403 resin system that conditioned at 30, 50 and 70 oC
as a function of immersion time and (b) Corresponding gravimetric sorption isotherms; data points
were joined to highlight the trend.
After the initial rapid lowering on the Tg, a gradual but higher reduction in Tg can be seen at
lower immersion temperatures. Figure 7.16(b) illustrates the percentage weight gain for the
neat-resin specimens that were immersed in water at 30, 50 and 70 oC, as a function of time.
The corresponding lowering of the Tg due to plasticisation of the epoxy resin is shown in
Figure 7.16(a).
In Figure 7.16(a), the rate of decrease in the Tg was seen to be explained by the conditioning
temperature in water. In other wards, the rate of decrease in the Tg was greater at 70 oC
Page 282
270
followed by 50 oC and 30
oC conditioning temperatures. However, the Tg for the dry
specimen (not conditioned in water) that was subsequently immersed in water at 70 oC was
approximately 70 oC. The reason for this was not established but the batches of the neat resin
were cross-linked at 60 oC. Therefore it is difficult to explain the lower Tg at t = 0 for the
conditioned specimens at 70 oC.
The effect of normalising the Tg data for the conditioned specimens in water at specified
immersion temperatures is shown in Figure 7.17. Here, the Tg data per batch of specimens
was normalised to the Tg at t = 0, i.e. the Tg of the unconditioned specimens. The normalised
data suggested that the initial rate of decrease in the Tg is similar for the specimens
conditioned at 50 and 70 oC. Tg of the specimens conditioned at 30
oC showed a slower rate
of decrease. However, interestingly the normalised Tg after approximately 48 hours was
higher for the specimens conditioned at 70 oC. This trend has followed by the specimens
conditioned at 50 and 30 oC. With reference to Figure 7.17, it is surprising to note that the
specimens that were conditioned at 70 and 50 oC showed a similar rate of decrease in Tg up to
approximately 24 hours of immersion. This may be due to the fact that the Tg recorded over
the initial conditioning period was infrequent compared with the specimens that were
conditioned at 30 and 70 oC. Other possible features such as inadequate mixing of the resin
and the cross-linking agent, deviations from the stoichiometry and error in the processing
temperature have been excluded as the experimental procedures were followed methodically.
Page 283
271
0 10 20 30 40
0.70
0.75
0.80
0.85
0.90
0.95
1.00
Time1/2
/thickness (hours1/2
/mm)
No
rma
lise
d
gla
ss t
ran
sitio
n t
em
pe
ratu
re (
oC
)
30oC
50oC
70oC
Figure 7.17 Decrease in normalised Tg of the LY3505/XB3403 resin system that conditioned at 30, 50
and 70 oC as a function of immersion time; data points were joined to highlight the trend.
In Figure 7.17, other researchers have observed that the Tg to increase with prolong
conditioning time [297]. This has been attributed to increased densification in the resin
system and physical aging. The situation with the specimens that were conditioned at 70 oC is
more complicated as they were cross-linked at 60 oC. Therefore, conditioning at 70
oC in
water will entirely lead to plasticisation followed by possible densification. Regretfully, these
findings were not investigated further due to time limitations.
As mentioned in the preceding section, a more accurate comparison between the Tg of the
aged epoxy/amine resin as measured by DSC, is not possible. Since analysis of DSC
thermogram is based on the assumption that the mass of the specimen remained same during
Page 284
272
DSC scan, disorption of absorbed moisture may interfere with the glass transition of the resin.
Hence, a definite conclusion on the change in Tg cannot be drawn from these results.
7.3.3 Dynamic mechanical thermal analysis
DMTA is an established technique for characterising the Tg of polymeric materials. DMTA
has been identified as a more sensitive technique for measuring change Tg due to
hygrothermal aging [279]. Typical traces of log E’, log E” and tan related to an un-aged
epoxy specimen obtained from dynamic temperature scan at 1 Hz are shown in Figure 7.18.
4
5
6
7
8
9
10
0 20 40 60 80 100 120 140 160
Temperature (oC)
Log E
' or
E"
(Pa)
0
0.2
0.4
0.6
0.8
1
1.2
1.4
1.6
Loss tangent (t
an
Log E"
Log E'
Loss tangent
Figure 7.18 Dynamic temperature scan of log E”, log E’ and loss tangent obtained for the un-aged
LY3505/XB3403 resin system at 1 Hz.
Page 285
273
In the DMTA analysis, the temperature related to the maximum peak height of the log E”
trace has been recommended as a suitable method for defining the Tg of polymers [420]. As
can be seen from Figure 7.19, the viscoelastic nature of the cross-linked resin is illustrated by
the shift of the log E” response to higher temperatures by increasing frequencies. This
behaviour was also observed from the E’ and loss tangent for all the DMTA analyses.
Especially at lower frequencies, the thermal and viscoelastic properties obtained from DMTA
are said to be specific to the material [420]. Therefore, for comparison of the Tg obtained
based on DSC and DMTA techniques, the dynamic moduli and tan traces that obtained at 1
Hz were considered.
4.5
5
5.5
6
6.5
7
7.5
8
8.5
9
9.5
0 20 40 60 80 100 120 140 160
Temperature (oC)
Log E
"(lo
ss m
odulu
s),
Pa
1 hz
10 hz
30 hz
Figure 7.19 Frequency dependence of Log E” traces obtained from DMTA for the un-aged
LY3505/XB3403 resin system at 1, 10 and 30 Hz.
The influence of hygrothermal aging on the storage modulus of the epoxy/amine resin
conditioned at 70 °C is shown in Figure 7.20. The relative moisture content in the
Page 286
274
specimens can be inferred from Figure 7.11. Similar behaviour was observed for the
epoxy/amine resin aged at 30° and 50 °C immersion temperatures.
7.25
7.75
8.25
8.75
9.25
9.75
0 20 40 60 80 100 120 140 160
Temperature (oC)
Log (
Sto
rage m
odulu
s, E
"), P
a
Point-1 (Un-aged)
Point-2
Point-3
Point-4
Point-5
Point-6
Point-7
Point-8
0 hours
2 hours
24.5 hours
48.5 hours
72.5 hours
16 days
35 days
98 days
7.25
7.75
8.25
8.75
9.25
9.75
0 20 40 60 80 100 120 140 160
Temperature (oC)
Log (
Sto
rage m
odulu
s, E
"), P
a
Point-1 (Un-aged)
Point-2
Point-3
Point-4
Point-5
Point-6
Point-7
Point-8
0 hours
2 hours
24.5 hours
48.5 hours
72.5 hours
16 days
35 days
98 days
Figure 7.20 Effect of immersion time on the storage modulus (E’) of LY3505/XB3403 resin system
conditioned at 70 oC.
Typical dynamic traces of loss modulus, E" of the epoxy/amine system that was conditioned
at 70 oC are shown in Figure 7.21. It can be noted that the hygrothermal ageing of the epoxy
resulted in a broadening of the -transition associated with the Tg, and moved towards lower
temperatures. As the specimens were dried prior to analysis, these changes cannot be
attributed to a physical ageing effect of the epoxy. Instead, this broadening of the log E” peak
could be attributed to the network relaxation associated with plasticisation by absorbed
moisture. The water molecules are capable of forming hydrogen bonds with hydroxyl groups
by disrupting inter-chain hydrogen bonding [250,251] and hence increase the segmental
mobility allowing the network to relax [317].
Page 287
275
4.5
5
5.5
6
6.5
7
7.5
8
8.5
9
9.5
0 20 40 60 80 100 120 140 160
Temperature (oC)
Log
(lo
ss m
odu
lus,
E")
, P
a
Point-1 (Un-aged)
Point-2
Point-3
Point-6
Point-7
Point-8
0 hours
2 hours
24.5 hours
16 days
35 days
98 days
4.5
5
5.5
6
6.5
7
7.5
8
8.5
9
9.5
0 20 40 60 80 100 120 140 160
Temperature (oC)
Log
(lo
ss m
odu
lus,
E")
, P
a
Point-1 (Un-aged)
Point-2
Point-3
Point-6
Point-7
Point-8
0 hours
2 hours
24.5 hours
16 days
35 days
98 days
Figure 7.21 Effect of immersion time on the loss modulus (E”) of LY3505/XB3403 resin system
conditioned at 70 oC.
However, it must be emphasized that the evolution of the shape of the log E” peaks is not
associated with any decrease in the rubbery storage modulus (see Figure 7.20). Therefore it
can be concluded that no significant decrease in the cross-link density of the epoxy resin
occurred during ageing [300].
Similar trends were observed for conditioning at 50 °C and 30 °C and the change in the Tg at
1 Hz as a function of immersion time and temperature are plotted in Figure 7.22. The Tg
decreases substantially followed by a minor increase over prolonged exposure at all
temperatures of immersion. Xian and Karbhari [14] concluded that the increase in Tg after the
initial decrease, is attributed to the dissolution loss of low-molecular weight segments takes
Page 288
276
place at higher temperatures of immersion over extended periods of time. However, in this
study, an increase in Tg after a first depression was observed at all immersion temperatures.
(a) DMTA
(b) Gravimetry
0 10 20 30 40
0
1
2
3
0 10 20 30 40
55
60
65
70
75
80
Perc
enta
ge w
eig
ht
gain
(%
)
Time1/2
/thickness (hours1/2
/mm)
30oC
50oC
70oC
Gla
ss t
ransitio
n t
em
pera
ture
,
Tg (
oC
)
30oC
50oC
70oC
(a) DMTA
(b) Gravimetry
0 10 20 30 40
0
1
2
3
0 10 20 30 40
55
60
65
70
75
80
Perc
enta
ge w
eig
ht
gain
(%
)
Time1/2
/thickness (hours1/2
/mm)
30oC
50oC
70oC
Gla
ss t
ransitio
n t
em
pera
ture
,
Tg (
oC
)
30oC
50oC
70oC
Figure 7.22 (a) Change in Tg based on dynamic loss modulus (E”) traces of the LY3505/XB3403 resin
system that conditioned at 30, 50 and 70 oC as a function of immersion time and (b)
Corresponding gravimetric absorption isotherms; data points were joined to highlight the trend.
The highest rate of depression of the Tg was noted at the highest temperature of immersion,
70°C. However the lowest Tg was noted from the epoxy conditioned at 30°C confirming the
behaviour that was observed with DSC analyses (see Figure 7.16 and Figure 7.17). This
behaviour has not been reported extensively. However a similar trend was observed for a
4,4‟-isopropylidenephenol-epichlorohydrin/aliphatic amine system but no detailed
Page 289
277
explanation was given [14]. According to Zhou and Lucas [250], single hydrogen bonding
(Type-I) between water and polymer molecules requires lower activation energy whilst
multiple interconnecting hydrogen bonding (Type-II) possesses high activation energy. The
Type-II interactions are also known as “secondary cross-linking”. Therefore at higher
immersion temperatures these two processes can be competitive, and after a short time of
immersion, the secondary cross-linking dominates the ageing mechanism. In case of ageing
at low immersion temperature, the plasticisation due to the single hydrogen bonding
dominates the water transport until all the hydrophilic sites available in the network are
occupied with water molecules followed by secondary cross-linking at prolonged exposure.
In Figure 7.23, the dynamic temperature scans of the loss-tangent obtained for the un-aged
and the aged epoxy specimens for different immersion times at 70 °C are presented. As
mentioned before, the single tan peak related to the un-aged epoxy resin that appeared at
78.9 °C is assigned to the -relaxation of the fully cross-linked epoxy network. Generally,
the aged epoxy resin shows lower intensity of the tan peak that compared with the un-aged
epoxy. The intensity of the tan peak is associated with the energy loss in the transition
region, which increases with increase in the local motion of the polymer chains [301]. The
single hydrogen bonding between water and polymer molecules allow network relaxation
resulting in peak broadening while the multiple interconnecting hydrogen bonding restricts
the molecular motions resulting in a decrease in the intensity of tan in the transition region
[14].
With reference to Figure 7.23, after 24 hours of ageing, the onset of peak splitting was
observed and after 48 hours of aging, a distinct second peak can be seen. The appearance of
the second peak on the loss tangent has been previously reported for different epoxy systems
Page 290
278
and different chemical and physical explanations for the behaviour have been proposed
[302,314,244,312,313].
0
0.2
0.4
0.6
0.8
1
1.2
1.4
1.6
0 20 40 60 80 100 120 140 160
Temperature (oC)
Lo
ss t
an
ge
nt
(Ta
n
)
Point-1 (Un-aged)
Point-2
Point-3
Point-4
Point-5
Point-6
Point-7
Point-8
0 hours
2 hours
24.5 hours
48.5 hours
72.5 hours
16 days
35 days
98 days
0
0.2
0.4
0.6
0.8
1
1.2
1.4
1.6
0 20 40 60 80 100 120 140 160
Temperature (oC)
Lo
ss t
an
ge
nt
(Ta
n
)
Point-1 (Un-aged)
Point-2
Point-3
Point-4
Point-5
Point-6
Point-7
Point-8
0 hours
2 hours
24.5 hours
48.5 hours
72.5 hours
16 days
35 days
98 days
Figure 7.23 A series of loss tangent traces obtained from 1st dynamic scan of the LY3505/XB3403 resin
system conditioned for different immersion times at 70 oC.
One of the proposed phenomena to explain the peak splitting of tan trace is the uneven
water sorption within epoxy resins due to the presence of a heterogeneous molecular structure
with regions of different cross-linking densities [314]. However, this may not be the case for
the epoxy/amine resin system used in this study, since it was suggested that the low-
functionality epoxies such as DGEBA resins create more even cross-linking density compared
with that created by high-functionality epoxy resins [244]. It has also been argued that an
epoxy resin system having correct stoichiometric ratio, is highly unlikely to exhibit a cross-
linked structure with low and high cross-linking densities [315,279,421]. An even and fully
Page 291
279
cross-linked structure for the epoxy/amine resin used in this study is evident from the narrow
and symmetric tan peak obtained for un-aged specimens (see Figure 7.18).
Chateauminois et al. [300] hypothesised that the upper Tg originated from dried region in the
samples, which exhibited a Tg close to that of the unexposed material. The same
phenomenon was discussed elsewhere [302]. The peak splitting of tan traces related to the
aged samples was assigned to the -relaxation of the epoxy network that has been plasticised
by water [295] and was also assigned to the absorbed water that is not chemically linked to
the polymer network [302,314]. Using a series of experiments, Xian and Karbhari [14]
confirmed that the peak splitting of the tan traces is influenced by the dry skin and the wet
core of the test specimens. Furthermore, they performed a second DMTA temperature scan
on the same test specimens and observed a complete recovery of the peak shape confirming a
fully dried resin after two dynamic temperature scans. A shift of the tan peak of the second
scan towards higher temperatures has been attributed to a permanent plasticisation due to
hygrothermal aging.
Page 292
280
0
0.2
0.4
0.6
0.8
1
1.2
1.4
1.6
0 20 40 60 80 100 120 140 160
Temperature (oC)
Lo
ss tangent (t
an d
)Point-1 (Un-aged)-1st scan
Point-1
Point-2
Point-3
Point-4
Point-5
Point-8
0 hours
- 1st scan
2 hours
24.5 hours
48.5 hours
72.5 hours
0 hours
98 days
0
0.2
0.4
0.6
0.8
1
1.2
1.4
1.6
0 20 40 60 80 100 120 140 160
Temperature (oC)
Lo
ss tangent (t
an d
)Point-1 (Un-aged)-1st scan
Point-1
Point-2
Point-3
Point-4
Point-5
Point-8
0
0.2
0.4
0.6
0.8
1
1.2
1.4
1.6
0 20 40 60 80 100 120 140 160
Temperature (oC)
Lo
ss tangent (t
an d
)Point-1 (Un-aged)-1st scan
Point-1
Point-2
Point-3
Point-4
Point-5
Point-8
0 hours
- 1st scan
2 hours
24.5 hours
48.5 hours
72.5 hours
0 hours
98 days
0
0.2
0.4
0.6
0.8
1
0 0.2 0.4 0.6 0.8 1
x/L
Fra
ctio
na
l m
ois
ture
co
nce
ntr
atio
n,
C
4.67 hours
9.34 hours
14 hours
18.68 hours
23.35 hours
28 hours
32.69 hours
37.36 hours
46.7 hours
60.71 hours
74.2 hours
93.4 hours
102.74 hours
0
0.2
0.4
0.6
0.8
1
1.2
1.4
1.6
0 20 40 60 80 100 120 140 160
Temperature (oC)
Lo
ss tangent (t
an d
)Point-1 (Un-aged)-1st scan
Point-1
Point-2
Point-3
Point-4
Point-5
Point-8
0 hours
- 1st scan
2 hours
24.5 hours
48.5 hours
72.5 hours
0 hours
98 days
0
0.2
0.4
0.6
0.8
1
1.2
1.4
1.6
0 20 40 60 80 100 120 140 160
Temperature (oC)
Lo
ss tangent (t
an d
)Point-1 (Un-aged)-1st scan
Point-1
Point-2
Point-3
Point-4
Point-5
Point-8
0
0.2
0.4
0.6
0.8
1
1.2
1.4
1.6
0 20 40 60 80 100 120 140 160
Temperature (oC)
Lo
ss tangent (t
an d
)Point-1 (Un-aged)-1st scan
Point-1
Point-2
Point-3
Point-4
Point-5
Point-8
0 hours
- 1st scan
2 hours
24.5 hours
48.5 hours
72.5 hours
0 hours
98 days
0
0.2
0.4
0.6
0.8
1
0 0.2 0.4 0.6 0.8 1
x/L
Fra
ctio
na
l m
ois
ture
co
nce
ntr
atio
n,
C
4.67 hours
9.34 hours
14 hours
18.68 hours
23.35 hours
28 hours
32.69 hours
37.36 hours
46.7 hours
60.71 hours
74.2 hours
93.4 hours
102.74 hours
Figure 7.24 A series of loss tangent traces obtained from 2nd dynamic of the LY3505/XB3403 resin
system that recorded at different immersion times at 70 oC; inset shows Figure 7.10, which
represents predicted fractional concentration profiles through thickness at 70 oC.
Figure 7.24 shows the tan traces that obtained from the second dynamic temperature scans
on the same test specimens that have undergone the first dynamic temperature scan. The tan
trace related to the first scan of the un-aged epoxy resin is also presented for cross-
correlation with the shape and the -relaxation attributed to the second scans. The un-aged
specimen and the aged specimen for 2 hours in water at 70 °C showed complete recovery of
the peak shape and the intensity however, shifted towards higher temperatures. This higher Tg
related to dry, aged epoxy is believed to be due to a complicated process of plasticisation in
Page 293
281
the short-term and hydrolysis, leaching of low-molecular weight groups and secondary cross-
linking in long-term, especially at high immersion temperatures [278,14].
As can be seen from Figure 7.24, tan related to the specimens immersed in water at 70 °C
for longer than one day showed reduced peak intensity followed by peak broadening for
prolonged exposure. This desorption behaviour can be interpreted on the basis of types of
water present in the epoxy and types of water-polymer interactions. In the early stage of
sorption process, the water molecules attach to the hydrophilic functional groups on the
surface of the epoxy [250,422]. This hypothesis also can be explained using the predicted
moisture concentration profiles through the thickness of an epoxy specimen at 70 °C (see
Section 7.2.2 and inset of Figure 7.24). At early immersion times below 5 hours, the moisture
has not reached the middle of the specimen. Therefore complete desorption is possible upon
drying. As the exposure time increases, the bound water content increases. Predicted
concentration profiles show that after about 23 hours of immersion, the moisture
concentration at the middle of the specimen reaches 0.32. As the moisture front moved into
the resin, the overall moisture content within the resin increases. It was explained before that
the peak broadening with lower intensity is associated with increase in the bound water
content (i.e. increase in Type-I and Type-II water in the resin). Signs of these types of
interactions present in the aged and dried specimens can be related to the irreversible
plasticisation associated with the Type-I bonding and the Type-II bonding.
Page 294
282
7.3.4 Fourier transform near-infrared spectroscopy
Infrared spectroscopy is a reliable quantitative technique for determining sorption kinetics of
water in polymers [374,423]. In this study, conventional transmission FTIR spectroscopy was
also carried out to investigate the feasibility and effectiveness of using the method as an on-
line technique for monitoring water diffusion in the epoxy/amine system [356,357].
Commercial fibre optic probes were used with a thermo-regulated sample holder for spectral
acquisition in the near-infrared range. Near-infrared spectra were obtained on the un-aged
epoxy and on the epoxy aged for different immersion times at the three temperatures of 30°,
50° and 70 °C. Since FTIR spectroscopy is a non-destructive technique, the DMTA
specimens were used before testing for acquiring the near-infrared spectra. The measurement
only takes approximately one minute and the weight loss of the aged specimens during
scanning is negligible (see Section 7.1 and Figure 7.3).
Figure 7.25 shows typical FTIR spectra in the range of 1100 – 2300 nm for an epoxy
specimen before aging and specimens immersed in water at 70 °C for different exposure
times. Considerable increase in absorbance band at 1905 nm, which is due to the combination
of asymmetric OH stretching and OH bending vibration, is readily apparent. It was also
reported that this band is not due to the alchoholic hydroxyl groups but is a characteristic band
for the hydroxyl due to moisture [136]. The increase in the band has been observed at all
three immersion temperatures and the peak has widely used for quantitative analysis of
moisture absorption in polymer systems [424,21]. The very weak band, which appeared at
this wavelength on the spectra of un-aged epoxy resin, could be due to the moisture
contaminated with the epoxy and the amine hardener before cross-linking [280].
Page 295
283
In addition, a baseline shift of the wide absorption band appearing at 1430 nm was observed
and the band has been assigned to the first overtone of the symmetric OH stretching. However
the band is wide and overlapped significantly and identified as less usable for quantitative
analysis [424] (see Section 5.2). Nevertheless, a minor decrease in peak intensity can be seen
as the moisture uptake increases. It was hypothesised that this feature can be used as an
indication of the increase in hydrogen bonding with immersion time since the frequency of
the OH band decreases for the stretching mode, but it increases for the bending mode, which
appears at 1409 nm [319]. Moreover, FTIR analysis confirmed that there was no post-curing
taking place in the epoxy specimens.
Point-1 (Un-aged)
Point-2
Point-3
Point-4
Point-5
Point-6
Point-7
Point-8
7
8
11
20
Nanometres
Abso
rbance
units
0 hours
2 hours
24.5 hours
48.5 hours
72.5 hours
16 days
35 days
98 days
Point-1 (Un-aged)
Point-2
Point-3
Point-4
Point-5
Point-6
Point-7
Point-8
7
8
11
20
Nanometres
Abso
rbance
units
Point-1 (Un-aged)
Point-2
Point-3
Point-4
Point-5
Point-6
Point-7
Point-8
Point-1 (Un-aged)
Point-2
Point-3
Point-4
Point-5
Point-6
Point-7
Point-8
7
8
11
20
Nanometres
Abso
rbance
units
0 hours
2 hours
24.5 hours
48.5 hours
72.5 hours
16 days
35 days
98 days
Figure 7.25 Near-infrared spectra obtained under transmission mode for LY3505/XB3403 resin system
conditioned at 70 oC; Peak assignments: [1] 2207 nm – epoxy combination band, [2] 2164 nm –
aromatic ring combination, [3] 1905 nm – OH band due to absorbed moisture and [4] 1430 nm –
OH band due to alchoholic hydroxyl (see Table 5.1).
Page 296
284
Conventional FTIR spectroscopy confirmed that there was no detectable post-curing taking
place at immersion temperatures. However, no chemical changes were observed due to the
leaching of low-molecular weight substances within the spectral range used in this study.
This may be due to insufficient spectral information available in the near-infrared region
compared with that available in the mid-infrared range [312].
0 10 20 30 40
0
1
2
3
0 10 20 30 40
0
5
10
15
20
Pe
rce
nta
ge
we
igh
t
ga
in (
%)
Time1/2
/thickness (hours1/2
/mm)
30oC
50oC
70oC
(At-A
0)/
A0
30oC
50oC
70oC
(a) FTIR
(b) Gravimetry
0 10 20 30 40
0
1
2
3
0 10 20 30 40
0
5
10
15
20
Pe
rce
nta
ge
we
igh
t
ga
in (
%)
Time1/2
/thickness (hours1/2
/mm)
30oC
50oC
70oC
(At-A
0)/
A0
30oC
50oC
70oC
(a) FTIR
(b) Gravimetry
Figure 7.26 (a) Increase in normalised peak area of 1905 nm of the LY3505/XB3403 resin system
conditioned at 30, 50 and 70 oC as a function of immersion time and (b) Corresponding
gravimetric sorption isotherms; data points were joined to highlight the trend.
Use of FTIR spectroscopy for quantitative analysis of the sorption kinetics of water in epoxy
resin systems has been widely explored [374,326,424]. Since the thickness of the samples is
Page 297
285
constant, according to the Beer-Lambert law (see Section 2.3.1.1) the concentration or amount
of absorbed water can be calculated as follows [374]:
t t tA C M
A C M Equation 7.6
where C is the concentration of water, A is the normalised absorbance at 1409 nm, M is the
amount of water absorbed and the subscripts t and ∞ are time at t and at equilibrium,
respectively. The peak area of the absorption band at 1409 nm was normalised to a non-
reacting reference band at 2164 nm to eliminate the influence of spectral baseline shifts and
spectral intensity caused by physical differences among different specimens. Figure 7.26
shows a comparison of the water absorption plots at three immersion temperatures, 30, 50 and
70 °C obtained from the near-infrared spectroscopy (Figure 7.26(a) and the gravimetric data
Figure 7.26(b)). A good correlation was observed between the two techniques and it can be
concluded that FTIR spectroscopy is an effective method of studying the sorption kinetics of
water in the epoxy/amine resin system.
7.4 Conclusions
Based on the gravimetric measurements, moisture absorption in the epoxy/amine resin system
satisfies Fickian diffusion behaviour and the equilibrium moisture content and the sorption
kinetics obtained are in good agreement with the published results obtained by gravimetric
measurements. An attempt was made to predict the moisture diffusion front across the
thickness of a specimen as a function of immersion time using a finite-difference solution. A
Page 298
286
reasonable correlation was found between the moisture content measured experimentally and
that determined using the numerical solution.
Also DSC, TGA, DMTA and FTIR techniques were employed to investigate the absorption
mechanism of water in the epoxy/amine resin system that immersed in water at 30, 50 and 70
°C. Possible diffusion phenomena of water in the epoxy resin system were discussed based
on the experimental evidence and compared with the published results. Furthermore, the
effect of absorbed moisture on the thermal, viscoelastic and chemical properties of the resin
system was characterised.
Page 299
287
Chapter 8
Monitoring of moisture ingress using
fibre-optic transmission spectroscopy
8 Overview
8.1 Introduction
Little attention has been paid to developing fibre-optic sensors for in situ monitoring of
absorbed moisture and hygrothermal degradation in epoxy-based composites and other related
epoxy applications. The use of conventional FTIR spectroscopy to detect the ingress of
moisture was discussed in Chapter 7. In this chapter, the fibre-optic transmission sensor
discussed in Section 3.4.1.3 was used for monitoring the cross-linking process followed by
the detection of moisture ingress.
Page 300
288
8.2 Quantitative analysis of changes in functional groups
during hygrothermal conditioning
The capillary support sensor design, which was initially used for monitoring the cross-linking
reactions, was used for on-line monitoring of moisture ingress [370,356,357]. In other words,
the same sensor was used for process monitoring followed by moisture ingress detection. On-
line moisture ingress monitoring was studied using three specimen configurations in terms of
relative position of the embedded sensors in the through-thickness direction of the cross-
linked neat-resin sample (see Section 3.6.2). In order to cross-correlate the date from the
sensors with conventional gravimetric measurements, the dimensions of the specimen were
the same (50 mm x 50 mm x 2 mm thickness). A set of reference specimens were also used to
obtain independent gravimetric measurements using each of the specimen configuration used.
The specimens with embedded sensors and the reference specimens were cross-linked at 60
oC for 8 hours.
8.2.1 Specimen configuration – I
Figure 8.1 shows absorption isotherms for the epoxy/amine resin system, that were
conditioned at 50 oC & 100% RH based on gravimetric measurements of the reference
specimens. The results from these specimens were compared with the gravimetric data
obtained previously (see Section 7.1) and good correlation was observed. Therefore, it can
be concluded that the specimen thickness and the embedded transmission sensors showed no
significant influence on the equilibrium moisture content and the absorption behaviour of the
bulk resin.
Page 301
289
0
0.2
0.4
0.6
0.8
1
0 5 10 15 20 25 30 35 40
Time1/2
/thickness (Hours1/2
/mm)
Mt / M
∞
SR1-1
SR1-2
SR1-3
Previous gravimetric data
R1-2
R1-4
R1-3
R1-3
R1-4
R1-2
0
0.2
0.4
0.6
0.8
1
0 5 10 15 20 25 30 35 40
Time1/2
/thickness (Hours1/2
/mm)
Mt / M
∞
SR1-1
SR1-2
SR1-3
Previous gravimetric data
R1-2
R1-4
R1-3
R1-3
R1-4
R1-2
Figure 8.1 Comparison of absorption isotherms of water in the LY3505/XB3403 resin system at 50 °C
based on the previous gravimetric data and based on the different reference specimens; inset
shows a schematic illustration of the set of reference specimens used for gravimetric analysis.
In this specimen configuration, six sensors were embedded in a neat-cast epoxy/amine
specimen (S1-1) at different depths for in situ moisture ingress monitoring and only one
surface was exposed to water at 50 oC (see Section 3.8.2).
Page 302
290
Nanometres
Abso
rba
nce
units
0 hours
4 days8 days13 days
14 days15 days16 days
25 days27 days39 days
78 days
8
11
20
6
Nanometres
Abso
rba
nce
units
0 hours
4 days8 days13 days
14 days15 days16 days
25 days27 days39 days
78 days
Nanometres
Abso
rba
nce
units
0 hours
4 days8 days13 days
14 days15 days16 days
25 days27 days39 days
78 days
0 hours
4 days8 days13 days
14 days15 days16 days
25 days27 days39 days
78 days
8
11
20
6
Figure 8.2 Near-infrared spectra of the LY3505/XB3403 resin system conditioned at 50 oC and obtained
using the sensor-1; peak assignments: [6] 2207 nm – epoxy combination band, [8] 2164 nm –
aromatic ring combination, [11] 1905 nm – OH band due to absorbed moisture and [20] 1430 nm
– OH band due to alcoholic hydroxyl (see Table 5.1).
Figure 8.2 shows typical FTIR spectra in the range of 1300 – 2250 nm for the specimen coded
as S1-1 before aging and after immersion in water at 50 °C for different exposure times. The
major peaks of interest are clearly visible and they correlate well with that obtained using
conventional FTIR spectroscopy (see Section 7.3.4). With increasing conditioning time, a
gradual increase in absorbance peak at 1905 nm, which is due to the combination of
asymmetric OH stretching and bending vibration can be seen. The increase in the absorption
band was observed from all the embedded sensors and this peak area was used for quantitative
analysis of localised moisture absorption at the sensor locations within the epoxy specimen.
Page 303
291
In addition, the wide absorption band at 1430 nm due to the first overtone of the symmetric
OH stretching can also be seen. A periodic progressive change in the peak of the absorption
band at 1430 nm is visible as a function of immersion time. It was explained in the preceding
chapters that this feature could be attributed to the influence of intramolecular and
intermolecular hydrogen bonding between hydroxyl groups and the interactions between
hydroxyl and the nucleophelic sites of the resin network (see Sections 5.2.1 and 7.3.4). This
appeared to be an indication of anomalous diffusion where changes in interactions of free and
bound water occur during the water transport process with in the cross-linked resin [272].
More detailed discussion on the observed behaviour will be presented later.
The normalised peak area of the combination band at 1905 nm was determined with respect to
the peak area of the reference band at 2164 nm. The change in the hydroxyl peak area as a
function of conditioning time along with the spatial location of the sensor is shown in Figure
7.26; the conventional gravimetric data have also been cross-plotted to enable comparison.
Except for the sensors -1 and -2, the other sensors showed similar rates of increase in the
normalised peak area to that of the weight uptake in the bulk resin in the initial linear region.
The higher rates of increase in the peak areas observed at sensors -1 and -2, which were
embedded near the exposed surface could be attributed to the processing and hygrothermal
history of the specimen and the response-time of the sensors will be discussed later.
With reference to Figure 7.26, a delay was observed for the sensors that were embedded away
from the exposed surface this delay-time increased with increasing depth of the sensor in the
case neat-resin specimen. However, it was difficult to obtain a linear relationship between the
sensor location and the delay time observed for each sensor. This could be attributed to the
change in the rate of diffusion as the moisture diffusion front move into the specimen across
Page 304
292
the thickness. Leaching of low-molecular weight species from the conditioned specimens
also may have influence on the rate of moisture diffusion. On the other hand, this could be
attributed to displacement of the sensors across the thickness of the specimen during specimen
fabrication. According to the mould set-up illustrated in Figure 3.25, the lead-out optical
fibres from the sensors were supported at specified heights outside the mould.
-0.2
0.0
0.2
0.4
0.6
0.8
1.0
0 5 10 15 20 25 30 35 40
Time1/2
/thickness (hour1/2
/mm)
Mt /
M∞
-0.2
0.0
0.2
0.4
0.6
0.8
1.0
At /
A∞
0 mm
0.22 mm
0.44 mm
0.88 mm
1.10 mm
1.32 mm
Previous gravimetricdata
-0.2
0.0
0.2
0.4
0.6
0.8
1.0
0 5 10 15 20 25 30 35 40
Time1/2
/thickness (hour1/2
/mm)
Mt /
M∞
-0.2
0.0
0.2
0.4
0.6
0.8
1.0
At /
A∞
0 mm
0.22 mm
0.44 mm
0.88 mm
1.10 mm
1.32 mm
Previous gravimetricdata
Figure 8.3 Comparison of the sensor responses from the embedded sensors within the specimen
configuration – I and the conventional gravimetric results of the LY3505/XB3403 resin system
conditioned at 50 oC as a function of immersion time and the sensor location.
With reference to Figure 8.4, due to the flexibility of the optical fibres, the possibility of
sensor displacement through the thickness of the specimen is high, especially during mould
filling and subsequent cross-linking of the resin. Nevertheless, absorption kinetics of water
Page 305
293
in the epoxy/amine resin system was determined based on the spectral data obtained via the
sensors -1, -3 and -6.
Embedded sensor
Lead-out sensing fibres
supported on the spacers
Displaced sensor
Silicone mould
PTFE spacers
Embedded sensor
Lead-out sensing fibres
supported on the spacers
Displaced sensor
Silicone mould
PTFE spacers
Figure 8.4 Schematic illustration showing the possibility of sensor displacement with in the epoxy
specimen when the sensors secured outside the mould cavity.
Figure 8.5 shows localised absorption isotherms within the epoxy specimen based on the
sensors -1, -3 and -6 embedded at 0, 0.44 and 1.32 mm, respectively from the surface that was
exposed to water. Except for the delayed responses of sensors -3 and -6, the general trend of
the absorption isotherms obtained from the three sensors showed similar diffusion behaviour.
One-dimensional Fickian diffusion model (see Equations 2.24 and 2.25) was used to predict
the localised moisture transport behaviour at three selected sensor locations. The applicability
of anomalous diffusion models for predicting the diffusion of water in the epoxy/amine resin
system was also investigated. The Carter-Kibler model [272] was used; this model invokes
the existence and interactions of bound and mobile water molecules within a material as a
Page 306
294
function of immersion time (See Section 2.4.2.2). This model was considered because of the
localised step-wise diffusion profile seen in Figure 8.5. Equations 2.32, 2.33 and 2.34 were
used to fit the experimental data and a comparison of the Carter-Kibler model and the Fickian
model with the experimental data is presented in Figure 8.6(a and b) and Figure 8.7.
Reasonable correlation was observed with the spectral data and the Fickian model. However,
a detailed investigation of the spectral response from the individual sensors revealed that the
localised water transport, especially the diffusion away from the exposed surface exhibits a
minor deviation from Fickian diffusion behaviour. The observed deviation of the localised
moisture diffusion from the Fickian behaviour towards a step-increase in diffusion may be
due to the following reasons. That may be due to the moisture diffusion through the interface
region between the resin and the embedded optical fibres. A similar diffusion mechanism of
water (capillary diffusion) has been reported in composite materials, where water enters the
system along the interface between matrix and reinforcing fibres [425]. Karalekas et al. [426]
employed FBG sensors for monitoring process-induced stresses and moisture-induced stresses
in an epoxy resin system. They observed interface cracks and fibre/resin debonding after
prolonged exposure to hygrothermal environment. Degradation of silicone rubber sealant that
was used to protect the fibre exit points, was observed after long immersion times. The
authors hypothesised that this may be attributed to combine effect of water penetration from
the edges along the fibre/resin interface and the moisture-induced tensile strains developed in
the resin. The same capillary diffusion may occur in the interface between the resin and the
sensing fibres, which leads to a flow of water through capillary action into the sensing region
along the fibres. On the other hand, this may be an over-estimation since the capillary
diffusion reported by Karalekas et al. [426] was observed at long immersion times and the
gravimetric measurements of the reference specimen with embedded “dummy” sensors
Page 307
295
showed no significant effect on the weight-uptake compared to that of the neat epoxy
specimens (see Figure 8.1).
-0.2
0.0
0.2
0.4
0.6
0.8
1.0
0 5 10 15 20 25 30 35 40
Time1/2
/thickness (hour1/2
/mm)
Mt /
M∞
-0.2
0.0
0.2
0.4
0.6
0.8
1.0
At /
A∞
Sensor-1 (0 mm)
Sensor-3 (0.44 mm)
Sensor-6 (1.32 mm)
Previous gravimetric data
-0.2
0.0
0.2
0.4
0.6
0.8
1.0
0 5 10 15 20 25 30 35 40
Time1/2
/thickness (hour1/2
/mm)
Mt /
M∞
-0.2
0.0
0.2
0.4
0.6
0.8
1.0
At /
A∞
Sensor-1 (0 mm)
Sensor-3 (0.44 mm)
Sensor-6 (1.32 mm)
Previous gravimetric data
Figure 8.5 Comparison of the responses from the sensors embedded at 0, 0.44 and 1.32 mm from the
exposed surface and the conventional gravimetric results of the LY3505/XB3403 resin system
conditioned at 50 oC as a function of immersion time.
Page 308
296
0.0
0.2
0.4
0.6
0.8
1.0
0 5 10 15 20 25 30 35 40
Time1/2
/ thickness (hours1/2
/mm)
At /
A∞
Sensor-1 (0 mm)
Carter-Kibler model
Fickian model
(a)
(b)
-0.2
0.0
0.2
0.4
0.6
0.8
1.0
-5 5 15 25 35
Time1/2
/thickness (hours1/2
/mm)
At /
A∞
Sensor-3 (0.44 mm)
Carter-Kibler model
Fickian model
0.0
0.2
0.4
0.6
0.8
1.0
0 5 10 15 20 25 30 35 40
Time1/2
/ thickness (hours1/2
/mm)
At /
A∞
Sensor-1 (0 mm)
Carter-Kibler model
Fickian model
(a)
(b)
-0.2
0.0
0.2
0.4
0.6
0.8
1.0
-5 5 15 25 35
Time1/2
/thickness (hours1/2
/mm)
At /
A∞
Sensor-3 (0.44 mm)
Carter-Kibler model
Fickian model
Figure 8.6 Comparison between the sensor response and the diffusion models for hydrothermal
conditioning of the LY3505/XB3403 resin system at 50 oC: (a) sensor-1 and (b) sensor-3.
Page 309
297
-0.2
0
0.2
0.4
0.6
0.8
1
-5 0 5 10 15 20 25 30 35 40
Time1/2
/thickness (hours1/2
/mm)
At /
A∞
Sensor-6 (1.32 mm)
Carter-Kibler Model
Fickian model
(c)
-0.2
0
0.2
0.4
0.6
0.8
1
-5 0 5 10 15 20 25 30 35 40
Time1/2
/thickness (hours1/2
/mm)
At /
A∞
Sensor-6 (1.32 mm)
Carter-Kibler Model
Fickian model
(c)
Figure 8.7 Comparison between the sensor response and the diffusion models for hydrothermal
conditioning of the LY3505/XB3403 resin system at 50 oC: (c) sensor-6.
Reasonable fits were obtained using Carter-Kibler model for the data recorded from the
sensors embedded at the exposed surface (sensor-1) and at 1.32 mm away from the exposed
surface (sensor-3). However, with respect to Figure 8.6(b), the models only can be used to
explain the initial linear region of the absorption isotherm that was obtained from the sensor
embedded at 0.44 mm away from the exposed surface. The kinetic parameters related to the
Carter-Kibler and the Fickian models are given in Table 5.5. The initial linear region of the
sorption isotherms for 0.7t
was used to obtain the diffusion coefficient, D. The values
corresponding to the best fit to the data obtained from the sensor embedded at 0.44 mm away
from the exposed surface do not follow the conditions of 2,2 to satisfy the Carter-
Kibler approximations (Equations 2.33 – 2.34).
Page 310
298
Table 8.1 Summary of kinetic parameters corresponding to best fit of the models to the spectral data
obtained based on specimen configuration – I for hygrothermal conditioning of the
LY3505/XB3403 resin system at 50 oC.
Sensor Location
0 mm 0.44 mm 1.32 mm
Dmm2 sec
-1)
sec-1
)
sec-1
)
sec-1
)
4.69 x 10⁻⁶
5.66 x 10⁻⁶
9.10 x 10⁻⁷
1.85 x 10⁻⁶
2.73 x 10⁻⁶
3.05 x 10⁻⁷
9.25 x 10⁻⁸
2.15 x 10⁻⁷
7.69 x 10⁻⁶
9.28 x 10⁻⁶
8.50 x 10⁻⁷
2.26 x 10⁻⁶
An attempt was also made to model the observed diffusion behaviour considering time-
dependent diffusion coefficient that proposed by Marsh et al. [274]. The diffusion coefficient
was determined as a function of immersion time using Equation 2.37. One-dimensional
Fickian diffusion model (see Equation 2.24) was used to fit the experimental data using the
values obtained for diffusion coefficient at different stages. Figure 8.8 shows a comparison of
the best fit of the multi-stage model to the experimental data that obtained from the embedded
sensors. A good correlation was observed between the spectral data and the model. The step-
wise change in diffusion rates observed for data obtained from the sensors could be attributed
to the nature of the water-polymer interactions and the transport phenomena associated with
bound and mobile water. The effect of the above parameters on the rate of change in
diffusion coefficient will be discussed later in this section in more detail.
Page 311
299
-0.2
0.0
0.2
0.4
0.6
0.8
1.0
0 5 10 15 20 25 30 35 40
Time1/2
/thickness (hour1/2
/mm)
At /
A∞
Sensor-1 (0 mm)
Sensor-3 (0.44 mm)
Sensor-6 (1.32 mm)
Multi-stage sorption model
1 2 43 5 611 22 4433 55 66
-0.2
0.0
0.2
0.4
0.6
0.8
1.0
0 5 10 15 20 25 30 35 40
Time1/2
/thickness (hour1/2
/mm)
At /
A∞
Sensor-1 (0 mm)
Sensor-3 (0.44 mm)
Sensor-6 (1.32 mm)
Multi-stage sorption model
1 2 43 5 611 22 4433 55 66
Figure 8.8 Comparison of the sensor responses and the best fits of the multi-stage diffusion model for
hydrothermal conditioning of the LY3505/XB3403 resin system at 50 oC.
The multi-stage model was also used to investigate the effect of the concentration of absorbed
moisture on the diffusion coefficient and Figure 8.9 shows the change in localised diffusion
coefficient at different sensor locations as a function of absorbed moisture content. The
diffusion coefficients at the sensor-1 and -3 showed a similar trend in which an overall
increase towards the equilibrium moisture content was followed by a decrase towards zero at
longer exposure times. A different trend was observed at the sensor-6 where the diffusion
coefficient showed a gradual decrease at the very early stage of diffusion and remained at an
average of 7.29 x 10⁻⁷
mm2 s
-1 for 0.1 1.0tA
A
.
Page 312
300
0.0 0.2 0.4 0.6 0.8 1.0
0.0
1.0x10⁻⁶
2.0x10⁻⁶
3.0x10⁻⁶
Diffu
sio
n c
oeffic
ient (m
m2 s
-1)
At / A
Sensor-1
(0 mm)
At / A∞
0.0 0.2 0.4 0.6 0.8 1.0
0.0
1.0x10⁻⁷
2.0x10⁻⁷
3.0x10⁻⁷
4.0x10⁻⁷
5.0x10⁻⁷
Diffu
sio
n c
oeff
icie
nt (m
m2 s
-1)
At / A
Sensor-3
(0.44 mm)
At / A∞
At / A∞
(a)
(c)
(b)
0.0 0.2 0.4 0.6 0.8 1.0
0.0
5.0x10⁻⁶
1.0x10⁻⁵
Diffu
sio
n c
oeff
icie
nt
(mm
2 s
-1)
At / A
Sensor-6
(1.32 mm)
0.0 0.2 0.4 0.6 0.8 1.0
0.0
1.0x10⁻⁶
2.0x10⁻⁶
3.0x10⁻⁶
Diffu
sio
n c
oeffic
ient (m
m2 s
-1)
At / A
Sensor-1
(0 mm)
At / A∞
0.0 0.2 0.4 0.6 0.8 1.0
0.0
1.0x10⁻⁷
2.0x10⁻⁷
3.0x10⁻⁷
4.0x10⁻⁷
5.0x10⁻⁷
Diffu
sio
n c
oeff
icie
nt (m
m2 s
-1)
At / A
Sensor-3
(0.44 mm)
At / A∞
At / A∞
(a)
(c)
(b)
0.0 0.2 0.4 0.6 0.8 1.0
0.0
5.0x10⁻⁶
1.0x10⁻⁵
Diffu
sio
n c
oeff
icie
nt
(mm
2 s
-1)
At / A
Sensor-6
(1.32 mm)
Figure 8.9 Change in localised diffusion coefficient of the LY3505/XB3403 resin system for
hygrothermal conditioning at 50 oC based on the sensors embedded in the specimen configuration
– I: (a) sensor-1, (b) sensor-3 and (c) sensor-6.
The observed trends of the time-dependent diffusion coefficient at different depths through
the thickness of the specimen could be due to several reasons. When a material absorbs
water, the local moisture concentration across the thickness varies with time until the
Page 313
301
equilibrium moisture content is attained. Therefore swelling due to bound water is not
uniform through out the material and residual stresses build up due to localised
inhomogeneous swelling. Moisture-induced swelling and hence moisture-induced residual
strain in neat epoxy resins has been found to be linearly proportional to the absorbed moisture
content [427,428,429].
In addition, residual stresses are also present in the dry material before immersion due to
process-induced resin shrinkage (see Section 6.3.3) [8,95,375]. Bogetti and Gillespie [6]
studied process-induced stresses develop in thick thermosetting composite laminates during
the cross-linking process. They proposed models to predict thermal and chemical strain of the
thermosetting resins during cross-linking and modelled stress profiles across the thickness
2.45 cm. The models were developed for specimens of outer faces in contact and the stress
profile across the thickness was found to be parabolic with tensile stresses at the contact
surfaces and compressive stresses at the middle of the specimen. They discussed the effect of
asymmetric processing parameters such as moulding methods and cross-linking temperature
on the gradient of process-induce shrinkage within the material. Also it was reported that
higher cooling rates induce higher resin shrinkage for shorter cooling times when a cross-
linked material is cooled down to ambient temperature [430]. However, the cooling rate
showed a negligible effect on the resin shrinkage strain over longer storage times (i.e.
2000t minutes) at room temperature.
Based on in situ monitoring of moisture induced strains using FBG sensors, Karalekas et al.
[426] observed that the process-induced compressive stresses reduce due to absorbed moisture
and after prolonged exposure to water, the stresses become tensile due to moisture-induces
swelling. Furthermore, they proposed that the capillary diffusion from the edges along the
Page 314
302
fibre/resin interface accelerate by the strain mismatch at the interface due to non-hygroscopic
nature of the fibre compared with the resin. Therefore the localised diffusivity of moisture is
a function of process and hygrothermal history of the material.
As explained in Section 3.8.2, an open mould was used to fabricate the epoxy specimens for
hygrothermal conditioning as shown in Figure 3.25. Therefore the process-induced residual
stresses may not be symmetric around the mid-plane across the thickness. During cross-
linking, the resin at the open side of the mould experiences less restriction towards chemical
shrinkage compared to that in contact with the glass moulding plate. Therefore in the cross-
linked epoxy specimens used in this study, tensile stresses develop at the surface that was in
contact with the glass plate while the free-surface remains at a lower stress level when the
specimen was cooled down to room temperature.
In the case of the hygrothermal conditioning experiments, the surface of the specimen that
was in contact with the glass moulding plate was exposed to water. Therefore a higher rate of
diffusion was observed at the sensor-1 during the initial stage of absorption, which could be
attributed to the accelerated water diffusion into free volume present at the surface. The
process-induced tensile stresses may restrain network relaxation leaving more the free-volume
at the surface region. A gradual deceleration of the diffusion coefficient at the sensor-1 for
0.1 0.2tAA
could be attributed to the network relaxation due to formation of bound
water at nucleophelic sites in the resin. The same transport phenomenon was discussed
previously in terms of water-polymer interactions in the polymer network [250,422] and the
types of water and their activities [247] at the early stage of sorption process. The formation
of bound water has been identified as a reversible exothermic reaction [317] and application
Page 315
303
of heat dominates the backward reaction. The periodic change in the diffusion coefficient
may lead to multi-stage diffusion of water in the epoxy/amine resin system.
This also can be evident from the near-IR spectra obtained via the embedded sensors (see
Figure 8.2). At the early stage of sorption, the absorption band at 1905 nm increased while
the overlapped band due to the first overtone of stretching and bending vibrations of OH at
1430 nm remained the same. However, a change in peak shape and a minor decrease in peak
intensity can be seen as the moisture uptake increases. This feature was attributed to the
formation of bound water within the resin network since the frequency of the OH band
decreases for the stretching mode, but it increases for the bending mode due to hydrogen
bonding [319]. A periodic change in the above mentioned spectral characteristics of the
absorption band at 1430 nm can be associated with the change in probabilities of existence of
free and bound water as a function of moisture content and the immersion time. However,
clear spectral evidence to support this absorption phenomenon cannot be found in the near-IR
spectral region used in this study. The compressive stresses develop due to moisture-induced
swelling also may reduce the diffusivity by compensating process-induced tensile stresses at
the surface regions.
The absorption isotherm obtained using sensor-3 shows similar multi-stage diffusion
behaviour, however the initial diffusion was slower than that observed from the sensor-1.
This could be attributed to the localised stress profile at the sensing region away from the
exposed surface. With respect to Figure 8.9(a and b) the observed increase in diffusion
coefficient at the later stage of diffusion could be due to the loss of protection of the sealant at
the exit points of lead-out fibres of sensors –1 and –3 and accelerated capillary diffusion
through the fibre/resin interface due to moisture-induced swelling strains [426].
Page 316
304
On the other hand, sensor-6 showed a different trend of change in diffusion coefficient against
the absorbed moisture content as shown in Figure 8.9(c). The behaviour is more related to
Fickian diffusion where the diffusion coefficient decreases with increase in moisture content
due to the exothermic nature of the reaction. In addition, as explained earlier, the covered
surface of the epoxy specimen for conditioning experiments was not in contact during cross-
linking. Therefore, the resin experienced no constraints for shrinkage except surface tension
of the resin and can be rearranged to minimise the induced stresses at the surface. This could
lead to less influence of the resin shrinkage on the moisture diffusion process at the regions
close to the covered surface. The Fickian model shows a good fit to the spectral data obtained
from sensor-6 and showed reasonable correlation as shown in Figure 8.8(c). The deviation
from the Fickian model towards multi-stage diffusion can be attributed to a combined effect
of moisture-induced swelling stresses and the localised water-polymer interactions as
discussed before.
8.2.2 Specimen configurations – II and – III
The differences between the specimen configuration – I and the configurations – II and – III
were: the method of securing the sensors during specimen fabrication, the number of sensors
embedded within the epoxy/amine specimens and the direction of hygrothermal exposure (see
Section 3.8.2). Figure 8.10 and Figure 8.11 show a comparison of the absorption isotherms of
the epoxy/amine resin system at 50 oC obtained based on the previous gravimetric
measurements and that based on the reference specimens corresponding to each specimen
configuration. Good correlation was observed between the neat-epoxy specimens (R2-2 and
R3-2) and the embedded dummy sensors (R2-3 and R3-3); however, no evidence was found
Page 317
305
on anomalous moisture transport due to capillary diffusion from the edges along the
fibre/resin interface.
0
0.2
0.4
0.6
0.8
1
0 5 10 15 20 25 30 35 40
Time1/2
/thickness (hour1/2
/mm)
Mt/M
∞
SR2-3
SR2-4
Previous gravimetric data
R2-3
R2-2
R2-2
R2-3
0
0.2
0.4
0.6
0.8
1
0 5 10 15 20 25 30 35 40
Time1/2
/thickness (hour1/2
/mm)
Mt/M
∞
SR2-3
SR2-4
Previous gravimetric data
R2-3
R2-2
R2-2
R2-3
Figure 8.10 Absorption isotherms of water in the LY3505/XB3403 resin system at 50 °C based on the
gravimetric measurements of reference epoxy specimens of the specimen configuration – II.
Figure 8.12 shows typical near-IR spectra in the range of 1200 – 2250 nm recorded via the
sensor-1 of the specimen configuration – III before aging and after immersion in water at
50°C for different exposure times. The absorption band at 1905 nm due to the asymmetric
stretching and bending of O-H showed a rapid response to absorbed moisture. This is due to
the sensor location compared with the relative locations of the sensors -2 and -3 from the
exposed surface. In addition, the shape of the overlapped band at 1430 nm due to the first
overtone of symmetric O-H stretching changed as a function of immersion time.
Page 318
306
0
0.2
0.4
0.6
0.8
1
0 5 10 15 20 25 30 35 40
Time1/2
/thickness (hour1/2
/mm)
Mt / M
∞
SR3-5
SR3-6
Previous gravimetric data
R3-2
R3-3
R3-2
R3-3
0
0.2
0.4
0.6
0.8
1
0 5 10 15 20 25 30 35 40
Time1/2
/thickness (hour1/2
/mm)
Mt / M
∞
SR3-5
SR3-6
Previous gravimetric data
R3-2
R3-3
R3-2
R3-3
Figure 8.11 Absorption isotherms of water in the LY3505/XB3403 resin system at 50 °C based on the
gravimetric measurements of reference epoxy specimens of the specimen configuration – III.
Nanometres
Abso
rba
nce
units
0 hours6 hours13 hours
24.5 hours2 days3 days
6 days11 days15 days
24 days31 days
8
11
20
6
Nanometres
Abso
rba
nce
units
0 hours6 hours13 hours
24.5 hours2 days3 days
6 days11 days15 days
24 days31 days
0 hours6 hours13 hours
24.5 hours2 days3 days
6 days11 days15 days
24 days31 days
8
11
20
6
Figure 8.12 Typical near-IR spectra obtained via the sensor-1 embedded in the specimen configuration–
III conditioned at 50 oC (see Table 5.1).
Page 319
307
8.2.2.1 Absorption kinetics: Specimen configuration – II
For in situ monitoring of moisture ingress, only one side of the specimen was exposed to the
water and the sensor-1 was embedded at the exposed surface. The locations of the sensors -2
and -3 with respect to the exposed surface are shown in Figure 3.30. Figure 8.13 shows
localised absorption isotherms constructed based on the spectral responses from the embedded
sensors. During specimen fabrication, the exposed side was in contact with the glass
moulding plate and the covered surface was on the open side of the mould.
0
0.2
0.4
0.6
0.8
1
0 5 10 15 20 25 30 35 40
Time1/2
/thickness (hour1/2
/mm)
Mt /M
∞
0
0.2
0.4
0.6
0.8
1
At /
A∞
Sensor-1 (0 mm)
Sensor-2 (0.66 mm)
Sensor-3 (1.32 mm)
Previous gravimetric data
0
0.2
0.4
0.6
0.8
1
0 5 10 15 20 25 30 35 40
Time1/2
/thickness (hour1/2
/mm)
Mt /M
∞
0
0.2
0.4
0.6
0.8
1
At /
A∞
Sensor-1 (0 mm)
Sensor-2 (0.66 mm)
Sensor-3 (1.32 mm)
Previous gravimetric data
Figure 8.13 Comparison of the sensor responses from the embedded sensors within the specimen
configuration – II and the conventional gravimetric results of the LY3505/XB3403 resin system
conditioned at 50 oC as a function of immersion time and the sensor location.
The localised diffusion behaviour observed from the embedded sensors were different from
that observed from the sensors embedded in the specimen configuration – I. Defining a
general trend was difficult since each sensor showed unique diffusion characteristics at the
Page 320
308
embedded locations. Moisture reached the sensor-1 at a very early stage of diffusion and
followed a similar diffusion rate as that of the bulk epoxy resin for a short time. A step-
change in the diffusion rate is clearly apparent at the sensor-1. A delay in response was
observed from the sensor-2 compared to the sensor-1 due to the sensor location. As water was
permitted to enter the specimen from only one side and the sensor-3 was located 1.32 mm
away from the exposed surface, we expected to see a delayed response compared with that
was seen from the sensor-2. However both sensors detected moisture approximately at the
same time while the rate of increase in the amount of absorbed moisture detected by the
sensor-2 was high compared with that detected by the sensor-3. In addition, sensor-3 showed
a slower rate of diffusion approximately for first 33 days of immersion followed by an
increase in rate up to the equilibrium moisture content. However, after 57 days of exposure,
responses from all the sensors overlapped and showed similar absorption behaviour.
The Carter-Kibler model and the multi-stage model were used to predict the localised sorption
kinetics of water in the epoxy/amine resin. Figure 8.14(a and b) and Figure 8.15 compare the
best fits of the models to the experimental data based on sensor-1, sensor-2 and sensor-3,
respectively. The kinetic parameters and were determined by fitting the experimental
data to Equations 2.33 – 2.34. It is clearly apparent from the plots that the Carter-Kibler
model only can be used to predict the initial stage of diffusion of water for immersion time,
0.7t
at each sensor location. Table 8.2 shows the summary of fitting parameters obtained
for the best fits to the experimental data. It can be clearly seen that for the data obtained from
sensors -2 and -3, the probabilities for water to become mobile and bound, and ,
respectively are greater than . Although and obtained for the data from sensor-1 satisfied
the condition 2,2 , it should be noted that the model is not capable of describing the
Page 321
309
actual sorption behaviour at all the sensor locations for immersion times,
1t . Therefore
the Carter-Kibler model seemed not suitable for predicting the complete sorption behaviour
through the thickness of the epoxy specimen.
Table 8.2 Summary of kinetic parameters corresponding to best fit of the models to the spectral data
obtained from the specimen configuration – II for hygrothermal conditioning of the
LY3505/XB3403 resin system at 50 oC.
Sensor Location
0 mm 0.66 mm 1.32 mm
Dmm2 sec
-1)
sec-1
)
sec-1
)
sec-1
)
6.25 x 10⁻⁶
1.02 x 10⁻⁵
1.80 x 10⁻⁷
9.90 x 10⁻⁷
6.25 x 10⁻⁴
1.02 x 10⁻³
9.00 x 10⁻⁴
1.08 x 10⁻³
1.22 x 10⁻⁵
1.99 x 10⁻⁵
7.00 x 10⁻⁴
4.84 x 10⁻²
As seen in Figure 8.14(a and b) and Figure 8.15, good correlation was observed between the
multi-stage model and the localised transport phenomena of water within the specimen. This
suggests that the influence of process and hygrothermal history on the diffusion coefficient of
water that was discussed in Section 8.2.1 could be used to describe the anomalous absorption
behaviour in the specimen configuration – II.
In particular, sensor-1, which is embedded at the surface showed a fast rate of diffusion
followed by an early pseudo-equilibrium level for short immersion times and the feature is not
apparent from the sensors -2 and -3. Hahn [427] showed that during the early stage of
diffusion, the absorbed water produces relatively little swelling until a critical amount of
water is absorbed into the specimen, and then the volume increases proportionally to the
additional water content. Li et al. [431] explained the behaviour in terms of types of absorbed
Page 322
310
water in a polymer. The change in volume of resin due to absorbed moisture was measured
using a liquid displacement method. The ASTM D792 standard was used to measure the
density of the specimens. The apparent volume of the conditioned specimens was calculated
using: MV . They hypothesised that the mobile water, which occupies existing free
volume in the polymer governs the early stage of sorption while the bound water dominates
the later stage of sorption process. It was reported that in the early stage of diffusion, the
water molecules attach to the hydrophilic functional groups on the surface of the specimen
[250].
The transport behaviour can also be affected by the influence of process-induced tensile
stresses exist at the exposed surface of the specimen, which was in contact with the glass
moulding plate during specimen fabrication. Therefore the first step-change of the diffusion
rate could be associated with the fast rate of diffusion of mobile water absorbed through the
exposed surface followed by the formation of bound water with the polymer molecules. A
gradual increase in compressive stresses due to moisture-induced swelling reduces the
diffusion rate by hindering the fabrication stresses. The second pseudo-equilibrium level of
moisture uptake was explained in terms of formation of clusters of unbound water within the
polymer network [274].
Page 323
311
(a)
(b)
0
0.2
0.4
0.6
0.8
1
0 5 10 15 20 25 30 35 40
Time1/2
/thickness (hour1/2
/mm)
At /
A∞
Sensor-1 (0 mm)
Cater-Kibler model
Multi-stage model
0
0.2
0.4
0.6
0.8
1
-5 0 5 10 15 20 25 30 35 40
Time1/2
/thickness (hour1/2
/mm)
At /
A∞
Sensor-2 (0.66 mm)
Cater-Kibler model
Multi-stage model
(a)
(b)
0
0.2
0.4
0.6
0.8
1
0 5 10 15 20 25 30 35 40
Time1/2
/thickness (hour1/2
/mm)
At /
A∞
Sensor-1 (0 mm)
Cater-Kibler model
Multi-stage model
0
0.2
0.4
0.6
0.8
1
-5 0 5 10 15 20 25 30 35 40
Time1/2
/thickness (hour1/2
/mm)
At /
A∞
Sensor-2 (0.66 mm)
Cater-Kibler model
Multi-stage model
Figure 8.14 Comparison between the sensor response and the diffusion models for hydrothermal
conditioning of the LY3505/XB3403 resin system at 50 oC (a) sensor-1 and (b) sensor-2.
Page 324
312
(c)
0
0.2
0.4
0.6
0.8
1
-5 0 5 10 15 20 25 30 35 40
Time1/2
/thickness (hour1/2
/mm)
At / A
∞
Sensor-3 (1.32 mm)
Cater-Kibler model
Multi-stage model
(c)
0
0.2
0.4
0.6
0.8
1
-5 0 5 10 15 20 25 30 35 40
Time1/2
/thickness (hour1/2
/mm)
At / A
∞
Sensor-3 (1.32 mm)
Cater-Kibler model
Multi-stage model
Figure 8.15 Comparison between the sensor response and the diffusion models for hydrothermal
conditioning of the LY3505/XB3403 resin system at 50 oC: (c) sensor-3.
As the moisture diffusion front moves into the specimen along the direction of the thickness,
different absorption phenomena were observed. As seen in Figure 8.14(b), the pseudo-
equilibrium moisture level at the sensor-2 was observed approximately at 0.75tAA
while
that for sensor-1 appeared at around 0.55tAA
. However, according to Figure 8.16(b), the
first change in the gradient of the diffusion coefficient clearly appeared around 0.5 together
with the second deflection at 0.8.
Page 325
313
At / A∞
At / A∞
At / A∞
0.0 0.2 0.4 0.6 0.8 1.0
0.0
5.0x10⁻⁴
1.0x10⁻³
1.5x10⁻³
2.0x10⁻³
Diffu
sio
n c
oeffic
ient (m
m2 s
-1)
At / A
Sensor-3
(1.32 mm)
0.0 0.2 0.4 0.6 0.8 1.0
0.00
1.50x10⁻⁷
3.00x10⁻⁷
4.50x10⁻⁷
6.00x10⁻⁷
Diffu
sio
n c
oeffic
ient (m
m2 s
-1)
At / A
Sensor-1
(0 mm)
0.0 0.2 0.4 0.6 0.8 1.0
0.0
1.5x10⁻⁵
3.0x10⁻⁵
4.5x10⁻⁵
6.0x10⁻⁵
7.5x10⁻⁵
Diffu
sio
n c
oe
ffic
ien
t (m
m2 s
-1)
At / A
Sensor-2
(0.66 mm)
(a)
(b)
(c)
At / A∞
At / A∞
At / A∞
0.0 0.2 0.4 0.6 0.8 1.0
0.0
5.0x10⁻⁴
1.0x10⁻³
1.5x10⁻³
2.0x10⁻³
Diffu
sio
n c
oeffic
ient (m
m2 s
-1)
At / A
Sensor-3
(1.32 mm)
0.0 0.2 0.4 0.6 0.8 1.0
0.00
1.50x10⁻⁷
3.00x10⁻⁷
4.50x10⁻⁷
6.00x10⁻⁷
Diffu
sio
n c
oeffic
ient (m
m2 s
-1)
At / A
Sensor-1
(0 mm)
0.0 0.2 0.4 0.6 0.8 1.0
0.0
1.5x10⁻⁵
3.0x10⁻⁵
4.5x10⁻⁵
6.0x10⁻⁵
7.5x10⁻⁵
Diffu
sio
n c
oe
ffic
ien
t (m
m2 s
-1)
At / A
Sensor-2
(0.66 mm)
At / A∞
At / A∞
At / A∞
0.0 0.2 0.4 0.6 0.8 1.0
0.0
5.0x10⁻⁴
1.0x10⁻³
1.5x10⁻³
2.0x10⁻³
Diffu
sio
n c
oeffic
ient (m
m2 s
-1)
At / A
Sensor-3
(1.32 mm)
0.0 0.2 0.4 0.6 0.8 1.0
0.00
1.50x10⁻⁷
3.00x10⁻⁷
4.50x10⁻⁷
6.00x10⁻⁷
Diffu
sio
n c
oeffic
ient (m
m2 s
-1)
At / A
Sensor-1
(0 mm)
0.0 0.2 0.4 0.6 0.8 1.0
0.0
1.5x10⁻⁵
3.0x10⁻⁵
4.5x10⁻⁵
6.0x10⁻⁵
7.5x10⁻⁵
Diffu
sio
n c
oe
ffic
ien
t (m
m2 s
-1)
At / A
Sensor-2
(0.66 mm)
(a)
(b)
(c)
Figure 8.16 Change in localised diffusion coefficient of the LY3505/XB3403 resin system for
hygrothermal conditioning at 50 oC based on the sensors embedded in the specimen configuration
– II (a) sensor-1; (b) sensor-2 and (c) sensor-3.
At sensor-3, which was embedded 1.32 mm away from the exposed surface, a different
transport phenomenon was observed where a decrease in the diffusion coefficient was
observed followed by an increase towards the equilibrium moisture content. The trend can be
attributed to the combined effect of the localised stresses and the chemical inhomogeneity at
Page 326
314
the sensing cavity. It is necessary to emphasis that the sensing region is small compared with
the overall specimen dimensions and possible localised material inhomogeneties that could
occur during resin mixing show a considerable influence on the moisture diffusion at the
sensing region. However, according to the spectra obtained after cross-linking and before
immersion of the specimens, it can be verified that there was no excess epoxy resin or amine
cross-linking agent left in the cross-linked system at the sensing regions.
On one hand, leaching of low-molecular weight species was observed in epoxy resins at
longer immersion times [278]. Therefore an increase in rate of water clustering could be
expected due to leaching of low-molecular weight segments by leaving more free volume at
prolong exposure. However the observed absorption behaviour cannot be supported on the
basis of leaching due to insufficient spectral evidence. On the other hand, interface
debonding due to capillary diffusion along the fibre/resin interface coupled with the influence
of increased strain mismatch at the interface may cause an increase in rate of moisture
diffusion into the sensing region [426].
8.2.2.2 Absorption kinetics: Specimen configuration – III
In specimen configuration – III, the locations of the embedded sensors through the thickness
of the specimens were kept the same as that in the configuration – II (see Figure 3.30).
However both sides of the specimens were exposed to water during hygrothermal
conditioning at 50 oC. Therefore as can be seen in Figure 3.30, sensor-3 was embedded 1.32
mm away from the surface where sensor-1 was embedded and at the same time the sensor was
0.68 mm away from the opposite side of the specimen, which was also exposed to water in
this specimen configuration. Similarly, sensor-2 was 0.66 mm away from sensor-1 and at the
same time 1.34 mm away from the opposite surface.
Page 327
315
0
0.2
0.4
0.6
0.8
1
0 5 10 15 20 25 30 35 40
Time1/2
/thickness (hour1/2
/mm)
At /
A∞
0
0.2
0.4
0.6
0.8
1
Mt /
M∞
Sensor-1 (0 mm)
Sensor-2 (0.66 mm)
Sensor-3 (1.32 mm)
Previous gravimetric data
0
0.2
0.4
0.6
0.8
1
0 5 10 15 20 25 30 35 40
Time1/2
/thickness (hour1/2
/mm)
At /
A∞
0
0.2
0.4
0.6
0.8
1
Mt /
M∞
Sensor-1 (0 mm)
Sensor-2 (0.66 mm)
Sensor-3 (1.32 mm)
Previous gravimetric data
Figure 8.17 Comparison of the sensor responses from the embedded sensors within the specimen
configuration – III and the conventional gravimetric results of the LY3505/XB3403 resin system
conditioned at 50 oC as a function of immersion time and the sensor location.
The localised absorption isotherms obtained based on the sensor responses are shown in
Figure 8.17. According to the observed localised transport phenomena of water, if the early
step-change behaviour is attributed to capillary diffusion from the edges as discussed before,
it seems unlikely the results are reproducible for the specimen configurations – II and – III.
However, the capillary diffusion is possible at prolong exposure to hygrothermal conditions
as discussed in Section 8.2.1. Therefore, the observed water transport behaviour could be due
to the combined effect of localised stress profile and the types of water-polymer interactions
as a function of immersion time.
Although sensor-1 was embedded at the surface, 74 minutes of delay in response to absorbed
moisture was observed compared to that seen from the sensor embedded in the specimen
Page 328
316
configuration – II. The delay can be attributed to possible deviation of the sensor location
along the thickness of the specimen. However, the influence of the magnitude and the mode
of process-induced stresses on the initial stage of diffusion are clearly evident from spectral
responses from the sensors -1 and -3. Except for the delay in response due to the distance
from the exposed surfaces, the initial pseudo-equilibrium level at the early stage of diffusion
is not visible at the sensor-3. Therefore it can be hypothesised that transport phenomena of
water in the polymer are strongly influenced by the resultant stress profile as a function of
immersion time. The resultant stress profile through the thickness of the specimen is a
function of process-induced stresses and moisture-induced stresses until equilibrium moisture
content is reached.
The effect can be further explained using the initial rates of diffusion observed at sensors -2
and -3. The sensors were approximately equally spaced from the closest surface of exposure
to water. Therefore both sensors detected moisture at nearly the same time. However the rate
of diffusion is higher at the sensor-2 compared with that apparent at the sensor-3. This can be
attributed to the non-uniform stress profile across the thickness of the specimen starting with
tensile stresses at the surface that was in contact with the glass moulding plate and decreasing
towards the opposite surface, which was on the open side of the mould. During the later stage
of diffusion, the first pseudo-equilibrium at the sensors -2 and -3 and the second pseudo-
equilibrium at the sensor-1 was attained approximately in the range of 0.4 – 0.5 moisture
uptake. After 61 days of exposure, moisture diffusion at all the sensors showed the same
transport behaviour. This feature coincides well with the nature of moisture absorption
observed from the embedded sensors in the specimen configuration – II for immersion time
over 57 days.
Page 329
317
0
0.2
0.4
0.6
0.8
1
0 10 20 30 40 50 60
Time1/2
/thickness (hour1/2
/mm)
At / A
∞
data
Cater-Kibler model
Multi-stage model
0
0.2
0.4
0.6
0.8
1
-10 0 10 20 30 40 50 60
Time1/2
/thickness (hour1/2
/mm)
At /
A∞
data
Cater-Kibler model
Multi-stage model
(a)
(b)
0
0.2
0.4
0.6
0.8
1
0 10 20 30 40 50 60
Time1/2
/thickness (hour1/2
/mm)
At / A
∞
data
Cater-Kibler model
Multi-stage model
0
0.2
0.4
0.6
0.8
1
-10 0 10 20 30 40 50 60
Time1/2
/thickness (hour1/2
/mm)
At /
A∞
data
Cater-Kibler model
Multi-stage model
(a)
(b)
Figure 8.18 Comparison between the sensor response and the diffusion models for hydrothermal
conditioning of the LY3505/XB3403 resin system at 50 oC: (a) sensor-1 and (b) sensor-2.
Page 330
318
0
0.2
0.4
0.6
0.8
1
-10 0 10 20 30 40 50 60
Time1/2
/thickness (hour1/2
/mm)
At /
A∞
data
Cater-Kibler model
Multi-stage model
(c)
0
0.2
0.4
0.6
0.8
1
-10 0 10 20 30 40 50 60
Time1/2
/thickness (hour1/2
/mm)
At /
A∞
data
Cater-Kibler model
Multi-stage model
(c)
Figure 8.19 Comparison between the sensor response and the diffusion models for hydrothermal
conditioning of the LY3505/XB3403 resin system at 50 oC: (c) sensor-3.
Table 8.3 Summary of kinetic parameters corresponding to best fit of the models to the spectral data
obtained from the specimen configuration–III for hygrothermal conditioning of the
LY3505/XB3403 resin system at 50 oC.
Sensor Location
0 mm 0.44 mm 1.32 mm
Dmm2 sec
-1)
sec-1
)
sec-1
)
sec-1
)
2.22 x 10⁻⁵
3.19 x 10⁻⁵
9.50 x 10⁻⁸
1.39 x 10⁻⁶
2.08 x 10⁻⁴
2.98 x 10⁻⁴
3.00 x 10⁻⁴
4.91 x 10⁻⁴
9.25 x 10⁻²
3.19 x 10⁻³
3.50 x 10⁻⁴
4.01 x 10⁻³
Page 331
319
0.0 0.2 0.4 0.6 0.8 1.0
0.0
1.0x10⁻⁷
2.0x10⁻⁷
3.0x10⁻⁷
Diffu
sio
n c
oeffic
ient (m
m2 s
-1)
At / A
Sensor-1
(0 mm)
At / A∞
At / A∞
At / A∞
(a)
(b)
0.0 0.2 0.4 0.6 0.8 1.0
0.0
5.0x10⁻⁴
1.0x10⁻³
1.5x10⁻³
2.0x10⁻³
Diffu
sio
n c
oe
ffic
ien
t (m
m2 s
-1)
At / A
Sensor-2
(0.66 mm)
0.0 0.2 0.4 0.6 0.8 1.0
0.0
5.0x10⁻⁴
1.0x10⁻³
1.5x10⁻³
Diffu
sio
n c
oeff
icie
nt
(mm
2 s
-1)
At / A
Sensor-3
(1.32 mm)
(c)
0.0 0.2 0.4 0.6 0.8 1.0
0.0
1.0x10⁻⁷
2.0x10⁻⁷
3.0x10⁻⁷
Diffu
sio
n c
oeffic
ient (m
m2 s
-1)
At / A
Sensor-1
(0 mm)
At / A∞
At / A∞
At / A∞
(a)
(b)
0.0 0.2 0.4 0.6 0.8 1.0
0.0
5.0x10⁻⁴
1.0x10⁻³
1.5x10⁻³
2.0x10⁻³
Diffu
sio
n c
oe
ffic
ien
t (m
m2 s
-1)
At / A
Sensor-2
(0.66 mm)
0.0 0.2 0.4 0.6 0.8 1.0
0.0
5.0x10⁻⁴
1.0x10⁻³
1.5x10⁻³
Diffu
sio
n c
oeff
icie
nt
(mm
2 s
-1)
At / A
Sensor-3
(1.32 mm)
(c)
Figure 8.20 Change in localised diffusion coefficient of the LY3505/XB3403 resin system for
hygrothermal conditioning at 50 oC based on the sensors embedded in the specimen configuration
– III (a) sensor-1; (b) sensor-2 and (c) sensor-3.
The kinetics of moisture diffusion of the specimen configuration – III were analysed using the
Carter-Kibler model and the multi-stage model. According to Figure 8.18(a and b), Figure
8.19 and Table 8.3, it can be clearly seen that the Carter-Kibler model is not suitable for
Page 332
320
predicting the localised transport phenomena in the epoxy resin while the multi-stage model
provides a good approximation to the sensor responses.
Figure 8.20(a-c) shows the change in diffusion coefficient at each sensor location as a
function of fractional moisture uptake. It can be clearly seen that the rate of diffusion
increases in the range of 0.6 – 1.0 fractional moisture uptake. This could be attributed to
either water clustering, capillary diffusion or both as discussed in Section 8.2.1.
8.3 Conclusions
An attempt was made to explain the localized diffusion behaviour observed using embedded
fibre optic sensors. A reasonable correlation was observed between sensor response via near-
IR transmission spectroscopy and gravimetric results; however, gravimetric analysis found to
be less sensitive to localised diffusion characteristics within the resin. Possible issues related
to the observed deviation of moisture absorption behaviour in the LY3505/XB3403 resin
system from Fickian diffusion model was discussed. The applicability of two other
anomalous diffusion models for predicting the moisture transport phenomena in the epoxy
resin system was also investigated. It was observed that the residual stresses in the resin
system have a considerable influence on the localised moisture diffusion characteristics.
Page 333
321
Chapter 9
General conclusions and further
recommendations
9 Overview
9.1 Introduction
This chapter contains a brief summary of the results presented in this thesis. The research
consisted of four main sections. A brief description is given of the results obtained and
conclusions drawn under each section. Some recommendations for future work that could be
carried out to further the research also will be discussed.
9.2 Conclusions
Design of low-cost fibre-optic sensors
Three sensor fixtures for obtaining near infrared transmission spectroscopy were designed and
evaluated. In the epoxy substrate sensor design, making a sensor with good quality was
Page 334
322
observed to be considerably dependent on the experience of the operator. Although the
dimensions of the abraded capillary sensor design were smaller compared with other sensor
designs, sensor fabrication was found to be more complicated due to practical difficulties
experienced during fixture fabrication. In the capillary support sensor design, sensor
fabrication was more robust and time-efficient compared to other sensor designs tested.
Reasonable dimensional consistency of the sensor was also achieved. Capillary reflector
sensor design was evaluated for obtaining near-infrared reflectance spectroscopy and a
reasonable reproducibility was achieved in terms of sensor fabrication and the quality of the
sensor.
Monitoring of cross-linking reaction using fibre-optic spectroscopy
Capillary support and capillary reflector sensor designs were chosen for in situ monitoring of
cross-linking reaction of an epoxy resin system under both transmission mode and reflection
mode. Cross-linking kinetics of the epoxy/amine resin system was studied at four isothermal
reaction temperatures, namely 40, 50, 60 and 70 oC while near infrared spectra were recorded
in real-time using the sensor designs.
Detailed peak assignments for the epoxy/amine resin system were given and three different
spectral analysis techniques were employed to resolve the overlapped absorption band with
the epoxy absorption band in the spectral range of 2180 – 2226 nm. Subtracting the peak area
of the hidden absorption band from the total peak area was found to give most accurate results
for determining the change in epoxy peak area. The change in epoxy, primary, secondary and
hydroxyl groups during cross-linking were monitored. Mass balance equations were used to
determine the change in secondary and hydroxyl group concentrations during cross-linking.
Page 335
323
Results showed that the contribution of the etherification reaction towards epoxy conversion
is negligible at the reaction conditions studied. Good correlation was observed between the
data obtained using the transmission sensor (capillary support sensor design) and the
reflectance sensor (capillary reflector sensor design).
An empirical model was used to predict the cross-linking kinetics using degree of epoxy
conversion and the reaction mechanism of the LY3505/XB3403 resin system showed
autocatalytic behaviour. A single equation was developed to describe the cross-linking
reaction of the epoxy/amine resin system as a function of reaction temperature. Good
agreement was observed between the predicted model and the spectral results obtained using
two fibre-optic sensor designs.
Proof-of-concept of multi-functional sensor design
Proof-of-concept of EFPI-based multi-functional sensor design was successfully
demonstrated for monitoring of cross-linking reaction. The rationale of the sensor design was
to monitor temperature, strain, refractive index and chemical reaction simultaneously using a
single interrogation unit, namely a conventional FTIR spectrometer. The feasibility of using
the FTIR spectrometer to interrogate the primary Fabry-Perot cavity and the FBG sensor was
also demonstrated. Primary EFPI/FBG sensor response to temperature and strain was
characterized in detail using separate EFPI and FBG sensors. Temperature sensitivity of the
EFPI and FBG sensors were evaluated within the range 30 – 80 oC. With regard to EFPI
sensor, no clear relationship was observed between the temperature and the sensor response at
the test conditions studied. However, the FBG sensor showed a linear response to the
temperature and the temperature sensitivity was in good agreement with the published results.
Page 336
324
Strain sensitivity of the sensors was evaluated using embedded EFPI and FBG sensors in the
epoxy resin system. The cross-linking reaction was carried out at 60 o
C for 8 hours and the
residual strain developed in the resin system while cooling down to the ambient temperature
was monitored. Reasonable agreement was observed with the strain obtained using EFPI and
FBG sensors.
The feasibility of using the multi-functional sensor design for monitoring chemical
conversion, strain, temperature, and Fresnel reflection during the cross-linking of the resin
system was demonstrated. The conventional FTIR spectrometer was used to interrogate the
primary and secondary sensors. Good correlation was observed for degree of conversion
obtained from the secondary chemical sensor attached to the multi-functional sensor, and
conventional transmission FTIR spectroscopy experiments. Good correlation was also
observed between the Fresnel-based secondary sensor results that were monitored via the
spectrometer.
Moisture ingress monitoring using conventional analytical techniques
Based on gravimetric measurements, moisture absorption in the LY3505/XB3403 resin
system satisfies Fickian diffusion behaviour and the equilibrium moisture content and the
absorption kinetics obtained are in good agreement with the published results. The diffusion
coefficient appeared to be independent of the thickness. A numerical method based on a
finite difference solution was used to predict the moisture diffusion front across the thickness
of a specimen as a function of immersion time. Reasonable correlation was observed between
experimental measurements and that determined using the numerical solution.
Page 337
325
DSC, TGA, DMTA and FTIR techniques were also employed to investigate the absorption
mechanism of water in the epoxy/amine resin system that immersed in water at 30°, 50° and
70°C. The results showed that the absorbed water exists in the epoxy/amine resin system as
two different types; bound water and free water. The bound water is characterized by strong
interactions with hydrophilic groups available in the resin, which govern the absorption
kinetics. The bound water molecules are divided into two types. Type-I bonding corresponds
to the formation of single hydrogen bonding between water molecules and the nucleophilic
sites in the network. The water molecules possess lower activation energy and are easy to
remove. Type-II bonding corresponds to water molecules forming multiple hydrogen bonds in
the matrix network. These water molecules possess higher activation energy and are difficult
to remove. The overall diffusion within the bulk resin is a combined and competitive process
of the two types of water and the overriding mechanism found to be highly dependent on the
immersion temperature and exposure time.
A decrease in Tg was observed due to absorbed moisture at all immersion temperatures. The
Type-I bound water molecules disrupt the intramolecular bonding between epoxy chains and
decreases Tg due to plasticisation, whereas Type-II bound water contributes to an increase of
Tg by forming intermolecular networks. It was also noted that these interactions possess
direct influence on the short-term and also on the long-term viscoelastic behaviour of the resin
system.
Moisture ingress monitoring fibre-optic spectroscopy
In situ moisture ingress monitoring in the resin system using fibre-optic near-infrared
spectroscopy was successfully demonstrated using the capillary support sensor design.
Page 338
326
Diffusion kinetics of water in the epoxy/amine resin system at 50 oC was studied in real-time
using fibre-optic spectroscopy. Fibre-optic sensors were embedded at different heights
relative to the faces of the specimen exposed to water. Three different specimen
configurations were used to study the localised diffusion behaviour under different exposure
conditions. A set of reference specimens was conditioned at the same environmental
conditions to monitor the weight uptake due to absorbed water. With reference to the
gravimetric analyses, the presence of fibre-optic sensors does not appear to affect the
diffusion kinetics of water in the bulk resin.
The change in normalised peak area of the absorption band at 1905 nm due to a combination
of O-H stretching and bending was used to obtain diffusion isotherms corresponding to each
sensor location. In addition, the variation in the shape of the absorption band appearing at
1430 nm was used to predict the diffusion behaviour of water as a function of immersion
time. The peak was attributed to the first overtone of the symmetric stretching vibration of
alcoholic OH. Anomalies associated with localised diffusion behaviour of water observed
based on the sensor responses could be attributed to the spectral quality, leaching of low-
molecular weight substances and the local stress/strain field due to process- and moisture-
induced stresses.
9.3 Further recommendations
The research work presented in this thesis showed the potential benefits of using fibre-optic
near-infrared spectroscopy for in situ monitoring of cross-linking reaction and moisture
ingress in epoxy/amine resin systems. However, the following are suggested to further the
Page 339
327
research and to gain in-depth understanding of reaction kinetics of the resin system during
processing and diffusion kinetics of water in the cross-linked resin system in a hygrothermal
environment.
Analysis of spectral data obtained during cross-linking showed that the absorption band
appeared at 1532 nm is an overlapped band of primary and secondary amine peaks. This is
the only band appearing in the near infrared region that contains information on the secondary
amine group concentration. Due to time constraints, no attempt was made during this study to
develop a method to resolve this combination band and to determine the change in secondary
amine concentration using spectral data. Instead, a mathematical approach based on the Beer-
Lambert law was used to calculate the secondary amine concentration using the concentration
of epoxy and primary amine groups. However, to predict the actual reaction mechanism of
the epoxy/amine resin system, there is merit in understanding the actual trend of changes in
secondary amine group concentration as a function of reaction time and temperature.
Therefore, developing a simple and more accurate method would be advantageous.
Chapter 6 presented proof-of-concept of a new multi-functional sensor design for monitoring
chemical conversion, strain, temperature and refractive index simultaneously during cross-
linking of the epoxy/amine resin system. Although the sensor design showed promising
results, further improvements of sensor fabrication, sensor interrogation and data analysis and
interpretation are essential to enhance the feasibility of using the sensor design for in situ
monitoring of cross-linking reactions. The sensor design can be also used for other sensing
applications such as monitoring moisture ingress, ingress of other chemicals, H2 and structural
integrity.
Page 340
328
The influence of moisture absorption on the chemical properties of the epoxy/amine resin
system was investigated using conventional near-infrared spectroscopy. However, the results
showed that the spectral evidence available on different types of water/polymer interactions
was less compared to that could be available in the mid infrared region. Getting more insight
in to the types of water/polymer interactions and the changes in these interactions as a
function of immersion temperature and time improves the understanding of diffusion
behaviour of water in the resin system. Therefore, extending spectral investigation into both
the mid- and near-infrared regions may have a significant impact on predicting diffusion
behaviour of water in epoxy/resin systems.
Furthermore, it was suggested that leaching of low-molecular weight species from the aged
specimens is possible at long immersion times and at higher temperatures. This may have an
impact on the water transport behaviour in cross-linked epoxy resin systems and therefore on
the diffusion coefficient. However, no spectral evidence was observed that related to leaching
of low-molecular weight species within the near-infrared region. Studies in this area can be
further extended by analysing samples of the water that was used for conditioning the epoxy
specimens. Analytical techniques such as HPLC or chemical titration could be employed to
analyse the water samples as a function of immersion time and temperature. This may also
provide evidence for observed trends of the changes in Tg of the resin system due to
hygrothermal ageing.
The results presented in Chapter 8 showed that the localised diffusion phenomena observed
using embedded fibre-optic sensors significantly deviated from the traditional Fickian
diffusion. It was also discussed that the observed behaviour could be due to localised strain
developed as a result of process-induced and moisture-induced stresses. The data obtained
Page 341
329
via embedded fibre-optic sensors showed promising results for confirming that there could be
a significant impact of localised stress/strain fields on the diffusion behaviour of water.
However, the sensor designs used in the current study did not provide direct evidence of strain
at the sensor locations. Implementation of the experimental set-up to verify these findings
would provide a significant understanding of how the localised stress/strain field affects the
transport behaviour of water in the epoxy/amine resin as a function of thermal history.
Page 342
330
References
1 Mouritz, A.P., Gellert, E., Burchill, P. and Challis, K. Review of advanced composite
structures for naval ships and submarines: Comp. Struct., 53, 2001, pp 21-41.
2 Ochoa, O. O. and Salama, M. M. Offshore composites: Transition barriers to an
enabling technology. Comp. Sci. Technol., 65, 2005, pp 2588-2596.
3 Seica, M. V. and Packer, J. A. FRP materials for the rehabilitation of tubular steel
structures for underwater applications. Comp. Struct., 80, 2007, pp 440-450.
4 Liu, L. and Wanger, H. D. Rubbery and glassy epoxy resins reinforced with carbon
nanotubes. Comp. Sci. Technol., 65, 2005, pp 1861-1868.
5 Low, I. M., Mai, Y. W. and Bandyopadhayay, S. Effect of temperature and rate on
fracture toughness of short-alumina-fibre-reinforced epoxies. Comp. Sci. Technol., 43,
1992, pp 3-12.
6 Bogetti, T. A. and Gillespie, J. W., Jr. Process-induced stress and deformation in thick-
section thermoset composite laminates. J Comp. Mater., 26(5), 1992, pp 626-659.
7 Day, D. R. Cure characterization of thick composite parts using dielectric and finite
difference analysis. 38th
Int. SAMPE Symp. Anaheim, CA., 10 – 13 May 1993.
8 Plepys, S. T. and Farris, R. J. Evolution of residual stresses in three-dimensionally
constrained epoxy resins. Polym., 31, 1990, 1932-1936.
9 Sala, G. Composite degradation due to fluid absorption. J. Comp.: Part B, 31, 2000,
pp. 357-373.
10 Karbhari, V. M., Chin, J. W., Hunston, D., Benmokrane, B., Juska, T., Morgan, R.,
Lesko, J. J., Sorathia, U. and Reynaud, D. Durability gap analysis for fibre-reinforced
polymer composites in civil infrastructure. Journal of Composites for Construction, 2003,
pp 238-247.
Page 343
331
11 Schutte, C. L. Environmental durability of glass-fibre composites. Mater. Sci. Eng.,
R13, 1994, pp 265-324.
12 Wright, W. W. The effect of diffusion of water into epoxy resins and their carbon-fibre
reinforced composites, Composites, 12(3), 1981, pp 201-205.
13 Vesely, D. Diffusion of liquids in polymers. Int. Mater. Rev., 53(5), 2008, pp 299-315.
14 Xian, G. and Karbhari, V. M. DMTA based investigation of hygrothermal aging of an
epoxy system used in rehavilitation. J. App. Poly. Sci., 104, 2007, pp 1084-1094.
15 McEwan, I., Pethrick, R. A. and Shaw, S. J. Water absorption in a rubber-modified
epoxy resin; carboxyl terminated butadiene acrylonitrile-amine cured epoxy resin system.
Polym., 40, 1999, pp 4213-4222.
16 Merdas, I., Thominette, F., Tcharkhtchi, A. and Verdu, J. Factors governing water
absorption by composite matrices. Comp. Sci. Technol., 62, 2002, pp 487-492.
17 Philippe, L., Sammon, C., Lyon, S.B. and Yarwood, J. An FTIR/ATR in situ study of
sorption and transport in corrosion protective organic coatings Paper 2. The effects of
temperature and isotopic dilution. Progress in Organic Coatings, 49, 2004, pp 315-323.
18 Lin, Y. C. and Chen, X. Investigation of moisture diffusion in epoxy systems:
Experimental and molecular dynamic simulations. Chem. Phys. Lett., 412, 2005, pp 322-
326.
19 Arbebili, H., Hillman, C., Natishan, A. E., McCluskey, P. Pecht, M. G. and Peterson,
D. A comparison of the theory of moisture diffusion in plastic encapsulated
microelectronics with moisture sensor chip and weight-gain measurements. IEEE
Transactions on Components and Packaging Technologies, 25(1), 2002, pp 132-139.
20 Ganesh, A. B. and Radhakrishnan, T.K. Fibre-optic sensors for the estimation of pH
within natural biofilms on metals. Sensors and Actuators - Part B,
doi:10.1016/j.snb.2006.11.027, (2006).
Page 344
332
21 Calvert, P., George, G. and Rintoul, L. Monitoring of cure and water uptake in
freeformed epoxy resin by an embedded optical fiber. Chem. Mater., 8, 1996, pp 1298 –
301.
22 Bormashenko, E., Sheshnev, A., Pogreb, R., Sutovski, S., Reichlin, Y., Shulzinger, E.
and Katzir, A. Study of water diffusion in polyacrylonitrile using IR fibre optic
evanescent wave spectroscopy. Polymers for Advanced Technologies, 13, 2002, pp 1039-
1045.
23 Laralekas, D., Cuganoni, J. and Botsis, J. Monitoring of hygrothermal ageing effects in
an epoxy resin using FBG sensor: A methodological study. Composites Science and
Technology, 69, 2009, pp 507-514.
24 Morgan, R. J. and Neal, J. E. O. A review of the relation between the physical structure
and mechanical response of Epoxies. In: Labana, S. S. Ed. Chemistry and Properties of
Crosslinked Polymers. New York: Academic Press Inc., 1977, pp 289-301.
25 Martin, G. C. Tungare, A. V. and Gotro, J. T. Modelling rheological and dielectric
properties during thermodet cure. In: Craver C. D. and Provder T. Eds. Polymer
Characterization. Washington, America Chemical Society, 1990, pp 235-248.
26 Jones, F. R. Epoxy resins in: Jones, F.R. Ed. Handbook of Polymer-Fibre Composites.
UK, Longman Scientific & Technical, 1994, pp 86-96.
27 Bar, H., Narkis, M. and Boiteux, G. The electrical behaviour of thermosetting polymer
composites containing metal plated ceramic filler. Polym. Comp., 2005, DOI
10.1002/pc.20064.
28 Almusallam, A. A., Khan, F. M., Dulaijan, S. U. and Al-Amoudi, O. S. B.
Effectiveness of surface coatings in improving concrete durability. Cement & Concrete
Composites, 25, 2003, pp 473-481.
Page 345
333
29 Abdel-Magid, B., Ziaee, S., Gass, K. and Schneider, M. The combined effect of load,
moisture and temperature on the properties of E-glass/epoxy composites. Comp. Struct.,
71, 2005, pp 320-326.
30 Mika, T. F. and Bauer, R. S. Curing agents and modifiers. In: May, C. A., Ed. Epoxy
resins: chemistry and technology. 2nd
Edition. California, USA, CRC Press, 1988, pp 465-
550.
31 Jiawu, G., Kui, S. and Mong, G. Z. The cure behaviour of tetraglycidyl
diaminodiphenyl methane with diaminodiphenyl sulfone. Thermochimica Acta, 352-353,
2000, pp 153-158.
32 Petrie, E. M. Handbook of Adhesives and Sealants. 2nd
Ed. USA: McGraw-Hill, 2006,
pp 378-390.
33 Bolger, J. C. Structural Adhesives: Today’s State of the Art. In: Schneberger G. L. Ed.
Adhesives in Manufacturing. New York: Marcel Dekker, Inc. New York, 1983, pp 133-
195.
34 Soni, H. K., Patel, V. S. and Patel, R. G. Studies on cure kinetics and thermal stability
of liquid epoxy resin based on bisphenol-C and epichlorohydrin using different amines as
curing agents. Thermochimica Acta, 191, 1991, pp 307-316.
35 Pakekh, J. K., Patel, R. G. and Patel, V. S. Studies on the properties of glass-reinforced
composites of various difunctional epoxies. in: Bhardwaj I. S. Ed. Polymer Science:
Recent Adcances. Vol. 2. France: Technip, 1994, pp 515-520.
36 Teh, P. L., Mariatti, M., Wagiman, A. N. R. and Beh, K. S. Effect of curing agent on
the properties of mineral silica filled epoxy composites. Polym. Comp., 2008, DOI
10.1002/pc.20345.
Page 346
334
37 Luck, R. M. and Sadhir, R. K. Monomers that expand during polymerisation. In: Luck
R. M. and Sadhir R. K. Eds. Expanding Monomers: Synthesis, Characterization and
applications. Florida, CRC Press Inc., Florida, 1992, pp 21-63.
38 Rozenberg B. A. Kinetics, thermodynamics and mechanism of reactions of epoxy
oligomers with amines. Advances in Polymer Science, 75, 1985, pp 113-165.
39 Cole, K. C. A new approach to modelling the cure kinetics of epoxy amine
thermosetting resins. 1. Mathematical development. Macromolecules, 24, 1991, pp 3093-
3097.
40 Smith, I. T. The mechanism of the cross-linking of epoxide resins by amines, Polym.,
2, 1961, pp 95-108.
41 Connors, K.A. Chemical Kinetics: The Study of Reaction Rates in Solution. John
Wiley Publishing, New York, 1990.
42 Macan, J. Ivankovic, H. Ivankovic, M. and Mencer, H.J. Study of cure kinetics of
epoxy-silica organic-inorganic hybrid materials. Thermochimica acta, 414, 2004, pp 219-
225.
43 Talbot, J. D. R. The kinetics of the epoxy amine cure reaction from a solvation
perspective. J. Polym. Sci. Part A, 42, 2004, pp 3579-3586.
44 Girard-Reydet, E., Richardi C. C., Sautereau H., Pascault J. P. Epoxy-Aromatic
diamine kinetics. 1. Modelling and influence of the diamine structure. Macromolecules,
28, 1995, pp 7599-7607.
45 Bonnet, A., Pascault, J. P., Sautereau, H., Taha, M. and Camberlin, Y. Epoxy-diamine
termoset/thermoplastic blends. 1. Rates of reactions before and after phase separation.
Macromolecules, 32, 1999, pp 8517-23.
Page 347
335
46 Chiao, L. Mechanistic reaction kinetics of 4,4’-Diaminodiphenyl sulfone cured
tetraglycidyl-4,4’-diaminodiphenylmethane epoxy resins. Macromolecules, 23, 1990, pp
1286-90.
47 Xu, L. and Schlup, J. R. Etherification versus amine addition during epoxy resin/amine
cure: An in situ study using near-infrared spectroscopy. J Appl. Polym. Sci., 67, 1998, pp
895-901.
48 Gupta, N. and Varma, I. K. Effect of structure of aromatic diamines on curing
characteristics, thermal stability and mechanical properties of epoxy resins. J. Appl. Poly.
Sci., 68, 1998, pp 1759-1766.
49 Mijovic, J. and Wijaya, J. Reaction kinetics of epoxy/amine model systems. The effect
of electrophilicity of amine molecule. Macromolecules, 27, 1994, pp 7589-7600.
50 Ašperger, S. Chemical Kinetics and Inorganic Reaction Mechanisms. 2nd
revised
edition. London, Springer, 2003, pp 3-51.
51 Frost, A. A. and Pearson, R .G. Kinetics and Mechanism. New York: John Wiley &
Sons Inc., 1962, pp 8-76.
52 Cole, K. C., Hechler, J. J. and Noël, D. A new approach to modelling the cure kinetics
of epoxy amine thermosetting resins. 2. Application to a typical system based on Bis[4-
(diglycidylamino)phenyl]methane and Bis(4-aminophenyl) sulfone. Macromolecules, 24,
1991, pp 3098-3110.
53 Xu, L., Fu, J. H. and Schlup, J. R. In situ near-infrared spectroscopic investigation of
the kinetics and mechanisms of reactions between phenyl glycidyl ether (PGE) and
multifunctional aromatic amine. Ind. Eng. Chem. Res., 35, 1996, pp 963-972.
54 Shechter, L., Wynstra, J. and Kurkjy, R.P. Glycidyl ether reactions with amines.
Industrial and Engineering Chemistry, 48(1), pp 94-97.
Page 348
336
55 Hong, S. G. and Wu, C. S. DSC and FTIR analyses of the curing behaviour of
epoxy/dicy/solvent systems on hermetic specimens. Journal of Thermal Analysis and
Calorimetry, 59, 2000, pp 711-719.
56 Mijovic, J., Arnon, F. and Wijaya, J. Mechanistic modelling of epoxy-amine kinetics.
1. Model compound study. Macromolecules, 25, 1992, pp 979-985.
57 Sautereau, J. P. P. H., Verdu, J. and Williams, R. J. J. Thermosetting Polymers. New
York: Marcel Dekker, Inc., 2002, pp 6-65.
58 St John, N. A., George, G. A., Cole-Clarke, P. A., Mackay, M. E. and Halley, P. J. The
effect of impurities on gel times for TGDDM epoxy cured with DDS. High Perform.
Polym., 5, 1993, pp 21-36.
59 Swern, D., Billen, G. N. and Knight, H. B. Chemistry of epoxy compounds. VIII.
Reaction of allyl alcohol with unsymmetrical oxirane compounds. An electronic
interpretation. J Am. Chem. Sco., 71, 1949, pp 1152-1156.
60 Morgan, R. J. and Mones, E. T. The cure reactions, network structure and mechanical
response of diaminodiphenyl sulfone-cured tetraglycidyl 4,4’ diaminodiphenyl methane
epoxies. J App. Polym. Sci., 33(4), 1987, pp 999-1020.
61 Ellis, B. Time-Temperature-Transformation diagrams for thermosets. in: Jones, F. R.
Ed. Handbook of Polymer-Fibre Composites, UK, Longman Scientific & Technical, 1994,
pp 115-121.
62 Um, M. K., Daniel, I. M. and Hwang, B. S. A study of cure kinetics by the use of
dynamic differential scanning calorimetry. Comp. Sci. Tech., 62, 2002, pp 29 – 40.
63 Blanco, M., Corcuera, M. A., Riccardi, C. C. and Mondragon I. Mechanistic kinetic
model of an epoxy resin cured with a mixture of amines of different functionalities.
Polym., 46, 2005, pp 7989-8000.
Page 349
337
64 Hargis, M., Grady, B. P., Aktas, L., Bomireddy, K. R., Howasman, S., Altan, C., Rose,
T. and Rose, H. Calorimetric and rheological measurements of three commercial
thermosetting prepreg epoxies. J. Comp. Mater., 40, 2005, pp 1 – 25.
65 Abdelkader, A. F. and White, J. R. Curing characteristics and internal stresses in epoxy
coatings: Effect of crosslinking agent. J. Mater. Sci., 40, 2005, pp 1843-1854.
66 Fuller, B., Gotro, J. T. and Martin, G. C. Analysis of the glass transition temperature,
conversion and viscosity during epoxy resin curing in: Craver, C. D. and Provder, T. Eds.
Polymer Characterization, Washington: American Chemical Society, 1990, pp 215-234.
67 Acitelli, M. A., Prime, R. B. and Sacher, E. Kinetics of epoxy cure: 1. The system
Bisphenol-A diclycidyl ether/m-phenylene diamine. Polym., 12(5), 1971, pp 335-343.
68 Sacher, E. Kinetic of epoxy cure: 3. The systems bisphenol-A epoxides/dicy. Polym.,
14, 1973, pp 91-95.
69 Ruiz, E. and Trochu, F. Thermomechanical properties during cure of glass-polyester
RTM composites: Elastic and viscoelastic modelling. J. Comp. Mater., 39(10), 2005, pp
881-916.
70 Sourour, S. and Kamal, M. R. Differential scanning calorimetry of epoxy cure:
isothermal cure kinetics. Thermochim Acta, 14, 1976, pp 41-59.
71 Tai, H. J. and Chou, H. L. chemical shrinkage and diffusion-controlled reaction of an
epoxy molding compound. Euro. Polym. J., 36, 2000, pp 2213 – 2219.
72 Kamal, M. R. and Svourour, S. Kinetics and thermal characterization of thermoset
cure. Polym. Eng. Sci., 13(1), 1973, pp 59–64.
73 Costa, M. L., Pardine, L. C. and Rezende, M. C. Influence of aromatic amine hardeners
in the cure kinetics of an epoxy resin used in advanced composites. Mater. Res., 8(1),
2005, pp 65-70.
Page 350
338
74 Deng, Y. and Martin, G. C. Diffusion and diffusion-controlled kinetics during epoxy-
amine cure. Macromolecules, 27, 1994, pp 5147-5153.
75 Brnardic, I., Ivankovic, M., Ivankovic, H. and Mencer, H.J. “Isothermal and
nonisothermal cure kinetics of an epoxy/poly(oxypropylene)diamine/octadecyl
ammonium modified montmorillonite system. J. Appl. Polym. Sci., 100, 2006, pp 1765-
1771.
76 Lee, J. Y., Shim, M. J. and Kim, S.W. Autocatalytic cure kinetics of natural zeolite
filled epoxy composites. Mater. Chem. Phys., 48, 1997, pp 36-40.
77 Ruiz, E. and Billotte, C. Predicting the cure of thermosetting polymers: The
isoconversion map. Polym. Comp., 2008, DOI 10.1002/pc.20710.
78 Ryan, M. E. and Dutta, A. Kinetics of epoxy cure: a rapid technique for kinetic
parameter estimation. Polym., 20, 1979, pp 203-206.
79 Zvetkov, V. L. Comparative DSC kinetics of the reaction of DGEBA with aromatic
diamines. 1. Non-isothermal kinetic study of the raction DGEBA with m-phenylene
diamine, Polym., 42, 2001, pp 6687-6697.
80 Musto, P., Martuscelli, E., Ragosta, G., Russo, P. and Villano, P. Tetrafunctional
epoxy resins: modelling the curing kinetics based on FTIR spectroscopy data. J. Appl.
Polym. Sci., 74, 1999, pp 532-540.
81 Fernando, G. F., Liu, T., Crosby, P., Doyle, C., Martin, A., Brooks, D., Ralph, B. and
Badcock, R. A multi-purpose optical fibre sensor design for fibre reinforced composite
materials. Meas. Sci. Technol., 8, 1997, pp 1065-1079.
82 Crosby, P. A., Powell, G. R., Fernando, G. F., France, C. M., Spooncer, R. C. and
Waters, D. N. In situ cure monitoring of epoxy resins using optical fibre sensors. Smart
Mater. Struct. 5, 1996, pp 415-428.
Page 351
339
83 Larranaga, M., Martin, M. D., Gabilondo, N., Kortaberria, G., Corcuera, M. A.,
Riccardi, C. C. and Mondrangon, I. Cure kinetics of epoxy systems modified with block
copolymers. Polym. Int., 53, 2004, pp 1495 – 1502.
84 Zhao, H., Gao, J., Li, Y. and Shen, S. Curing kinetics and thermal property
characterization of bisphenol-F epoxy resin and MeTHPA system. J. Therm. Anal.
Calori., 74, 2003, pp 227-236.
85 Kim, J., Moon, T. J. and Howell, J. R. Cure kinetic model, heat of reaction, and glass
transition temperature of AS4/3501-6 graphite-epoxy prepregs. J. Comp. Mater., 36(21),
2002, pp 2479-2499.
86 Kenny, J. M. and Trivisano, A. Isothermal and dynamic reaction kinetics of high
performance epoxy matrices. Polym. Eng. Sci., 31(19), 1991, pp 1426-1433.
87 Planting, P. J. An approach for evaluating epoxy adhesives for use in hybrid
microelectronic assembly. IEEE Trans. Parts, Hybrids and Packaging, 11(4), 1975, PHP-
305-11.
88 Stone, G. C., Heeswijk, R. G. V. and Bartnikas, R. Investigation of the effect of
repetitive voltage surges on epoxy insulation. IEEE Trans. Energy Conversion, 7(4),
1992, pp 754-760.
89 Dodiuk, H. and Kenig, S. Low temperature curing epoxies for structural repairs. Prog.
Polym. Sci., 19, 1994, pp 439-467.
90 Ollier-Duréault, V. and Gosse, B. Photo-oxidation and electrical aging of anhydride-
cured epoxy resins. IEEE Trans. Dielectrics and Electrical Insulation, 5(6), 1998, pp 935-
943.
91 Lemma, E. Chen, L. Siores, E. and Wang, J. Study of cutting fibre-reinforced
composites by using abrasive water-jet with cutting head oscillation. Comp. Struct., 57,
2002, pp 297-303.
Page 352
340
92 Park, J. Shin, D.S., Delucca, J., Theis, C. and Osenbach, J. Critical aspect of curing
epoxy adhesive: Fibre pistoning of LC connector. IEEE Trans. Device and Materials
Reliability, 5(3), 2005, pp 572-580.
93 El-Sonbaty, I., Khashaba, U. A. and Machaly, T. Factors affecting the machinability
of GFR/epoxy composites. Comp. Struct., 63, 2004, pp 329-338.
94 Hodges, J., Yates, B., Darby, M. I. and Wostenholm, G. H. Residual stresses and the
optimum cure cycle for an epoxy resin. J. Mater. Sci., 24, 1989, pp 1984-1990.
95 White, S. R. and Hahn, H. T. Process modelling of composite materials: Residual
stress development during cure. Part I. Model formation. J. Comp. Sci., 26(16), 1992, pp
2402-2422.
96 Adolf, D. and Martin, J. E. Calculation of stresses in crosslinking polymers. J. Comp.
Mater., 30(1), 1996, pp 13-34.
97 Wang, S. and Garton, A. Chemical interaction at the interface between a carbon fiber and
a boron trifluoride-catalyzed epoxy matrix. J. App. Polym. Sci., 45, 1992, pp 1743-1752.
98 Yu, J. W. and Sung, C. S. P. Interphase cure characterization in epoxy composites by
fluorescence technique. J. Appl. Polym. Sci., 63 (13), 1997, pp 1769–1775.
99 Guo, Z. S. Effects of storage aging on the cure kinetics of T700/BMI prepreg for
advanced composites. Polym. Comp., 2008; DOI 10.1002/pc.20457.
100 Frigione, M. and Kenny, J. M. Effects of storage aging on the cure kinetics of
bismaleimide prepregs. Adv. Polym. Technol., 24(4), 2005, pp 253-265.
101 Valliappan, M., Roux, J. A. and Vaughan, J. G. Die and post-die temperature and cure in
graphite/epoxy composites. Composites: Part B, 27B(1), 1996, pp 1-9.
102 Perry, M. J., Lee, L.J. and Lee, C. W. On-line cure monitoring of epoxy/graphite
composites using a scaling analysis and a dual heat flux sensor. J. Comp. Mater., 26(2),
1992, pp 274-292.
Page 353
341
103 DeBakker, C. J., St John, N. A. and Geroge, G. A. Simultaneous differential scanning
calorimetry and near-infra-red analysis of the curing of TGDDM with DDS. Polym.,
34(4), 1993, pp 716-725.
104 Costa, M. L., Botelho, E. C., Rezende, M. C. Monitoring of cure kinetic prepreg and cure
cycle modelling. J. Mater. Sci., 41, 2006, pp 4349-4356.
105 Adolf, D. and Chambers, R. Verification of the capability for quantitative stress
prediction during epoxy cure. Polym., 38(21), 1997, pp 5481-5490.
106 Schoch, K. F. Jr, Panackal, P. A., and Frank, P.P. Real-time measurement of resin
shrinkage during cure. Thermochimica Acta, 417, 2004, pp 115-118.
107 Mijovic, J., Fishbain, A. and Wijaya, J. Mechanistic modelling of epoxy-amine kinetics.
1. Model compound study. Macromolecules, 25, 1992, pp 9979-9985.
108 Zukas, W. X. Tortional braid analysis of the aromatic amine cure of epoxy resins. J. Appl.
Polym. Sci., 53, 1994, pp 429-440.
109 Frey, T, Große-Brinkhaus K. –H. and Röckrath, U. Cure monitoring of thermoset
coatings, Progress in Organic Coatings, 27, 1996, pp 59-66.
110 Yu, D., Chen, H., Shi, Z. and Xu, R. Curing kinetics of benzoxazine resin by torsional
braid analysis, Polym., 43, 2002, pp 3163-3168.
111 Hofmann, K. and Glasser, W. G. Cure monitoring of an epoxy-amine system by dynamic
mechanical thermal analysis (DMTA), Thermochimica Acta, 166, 1990, pp 169-184.
112 Matsuoka, S., Quan, X., Bair, H. E. and Boyle, D.J. A model for the curing reaction of
epoxy resins. Macromolecules, 22, 1989, pp 4093-4098.
113 Hofmann, K. and Glasser, W. G. Cure monitoring of an epoxy-amine system by dynamic
mechanical thermal analysis (DMTA). Thermochimica Acta. 166, 1990, pp 169-184.
114 Mopsik, F. I., Chang, S. S. and Hunston, D.L. Dielectric measurements for cure
monitoring. Materials Evaluation, 47, 1989, pp 448-453.
Page 354
342
115 Maistros, G. M., and Partridge, I. K. Dielectric monitoring of cure in a commercial
carbon-fibre Composite. Comp. Sci. Technol., 53, 1995, pp 355-359.
116 Núñez-Regueira, L., Gracia-Fernández, C. A. and Gómez-Barreiro, S. Use of rheology,
dielectric analysis and differential scanning calorimetry for gel time determination of a
thermoset. Polym., 46, 2005, pp 5979-5985.
117 Ishii, Y. and Ryan, A.J. Processing of poly(2,6-dimethyl- 1,4-phenylene ether) with
epoxy resin. 2. Gellation mechanism. Macromoleucles. 33, 2000, pp 167-176.
118 Chen, D. and He, P. Monitoring the cure process of epoxy resin nanocomposites based on
organo-montmorillonite – a new application of resin curemeter. Comp. Sci. Technol., 64,
2004, pp 2501-2507.
119 Simpson, J. O. and Bidstrup, S. A. Rheological and dielectric changes during isothermal
epoxy-amine cure. J. Polym. Sci.: Part B., 33, 1995, pp 55-62.
120 Smith, B. C. Fundamentals of Fourier Transform Infrared Spectroscopy. USA: CRC
Press LLC, 1996, pp 7-11.
121 Stuart, B. Ed. Modern Infrared Spectroscopy. England: DJ. John Wiley & Sons., 1996.
122 Mirabella, F. M. Ed. Modern Techniques in Applied Molecular Spectroscopy. USA: John
Wiley & Sons, Inc., 1998, pp 1-10.
123 Leyden, D. E. and Murthy, R. S. S. Diffuse reflectance Fourier transform IR
spectroscopy. Trends in Analytical Chemistry, 7(5), 1988, pp 164-169.
124 Pate, C. B. and Noftle, R. E. Diffuse reflectance FTIR spectra of conducting polymeric
films. Synthetic Metals, 38, 1990, pp 259-261.
125 Li, W., Huang, Y. D., Liu, L. and Chen, N.T. Rapid and nondestrective analysis of
quality of prepreg cloth by near-infrared spectroscopy. Comp. Sci. Technol., 65, 2005, pp
1668-1674.
Page 355
343
126 Arvalo, F., Saavedra, R. and Paulraj, M. Optical characterization of semiconductor
materials by FTIR-PAS. J. Phys.: Conf. Series, 134, 2008, doi:10.1088/1742-
6596/134/1/012019.
127 Occhiello, E., Garbassi, F., Morra, M. and Nicolais, L. Spectroscopic characterization of
interfaces in polymer composites. Comp. Sci. Technol., 36, 1989, pp 133-151.
128 Sherman, C-P. Infrared Spectroscopy in Handbook of Instrumental Techniques for
Analytical Chemistry. Settle F. Ed. New Jersey: Prentice Hall PTR, 1997, pp 247-277.
129 Dumitrescu, O. R. Simultaneous differential scanning callorimetry – Fourier transform
infrared spectroscopy. Ph.D. Thesis, Cranfield University, England, 2003.
130 Degamber, B., Winter, D., Tetlow, J., Teagle, M. and Fernando, G. F. Simultaneous
DSC/FTIR/TMA. Meas. Sci. Technol., 15, 2004, L5-L10.
131 Workman, J. and Weyer, L. Practical guide to interpretative near-infrared spectroscopy.
Florida: CRC Press, 2007.
132 Rigail-Cedeno, A. and Sung, C. S. P. Fluorescence and IR characterization of epoxy
cured with aliphatic amines. Polym., 46, 2005, pp 9378 – 9384.
133 Varley, R. J., Heath, G. R., Hawthorne, D. G., Hodgkin, J. H. and Simon, G. P.
Toughening of a trifunctional epoxy system: 1. Near infra-red spectroscopy study of
homopolymer cure. Polym., 36(7), 1995, pp 1347-1355.
134 Maxwell, I. D. and Pethrick, R. A. Low temperature rearrangement of amine cured epoxy
resins. Polymer Degradation and Stability, 5, 1983, pp 275-301.
135 DeBakker, C. J., George, G. A., St John, N. A. and Fredericks P. M. The kinetics of the
cure of an advanced epoxy resin by Fourier transform Raman and near-IR spectroscopy.
Spectrochimica. Acta, 49A(5/6), 1993, pp 739-752.
136 Mijovic, J., Andjelić, S. and Kenny, J. M. In situ real-time monitoring of epoxy/amine
kinetics by remote near infrared spectroscopy. Polym. Adv. Technol.,7, 1995, pp. 1-16.
Page 356
344
137 Cossins, S. L., Connell, M. E., Cross, W. M., Winter, R. M. and Kellar, J. J. Evanescent
wave spectroscopy for in-situ cure monitoring. Chemical, Biochemical, and
Environmental Fiber Sensors VIII, Lieberman R. A. Ed. Proc. SPIE, 2836, 1996, pp 147-
156.
138 George, G., Hynard, N., Cash, G., Rintoul, L. and O’Shea, M. Spectroscopic probes for
real-time monitoring of polymer modification and degradation reactions. C. R. Chimie. 9,
2006, pp 1433-1443.
139 Navabpour, P., Nesbitt, A., Degamber, B., Fernendo, G., Mann, T. and Day, R.
Comparison of the curing kinetics of the RTM6 epoxy resin system using differential
scanning calorimetry and a microwave-heated calorimetry. J. Appl. Polym. Sci., 99, 2006,
pp 3658-3668.
140 Strehmel, V. and Scherzer, T. Structural investigation of epoxy amine networks by mid-
and near-infrared spectroscopy. Eur. Polym. J., 30(3), 1994, pp 361-368.
141 Lohman, F. H. and Norteman, W. E. Jr. Determination of primary and secondary
aliphatic amines by near-infrared spectrophotometry. Anal. Chem., 35(6), 1963, pp 707-
711.
142 Lin, Y. G., Santereau, H. and Pascault, J. P. BDMA-catalyzed DDA-epoxy resin system:
temperature and composition effects on curing mechanism. J. Polym. Sci. Part A, 24(9),
1986, pp 2171-2184.
143 Prime, R. B. and Sacher, E. Kinetics of epoxy cure: 2. The system bisphenol-A diglycidyl
ether/polyamide. Polym., 13, 1972, pp 455-458.
144 Ayambem, A., mecham, S. J., Sun, Y., Glass, T. E. and McGrath, J. E. End group
substituent effects on the rate/extent of network formation and adhesion for
phenylethynyl-terminated poly(arylene ether Sulfone) oligomers. Polym., 41, 2000, pp
5109 – 5124.
Page 357
345
145 Schab-Balcerzak, E., Janeczek, H., Kaczmarczyk, B., Bednarski, H., Sk, D. and
Miniewicz, A. Epoxy resin cured with diamine bearing azobenzene group. Polym., 45,
2004, pp 2483-2493.
146 Finzel, M. C., Delong, J. and Hawley, M. C. Effect of stoichiometry and diffusion on an
epoxy/amine reaction mechanism. Polym. Sci.: Part A., 33, 1995, pp 673-689.
147 George, G. A., Cole-Clarke, P., St. John, N. A. and Friend, G. Real-time monitoring of
the cure reaction of a TGDDM/DDS epoxy resin using fibre optic FTIR. J. App. Polym.
Sci., 42, 1991, pp 643-657.
148 St John, N.A. and George, G. A. Cure kinetics and mechanisms of a tetraglycidyl-4,4’-
diaminodiphenylmethane/diaminodiphenylsulphone epoxy resin using near i.r.
spectroscopy. Polym., 33(13), 1992, pp 2679-2687.
149 Crosby, P. In-situ cure monitoring of epoxy resin systems. PhD Thesis. Department of
Materials Engineering, Brunel University, England. 1997.
150 Liu, T. and Fernando, G. F. Processing of polymer composites: an optical fibre-based
sensor system for on-line amine monitoring. Composites: Part A., 32, 2001, pp 1561-
1572.
151 St John, N. A. and George, G. A. Diglycidyl amine-epoxy resin networks: Kinetics and
mechanisms of cure. Prog. Polym. Sci., 19, 1994, pp 755-795.
152 Kozielski, K. A., George, G. A., St John, N. A. and Billingham, N. C. Kinetic studies by
FT-NIR of the curing reactions of two glycidyl ether epoxy resins mixed with
stoichiometric quantities of 4,4’-DDS. High Perform. Polym., 6, 1994, pp 263-286.
153 Hoffmann, U., Pfeifer, F., Okretic, S., Volkl, N., Zahedi, M. and Siesler, H. W. Rheo-
optical Fourier transform infrared and Raman spectroscopy of polymers. App. Spect.,
47(9), 1993, pp 1531-1539.
Page 358
346
154 Mijovic, J. and Andjelic, S. Monitoring of reactive processing by remote mid infra-red
spectroscopy. Polym., 37(8), 1996, pp 1295-1303.
155 Mijovic, J. and Andjeli, S. In situ real-time monitoring of reactive systems by remote
fibre-optic-near-infra-red spectroscopy. Polym., 36(19), 1995, pp 3783-3786.
156 Min, B-G, Stachurski, Z. H. and Hodgkin, J. H. Cure kinetics of elementary reactions of a
DGEBA/DDS epoxy resin: 1. Glass transition temperature versus conversion. Polym.,
34(23), 1993, pp. 4908-4912.
157 Sichina, W. J. Better characterization of thermosets using stepscan DSC. Thermal
Analysis application note, ParkinElmerTM Instruments.
158 Serrano, B., Cabalelas, J. C., González-Benito, J., Baselga, J. and Bravo, J. Pyrene
fluorescence as a probe for the monitoring of polymerisation processes: Simultaneous
DSC and fluorescence study. Journal of Fluorescence., 7(4), 1997, pp 341-345.
159 Chern, B-C, Moon, T. J., Howell, J. R. and Tan, W. New experimental data for enthalpy
of reaction and temperature and degree-of-cure-dependent specific heat and thermal
conductivity of the Hercules 3501-6 epoxy system. J. Comp. Mater., 36, 2002, pp 2061-
2073.
160 Sickfeld, J., Mielke, W. Application of thermal analysis for the investigation of epoxy
resins. Progress in Organic Coatings. 12, 1984, pp 27-116.
161 Richardson, M. J. Curing of thermosets in: Calorimetry and Thermal Analysis of
Polymers, Mathot, V. B. F. Ed. New York: Hanser Publishers, 1993, pp 189-205.
162 Fava, R. A. Differential scanning calorimetry of epoxy resins. Polym., 9, 1968, pp 137-
151.
163 Prime, R. B., Kichalski, C. and Neag, C. M. Kinetic analysis of a fast reacting thermoset
system. Thermochimica Acta, 429, 2005, pp 213-217.
Page 359
347
164 Roşu, D., Caşcaval, C. N., Mustaţă, F. and Ciobanu, C. Cure kinetics of epoxy resins
studied by non-isothermal DSC data. Termochimica Acta. 383, 2002, pp 119-127.
165 Lu, M. G., Shim, M. J. and Kim, S. W. Dynamic DSC characterisation of epoxy resin by
means of the Avrami equation. Journal of Thermal Analysis and Calorimetry, 58, 1999,
pp 701-709.
166 Lee, W. I., Loos, A. C. and Springer, G. S. Heat of reaction, degree of cure, and viscosity
of Hercules 3501-6 resin. J Comp. Mater., 16, 1982, pp 510-520.
167 Nunez, L., Fraga, F., Fraga, L., Salgado, T. and Anon, R. Determination of the optimum
epoxy/curing agent ratio: A study of different kinetic parameters. Pure & Appl. Chem.,
67(7), pp 1091 – 1094.
168 Lelli, G., Terenzi, A., Kenny, J. M. and Torre, L. Modelling of the chemo-rheological
behavior of thermosetting polymer nanocomposites. Polym. Comp., 2009, DOI
10.1002/pc.20517.
169 Montanini, R., D’Acquisto, L. Simultaneous measurement of temperature and strain in
glass fibre/epoxy composites by embedded fibre optic sensors: I. Cure monitoring. Smart
Mater. Struct., 16, 2007, pp 1718-1726.
170 Roberts, S. S. J. and Davidson, R. Cure and fabrication monitoring of composite
materials with fibre-optic sensors. Comp. Sci. Technol., 49, 1993, pp 265-276.
171 Ungarish, M., Joseph, R., Vittoser, J. and Kenig, S. Cure cycle optimization of
composites by dielectric measurements. Composites, 21(6), 1990, pp 481-486.
172 Delides, C. G., Hayward, D., Pethrick, R. A. and Vatalis, A. S. Real time dielectric
investigations of phase separation and cure in rubber modified epoxy resin systems. Euro.
Polym. J., 28(5), 1992, pp 505-512.
Page 360
348
173 Mijovic, J., Kenny, J. M., Maffezzoli, A., Trivisano, A., Bellucci, F. and Nicolais L. The
principles of dielectric measurements for in situ monitoring of composite processing.
Comp. Sci. Technol., 49, 1993, pp 277-290.
174 Shtrauss, V. A study on the information capability of dielectric spectra in monitoring
nonisothermal cure processes. Mechanics of Composite Materials, 38(2), 2002, pp 181-
186.
175 Park, J-M, Lee, S-I and Choi, J-H. Cure monitoring and residual stress sensing of single-
carbon fibre reinforced epoxy composites using electrical resistivity measurement. Comp.
Sci. Technol., 65, 2005, pp 571-580.
176 Park, J-M, Kong, J-W, Kim, D-S and Lee, J-R. Non-destructive damage sensing and cure
monitoring of carbon fibre/epoxyacrylate composites with UV and thermal curing using
electro-micromechanical techniques. Comp. Sci. Technol., 64, 2004 pp 2565-2575.
177 Kazilas, M. C. and Partrige, I. K. Exploring equivalence of information from dielectric
and calorimetric measurements of thermoset cure-a model for the relationship between
curing temperature, degree of cure and electric impedance. Polym., 46, 2005, pp 5868-
5878.
178 Kim, J. S. and Lee, D. G. Analysis of dielectric sensors for the cure monitoring of resin
matrix composite materials. Sensors and Actuators B, 30, 1996, pp 159-164.
179 Saliba, T. E., Hofmann, D. and Smolinski, P. Development of an In situ Hall-effect
sensor for on-line monitoring of thickness and compaction during composite curing.
Comp. Sci. Technol., 51, 1994, pp 1-9.
180 Urabe, K., Okabe, T. and Tsuda, H. Monitoring of resin flow and cure with an
electromagnetic wave transmission line using carbon fibre as conductive elements. Comp.
Sci. Technol., 62, 2002, pp 791-797.
Page 361
349
181 Zimmermann, B, DiFrancia, C, Murphy, K, Vengsarkar, A. and Claus, R. Optical fibre
methods for autoclave and epoxy cure monitoring. in: Review of Progress in Quantitative
Nondestructive Evaluation. Thompson, D. O. and Chimenti, D. E., Eds. 9, New York:
Plenum Press, 1990, pp 2047-2053.
182 De Vries, M. J., Nasta, M, Patel, J, Kamdar, K, Lowden, R, Stinton, D, Allison, S, Muhs,
J. and Claus R.O. Survivability of optical fiber sensor elements embedded in silicone
carbide ceramic matrix composites. Smart Sensing, Processing and Instrumentation. Proc.
of SPIE. 1918, 1993, pp 55-59.
183 Wolfbeis, O. S. Fiber-optic chemical sensors and biosensors. Anal. Chem., 78, 2006, pp
3859-3874.
184 Fernando, G. F. Fibre optic sensor systems for monitoring composite structures. R P Asia
2005 Conference, Reinforced Plastics, Bangkok, December 2005, pp 41-49.
185 Fernando, G. F. and Degamber, B. Process monitoring of fibre reinforced composites
using optical fibre sensors. Inter. Mater. Reviews, 51(2), 2006, pp 1-42.
186 Jenny, R. Fundamentals of Fiber Optics – An Introduction for beginners. New York. Co.
Inc., 2000.
187 Rao, Y-J, Webb, D J, Jacson, D A., Zhang, L and Bennion, I. In-fiber Bragg-grating
temperature sensor system for medical applications”, J of Lightwave Tech. 15(5), 1997, pp
779-785.
188 Rolfe, P., Scopesi, F. and Serra, G. Advances in fibre-optic sensing in medicine and
biology. Meas. Sci. Technol., 8, 2007, pp 1683-1688.
189 Fan, Y and Kahrizi, D A Characterization of FBG strain gauge array embedded in
composite structure. Sensors And Actuators: Part A, 121, 2005, pp 297-305.
190 Dersey, A. D., Davis, M. D., Patric, J. H., KeBlanc, M. and Koo, K. P. Fiber grating
sensors. J of Lightwave Tech., 15(8), pp 1442-1463.
Page 362
350
191 Baulsir, C.F. and Simler, R. J. Design and evaluation of IR sensors for pharmaceutical
testing. Advanced Drug Delivery Reviews. 21, 1996, pp 191-203.
192 Druy, M. A., Glatkowski, P. J. and Stevenson, W. A. Applications of remote fibre optic
spectroscopy using IR fibers and Fourier transform infrared spectrometers. Infrared Fiber
Optics III. Proc. of SPIE. 1591, 1991, pp 218-224.
193 Tan, W., Shi, Z-Y and Kopelman, R Miniaturized fiber-optic chemical sensors with
fluorescent dye-doped polymers. Sensors and Actuators B, 28, 1995, pp 157-163.
194 DeGrandpre, M. D. and Baehr, M. M. Calibration-free optical chemical sensors. Anal.
Chem., 71, 1999, pp 1152-1159.
195 Rogers, D. G., Marand, E., Hill, D. J. T. and George, G. A. Anomalies between
microwave and thermal cure kinetics of epoxy-amine resin systems. High Perform.
Polym., 11, 1999, pp 27-39.
196 Powell, G. R., Crosby, P. A., Waters, D.N., France, C. M., Spooncer, R. C. and Fernando,
G. F. In-situ cure monitoring using optical fibre sensors – a comparative study. Smart
Mater. Struct., 7, 1998, pp 557-567.
197 Liu, T. and Fernando, G. F. Processing of polymer composites: an optical fibre-based
sensor system for on-line amine monitoring. Composites: A, 32, 2001, 1561-1572.
198 Nestitt, A., Navabpour, P., Degamber, B., Nightingale, C., Mann, T., Fernando, G. and
Day, R. J. Development of a microwave calorimeter for simultaneous thermal analysis,
infrared spectroscopy and dielectric measurements. Meas. Sci. Technol., 15, 2004 pp
2313-2324.
199 Zimmermann, B., Bürck, J. and Ache, H-J. Studies on siloxane polymers for NIR-
evanescent wave absorbance sensors. Sensors and Actuators. B. 41, 1997, pp 45-54.
200 Brown, J. M., Srinivasan, S., Rau, A., Ward, T. C., McGrath, J. E., Loos, A. C., Hood, D.
and Kranbeuhl, D. E. Production of controlled networks and morphologies in toughened
Page 363
351
thermosetting resins using real-time, in situ cure monitoring. Polym., 37(9), 1996, pp
1691-1696.
201 Margalit, E., Katzir, A., Dodiuk, H. and Kosower, E. M. Silver halide infrared fibre-optic
evanescent wave spectroscopy for in situ monitoring of the chemical processes in
adhesive curing. Surface and Interface Analysis. 15(8), 1990, pp 473-478.
202 Chailleux, E., Salvia, M., Jaffrezic-Renault, N., Matejec, V. and Kasik, I. In situ study of
the epoxy cure process using a fibre-optic sensor. Smart Mater. Struct. 10, 2001, pp 194-
202.
203 Johnson, F. J., Cross, W. M., Boyles, D. A. and Keller, J. J. “Complete” system
monitoring of polymer matrix composites. Composites: Part A., 31, 2000, pp 959-968.
204 Wang, L., Pandita, S.D., Machavaram, V.R., Malik, S., Harris, D. and Fernando, G. F.
Characterization of the cross-linking process in an E-glass fibre/Epoxy composite using
evanescent wave spectroscopy. J. Comp. Sci. Technol., 69(13), 2009, pp 2069-2074.
205 Wang, L., Malik, S., Harris, D. and Fernando, G. F. Self-sensing composites: in-situ cure
monitoring in: International Conference on Smart Materials and Nanotechnology in
Engineering, Du, S., Leng, J. and Asundi, A. K. Eds. Proc. SPIE, 6423, 64231F, July
2007, Harbin, China. 2007.
206 Connell, M. E., Cross, W. M., Snyder, T. G., Winter, R. M. and Kellar, J. J. Direct
monitoring of silane/epoxy interphase chemistry. Composites Part A., 29A, 1998, pp 495-
502.
207 Levy, R. L. and Schwab, S. D. Monitoring the composite curing process with a
fluorescence-based fiber-optic sensor. Polym. Comp., 12(2), 1991, pp 96-101.
208 Dang, W., Sung, N-H. In-situ cure monitoring of diamine cured epoxy by fibreoptic
fluorimetry using extrinsic ractiove fluorophore. Polym. Eng. Sci., 34(9), 1994, pp 707-
715.
Page 364
352
209 Paik, H-J and Sung, N-H. Fibre-optic intrinsic fluorescence for in-situ cure monitoring
of amine cured epoxy and composites. Polym. Eng. Sci., 34(12), 1994, pp. 1025-1032.
210 Jessop, J. L., Scranton, A. B. and Blanchard, G. J. In-situ cure monitoring of a vinyl ester
polymer using fiber optic fluorescence sensors. Polym. Mater. Sci. Eng., 72, 1995, pp 58-
59.
211 Bur, A. J., Wang, F. W., Thomas, C. L. and Rose, J. L. In-line optical monitoring of
polymer injection moulding. Poly. Eng. Sci. 34(8), 1994, pp 671-679.
212 Woerdeman, D. L. and Parnas, R. S. Cure monitoring in RTM using fluorescence.
Plastics Engineering., L1(10), 1995, pp 25-27.
213 Woerdeman, D. L., Flynn, K. M., Dunkers, J. P. and Parnas, R. S. The use of evanescent
wave fluorescence spectroscopy for control of the liquid molding process. Journal of
Reinforced Plastics and Composites, 15, 1996, pp 922-943.
214 Stewart, G. Fiber optic sensors in environmental monitoring in Optical Fiber Sensor
Technology. Vol. 4. Grattan KTV, Meggitt BT. Eds. Netherlands: Kluwer Academic
Publishers, 1999, pp 87-112.
215 Cooney, T. F., Kinner, T. and Angel, S. M. Comparative study of some fibre-optic
remote Raman probe designs. Part I: Model for liquids and transparent solids. Applied
Spectroscopy, 50(7), 1996, pp 836-48.
216 DeBakker, C. J., Federicks, P. M. and George, G. A. Fibre optic FT-Raman spectroscopy
for the thermal and microwave cure of advanced composite resins. Preliminary studies.
14th
Int. Conf. on Raman Spectroscopy. 524, 1994, pp 702-703.
217 Lyon, R. E., Chike, K. E., and Angel, S. M. In situ cure monitoring of epoxy resins using
fibre-optic Raman spectroscopy. J. App. Polym. Sci. 53, 1994, pp 1805-1812.
Page 365
353
218 Aust, J. F., Booksh, K. S., Stellman, C. M., Parnas, R. S. and Myrick, M. L. Use of in situ
fibre-optic Raman spectroscopy to replace calorimetry in the monitoring of polymer and
composite curing. Int. J. Vib. Spect. 1, 1997, pp 117-128.
219 Aust, J. F., Booksh, K. S. and Myrick, M. L. Novel in situ probe for monitoring polymer
curing. Applied Spectroscopy. 50(3), 1996, pp 382-387.
220 Zimmermann, B., de Vries, M. and Claus, R. Resin sensors for composite cure
monitoring. ADPA/AIAA/ASME/SPIE Conference on Active Materials and Adaptive
Structures, 1992, pp 313–316.
221 Afromowitz, M. A., Lam, K-Y. The optical properties of curing epoxies and applications
to the fiber-optic epoxy cure sensor. Sensors and Actuators. A21-A23, 1990, pp 1107-
1110.
222 Lam, K-Y. and Afromowitz, M. A. Fibre-optic epoxy composite cure sensor. I.
Dependence of refractive index of an autocatalytic reaction epoxy system at 850 nm on
temperature and extent of cure. Applied Optics. 34(25), 1995, pp 5635-5638.
223 Lam, K-Y., Afromowitz, M. A. Fiber-optic epoxy composite cure sensor. II. Performance
characteristics. Applied Optics. 34(25), 1995, pp 5639-5644.
224 Fei, L., Aidong, M., Jianyi, L., Kwangsoo, K. and Dongchang, P. Optical fiber sensing
method for the in-situ cure monitoring of composite materials. in Fiber Optic and Laser
Sensors XIV, Ramon P. DePaula; John W. Berthold; Eds. Proc. SPIE. 2839, 1996, pp 413-
419.
225 Li, C., Cao, M., Wang, R., Wang, Z., Qiao, Y., Wan, L., Tian, Q., Liu, H., Zhang, D.,
Liang, T. and Tang, C. Fibre-optic composite cure sensor: monitoring the curing process
of composite materials based on intensity modulation. Comp. Sci. Technol., ; 63(12),
2003, pp 1749-1758.
Page 366
354
226 Lekakou, C., Cook, S., Deng, Y., Ang, T. W. and Reed, G. T. Optical fibre sensor for
monitoring flow and resin curing in composite manufacture. Composites: Part A. 37,
2006, pp 934-938.
227 Hecht, E. Optics. Second Edition. California, Sddision-Wesley Co. Inc., 1987.
228 Liu, Y. M., Ganesh, C., Stelle, J. P. H. and Jones, J. E. Fiber optic sensor development
for real-time in-situ epoxy cure monitoring. J. Comp. Mater. 31(1), 1997, pp 87-102.
229 Giordano, M., Nicolais, L., Calabro, A. M., Cantoni, S., Cusano, A., Breglio, G. and
Cutolo, A. A fibre optic thermoset cure monitoring sensor. Polym. Comp., 21(4), 2000, pp
523-530.
230 Cusano, A., Cutolo, A., Giordano, M. and Nicolais, L. Optoelectronic refractive index
measurements: Application to smart processing. IEEE Sensors Journal. 3(6), 2003, pp
781-787.
231 Sanderson, J. M., May, S. G., Murphy, K. A. and Claus, R. O. Multiuse extrinsic sensor
for material evaluation. Distributed and Multiplexed Fiber Optic Sensors IV, Alan D.
Kersey; John P. Dakin; Eds. Proc. SPIE. 2294, 1994, pp 153-164.
232 Michie, W. C., Thursby, G., Johnstone, W. and Culshaw, B. Optical techniques for
determination of the state of cure of epoxy resin based systems. Int. Conf. on Fiber Optic
Smart Structures and Skins V. Proc. SPIE. 1798, 1992, pp 11-18.
233 Cong, J., Zhang, X., Chen, K. and Xu, J. Fibre optic Bragg grating sensor based on
hydrogels for measuring sailinity. Sensors and Actuators B, 87, 2002, pp 487-490.
234 Falate, R., Kamikawachi, R. C., Muller, M., Kalinowski, H. J. and Fabris, J. L. Fiber
optic sensors for hydrocarbon detection. Sensors and Actuators B, 105, 2005, pp 430-436.
235 Merzbacher, C. I., Kersey, A. D. and Friebele, E. J. Fiber optic sensors in Concrete
structures: a review. Smart Mater. Struct., 5, 1996, pp 196-208.
236 Rao, Y-J. In-fibre Bragg grating sensors. Meas. Sci. Technol. 8, 1997, pp 355-375.
Page 367
355
237 Buggy, S. J., Chehura, E., James, S. W. and Tatam, R. P. Optical fibre grating
refractometers for resin cure monitoring. Journal of Optics A: Pure and Applied Optics.
9(6), 2007; S60.
238 Dunphy, J. R., Meltz, G., Lamm, E. P. and Morey, W. W. Multi-function, distributed
optical fibre sensor for composite cure and response monitoring. Fiber Optic Smart
Structures and Skins III. Proc. of SPIE. 1370, 1990, pp 116-118.
239 Murukeshan, V. M., Chan, P. Y., Ong, L. S., Seah, L. K. Cure monitoring of smart
composites using fiber Bragg grating based embedded sensors. Sensors and Actuators, 79,
2000, pp 153-161.
240 Harsch, M., Karger-Kocsis, J. and Herzog, F. Influence of cure regime on the strain
development in an epoxy resin as monitored by a fibre Bragg grating sensor. Macromol.
Mater. Eng. 292, 2007, pp 474-483.
241 Dunkers, J. P., Lenhart, J. L., Kueh, S. R., Van Aanten, J. H., Advani, S. G. and Parnas R.
S. Fiber optic flow and cure sensing for liquid composite moulding. Optics and Lasers in
Engineering, 35, 2001, pp 91-104.
242 O’Dwyer, M. J., Maistros, G. M., James, S.W., Tatam, R. P. and Partridge, I. K. Relating
the state of cure to the real-time internal strain development in a curing composite using
in-fibre Bragg gratings and dielectric sensors. Meas. Sci. Technol., 9, 1998, pp 1153-
1158.
243 Lou, K-A., Zimmermann, B. and Yaniv, G. Combined sensor system for process and in-
service health monitoring of composite structures. Smart Structures and Materials 1994:
Smart Sensing, Processing, and Instrumentation, Sirkis JM; Ed. Proc. SPIE, 2191, 1994,
pp 32-45.
Page 368
356
244 Becker, O., Varley, R. J. and Simon, G. P. Thermal stability and water uptake of high
performance epoxy layered silicate nanocomposites. Euro. Polym. J., 40, 2004, pp 187-
195.
245 Morel, E., Bellenger, V. and Verdu, J. Structure-water absorption relationships of amine-
cured epoxy resins. Polym., 26, 1985, pp 1719-1724.
246 Soles, C. L., Chang, F. T., Bolan, B. A., Hristov, H. A., Gidley, D. W. and Yee, A. F.
Contributions of the nanovoid structure to the moisture absorption properties of epoxy
resins. J. Polym. Sci. Part B: Polym. Phys., 36, 1998, pp 3035-3048.
247 Soles, C. L., Chang, F. T., Gidley, D. W., Yee, A. F. Contributions of the nanovoid
structure to the kinetics of moisture transport in epoxy resins. J. Polym. Sci. Part B:
Polym. Phys., 38(5), 2000, pp 776-791.
248 Soles, C. L., Yee, A. F. A discussion of the molecular mechanisms of moisture transport
in epoxy resins. J. Polym. Sci. Part B: Polym. Phys., 38(5), 2000, pp 792-802.
249 Li, L., Liu, M. and Li, S. Morphology effect on water sorption behaviour in a
thermoplastic modified epoxy resin system. Polym., 45, 2004, pp 2837-2842.
250 Zhou, J. and Lucas, J. P. Hygrothermal effects of epoxy resin: Part I: the nature of water
in epoxy. Polym., 40, 1999, pp 5505-5512.
251 Apicella, A., Tessieri, R. and Cataldis, C. D. Sorption Modes of Water in Glassy Epoxies.
Journal of Membrane Science, 18, 1984, pp 211-225.
252 Peppas, N. A., Meadows, D. L. Macromolecular structure and solute diffusion on
membranes: An overview of recent theories. Journal of Membrane Science, 16, 1983, pp
361-377.
253 Frisch, H. L. Sorption and transport in glassy polymers – A review. Polym. Eng. Sci.,
20(1), 1980, pp 2-13.
254 Vieth, W.R. Diffusion in and through polymers. Munich: Hanser Publishers, 1991.
Page 369
357
255 Shen, C-H, Springer, G. S. Moisture absorption and desorption of composite materials.
J.Comp. Mater., 10, 1976, pp 2-20.
256 Loos, A. C., Springer, G. S. Moisture absorption of graphite-epoxy composites immersed
in liquids and in humid air. J.Comp. Mater., 13, 1979, pp 131-147.
257 Zanni-Deffarges, M. P. and Shanahan, M. E. R. Diffusion of water into an epoxy
adhesive: comparison between bulk behaviour and adhesive joints. Int. J. Adhesion and
Adhesives, 15, 1995, pp 137-142.
258 Laoubi, S. and Vergnaud, J. M. Modelling the process of absorption and desorption of
water by coating made of epoxy resin. Eur. Polym. J, 26(12), 1990, pp 1359-1364.
259 Jost, W. Diffusion in solids, liquids, gases. New York: Academic Press Inc. Publishers,
New York, 1952, pp 2-25.
260 Crank, J. The Mathematics of Diffusion. 2nd Ed. New York: Oxford University Press,
1975.
261 Tang, J. M. and Springer, G. S. Effects of moisture and temperature on the compressive
and short beam shear properties of Fiberite T300/976 fabric. Journal of Reinforced Plastic
and Composites, 7, 1988, pp 120-135.
262 Singh, K. S., Singh, P. N. and Rao, R. M. V. G. K. Hygrothermal effects on chopped
fibre/woven fabric reinforced epoxy composites. Part A: Moisture absorption
characteristics. Journal of Reinforced Plastics and Composites, 10, 1991, pp 446-456.
263 Bonniau, P. and Bunsell, A. R. A comparative study of water absorption theories applied
to glass epoxy composites. J. Comp. Mater., 15, 1981, pp 272-293.
264 Loos, A. C., Springer, G. S., Sanders, B.A. and Tung, R. W. Moisture absorption of
polyester-E glass composites. J. Comp. Mater., 14, 1980, pp 142-154.
265 Dewimille, B. and Bunsell, A. R. The modelling of hydrothermal aging in glass fibre
reinforced epoxy composites. J. Phys. D: Appl. Phys., 15, 1982, pp 2079-2091.
Page 370
358
266 Neogi, P. Transport phenomena in polymer membranes, Diffusion in Polymers, New
York: Marcel Dekker Inc., pp 173-209.
267 Apicella, A., Nicolais, L., Astarita, G. and Drioli, E. Effect of thermal history on water
sorption, elastic properties and the glass transition of epoxy resins. Polymer, 20, 1979, pp
1143-1148.
268 Roy, S., Xu, W. X., Park, S. J. and Liechti, K. M. Anomalous moisture diffusion in
viscoelastic polymers: modelling and testing. Journal of Applied Mechanics, 67, 2000, pp
392-396.
269 Aditya, P. K. and Sinha, P. K. Effects of fiber shapes on moisture diffusion coefficients.
J. of Reinforced Plastics and Composites, 12, 1993.
270 Pogany, G. A. Anomalous diffusion of water in glassy polymers. Polymer, 17, 1976.
271 Papanicolaou, G. C. and Pappa, A. Water sorption and temperature effects on the
dynamic mechanical behaviour of epoxy-matrix particulates. Journal of Materials
Science, 27, 1992, pp 3889-3896.
272 Carter, H. G. and Kibler, K. G. Langmuir-type model for anomalous moisture diffusion in
composite resins. Journal of Composite Materials, 12, 1978, pp 118-131.
273 Popineau, S., Rondeau-Mouro, C., Sulpice-Gaillet, C. and Shanahan, M. E. R.
Free/bound water absorption in an epoxy adhesive. Polymer, 46, 2005, pp 10733-10740.
274 Marsh, L. L., Lasky, R., Seraphim, D. P. and Springer, G. S. Moisture solubility and
diffusion in epoxy and epoxy glass composites. J Res. Develop., 28(6), 1984, pp 655-661.
275 William, D. Callister, Jr., Materials Science and Engineering – An Introduction (3rd Ed.),
John Wiley & Sons Inc., 1994, pp 98-99.
276 Li, Y. and Unsworth, J. Effect of physical aging on dielectric, thermal and mechanical
properties of cast-epoxy insulators. IEEE Translations on Dielectrics and Electrical
Insulations, 1(1), 1994, pp 9-17.
Page 371
359
277 Abdelkader, A. F. and White, J. R. Water absorption in epoxy resins: The effects of the
cross-linking agent and curing temperature. J. App. Polym. Sci., 98, 2005, pp 2544-2549.
278 Han, S. O. and Drzal, L. T. Water absorption effects on hydrophilic polymer matrix of
carboxyl functionalised glucose resin and epoxy resin. Euro. Polym. J., 39, 2003, pp
1791-1799.
279 Wu, L., Hoa, S. V. and Ton-That, M. T. Effects of water on the curing and properties of
epoxy adhesive used for bonding FRP composite sheet to concrete. J. App. Polym. Sci.,
92(4), 2004, pp 2261-2268.
280 Chen, J., Nakamura, T., Aoki, K., Aoki, Y. and Utsunomiya, T. Curing of epoxy resin
contaminated with water. J. App. Polym. Sci., 79, 2001, pp 214-220.
281 Adams, D. F. and Miller, A. K. Hygrothermal microstresses in a unidirectional composite
exhibiting inelastic material behaviour. J. Comp. Mater., 11, 1977, pp 285-299.
282 Chen, R. S., Chen, G. S. and Chen, J. R. The effect of environmental humidity after post
cure on the optimal temperature path of polymer composites. Comp. Struct., 25, 1993, pp
101-111.
283 Xiao, G. Z. and Shanahan, M. E. R. Water absorption and desorption in an epoxy resin
with degradation. J.Polym. Sc. Part B: Polym. Phys., 35, 1997, pp 2659-2670.
284 Xiao, G. Z. and Shanahan, M. E. R. Swelling of DGEBA/DDA epoxy resin during
hygrothermal ageing. Polym., 39(14), 1998, pp 3253-3260.
285 Lin, Y. C. and Chen, X. Investigation of moisture diffusion in epoxy systems:
Experimental and molecular dynamic simulations. Chemical Physics Letters, 412, 2005,
pp 322-326.
286 Papanicolaou, G. C., Kosmidou, Th W., Vatalis, A. S. and Delides, C. G. Water
absorption mechanism and some anomalous effects on the mechanical and viscoelastic
behavior of an epoxy system. J. App. Poly. Sci., 99, 2006, pp 1328-1339.
Page 372
360
287 Artemove, D. Y., Samoilenko, A. A. and Iordanskii, A. L. Study of diffusion of water in
polyamide-6 using nuclear magnetic resonance intrascopy. Polymer Science USSR, 31
(12), 1989, pp 2709-2713.
288 VanLandingham, M. R., Eduljee, R. F. and Gillespie, J. W. Jr., Moisture diffusion in
epoxy systems. J. App. Polym. Sci., 71, 1999, pp 787-798.
289 Jefffey, K. and Pethrick, R. A. Influence of chemical structure on free volume in epoxy
resins: A positron anninilation study. Euro. Polym. J., 30(2), 1994, pp 153-158.
290 Barrie, J. A., Sagoo, P. S. and Johncock, P. The sorption and diffusion of water in
halogen-containing epoxy resins. Polym., 26, 1985, pp 1167-1171.
291 Barrie, J. S., Sagoo, P. S. and Johncock, P. The sorption and diffusion of water in epoxy
resins. J. Membrane Sci., 18, 1984, pp 197-210.
292 Lin, Y. C. and Chen, X. Moisture sorption-desorption-resorption characteristics and its
effect on the mechanical behavior of the epoxy system. Polym., 46, 2005, pp 11994-
12003.
293 Kasturiarachchi, K. A. and Pritchard, G. Water absorption of glass/epoxy laminates under
bending stresses. Composites, 14(3), 1983, pp 244-250.
294 Costa, M. L., De Almeida, S. F. M. and Rezende, M. C. Hygrothermal effect on dynamic
mechanical analysis and fracture behaviour of polymeric composites. Materials Research,
8(3), 2005, pp 335-340.
295 Arribas, C., Sepúlveda, L., Salom, C., Masegosa, R. M. and Prolongo, M. G. Morphology
effect on the hydrothermal ageing of a thermoplastic modified epoxy thermoset. Polym.
Eng. Sci., 47(6), 2007, pp 960-968.
296 Apicella, A., Migliaresi, C., Nicodemo, L., Nicolais, L., Iaccarino, L. and Roccotelli, S.
Water sorption and mechanical properties of a glass-reinforced polyester resin.
Composites, 1982, pp 406-410.
Page 373
361
297 Zhou, J. and Lucas, J. P. Hygrothermal effects of epoxy resin. Part II: variations of glass
transition temperature. Polym., 40(20), 1999, pp 5513-5522.
298 Carter, H. G. and Kibler, K. G. Entropy model for glass transition in wet resins and
composites. J. Comp. Mater., 11, 1977, pp 265-275.
299 Bellenger, V., Verdu, J., Francillette, J., Hoarau, P. and Morel, E. Infra-red study of
hydrogen bonding in amine-crosslinked epoxies. Polym., 28, 1987, pp 1079-1086.
300 Chateauminois, A., Vincent, L., Chabert, B. and Soulier, J. P. Study of the interfacial
degradation of a glass-epoxy composite during hygrothermal ageing using water diffusion
measurements and dynamic mechanical thermal analysis. Polym., 35(22), 1994, pp 4766-
4774.
301 Manfredi, L. B., Fraga, A. N. and Vázquez, A. Influence of the network structure and
void content on hygrothermal stability of resol resin modified with epoxy-amine. J. App.
Polym. Sci., 102, 2006, pp 588-597.
302 Ivanova, K. I., Pethrick, R. A. and Affrossman, S. Investigation of hydrothermal ageing
of a filled rubber toughened epoxy resin using dynamic mechanical thermal analysis and
dielectric spectroscopy. Polym., 41, 2000, pp 6787-6796.
303 Apicella, A., Nicolais, L., Astarita, G. and Drioli, E. Hygrothermal history dependance of
equilibrium moisture sorption in epoxy resins. Polym., 22, 1981, pp 1064-1067.
304 Pogany, G. A. The α relaxation in epoxy resins. Euro. Polym., 6, 1970, pp 343-353.
305 Jordan, C., Galy, J. and Pascault, J. P. Comparison of microwave and thermal cure of an
epoxy/amine matrix. Polym. Eng. Sci., 35(3), 1995, pp 233-239.
306 Pogany, G. A. Gamma relaxation in epoxy resins and related polymers. Polym., 11, 1970,
pp 66–78.
Page 374
362
307 Li, G., Lee-Sulivan, P. and Thring, R. W. Determination of activation energy for glass
transition of an epoxy adhesive using dynamic mechanical analysis. J. Thermal Analysis
and Calorimetry, 60, 2000, pp 377 – 390.
308 Zarrelli, M., Skordos, A. A. and Partridge, I. K. Thermomechanical analysis of a
toughened thermosetting system. Mechanics of Composite Materials, 44(2), 2008, pp 181-
190.
309 Lee, M. C. and Peppas, N. A. Water transport in graphite/epoxy composites. J. App.
Polym. Sci., 47, 1993, pp 1349-1359.
310 Ishisaka, A. and Kawagoe, M. Examination of the time-water content superposition on
the dynamic viscoelasticity of moistened polyamide 6 and epoxy. J. App. Polym. Sci., 93,
2004, pp 560-567.
311 Gates, T. S. On the use of accelerated test methods for characterization of advanced
composite materials. NASA report NASA/TP-2003-212407, Hampton, Virginia, 2003.
312 DéNeve, B. and Shanahan, M. E. R. Water absorption by an epoxy resin and its effect on
the mechanical properties and infra-red spectra. Polym., 34(24), 1993, pp 5099-5105.
313 Karad, S. K., Attwood, D. and Jones, F. R. Moisture absorption by cyanate ester modified
epoxy resin matrices. Part IV: Effect of curing schedules. Polym. Comp., 24(4), 2003, pp
567-576.
314 Akay, M., Kong, A., Mun S., and Stanley, A. Influence of moisture on the thermal and
mechanical properties of autoclaved and oven-cured kevla-49/epoxy laminates. Comp.
Sci. Technol., 57, 1997, pp 565-571.
315 Dušek, K., Pleštil, J., Lednický ,F. and Luňák, S. Are cured epoxy resins
inhomogeneous?. Polym., 19, 1978, pp 393-397.
Page 375
363
316 Chateauminois, A., Chabert, B., Soulier, J. P. and Vincent, L. Dynamic mechanical
analysis of epoxy composites plasticized by water: Artifact and reality. Polym. Comp.,
16(4), 1995, pp 288 – 296.
317 Li, Y., Miranda, J. and Sue, H. J. Hygrothermal diffusion behaviour in bismaleimide
resin. Polym., 42, 2001, pp 7791-7799.
318 Lin, Y. C., Xu, C., Zhang, H. J. and Wang, Z. P. Effects of hygrothermal aging on epoxy-
based anisotropic conductive film. Materials Letters, 60, 2006, pp 2958-2963.
319 Lachenal, G. Dispersive and Fourier transform near-infrared spectroscopy of polymeric
materials. Vibrational Spectroscopy, 9, 1995, pp 93-100.
320 Pereira, M. R. and Yarwood, J. ATR-FTIR spectroscopic studies of the structure and
permeability of sulfonated poly(ether sulfone) membranes Part 1. interfacial water-
polymer interaction. Journal of Chemical Society, Faraday Transactions, 92(15), 1996,
pp 2731-2735.
321 Öhman, M., Persson, D. and Leygraf, C. In situ ATR-FTIR studies of the
aluminium/polymer interface upon exposure to water and electrolyte. Progress in Organic
Coatings, 57, 2006, pp 78-88.
322 Wu, P. and Siesler, H. W. Water diffusion into epoxy resin: a 2D correlation ATR-FTIR
investigation. Chemcial Physics Letters, 374, 2003, pp 74-78.
323 Fieldson, G. T. and Barbari, T. A. The use of FTi.r.-a.t.r spectroscopy to characterize
penetrant diffusion in polymers. Polym., 34(6), 1993, pp 1146-1153.
324 Cotugno, S., Larobina, D., Mensitieri, G., Musto, P. and Ragosta, G. A novel
spectroscopic approach to investigate transport processes in polymers: the case of water-
epoxy system. Polym., 42, 2001, pp 6431-6438.
Page 376
364
325 Mensitieri, G., Lavorgna, M., Musto, P. and Ragosta, G. Water transport in densely
crosslinked networks: A comparison between epoxy systems having different interactive
characters. Polym., 47, 2006, pp 8326-8336.
326 Musto, P., Martuscelli, E., Ragosta, G. and Russo, P. The curing process and moisture
transport in a tetrafunctional epoxy resin as investigated by FT-NIR spectroscopy. High
Performance Polymers, 12, 2000, pp 155-168.
327 Yamazoe, N. and Shimizu, Y. Humidity sensors: Principles and applications. Sensors and
Actuators B, 10, 1986, pp 379-398.
328 Golnabi, H. and Azimi, P. Design and performance of a plastic optical fibre leakage
sensor. Optics & Laser Tech., 39, 2007, pp 1346-1350.
329 Arregui, F. J., Ciaurriz, A., Oneca, M. and Matias, I. R. An experimental study about
hydrogels for the fabrication of optical fibre humidity sensors. Sensors and Actuators B,
96, 2003, pp 165-172.
330 Ansari, Z. A., Karekar, R. N. and Aiyer, R. C. Humidity sensor using planar optical
waveguides with cladding of various oxide materials. Thin solid Films, 305, 1997, pp 330-
335.
331 Shula, S. K., Parashar, G. K., Mishra, A. P., Misra, P., Yadav, B. C., Shukla, R. K., Bali,
L. M. and Dubey, G. C. Nano-like magnesium oxide films and its significance in optical
fibre humidity sensor. Sensors and Actuators B, 98, 2004, pp 5-11.
332 Slavik, R., Homola, J. and Ctyroky, J. Miniaturization of fibre optic surface plasmon
resonance sensor. Sensors and Actuators B, 51, 1998, pp 311-315.
333 Dhawan, A. and Muth, J.F. Engineering surface Plasmon based fibre-optic sensors.
Mater. Sci. Eng. B (2007), doi:10.1016/j.mseb.2007.09.076
Page 377
365
334 Corres, J. M., Arregui F. J. and Matias, I. R. Sensitivity optimization of tapered optical
fibre humidity sensors by means of tuning the thickness of nanostructured sensitive
coatings. Sensors and Actuators B, 122, 2007, pp 442-449.
335 Russel, A. P. and Fletcher, K. S. Optical sensor for the determination of moisture.
Analytica Chemica Acta, 170, 1985, pp 209-216.
336 Posch, H. E. and Wolfbeis, O. S. Optical sensors, 13: Fibre-optic humidity sensor based
on fluorescence quenching. Sensors and Actuators B, 15, 1988, pp 38-77.
337 Choi, M. M. F. and Tse, O. L. Humidity-sensitive optode membrane based on a
fluorescent dye immobilized in gelatine film. Analytica Chimica Acta, 378, 1999, pp 127-
134.
338 Zanjanchi, M. A. and Sohrabnezhad, S. Evaluation of methylene blue incorporated in
zeolite for construction of an optical humidity sensor. Sensors and Actuators B, 105,
2005, pp 502-507.
339 Potyrailo, R. A., Szumlas, A. W., Danielson, T. L., Johnson, M. and Hieftje, G. M. A
dual-parameter optical sensor fabricated by gradient axial doping of an optical fibre.
Meas. Sci. Technol., 16, 2005, pp 235-241.
340 Tao, S., Winstead, C. B., Jindal, R. and Singh, J. P. Optical-fiber sensor using tailored
porous sol-gel fibre core. IEEE Sensors J., 4(3), 2004, pp 322-328.
341 Gaston, A., Lozano, I., Perez, F., Auza, F. and Sevilla, J. Evanescent wave optical fiber
sensing (temperature, relative humidity and pH sensors). IEEE Sensors, 3(6), 2003, pp
806- 811.
342 Vijayan, A., Fuke, M., Hawaldar, R., Kulkarni, M., Amalnerkar, D. and Aiyer, R. C.
Optical fibre based humidity sensor using Co-polyaniline clad. Sensors and Actuators B,
2007, doi:10.1016/j.snb.2007.07.113.
Page 378
366
343 Gupta, B. D. and Rathnanjali, A novel probe for a fiber optic humidity sensor. Sensors
and Actuators B, 80, 2001, pp 132-135.
344 Khijwania, S. K., Srinivasan, K. L. and Singh, J. P. An evanescent-wave potical fiber
relative humidity sensor with enhanced sensitivity. Sensors and Actuators B, 104, 2005,
pp 217-222.
345 Otsuki, S., Adachi, K. and Taguchi, T. A novel fiber-optic gas-sensing configuration
using extremely curved optical fibers and an attempt for optical humidity detection.
Sensors and Actuators B, 53, 1998, pp 91-96.
346 Lomer, M., Arrue, J., Jauregui, C., Aiestaran, P., Zubia, J. and Lopez-Higuera, J. M.
Lateral polishing of bends in plastic optical fibres applied to a multipoint liquid-level
measurement sensor. Sensors and Actuators A, 137, 2007, pp 68-73.
347 Khijwania, S. K. and Gupta, B. D. Maximum achievable sensitivity of the fibre optic
evanescent field absorption sensor based on the U-shaped probe. Optics Communications,
175, 2000, pp 135-137.
348 Arregui, F. J., Liu, Y., Matias, I. R. and Claus, R. O. Optical fibre humidity sensor using
a nano Fabry-Perot cavity formed by the ionic self-assembly method. Sensors and
Actuators B, 59, 1999, pp 54-59.
349 Tan, K. M., Tay, C. M., Tjin, S. C., Chan, C. C. and Rahardjo, H. High relative
humidity measurements using gelatine coated long-period grating sensors. Sensors and
Actuators B, 110, 2005, pp 335-541.
350 Liu, Y., Wang, L., Zhang, M., Tu, D., Mao, X. and Liao, Y. Long-period grating relative
humidity sensor with hydrogel coating. IEEE Photonics Tech. Letters, 19(12), 2007, pp
880-882.
351 Wang, L., Liu, Y., Zhang, M., Tu, D., Mao, X. and Liao, Y. Relative humidity sensor
using a hydrogel coated Long-period grating. Meas. Sci. Tech., 18, 2007, pp 3131-3134.
Page 379
367
352 Huang, X. F., Sheng, D. R., Cen, K. F. and Zhou, H. Low-cost relative humidity sensor
based on thermoplastic polyimide-coated fibre Bragg grating. Sensors and Actuators B,
127, 2007, pp 518-524.
353 Yeo, T. L., Sun, T., Grattan, K. T. V., Parry, D, Lade, R and Powell, B. D. Polymer-
coated fibre Bragg grating for relative humidity sensing. IEEE Sensors J., 5(5), 2005, pp
1082-1089.
354 Yeo, T. L., Cox, M. A. C., Boswell, L. F., Sun, T. and Grattan, K. T. V. Monitoring
ingress of moisture in structural concrete using a novel optical-based sensor approach.
Journal of Physics: Conference Series, 45, 2006, pp 186-192.
355 Eftimov, T. A. and Bock, W. J. A simple multifunctional fibre optic
level/moisuture/vapour sensor using large-core quartz polymer fiber pairs. IEEE
Transactions on Instrumentation and measurement, 55(6), 2006, pp 2080-2087.
356 Mahendran, R. S., Chen, R., Wang, L., Pandita, S. D., Machavaram, V. R., Kukureka, S.
N. and Fernando, G. F. Chemical process monitoring and the detection of moisture ingress
in composites. In SPIE/Smart Structures and Materials & Nondestructive Evaluation and
Health Monitoring 2008: Smart Sensor Phenomena, Technology, Networks, and Systems,
Ecke, W., Peters, K.J. and Meyendorf, N.G., Proc SPIE, 6933, 69330R, March 2008, San
Diego, CA, USA, 2008.
357 Mahendran, R.S., Wang, L., Machavaram, V.R., Pandita, S.D., Chen, R., Kukureka, S.N.,
Fernando, G.F. Fibre-optic sensor design for chemical process and environmental
monitoring. Optics and Lasers in Engineering, 47, 2009, pp 1069–1076.
358 Mahendran R. S., Chen, R, Kukureka, S. N., Fernando, G. F. Monitoring and modelling
the diffusion profile in a thermosetting resin in: SPIE/Smart Structures and Materials &
Nondestructive Evaluation and Health Monitoring 2009: Smart Sensor Phenomena,
Page 380
368
Technology, Networks, and Systems, Meyendorf, N.G., Peters, K.J. and Ecke, W. Proc.
SPIE, 7293, 729319, March 2009, San Diego, CA, USA, 2009.
359 Sheshnev, A., Bormashenko, E., Reiclin, J. and Pogreb, R. Mathematical simulation of
water and benzene penetration in thin polystyrene films and experimental investigation of
the mass transport processes by FEWS-FTIR spectroscopy procedure2, Int. Conf. on
Mathematical Modelling and Simulation of Metal Technologies, MMT-2000, Israel, Nov.
13-15, 2000.
360 Texier, S. and Pamukcu, S. Fiber optic sensor for distributed liquid content quantification
in subsurface. 6th Int. Symp. On Field Measurements in Geomechanics, NGI, Oslo,
Norway, 2003.
361 Lyons, W. B., Ewald, E, Flanagan, C. and Lewis, E. A multi-point optical fibre sensor for
condition monitoring in process water systems based on pattern recognition.
Measurement, 34, 2003, pp. 301-312.
362 Etches, J. A. and Fernando, G. F. Evaluation of embedded optical fibre sensors in
composites: EFPI sensor fabrication and quasi-static evaluation. Polymer Composites;
2008.
363 Druy, M. A. Applications of IR transmitting fibres in Infrared Fibre Optics. Sanghera, J.
S. and Aggrawal, I. D. Eds. Washington, CRC Press, 1998, pp 305-323.
364 Claus, R. O., Bennett, K. D., Vengsarkar, A. M. and Murphy, K. A. Embedded optical
fibre sensors for material evaluation. Journal of Nondestructive Evaluation, 8(2), 1989, pp
135-145.
365 Archibald, D. D., Lin, L. T. and Honigs, D. E. Remote near-IR spectroscopy over an
optical fiber with a modified FT spectrometer. Applied Spectroscopy, 42(3), 1988, pp 468-
472.
366 Harrington, J. A. Infrared Fibers and Their Application. Washington, SPIE Press, 2004.
Page 381
369
367 Machavaram, V. R., private communication, 2007.
368 Griffiths, P. R. and Dahm, D. J. Continuum and discontinuum theories of diffuse
reflectance in: Handbook of near-infrared analysis. 3rd Edition. Burn, D. A. and
Ciurczak, E. W. Eds. Florida, CRC Press, 2008, pp 22-62.
369 Griffiths, P. R. and DE Haseth, J. A. Fourier Transform Infrared Sepctrometry. 2nd
Edition., USA, John Wiley & Sons, Inc. pp 349-361.
370 Mahendran, R. S., Harris, D., Wang, L., Machavaram, V. R., Chen, R., Kukureka, S. N.,
and Fernando, G. F. Fibre optic sensor design for chemical process and environmental
monitoring. Int. Conf. Smart Materials and Nanotechnology in Engineering, Du, S., Leng,
J. and Asundi, A. K. Eds. Proc. SPIE, 6423, 64232S, Nov. 1, 2007.
371 Fernando, G. F., Crosby, P. A. and Liu, T. The application of optial fiber sensors in
advanced fiber reinforced composites. Part 1. Introduction and issues. In: Grattan, K. T.
V. and Meggitt, B. T. Eds. Optical Fiber Sensor Technology Volume 3. Kluwer Academic
Publishers, Netherlands, 1999, pp 25 – 56.
372 Crosby, P. A. and Fernando, G. F. The application of optial fiber sensors in advanced
fiber reinforced composites. Part 2. Cure monitoring. In: Grattan, K. T. V. and Meggitt, B.
T. Eds. Optical Fiber Sensor Technology Volume 3. Kluwer Academic Publishers,
Netherlands, 1999, pp 57 – 86.
373 Liu, T. and Fernando, G. F. The application of optial fiber sensors in advanced fiber
reinforced composites. Part 3. Strain, temperature and health monitoring. In: Grattan, K.
T. V. and Meggitt, B. T. Eds. Optical Fiber Sensor Technology Volume 3. Kluwer
Academic Publishers, Netherlands, 1999, pp 87 – 130.
374 Camacho, W., Hedenqvist, M. S. and Karlsson, S. Near infrared (NIR) spectroscopy
compared with thermogravimetric analysis as a tool for on-line prediction of water
diffusion in polyamide 6,6. Polym. Int., 51(12), 2002, pp 1366-1370.
Page 382
370
375 Mahendran, R. S., Machavaram, V. R., Wang, L., Burns, J. M., Harris, D., Kukureka, S.
N., Fernando, G. F. A novel multifunctional fibre optic sensor. SPIE/Smart Structures and
Materials & Nondestructive Evaluation and Health Monitoring 2009: Smart Sensor
Phenomena, Technology, Networks, and Systems, Meyendorf, N.G. Peters, K.J. and Ecke,
W. Proc. SPIE, 7293, 72930C, March 2009, San Diego, CA, USA (2009).
376 Machavaram, V.R., Mahendran, R. S., Wang, L., Chen, R., Kukureka S.N. and Fernando,
G.F. Cure monitoring and water ingress detection using a low-cost fibre-optic sensor. 16th
Annual International Conference on Composites/Nanoengineering (ICCE-16), Kunming,
China, 20 July, 2008.
377 Dannenberg, H. Determination of functional groups in epoxy resins by near-infrared
spectroscopy. Polym. Eng. Sci., 1963; 3(1): 78 – 88.
378 Wang, L., Machavaram, V. R., Mahendran, R., Harris, D., Pandita, S. D., Tomlin, A.,
Redmore, E., Malik, S. A., Fernando, G. F. A comparison of cure monitoring techniques.
Sensors and Smart Structures Technologies for Civil, Mechanical, and Aerospace Systems
2009, Tomizuka, M. Proc. SPIE, 7292, 729213, March 2009, San Diego CA, USA. 2009.
379 Macan, J., Brnardić, I., Ivanković, M. and Mencer, H. J. DSC study of cure kinetics of
DGEBA-based epoxy resin with poly(oxypropylene)diamine. Journal of Thermal analysis
and Calorimetry, 81, 2005, pp 369-373.
380 The impact of temperature and phosphor concentration on the refractive index of LED
encapsulants. http://www.lrc.rpi.edu/programs/solidstate/cr_impact.asp
381 Ltzenkirchen-Hecht, D. and Frahm, R. Structural investigations of sputter deposited thin
films: reflection mode EXAFS, specular and non specular X-ray scattering. Physica B,
283, 2000, pp. 108-113.
382 http://www.ealingcatalog.com/pdf/Coatings.pdf
383 http://www.lasergold.com/laser_properties.ssi#reflectivity
Page 383
371
384 Leng, J. and Asundi, A. Structural health monitoring of smart composite materials by
using EFPI and FBG sensors. Sensors and Actuators. A, 103, 2003, pp 330-40.
385 Zhao, W., Wang, J., Wang, A. and Claus, R. O. Geometric analysis of optical fibre EFPI
sensor performance: Technical Note. Smart Mater. Struct., 7, 1998, pp 907-910.
386 Liu, T., Brooks, D., Martin, A., Badcock, R., Ralph, B., Fernando, G. F. A multi-mode
extrinsic Fabry-Perot ineterferometric strain sensor. Smart Mater. Struct., 6, 1997, pp 464-
469.
387 Yoon, H-J., Costantini, D. M., Limverger, H. G., Salathe, R. P., Kim, C-G. and Michaud,
V. In situ train and temperature monitoring of adaptive composite materials. J. Intelligent
material systems and structures. 17, 2006, pp 1059-1067.
388 Pal, S., Mandal, J., Sun, T., Grattan, K. T. V., Fokine, M., Carlsson, F., Fonjallaz, P.Y.,
Wade, S. A. and Collins, S. F. Characteristics of potential fibre Bragg grating sensor-
based devices at elevated temperatures. Meas. Sci. Technol., 14, 2003, pp 1131-1136.
389 MS9710B Optical Spectrum Analyser, Operation Manual, Document No.: M-W1283AE-
15.0.
390 FBG Interrogation System IS7000, Operation Manual.
391 Cavaleiro, P. M., Araújo, F. M., Ferreira, L. A., Santos, J. L. and Farahi, F. Simultaneous
measurement of strain and temperature using Bragg gratings written in germanosilicate
and Boron-codoped Germanosilicate fibres. IEEE Photonics Technology Letters, 11(2),
1999, pp 1635 – 1637.
392 Pal, S., Sun, T., Grattan, K. T. V., Wade, S. A., Collins, S. F., Baxter, G. W., Dussardier,
B. And Monnom, G. Non-linear temperature dependence of Bragg gratings written in
different fibres, optimised for sensor applications over a wide range of temperatures.
Sensors and Actuators A, 112, 2004, pp 211 - 219.
Page 384
372
393 Yeo, T. L., Sun, T., Grattan, K. T. V., Parry, D., Lade, R. And Powell, B. D.
Characterisation of a polymer-coated fibre Bragg grating sensor for relative humidity
sensing. Sensors and Actuators B, 110, 2005, pp 148 - 155.
394 Yoon, H-J, Costantini, D. M., Limverger, H. G., Salathe, R. P., Kim, C-G and Michaud,
V. In situ strain and temperature monitoring of adaptive composite materials. Journal of
Intelligent material systems and structures, 17, 2006, pp 1059-1067.
395 De Oliveira, R., Lavanchy, S., Chatton, R., Costantini, D., Michaud, V., Salath, R. and
Mnson J. –A. E. Experimental investigation of the effect of the mould thermal expansion
on the development of internal stresses during carbon fibre composite processing.
Composites: Part A, 39, 2008, pp 1083 – 1090.
396 Rysman, J-F. And Nikogosyan, D. N. Thermal sensitivity studies of fibre Bragg gratings
inscribed by high-intensity femtosecond UV laser pulses. Optics Comm., 282, 2009, pp
1120-1122.
397 Harris, D. and Fernando, G. F. Simultaneous acquisition of data of refractive index,
strain, temperature and cross-linking kinetics. Int. conf. on Composite Materials: ICCM-
17, July 2009, Edinburgh, United Kingdom, 2009.
398 Park, S. O., Jang, B. W., Lee, Y. G., Kim, C. G. and Park, C. Y. Simultaneous
measurement of strain and temperature using a reverse index fibre Bragg grating sensor.
Meas. Sci. Technol., 21, 2010, 035703(8pp).
399 Mahendran, R. S., Machavaram, V. R., Wang L., Kukureka, S. N., Paget, M., Fernando,
G. F. A novel multi-measurand fibre optic sensor. 16th Annual International Conference
on Composites/Nanoengineering (ICCE-16), Kunming, China, 20 July 2008.
400 Mahendran, R. S., Machavaram, V. R., Wang L., Nair, A. K. R., Burns, J. M., Kukureka,
S. N. and Fernando, G. F. A novel multi-functional sensor design for process monitoring.
Int. Conf. On Composite Materials: ICCM-17, July 2009, Edinburgh, England, 2009.
Page 385
373
401 Vieth, W. R. Diffusion in and through polymers. Munich, Hanser Publishers, 1991.
402 Fujita, H. Organic vapours above the glass transition temperature. In: Diffusion in
Polymers, Crank, J. and Park, G. S., Eds. London, Academic Press, 1968, pp 75-104.
403 Maggana, C. and Pissis, P. Water sorption and diffusion studies in an epoxy resin system.
J. Polym. Sci.: Part B: Polym. Phys., 37, 1999, pp 1165-1182.
404 Nakamura, K., Ueda, T., Hosono, S. and Maruno, T. Theoritical analysis of the decay of
shear strength of adhesion in metal/epoxy/metal joints in an aqueous environment. Int. J.
Adhesion and Adhesives, 7(4), 1987, pp 209-212.
405 Shen, C-H. and Springer, G. S. Effects of moisture and temperature on the tensile
strength of composite materials. J. Comp. Mater., 11, 1977, pp 2-16.
406 Whiteside, J. B., DeIasi, R. J. and Schulte, R. L. Measurement of preferential moisture
ingress in composite wing/spar joints. Comp. Sci. Technol., 24, 1985, pp 123-145.
407 Nakamura, K., Maruno, T., Sasaki, S. Theory for the decay of the wet shear strength of
adhesion and its application to metal/epoxy/metal joints. International Adhesion and
Adhesives, 7(2), 1987, pp 97-102.
408 Laoubi, S., Vergnaud, J. M. Effect of temperature on the transfer between epoxy coatings
and water. Euro. Polym. J., 27(12), 1991, pp 1425-1429.
409 Carter, H. G. and Kibler, K. G. Rapid moisture-characterization of composites and
possible screening applications. J. Comp. Mater., 10, 1976, pp 355-370.
410 Miller, R. K. Multi-material model moisture analysis for steady-state boundary conditions
in: Environmental Effects on Composite Materials – Volume 2, Springer, G. S. Ed.
Technomic Publishing Inc., 1984, pp 162-169.
411 Wapner, K., Grundmeier G. Spatially resolved measurements of the diffusion of water in
a model adhesive/silicon lap joint using FTIR-transmission-microscopy. International
Journal of Adhesion & Adhesives, 24, 2004, pp 193-200.
Page 386
374
412 Tay, A. A. O. and Lin, T. Y. Moisture diffusion and heat transfer in plastic IC packages.
IEEE – InterSociety Conference on Thermal Phenomena, 1996, pp 67-73.
413 Duncan, B., Urquhart, J. and Roberts, S. Review of measurement and modelling of
permeation and diffusion in polymers. NPL Report DEPC MPR 012, Middlesex, England,
2005.
414 Newill, J. F., McKnight, S. H., Hoppel, C. P. R., Cooper, G. R. and Berman, M. S.
Theoretical evaluation of moisture protection using coatings. ARL-TR-2016 Report, Army
Research Laboratory, 1999.
415 Laoubi, S., Vergnaud, J. M. Modelling the process of absorption and desorption of water
by coatings made of epoxy resins. Euro. Polym. J., 26(12), 1990, pp 1359-1364.
416 Özisik, M. N. Finite difference methods in heat transfer. Boca Raton: CRC Press, 1994.
417 Smith, G. D. Numerical solution of partial differential equations. London: Oxford
University Press, 1965, pp 9-54.
418 Gordon, J. M., Rouse, G. B., Gibbs, J. H. and Risen, W. M. Jr. The composition
dependence of glass transition properties. J. Chem. Phys., 66(11), 1977, pp 4971-4976.
419 Couchman, P. R. and Karasz, F. E. A classical thermodynamic discussion of the effect of
composition on glass-transition temperatures. Macromolecules, 11(1), 1978, pp 117-119.
420 Bower, D. I. An Introduction to Polymer Physics. Cambridge: Cambridge University
Press, 2002, pp 187-219.
421 Feng, J., Gerger, K. R. and Douglas, E. P. Water vapor transport in liquid crystalline and
non-liquid crystalline epoxies. J. Mater. Sci., 39, 2004, pp 3413-3423.
422 Ping, Z. H., Nguyen, Q. T., Chen, S. M., Zhou, J. Q. and Ding, Y. D. States of water in
different hydrophilic polymers – DSC and FTIR studies. Polym., 42, 2001, pp 8461-8467.
423 Olmos, D., López-Morón, R. and González-Benito, J. The nature of the glass fibre
surface and its effect in the water absorption of glass fibre/epoxy composites. The use of
Page 387
375
fluorescence to obtain information at the interface. Comp. Sci. Technol., 66, 2006, pp
2758-2768.
424 Musto, P., Ragosta, G., Scarinzi, G., Mascia, L. Probing the molecular interactions in the
diffusion of water through epoxy and epoxy-bismaleimide networks. J. Polym. Sci. Part
B: Polym. Phys., 40(10), 2002, pp 922-938.
425 Gopalan, R., Somashekar, B.R. and Dattaguru, B. Environmental effects on fibre-
polymer composites. Polymer Degradation and Stability, 24, 1989, pp 361-371.
426 Karalekas, D., Cugnoni, J., Botsis, J. Monitoring of hygrothermal ageing effects in an
epoxy resin using FBG sensor: A methodological study. Comp. Sci. Technol., 69, 2009, pp
507-514.
427 Hahn, H. T. Residual stresses in polymer matrix composite laminates. J. Comp. Mater.,
10, 1976, pp 266-278.
428 Chang, T-W., Tsai, C-L., Yehi, W. and Cheng, J-J. Tracking the moisture expansion of
carbon/epoxy composite exposed to varying humidity. J. Comp. Mater., 42(5), 2008, pp
431-446.
429 Tsai, C-L., Hung, I-T. and Chang, T-W. Characterisation of principle diffusivities of
composite by suspension method. Comp. Sci. Technol., 66, 2006, pp 2837-2843.
430 Chen, Y., Xia, Z. and Ellyin, F. Evolution of residual stresses induced during curing
processing using a viscoelastic micromechanical model. J.Comp. Mater., 35(6), 2001, pp
522-542.
431 Li, Y., Miranda, J. and Sue, H-J. Hygrothermal diffusion behaviour in bismaleimide
resin. Polym., 42, 2001. pp 7791-7799.
Page 388
376
Appendix – I
I Ray optic theory of fibre-optic near-infrared
transmission spectroscopy
o
1
1
Fibre core
Fibre cladding
ncore
ncladding
n0
rcore
Output fibreInput fibre
d
ao
rcore
o
1
1
Fibre core
Fibre cladding
ncore
ncladding
n0
rcore
Output fibreInput fibre
d
ao
rcore
Figure I.1 Schematic illustration of refraction of IR beam at the cleaved fibre interface.
The Figure 4.1 illustrates the ray-optic approach for transmission of IR radiation at a sensing
cavity of step-index multimode fibres. Let us consider there is an analyte in the sensing
cavity with absorption, A at wavelength, λ and Po(λ) is the power of the IR radiation leaving
from the fibre core interface with radius, rcore. Then according to the Beer-Lambert law (see
Section 4.1.1), the power of the IR radiation at a distance, d along the fibre axis can be
expressed as [367]:
01
( )( )
10A
PP Equation I.1
Page 389
377
where P1(λ) is power at a distance, d. If another step-index multimode fibre with radius rcore,
is brought to the distance, d along the fibre axis, then the power of IR beam, P2(λ) that couples
into the second fibre (output fibre) can be expressed by considering the fresnel reflections
[82] at the analyte/fibre interface:
2
02 1
0
( ) ( ) 1 core
core
n nP P
n n Equation I.2
where no and ncore are refractive indices of the analyte and the fibre core, respectively.
However P2(λ) represents the power distributed within the boundary of cone of acceptance at
distance, d. The radius of the cone at distance d, rc,d can be expressed as [82]:
, 0tanc d core corer r a r d Equation I.3
1
0
0
tan tan sinNA
n
where NA is numerical aperture of the step-index multimode fibre and can be expressed as
below:
2 2
core claddingNA n n
Therefore, the fraction of the power of IR radiation, P3(λ) that coupling into the output fibre is
given by:
Page 390
378
3 2
0
( ) ( )tan
core
core
rP P
r d Equation I.4
Considering Equation I.1 - I.4, P3(λ) can be written as:
2
03 0
0 0
1( ) 1 ( )
10 tan
core core
A
core core
n n rP P
n n r d Equation I.5
3 0 0( ) , , ( )P f n A d P Equation I.6
where f(no,A,d) is a function of refractive index of the analyte, absorbance at λ and distance
between input and output fibres at a given time.
Page 391
379
Appendix – II
II Ray optic theory of fibre-optic near-infrared
reflectance spectroscopy
Refl
ecti
ng s
ub
stra
te
o
1
1
Fibre core
Fibre cladding
ncore
ncladding
n0
rcore
Input/output fibre
d
a
o
o
o
Refl
ecti
ng s
ub
stra
te
o
1
1
Fibre core
Fibre cladding
ncore
ncladding
n0
rcore
Input/output fibre
d
a
o
o
o
Figure II.1 Schematic illustration of ray-optic approach for specular reflection of IR radiation at the
fibre-optic sensing cavity.
The Figure 4.3 illustrates the ray-optic approach for specular reflection of IR radiation at a
sensing cavity of step-index multimode fibres. Let us consider there is an analyte in the
sensing cavity with absorption, A at wavelength, λ and Po(λ) is the power of the IR radiation
emerging from the fibre core interface with radius, rcore. It was demonstrated that basis for
Page 392
380
transmission spectroscopy can be applied for the ray optic characteristics of the fibre-optic
reflectance spectroscopy. Then (see Appendix-I), the power of the IR radiation at a distance, d
along the fibre axis can be expressed as:
01
( )( )
10A
PP Equation II.1
where P1(λ) is power at a distance, d. If a reflective substrate, is brought to the distance, d
perpendicular to the fibre axis, the loss of absorbance (Arefl) at the reflector can be expressed
as [367]:
2
1
( )10 log
( )refl
PA
P Equation II.2
where P2(λ) is the power of IR radiation, that reflects at the reflective surface and P2(λ) can be
expressed as:
102 1( ) ( )10
reflA
P P Equation II.3
Then the fraction of power of reflected IR radiation at distance, d from the reflector, P3(λ) can
be written as (see Appendix-I).
23
( )( )
10A
PP Equation II.4
The power of reflected IR radiation at the analyte/fibre interface, P4(λ) due to the presence of
the fibre at distance, d can be expressed as:
Page 393
381
2
04 3
0
( ) ( ) 1 core
core
n nP P
n n Equation II.5
where no and ncore are refractive indices of the analyte and the fibre core, respectively.
However P4(λ) represents the power distributed within a boundary of cone of reflection at
distance, d (see Figure 4.3). According to the law of reflection at the reflective surface, the
radius of the cone of reflected radiation at distance d, rc,d can be expressed as [227]:
, 02 tanc d core corer r a r d Equation II.6
1
0
0
tan tan sinNA
n
where NA is numerical aperture of the step-index multimode fibre.
Therefore, the fraction of the power of IR radiation, P5(λ) that coupling back to the fibre is
given by:
5 4
0
( ) ( )2 tan
core
core
rP P
r d Equation II.7
Then considering Equation II.1 - II.7, P5(λ) can be written as:
22
10 05 0
0 0
( ) 10 1 ( )2 tan
reflAA
core core
core core
n n rP P
n n r d Equation II.8
Assuming constant reflectivity within the near-IR wavelength range and at the experimental
conditions studied, P5(λ) can be written as:
Page 394
382
5 0 0( ) , , ( )P f n A d P Equation II.9
where
22
10 00
0 0
( , , ) 10 12 tan
reflAA
core core
core core
n n rf n A d
n n r d
f(no,A,d) is a function of refractive index of the analyte, absorbance at λ and distance between
the input/output fibre and the reflector at a given time.
Page 395
383
Appendix – III
III Integral solution for kinetic model used for
cross-linking kinetics
The modified extended Kamal model that used for obtaining cross-linking kinetics of the
LY3505/XB3403 resin system is given as:
5.1
max
5.0
21 ))(( kkdt
d Equation III.1
where d /dt is the rate of reaction, and k1, k2, m and n are rate constants and reaction orders,
respectively. f is optimum conversion and is conversion at time t. Then the integral of
Equation III.1 can be written as:
1.50.5
0 01 2
t
f
ddt
k k Equation III.2
Considering left-hand side of Equation III.2, I1 can be defined as:
1 1.50.5
0 1 2 f
dI
k k Equation III.3
Page 396
384
1.5
1.5 0.50.50 1 21 2
0
1.5 0.50.5 0.5
01 2 1 20
1.
1
2
f
f
f f
dd
k kk k
d d
k k k k
21.50.5
1 20
1
2f
dI
k k Equation III.4
I2 can be defined as below:
2 0.50.5
0 1 2
2 0.5
0 0.5
1 2 1
f
c
f
f
dI
k k
dI
k k
Equation III.5
By substituting, 1 cosf
, Equation III.5 Can be re-written as bellow:
2
2
0 1 2
sin.
2 sinf f
Id
k k
Page 397
385
Then the solution of Equation III.5 is given as:
21 2
1 2 2
11
ln2
f
f
f f f
Ik k
k k k Equation III.6
By substituting solution for the I1, the solution for Equation III.2 can be written as:
21.51.5
1 1 2
1 1 1
2f f f
t Ik k k
Equation III.7
Where solution for the integral I2, is given below:
2 1 2 1 2
21 2 1 2
ln lnf f f
f f
f f
I k k k kkk k k k
Page 398
386
Appendix - IV
Publications produced during the thesis
Major findings presented in this thesis were published in the following publications [P1-P7].
In addition to the main content of this thesis, five papers were published, which involved
developing a broad spectrum of fibre-optic sensors for process monitoring and life assessment
of composites. These papers are listed below in [P8-P12] and include studies in the area of
self-sensing using reinforcing fibres [P8], strain transfer in fibre Bragg gratings [P9],
comparison of fibre sensing techniques [P10], concept of self-healing and self-sensing
composites [P11] and low-cost spectroscopic sensors [P12].
First author journal papers
[P1] Mahendran, R. S., Wang, L., Machavaram, V. R., Chen, R., Kukureka, S. N. and
Fernando, G. F., “Fibre optic sensor design for chemical process and environmental
monitoring”, Optics and Laser Engineering, 47, 1069-1076, (2009).
First author conference papers
[P2] Mahendran, R. S., Machavaram, V. R., Wang L., Nair, A. K. R., Burns, J. M., Kukureka,
S. N. and Fernando, G. F., “A novel multi-functional sensor design for process
monitoring” Int. Conf. On Composite Materials: ICCM-17, July 2009, Edinburgh, UK
(2009).
Page 399
387
[P3] Mahendran, R. S., Chen, R., Kukureka, S. N. and Fernando, G. F., "Monitoring and
modeling the diffusion profile in a thermosetting resin" in SPIE/Smart Structures and
Materials & Nondestructive Evaluation and Health Monitoring 2009: Smart Sensor
Phenomena, Technology, Networks, and Systems, edited by Norbert G. Meyendorf,
Kara J. Peters, Wolfgang Ecke, Proceedings of SPIE Vol. 7293, 729319, March 2009,
San Diego, CA, USA (2009).
[P4] Mahendran, R. S., Machavaram, V. R., Wang, L., Burns, J. M., Harris, D., Kukureka, S.
N. and Fernando, G. F., "A novel multifunctional fibre optic sensor" in SPIE/Smart
Structures and Materials & Nondestructive Evaluation and Health Monitoring 2009:
Smart Sensor Phenomena, Technology, Networks, and Systems, edited by Norbert G.
Meyendorf, Kara J. Peters, Wolfgang Ecke, Proceedings of SPIE Vol. 7293, 72930C,
March 2009, San Diego, CA, USA (2009).
[P5] Mahendran, R., Chen, R., Wang, L., Pandita, S. D., Machavaram, V. R., Kukureka, S.
N., Fernando, G. F., "Chemical process monitoring and the detection of moisture
ingress in composites" in SPIE/Smart Structures and Materials & Nondestructive
Evaluation and Health Monitoring 2008: Smart Sensor Phenomena, Technology,
Networks, and Systems, edited by Wolfgang Ecke, Kara J. Peters, Norbert G.
Meyendorf, Proceedings of SPIE Vol. 6933, 69330R, March 2008, San Diego, CA,
USA (2008).
[P6] Mahendran, R. S., Machavaram, V. R., Wang L., Kukureka, S. N., Paget, M. and
Fernando, G. F., “A novel multi-measurand fibre optic sensor”, 16th Annual
Page 400
388
International Conference on Composites/Nanoengineering (ICCE-16), Kunming,
China, 20 July (2008).
[P7] Mahendran, R. S., Harris, D., Wang, L., Machavaram, V. R., Chen, R., Kukureka, S. N.
and Fernando, G. F., "Fibre optic sensor design for chemical process and
environmental monitoring" in International Conference on Smart Materials and
Nanotechnology in Engineering, edited by Shanyi Du, Jinsong Leng, Anand K.
Asundi, Proceedings of SPIE Vol. 6423, 64232S, July 2007, Harbin, China (2007).
Other conference papers
[P8] Malik, S. A., Wang, L., Mahendran, R. S., Harris, D., Ojo, S. O., Collins, D., Paget, M.,
Pandita, S. D., Machavaram, V. R. and Fernando, G. F., "In-situ damage detection
using self-sensing composites" eds. Tomizuka M., Proceedings of SPIE/Sensors and
Smart Structures Technologies for Civil, Mechanical, and Aerospace Systems, Vol.
7292, 729204, March 2009, San Diego CA, USA. (2009).
[P9] Malik, S. A., Mahendran, R. S., Harris, D., Paget, M., Pandita, S. D., Machavaram, V.
R., Collins, D., Burns, J. M., Wang, L. and Fernando, G. F., "Finite element modelling
of fibre Bragg grating sensors and experimental validation", eds. Tomizuka M.,
Proceedings of SPIE/Sensors and Smart Structures Technologies for Civil,
Mechanical, and Aerospace Systems, Vol. 7292, 72921V, March 2009, San Diego
CA, USA. (2009).
[P10] Wang, L., Machavaram, V. R., Mahendran, R. S., Harris, D., Pandita, S. D., Tomlin, A.,
Redmore, E., Malik, S. A., Fernando, G. F., "A comparison of cure monitoring
Page 401
389
techniques" in Sensors and Smart Structures Technologies for Civil, Mechanical, and
Aerospace Systems 2009, edited by Masayoshi Tomizuka, Proceedings of SPIE Vol.
7292, 729213, March 2009, San Diego CA, USA. (2009).
[P11] Harris, D., Mahendran, R. S., Brooks, D., Al-Khodairi, F. A., Machavaram, V. R.,
Reynolds, P., Wang, L., Pandita, S. D., Paget, M., Wedderburn, J., Malik, S. A., Ojo,
S. O., Kukureka, S. N., Fernando, G. F., "Self-sensing, self-healing, and crack-
arrestor composites" in SPIE/Smart Structures and Materials & Nondestructive
Evaluation and Health Monitoring 2009: Smart Sensor Phenomena, Technology,
Networks, and Systems, edited by Norbert G. Meyendorf, Kara J. Peters, Wolfgang
Ecke, Vol. 7293, 72930P, March 2009, San Diego, CA, USA (2009).
[P12] Machavaram, V. R., Mahendran, R. S., Wang, L., Chen, R., Kukureka, S. N. and
Fernando, G. F., “Cure monitoring and water ingress detection using a low-cost fibre-
optic sensor”, 16th Annual International Conference on Composites/Nanoengineering
(ICCE-16), Kunming, China, 20 July (2008).


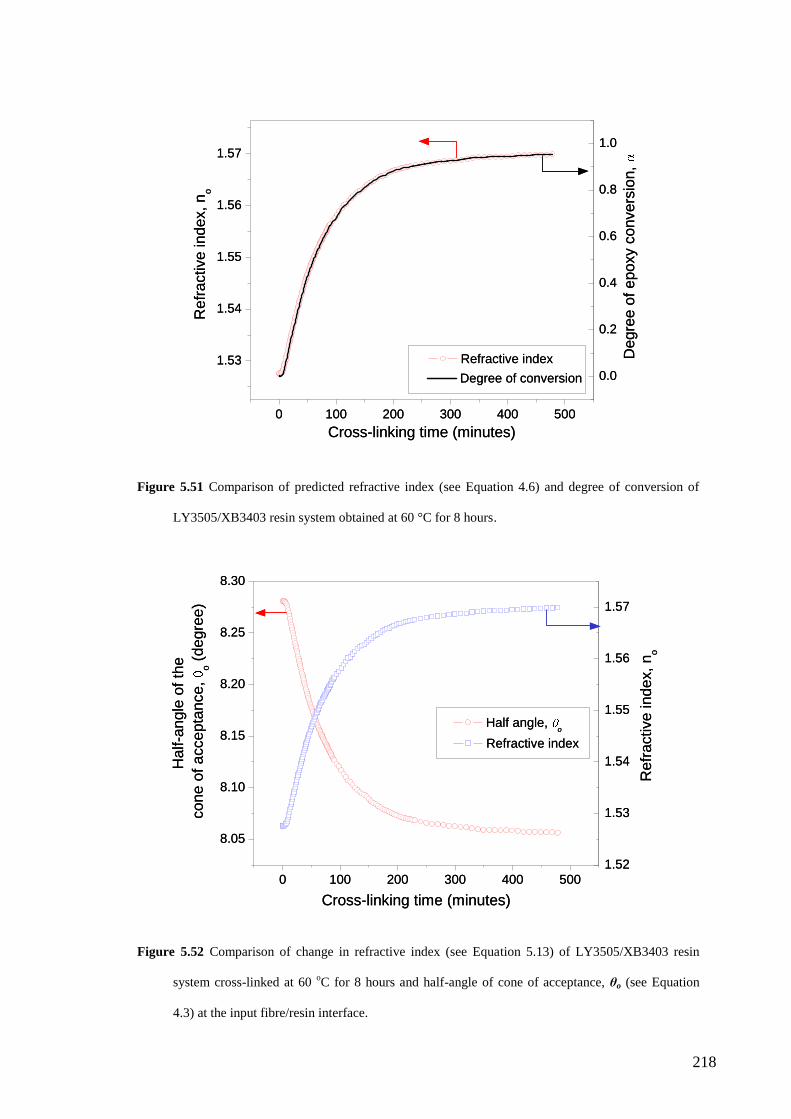


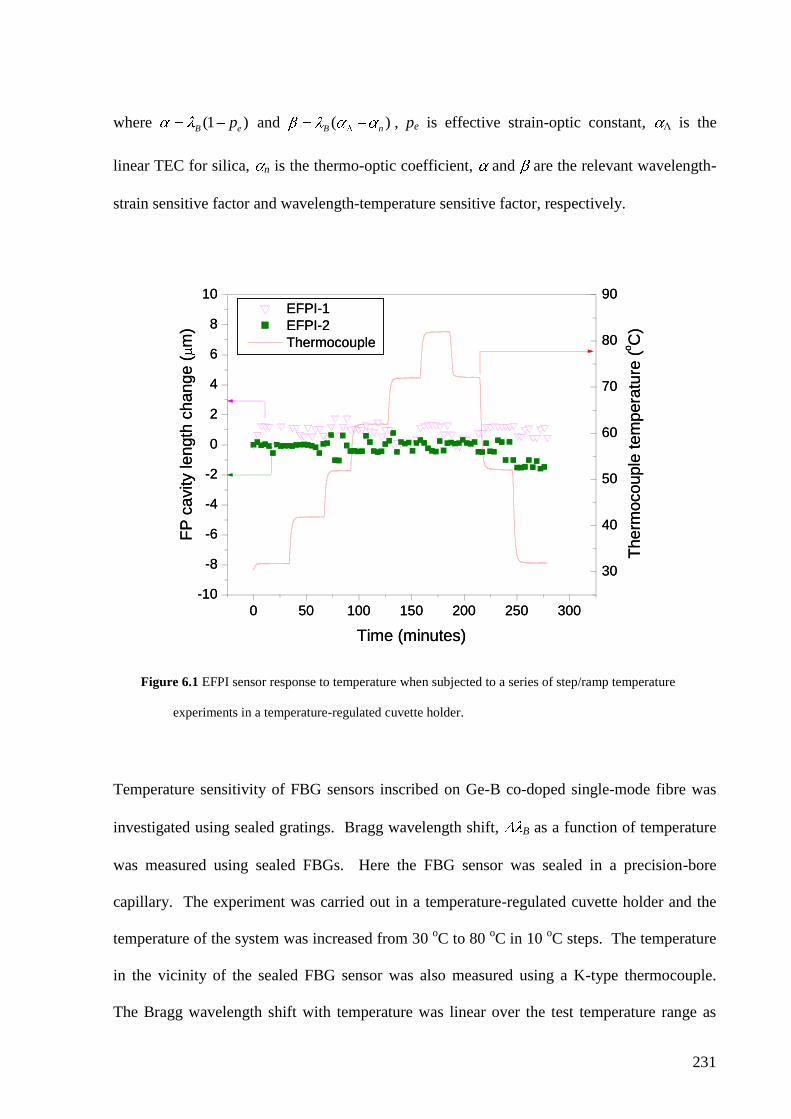


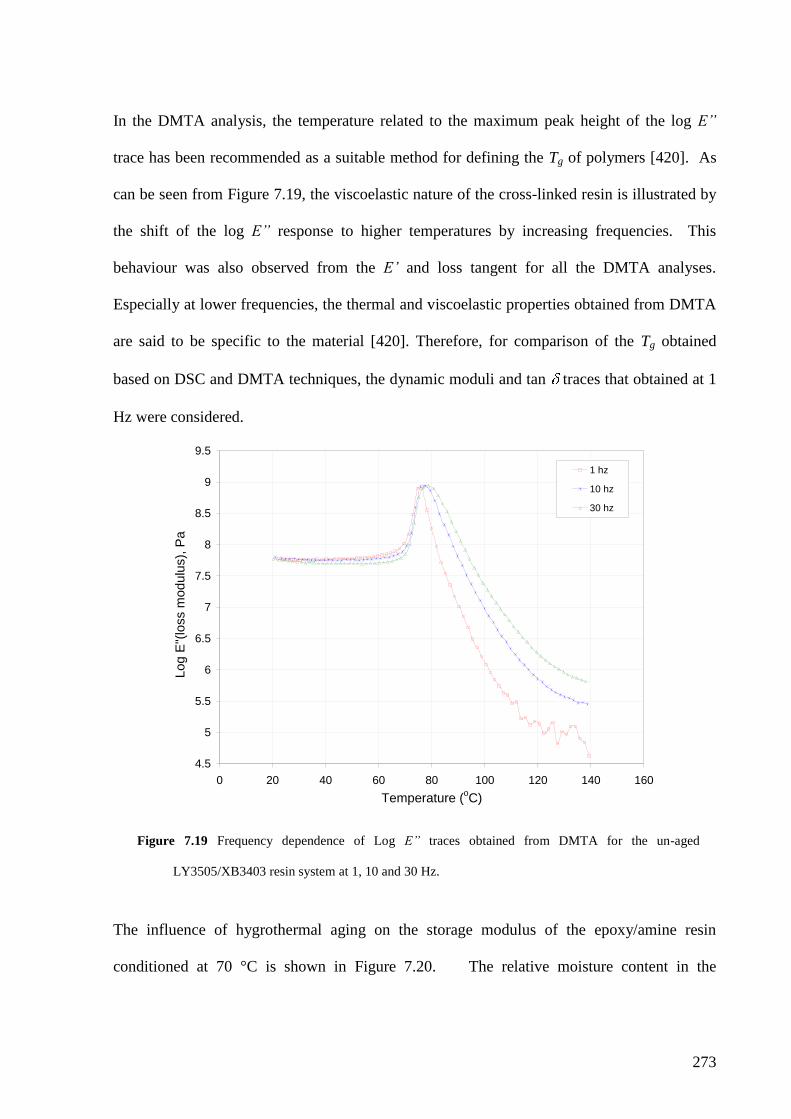


![Convolutional Feature Maps - mp7.watson.ibm.commp7.watson.ibm.com/ICCV2015/slides/iccv2015_tutorial_convolutional... · see [Mahendran & Vedaldi, CVPR 2015] Aravindh Mahendran & Andrea](https://static.documents.pub/doc/80x56/5c76d1ff09d3f29a548b72f1/convolutional-feature-maps-mp7-see-mahendran-vedaldi-cvpr-2015-aravindh.jpg)


