1 Randall & Quilter Investment Holdings Ltd. (“R&Q” or the “Group”) Final results for the year ended 31 December 2014 The Board of Randall & Quilter (AIM:RQIH), the specialist non-life insurance investor, service provider and underwriting manager, is pleased to announce the Group’s final results for the year ended 31 December 2014. Overview 2014 was a challenging year financially but we remain confident about the prospects and outlook for the Group. Key highlights include: - A strong contribution from new legacy transactions completed during the year and from the UK operations of the Insurance Services Division (“ISD”), particularly broker run-off and credit control services. - Securing the contract to provide the back office support for Syndicate 2088, the newly established syndicate managed by XL Catlin and backed by China Re. - The acquisition of Accredited, a US admitted insurance carrier rated A- by AM Best, which provides the Group with the opportunity to develop over the medium term valuable new fee income for the Underwriting Management Division (“UMD”) and enhanced new business sources for our live syndicate (Syndicate 1991). However, as commented on in the 2014 interim results and subsequent trading updates, the 2014 result was adversely impacted by reserve deterioration in R&Q Re US, the legal costs relating to the recently concluded Syndicate 102 arbitration and weaker than expected trading in the Group’s US service operations. The Board is proposing a final return of capital in respect of the 2014 financial year of 5.0 pence per share to those shareholders on the register on 28 July 2015, with payments expected to be made on or around 10 August 2015. This will bring the total for the year to 8.4p per share (2013: 8.4p per share), reflecting our confidence in the Group’s underlying trading and future prospects. There will be no option to receive an income dividend and the return of capital remains subject to the customary approval of the Group’s shareholders at the forthcoming Annual General Meeting. Strategy and business model The overall mission and purpose of the Group remains to offer investors a stable cash profit stream from Insurance Services, potential additional profits and capital extractions from Insurance Investments and significant growth prospects through a fee focused Underwriting Management business. Our main strategic objectives are to: acquire or reinsure run-off insurance companies and portfolios to produce attractive cash returns; provide specialist insurance services to the live, run-off and captive markets; grow our Lloyd’s managing agency business; and develop Accredited, our new US admitted carrier, with diversified sources of revenue, including fee-based income. The Group has developed a strong reputation and good relationships in the global insurance market. The Group benefits from financial strength and a highly skilled, entrepreneurial and experienced workforce. We use these attributes to source and manage attractive run-off opportunities and to offer expertise in niche insurance services and underwriting management. The aim is to generate strong cash flows to support our business model, grow tangible book value and increase cash distributions to shareholders.
Transcript
1
Randall & Quilter Investment Holdings Ltd.(“R&Q” or the “Group”)
Final results for the year ended 31 December 2014
The Board of Randall & Quilter (AIM:RQIH), the specialist non-life insurance investor, service provider andunderwriting manager, is pleased to announce the Group’s final results for the year ended 31 December 2014.
Overview
2014 was a challenging year financially but we remain confident about the prospects and outlook for the Group. Keyhighlights include:
- A strong contribution from new legacy transactions completed during the year and from the UK operationsof the Insurance Services Division (“ISD”), particularly broker run-off and credit control services.
- Securing the contract to provide the back office support for Syndicate 2088, the newly established syndicatemanaged by XL Catlin and backed by China Re.
- The acquisition of Accredited, a US admitted insurance carrier rated A- by AM Best, which provides theGroup with the opportunity to develop over the medium term valuable new fee income for the UnderwritingManagement Division (“UMD”) and enhanced new business sources for our live syndicate (Syndicate 1991).
However, as commented on in the 2014 interim results and subsequent trading updates, the 2014 result wasadversely impacted by reserve deterioration in R&Q Re US, the legal costs relating to the recently concludedSyndicate 102 arbitration and weaker than expected trading in the Group’s US service operations.
The Board is proposing a final return of capital in respect of the 2014 financial year of 5.0 pence per share to thoseshareholders on the register on 28 July 2015, with payments expected to be made on or around 10 August 2015.This will bring the total for the year to 8.4p per share (2013: 8.4p per share), reflecting our confidence in the Group’sunderlying trading and future prospects. There will be no option to receive an income dividend and the return ofcapital remains subject to the customary approval of the Group’s shareholders at the forthcoming Annual GeneralMeeting.
Strategy and business model
The overall mission and purpose of the Group remains to offer investors a stable cash profit stream from InsuranceServices, potential additional profits and capital extractions from Insurance Investments and significant growthprospects through a fee focused Underwriting Management business.
Our main strategic objectives are to:
acquire or reinsure run-off insurance companies and portfolios to produce attractive cash returns; provide specialist insurance services to the live, run-off and captive markets; grow our Lloyd’s managing agency business; and develop Accredited, our new US admitted carrier, with diversified sources of revenue, including fee-based
income.
The Group has developed a strong reputation and good relationships in the global insurance market. The Groupbenefits from financial strength and a highly skilled, entrepreneurial and experienced workforce. We use theseattributes to source and manage attractive run-off opportunities and to offer expertise in niche insurance servicesand underwriting management. The aim is to generate strong cash flows to support our business model, growtangible book value and increase cash distributions to shareholders.
2
Group performance
£000s 2014 2013
Group resultsOperating (loss)/ profit * (Group KPI) (799)** 10,159***(Loss)/profit before tax (1,559)** 9,564***(Loss)/profit after tax (2,746) 7,440***Earnings per share (basic) (Group KPI) (6.3)p 11.9p
Key statisticsInvestment return on free assets 2.5% 3.3%Return on tangible equity (3.2%) 11.8%Net tangible assets per share (Group KPI) 88.2p 116.4pDistribution per share (Group KPI) 8.4p 8.4p*Operating (loss)/profit is defined as (loss)/profit before income tax, finance costs and share of loss of associate** In 2014, operating profit and profit before tax are stated before deducting exceptional costs relating to the acquisition of Accredited of £750k***In 2013, operating profit, profit before tax and profit after tax are stated after the deduction of non-controlling interests primarily relating to Syndicate 3330of £1,695k
As stated, 2014 was a challenging year overall, primarily for the reasons detailed in our November trading update.The deterioration in net provisions for asbestos claims in R&Q Re US, the significant legal expenses associated withthe recently successfully concluded arbitration of a large life settlement claim in former Syndicate 102, and thefailure to secure a number of anticipated service contract wins in the now restructured US service operations werethe main contributory factors.
In addition, maintaining our underwriting discipline amidst poor underwriting conditions slowed the development ofearned premium in Syndicate 1991, reduced commission income growth in our Managing General Agency (MGA)business units, and restricted the flow of new syndicate management opportunities.
Investment income was weak in the second half of the year as credit spreads widened, especially in structured andhigh yield credit where the Group has a significant portion of its assets, though the full year performance wassatisfactory. The fall in long-term gilt yields, which has already been partially reversed in the current year to date,caused the pension deficit to increase (as measured by IAS 19) by £4.0m, accounting for the larger fall in net tangibleasset per share than would otherwise be expected from the trading result and shareholder distributions made duringthe year.
Other areas of the Group performed well. We completed nine legacy transactions in 2014, with an increasedemphasis on EU-domiciled and Bermuda based entities, prompted in part by the impending introduction of SolvencyII and other equivalent solvency regimes. UK services performed well, with broker services continuing to gain in scaleand efficiency, as well as strong growth in our premium credit control services after we were awarded preferredsupplier status by the Lloyd’s Market Association at the end of 2013. We signed a new contract to provide back officesupport for Syndicate 2088, the newly established syndicate managed by XL Catlin and backed by China Re.Furthermore, our acquisition of Accredited, an A- rated US-admitted carrier, offers significant growth potential infees and underwriting distribution, albeit the necessary US state regulatory processes will delay full implementationuntil 2016. Similarly, the US Healthcare initiative continues to develop with potential opportunities for the ISD andInsurance Investments Division (“IID”) through legacy acquisition opportunities.
3
Divisional overview
Insurance Investments
£000s 2014 2013
Live income 10,093 5,472Run-off Income 18,465 15,624Total income 28,558 21,096
Result of operating activities (live and run-off) (4,389) 10,333
Key metricsNet insurance claims released – run-off 2,360 8,313Acquired through portfolio transfers (7,393) -Total net claims provisions (increased)/released (5,033) 8,313
Goodwill on bargain purchase 8,609 8,479
Live Syndicates’ contribution to operating profit (2,566) (2,011)
Increase in fair value of insolvent insurance debt portfolio 1,700 4,257
Investment return on free assets 2.5% 3.3% A further £2,498k goodwill on bargain purchase was generated on the Accredited acquisition (attributed to UMD) and £3,485k goodwill on bargain
purchase was generated on the Oval acquisition (attributed to ISD) Investment return % is calculated as net investment income over average total investments. Investment return is stated after fees of £547k and
£581k in 2014 and 2013 respectively.
The IID benefited from a strong contribution from the nine legacy transactions completed in the year (eightacquisitions and one retrospective reinsurance), and from reserve releases from each run-off insurance companysave for R&Q Re US, which was affected by deterioration in its US asbestos book. The Division made a reasonableinvestment return of 2.5% in markets which, in the second half especially, favoured a more traditional credit andgovernment bond-based investment strategy rather than the Group’s focus on structured and high-yield credit. Wedid nevertheless manage to outperform the majority of traditional fixed income strategies, which was pleasing.
Syndicate results were poor in the aggregate, mostly as a result of: (i) a weaker than expected performance in formerrun-off Syndicate 102, which was impacted by high legal costs related to the now successfully concluded arbitrationand deterioration in the values of certain life policy assets; and (ii) losses from the live syndicate participations,which continued to be impacted by slow development of premium exacerbated by poor underwriting conditions.Run-off Syndicate 3330 however continued to perform strongly, in line with expectations.
Profitability of the Division was also negatively impacted by lower cost recoveries in the US than the prior year.
The insolvent insurance debt portfolio performed to plan, albeit the contribution was significantly lower than in2013, which benefited from the move to fair value accounting. The joint venture with Phoenix Asset ManagementPartners Limited (“Phoenix”) was successfully launched at the end of the year through the transaction to sell 50% ofthe portfolio, which will serve to increase our capacity as a buyer going forward.
Insurance Services
£000s 2014 2013
Total revenue 36,899 39,399- Of which intercompany 15,385 16,829
4
- Of which third party 21,514 22,570Operating profit * 8,321 9,839Operating profit margin ** 22.6% 25.0%*Operating profit is defined as profit before income tax and finance costs**Operating profit margin is defined as operating profit divided by total income
UK insurance services returned a strong performance, particularly in broker and financial services run-off, premiumcredit control and binding authority management services. However, results in the US were disappointing, primarilydue to a failure to secure certain targeted new business. We have recently restructured this business to focus on theprofitable accounting and reinsurance collection services. We continue to grow our franchise in captive managementservices, and the US Healthcare initiative is developing positively although it will continue to require investment untilincome picks up towards the end of the current year.
Accredited ***- Profit before tax 1,076 N/A- Return on net tangible equity 6.52% N/A*Operating profit/(loss) is defined as profit/(loss) before income tax, finance costs and share of loss of associate** Operating profit/(loss) margin is defined as operating profit/(loss) divided by total income*** Acquired on 26 November 2014. These metrics are presented as if Accredited were owned by the Group for the entire year.
During 2014, we secured a new third-party syndicate management contract to provide back office support forSyndicate 2088, the newly established syndicate managed by XL Catlin and backed by China Re. Syndicate 1991successfully doubled its capacity in the 2014 year of account; however, earned premium development continues tobe slow. The acquisition of Accredited, an A- rated US-admitted carrier, offers an opportunity to generate future feesand increase distribution to Syndicate 1991. We experienced reasonable performance from our MGA business unitsduring the year, all of which grew commission income. The sale of R&Q Marine Services Limited was completed inFebruary 2015 at a premium to book value.
GovernanceWe set high standards of corporate governance, with a structure designed to establish, implement and maintain theeffective controls essential to the Group’s long-term success. The role of the Board is to set the Group’s strategicobjectives, and to oversee and review management performance, ensuring the required resources are available formeeting those objectives. The Board met regularly through the year to debate and conduct these matters.
Our peopleDuring the past year, our staff have continued to make valuable contributions to the success of the Group and Iemphasise my gratitude for this. We continue to identify and recruit high-quality individuals to develop existing andnew business areas, and we demonstrate strength and depth in the management team across the three divisions.We are pleased to welcome, amongst other new joiners, Heather McKinlay as Deputy Group CFO, Caroline Cotterellas Group Head of HR, Terry McGinness as Group Head of IT as well as Debbie Snow, Sharon Jallad, Marney Emel andAJ Campofiore, all from Accredited. We would like to wish Brenda Payter, who worked for the Group for a number ofyears, latterly helping the Group’s managing agency become fully Solvency II compliant, a happy retirement.
5
OutlookWe expect a much improved full year result compared with 2014, with the potential to increase distribution toshareholders in line with anticipated profit growth.
Our run-off entities are generally performing satisfactorily, and we are working on a strong legacy and run-offacquisition pipeline, continuing and expanding our geographical diversity, and focusing on some larger scaleopportunities. Certain of these transactions, such as the acquisition of IC Insurance Limited, have already beenannounced and are only subject to change of control approval. Others are very well-progressed, but in most, if not allcases, completion is not expected until the second half of 2015. This, coupled with the fact that our servicebusinesses have a customary income bias in the latter part of the year, will mean that the Group’s profit will likelyemanate in the second half of the year. However, considerably more progress has already been achieved towardsmeeting our year end goal than was the case at the equivalent stage in 2014.
Investment markets have been generally favourable in the year to date for our type of investment portfolio, with itsfocus on floating rate structured credit, though yields remain low.
Syndicate 1991 premium continues to build although a lot more slowly than we originally anticipated. However,there are some positive signs of good business retention rates and continuing new business flows, leading to moresubstantial levels of business being bound. As previously indicated, we have steadily lessened our live underwritingexposure and have reduced the capacity we provide on Syndicate 1991 to £20m for the 2015 underwriting year,from £30m in 2014; this is to focus on fee-generating new third-party syndicate management opportunities. ThroughAccredited, our newly acquired A- rated US admitted carrier, we are developing, subject to completing variousregulatory processes, new sources of fee income in the US admitted market, placing business through to our ownsyndicate and interested third parties, potentially from the end of 2015 but most likely from 2016 onwards.
We continue to see new business growth in UK services with further broker run-off opportunities arising. We havebeen refining our strategy, and have closed down the non-performing parts of our US services operations. We havesold our Marine MGA to Hiscox at an attractive premium to book value, but continue to support the growth of ourremaining MGA units, Commercial Risk Services and Synergy Insurance Services.
As well as generating potential service opportunities through offering carriers ways to reduce medical expenses inworkers’ compensation claims, the US Healthcare initiative could also bring benefits to our legacy acquisitionactivity.
Across the business we are reviewing our cost base with a view to realising economies and the Remuneration andNominations Committee will be focusing on senior management succession issues.
We look to the future with confidence after a challenging year financially during 2014. We benefit from an excellentlegacy transaction pipeline, a newly streamlined service operation in the US and further opportunity to grow feeincome in our Underwriting Management Division. The focus will be firmly on growing tangible book value andresuming the annual increases in cash distributions to shareholders.
K E RandallChairman and Chief Executive Officer
6
Insurance Investments Division
£000s 2014 2013
Live income 10,093 5,472Run-off income 18,465 15,624Total Income 28,558 21,096
Live operating loss (2,566) (2,011)Run-off operating (loss)/profit (1,823) 12,344
Operating (loss)/profit (4,389) 10,333
Net claims releases/(increases)- Europe 3,131 5,278- US (2,241) (1,440)- Bermuda 73 (223)- Run-off Syndicates 1,397 4,698
2,360 8,313Acquired through portfolio transfers (7,393) -Total (5,033) 8,313
Goodwill on bargain purchase- Europe 2,560 7,404- Bermuda 3,539 825- Other 2,510 250Total 8,609 8,479
Live Syndicates (The Group’s share)- Live operating loss (2,566) (2,011)
RQLM- Fair value of debt 10,629 16,033- Movement in fair value of debt 1,700 4,257
Investment return on free assets- Percentage 2.5% 3.3%- Net investment income 5,079 7,118
A further £2,498k goodwill on bargain purchase was generated on the Accredited acquisition (shown in UMD) and £3,485k goodwill on bargainpurchase was generated on the Oval acquisition (shown in ISD)
Investment return % is calculated as net investment income over average total investments. Investment return is stated after fees of £547k and£581k in 2014 and 2013 respectively.
2014 saw a significant increase in income in the division but a fall in profitability.
Income rose in the live segment as earned premium from our Syndicate 1991 participation increased. In the run-offsegment, income rose as a result of the retrospective reinsurance premium relating to the AEGON non-life lossportfolio transfer.
Profitability was primarily impacted by the following factors, all of which are discussed in further detail below: lowerclaims releases, a reduced contribution from the insolvent insurance debt portfolio, lower investment income, andhigher expenses in our US companies, which in the prior year benefited from certain legal expense recoveries andcredits arising from the attachment of the ACE surplus maintenance agreement.
7
Run-off investmentsClaims releases from run-off insurance companies were positive at £2.4m but significantly below last year’s total of£8.3m, primarily as a result of the higher strengthening in R&Q Re US’s asbestos reserves but also lower releases inR&Q Malta and R&Q Re UK. The results from the run-off syndicates were positive overall given continued strongperformance from Syndicate 3330’s 2012 year of account, but the impact of the legal expenses associated with thearbitration in former Syndicate 102 meant that the contribution was below original expectations. It is neverthelesspleasing to report a successful resolution to this long-standing dispute concerning a life settlement claim.
Mergers and acquisitionsEight legacy acquisitions were completed during 2014 within the Insurance Investments Division generating goodwillon bargain purchase of £8.6m. These figures exclude the Oval and Accredited acquisitions which are reflected in theInsurance Services Division and Underwriting Management Division respectively.
In addition, the reinsurance premium received for AEGON’s non-life book exceeded estimated liabilities. Adding thisrisk premium to the goodwill on bargain purchase for the year, the contribution from legacy acquisition activity wassignificantly ahead of the prior year, which itself was a very good year.
The deals completed were broad in type and geography. Silco was a US based Black Lung Trust, Pender was an Isle ofMan insurer subject to a scheme, SRM and Catholic were both Bermuda-based cells with predominantly Workers’Compensation (“WC”) exposures, Armitage and Berda were Unilever’s Bermuda-based captives which primarilywrote WC deductible reimbursement policies, Aker was a Norwegian WC portfolio transfer and Tryg was a portfoliotransfer of Danish, Swedish and Norwegian based marine business.
We are pleased to report that R&Q Malta is gaining significance as our strategy of consolidating run-off portfoliosinto this company develops and we offer flexible and well-priced exit solutions to the growing number of interestedparties in the UK and rest of Europe ahead of Solvency II implementation. Meanwhile, our Bermuda based teamcontinues to develop its loss portfolio transfer solutions using our segregated account companies in Bermuda andthe US.
Live syndicate resultsOur participation on live syndicates, including Syndicate 1991, which is the Group’s own syndicate, and Syndicate1897, for which we were previously turnkey agent, produced higher income in the aggregate in 2014 but slightlyhigher losses compared with the prior year. We remain on only one underwriting year of account for Syndicate 1897,being the 2013 year of account, which should naturally close at the end of this year.
Much as anticipated, premium development in Syndicate 1991 continued at a slow pace given challenging marketunderwriting conditions and the knock-on effects of earlier delays in signing up the MGAs with which the syndicatehas established its binding authorities. This meant that the higher expenses associated with an expanded team and alarger underwriting book and reinsurance programme outweighed the benefits of the higher premium levels. Asincome continues to grow, expenses will be mitigated and the bottom line result will improve. The loss ratiocontinues to be in line or ahead of plan.
As indicated earlier in the year, we reduced our underwriting commitment for the 2015 year of account from £30mto £20m and will begin to see our associated funding begin to fall as early year capital loadings are removed and theaccount’s track record as regards claims loss ratios is proven. Going forward the Group believes that a focus onmanagement and fee income, rather than the deployment of significant levels of underwriting capital, will generatethe best returns for shareholders.
Insolvent insurance debt portfolioRQLM Limited is our subsidiary that is dedicated to acquiring insurance debt from insolvent estates. We had anactive year during 2014 with results in line or slightly ahead of expectations, though the contribution was materiallylower than in 2013, which benefited from our switch to a fair value accounting basis in that year. The fair value ofdebt decreased year on year from £16.0m to £10.6m primarily due to the receipt of a large dividend on certainpositions we owned as an estate moved to closure earlier this year.
8
We were pleased to announce the joint venture with Phoenix in November 2014 which has increased our capacity asa bidder, a benefit we have brought to bear in recent successful acquisitions in 2015.
Investments and investment income (including Funds at Lloyd’s)
Cash 22%AAA 10%AA 18%A 24%BBB 2%BB 9%Unrated * 15%Total 100%* ‘Unrated’ includes cash held within our Funds at Lloyd’s
We generated a satisfactory investment performance during 2014 with an average return of 2.5% on free assets ofaround £160m equivalent. After a strong first half year, returns were disappointing during the remainder of the yearwhen yields began to fall and credit spreads widened, especially in structured and high-yield credit where the Grouphas a significant amount of its assets invested. However, our strategy of being diversified and focused on high qualitysecurities with low credit spread duration paid off and we avoided suffering mark to market losses on the portfoliooverall. As a result, despite the falling yield environment, we managed to generate a better full year performancethan the majority of traditional fixed income strategies
The Group’s asset allocations and credit ratings generally remained similar to the prior year though the cashallocation increased towards the end of the year as we reduced exposure to lower grade structured credit. We haverecently appointed two new investment managers to manage all of our US and non-US assets respectively, who willassist in optimal allocation according to market conditions. We will continue with low interest rate duration and astructured credit focus though there will be reductions in the ABS and CLO allocations. We expect the average yieldto increase modestly post the proposed reallocations to above 2.5%.
9
Insurance Services Division
£000s 2014 2013
Total income 36,899 39,399- Of which intercompany 15,385 16,829- Of which third party 21,514 22,570Operating profit * 8,321 9,839Operating profit margin ** 22.6% 25.0%*Operating profit is defined as profit before income tax and finance costs**Operating profit margin is defined as operating profit divided by total income
Total income and operating profit in the Insurance Services Division fell slightly in 2014 against 2013, but the qualityof income and profit improved significantly and the operating margin remained comfortably above our 20% target.
Run-off services
£000s 2014 2013
Total income 21,214 19,363Operating profit * 10,760 5,949Operating profit margin ** 50.7% 30.7%Operating profit margin excluding goodwill onbargain purchase ** 41.0% 30.7%*Operating profit is defined as profit before income tax and finance costs**Operating profit margin is defined as operating profit divided by total income
Run-off services performed strongly during 2014 with income and especially operating profit increasing significantly.Our broker services in the UK were the primary driver of the improved performance, in part due to the goodwill onbargain purchase arising on the acquisition of a broker and financial services run-off. In addition, we expanded thebroker service contracts with a number of insurers. Whilst credit write backs continued, they were lower than theprior year, reflecting an improved underlying quality in third party income.
Live Services
£000s 2014 2013
Total income 15,685 20,036- Of which non-US 8,591 8,893- Of which US 7,094 11,143Operating (loss)/profit * (2,439) 3,890- Of which non-US 333 100- Of which US (2,772) 3,790Operating profit margin ** (15.5%) 19.4%*Operating profit is defined as profit before income tax and finance costs**Operating profit margin is defined as operating profit divided by total income
The 2014 income and operating result in live services was impacted by a weak result in the US, although the non-USbusiness saw improved profitability especially in liquidity services in the UK. Indeed, UK income grew by more than20% and the operating margin improved to 11% from a negative figure in 2013, as our status as preferred premiumcredit control supplier awarded by the Lloyd’s Market Association helped us win new contracts and gain scale.Elsewhere, whilst third party income in captive management grew, operating profit was impacted by the cost of newsenior hires aimed at driving future revenue growth, as well as a lower contribution from internally generated feesfrom acquiring new captives in run-off against 2013.
10
Following a continued disappointing performance in US services, we have decided to continue only with third partyaccounting and reinsurance collection services, Workers’ Compensation support systems, as well as RTU, our legacybroking facility, and the Healthcare initiative referenced below. Whilst this restructuring will benefit the Divisionalresult in the future, the current year will be muted after restructuring charges. It should also be noted that the 2013result benefited from a significant credit write back in one of the subsidiary operations, as detailed at the time.
Whilst income from the US Healthcare initiative was negligible during 2014, we expect programme managementservices to develop into a source of new profit and revenue during the latter part of 2015 and beyond. There is alsopotential to provide a combined service and exit solution for captives, self-insurers and carriers looking to bring morecertainty to portfolios of Workers’ Compensation claims.
11
Underwriting Management Division
£000s 2014 2013
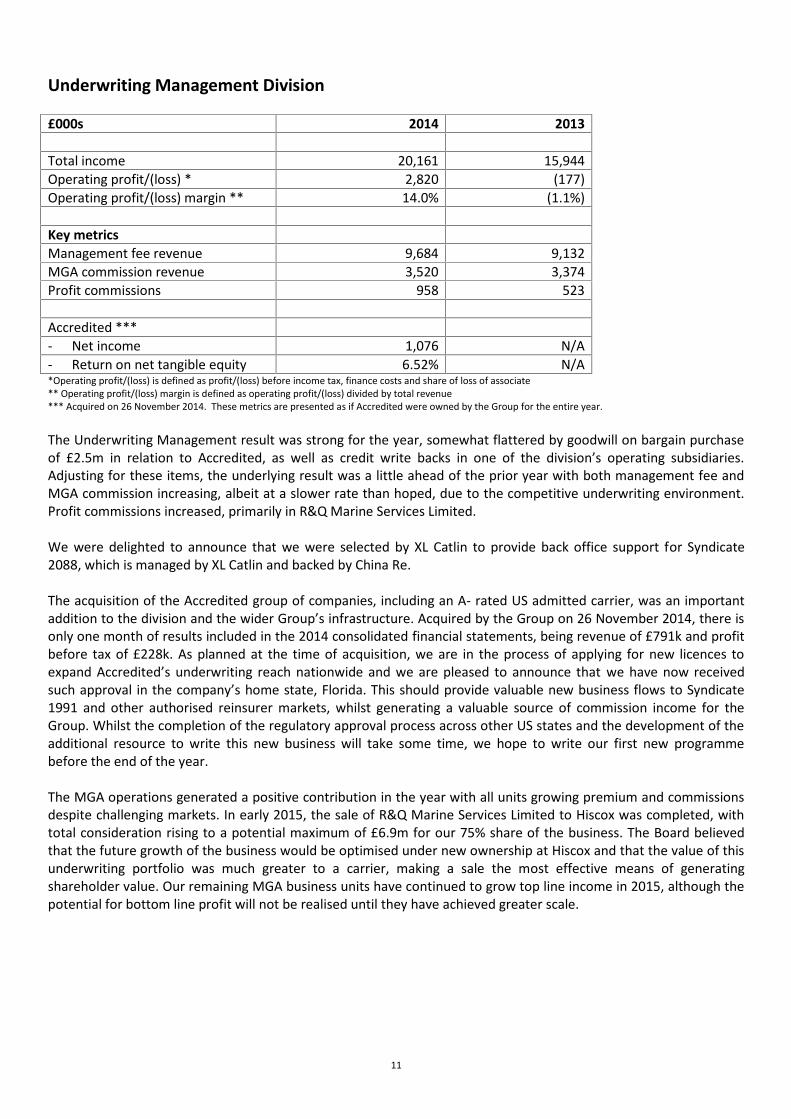
Total income 20,161 15,944Operating profit/(loss) * 2,820 (177)Operating profit/(loss) margin ** 14.0% (1.1%)
Accredited ***- Net income 1,076 N/A- Return on net tangible equity 6.52% N/A*Operating profit/(loss) is defined as profit/(loss) before income tax, finance costs and share of loss of associate** Operating profit/(loss) margin is defined as operating profit/(loss) divided by total revenue*** Acquired on 26 November 2014. These metrics are presented as if Accredited were owned by the Group for the entire year.
The Underwriting Management result was strong for the year, somewhat flattered by goodwill on bargain purchaseof £2.5m in relation to Accredited, as well as credit write backs in one of the division’s operating subsidiaries.Adjusting for these items, the underlying result was a little ahead of the prior year with both management fee andMGA commission increasing, albeit at a slower rate than hoped, due to the competitive underwriting environment.Profit commissions increased, primarily in R&Q Marine Services Limited.
We were delighted to announce that we were selected by XL Catlin to provide back office support for Syndicate2088, which is managed by XL Catlin and backed by China Re.
The acquisition of the Accredited group of companies, including an A- rated US admitted carrier, was an importantaddition to the division and the wider Group’s infrastructure. Acquired by the Group on 26 November 2014, there isonly one month of results included in the 2014 consolidated financial statements, being revenue of £791k and profitbefore tax of £228k. As planned at the time of acquisition, we are in the process of applying for new licences toexpand Accredited’s underwriting reach nationwide and we are pleased to announce that we have now receivedsuch approval in the company’s home state, Florida. This should provide valuable new business flows to Syndicate1991 and other authorised reinsurer markets, whilst generating a valuable source of commission income for theGroup. Whilst the completion of the regulatory approval process across other US states and the development of theadditional resource to write this new business will take some time, we hope to write our first new programmebefore the end of the year.
The MGA operations generated a positive contribution in the year with all units growing premium and commissionsdespite challenging markets. In early 2015, the sale of R&Q Marine Services Limited to Hiscox was completed, withtotal consideration rising to a potential maximum of £6.9m for our 75% share of the business. The Board believedthat the future growth of the business would be optimised under new ownership at Hiscox and that the value of thisunderwriting portfolio was much greater to a carrier, making a sale the most effective means of generatingshareholder value. Our remaining MGA business units have continued to grow top line income in 2015, although thepotential for bottom line profit will not be realised until they have achieved greater scale.
12
Randall & Quilter Investment Holdings Ltd.
Consolidated Income StatementFor the years ended 31 December 2014 and 2013
1
2014 2013
Note £000 £000 £000 £000
Gross premiums written 24,751 9,121Written premiums ceded to reinsurers (1,285) (837)Net written premiums 23,466 8,284
Change in provision for unearned premiums, gross (3,996) (2,077)Change in provision for unearned premiums, reinsurers’share 738 270Net change in provision for unearned premiums (3,258) (1,807)Earned premium, net of reinsurance 20,208 6,477
Gross investment income 6 5,626 7,699Other income 7 39,560 40,578
45,186 48,277Total income 65,394 54,754
Gross claims paid (46,624) (42,241)Reinsurers’ share of gross claims paid 26,475 21,954Claims paid, net of reinsurance (20,149) (20,287)
Movement in gross technical provisions 8,705 14,377Movement in reinsurers’ share of technical provisions 172 10,638Net change in provisions for claims 8,877 25,015
Net claims provisions (increased)/released (11,272) 4,728Operating expenses 8 (69,859) (55,904)Result of operating activities before goodwillon bargain purchase (15,737) 3,578Goodwill on bargain purchase 29 14,592 8,479Amortisation and impairment of intangibleassets
14 (404) (203)
Result of operating activities (1,549) 11,854Finance costs 9 (649) (523)Share of loss of associate (111) (72)(Loss)/profit on ordinary activities beforeincome taxes 10 (2,309) 11,259
Income tax charge 11 (437) (2,124)
(Loss)/profit for the year (2,746) 9,135
Attributable to:-Shareholders of the parent (4,509) 7,440Non-controlling interests 1,763 1,695
(2,746) 9,135Earnings per ordinary share for the profit attributableto the ordinary shareholders of the Company:Basic 12 (6.3p) 11.9pDiluted 12 (6.3p) 11.9pThe accounting policies and accompanying notes are an integral part of the Consolidated Financial Statements.
Randall & Quilter Investment Holdings Ltd.
Consolidated Statement of Comprehensive IncomeFor the years ended 31 December 2014 and 2013
2
2014£000
2013£000
Other Comprehensive Income:-Items that will not be reclassified to profit or loss:-Pension scheme actuarial (losses)/gains (5,027) 1,465Deferred tax on pension scheme actuarial losses/(gains) 1,005 (285)
(4,022) 1,180Items that may be subsequently reclassified to profit or loss:-Exchange gains/(losses) on consolidation 373 (1,100)Other comprehensive income (3,649) 80
(Loss)/profit for the year (2,746) 9,135Total comprehensive income for the year (6,395) 9,215
Attributable to:-Shareholders of the parent (8,185) 7,490Non-controlling interests 1,790 1,725Total comprehensive income for the year (6,395) 9,215
The accounting policies and accompanying notes are an integral part of the Consolidated Financial Statements.
Randall & Quilter Investment Holdings Ltd.
Consolidated Statement of Changes in EquityFor the year ended 31 December 2014
EquityShare capital 23 1,435 1,435Share option costs 64 84Share premium 23 17,363 23,392Treasury shares 23 (175) (54)Retained earnings 67,609 75,787Attributable to equity holders of the parent 86,296 100,644Non-controlling interests in subsidiary undertakings 30 3,161 1,371Total equity 89,457 102,015
Total liabilities and equity 537,599 474,628
The Financial Statements were approved by the Board of Directors on 19 June 2015 and were signed on its behalfby:-
K E Randall T A Booth
The accounting policies and accompanying notes are an integral part of the Consolidated Financial Statements.
Randall & Quilter Investment Holdings Ltd.
Consolidated Cash Flow StatementFor the years ended 31 December 2014 and 2013
6
Cash flows from operating activities Note2014£000
2013£000
(Loss)/profit on ordinary activities before income taxes (2,309) 11,259Finance costs 9 649 523Depreciation 15 676 638Share based payments 23 213 240Share of loss of associate 111 72Goodwill on bargain purchase 29 (14,592) (8,479)Amortisation and impairment of intangible assets 14 404 203Fair value gain on financial assets (242) (1,268)Loss on net assets of pension schemes 217 123Increase in receivables (23,079) (11,087)Decrease in deposits with ceding undertakings 975 365Increase/(decrease) in payables 8,701 (23,155)Decrease in net insurance technical provisions (5,620) (22,976)
(33,896) (53,542)Sale of financial assets 22,901 50,542Purchase of financial assets (10,574) (33,117)Cash used in operations (21,569) (36,117)Income taxes repaid - 194Net cash used in operating activities (21,569) (35,923)
Cash flows from investing activitiesPurchase of property, plant and equipment 15 (704) (568)Proceeds from sale of property, plant and equipment - 210Purchase of intangible assets 14 (264) (344)Acquisition of subsidiary undertakings (offset by cash acquired) 20,398 18,923Share of cash from reinsurance of Syndicate 530 -Purchase of non-controlling interest in subsidiary - (5,064)Net cash generated from investing activities 19,960 13,157
Cash flows to financing activitiesRepayment of borrowings (19,328) (2,278)Proceeds from new borrowing arrangements 28,576 1,017Equity dividends paid 13 (3,011) (2,249)Interest and other finance costs paid 9 (649) (523)Receipts from issue of shares - 23,977Cancellation of shares 13 (3,015) (2,652)Purchase of treasury shares (403) -Sale of treasury shares 53 230Net cash from financing activities 2,223 17,522
Net increase/(decrease) in cash and cash equivalents 614 (5,244)Cash and cash equivalents at beginning of year 46,942 52,263Exchange losses on cash and cash equivalents (786) (77)Cash and cash equivalents at end of year 18 46,770 46,942
Share of Syndicates’ cash restricted funds 1,987 1,570Unrestricted funds 44,783 45,372Cash and cash equivalents at end of year 46,770 46,942
The accounting policies and accompanying notes are an integral part of the Consolidated Financial Statements.
Randall & Quilter Investment Holdings Ltd.
Notes to the Consolidated Financial StatementsFor the year ended 31 December 2014
7
1. Corporate informationRandall & Quilter Investment Holdings Ltd. (the “Company”) is a company incorporated in Bermuda and listedon AIM, a sub-market of the London Stock Exchange. The Company and its subsidiaries (together forming the“Group”) carry on business worldwide as owners and managers of insurance companies, live and in run off, asunderwriting managers for active insurers, as participators and managers of Lloyd’s Syndicates, as purchasersof insurance receivables and as service providers to the non-life insurance market. The Consolidated FinancialStatements were approved by the Board of Directors on 19 June 2015.
2. Accounting policiesThe principal accounting policies adopted in the preparation of these Consolidated Financial Statements areset out below. These policies have been consistently applied to all the periods presented, unless otherwisestated.
a. Basis of preparationThe Consolidated Financial Statements have been prepared in accordance with International FinancialReporting Standards (“IFRS”), endorsed by the European Union (“EU”), International Financial ReportingInterpretations Committee (“IFRIC”) interpretations and with the Bermuda Companies Act 1981 (as amended).
The Group Consolidated Financial Statements have been prepared under the historical cost convention, exceptthat financial assets (including investment property), financial liabilities (including derivative instruments) andpurchased reinsurance receivables are recorded at fair value through profit and loss. All amounts are stated insterling and thousands, unless otherwise stated.
The preparation of the Consolidated Financial Statements in conformity with IFRS requires the use ofestimates and assumptions that affect the reported amounts of assets and liabilities at the date of theConsolidated Financial Statements and the reported amounts of revenues and expenses during the year (Note3). Although these estimates are based on management’s best knowledge of the amount, event or actions,actual results may differ from these estimates. The estimates and underlying assumptions are reviewed on anongoing basis. Revisions to estimates are recognised in the current and future years depending on when therevision is made and the year it affects.
New and amended standards adopted by the Group
All new standards and interpretations released by the International Accounting Standards Board have beenconsidered; of these the following new and amended standards have been adopted, where applicable, by theGroup during the year:-
IFRS 10, Consolidated Financial Statements
IFRS 11, Joint Arrangements
IFRS 12, Disclosure of Interests in Other Entities
IAS 27 Amendment, Separate Financial Statements
IAS 28 Amendment, Investments in Associates and Joint Ventures
IAS 32 Amendment, Offsetting Financial Assets and Financial Liabilities
IAS 36 Amendment, Recoverable Amount Disclosures for Non-financial Assets
IAS 39 Amendment, Novation of Derivatives and Continuation of Hedge Accounting
IFRIC 21, Levies
Randall & Quilter Investment Holdings Ltd.
Notes to the Consolidated Financial StatementsFor the year ended 31 December 2014
8
IFRS 10, Consolidated Financial StatementsIFRS 10 was effective as of 1 January 2014 and as a result the Group has changed its accounting policy fordetermining whether it has control over and consequently whether it consolidates its subsidiaries. IFRS 10introduces a new control model that focuses on whether the Group has power over an investee, exposure orrights to variable returns from its involvement with the investee and ability to use its power to affect thosereturns. In accordance with the transitional provisions of IFRS 10, the Group reassessed the control conclusion,including a review of relationships influencing the Group’s associates, subsidiaries and other related parties forits investees at 1 January 2014. The Group has not changed any of its control conclusions in respect of anyinvestments in subsidiaries or associates.
As Lloyd’s Syndicates do not carry out business in their own right, they are not considered entities andtherefore fall outside the scope of IFRS 10. The Syndicate structure, used by underwriters at Lloyd’s, is a meansfor the spreading of risk where each investor provides separate and distinct collateral of its own, and hasseveral and direct liability for losses rather than joint and several liability. The Group’s consolidationconclusion in respect of its syndicates remains unchanged from previous periods. Therefore, there is no impacton the profit or loss for the current or prior year or on equity reported. There is also no impact on the totalassets or liabilities in the comparative period.
IFRS 11, Joint ArrangementsIFRS 11 replaces IAS 31, Interests in Joint Ventures and SIC 13, Jointly-controlled Entities – Non-monetaryContributions by Venturers. IFRS 11 classifies joint arrangements as either joint operations or joint venturesand focuses on the nature of the rights and obligations of the arrangement. The predecessor standard, IAS 31,focused to a greater extent on the legal form to determine the presence of ‘jointly controlled entities’ (“JCE”),which would then have been equity accounted for or proportionately consolidated. IFRS 11 may result in someof these JCEs instead being seen as joint operations, which will be subject to a requirement for the party todirectly account for its own assets and liabilities, when additional factors (other than legal form) are taken intoaccount. All investee entities determined under the new criteria to be ‘joint ventures’ will be equity accountedfor, with the option for the investor to proportionately consolidate being removed from the new standard. Theadoption of IFRS 11 has no impact on the Consolidated Financial Statements in the current or prior periods.
IFRS 12, Disclosure of Interests in Other EntitiesIFRS 12 sets out more comprehensive disclosures relating to the nature, risks and financial effects of interestsin subsidiaries, associates, joint arrangements and unconsolidated structured entities. Interests are widelydefined as contractual and non-contractual involvement that exposes an entity to variability of returns fromthe performance of the other entity or operation. The Group has included additional disclosures onunconsolidated segregated cells in Note 19 and additional disclosures on non-controlling interests in Note 30.
IAS 27 Amendment, Separate Financial StatementsIAS 27 carries forward the existing accounting requirements for separate Financial Statements; therequirements of IAS 28 and IAS 31 for separate Financial Statements have been incorporated into IAS 27. Thisamendment did not result in a material impact on the Consolidated Financial Statements of the Group.
IAS 28 Amendment, Investments in Associates and Joint VenturesIAS 28 previously discussed how to apply equity accounting to associates in Consolidated Financial Statements.The revised IAS 28 continues to include that guidance but it is now extended to apply that accounting toentities that qualify as joint ventures under IFRS 11. This amendment did not result in a material impact onthe Consolidated Financial Statements of the Group.
IAS 32 Amendment, Offsetting Financial Assets and Financial LiabilitiesIAS 32 was amended to clarify the meaning of ‘currently has a legally enforceable right of set-off’ and thatsome gross settlement systems may be considered equivalent to net settlement. This amendment did notresult in a material impact on the Consolidated Financial Statements of the Group.
Randall & Quilter Investment Holdings Ltd.
Notes to the Consolidated Financial StatementsFor the year ended 31 December 2014
9
IAS 36 Amendment, Recoverable Amount Disclosures for Non-financial AssetsIAS 36 was amended to reverse the unintended requirement in IFRS 13 Fair Value Measurement to disclosethe recoverable amount of every cash generating unit to which significant goodwill or indefinite-livedintangible assets have been allocated. Under the amendments, the recoverable amount is required to bedisclosed only when an impairment loss has been recognised or reversed. This amendment did not result in amaterial impact on the Consolidated Financial Statements of the Group.
IAS 39 Amendment, Novation of Derivatives and Continuation of Hedge AccountingIAS 39 was amended to allow hedge accounting to continue in a situation where a derivative, which has beendesignated as a hedging instrument, is novated to effect clearing with a central counterparty as a result of lawsor regulation, if specific conditions are met (in this context, a novation indicates that parties to a contractagree to replace their original counterparty with a new one). This relief was introduced in response tolegislative changes across many jurisdictions that would lead to the widespread novation of over-the-counterderivatives. These legislative changes were prompted by a G20 commitment to improve transparency andregulatory oversight of over-the-counter derivatives in a consistent manner. This amendment did not result ina material impact on the Consolidated Financial Statements of the Group.
IFRIC 21, LeviesIFRIC 21 provides guidance on accounting for levies imposed by governments under legislation in accordancewith IAS 37 Provisions, Contingent Liabilities and Contingent Assets. The interpretation confirms that an entityrecognises a liability for a levy when and only when the triggering event specified in the legislation occurs. Anentity does not recognise a liability at an earlier date, even if commercially it has no realistic opportunity toavoid the triggering event. This standard did not result in a material impact on the Consolidated FinancialStatements of the Group.
New standards and interpretations not yet effectiveA number of new standards, amendments to standards and interpretations are effective for annual periodsbeginning on or after 1 July 2014, and have not been applied in preparing these Financial Statements. TheGroup does not plan to adopt these standards early; instead it will apply them from their effective dates asdetermined by their dates of EU endorsement. The Group is reviewing the impact of the upcoming standardsto determine their impact; however, they are not likely to have a material impact on the ConsolidatedFinancial Statements:
IFRS 9: Financial Instruments (1 January 2018); IFRS 10: Amendment: Sale or Contribution of Assets Between an Investor and its Associate or Joint
Venture (1 January 2016); IFRS 11: Amendment: Accounting for Acquisitions on Interests in Joint Operations (1 January 2016); IFRS 14: Regulatory Deferral Accounts (1 January 2016); IFRS 15: Revenue from Contracts with Customers (1 January 2017); IAS 1: Amendment: Disclosure Initiative (1 January 2016); IAS 16: Amendment: Clarification of Acceptable Methods of Depreciation and Amortisation (1 January
2016); IAS 19: Amendment: Defined Benefit Plans (1 July 2014)*; IAS 27: Amendment: Equity Method in Separate Financial Statements (1 January 2016); IAS 28: Amendment: Sale or Contribution of Assets Between an Investor and its Associate or Joint
Venture (1 January 2016); IAS 38: Amendment: Clarification of Acceptable Methods of Depreciation and Amortisation (1 January
2016); Annual Improvement to IFRSs – 2010-2012 cycle (1 July 2014)*; Annual Improvement to IFRSs – 2011-2013 cycle (1 July 2014)*; and Annual Improvement to IFRSs – 2012-2014 cycle (1 January 2016).
* Standards that have been endorsed by the EU.
Randall & Quilter Investment Holdings Ltd.
Notes to the Consolidated Financial StatementsFor the year ended 31 December 2014
10
b. Selection of accounting policiesJudgement, estimates and assumptions are made by the Directors in selecting each Group accounting policy.The accounting policies are selected by the Directors to present Consolidated Financial Statements that theyconsider provide the most relevant information. In the case of certain accounting policies, there are differentaccounting treatments that could be adopted, each of which would be in compliance with IFRS and wouldhave a significant influence upon the basis on which the Consolidated Financial Statements are presented.
In respect of financial instruments, the Group accounting policy is to designate all financial assets as fair valuethrough profit or loss, including purchased reinsurance receivables.
c. Consolidation
The Consolidated Financial Statements incorporate the Financial Statements of the Company, and entitiescontrolled by the Company (its subsidiaries), for the years ended 31 December 2014 and 2013. Control existswhen the Group is exposed to, or has the right to, variable returns from its involvement with the entity andhas the ability to affect those returns through its power over the entity. In assessing control, the Group takesinto consideration potential voting rights that are currently exercisable. The acquisition date is the date onwhich control is transferred to the acquirer. The financial results of subsidiaries are included in theConsolidated Financial Statements from the date that control commences until the date that control ceases.Losses applicable to the non-controlling interests in a subsidiary are allocated to the non-controlling interestseven if doing so causes non-controlling interests to have a deficit balance.
The Group uses the acquisition method of accounting to account for business combinations. The cost of anacquisition is measured as the fair value of the assets given, equity instruments issued and liabilities incurredor assumed at the date of acquisition directly attributable to the acquisition. Acquisition-related costsassociated are charged to the Consolidated Income Statement in the year in which they are incurred.
Certain group subsidiaries underwrite as corporate members of Lloyd’s on Syndicates managed by R&QManaging Agency Limited. In view of the several and direct liability of underwriting members at Lloyd’s for thetransactions of Syndicates in which they participate, only attributable shares of transactions, assets andliabilities of those Syndicates are included in the Consolidated Financial Statements. The Group continues toconclude that it remains appropriate to consolidate its share of the result of these Syndicates and accordingly,as the Group is the sole provider of capacity on Syndicate 3330, these Financial Statements include 100.00% ofthe economic interest in that Syndicate. For Syndicate 1991, the Group provides 22.77% of the capacity on the2013 year of account and 20.01% on the 2014 year of account, and for Syndicate 1897 the Group provides8.33% of the capacity on the 2013 year of account. These Consolidated Financial Statements include itsrelevant share of the result for those years. For the other Syndicate to which the Group is appointedmanaging agent, and where the capacity is provided wholly by third parties, these Consolidated FinancialStatements reflect the Group’s economic interest in the form of agency fees and profit commission to whichthey are entitled.
Associates are those entities in which the Group has power to exert influence but which it does notcontrol. Investments in associates are accounted for using the equity method of accounting. Under thismethod the investments are initially measured at cost. Thereafter the Group’s share of post-acquisition profitsor losses are recognised in the Consolidated Income Statement. Therefore, the cumulative post-acquisitionmovements in the associates’ net assets are adjusted against the cost of the investment.
When the Group’s share of losses equals or exceeds the carrying amount of the associate, the carrying amountis reduced to nil and recognition for the losses is discontinued except to the extent that the Group hasincurred obligations in respect of the associate.
Equity accounting is discontinued when the Group no longer has significant influence over the investment.
Inter-company transactions, balances and unrealised gains on transactions between Group companies areeliminated in preparing the Consolidated Financial Statements. Unrealised losses are also eliminated unlessthe transaction provides evidence of impairment of the asset transferred. Non-controlling interests representthe portion of profit or loss and net assets not held by the Group and are presented separately in the
Randall & Quilter Investment Holdings Ltd.
Notes to the Consolidated Financial StatementsFor the year ended 31 December 2014
11
Consolidated Income Statement and Consolidated Statement of Comprehensive Income and within equity inthe Consolidated Statement of Financial Position, separately from the equity attributable to the shareholdersof the parent.
Insurance broking cash, receivables and payables held by subsidiary companies, other than the receivable forfees, commissions and interest earned on a transaction, are not included in the Group’s ConsolidatedStatement of Financial Position as the subsidiaries act as agents for the client in placing the insurable risks oftheir clients with insurers and as such are not liable as principals for amounts arising from such transactions.
d. Going concernThe Consolidated Financial Statements have been prepared on a going concern basis. The Directors haveassessed the position of the Group and have concluded that the Group has adequate cash resources to meetits liabilities as they fall due. On this basis, the Directors have a reasonable expectation that the Group will beable to continue in operational existence for the foreseeable future.
e. PremiumsGross premiums written represent premiums on business commencing in the financial year together withadjustments to premiums written in previous accounting periods and estimates for premiums from contractsentered into during the course of the year. Gross premiums written are stated before deduction of brokerage,taxes and duties levied on premiums and other deductions.
Unearned premiumsA provision for unearned premiums represents that part of the gross premiums written that is estimated willbe earned in the following financial periods. It is calculated on a time apportionment basis having regard,where appropriate, to the incidence of risk.
Reinsurance premium costs are allocated to reflect the protection arranged in respect of the business writtenand earned.
Acquisition costsAcquisition costs, which represent commission and other related expenses, are deferred over the period inwhich the related premiums are earned. Acquisition costs incurred during the period are recorded inoperating expenses in the Consolidated Income Statement.
f. ClaimsThese include the cost of claims and related expenses paid in the year, together with changes in the provisionsfor outstanding claims, including provisions for claims incurred but not reported and related expenses,together with any other adjustments to claims from previous years. Where applicable, deductions are madefor salvage and other recoveries. These are shown as net claims provisions (increased)/released in theConsolidated Income Statement.
g. Insurance contract provisions and reinsurers’ share of insurance liabilitiesProvisions are made in the insurance company subsidiaries and in the Lloyd’s Syndicates on which the Groupparticipates for the full estimated costs of claims notified but not settled, including claims handling costs, onthe basis of the best information available, taking account of inflation and latest trends in court awards. TheDirectors of the subsidiaries, with the assistance of run-off managers, independent actuaries and internalactuaries, have established such provisions on the basis of their own investigations and their best estimates ofinsurance payables, in accordance with accounting standards. Legal advice is taken where appropriate.Deductions are made for salvage and other recoveries as appropriate.
The provisions for claims incurred but not reported (“IBNR”) have been based on a number of factors includingprevious experience in claims and settlement patterns, the nature and amount of business written, inflationand the latest available information as regards specific and general industry experience of trends.
A reinsurance asset (reinsurers’ share of technical provisions) is recognised to reflect the amount estimated tobe recoverable under the reinsurance contracts in respect of the outstanding claims reported and IBNR. The
Randall & Quilter Investment Holdings Ltd.
Notes to the Consolidated Financial StatementsFor the year ended 31 December 2014
12
amount recoverable from reinsurers is initially valued on the same basis as the underlying claims provision.The amount recoverable is reduced when there is an event arising after the initial recognition that providesobjective evidence that the Group may not receive all amounts due under the contract.
Neither the outstanding claims nor the provisions for IBNR have been discounted.
The uncertainties which are inherent in the process of estimating are such that, in the normal course ofevents, unforeseen or unexpected future developments may cause the ultimate cost of settling theoutstanding liabilities to differ materially from that presently estimated. Any differences between provisionsand subsequent settlements are recorded in the Consolidated Income Statement in the year which they arise.Having regard to the significant uncertainty inherent in the business of insurance as explained in Note 3, and inlight of the information presently available, in the opinion of the Directors the provisions for outstandingclaims and IBNR in the Consolidated Financial Statements are fairly stated.
Unexpired risks provisionProvisions for unexpired risks are made where the costs of outstanding claims, related expense and deferredacquisition costs are expected to exceed the unearned premium provision carried forward at the end of thereporting period. The provision for unexpired risks is calculated separately by reference to classes of businesswhich are managed together, after taking into account relevant investment return.
Closed years of accountAt the end of the third year (36 month period), the underwriting year of account of a Lloyd’s Syndicate isnormally closed by way of a Reinsurance to Close into the following underwriting year of account of the sameSyndicate. The amount of the Reinsurance to Close premium payable is determined by the managing agent,generally by estimating the cost of claims notified but not settled at 31 December and by making a provision inrespect of IBNR, together with the estimated costs of administering those claims. In subsequent years anyvariation in the ultimate liabilities of the closed year of account provision is borne by the underwriting yearinto which it is reinsured.
The payment of a Reinsurance to Close premium does not eliminate the liability of the closed year foroutstanding claims. If the reinsuring Syndicate was unable to meet its obligations, and the other elements ofLloyd’s chain of security were to fail, then the participators in the closed underwriting account would have tosettle outstanding claims.
The Directors consider that the likelihood of such a failure of the Reinsurance to Close is extremely remote,and consequently the Reinsurance to Close has been accounted for as settling the liabilities outstanding at theclosure of an underwriting account. The Group has included its share of the external Reinsurance to Closepremiums payable as insurance contract provisions at the end of the current period, and no further provision ismade for any potential variation in the ultimate liability of that year of account.
Run-off years of accountWhere an underwriting year of account of a Lloyd’s Syndicate is not closed at the end of the third year (a “run-off” year of account) a provision is made for the estimated cost of all known and unknown outstandingliabilities of that underwriting year of account. The provision is determined initially by the managing agent ona similar basis to the Reinsurance to Close. However, any subsequent variation in the ultimate liabilities forthat year remains with the members participating therein until the relevant underwriting year of account isclosed by way of Reinsurance to Close into the successor underwriting year of account or a later underwritingyear of account of another syndicate. As a result any run-off year will continue to report movements in itsresults after the third year until such time as it secures a Reinsurance to Close.
h. Provisions for future claims handling costs
Provision is made for the anticipated costs of running off the business of those insurance company subsidiariesand the Group’s participation in Syndicates which are in run off. Syndicates are treated as being in run off for
Randall & Quilter Investment Holdings Ltd.
Notes to the Consolidated Financial StatementsFor the year ended 31 December 2014
13
the Consolidated Financial Statements where they have ceased writing new business and, in the opinion ofmanagement, there is no current probable reinsurer available to close the relevant Syndicate years of account.
Provision for run-off costs is made to the extent that the anticipated run-off administration costs exceed theestimated future investment return expected to be earned by those insurance company subsidiaries andSyndicates treated as being in run off. Changes in the estimates of such costs and future investment return arereflected in the year in which the estimates are made.
When assessing the amount of the provision to be recognised, the investment return and claims handling andall other costs of all the insurance company subsidiaries and Syndicates treated as being in run off areconsidered in aggregate.
The uncertainty inherent in the process of estimating the period of run-off and the pay-out pattern over thatperiod, the anticipated run-off administration costs to be incurred over that period and the level of investmentreturn to be made are such that in the normal course of events unforeseen or unexpected futuredevelopments may cause the ultimate costs of settling the outstanding liabilities to differ from that previouslyestimated.
i. ProvisionsProvisions are recognised when the Group has a present obligation (legal or constructive) as a result of a pastevent, it is probable that the Group will be required to settle the obligation, and a reliable estimate can bemade of the amount of the obligation.
Provisions are measured at the present value of the expenditures expected to be required to settle theobligation, using a pre-tax rate that reflects current market assessments of the time value of money and therisks specific to the obligation. The increase in the provision due to the passage of time is recognised asinterest expense.
j. Structured settlementsCertain of the US insurance company subsidiaries have entered into structured settlements whereby theirliability has been settled by the purchase of annuities from third party life insurance companies in favour ofthe claimants. The subsidiary retains the credit risk in the unlikely event that the life insurance companydefaults on its obligations to pay the annuity amounts. Provided that the life insurance company continues tomeet the annuity obligations, no further liability will fall on the insurance company subsidiary. The amountspayable to claimants are recognised in liabilities. The amount payable to claimants by the third party lifeinsurance companies are also shown in liabilities as reducing the Group’s liability to nil.
In the opinion of the Directors, this treatment reflects the substance of the transaction on the basis that anyremaining liability of Group companies under structured settlements will only arise upon the failure of therelevant third party life insurance companies.
Should the Directors become aware that a third party life insurance company responsible for the payment ofan annuity under a structured settlement may not be in a position to meet its annuity obligations in full,provision will be made for any such failure.
Disclosure of the position in relation to structured settlements is shown in Note 19.
k. Segmental reportingThe Group’s business segments are based on the Group’s management and internal reporting structures andrepresent the level at which financial information is reported to the Board, being the chief operating decisionmaker as defined in IFRS 8.
Randall & Quilter Investment Holdings Ltd.
Notes to the Consolidated Financial StatementsFor the year ended 31 December 2014
14
l. Foreign currency translation
Functional and presentational currencyItems included in the financial statements of each of the Group’s entities are measured using the currency ofthe primary economic environment in which the entity operates (the “functional currency”). The ConsolidatedFinancial Statements are presented in sterling, which is the Group’s presentational currency.
Transactions and balancesTransactions in foreign currencies are recorded at the functional currency rate ruling at the date of thetransaction. Monetary assets and liabilities denominated in foreign currencies are retranslated at thefunctional currency rate of exchange ruling at the end of the reporting period; the resulting exchange gain orloss is recognised in the Consolidated Income Statement. Non-monetary items recorded at historical cost in aforeign currency are translated using the exchange rate as at the date of the initial transaction and are notsubsequently restated.
Group translationThe assets and liabilities of overseas subsidiaries, including associated goodwill, held in functional currenciesother than the Group’s presentational currency are translated at the exchange rate as at the period end date.Income and expenses are translated at average rates for the period. All resulting exchange differences arerecognised in other comprehensive income and accumulated in retained earnings in the ConsolidatedStatement of Financial Position.
On the disposal of foreign operations, cumulative exchange differences previously recognised in othercomprehensive income are recognised in the Consolidated Income Statement as part of the gain or loss ondisposal.
m. Financial instrumentsFinancial instruments are recognised in the Consolidated Statement of Financial Position at such time that theGroup becomes a party to the contractual provisions of the financial instrument. A financial asset isderecognised when the contractual rights to receive cash flows from the financial assets expire, or where thefinancial assets have been transferred, together with substantially all the risks and rewards of ownership.Financial liabilities are derecognised if the Group’s obligations specified in the contract expire, are dischargedor cancelled.
Financial assetsi) AcquisitionOn acquisition of a financial asset, the Group is required under IFRS to classify the asset into one of thefollowing categories: ‘financial assets at fair value through profit and loss’, ‘loans and receivables held tomaturity’ and ‘available for sale’. The Group does not currently make use of the ‘held to maturity’ and‘available for sale’ classifications.
ii) Financial assets at fair value through profit and lossAll financial assets, other than cash, loans and receivables, are currently designated as fair value throughprofit and loss upon initial recognition because they are managed and their performance is evaluated on afair value basis. Information about these financial assets is provided internally on a fair value basis to theGroup’s key management. The Group’s investment strategy is to invest and evaluate their performance withreference to their fair values.
iii) Fair value measurementWhen available, the Group measures the fair value of an instrument using quoted prices in an active marketfor that instrument.
If a market for a financial instrument is not active, the Group establishes fair value using a valuationtechnique. Valuation techniques include using recent arm’s length transactions between knowledgeable,
Randall & Quilter Investment Holdings Ltd.
Notes to the Consolidated Financial StatementsFor the year ended 31 December 2014
15
willing parties (if available), reference to the current fair value of other instruments that are substantially thesame or discounted cash flow analyses.
Assets and long positions are measured at a bid price; liabilities and short positions are measured at anasking price. Where the Group has positions with offsetting risks, mid-market prices are used to measure theoffsetting risk positions and a bid or asking price adjustment is applied only to the net open position asappropriate. Fair values reflect the credit risk of the instrument and include adjustments to take account ofthe credit risk of the Group entity and counterparty where appropriate. Fair value estimates obtained frommodels are adjusted for any other factors, such as liquidity risk or model uncertainties, to the extent that theGroup believes a third party market participant would take them into account in pricing a transaction.
Upon initial recognition, attributable transaction costs relating to financial instruments at fair value throughprofit or loss are recognised when incurred in other operating expenses in the Consolidated IncomeStatement. Financial assets at fair value through profit and loss are measured at fair value, and changestherein are recognised in the Consolidated Income Statement. Net changes in the fair value of financialassets at fair value through profit and loss exclude interest and dividend income, as these items areaccounted for separately as set out in the investment income section below.
iv) Insurance receivables and payablesInsurance receivables and payables are recognised when due. These include amounts due to and fromagents, brokers and insurance contract holders. Insurance receivables are classified as ‘loans andreceivables’ as they are non-derivative financial assets with fixed or determinable payments that are notquoted on an active market. Insurance receivables are measured at amortised cost less any provision forimpairments. Insurance payables are stated at amortised cost.
v) Investment incomeInvestment income consists of dividends, interest, realised and unrealised gains and losses and exchangegains and losses on financial assets at fair value through profit and loss. The realised gains or losses ondisposal of an investment are the difference between the proceeds and the original cost of the investment.Unrealised investment gains and losses represent the difference between the carrying amount at thereporting date, and the carrying amount at the previous period end or the purchase value during the period.
Financial liabilitiesBorrowingsBorrowings are initially recorded at fair value less transaction costs incurred. Subsequently borrowings arestated at amortised cost and interest is recognised in the Consolidated Income Statement over the period ofthe borrowings.
Derivative financial instrumentsDerivatives are initially recognised at fair value on the date on which a derivative contract is entered into andare subsequently remeasured at their fair value. The best evidence of fair value of a derivative at initialrecognition is the transaction price. The method of recognising the resulting fair value gains or lossesdepends on whether the derivative is designated as a hedging instrument and, if so, the nature of the itembeing hedged. Fair values are obtained from quoted market prices in active markets, recent markettransactions, and valuation techniques which include discounted cash flow models. All derivatives are carriedas assets when fair value is positive and as liabilities when fair value is negative.
The Group has not designated any derivatives as fair value hedges, cash flow hedges or net investmenthedges.
Randall & Quilter Investment Holdings Ltd.
Notes to the Consolidated Financial StatementsFor the year ended 31 December 2014
16
n. Treasury shares
The Employee Benefit Trust (EBT) held shares in the Company for the benefit of employees of theGroup. These have been used to meet exercises of options granted by the Company or its predecessor,Randall & Quilter Investment Holdings plc (now RQIH Limited). The Trust waived its right to dividends and tovote on the shares it held and as a consequence those shares were deemed to be in Treasury and are recordedas Treasury Shares in the Consolidated Statement of Changes in Equity. The Company funds the expenses ofthe Trust and consolidates the expense statement and balance sheet of the Trust. As at the period end datethe EBT did not hold any shares in the Company.
o. LeasesLeases in which a significant portion of the risks and rewards of ownership are retained by the lessor areclassed as operating leases. Payments made under operating leases (net of any incentives received from thelessor) are charged to the Consolidated Income Statement on a straight-line basis over the period of the lease.
p. Property, plant and equipment
All assets included within property, plant and equipment (“PPE”) are carried at historical cost lessdepreciation. Depreciation is calculated to write down the cost less estimated residual value of motor vehicles,office equipment, IT equipment and leasehold improvements by the straight-line method over their expecteduseful lives.
The principal rates per annum used for this purpose are:-
%
Motor vehicles 25
Office equipment 8 – 50
IT equipment 20 – 25
Leasehold improvements Term of lease
The gain or loss arising on the disposal of an item of PPE is determined as the difference between the salesproceeds and the carrying amount of the asset and is recognised in the Consolidated Income Statement.
q. GoodwillThe Group uses the acquisition method in accounting for acquisitions. The difference between the cost ofacquisition and the fair value of the Group’s share of the identifiable net assets acquired is capitalised andrecorded as goodwill. If the cost of an acquisition is less than the fair value of the net assets of the subsidiaryacquired the difference is recognised directly in the Consolidated Income Statement as goodwill on bargainpurchase.
Goodwill acquired in a business combination is initially measured at cost, being the excess of the fair value ofthe consideration paid for the business combination over the Group’s interest in the net fair value of theidentifiable assets, liabilities and contingent liabilities. Following initial recognition, goodwill is measured atcost less any accumulated impairment losses. Goodwill is tested for impairment at the cash generating unitlevel, as shown in Note 14, on a biannual basis or if events or changes in circumstances indicate that thecarrying amount may be impaired.
Randall & Quilter Investment Holdings Ltd.
Notes to the Consolidated Financial StatementsFor the year ended 31 December 2014
17
r. Other intangible assetsIntangible assets, other than goodwill, that are acquired separately are stated at cost less accumulatedamortisation and impairment.
Intangible assets acquired in a business combination, and recognised separately from goodwill, are recognisedinitially at fair value at the acquisition date.
Amortisation is charged to other operating expenses in the Consolidated Income Statement as follows:-
Purchased IT software 3 – 5 years, on a straight-line basis
On acquisition of insurance companies in run off Estimated pattern of run-off
On acquisitions – other Useful life, which may be indefinite
Assets that are subject to amortisation are reviewed for impairment whenever events or changes incircumstances indicate that the carrying amount may not be recoverable. An impairment loss is recognised inthe Consolidated Income Statement to reduce the carrying amount to the recoverable amount.
US insurance authorisation licencesUS state insurance authorisation licences acquired in business combinations are recognised initially at their fairvalue. The asset is not amortised, as the Directors consider that economic benefits will accrue to the groupover an indefinite period due to the stability of the US insurance market. The licences are tested annually forimpairment, and any accumulated impairment losses recognised in the Consolidated Income Statement. Thisassumption is reviewed annually to determine whether the asset continues to have an indefinite life.
Rights to customer contractual relationshipsCosts directly attributable to securing the intangible rights to customer contractual relationships arerecognised as an intangible asset where they can be identified separately and measured reliably and it isprobable that they will be recovered by directly related future profits. These costs are amortised on a straight-line basis over the useful economic life which is deemed to be 15 years and are carried at cost lessaccumulated amortisation and impairment losses.
s. Employee BenefitsThe Group makes contributions to defined contribution schemes and a defined benefit scheme.
The pension cost in respect of the defined contribution schemes represents the amounts payable by the Groupfor the year. The funds of the schemes are administered by trustees and are separate from the Group. TheGroup’s liability is limited to the amount of the contributions.
The defined benefit scheme is funded by contributions from a subsidiary company and its assets are held in aseparate Trustee administered fund. Pension scheme assets are measured at market value, and liabilities aremeasured using the projected unit method and discounted at the current rate of return on high qualitycorporate bonds of equivalent term and currency to the liability.
Current service cost, net interest income or cost and any curtailments/settlements are charged to theConsolidated Income Statement. The present value of the defined benefit obligation at the end of thereporting period less the fair value of plan assets is recognised and disclosed separately as a net pensionliability in the Consolidated Statement of Financial Position. Surpluses are only recognised up to the aggregateof any cumulative unrecognised net actuarial gains and past service costs, and the present value of anyeconomic benefits available in the form of any refunds or reductions in future contributions.
Subject to the restrictions relating to the recognition of a pension surplus, all actuarial gains and losses arerecognised in full in other comprehensive income in the period in which they occur.
In addition certain of the Group’s employees also participate in a defined benefit scheme where the subsidiarycompany is one of several participating employers. It is not possible to identify the share of the underlying
Randall & Quilter Investment Holdings Ltd.
Notes to the Consolidated Financial StatementsFor the year ended 31 December 2014
18
assets and liabilities belonging to the individual participating employers. Therefore the scheme is accountedfor as if it were a defined contribution scheme and the Consolidated Income Statement charge for the yearrepresents the employer contribution payable.
t. Cash and cash equivalentsFor the purposes of the Consolidated Cash Flow Statement, cash and cash equivalents comprise cash at bankand other short-term highly liquid investments with a maturity of three months or less from the date ofacquisition, and bank overdrafts which are repayable on demand.
u. Finance costsFinance costs comprise interest payable and are recognised in the Consolidated Income Statement in line withthe effective interest rate on liabilities.
v. Operating expenses
Operating expenses are accounted for in the Consolidated Income Statement in the period to which theyrelate.
Pre-contract costsDirectly attributable pre-contract costs are recognised as an asset when it is virtually certain that a contractwill be obtained and the contract is expected to result in future net cash inflows in excess of any amountsrecognised as an asset.
Pre-contract costs are charged to the Consolidated Income Statement over the shorter of the life of thecontract or five years.
Onerous contractsOnerous contract provisions are provided for in circumstances where a legal commitment exists to provideservices which exceed future income. The costs of providing the services are projected based onmanagement’s assessment of the contract.
Arrangement feesArrangement fees in relation to loan facilities are deducted from the relevant financial liability and amortisedover the period of the facility.
w. Other income
Other income is stated excluding any applicable value added tax and includes the following items:-
Management feesManagement fees are from non-Group customers and are recognised when the right to such fees isestablished through a contract and to the extent that the services concerned have been performed.
Purchased reinsurance receivablesThe Group accounts for these financial assets at fair value through profit and loss. Fair value is defined as theprice at which an orderly transaction would take place between market participants at the reporting date andis therefore an estimate which requires the use of judgement.
Profit commission on managed Lloyd’s SyndicatesProfit commission from managed Syndicates is earned as the related underwriting profits are recognised.Profit commission receivable on open underwriting years may be subject to further adjustment (up or down)as the results are reported prior to closure of the account in accordance with Lloyd’s Reinsurance to Closearrangements.
Randall & Quilter Investment Holdings Ltd.
Notes to the Consolidated Financial StatementsFor the year ended 31 December 2014
19
Insurance commissions from Managing General AgenciesInsurance commissions comprise brokerage and profit commission arising from the placement of insurancecontracts. Brokerage is recognised at the inception date of the policy, or the date of contractual entitlement, iflater. Alterations in brokerage arising from premium adjustments are taken into account as and when suchadjustments are notified. To the extent that the Group is contractually obliged to provide services after thisdate, a suitable proportion of income is deferred and recognised over the life of the relevant contracts toensure that revenue appropriately reflects the cost of fulfilling those obligations. Profit commission isrecognised when the right to such profit commission is established through a contract but only to the extentthat a reliable estimate of the amount due can be made. Such estimates are made on a prudent basis thatreflects the level of uncertainty involved.
x. Share based paymentsThe Group issues equity settled payments to certain of its employees.
The cost of equity settled transactions with employees is measured by reference to the fair value at the dateat which they are granted and is recognised as an expense on a straight-line basis over the vesting period. Thefair value is measured using the binomial option pricing method, taking into account the terms and conditionson which the awards were granted.
y. Current and deferred income taxTax on the profit or loss for the year comprises current and deferred tax.
Tax is recognised in the Consolidated Income Statement except to the extent that it relates to itemsrecognised in other comprehensive income, in which case it is recognised in the Consolidated Statement ofComprehensive Income.
The current income tax charge is calculated on the basis of the tax laws enacted or substantively enacted atthe end of the reporting period in the countries where the Company’s subsidiaries and associates operate andgenerate taxable income.
Deferred tax liabilities are provided in full, using the liability method, on temporary differences arisingbetween the tax bases of assets and liabilities and their carrying amounts in the Consolidated FinancialStatements. However, if the deferred tax arises from initial recognition of an asset or liability in a transactionother than a business combination and which, at the time of the transaction, affects neither accounting nortaxable profit or loss, it is not provided for.
Deferred tax assets are recognised to the extent that it is probable that future taxable profits will be availableagainst which these temporary differences can be utilised. Deferred tax assets and liabilities are notdiscounted.
Deferred income tax assets and liabilities are offset when there is a legally enforceable right to offset currenttax assets against current tax liabilities and when the deferred income tax assets and liabilities relate toincome taxes levied by the same taxation authority on either the taxable entity or different taxable entitieswhere there is an intention to settle the balances on a net basis. Deferred tax assets and liabilities aredetermined using tax rates that have been enacted or substantively enacted by the period end date and areexpected to apply when the related deferred tax asset is realised or the deferred tax liability is settled.
z. Share capitalOrdinary shares and Preference A and B shares are classified as equity. Incremental costs directly attributableto the issue of new shares or options are shown in equity as a deduction, net of tax, from the proceeds.
aa. DistributionsDistributions payable to the Company’s shareholders are recognised as a liability in the Consolidated FinancialStatements in the period in which the distributions are declared and appropriately approved.
Randall & Quilter Investment Holdings Ltd.
Notes to the Consolidated Financial StatementsFor the year ended 31 December 2014
20
3. Estimation techniques, uncertainties and contingenciesEstimates and judgements are continually evaluated, and are based on historical experience and other factors,including expectations of future events that are believed to be reasonable under the circumstances.
Significant uncertainty in technical provisionsSignificant uncertainty exists as to the accuracy of the insurance contract provisions and the reinsurers’ shareof insurance liabilities established in the insurance company subsidiaries and the Lloyd’s Syndicates on whichthe Group participates as shown in the Consolidated Statement of Financial Position. The ultimate costs ofclaims and the amounts ultimately recovered from reinsurers could vary materially from the amountsestablished at the year end.
In the event that further information were to become available to the Directors of an insurance companysubsidiary which gave rise to material additional liabilities, the going concern basis might no longer beappropriate for that company and adjustments would have to be made to reduce the value of its assets totheir realisable amount, and to provide for any further liabilities which might arise. However, should thisoccur it will not impact on the going concern basis applicable to the Group.
Except as disclosed in Note 32, the Company bears no financial responsibility for any liabilities or obligations ofany insurance company subsidiary in run off. Should any insurance company subsidiary cease to be able tocontinue as a going concern in the light of further information becoming available, any loss to the Companyand its other subsidiaries would thus be restricted to the book value of their investment in and amounts duefrom that subsidiary and any guarantee liability that may arise.
Claims provisionsThe Group participates on a number of syndicates and owns a number of insurance companies in run-off. TheConsolidated Financial Statements include provisions for all outstanding claims and IBNR, for relatedreinsurance recoveries and for all costs expected to be incurred to run off its liabilities.
The insurance contract provisions including IBNR are based upon actuarial and other studies of the ultimatecost of liabilities including exposure based and statistical estimation techniques. There are significantuncertainties inherent in the estimation of each insurance company subsidiary’s and syndicate’s insuranceliabilities and reinsurance recoveries. There are many assumptions and estimation techniques that may beapplied in assessing the amount of those provisions which individually could have a material impact on theamounts of liabilities, related reinsurance assets and reported shareholders’ equity funds. Actual experiencewill often vary from these assumptions, and any consequential adjustments to amounts previously reportedwill be reflected in the results of the year in which they are identified. Potential adjustments arising in thefuture could, if adverse in the aggregate, exceed the amount of shareholders’ equity funds of an insurancecompany subsidiary.
The Group also contracts with independent external actuaries to obtain a Statement of Actuarial Opinion(SAO) for the Lloyd’s Syndicates that it participates on. This statement shows the booked reserves are greaterthan or equal to their view of best estimate. In the case of the Group’s larger insurance companies in run off,independent external actuaries provide a range of acceptable estimates. The Group sets its reserves to liewithin this acceptable range.
The business written by the insurance company subsidiaries consists in part of long-tail liabilities, includingasbestos, pollution, health hazard and other US liability insurance. The claims for this type of business aretypically not settled until many years after policies have been written. Furthermore, much of the businesswritten by these companies is reinsurance and retrocession of other insurance companies’ business, whichlengthens the settlement period.
Significant delays occur in the notification and settlement of certain claims and a substantial measure ofexperience and judgement is involved in making the assumptions necessary for assessing outstandingliabilities, the ultimate cost of which cannot be known with certainty at the period end date. The grossinsurance contract provisions and related reinsurers’ share of insurance liabilities are estimated on the basis ofinformation currently available. Provisions are calculated gross of any reinsurance recoveries. A separate
Randall & Quilter Investment Holdings Ltd.
Notes to the Consolidated Financial StatementsFor the year ended 31 December 2014
21
estimate is made of the amounts that will be recoverable from reinsurers based upon the gross provisions andhaving due regard to collectability.
The insurance contract provisions include significant amounts in respect of notified and potential IBNR claimsfor long-tail liabilities. The settlement of most of these claims is not expected to occur for many years, andthere is significant uncertainty as to the timing of such settlements and the amounts at which they will besettled.
While many claims are clearly covered and are paid quickly, many other claims are subject to significantdisputes, for example over the terms of a policy and the amount of the claim. The provisions for disputedclaims are based on the view of the Directors of each insurance company subsidiary as to the expectedoutcomes of such disputes. Claim types impacted by such disputes include asbestos, pollution and certainhealth hazards and retrocessional reinsurance claims.
Uncertainty is further increased because of the potential for unforeseen changes in the legal, judicial,technological or social environments, which may increase or decrease the cost, frequency or reporting ofclaims, and because of the potential for new sources or types of claim to emerge.
Asbestos, pollution and health hazard claimsThe estimation of the provisions for the ultimate cost of claims for asbestos, pollution, health hazard andother US liability insurance, is subject to a range of uncertainties that is generally greater than thoseencountered for other classes of insurance business. As a result it is not possible to determine the futuredevelopment of asbestos, pollution, health hazard and other US liability insurance with the same degree ofreliability as with other types of claims. Consequently, traditional techniques for estimating claims provisionscannot wholly be relied upon. The Group employs further techniques which utilise, where practical, theexposure to these losses by contract to determine the claims provisions.
Insurance claims handling expensesThe provision for the cost of handling and settling outstanding claims to extinction and all other costs ofmanaging the run-off is based on an analysis of the expected costs to be incurred in run-off activities,incorporating expected savings from the reduction of transaction volumes over time.
The period of the run-off may be between 5 and 50 years depending upon the nature of the liabilities withineach insurance company subsidiary. Ultimately, the period of run-off is dependent on the timing andsettlement of claims and the collection of reinsurance recoveries; consequently similar uncertainties apply tothe assessment of the provision for such costs.
Reinsurance recoveriesReinsurance recoveries are included in respect of claims outstanding (including IBNR claims) and claims paidafter making provision for irrecoverable amounts.
The reinsurance recoveries on IBNR claims are estimated based on the recovery rate experienced on notifiedand paid claims for each class of business.
The insurance company subsidiaries are exposed to disputes on contracts with their reinsurers and thepossibility of default by reinsurers. In establishing the provision for non-recovery of reinsurance balances, theDirectors of each insurance company subsidiary consider the financial strength of each reinsurer, its ability tosettle their liabilities as they fall due, the history of past settlements with the reinsurer, and the Group’s ownreserving standards and have regard to legal advice regarding the merits of any dispute.
Defined benefit pension schemeThe pension assets and post retirement liabilities are calculated in accordance with IAS 19. The assets,liabilities and Consolidated Income Statement charge or credit, calculated in accordance with IAS 19, aresensitive to the assumptions made, including inflation, interest rate, investment return and mortality. IAS 19compares, at a given date, the current market value of a pension fund’s assets with its long term liabilities,
Randall & Quilter Investment Holdings Ltd.
Notes to the Consolidated Financial StatementsFor the year ended 31 December 2014
22
which are calculated using a discount rate in line with yields on ‘AA’ rated bonds of suitable duration andcurrency. As such, the financial position of a pension fund on this basis is highly sensitive to changes in bondrates and equity markets.
Litigation, mediation and arbitrationThe Group in common with the insurance industry in general, is subject to litigation, mediation andarbitration, and regulatory, governmental and other sectorial inquiries in the normal course of its business.The Directors do not believe that, in the aggregate, current litigation, governmental or sectorial inquiries andpending or threatened litigation or dispute is likely to have a material impact on the Group's financial position.However, if the outcome of any individual dispute differs substantially from expectation, there could be amaterial impact on the Group's profit or loss, financial position or cash flows in the year in which that impact isrecognised.
Changes in foreign exchange ratesThe Group’s Consolidated Financial Statements are prepared in sterling. Therefore, fluctuations in exchangerates used to translate other currencies, particularly the Euro and US dollar, into sterling will impact thereported Consolidated Statement of Financial Position, results of operations and cash flows from year to year.These fluctuations in exchange rates will also impact the sterling value of the Group’s investments and thereturn on its investments. Income and expenses are translated into sterling at average exchange rates. Assetsand liabilities are translated at the closing exchange rates at the period end date.
Assessment of impairment of intangible assetsGoodwill and US insurance authorisation licences are deemed to have an indefinite life as they are expected tohave a value in use that does not erode or become obsolete over the course of time. Consequently, they arenot amortised but tested for impairment on a biannual basis or if events or changes in circumstances indicatethat the carrying amount may be impaired.
The impairment tests involve evaluating the recoverable amount of the Group’s cash generating units andcomparing them to the relevant carrying amounts. The recoverable amount of each cash generating unit isdetermined based on cash flow projections. These cash flow projections are based on the financial budgetsapproved by management covering a five year period. Management also consider the current net asset valueand earnings of each cash generating unit for impairment.
ProvisionsIncluded in Other payables in Note 19 is the Directors’ estimate of the Group’s exposure to the variousliabilities of the Southern Illinois Land Company, as well as the compensation referred to in Note 32.
These estimates have been based on reports provided by recognised specialists as well as the Group’s owninternal review. These liabilities may not be settled for many years and significant judgement is involved inmaking an assessment of these liabilities, the period over which they will be settled and where appropriatethe discount rate to be applied to assess the present value of these amounts to be settled.
Randall & Quilter Investment Holdings Ltd.
Notes to the Consolidated Financial StatementsFor the year ended 31 December 2014
23
4. Management of insurance and financial risks
The Group’s activities expose it to a variety of insurance and financial risks. The Board is responsible formanaging the Group’s exposure to these risks and, where possible, for introducing controls and proceduresthat mitigate the effects of the exposure to risk.
The Group has a Risk Committee which is a formal Committee of the Board. The Committee has responsibilityfor maintaining the effectiveness of the Group’s Risk Management Framework, systems of internal control,risk policies and procedures and adherence to risk appetite.
The following describes the Group’s exposure to the more significant risks and the steps management havetaken to mitigate their impact from a quantitative and qualitative perspective.
a. Investment risks (including market risk and interest rate risk)
The Group has a Capital and Investment Committee which is responsible, inter alia, for setting andrecommending to the Board, an investment strategy for the management of the Group’s assets owned ormanaged by companies within the Group. The investment of the Group’s financial assets, except certaindeposits with ceding undertakings, is managed by external investment managers, appointed by the Capital andInvestment Committee. The Capital and Investment Committee is responsible for setting the policy to befollowed by the investment managers. The investment strategy strives to mitigate the impact of interest ratefluctuation and credit risks and to provide appropriate liquidity, in addition to monitoring and managingforeign exchange exposures.
The Capital and Investment Committee is also responsible for keeping under review the investment controlprocedures, monitoring and amending (where appropriate) the investment policies set by the Board,monitoring Group cash flow and policies for its management, and oversight of all banking and other financialcommitments and covenants across the Group, as well as any regulatory requirements in relation to Groupsolvency.
The main objective of the investment policy is to maximise return whilst maintaining and protecting theprincipal value of funds under management.
The investment allocation (including surplus cash) at 31 December 2014 and 2013 is shown below:-
2014£000
2013£000
Government and government agencies 22,972 7,544Corporate bonds 91,753 94,153Equities 18,539 16,899Cash based investment funds 30,024 37,213Cash and cash equivalents 46,770 46,942
210,058 202,751
% %Government and government agencies 10.9 3.7Corporate bonds 43.7 46.5Equities 8.8 8.3Cash based investment funds 14.3 18.4Cash and cash equivalents 22.3 23.1
Notes to the Consolidated Financial StatementsFor the year ended 31 December 2014
24
Based on invested assets at external managers of £161,624k as at 31 December 2014 (2013: £155,844k), a 1percentage increase/decrease in market price would result in an increase/decrease in the profit before incometaxes for the year to 31 December 2014 of £1,616k (2013: £1,558k).
(i) Pricing risk
The following table shows the fair values of financial assets using a valuation hierarchy; the fair value hierarchyhas the following levels:-
Level 1 – Valuations based on quoted prices in active markets for identical instruments. An active market is amarket in which transactions for instrument occur with sufficient frequency and volume on an ongoing basissuch that quoted prices reflect prices at which an orderly transaction would take place between marketparticipants at the measurement date.
Level 2 – Valuations based on quoted prices in markets that are not active or based on pricing models forwhich significant inputs can be corroborated by observable market data.
Level 3 – Valuations based on inputs that are unobservable or for which there is limited activity against whichto measure fair value.
2014Level 1
£000Level 2
£000Level 3
£000Total£000
Government and government agencies 22,972 - - 22,972Corporate bonds 49,603 42,150 - 91,753Equities 18,539 - - 18,539Cash based investment funds 30,024 - - 30,024Purchased reinsurance receivables (Note 17) - - 10,629 10,629Total financial assets measured at fair value 121,138 42,150 10,629 173,917
2013Level 1
£000Level 2
£000Level 3
£000Total£000
Government and government agencies 7,544 - - 7,544Corporate bonds 50,006 44,147 - 94,153Equities 16,899 - - 16,899Cash based investment funds 34,255 2,958 - 37,213Purchased reinsurance receivables (Note 17) - - 16,033 16,033Total financial assets measured at fair value 108,704 47,105 16,033 171,842
The following table shows the movement on Level 3 assets measured at fair value:-
2014 2013£000 £000
Opening balance 16,033 6,598Total net gains recognised in the Consolidated Income Statement 1,700 4,257Purchases 353 7,246Disposals (8,249) (1,965)Exchange adjustments 792 (103)Closing balance 10,629 16,033
Randall & Quilter Investment Holdings Ltd.
Notes to the Consolidated Financial StatementsFor the year ended 31 December 2014
25
Level 3 investments (purchased reinsurance receivables) have been valued using detailed models outlining theanticipated timing and amounts of future receipts. The net gains recognised in the Consolidated IncomeStatement in other income for the year amounted to £1,700k (2013: £4,257k). During the year the Grouppurchased further reinsurance receivables at a cost of £353k. Short term delays in the anticipated receipt ofthese investments will not have a material impact on their valuation.
There were no transfers between Level 1 and Level 2 investments during the year under review.
The following shows the maturity dates and interest rate ranges of the Group’s debt securities:-
Liquidity risk is managed by the Capital and Investment Committee who monitor the cash position of eachentity and for the Group as a whole on a regular basis to ensure that sufficient funds are available to meetliabilities as they fall due. Liquidity risk is also managed by reference to the Group’s overall tolerance forpotential liquidity shortfalls, which is monitored by the Group’s financial planning and treasury function’sestablished cash flow and liquidity management processes.
b. Credit risk
Credit risk arises where counterparties fail to meet their financial obligations as they fall due. The mostsignificant area where it arises for the Group is where reinsurers fail to meet their obligations in full as they falldue. In addition, the Group is exposed to the risk of disputes on individual claims presented to its reinsurers orin relation to the contracts entered into with its reinsurers.
The ratings used in the below analysis are based upon the published rating of Standard & Poor’s or otherrecognised ratings agency.
* Other includes reinsurers who currently have no credit rating.
The reinsurers’ share of insurance liabilities is based upon a best estimate given the profile of the insuranceprovisions outstanding and the related IBNR. Receivables arising out of reinsurance contracts are included ininsurance and other receivables in the Consolidated Statement of Financial Position.
The average credit period of receivables arising out of reinsurance contracts are as follows:-
As at 31 December 20140-6
months%
6-12months
%
12-24months
%
> 24months%
Percentage of receivables 62.0 3.1 6.8 28.1
As at 31 December 20130-6
months%
6-12months
%
12-24months
%
> 24months
%Percentage of receivables 40.4 5.6 21.3 32.7
A substantial part of the Group’s business consists of acquiring debts or companies with debts, which arenormally past due. Any further analysis of these debts is not meaningful. The Directors monitor these debtsclosely and make appropriate provision for impairment.
The Directors believe the amounts past due but not impaired, after allowing for any provision made, arerecoverable in full.
Credit risk is managed at the Group level by way of two Committees which have been established specificallywith this in mind, both of whom liaise with each other.
The first is the Group Reinsurance Asset Committee, which is chaired by a Non-Executive Director and meetsquarterly. This is a Committee of the Group Board and its function is to monitor and report on the Group’snon-Syndicate reinsurance assets and, where necessary, recommend action to protect the asset.
The second is the Reinsurance Committee of R&Q Managing Agency Limited (“RQMA”) (a Committee of theRQMA Board), which is responsible for establishing minimum security levels for all reinsurance purchases bythe managed Syndicates by reference to appropriate rating agencies, agree maximum concentration levels forindividual reinsurers and intermediaries, and to deal with any other issue relating to reinsurance assets.
Randall & Quilter Investment Holdings Ltd.
Notes to the Consolidated Financial StatementsFor the year ended 31 December 2014
28
There are also a number of Key Risk Indicators pertaining to reinsurance security and concentration whichhave been developed under the auspices of the Group Risk Committee and the RQMA Risk and CapitalCommittee, which monitor adherence to predefined risk appetite and tolerance levels.
c. Currency riskCurrency risk is the risk that the fair value of future cash flows of a financial instrument will fluctuate becauseof changes in foreign exchange rates.
The Group’s principal transactions are carried out in sterling and its exposure to foreign exchange risk arisesprimarily with respect to US dollar and Euros. This is the same as in the previous year.
The Group’s main objective in managing currency risk is to mitigate exposure to fluctuations in foreignexchange rates. There have been no material changes in trading currencies during the year under review. TheGroup manages this risk by way of matching assets and liabilities by individual entity. Asset and liabilitymatching is monitored by the Group’s financial planning and treasury functions’ established cash flow andliquidity management processes.
The Group’s financial assets are primarily denominated in the same currencies as its insurance and investmentcontract liabilities. This mitigates the foreign currency exchange rate risk for the overseas operations. Thus,the main foreign exchange risk arises from assets and liabilities denominated in currencies other than those inwhich insurance and investment contract liabilities are expected to be settled. The currency risk is effectivelymanaged by the Group through derivative financial instruments. Forward currency contracts are used toeliminate the currency exposure on individual foreign transactions. The Group will not enter into theseforward contracts until a firm commitment is in place.
The table below summarises the Group’s principal assets and liabilities by major currencies:-
The Group has no significant concentration of currency risk.
Randall & Quilter Investment Holdings Ltd.
Notes to the Consolidated Financial StatementsFor the year ended 31 December 2014
29
The analysis that follows is performed for reasonably possible movements in key variables with all othervariables held constant, showing the impact on profit before tax and equity due to changes in the fair value ofcurrency sensitive monetary assets and liabilities including insurance contract claim liabilities. The correlationof variables will have a significant effect in determining the ultimate impact on market risk, but todemonstrate the impact due to changes in variables, variables had to be changed on an individual basis. Itshould be noted that movements in these variables are non–linear.
31 December 2014 31 December 2013Currency Changes in
variablesImpact on profit Impact on
equity* Impact on profitImpact on
equity*£000 £000 £000 £000
Euro +10% (98) 285 (59) (335)US dollar +10% 342 (4,654) 733 (812)Euro -10% 118 (348) 71 409US dollar -10% (420) 5,689 (894) 992
* Impact on equity reflects adjustments for tax, where applicable.
d. Capital managementThe Group’s objectives with respect to capital sufficiency are to maintain capital at a level that provides asuitable margin over that deemed by the Group’s regulators and supervisors as providing an acceptable levelof policyholder protection, whilst remaining economically viable. At Group level, this currently translates asmaintaining Group capital at a level that provides an adequate margin over the Group’s solvency capitalrequirements whilst maintaining local capital which meets or exceeds the relevant local minima including,where appropriate, those relating to maintenance of external ratings. This is monitored by way of a capitalsufficiency assessment by the Group Risk Committee.
e. Insurance risk
The Group participates on Syndicates shown below:-
Syndicate Year of accountCapacity
£000Group capacity
£000 Open / closed
1991 2014 150,000 30,019 Open1991 2013 76,934 17,500 Open
Underwriting risk is the primary source of risk in the Group’s live underwriting operations and is reflected inthe scope and depth of the risk appetite and monitoring frameworks implemented in those entities. Individualoperating entities are responsible for establishing a framework for the acceptance and monitoring ofunderwriting risk including appropriate consideration of potential individual and aggregate occurrenceexposures, adequacy of reinsurance coverage and potential geographical and demographic concentrations ofrisk exposure.
Randall & Quilter Investment Holdings Ltd.
Notes to the Consolidated Financial StatementsFor the year ended 31 December 2014
30
In the event that potential for risk concentrations are identified across operating entities, appropriatemonitoring is developed to manage the overall Group exposure.
(ii) Reserving risk
Reserving risk represents a significant risk to the Group in terms of both driving required capital levels and thethreat to volatility of earnings.
Reserving risk is managed through the application of an appropriate reserving approach to both live and run-off portfolios and the performance of extensive due diligence on new run-off portfolios and acquisitions priorto acceptance. Reserving exercises undertaken by the in-house actuarial team are supplemented with bothscheduled and ad hoc reviews conducted by external actuaries.
Reserving risk is also mitigated through the use of reinsurance on live underwriting portfolios and throughassuming the inuring reinsurance treaties in place in respect of acquired run-off acquisitions/portfolios.
Where appropriate, reserving risk is mitigated through the use of adverse loss development cover.
Claims development information is disclosed below in order to illustrate the effect of the uncertainty in theestimation of future claims settlements by the Group. The tables compare the ultimate claims estimates withthe payments made to date. Details are presented on an aggregate basis and show the movements on a grossand net basis, and separately identify the effect of the various acquisitions made by the Group since 1 January2011.
Randall & Quilter Investment Holdings Ltd.
Notes to the Consolidated Financial StatementsFor the year ended 31 December 2014
31
The analysis of claims development in the Group’s run-off insurance entities is as follows:-
Gross Group Entities Entities Entities Entitiesentities at acquired by acquired by acquired by acquired by1 January the Group the Group the Group the Group
2011 during2011
during2012
during2013
during2014
£000 £000 £000 £000 £000Gross claims at :-1 January/acquisition 440,095 16,579 31,922 13,296 28,082First year movement (90,146) (5,672) (15,633) (605) (4,656)Second year movement (49,086) (4,117) (6,606) (2,569)Third year movement (11,611) (2,573) (2,355)Fourth year movement 13,200 (851)Gross provision at 31 December 2014 302,452 3,366 7,328 10,122 23,426
Gross claims at :-1 January/acquisition 440,095 16,579 31,922 13,296 28,082Exchange adjustments (1,705) (62) (1,500) (207) (1,104)Payments (226,209) (8,448) (4,368) (1,578) (3,990)Gross provision at 31 December 2014 (302,452) (3,366) (7,328) (10,122) (23,426)(Deficit)/surplus to date (90,271) 4,703 18,726 1,389 (438)
Net Group Entities Entities Entities Entitiesentities at acquired by acquired by acquired by acquired by1 January the Group the Group the Group the Group
2011 during2011
during2012
during2013
during2014
£000 £000 £000 £000 £000Net claims at :-1 January/acquisition 223,488 12,483 29,175 11,571 24,150First year movement (37,842) (3,955) (15,442) (438) (3,940)Second year movement (29,641) (3,200) (5,529) (2,108)Third year movement (19,921) (2,094) (2,018)Fourth year movement 3,149 (672)Net provision at 31 December 2014 139,233 2,562 6,186 9,025 20,210
Net claims at :-1 January/acquisition 223,488 12,483 29,175 11,571 24,150Exchange adjustments 3,529 (19) (1,570) (311) (1,225)Payments (76,184) (6,748) (2,997) (921) (3,255)Net position at 31 December 2014 (139,233) (2,562) (6,186) (9,025) (20,210)Surplus/(deficit) to date 11,600 3,154 18,422 1,314 (540)
Net claims provisions - live business - - 1,111 12,431 721Total net insurance contractprovisions (Note 21) 139,233 2,562 7,297 21,456 20,931
The above figures include the Group’s participation on Lloyd’s Syndicates treated as being in run-off.
Randall & Quilter Investment Holdings Ltd.
Notes to the Consolidated Financial StatementsFor the year ended 31 December 2014
32
5. Segmental information
The Group’s segments represent the level at which financial information is reported to the Board, being thechief operating decision maker as defined in IFRS 8. The reportable segments have been identified as follows:-
• Insurance Investments, which acquires legacy portfolios and insurance debt and provides capitalsupport to the Group’s managed Lloyd’s Syndicates
• Insurance Services, which provides insurance related services (including captive management) to bothinternal and external clients in the insurance market
• Underwriting Management, which provides management to Lloyd’s Syndicates and operates otherunderwriting entities including bail bond business
• Other corporate activities, which primarily includes the Group holding company and other minorsubsidiaries which fall outside of the segments above
Randall & Quilter Investment Holdings Ltd.
Notes to the Consolidated Financial StatementsFor the year ended 31 December 2014
33
Segmental results for the year ended 31 December 2014Insurance Investments Insurance Underwriting Other Consolidation
Live Run-off Total Services Management Corporate adjustments Total£000 £000 £000 £000 £000 £000 £000 £000
Notes to the Consolidated Financial StatementsFor the year ended 31 December 2014
35
Internal income includes fees payable by the insurance companies to the Insurance Services Division in theperiod. These are contractually committed on an arm’s length basis.
No income from any one client included within the external income generated more than 10% of the totalexternal income.
Included within management fees is £nil (2013: £3,835k) which represents amounts previously classified asliabilities which no longer meet the definition of liabilities under IFRS.
8. Operating expenses2014£000
2013£000
Costs of insurance company subsidiaries 10,097 7,538Pre-contract costs 392 133Employee benefits 34,804 33,398Other operating expenses 24,566 14,835
69,859 55,904
The costs of insurance company subsidiaries represent external costs borne by subsidiaries of the Group;intragroup charges are removed on consolidation.
Auditor remuneration
2014£000
2013£000
Fees payable to the Group’s auditors for the audit of theparent company and its Consolidated FinancialStatements 110 120
Fees payable for the audit of the Group’s subsidiaries by:-- Group auditors 407 407- Other auditors 237 178
Services relating to the relisting and redomicile - 85Advice on financial and accountancy matters 39 28Other services under legislative requirements 112 76Total 905 894
9. Finance costs2014£000
2013£000
Bank loan and overdraft interest 649 523
Randall & Quilter Investment Holdings Ltd.
Notes to the Consolidated Financial StatementsFor the year ended 31 December 2014
37
10. (Loss)/profit on ordinary activities before taxation(Loss)/profit on ordinary activities before taxation is stated after charging/(crediting):-
2014£000
2013£000
Employee benefits (Note 25) 34,851 33,398Costs to acquire Accredited 750 -Legacy acquisition costs (including aborted transactions) 463 296Depreciation of fixed assets (Note 15) 676 638Operating lease rental expenditure 1,559 1,508Operating lease rental income (42) (39)Amortisation of pre contract costs 329 120Amortisation and impairment of intangibles (Note 14) 404 203
11. Income tax chargea. Analysis of charge in the year
2014£000
2013£000
Current taxCurrent year - -Adjustments in respect of previous years 1,208 1,370Foreign tax 1,129 539
b. Factors affecting tax charge for the yearThe tax assessed differs from the standard rate of corporation tax in the United Kingdom. The differences areexplained below:-
2014£000
2013£000
(Loss)/profit on ordinary activities before taxation (2,309) 11,259
(Loss)/profit on ordinary activities at the standard rate ofcorporation tax in the UK of 21.5% (2013: 23.25%) (496) 2,617
Temporary differences 605 (2,471)Capital allowances in excess of depreciation (40) (72)Utilisation of tax losses (415) (274)Timing differences in respect of pension schemes 102 (72)Unrelieved losses 10 3,235Foreign tax rate differences (537) (2,209)Adjustments to the tax charge in respect of prior years 1,208 1,370Income tax charge for the year 437 2,124
c. Factors that may affect future tax charges
In addition to the recognised deferred tax asset, the Group has other trading losses of approximately £56,587k(2013: £57,836k) in various Group companies available to be carried forward against future trading profits ofthose companies. The recovery of these losses is uncertain and no deferred tax asset has been provided in
Randall & Quilter Investment Holdings Ltd.
Notes to the Consolidated Financial StatementsFor the year ended 31 December 2014
38
respect of these losses. Should it become possible to offset these losses against taxable profits in future yearsthe Group tax charge in those years will be reduced accordingly.
12. Earnings and net assets per sharea. Basic earnings per share
Basic earnings per share is calculated by dividing the earnings attributable to ordinary shareholders by theweighted average number of ordinary shares outstanding during the year.
Reconciliations of the earnings and weighted average number of shares used in the calculations are set outbelow.
2014£000
2013£000
(Loss)/profit for the year attributable to ordinary shareholders (4,509) 7,440
No.000’s
No.000’s
Shares in issue throughout the year 71,708 50,133Weighted average number of ordinary shares issued 64 12,927Weighted average number of Treasury shares held (92) (489)Weighted average number of ordinary shares 71,680 62,571
Basic earnings per ordinary share (6.3p) 11.9p
b. Diluted earnings per share
Diluted earnings per share is calculated by adjusting the weighted average number of ordinary shares forconversion of all potentially dilutive ordinary shares. The Group’s earnings per share is diluted by the effectsof outstanding share options.
Reconciliations of the earnings and weighted average number of shares used in the calculations are set outbelow.
2014£000
2013£000
(Loss)/profit for the year attributable to ordinary shareholders (4,509) 7,440
No.000’s
No.000’s
Weighted average number of ordinary shares in issue in the year 71,680 62,571Dilution effect of options - 164
71,680 62,735
Diluted earnings per ordinary share (6.3p) 11.9p
Potentially issuable securities that would result in a reduction in loss per share if issued are not considered tohave a dilution effect. In 2014, due to the loss incurred, no potentially issuable securities are considereddilutive. As a result, there is no difference between basic and diluted earnings per ordinary share.
Randall & Quilter Investment Holdings Ltd.
Notes to the Consolidated Financial StatementsFor the year ended 31 December 2014
39
c. Net asset value per share2014£000
2013£000
Net assets attributable to equity shareholders as at 31 December 86,296 100,644
No.000’s
No.000’s
Ordinary shares in issue as at 31 December 71,776 71,776Less: shares held in treasury (100) (68)
71,676 71,708
Net asset value per ordinary share 120.4p 140.4p
13. DistributionsThe amounts recognised as distributions to equity holders in the year are:-
2014£000
2013£000
Dividend to Q/M shareholders 1,844 1,074Dividend to S/O shareholders 1,167 1,175
3,011 2,249
Distribution on cancellation of P/L shares 1,745 1,409Distribution on cancellation of R/N shares 1,270 1,243
3,015 2,652
Total distributions to shareholders 6,026 4,901
Randall & Quilter Investment Holdings Ltd.
Notes to the Consolidated Financial StatementsFor the year ended 31 December 2014
40
14. Intangible assetsUS state
licences &customercontracts
Arising onacquisition Goodwill Other Total
£000 £000 £000 £000 £000CostAs at 1 January 2013 - 493 28,674 11 29,178Exchange adjustments - (33) (448) - (481)Acquisition of subsidiaries - 990 655 - 1,645Additions - - - 344 344Disposals - - - (50) (50)As at 31 December 2013 - 1,450 28,881 305 30,636
Amortisation/ImpairmentAs at 1 January 2013 - 122 13,381 - 13,503Exchange adjustments - (11) (207) - (218)Charge for the year - 120 - 62 182Disposals - - - (29) (29)As at 31 December 2013 - 231 13,174 33 13,438
Exchange adjustments - (23) 656 - 633Charge for the year - 302 - 102 404Disposals - - - - -As at 31 December 2014 - 510 13,830 135 14,475
Carrying amountAs at 31 December 2014 5,411 1,490 15,755 434 23,090
As at 31 December 2013 - 1,219 15,707 272 17,198
As at 31 December 2012 - 371 15,293 11 15,675
Goodwill acquired through business combinations has been allocated to cash generating units, (which are alsooperating and reportable segments) for impairment testing as shown in the table below, including the carryingamount for each unit.
Notes to the Consolidated Financial StatementsFor the year ended 31 December 2014
41
The recoverable amount of these cash generating units is determined based on a value in use calculation usingcash flow projections from financial budgets approved by senior management. As a result of the analysis, noimpairment was required for these cash generating units.
Key assumptions used in value in use calculations
The calculation of value in use for the units is most sensitive to the following assumptions:-
Discount rates, which represent the current market assessment of the risks specific to each cash generatingunit, regarding the time value of money and individual risks of the underlying assets which have not beenincorporated in the cash flow estimates. The pre-tax discount rate applied to the cash flow projections is10.0% (2013: 10.0%). The discount rate calculation is based on the specific circumstances of the Group andits operating segments and derived from its weighted average cost of capital (“WACC”) with uplift forexpected increases in interest rates. The WACC takes into account both debt and equity. The cost of equity isderived from the expected investment return.
Reductions in operating expenses, which are linked to management expectations of the run-off of theinsurance business managed by ISD.
Growth rate used to extrapolate cash flows beyond the budget period, based on published industrystandards. Cash flows beyond the four-year period are extrapolated using a 10.0% growth rate (2013:10.0%).
The Directors believe that no foreseeable change in any of the above key assumptions would require animpairment of the carrying amount of goodwill.
Randall & Quilter Investment Holdings Ltd.
Notes to the Consolidated Financial StatementsFor the year ended 31 December 2014
42
15. Property, plant and equipment
Computerequipment
Motorvehicles
Officeequipment
Leaseholdimprovements Total
£000 £000 £000 £000 £000CostAs at 1 January 2013 1,734 11 1,886 142 3,773Exchange adjustments (11) - (2) (11) (24)Acquisition of subsidiaries 2 - - - 2Additions 397 23 112 36 568Disposals (449) - (1) (70) (520)As at 31 December 2013 1,673 34 1,995 97 3,799
DepreciationAs at 1 January 2013 968 7 960 119 2,054Exchange adjustments (8) - (5) (10) (23)Charge for the year 272 5 346 15 638Disposals (239) - (1) (70) (310)As at 31 December 2013 993 12 1,300 54 2,359
Exchange adjustments 9 1 5 35 50Charge for the year 302 10 316 48 676Disposals (45) - (49) - (94)As at 31 December 2014 1,259 23 1,572 137 2,991
Carrying amountAs at 31 December 2014 722 12 573 221 1,528
As at 31 December 2013 680 22 695 43 1,440
As at 31 December 2012 766 4 926 23 1,719
As at 31 December 2014, the Group had no significant capital commitments (2013: none). The depreciationcharge for the year is included in operating expenses.
16. Investment properties and financial assets2014£000
2013£000
a. Investment propertiesAs at 31 December 973 1,019
The decrease in the valuation of these properties is due to exchange movements of £46k (2013: increase£15k); the change in fair value was £nil (2013: £nil).
Randall & Quilter Investment Holdings Ltd.
Notes to the Consolidated Financial StatementsFor the year ended 31 December 2014
43
b. Financial investment assets at fair value through profit or loss (designated at initial recognition)2014£000
In the normal course of business insurance company subsidiaries have deposited investments in 2014 of £65k(2013: £131k) in respect of certain contracts in escrow which can only be released or withdrawn with theapproval of the appropriate regulatory authority.
Included in Debt securities – fixed interest rate amount is £35,915k (2013: £30,573k) pledged as Funds atLloyd’s to support the Group’s underwriting activities in 2014. Lloyd’s has the right to apply these monies inthe event the corporate member fails to meet its obligations. These monies are not available to meet theGroup’s own working capital requirements and can only be released with Lloyd’s express permission.
c. Shares in subsidiary and associate undertakingsThe Company had interests in the following subsidiaries and associate at 31 December 2014:-
% of ordinaryshares held
via:-
Country ofincorporation/registration
TheCompany
Subsidiaryand associateundertakings
Overalleffective % ofshare capital
heldPrincipal activity and name of subsidiaries/associateInsurance Investments DivisionRandall & Quilter II Holdings Limited England and Wales - 100 100Alliance Insurance Agents Limited Cyprus - 100 100Alma Vakuutus OY Finland - 100 100Armitage International Insurance Company, Ltd Bermuda 100 - 100Berda Developments Limited Bermuda 100 - 100Capstan Insurance Company Limited Guernsey - 100 100Goldstreet Insurance Company USA - 100 100Hickson Insurance Limited Isle of Man - 100 100La Licorne Compagnie de Reassurances SA France - 100 100La Metropole Compagnie Belge d’Assurance SA Belgium - 100 100Pender Mutual Insurance Company Limited Isle of Man - 100 100Principle Insurance Company Limited England and Wales - 100 100R&Q Capital No. 1 Limited England and Wales - 95 95R&Q Capital No. 2 Limited England and Wales - 100 100R&Q Capital No. 4 Limited England and Wales 100 - 100R&Q Capital No. 5 Limited England and Wales 100 - 100R & Q Cyprus Ltd Cyprus 100 - 100R&Q Insurance (Guernsey) Limited Guernsey - 100 100R&Q Insurance (Malta) Limited Malta - 100 100R&Q Liquidity Management Limited England and Wales - 100 100R&Q Malta Holdings Limited Malta - 100 100R&Q Re (Bermuda) Limited Bermuda - 100 100R&Q Reinsurance Company USA - 100 100R&Q Reinsurance Company (UK) Limited England and Wales - 100RQLM Limited Bermuda 100 - 100Southern Illinois Land Company USA - 100 60Transport Insurance Company USA - 100 100
Randall & Quilter Investment Holdings Ltd.
Notes to the Consolidated Financial StatementsFor the year ended 31 December 2014
44
Insurance Services DivisionRandall & Quilter IS Holdings Limited England and Wales - 100 100Randall & Quilter Captive Holdings Limited England and Wales - 100 100A. M. Associates Insurance Services Limited Canada - 100 100Callidus Secretaries Limited England and Wales - 100 100Callidus Solutions Limited England and Wales - 100 100Excess and Treaty Management Corporation USA - 100 100Grafton US Holdings Inc. USA - 60 60JMD Specialist Insurance Services Group Limited England and Wales - 100 100JMD Specialist Insurance Services Limited England and Wales - 100 100John Heath & Company Inc USA - 100 100LBL Acquisitions, LLC USA - 100 60R&Q Archive Services Limited England and Wales - 100 100R&Q Broker Services Limited England and Wales - 100 100R&Q Captive Management LLC USA - 100 100R&Q Central Services Limited (formerly R&Q ConsultantsLimited) England and Wales - 100 100
R&Q CG Limited England and Wales - 100 100R&Q Healthcare Interests LLC USA 100 - 100R&Q Insurance Management (Gibraltar) Limited Gibraltar 100 100R&Q Insurance Management (IOM) Limited Isle of Man - 100 100R&Q Insurance Services Limited England and Wales - 100 100R&Q Intermediaries (Bermuda) Limited Bermuda - 100 100R&Q KMS Management Limited England and Wales - 100 100R&Q Market Services Limited England and Wales - 100 100R&Q Quest (SAC) Limited Bermuda - 100 100R&Q Quest Insurance Limited Bermuda - 100 100R&Q Quest Management Services (Cayman) Limited Cayman Isl. - 100 100R&Q Quest Management Services Limited Bermuda - 100 100R&Q Quest PCC, LLC USA - 100 100R&Q Services Holding Inc USA - 100 100R&Q Solutions LLC USA - 100 100R&Q Triton AS Norway - 100 100R&Q Triton Claims AS Norway - 100 100R&Quiem Financial Services Limited England and Wales - 100 100R&Quiem Limited England and Wales - 100 100Randall & Quilter America Holdings Inc USA - 100 100Randall & Quilter Bermuda Holdings Limited Bermuda - 100 100Randall & Quilter Canada Holdings Limited Canada - 100 100Randall & Quilter Healthcare Holdings Inc. USA 100 - 100Reinsurance Solutions Limited England and Wales - 100 100Requiem America Inc USA - 100 100Risk Transfer Underwriting Inc. USA - 100 60RSI Solutions International Inc USA - 100 100Syndicated Services Company Inc USA - 100 100
Underwriting ManagementRandall & Quilter Underwriting Management HoldingsLimited England and Wales - 100 100
Accredited Holding Corporation USA - 100 100Accredited Surety & Casualty Company, Inc. USA - 100 100Accredited Group Agency Inc. USA - 100 100Accredited Bond Agencies Inc. USA - 100 100DTW 1991 Underwriting Limited England and Wales - 100 100R&Q Commercial Risk Services Limited England and Wales - 100 100R&Q Managing Agency Limited England and Wales - 100 100
Randall & Quilter Investment Holdings Ltd.
Notes to the Consolidated Financial StatementsFor the year ended 31 December 2014
45
R&Q Marine Services Limited England and Wales - 75 75R&Q MGA Limited England and Wales - 100 100R&Q Risk Services Canada Limited Canada - 100 100Synergy Insurance Services (UK) Limited England and Wales - 100 100Trilogy Managing General Agents Limited England and Wales - 30 30
OthersRQIH Limited England and Wales 100 - 100R&Q (EC3) Limited England and Wales - 100 100R&Q Ludgate No. 1 Limited England and Wales - 100 100R&Q No 1 Limited England and Wales - 100 100R&Q Oast Limited England and Wales - 100 100R&Q Secretaries Limited England and Wales - 100 100
17. Insurance and other receivables2014£000
2013£000
Receivables arising from direct insurance operations 20,158 4,215Receivables arising from reinsurance operations 41,880 37,342Insurance receivables 62,038 41,557
Trade receivables 5,218 3,057Other receivables 20,932 10,922Purchased reinsurance receivables 10,629 16,033Prepayments and accrued income 15,966 8,477
52,745 38,489Total 114,783 80,046
Included in purchased reinsurance receivables is £8,019k (2013: £10,068k) which is expected to be receivedwithin 12 months. The remainder of the balance is expected to be received after 12 months.
Included in other receivables is an amount of £280k (2013: £280k) held in escrow in respect of the definedbenefit scheme.
The carrying amounts disclosed above reasonably approximate their fair values at the period end date.
18. Cash and cash equivalents2014£000
2013£000
Cash at bank and in hand 46,770 46,942
Included in cash and cash equivalents is £480k (2013: £458k) being funds held in escrow accounts in respect ofguarantees provided to the Institute of London Underwriters. The increase is due to exchange movements.
In the normal course of business, insurance company subsidiaries will have deposited funds in respect ofcertain contracts which can only be released with the approval of the appropriate regulatory authority.
The carrying amounts disclosed above reasonably approximate their fair values at the period end date.
Insurance broking fiduciary funds of £22,994k (2013: £19,629k), which are used to pay premiums tounderwriters and settle claims to policy holders, are not included in the above cash balances.
Randall & Quilter Investment Holdings Ltd.
Notes to the Consolidated Financial StatementsFor the year ended 31 December 2014
Payables arising from reinsurance operations 4,569 5,712Payables arising from direct insurance operations 1,396 2,209Insurance payables 5,965 7,921
Trade payables 2,173 1,284Other taxation and social security 724 724Other payables 23,567 4,865Accruals and deferred income 6,568 5,316
33,032 12,189Total 38,997 20,110
The carrying amounts disclosed above reasonably approximate their fair values at the period end date.
Included in other payables is £1,379k in respect of various liabilities arising in the Southern Illinois LandCompany in respect of potential subsidence and workers compensation claims. The subsidence claims havebeen discounted and the potential undiscounted amount of all future payments is £11,899k.
Structured SettlementsNo new structured settlement arrangements have been entered into during the year. The movement in thesestructured liabilities during the period is primarily due to exchange movements. The Group has paid forannuities from third party life insurance companies for the benefit of certain claimants. In the event that anyof these life insurance companies were unable to meet their obligations to these annuitants, any remainingliability would fall upon the respective insurance company subsidiaries. The subsidiary company retains thecredit risk in the unlikely event that the life insurance company defaults on its obligations to pay the annuityamounts. The Directors believe that, having regard to the quality of the security of the life insurancecompanies, the possibility of a material liability arising in this way is very unlikely. The life companies will settlethe liability directly with the claimants and no cash will flow through the Group. These annuities have beenshown as reducing the insurance companies’ liabilities to reflect the substance of the transactions and toensure that the disclosure of the balances does not detract from the users’ ability to understand the Group’sfuture cash flows.
Segregated CellsR&Q Quest (SAC) Limited (“Quest”) is a segregated cell company in which assets and liabilities are heldseparately in segregated cells. The assets and liabilities of the segregated cells and the profits and losses ofeach cell are not available for use by Quest and as such only the assets and liabilities of the Group-owned cellsare included in the Consolidated Statement of Financial Position. Excluding Group-owned cells, the amountsheld on behalf of the segregated cells as at 31 December 2014 amount to £40,018k (2013: £51,514k).
Randall & Quilter Investment Holdings Ltd.
Notes to the Consolidated Financial StatementsFor the year ended 31 December 2014
47
20. Financial liabilities2014£000
2013£000
Amounts owed to credit institutions 27,117 17,572
Amounts due to credit institutions are payable as follows:-2014£000
2013£000
Less than one year 27,117 2,411Between one to five years - 15,161
27,117 17,572
As outlined in Note 31, £24,879k (2013: £16,531k) owed to credit institutions is secured by debentures overthe assets of the Company and several of its subsidiaries.
At the end of 2014, a technical breach occurred in the financial covenants required under the Group’s bankingfacility. It was reported to the bank and corrected as soon as it was discovered and the bank waived thebreach. However, because the waiver was received after the period end date, IAS 10 requires that all interestaccrued and outstanding utilisations are disclosed as immediately due and payable on demand. This amountsto £24,879k, presented above as due in less than one year.
Randall & Quilter Investment Holdings Ltd.
Notes to the Consolidated Financial StatementsFor the year ended 31 December 2014
48
21. Insurance contract provisions and reinsurance balances
Gross
2014£000
2013£000
Insurance contract provisions at 1 January 323,948 327,973Claims paid (46,624) (42,241)Increase in provisions arising from the acquisition ofsubsidiary undertakings and Syndicate participations 28,082 13,996Strengthening of provisions 41,914 29,941Net exchange differences 15,563 (5,721)As at 31 December 362,883 323,948
Reinsurance
2014£000
2013£000
Reinsurers’ share of insurance contract provisions at 1January 157,682 148,988Reinsurers’ share of gross claims paid (26,475) (21,954)Increase in provisions arising from the acquisition ofsubsidiary undertakings and Syndicate participations 3,932 1,724Strengthening of provisions 27,385 32,862Net exchange differences 8,880 (3,938)As at 31 December 171,404 157,682
Net2014£000
2013£000
Net insurance contract provisions at 1 January 166,266 178,985Net claims paid (20,149) (20,287)Increase in provisions arising from the acquisition ofsubsidiary undertakings 24,150 12,272Strengthening/(release) of provisions 14,529 (2,921)Net exchange differences 6,683 (1,783)As at 31 December 191,479 166,266
The carrying amounts disclosed above reasonably approximate their fair values at the period end date.
Assumptions, changes in assumptions and sensitivityThe assumptions used in the estimation of provisions relating to insurance contracts are intended to result inprovisions which are sufficient to settle the net liabilities from insurance contracts.
Provision is made at the period end date for the estimated ultimate cost of settling all claims incurred inrespect of events and developments up to that date, whether reported or not.
As detailed in Note 3, significant uncertainty exists as to the likely outcome of any individual claim and theultimate costs of completing the run off of the Group’s insurance operations.
The provisions carried by the Group for its insurance liabilities are calculated using a variety of actuarialtechniques. The provisions are calculated and reviewed by the Group’s internal actuarial team; in addition theGroup periodically commissions independent reviews by external actuaries. The use of external actuariesprovides management with additional comfort that the Group’s internally produced statistics and trends areconsistent with observable market information and other published data.
Randall & Quilter Investment Holdings Ltd.
Notes to the Consolidated Financial StatementsFor the year ended 31 December 2014
49
As detailed in Note 2 (h), when preparing these Consolidated Financial Statements, provision is made for allcosts of running off the business of the insurance company subsidiaries to the extent that these costs exceedthe estimated future investment return expected to be earned by those subsidiaries. Provision is also made forall costs of running off the underwriting years for those Syndicates treated as being in run-off on which theGroup participates. The quantum of the costs of running off the business and the future investment incomehas been determined through the preparation of cash flow forecasts over the anticipated period of the run-off, using internally prepared budgets and forecasts of expenditure, investment income and actuariallyassessed settlement patterns for the gross provisions. The gross costs of running off the business areestimated to be fully covered by the estimated future investment income. Provisions for outstanding claimsand IBNR are initially estimated at a gross level and a separate calculation is carried out to estimate the size ofreinsurance recoveries. Insurance companies and Syndicates within the Group are covered by a variety oftreaty, excess of loss and stop loss reinsurance programmes.
The provisions disclosed in the Consolidated Financial Statements are sensitive to a variety of factorsincluding:-• Settlement and commutation activity of third party lead reinsurers• Development in the status of settlement and commutation negotiations being entered into by the
Group• The financial strength of the Group’s reinsurers and the risk that these entities could, in time, become
insolvent or could otherwise default on payments• Future cost inflation of legal and other advisors who assist the Group with the settlement of claims• Changes in statute and legal precedent which could particularly impact provisions for asbestos, pollution
and other latent exposures• Arbitration awards and other legal precedents which could particularly impact upon the presentation of
both inwards and outwards claims on the Group’s exposure to major catastrophe losses
A 1 percent reduction in the net technical provisions would increase net assets by £1,915k (2013: £1,662k).
22. Current and deferred tax
Current tax
2014 2013£000 £000
Current tax assets 3,835 4,047Current tax liabilities (5,855) (3,845)Net current tax (liabilities)/assets (2,020) 202
Deferred taxDeferred tax is calculated in full on temporary differences under the liability method using tax rates of 20% forthe UK (2013: 20%) and 34% for the US (2013: 34%).
Deferred tax assets have been recognised in respect of all tax losses and other temporary differences givingrise to deferred tax assets where it is probable that these assets will be recovered.
The movements in deferred tax assets and liabilities during the year are shown below. The movement indeferred tax is recorded in the income tax charge in the Consolidated Income Statement.
Deferred tax assets and liabilities are only offset where there is a legally enforceable right of offset and there isan intention to settle the balances on a net basis.
Randall & Quilter Investment Holdings Ltd.
Notes to the Consolidated Financial StatementsFor the year ended 31 December 2014
50
Deferredtax
assets
Deferredtax
liabilities Total£000 £000 £000
As at 1 January 2013 5,383 (2,192) 3,191Movement in year (91) (410) (501)As at 31 December 2013 5,292 (2,602) 2,690Movement in year 2,569 (907) 1,662As at 31 December 2014 7,861 (3,509) 4,352
The movement on the deferred tax account is shown below:-
Acceleratedcapital
allowancesTrading
losses
Pensionscheme
deficit
Othertemporarydifferences Total
£000 £000 £000 £000 £000
As at 1 January 2013 102 666 1,008 1,415 3,191Movement in year - 1,800 (374) (1,927) (501)As at 31 December 2013 102 2,466 634 (512) 2,690Movement in year (68) 1,789 1,018 (1,077) 1,662As at 31 December 2014 34 4,255 1,652 (1,589) 4,352
Movements in the provisions for deferred taxation are disclosed in the Consolidated Financial Statements asfollows:-
On acquisitionof subsidiary
Exchangeadjustment
Deferred taxin incomestatement
Deferred taxin statement ofcomprehensive
income Total£000 £000 £000 £000 £000
Movement in 2013 - (87) (128) (286) (501)
Movement in 2014 (1,243) 95 1,805 1,005 1,662
The analysis of the deferred tax assets relating to tax losses is as follows:-
2014 2013£000 £000
Deferred tax assets – relating to trading lossesDeferred tax assets to be recovered after more than 12months
3,465 1,941
Deferred tax assets to be recovered within 12 months 790 525
Deferred tax assets 4,255 2,466
Deferred tax assets are recognised for tax losses carried forward to the extent that the realisation of therelated tax benefit through future taxable profits is probable.
The Directors have prepared forecasts which indicate that, excluding the deferred tax asset on the pension
Randall & Quilter Investment Holdings Ltd.
Notes to the Consolidated Financial StatementsFor the year ended 31 December 2014
51
scheme deficit, the deferred tax assets will substantially reverse over the next six years.
The above deferred tax assets arise mainly from temporary differences and losses arising on the Group’s USinsurance companies in run-off. Under local tax regulations these losses and other temporary differencesare available to offset against the US subsidiaries’ future taxable profits in the Group’s US InsuranceServices Division as well as any future taxable results that may arise in the US insurance companies in run-off.
The Group’s total deferred tax asset includes £4,255k (2013: £2,466k) in respect of trading losses carriedforward. The tax losses have arisen in individual legal entities and will be used as future taxable profits arisein those legal entities, though substantially all of the unused tax losses for which a deferred tax asset hasbeen recognised, arises in the US subgroup.
The deferred tax assets are not wholly recoverable within 12 months.
23. Share capitalNumber of
sharesOrdinary
sharesShare
premiumTreasury
sharesTotal
£000 £000 £000 £000
At 1 January 2013 50,133,002 1,036 4,752 (434) 5,354
Issue of ordinary shares 20,833,333 416 23,500 - 23,916
Redenomination of 26/91p – 2p shares
- (33) - - (33)
Issue of L-O shares 121,789,337 4,937 (4,937) - -
Redemption/Cancellationof L-O shares
(121,789,337) (4,937) - - (4,937)
Issue of shares to coveroptions
809,745 16 77 - 93
Movement in treasuryshares*
- - - 380 380
At 31 December 2013 71,776,080 1,435 23,392 (54) 24,773
Issue of P-S shares 143,552,160 6,029 (6,029) - -
Redemption/Cancellationof P-S shares
(143,552,160) (6,029) - - (6,029)
Movement in treasuryshares*
- - - (121) (121)
At 31 December 2014 71,776,080 1,435 17,363 (175) 18,623
* 100,190 shares (2013: 68,338)
Randall & Quilter Investment Holdings Ltd.
Notes to the Consolidated Financial StatementsFor the year ended 31 December 2014
52
2014£
2013£
Allotted, called up and fully paid71,776,080 ordinary shares of 2p each
(2013: 71,776,080 ordinary shares of 2p each) 1,435,522 1,435,5221 Preference A Share of £1 1 11 Preference B Share of £1 1 1
1,435,524 1,435,524
Included in Equity
2014£
2013£
71,776,080 ordinary shares of 2p each(2013: 71,776,080 ordinary shares of 2p each) 1,435,522 1,435,522
1 Preference A Share of £1 1 11 Preference B Share of £1 1 1
1,435,524 1,435,524
Cumulative Redeemable Preference SharesPreference A and B Shares have rights, inter alia, to receive distributions in priority to ordinary shares ofdistributable profits of the Company derived from certain subsidiaries:-
• Preference A Share:- one half of all distributions arising from the Company’s investment in R&QReinsurance Company up to a maximum of $5,000k.
• Preference B Share:- one half of all distributions arising from the Company’s investment in R&QReinsurance Company (UK) Limited up to a maximum of $10,000k.
The Preference A and Preference B Shares have been classified as equity on the basis that redemption datesare not prescribed in the Memorandum and Articles of Association and as such there is no contractualobligation to deliver cash. No distributions have been made to date by either R&Q Reinsurance Company orR&Q Reinsurance Company (UK) Limited.
Shares issuedDuring the year the Group issued P, Q, R and S shares (with an aggregate value of £6,029k) (2013: L, M, N andO shares (with an aggregate value of £4,937k)) which were all cancelled. Of these amounts, £5k (2013: £36k)was payable to the Employee Benefit Trust.
Share optionsShare options were granted to directors of subsidiaries and selected employees. The options are exercisablethree years from the date of grant and lapse on the tenth anniversary of the date of grant or the holderceasing to be an employee of the Group. Neither the Company nor the Group has any legal or constructiveobligation to settle or repurchase the options in cash.
Treasury sharesDuring 2014, the Company purchased 230,000 ordinary shares of 2.0 pence each into Treasury andsubsequently transferred 129,810 ordinary shares to meet option exercises. As at the period end date thebalance of shares held in Treasury is 100,190.
Randall & Quilter Investment Holdings Ltd.
Notes to the Consolidated Financial StatementsFor the year ended 31 December 2014
53
Movements in the number of share options and their related exercise price are as follows:-
Weightedaverage
exercise price2014
pence
Number ofoptions
2014
Weightedaverage
exercise price2013
pence
Number ofoptions
2013
Outstanding at 1 January 67.2 165,000 35.8 1,240,000Exercised 19.1 (198,148) 25.5 (1,234,745)Granted 2.0 148,148 2.0 159,745
At 31 December 66.0 115,000 67.2 165,000
The total number of options in issue during the year have given rise to a charge to the Consolidated IncomeStatement of £213k (2013: £240k) based on the fair values at the time the options were granted.
The fair value of the share options was determined using the Binomial option pricing method. The parametersused are detailed below. The volatility measured at the standard deviation of continuously compoundedshare returns is based on statistical analysis of the daily share price over a 100 day period.
2014 options 2013 options
Weighted average fair value 91.1 pence 73.8 penceWeighted average share price 157.1 pence 140.2 penceExercise price 66.0 pence 67.2 penceExpiry date 10 years after granting 10 years after grantingVesting period 3 years 3 yearsVolatility 21.0% 21.0%Dividend yield 8.5% 8.5%Expected option life 3 years 3 yearsAnnual risk free interest rate 0.91% 0.91%
The options outstanding at 31 December 2014 are all exercisable and had a weighted average remainingcontractual life of 4.1 (2013: 5.0) years.
The range of prices on the outstanding share options is 40.0 pence to 70.0 pence.
24. Employee Benefit Trust
The Employee Benefit Trust has purchased no ordinary shares and released 68,338 ordinary shares deemed tobe held in Treasury during the year to give a holding at the year end of £nil (2013: 68,338). The value at theyear end was £nil (2013: £122k).
Randall & Quilter Investment Holdings Ltd.
Notes to the Consolidated Financial StatementsFor the year ended 31 December 2014
54
25. Employees and Directors
Employee benefit expense for the Group during the year2014£000
2013£000
Wages and salaries 29,578 28,193Social security costs 2,917 2,717Pension costs 2,096 2,247Share based payment charge 213 241
34,804 33,398
Pension costs are recognised in operating expenses in the Consolidated Income Statement and include£2,096k (2013: £2,047k) in respect of payments to defined contribution schemes and £nil (2013: £200k) inrespect of closed defined benefit schemes.
Average number of employees2014
Number2013
Number
Group executives & support services 72 66Insurance Services Division 214 211Insurance Investments Division 14 9Underwriting Management Division 100 87
400 373
Remuneration of the Directors and key management2014£000
K E Randall 304 - - - 20 324 533A K Quilter 262 13 75 - - 350T A Booth 243 37 198 197 125 800 1,262M G Smith 150 - - - - 150K P McNamara 4 - - - - 4A H F Campbell 69 - - - - 69P A Barnes 61 - - - - 61 100
Two Directors have retirement benefits accruing under money purchase pension schemes (2013: Two). In theyear, T A Booth was granted share options in respect of qualifying services under a long term incentive planover 148,148 shares with a fair value of £197k (2013:159,745 shares with a fair value of £235k) and theexpense has been charged to the Consolidated Income Statement over the course of the vesting period.
26. Pension commitmentsThe Group operates one defined benefit scheme in the UK. The defined benefit scheme’s assets are held inseparate trustee administered funds. The pension cost was assessed by an independent qualified actuary. Inhis valuation, the actuary used the projected unit method as the scheme is closed to new employees. A fullvaluation of the scheme was carried out as at 1 January 2012 by a qualified independent actuary.
On 2 December 2003, the scheme was closed to future accrual although the scheme continues to remain infull force and effect for members at that date.
a. Employee benefit obligations – amount disclosed in the Consolidated Statement of Financial Position
2014£000
2013£000
Fair value of plan assets 25,172 25,552Present value of funded obligations (33,434) (28,570)Net defined benefit liability (8,262) (3,018)Related deferred tax asset 1,652 634Liability in the Consolidated Statement of Financial Position (6,610) (2,384)
All actuarial (losses)/gains are recognised in full in the Consolidated Statement of Comprehensive Income inthe period in which they occur.
Randall & Quilter Investment Holdings Ltd.
Notes to the Consolidated Financial StatementsFor the year ended 31 December 2014
56
b. Movement in the net defined benefit obligation and fair value of plan assets over the year
Present valueof obligation
Fair value ofplan assets
Deficit offunded plan
Net definedbenefit liability
£000 £000 £000 £000
As at 31 December 2013 (28,570) 25,552 (3,018) (3,018)
(29,807) 26,654 (3,153) (3,153)Remeasurements:-Return on plan assets,excluding amounts includedin interest expense
- (468) (468) (468)
Loss from changes infinancial assumptions (4,724) - (4,724) (4,724)
Experience gain 165 - 165 165
(34,366) 26,186 (8,180) (8,180)
Employer’s contributions - (82) (82) (82)
Benefit payments from theplan 932 (932) - -
As at 31 December 2014 (33,434) 25,172 (8,262) (8,262)
Present valueof obligation
Fair value ofplan assets
Net definedbenefit liability
£000 £000 £000
As at 31 December 2012 (29,930) 25,549 (4,381)
Interest income/(expense) (1,192) 1,014 (178)
(31,122) 26,563 (4,559)Remeasurements:-Return on plan assets, excluding amountsincluded in interest income - 607 607
Gain from changes in financial assumptions 769 - 769
Experience gain 89 - 89
858 607 1,465
Employer’s contributions - 76 76
Benefit payments from the plan 1,694 (1,694) -
As at 31 December 2013 (28,570) 25,552 (3,018)
The Group does not expect to contribute directly to the Scheme but expects to contribute £280k to an escrowaccount in the next accounting year.
Randall & Quilter Investment Holdings Ltd.
Notes to the Consolidated Financial StatementsFor the year ended 31 December 2014
57
c. Significant actuarial assumptions
i) Financial assumptions
2014 2013
Discount rate 3.4% 4.4%
RPI inflation assumption 3.2% 3.5%
CPI inflation assumption 2.4% 2.7%
Pension revaluation in deferment:-- CPI, maximum 5% 2.4% 2.7%
Pension increases in payment:-- RPI, maximum 5% 3.2% 3.5%
ii) Demographic assumptions
Assumed life expectancy in years, on retirement at 60
2014 2013
Retiring today
- Males 29.5 29.3
- Females 31.8 31.7
Retiring in 20 years
- Males 33.0 32.8
- Females 35.1 34.9
d. Sensitivity to assumptions
The results of the IAS 19 valuation at 31 December 2014 are sensitive to the assumptions adopted.
The sensitivities regarding the principal assumptions used to measure the Scheme liabilities are set out below:
Assumption Change in assumption Change in liabilities
Discount rate Decrease by 0.5% Increase by 10%
Rate of inflation Increase by 0.5% Increase by 4%
Life expectancy Increase by 1 year Increase by 2%
The above sensitivity analyses are based on a change in assumption while holding all other assumptionsconstant. In practice, this is unlikely to occur, and changes in some of the assumptions may be correlated. Thesensitivity of the defined benefit obligation to significant actuarial assumptions has been estimated, based onthe average age and the normal retirement age of members and the duration of the Scheme.
Randall & Quilter Investment Holdings Ltd.
Notes to the Consolidated Financial StatementsFor the year ended 31 December 2014
58
e. The major categories of plan assets are as follows
As at 2014 As at 2013
£000 £000
Quoted Un-quoted Total Quoted Un-quoted Total
Cash and cashequivalents - 107 107 - 219 219
Investment funds:-
– equities - 1,046 1,046 - - -
– bonds - 13,583 13,583 - 3,041 3,041
– property - 151 151 - - -
– cash - 10,285 10,285 - 22,292 22,292
- 25,172 25,172 - 25,552 25,552
f. Amount, timing and uncertainty of future cash flows
The Group paid a single premium into the Scheme following the last full actuarial valuation as at 1 January2012. Funding levels are monitored on an annual basis and the current agreed contribution rate is £280k perannum, which is based on the last triennial valuation as at 1 January 2012.
The present value of the defined benefit obligation has been estimated by projecting the results of the last fullactuarial valuation as at 1 January 2012 to 31 December 2014. The table below shows an analysis by term toretirement of Scheme membership and past service liability as at the date of the last full actuarial valuation.
The duration of the liabilities of the Scheme is approximately 18 years as at 31 December 2014.
Participating defined benefit schemeIn addition, certain of the Group’s employees also participate in a defined benefit scheme where thesubsidiary company is one of several participating employers. It is not possible to identify the share of theunderlying assets and liabilities belonging to the individual participating employers. The most recent valuationof this scheme was at 1 June 2011. The actuary used the projected unit method for determining the futurecosts. The deficit in the Scheme at 31 May 2014, the latest information available, was £4,432k. The subsidiarymade no contributions to this scheme in 2014 or 2013, and does not expect to have to make any contributionsin 2015.
Randall & Quilter Investment Holdings Ltd.
Notes to the Consolidated Financial StatementsFor the year ended 31 December 2014
59
27. Related party transactions
The following Directors and connected parties received distributions during the year as follows:-
During the year, the Group recharged expenses totalling £9,842k (2013: £9,402k) to Lloyd’s Syndicates 102,3330, 1897 and 1991, which are managed by the Group.
28. Operating lease commitments
The Group leases a number of premises under operating leases. The Group has entered into a number ofsublease arrangements with third parties. Sublease arrangements in force as at 31 December 2014 are due toexpire within one to five years of the period end date. It is anticipated that sublease income of £9k (2013:£50k) will be earned over the lease term.
The total future minimum lease payments payable over the remaining terms of non-cancellable operatingleases are:-
2014£000
2013£000
Land and buildingsNo later than one year 271 9Later than one year but no later than five years 2,185 2,744Later than five years 365 1,467
29. Acquisitions and divestments
AcquisitionsThe Group made ten acquisitions during 2014, all of which have been accounted for using the acquisitionmethod of accounting. Nine of these acquisitions involve legacy transactions and the tenth acquisition is of theentire issued share capital of the holding company Accredited Holding Corporation.
2014 2013£000 £000
K E Randall and family 1,547 1,658A K Quilter and family 357 347T A Booth 60 17M G Smith 2 2
Randall & Quilter Investment Holdings Ltd.
Notes to the Consolidated Financial StatementsFor the year ended 31 December 2014
60
Legacy entities and businessesThe following table shows the fair value of assets and liabilities included in the Consolidated FinancialStatements at the date of acquisition of the legacy businesses:-
In all instances, goodwill on bargain purchase was recorded on the transactions. Goodwill on bargain purchaseis calculated after the alignment of accounting policies and other adjustments to the valuation of assets andliabilities to reflect their fair value at acquisition. It arises because the long-tail nature of the liabilities causessignificant problems for former owners such as tying up capital and a lack of specialist staff. As a specialistservice provider and manager, the Group is more efficient at managing such entities and former owners areprepared to sell at a discount on the fair value of the net assets.
In order to disclose the impact on the Group as though the legacy entities had been owned the whole year,assumptions would have to be made about the Group’s ability to manage efficiently the run-off of the legacyliabilities prior to the acquisition. As a result, and in accordance with IAS 8, the Directors believe it is notpracticable to disclose revenue and profit before tax as if the entities had been owned for the whole year.
Where significant uncertainties arise in the quantification of the liabilities, the Directors have estimated thefair value based on the currently available information and on assumptions which they believe to bereasonable.
The Group acquired the following legacy entities and businesses during 2014:-
On 20 March 2014, by way of novation, contracts from SEG Insurance Limited, in relation to its Schools RiskManagement (“SRM”) to the Group’s owned cell in R&Q Quest (SAC) Ltd. SRM wrote business as a reinsurer ofTravelers/Discover Re for various schools and SEG wished to dispose of the vehicle to free up collateral. Costsincurred in acquiring SRM were £30k.
On 24 June 2014, Southern Illinois Land Company, Inc (“Silco”) with liabilities for subsidence, black lung andworkers compensation. The subsidence and black lung liabilities have been valued in accordance with externalreports. The workers compensation liabilities are in relation to a single claim and are assessed to be sufficient.Costs incurred in acquiring Silco were £72k. These provisions are not classified as insurance technicalprovisions.
On 27 June 2014, Pender Mutual Insurance Company Limited (“Pender”) which wrote general insurance andhas been in run off since April 2005. A Scheme of Arrangement was sanctioned in 2006 which operates on areceived basis: a claim is only payable if the ensuring reinsurance is actually received. Therefore, the claimsprovisions are deemed to be benign and so are not classified as insurance technical provisions. Costs incurredin acquiring Pender were £9k.
On 30 June 2014, Oval Financial Services Limited (“Oval”), which has since been renamed R&Quiem FinancialServices Limited. The legacy business consisted of a pension administration department (with one remaining
Randall & Quilter Investment Holdings Ltd.
Notes to the Consolidated Financial StatementsFor the year ended 31 December 2014
61
contract) and two work-streams in relation to mis-selling. Their provisions are not classified as insurancetechnical provisions. Costs incurred in acquiring Oval were £82k.
On 26 August 2014, by way of novation, certain run-off business of the Bermuda domiciled Catholic InsuranceAssociation (“Catholic”) captive programme. Catholic provided reinsurance through a fronting company,Discover Re. The Group acquired the Discover Re fronted business which wrote policies in the years 2003 to2006. Costs incurred in acquiring Catholic were £55k.
On 11 December 2014, Armitage International Insurance Company Limited (“Armitage”) and BerdaDevelopments Limited (“Berda”), which are both Bermuda domiciled captives, were acquired from theUnilever group. They predominately wrote workers’ compensation, auto liability, general liability and productsliability and have been in run off since 2011 (Armitage) and 1987 (Berda). Costs incurred in acquiring Armitagewere £20k and Berda were £19k.
On 30 December 2014, by way of a loss portfolio transfer, policies written by Tryg Forsikring AS (“Tryg”),which was incorporated in Denmark, were transferred to R&Q Insurance (Malta) Limited. The policiestransferred provided marine insurance cover for the years 1998 to 2010 to policyholders in Denmark, Swedenand Norway. Costs incurred in acquiring Tryg were £10k.
On 31 December 2014, by way of a loss portfolio transfer, policies written by Aker Insurance AS (“Aker”),which is a Norwegian domiciled captive, were transferred to R&Q Insurance (Malta) Limited. The policiestransferred provided workers’ compensation and personal accident cover for the years 2003 to 2009. Costsincurred in acquiring Aker were £4k.
Accredited Holding Corporation and subsidiariesOn 26 November 2014, the Group acquired 100% of the issued share capital and voting rights of AccreditedHolding Corporation, the holding company for Accredited Surety and Casualty Company, Inc (“AccreditedSurety”), a specialist insurer, and two managing general agencies used for business distribution based in theUS state of Florida. Accredited Holding Corporation together with its subsidiaries are referred to as Accredited.
Accredited Surety has active licences in 49 US States and the District of Columbia. It is the third largest bail-bond insurer in the US based on direct premium and represents more than 1,600 bail agents.
As a result of this transaction, the Group now owns an insurance platform which is rated A- by AM Best andhas significantly expanded its presence in the United States.
The initial consideration paid by the Group amounted to £12,807k (US$20,000k). In addition to the initialconsideration, a 20% deferred payment of £3,202k (US$5,000k) was agreed and is to be paid on 26 November2016.
Randall & Quilter Investment Holdings Ltd.
Notes to the Consolidated Financial StatementsFor the year ended 31 December 2014
62
The fair value of net assets acquired and the resulting goodwill on bargain purchase is as follows:-
£000
Intangible assets 5,411Property, plant and equipment 45Insurance and other receivables 1,192Cash and cash equivalents 5,393Investments 9,806Insurance and other payables (750)Technical provisions (1,179)Deferred tax (1,731)
Net assets acquired 18,187
Consideration paid 12,807Fair value of deferred consideration 2,882
Goodwill on bargain purchase (2,498)
The identifiable intangible assets acquired comprise customer relationships, valued at £2,209k (US$3,450k),and the 50 insurance licences, valued at £3,202k (US$5,000k), gross of deferred tax.
Revenue generated after the date of acquisition amounted to £791k (US$1,235k) and profit before taxamounted to £228k (US$356k).
The Group incurred £750k of costs in acquiring Accredited. If Accredited had been owned the whole year, itwould have contributed additional revenue of £7,021k (US$10,964k) and profit before tax of £1,076k(US$1,680k) to the Group.
Divestment
On 24 November 2014, the Group entered into an agreement with Phoenix UK Fund Limited (”Phoenix”). Aspart of the transaction, a new cell company was established in Bermuda, RQLM Limited, and the Grouptransferred certain reinsurance receivable portfolios from R&Q Liquidity Management Limited into the cells.Phoenix then acquired 50% of the equity of the cells for £4,432k ($6,914k).
Also as part of the transaction, Phoenix were granted a put option over their equity in the cells, which willallow them to put their shares back to the Group on 24 November 2015, the anniversary of completion, at thecost of the original transaction plus their share of the cost of any reinsurance receivable portfolio purchases inthe intervening period. As a result, the transaction has not been recognised as a sale, and the Group has notderecognised the asset. The reinsurance receivables continue to be recognised in full and a liability is carriedfor the cost of the original transaction plus Phoenix’s share of the cost of any subsequent reinsurancereceivable purchases. As at 31 December 2014, the put option is valued at £125k, which represents thedifference between Phoenix’s share of the fair value of the reinsurance receivables less the cost of the originaltransaction, and is held as a liability in the Consolidated Statement of Financial Position.
The put option creates the risk to the Group that, for Phoenix’s share, if the fair value of the reinsurancereceivables drop below the cost of the original transaction plus the cost of subsequent debt purchases, theloss will be borne by the Group.
Randall & Quilter Investment Holdings Ltd.
Notes to the Consolidated Financial StatementsFor the year ended 31 December 2014
63
30. Non-controlling interests
The following table shows the Group’s non-controlling interests and movements in the year:-
31 December 2014 2014 2013£000 £000
Non-controlling interestsEquity shares in subsidiaries 105 105Share of retained earnings 3,055 1,265Share of other reserves 1 1
3,161 1,371
Movements in the yearBalance at 1 January 1,371 5,142
Profit for the year attributable to non-controlling interests 1,763 1,695Exchange adjustments 27 30Comprehensive income attributable to non-controlling interests 1,790 1,725
Non-controlling interests’ share of dividends declared in the year - (5,064)Changes in non-controlling interest in subsidiaries - (432)Balance at 31 December 3,161 1,371
During 2013, the Group purchased the non-controlling interests of R&Q Capital No. 1 Limited which had theeconomic benefit of 45% of the profit of the 2012 year of account of Syndicate 3330 in the 2012 financial year.The Group owns 95.01% of R&Q Capital No. 1 Limited. The accumulated non-controlling interests of R&QCapital No. 1 Limited at the end of the reporting period are £2,862k (2013: £1,760k).
31. Guarantees and debentures
The Group has entered into a guarantee agreement and debenture arrangement with its bankers, along withseveral of its subsidiaries, in respect of the Group term loan facilities. The total liability to the bank at31 December 2014 is £24,879k (2013: £16,531k).
The Group has the following external guarantees provided through subsidiaries:-
R&Q Reinsurance Company (UK) Limited guarantee to MAAF Assurances in respect of La ReassuranceIntercontinentale (now part of La Licorne Compagnie de Reassurances SA) up to €1,600k.
In December 2013, the Group entered into a guarantee with the Institute of London Underwriters inrespect of old policy liabilities which had previously been guaranteed by Tryg Forsikring AS andsubsequently indemnified by Chevanstell Limited (transferred into R&Q Insurance Malta Limited inDecember 2013). The limit of this guarantee is £1,500k.
32. Contingent liabilities
In connection with certain acquisitions, the terms are subject to potential amendment which could give rise toadditional payments of up to £8,700k (2013: £8,300k).
Prior to its acquisition by the Group during 2014, a subsidiary undertook projects to advise members ofdefined benefit pension schemes where the members received incentivised transfer offers from theiremployer. Following the conclusion of an internal review earlier in the year, work continued on finalising the
Randall & Quilter Investment Holdings Ltd.
Notes to the Consolidated Financial StatementsFor the year ended 31 December 2014
64
quantum of loss that clients of the subsidiary may have suffered and the amount of compensation that theymight be entitled to, calculated actuarially, by reference to Financial Ombudsman Service guidelines. As aresult of this work, and having regard to the warranties, indemnities and indemnity insurance in place at thetime of acquisition, the Directors have concluded no further provision is required. As at 31 December 2014, nocompensation payments had been made. After the year end, this subsidiary has also received complaints fromtwo former clients alleging mal-administration of their respective pension schemes. These complaints are at avery early stage and are being investigated.
33. Foreign exchange rates
The Group used the following exchange rates to translate foreign currency assets, liabilities, income andexpenses into sterling, being the Group’s presentational currency:-
2014 2013Average Year end Average Year end
US dollar 1.65 1.56 1.56 1.64Euro 1.24 1.27 1.18 1.20
34. Events after the reporting date
Funds at Lloyd’s relief insuranceOn 10 February 2015, the Group entered into an excess of loss reinsurance contract, through which a£10,000k letter of credit has been provided to support the Group’s Funds at Lloyd’s. The premium paid was£680k. As a result, £10,000k has been released from Funds at Lloyd’s into the Group’s available workingcapital.
DivestmentOn 27 February 2015, the Group completed the sale of its 75% ownership of R&Q Marine Services Limited toHiscox. The agreed cash consideration was £6,750k, of which £5,063k was for the share owned by the Group.Contingent consideration of up to £2,500k, of which £1,875k is for the share owned by the Group, is receivablein February 2016 depending on the performance of the divested business.
AcquisitionOn 25 May 2015, the Group signed an agreement to acquire, subject to change of control approval from thePrudential Regulation Authority and Financial Conduct Authority, the entire issued share capital of ICInsurance Limited from its indirect owners, AstraZeneca UK Limited and Imperial Chemical IndustriesLimited. IC Insurance Limited was formed in 1926 as the UK registered captive insurer for Imperial ChemicalIndustries and ceased active underwriting in 1996.
The consideration payable by the Group is anticipated to be approximately £17,000k, and will be paid in cashfrom existing resources and the Group’s bank facility. IC Insurance Limited had claim reserves as at 31December 2014 amounting to £1.9m and shareholder’s funds of £22.5m.
Business development – new classes of businessFollowing the acquisition of Accredited on 26 November 2014, a new business plan was filed on 6 April 2015with the Florida state regulator by its subsidiary, Accredited Surety, to expand its existing nationwide suretylicences to include certain property and casualty lines of business. Approval was received on 5 June 2015,following which Accredited Surety will begin filing applications to other states towards the end of June 2015.
Distribution to shareholdersOn 19 June 2015, the Board approved a distribution payment of 5.0 pence per share, to be made by way of areturn of capital.
Randall & Quilter Investment Holdings Ltd.
Notes to the Consolidated Financial StatementsFor the year ended 31 December 2014
65
35. Ultimate controlling party
The Directors consider that the Group has no ultimate controlling party.