14
Random-coefficient Models 1. Markov-switching model (MRS) 2. Threshold model 3. Quantile Regression mo del (QR)
| Date post: | 20-Dec-2015 |
| Category: |
Documents |
| View: | 232 times |
| Download: | 6 times |

Random-coefficient Models
1. Markov-switching model (MRS)
2. Threshold model
3. Quantile Regression model (QR)
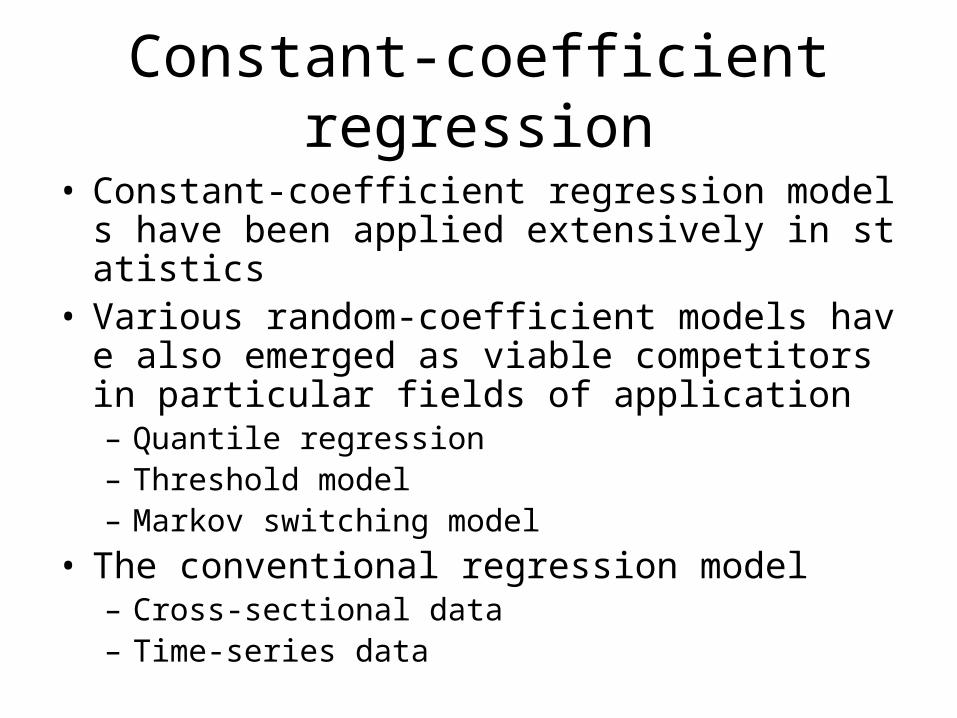
Constant-coefficient regression
• Constant-coefficient regression models have been applied extensively in statistics
• Various random-coefficient models have also emerged as viable competitors in particular fields of application– Quantile regression – Threshold model– Markov switching model
• The conventional regression model – Cross-sectional data– Time-series data
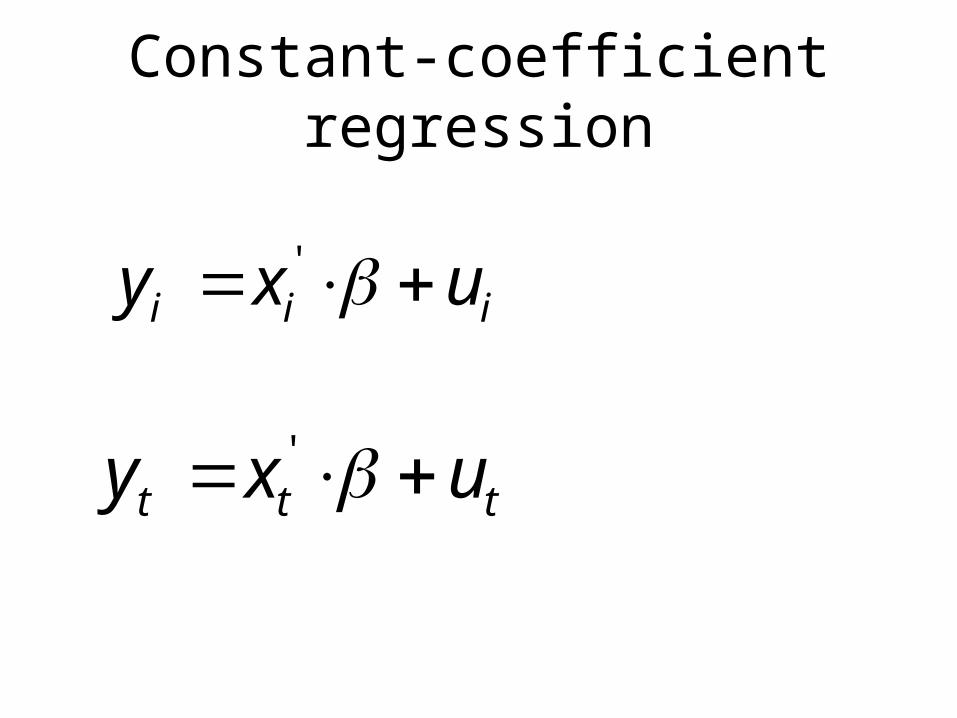
Constant-coefficient regression
iii uxy '
ttt uxy '
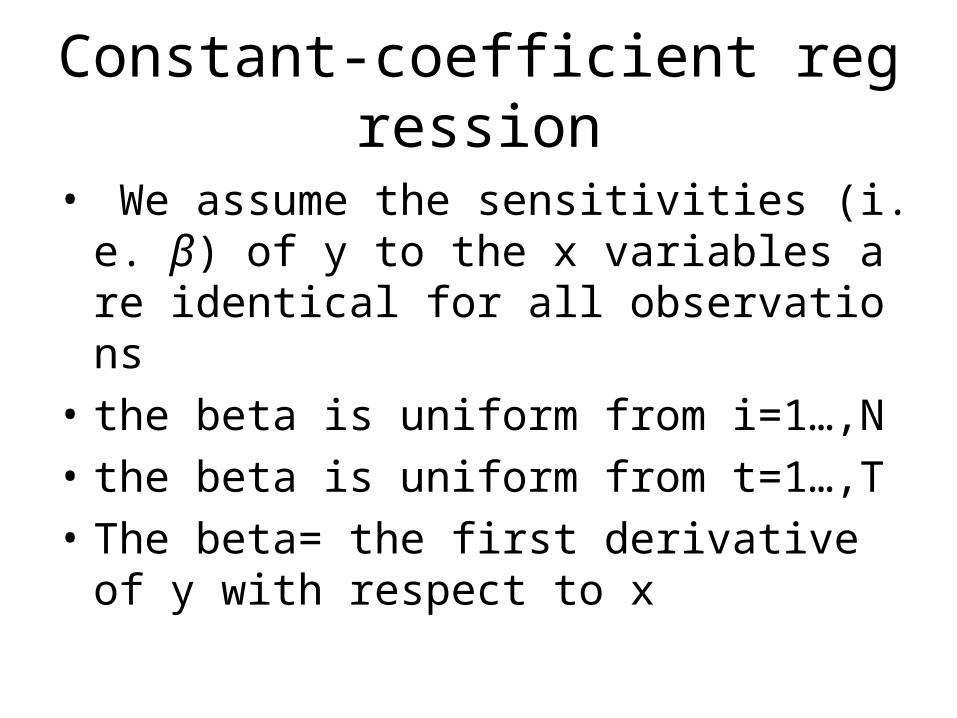
Constant-coefficient regression
• We assume the sensitivities (i.e. β) of y to the x variables are identical for all observations
• the beta is uniform from i=1…,N
• the beta is uniform from t=1…,T
• The beta= the first derivative of y with respect to x
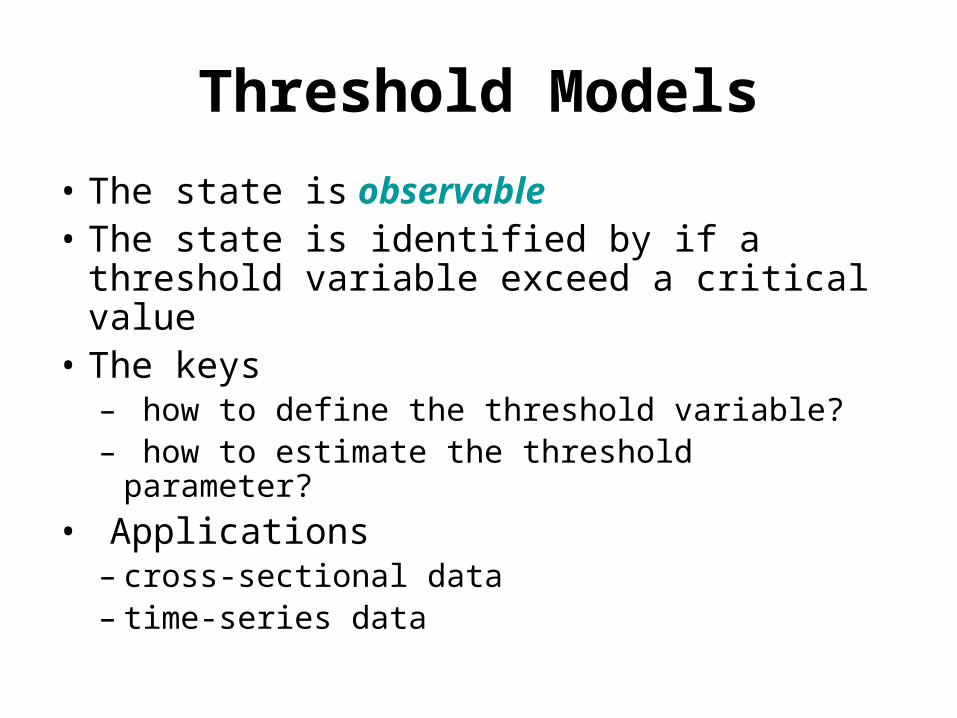
Threshold Models
• The state is observable• The state is identified by if a threshold
variable exceed a critical value• The keys
– how to define the threshold variable?– how to estimate the threshold parameter?
• Applications– cross-sectional data– time-series data
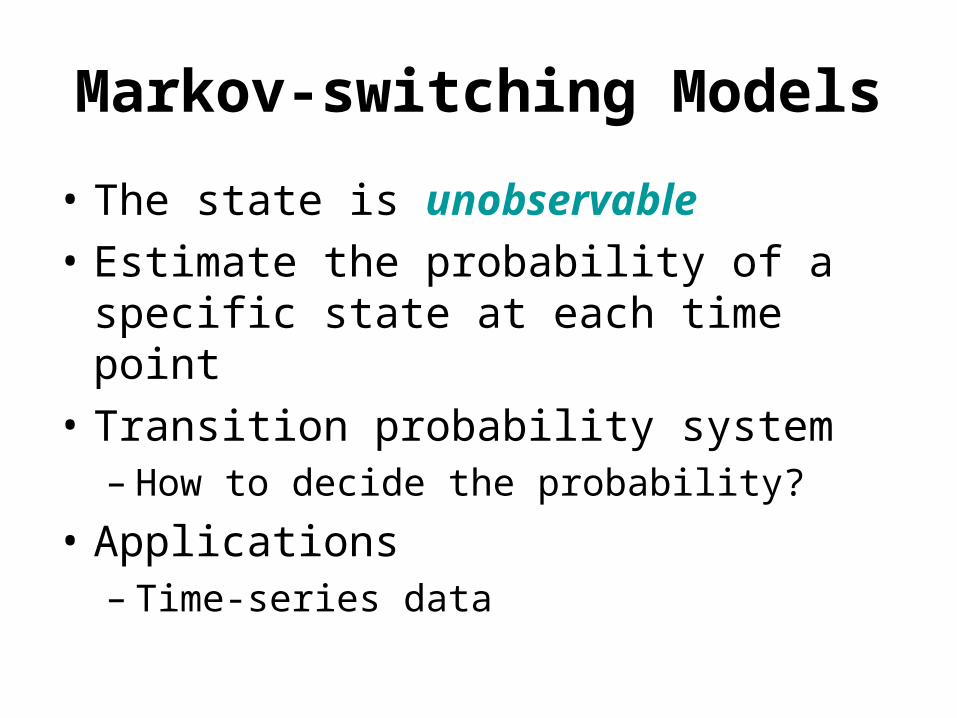
Markov-switching Models
• The state is unobservable
• Estimate the probability of a specific state at each time point
• Transition probability system– How to decide the probability?
• Applications– Time-series data
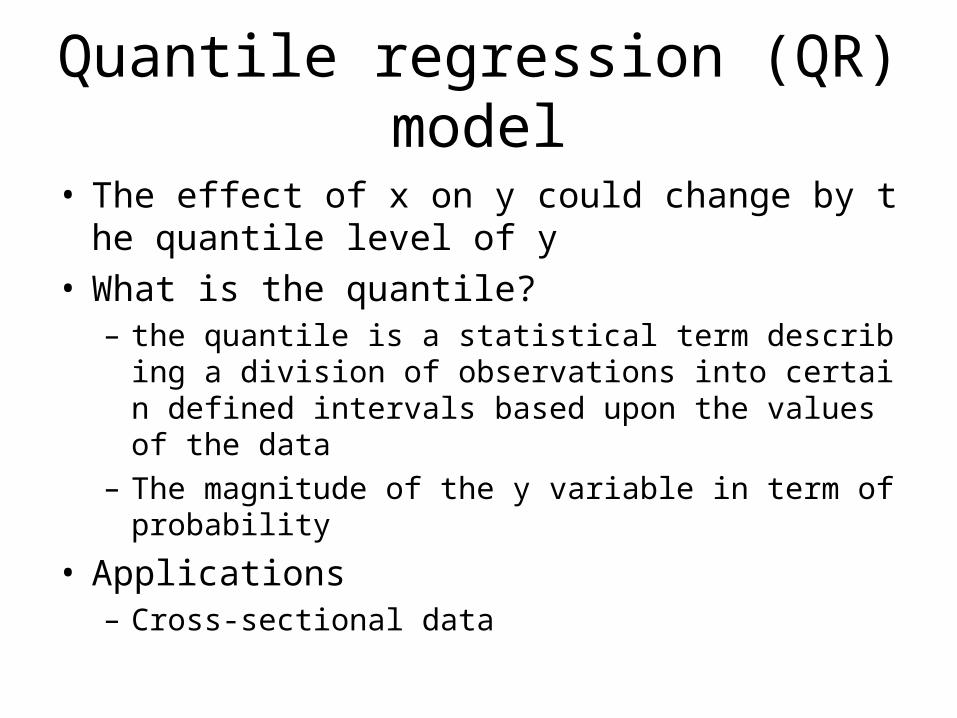
Quantile regression (QR) model
• The effect of x on y could change by the quantile level of y
• What is the quantile? – the quantile is a statistical term describing a division o
f observations into certain defined intervals based upon the values of the data
– The magnitude of the y variable in term of probability
• Applications– Cross-sectional data

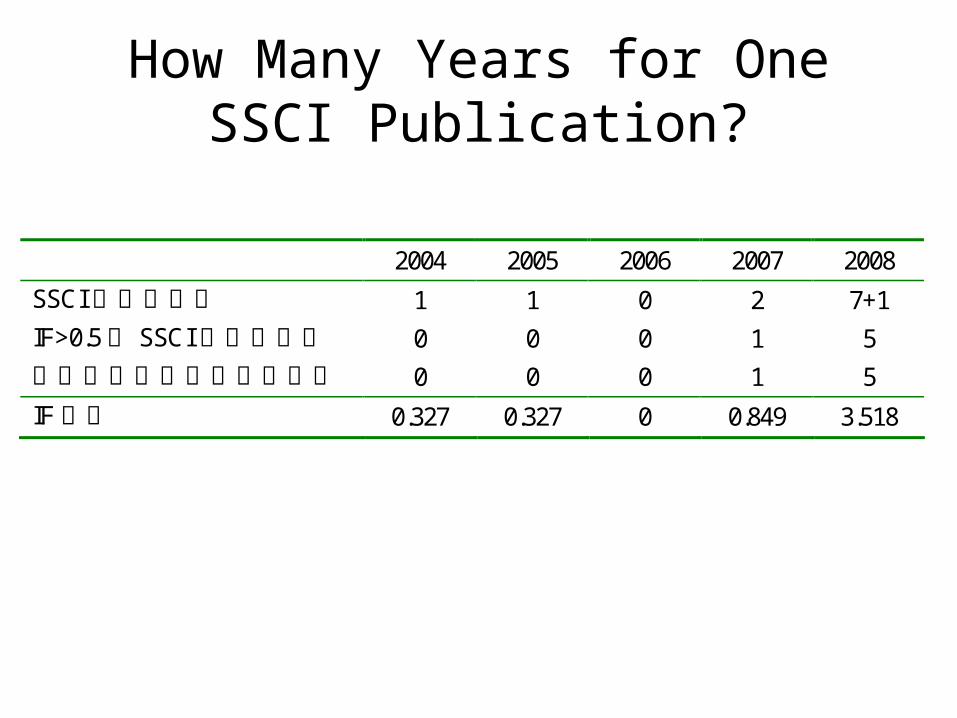
How Many Years for One SSCI Publication?
How Many Years for One SSCI Publication?
2004 2005 2006 2007 2008
SSCI 發表總篇數 1 1 0 2 7+1
IF>0.5 之 SSCI 發表總篇數 0 0 0 1 5
國科會評定之優良國際期刊 0 0 0 1 5
IF 總合 0.327 0.327 0 0.849 3.518
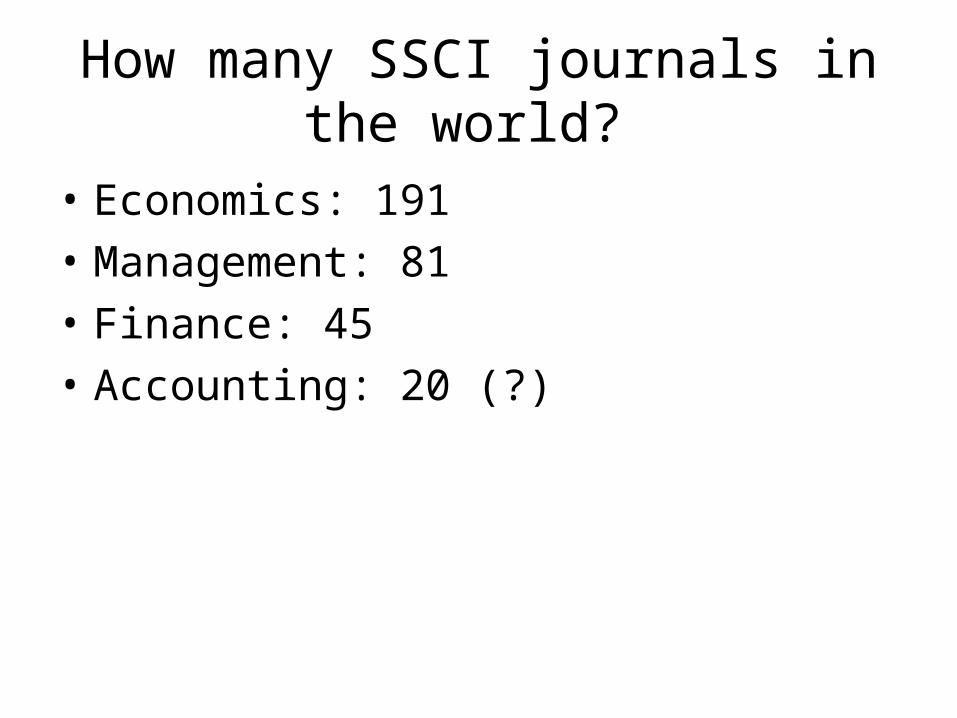
How many SSCI journals in the world?
• Economics: 191
• Management: 81
• Finance: 45
• Accounting: 20 (?)
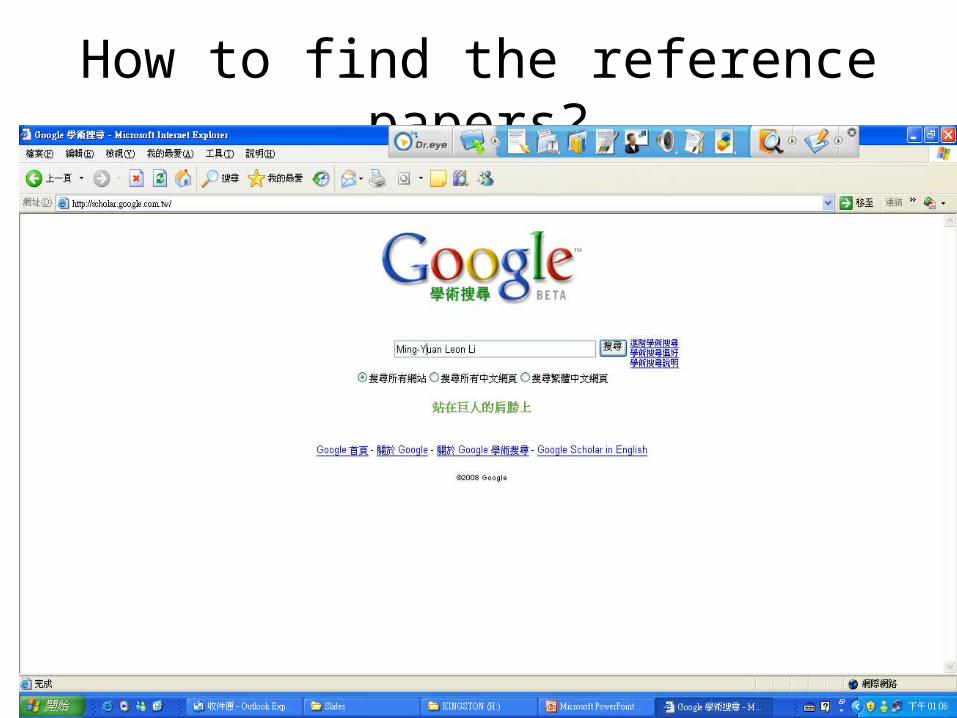
How to find the reference papers?