+ All Categories
Home > Documents > Ranil Jayawardena Mallika Arachchige - QUT · Ranil Jayawardena . Mallika Arachchige. MBBS...

Ranil Jayawardena Mallika Arachchige - QUT · Ranil Jayawardena . Mallika Arachchige. MBBS...

Date post: 25-May-2019
Category:
Upload: doankhanh
View: 227 times
Download: 0 times
Share this document with a friend
264
VALIDITY OF DIETARY QUESTIONNAIRES IN SRI LANKAN ADULTS AND THE ASSOCIATION OF DIETARY INTAKE WITH OBESITY Ranil Jayawardena Mallika Arachchige MBBS (Colombo), HND (UK), MSc (Glasgow) Submitted in fulfilment of the requirements for the degree of Doctor of Philosophy Institute of Health and Biomedical Innovation School of Exercise and Nutrition Sciences, Faculty of Health, Queensland University of Technology April 2013
Transcript

VALIDITY OF DIETARY QUESTIONNAIRES IN SRI LANKAN ADULTS AND THE ASSOCIATION OF

DIETARY INTAKE WITH OBESITY

Ranil Jayawardena Mallika Arachchige

MBBS (Colombo), HND (UK), MSc (Glasgow)

Submitted in fulfilment of the requirements for the degree of

Doctor of Philosophy

Institute of Health and Biomedical Innovation

School of Exercise and Nutrition Sciences,

Faculty of Health,

Queensland University of Technology

April 2013

Validity of dietary questionnaires in Sri Lankan adults and the association of dietary intake with obesity i

Keywords

Body Weight Perception, Diabetes, Diet, Dietary Diversity, Food Frequency

Questionnaire, Non-Communicable Diseases, Nutrition, Obesity, Sri Lanka.

ii Validity of dietary questionnaires in Sri Lankan adults and the association of dietary intake with obesity

Abstract

Traditionally, infectious diseases and under-nutrition have been considered major

health problems in Sri Lanka with little attention paid to obesity and associated non-

communicable diseases (NCDs). However, the recent Sri Lanka Diabetes and

Cardiovascular Study (SLDCS) reported the epidemic level of obesity, diabetes and

metabolic syndrome. Moreover, obesity-associated NCDs is the leading cause of

death in Sri Lanka and there is an exponential increase in hospitalization due to

NCDs adversely affecting the development of the country. Despite Sri Lanka having

a very high prevalence of NCDs and associated mortality, little is known about the

causative factors for this burden. It is widely believed that the global NCD epidemic

is associated with recent lifestyle changes, especially dietary factors. In the absence

of sufficient data on dietary habits in Sri Lanka, successful interventions to manage

these serious health issues would not be possible. In view of the current situation the

dietary survey was undertaken to assess the intakes of energy, macro-nutrients and

selected other nutrients with respect to socio demographic characteristics and the

nutritional status of Sri Lankan adults especially focusing on obesity. Another aim of

this study was to develop and validate a culturally specific food frequency

questionnaire (FFQ) to assess dietary risk factors of NCDs in Sri Lankan adults.

Data were collected from a subset of the national SLDCS using a multi-stage,

stratified, random sampling procedure (n=500). However, data collection in the

SLDCS was affected by the prevailing civil war which resulted in no data being

collected from Northern and Eastern provinces. To obtain a nationally representative

sample, additional subjects (n=100) were later recruited from the two provinces

using similar selection criteria. Ethical Approval for this study was obtained from the

Validity of dietary questionnaires in Sri Lankan adults and the association of dietary intake with obesity iii

Ethical Review Committee, Faculty of Medicine, University of Colombo, Sri Lanka

and informed consent was obtained from the subjects before data were collected.

Dietary data were obtained using the 24-h Dietary Recall (24HDR) method. Subjects

were asked to recall all foods and beverages, consumed over the previous 24-hour

period. Respondents were probed for the types of foods and food preparation

methods. For the FFQ validation study, a 7-day weight diet record (7-d WDR) was

used as the reference method. All foods recorded in the 24 HDR were converted into

grams and then intake of energy and nutrients were analysed using NutriSurvey 2007

(EBISpro, Germany) which was modified for Sri Lankan food recipes. Socio-

demographic details and body weight perception were collected from interviewer-

administrated questionnaire. BMI was calculated and overweight (BMI ≥23 kg.m-2),

obesity (BMI ≥25 kg.m-2) and abdominal obesity (Men: WC ≥ 90 cm; Women: WC

≥ 80 cm) were categorized according to Asia-pacific anthropometric cut-offs. The

SPSS v. 16 for Windows and Minitab v10 were used for statistical analysis purposes.

From a total of 600 eligible subjects, 491 (81.8%) participated of whom 34.5%

(n=169) were males. Subjects were well distributed among different socio-economic

parameters. A total of 312 different food items were recorded and nutritionists

grouped similar food items which resulted in a total of 178 items. After performing

step-wise multiple regression, 93 foods explained 90% of the variance for total

energy intake, carbohydrates, protein, total fat and dietary fibre. Finally, 90 food

items and 12 photographs were selected. Seventy-seven subjects completed

(response rate = 65%) the FFQ and 7-day WDR. Estimated mean energy intake (SD)

from FFQ (1794±398 kcal) and 7DWR (1698±333 kcal, P<0.001) was significantly

different due to a significant overestimation of carbohydrate (~10 g/d, P<0.001) and

to some extent fat (~5 g/d, NS). Significant positive correlations were found between

iv Validity of dietary questionnaires in Sri Lankan adults and the association of dietary intake with obesity

the FFQ and 7DWR for energy (r = 0.39), carbohydrate (r = 0.47), protein (r = 0.26),

fat (r =0.17) and dietary fiber (r = 0.32). Bland-Altman graphs indicated fairly good

agreement between methods with no relationship between bias and average intake of

each nutrient examined.

The findings from the nutrition survey showed on average, Sri Lankan adults

consumed over 14 portions of starch/d; moreover, males consumed 5 more portions

of cereal than females. Sri Lankan adults consumed on average 3.56 portions of

added sugars/d. Moreover, mean daily intake of fruit (0.43) and vegetable (1.73)

portions was well below minimum dietary recommendations (fruits 2 portions/d;

vegetables 3 portions/d). The total fruit and vegetable intake was 2.16 portions/d.

Daily consumption of meat or alternatives was 1.75 portions and the sum of meat

and pulses was 2.78 portions/d. Starchy foods were consumed by all participants and

over 88% met the minimum daily recommendations. Importantly, nearly 70% of

adults exceeded the maximum daily recommendation for starch (11portions/d) and a

considerable proportion consumed larger numbers of starch servings daily,

particularly men. More than 12% of men consumed over 25 starch servings/d. In

contrast to their starch consumption, participants reported very low intakes of other

food groups. Only 11.6%, 2.1% and 3.5% of adults consumed the minimum daily

recommended servings of vegetables, fruits, and fruits and vegetables combined,

respectively. Six out of ten adult Sri Lankans sampled did not consume any fruits.

Milk and dairy consumption was extremely low; over a third of the population did

not consume any dairy products and less than 1% of adults consumed 2 portions of

dairy/d. A quarter of Sri Lankans did not report consumption of meat and pulses.

Regarding protein consumption, 36.2% attained the minimum Sri Lankan

recommendation for protein; and significantly more men than women achieved the

Validity of dietary questionnaires in Sri Lankan adults and the association of dietary intake with obesity v

recommendation of ≥3 servings of meat or alternatives daily (men 42.6%, women

32.8%; P<0.05).

Over 70% of energy was derived from carbohydrates (Male:72.8±6.4%,

Female:73.9±6.7%), followed by fat (Male:19.9±6.1%, Female:18.5±5.7%) and

proteins (Male:10.6±2.1%, Female:10.9±5.6%). The average intake of dietary fiber

was 21.3 g/day and 16.3 g/day for males and females, respectively. There was a

significant difference in nutritional intake related to ethnicities, areas of residence,

education levels and BMI categories. Similarly, dietary diversity was significantly

associated with several socio-economic parameters among Sri Lankan adults. Adults

with BMI ≥25 kg.m-2 and abdominally obese Sri Lankan adults had the highest diet

diversity values.

Age-adjusted prevalence (95% confidence interval) of overweight, obesity, and

abdominal obesity among Sri Lankan adults were 17.1% (13.8-20.7), 28.8% (24.8-

33.1), and 30.8% (26.8-35.2), respectively. Men, compared with women, were less

overweight, 14.2% (9.4-20.5) versus 18.5% (14.4-23.3), P = 0.03, less obese, 21.0%

(14.9-27.7) versus 32.7% (27.6-38.2), P < .05; and less abdominally obese, 11.9%

(7.4-17.8) versus 40.6% (35.1-46.2), P < .05. Although, prevalence of obesity has

reached to epidemic level body weight misperception was common among Sri

Lankan adults. Two-thirds of overweight males and 44.7% of females considered

themselves as in “about right weight”. Over one third of both male and female obese

subjects perceived themselves as “about right weight” or “underweight”. Nearly 32%

of centrally obese men and women perceived that their waist circumference is about

right. People who perceived overweight or very overweight (n = 154) only 63.6%

tried to lose their body weight (n = 98), and quarter of adults seek advices from

professionals (n = 39).

vi Validity of dietary questionnaires in Sri Lankan adults and the association of dietary intake with obesity

A number of important conclusions can be drawn from this research project. Firstly,

the newly developed FFQ is an acceptable tool for assessing the nutrient intake of Sri

Lankans and will assist proper categorization of individuals by dietary exposure.

Secondly, a substantial proportion of the Sri Lankan population does not consume a

varied and balanced diet, which is suggestive of a close association between the

nutrition-related NCDs in the country and unhealthy eating habits. Moreover, dietary

diversity is positively associated with several socio-demographic characteristics and

obesity among Sri Lankan adults. Lastly, although obesity is a major health issue

among Sri Lankan adults, body weight misperception was common among

underweight, healthy weight, overweight, and obese adults in Sri Lanka. Over 2/3 of

overweight and 1/3 of obese Sri Lankan adults believe that they are in “right weight”

or “under-weight” categories.

Validity of dietary questionnaires in Sri Lankan adults and the association of dietary intake with obesity vii

THE FOLLOWING PAPERS HAVE BEEN PUBLISHED DURING MY CANDIDATURE

Publications included in the thesis

1. R Jayawardena, NM Byrne, MJ Soares, P Katulanda, AP Hills (2012). Food

consumption of Sri Lankan adults: an appraisal of serving characteristics

Public Health Nutrition: 16 (4): 653-658.

2. R Jayawardena, P Ranasinghe, NM Byrne, MJ Soares, P Katulanda, AP

Hills (2012). Prevalence and trends of the diabetes epidemic in South Asia: a

systematic review and meta-analysis. BMC Public Health 12: 380.

3. R Jayawardena, NM Byrne, MJ Soares, P Katulanda, AP Hills (2012).

Development of a food frequently questionnaire for Sri Lankan adults.

Nutrition Journal 11: 63.

4. R Jayawardena, NM Byrne, MJ Soares, P Katulanda, AP Hills (2012). The

obesity epidemic in Sri Lanka Revisited. Asia Pac J Public Health. doi:

10.1177/1010539512464650. 2012 Nov 27. [Epub ahead of print].

5. R Jayawardena, NM Byrne, MJ Soares, P Katulanda, AP Hills (2013). High

dietary diversity is associated with obesity in Sri Lankan adults. BMC Public

Health 13: 314.

6. R Jayawardena, NM Byrne, MJ Soares, P Katulanda, AP Hills. Body weight

perception and weight losing practices in Sri Lankan adults. Obesity Research

and Clinical Practice (DOI: 10.1016/j.orcp.2013.05.003).

7. R Jayawardena, NM Byrne, MJ Soares, P Katulanda, AP Hills. Prevalence,

Trends and Associated Socio-Economic Factors of Obesity in South Asia.

Obesity Facts (in press).

viii Validity of dietary questionnaires in Sri Lankan adults and the association of dietary intake with obesity

8. R Jayawardena, SN Thennakoon, NM Byrne, MJ Soares, P Katulanda, AP

Hills. Energy and Nutrient Intakes among Sri Lankan Adults. BMC Research

Notes (in press).

9. R Jayawardena, NM Byrne, MJ Soares, P Katulanda, AP Hills. Validation

of Food Frequency Questionnaire for Sri Lankan adults. Nutrition Journal

(Under review).

Relevant publications (with QUT affiliation) not included in the thesis

2012

1. R Jayawardena, P Ranasinghe, P Galappatty, RLDK Malkanthi, GR

Constantine and Prasad Katulanda (2012) Effects of Zinc supplementation on

Diabetes Mellitus: a systematic review and meta-analysis. Diabetology &

Metabolic Syndrome 4:13 (doi:10.1186/1758-5996-4-13)

2. P Ranasinghe, R Jayawardana, N de Vas Gunawardana, P Katulanda.

(2012) Efficacy and safety of ‘True’ cinnamon (Cinnamomum zeylanicum)

as a pharmaceutical agent in diabetes: a systematic review and meta-analysis.

Diabetes Medicine 2012 DOI: 10.1111/j.1464-5491.2012.03718.x

3. P Katulanda, P Ranasinghe, R Jayawardena, MHR Sheriff, DR Matthews.

(2012) The prevalence, patterns and correlates of diabetic peripheral

neuropathy in Sri Lanka. Diabetology & Metabolic Syndrome 4:21

4. P Katulanda, P. Ranasinghe, R Jayawardena, MHR Sheriff, DR Matthews.

(2012) Metabolic Syndrome among adults from a developing country:

Prevalence, patterns and correlates. Diabetology & Metabolic Syndrome

2012, 4:24

Validity of dietary questionnaires in Sri Lankan adults and the association of dietary intake with obesity ix

5. P Ranasinghe, R Jayawardena, P Katulanda. (2012) Diabetes Mellitus in

South Asia: a scientific evaluation of the research output. Journal of Diabetes

DOI: 10.1111/jdb.12003

6. P Katulanda, R Jayawardena, P Ranasinghe, MHR Sheriff, DR Matthews.

(2012) Physical activity patterns and correlates among Sri Lankan adults: the

Sri Lanka Diabetes and Cardiovascular Study. Public Health Nutrition, 2012,

Firstview 1-9

7. P Ranasinghe, R Jayawardena, P Katulanda. (2012) Sri Lanka in the global

map of medical research: a scientific analysis of the Sri Lankan research

output during 2000-2009. BMC Research Notes 5:121

2013

8. R Jayawardana, P Ranasinghe, MHR Sheriff, DR Matthews, P Katulanda.

(2013) Waist to height ratio: a better anthropometric predictor of diabetes and

cardio-metabolic risk factors in Sri Lankan adults. Diabetes Research and

Clinical Practice 99 292–299.

9. P Ranasinghe, R Jayawardana, N de Vas Gunawardana, P Katulanda.

(2013) Re Response to Akilen et al. Efficacy and safety of ‘true’ cinnamon

(Cinnamomum zeylanicum) as a pharmaceutical agent in diabetes: a

systematic review and meta-analysis Diabet Med. 2013 Jan 28. doi:

10.1111/dme.12141. [Epub ahead of print]

10. P Ranasinghe, R Jayawardena, ASAD Pigera, P Katulanda, GR

Constantine, P Galappaththy. Zinc supplementation in pre-diabetes: study

protocol for a randomized, double-blind, placebo-controlled clinical trial.

Trials 2013, 14:52

x Validity of dietary questionnaires in Sri Lankan adults and the association of dietary intake with obesity

11. P Ranasinghe, R Jayawardena, P Katulanda. The growing epidemic of

Diabetes Mellitus in Sri Lanka: facts, figures and reality. BMC Research

Notes (Under review)

12. AK Pathirana, NC Lokunarangoda, I Ranathunga, R Ekananyaka, WS

Santharaja, R Jayawardena. Prevalence of malnutrition among cardiac

patients in a developing country. Journal of Human Nutrition and Dietetics

(Under review)

13. Anidu K Pathirana, Ranil Jayawardena, Ishara Ranathunga, Sandamali P

Premaratne, W S Santharaj and Niroshan C Lokunarangoda. Is malnutrition

worsening during hospitalization? BMC Research Notes (Under review)

14. R Jayawardena, NC Lokunarangoda, I Ranathunga, WS Santharaj, AO

Walawwatta and AK Pathirana. Predicting clinical outcome of cardiac

patients by six malnutrition screening tools. Nutrition Journal (Under review)

15. R Jayasuria, J Pinidiyapathirage, R Wickremasinghe, R Jayawardena, P de

Zoysa, A Kasturiratne. Translational Research for Diabetes self management

in Sri Lanka. The Diabetic Educator (Under review)

16. C Ranasinghe, P Ranasinghe, R Jayawardena, A Misra. Physical activity

patterns among South-Asian adults: a Systematic Review. IJBNPA (Under

review)

17. P Katulanda, P Ranasinghe, R Jayawardena, MHR Sheriff, DR Matthews

The prevalence, patterns and predictors of hypertension in Sri Lanka: a cross-

sectional population based national survey. Hypertension (Under review)

18. C Ranasinghe, P Ranasinghe, R Jayawardena, MHR Sheriff, DR Matthews

P Katulanda. Evaluation of physical activity among adults with diabetes

Validity of dietary questionnaires in Sri Lankan adults and the association of dietary intake with obesity xi

mellitus from Sri Lanka. The Journal of Diabetes and Metabolic Disorders.

(Under review)

19. KM Rathnayake, A Satchithananthan, S Mahamithawa, R Jayawardena.

Early life predictors of preschool overweight and obesity: a case-control

study in Sri Lanka. BMC Public Health (Under review)

Conference publications during my candidature

2010

• Jayawardana MAR, Hills AP, Soares MJ, Katulanda P. Development and

validation of a food frequency questionnaire (FFQ) for Sri Lankan adults.

IHBI inspires 2010, Gold Coast, 25-26 Nov, 2010, pg 91

• Jayawardana MAR, Hills AP, Soares MJ, Katulanda P. Obesity in South

Asia: A review. IHBI Inspires 2010, Gold Coast, 25-26 Nov, 2010, pg 92

2011

• R Jayawardena, NM Byrne, MJ Soares, P Katulanda, AP Hills. Prevalence

and associated socio-economic factors of obesity and overweight in South

Asian countries; The 7th Asia Pacific Conference on Clinical Nutrition (7th

APCCN 2011) 5-8 June 2011 in Bangkok, Thailand (406)

• RLDK Malkanthi, MSF Shakira, KDRR Silva, R Jayawardena and KPB

Herath. Association of Serum Zinc level and percentage of body fat in

healthy adults: a case control study; The 7th Asia Pacific Conference on

Clinical Nutrition (7th APCCN 2011) 5-9 June 2011 in Bangkok, Thailand

(434)

xii Validity of dietary questionnaires in Sri Lankan adults and the association of dietary intake with obesity

• R Jayawardena, NM Byrne, MJ Soares, P Katulanda, AP Hills. Prevalence,

trends and associated socio-economic factors of obesity in South Asia. 18th

European Congress of Obesity, 25- 28 May 2011, Istanbul, Turkey

• R Jayawardena, P Ranasighe, NM Byrne, MJ Soares, P Katulanda, AP

Hills. The association between weight perception and obesity among Sri

Lankan adults. 6th Asia-Oceania Conference on Obesity. Aug. 31 - Sept. 2,

2011 Sofitel Philippine Plaza Manila, Philippines

• R Jayawardena, NM Byrne, MJ Soares, P Katulanda, AP Hills. Prevalence

of obesity, overweight and abdominal obesity in Sri Lankan adults. 6th Asia-

Oceania Conference on Obesity. Aug. 31 - Sept. 2, 2011 Sofitel Philippine

Plaza, Manila, Philippines

• R Jayawardena, P Ranasighe, NM Byrne, MJ Soares, P Katulanda, AP

Hills. Body weight perception and weight loss practices in adults with

diabetes. World Diabetes Congress, Dec 4-8, 2011 Dubai

• P Ranasinghe, R Jayawardena, MHR Sheriff, DR Matthews, P Katulanda.

The patterns and correlates of diabetic peripheral neuropathy in Sri Lanka.

World Diabetes Congress, Dec 4-8, 2011 Dubai

• R Jayasuriya, MJ Pinidiyapathirage, A Kasturiratne, P Godamunne, P de

Zoysa, R Jayawardana, J Perera, S Siyambalapitiya, AR Wickremasinghe.

Efficacy of a patient centred diabetes self management model in a developing

country: a randomized controlled trial World Diabetes Congress Dubai; Dec

4-8: 2011

2012

• R Jayawardena, P Ranasinghe, NM Byrne, MJ Soares, P Katulanda and AP

Hills. Prevalence and trends of the diabetes epidemic in South Asia: a

Validity of dietary questionnaires in Sri Lankan adults and the association of dietary intake with obesity xiii

systematic review. Annual sessions 2012; Nutrition Society of Sri Lanka; 23-

24 Jan 2012

• R Jayawardena, MSF. Shakira, NM Byrne, MJ Soares, P Katulanda and AP

Hills. The association between body weight perception and obesity among Sri

Lankan adults. Annual sessions 2012; Nutrition Society of Sri Lanka; 23-24

Jan 2012

• R Jayawardena, MSF Shakira, NM Byrne, MJ Soares, P Katulanda and AP

Hills. Fruit and vegetable intake among adults in Sri Lanka. Annual sessions

2012; Nutrition Society of Sri Lanka; 23-24 Jan 2012

• R Jayawardena, P Katulanda, NM Byrne, MJ Soares, AP Hills. Body weight

perception and weight loss practices among Sri Lankan adults. SLMA, 2012,

P.(20)

• R Jayawardena, P Katulanda, NM Byrne, MJ Soares, AP Hills. Energy and

nutrient intake - findings from a Sri Lankan adult nutrition survey. SLMA,

2012, P.(22)

• R Jayawardena, P Ranasinghe, P Katulanda, R Sheriff, DR Matthews.

Patterns and correlates of physical activity among Sri Lankan adults. SLMA,

2012, P.(23)

• P Ranasinghe, R Jayawardena, GR Constantine, R Sheriff, P Katulanda. The

prevalence, patterns and correlates of diabetic peripheral neuropathy in Sri

Lanka. SLMA, 2012, P.(25)

• R Jayawardena, P Ranasinghe, P Galappatthy, GR Constantine, P

Katulanda. Effects of zinc supplementation on diabetes mellitus: a systematic

review and meta-analysis. SLMA, 2012, P.(26)

xiv Validity of dietary questionnaires in Sri Lankan adults and the association of dietary intake with obesity

• P Ranasinghe, R Jayawardena, P Katulanda, R Sheriff, DR Matthews.

Metabolic syndrome among Sri Lankan adults - prevalence, patterns and

correlates. SLMA, 2012, P.(49)

• P Ranasinghe, R Jayawardena, WRUAS Wijesundara,WMUA Wijetunga,

TAD Tilakaratne, S Subasinghe, P Katulanda. Waist-to-height ratio has the

best anthropometric association with cardio-metabolic disease among Sri

Lankan adults. SLMA, 2012, P.(49)

• P Ranasinghe, R Jayawardena, P Katulanda. Diabetes mellitus in South Asia

- a scientific evaluation of the research output. SLMA, 2012, P.(93)

• R Jayawardena, P Katulanda, MJ Soares, NM Byrne, AP Hills.

Development of a Food Frequency Questionnaire for Sri Lankan adults

SLMA, 2012, P.(125)

• P Ranasinghe, R Jayawardena, P Katulanda. Sri Lanka in global medical

research: a scientific analysis of the Sri Lankan research output. SLMA,

2012, P.(137)

• P Ranasinghe, R Jayawardena, P Galappaththy, GR Constantine, P

Katulanda. Efficacy and safety of ‘true’ cinnamon (Cinnamomum

zeylanicum) as a pharmaceutical agent in diabetes. SLMA, 2012, P.(148)

• Ranasinghe P, Jayawardana R, Constantine GR, Sheriff R, Matthews DR,

Katulanda P Prevalence and correlates of complicated Diabetes Mellitus and

associated co-morbidities among Sri Lankan adults: the Sri Lanka Diabetes

and Cardiovascular Study” at the 48th Annual meeting of the European

Association for Study of Diabetes, held in Berlin, Germany, 2012

• R Jayawardena, P Ranasinghe, P Katulanda, R Sheriff, DR Matthews.

Waist-to-height ratio has the best anthropometric association with cardio-

Validity of dietary questionnaires in Sri Lankan adults and the association of dietary intake with obesity xv

metabolic disease among Sri Lankan adults. IDF-WPR and AASD

conference, Kyoto, Japan 2012

2013

• R Jayawardena, A Pathirana, N Lokunarangoda, I Ranathunga, W

Santharaj, A Walawwatta. Prevalence of Malnutrition among cardiac patients

in Sri Lanka. Annual Scientific Sessions 2013, Nutrition Society of Sri

Lanka. Feb 2-3, 2013.

• R Jayawardena, NM Byrne, MJ Soares, P Katulanda, AP Hills. Validation

of Food Frequency Questionnaire for Sri Lankan adults. Nutrition Journal

(selected to IUNS -20th International congress of nutrition, Granada, Spain)

• Jayawardana R, Ranasinghe P, Constantine GR, Sheriff R, Matthews DR,

Katulanda P. Prevalence, patterns and correlates of Diabetes Retinopathy

among Sri Lankan adults (selected to World Diabetes Congress 2013 in

Melbourne)

Awards and grants during my candidature

• Research Awards

EM Wijerama Prize- 125th anniversary international medical congress,

Sri Lanka Medical Association, 2012

Sir Nicholas Attygalle Prize - 125th anniversary international medical

congress, Sri Lanka Medical Association, 2012

• Travel Grant Awards

European Association for Study of Diabetes (EASD) travel grant 2013

– EASD Annual Conference, Barcelona, Spain (Euro 2000)

European Association for Study of Diabetes (EASD) travel grant 2012

– EASD Annual Conference, Berlin, Germany (Euro 2000)

Asian Association for Study of Diabetes (AASD) travel support 2012

– AASD Annual Conference, Kyoto, Japan (Yen 50000)

xvi Validity of dietary questionnaires in Sri Lankan adults and the association of dietary intake with obesity

• Scholarships

QUT Tuition Fee Waiver Scholarship, Queensland University of

Technology, Australia

QUT Postgraduate Award (QUTPRA), Faculty of Health, Queensland

University of Technology, Australia

IHBI Top Up Scholarship 2011, Queensland University of

Technology, Australia

• International competitive fellowships

EASD scholarship to follow Scientist Training Course in University

of Heidelberg, Germany, 2011

SEAMEO scholarship to follow Public Health And Community

Nutrition System And Analysis: University of Indonesia, Jakarta

Chronic Disease Control (CCDC) and the Public Health Foundation

of India (PHFI) scholarship to follow “Cardiovascular Disease

Epidemiology and Physical Activity Research Methods Course”

InfoSys campus, Mysore, India

Full scholarship to follow short course in Prevention Strategies for

Non-Communicable Diseases (15-20 July 2012) in University of

Oxford, UK

SJRI fellowship to follow Heath Research Methodology course, St’

John’s Medical College & Research Institute, Bangalore, India. 2012

IUNS-KNS - Capacity and Leadership Development in Nutritional

Sciences. Seoul National University, Republic of Korea. 14-16th Nov

2012. (country representation)

International Course in Nutrition Research Methods Sponsored by the

Bangalore Boston Nutrition Collaborative, St John’s Research

Institute, Bangalore. 21st Jan -1st Feb 2013.

Scholarly activities undertaken:

Training and workshop

2010

• The required unit AIRS [IFN001] has been completed.

Validity of dietary questionnaires in Sri Lankan adults and the association of dietary intake with obesity xvii

• Followed UQ Sport's ISAK Level 1 Anthropometry Course 1st Oct- 3rd Oct-

2010 and Obtained full ISAK (level 1) accreditation as an anthropometrist

2011

• Cardiovascular Disease Epidemiology and Physical Activity Research

Methods Course, Mysore, India, 18-24 May 2011

• Public Health And Community Nutrition System And Analysis: SEAMEO

RECFON University of Indonesia, Jakarta: October 31 – November 14, 2011

• EASD Scientist Training Course 2011, University Hospital Heidelberg,

Germany: October 9-15, 2011

2012

• Prevention Strategies for Non-Communicable Diseases. University of

Oxford, UK, 15 - 20 July 2012

• Health Research Methodology, St’ John’s Medical College and Research

Institution, Bangalore, India. 3-15th Sep 2012

• IUNS-KNS - Capacity and Leadership Development in Nutritional Sciences.

Seoul National University, Republic of Korea. 14-16th Nov 2012.

• International Course in Nutrition Research Methods Sponsored by the

Bangalore Boston Nutrition Collaborative, St’ John’s Medical College and

Research Institution, Bangalore, India. 21st Feb – 1st March, 2013

2013

• 1st Singapore Clinical Nutrition Meeting, Grand Copthorne Waterfront,

Singapore. 6-7th April, 2013.

Conferences

• IHBI inspires 2010, Gold Coast, Australia; 25th-26th November 2010

xviii Validity of dietary questionnaires in Sri Lankan adults and the association of dietary intake with obesity

• 7th Asia Pacific Conference on Clinical Nutrition, 5th-8th June, 2011

Bangkok, Thailand

• Annual Scientific Sessions 2012, Nutrition Society of SL, Jan 23-24th, 2012

• 125th Anniversary International Medical Congress, Colombo, Sri Lanka, 2-6th

July 2012

• 48th Annual Meeting of the European Association for the Study of Diabetes,

Berlin, Germany. 1-5th October 2012

• The 44th APACPH conference 2012, Colombo, Sri Lanka, 14-17th October

• 9th IDF-WPR Congress and 4th AASD Scientific Meeting, Kyoto, Japan,

Nov 24-27, 2012

• Annual Scientific Sessions 2013, Nutrition Society of Sri Lanka, Feb 2-3rd,

February 2013

• IUNS -20th International congress of nutrition, Granada, Spain, Sep. 15-20

(registered)

• 49th Annual Meeting of the European Association for the Study of Diabetes,

Barcelona. Spain. Sep 23-27th (registered)

Validity of dietary questionnaires in Sri Lankan adults and the association of dietary intake with obesity xix

Table of Contents

Keywords .................................................................................................................................................i

Abstract .................................................................................................................................................. ii

The following papers have been published during my candidature ..................................................... vii Publications included in the thesis ............................................................................................ vii Relevant publications (with QUT affiliation) not included in the thesis .................................. viii Awards and grants during my candidature ................................................................................. xv Scholarly activities undertaken: ................................................................................................ xvi Conferences ............................................................................................................................ xvii

Table of Contents ................................................................................................................................. xix

List of Figures .................................................................................................................................... xxii

List of Tables .................................................................................................................................... xxiii

List of Abbreviations ........................................................................................................................... xxv Statement of Original Authorship ...................................................................................................... xxvi

Acknowledgements .......................................................................................................................... xxvii

Dedication .......................................................................................................................................... xxix

CHAPTER 1: INTRODUCTION ....................................................................................................... 1 Background ............................................................................................................................................. 1

Aims and objectives ................................................................................................................................ 6 Thesis orientation .................................................................................................................................... 7

Significance of the thesis......................................................................................................................... 9

Reference list ......................................................................................................................................... 12

CHAPTER 2: MANUSCRIPT 1 ....................................................................................................... 14 Title page............................................................................................................................................... 15 Abstract ................................................................................................................................................. 16

Background ........................................................................................................................................... 17

Methods ................................................................................................................................................. 19

Results ................................................................................................................................................... 21

Discussion ............................................................................................................................................. 26

Conclusions ........................................................................................................................................... 30 References ............................................................................................................................................. 31

CHAPTER 3: MANUSCRIPT 2 ....................................................................................................... 47 Title page............................................................................................................................................... 48

Summary ............................................................................................................................................... 49

Introduction ........................................................................................................................................... 50

Methods ................................................................................................................................................. 51 Results ................................................................................................................................................... 52

Discussion ............................................................................................................................................. 55

Limitations ............................................................................................................................................ 59

xx Validity of dietary questionnaires in Sri Lankan adults and the association of dietary intake with obesity

Conclusion ............................................................................................................................................ 60

References ............................................................................................................................................. 61

CHAPTER 4: MANUSCRIPT 3 ....................................................................................................... 69 Title page .............................................................................................................................................. 70

Abstract ................................................................................................................................................. 71

Introduction ........................................................................................................................................... 72

Methodology ......................................................................................................................................... 72

Results ................................................................................................................................................... 77 Discussion ............................................................................................................................................. 78

Conclusion ............................................................................................................................................ 81

Reference list ........................................................................................................................................ 83

Supplementary Materials, Part 1 ........................................................................................................... 89

Supplementary Materials, Part 2 ........................................................................................................... 96

CHAPTER 5: MANUSCRIPT 4 ....................................................................................................... 97 Title page .............................................................................................................................................. 98

Abstract ................................................................................................................................................. 99

Introduction ......................................................................................................................................... 100

Methods .............................................................................................................................................. 101

Results and Discussion ........................................................................................................................ 104

Conclusion .......................................................................................................................................... 108 Reference list ...................................................................................................................................... 109

CHAPTER 6: MANUSCRIPT 5 ..................................................................................................... 116 Title page ............................................................................................................................................ 117

Abstract ............................................................................................................................................... 118

Introduction ......................................................................................................................................... 119 Methodology ....................................................................................................................................... 120

Results ................................................................................................................................................. 123

Discussion ........................................................................................................................................... 126

Reference list ...................................................................................................................................... 131

CHAPTER 7: MANUSCRIPT 6 AND 7 ......................................................................................... 142 Chapter 7a: Manuscript 6 .................................................................................................................... 143 Chapter 7b: Manuscript 7 .................................................................................................................... 147

Title page ............................................................................................................................................ 148

Abstract ............................................................................................................................................... 149

Introduction ......................................................................................................................................... 150

Methodology ....................................................................................................................................... 151

Results ................................................................................................................................................. 154 Discussion ........................................................................................................................................... 155

Reference list ...................................................................................................................................... 160

CHAPTER 8: MANUSCRIPT 8 ..................................................................................................... 167

Validity of dietary questionnaires in Sri Lankan adults and the association of dietary intake with obesity xxi

Title page............................................................................................................................................. 168

Abstract ............................................................................................................................................... 169 Introduction ......................................................................................................................................... 170

Material and Methods ......................................................................................................................... 172

Results ................................................................................................................................................. 174

Discussion ........................................................................................................................................... 175

Conclusion .......................................................................................................................................... 180

References ........................................................................................................................................... 182

CHAPTER 9: MANUSCRIPT 9 ..................................................................................................... 188 Title page............................................................................................................................................. 189

Abstract ............................................................................................................................................... 190

Introduction ......................................................................................................................................... 191

Methods ............................................................................................................................................... 192

Results ................................................................................................................................................. 194 Discussion ........................................................................................................................................... 195

Conclusion .......................................................................................................................................... 197

Reference list ....................................................................................................................................... 199

CHAPTER 10: GENERAL DISCUSSION ................................................................................. 206 Comparison of different dietary assessment tools ............................................................................... 207

Nutritional issues in South Asia in relation to current diabetes epidemic ........................................... 212 Strengths of the study .......................................................................................................................... 216

Limitations of the study ...................................................................................................................... 216

Recommendations ............................................................................................................................... 218

Conclusions ......................................................................................................................................... 221

Reference list ....................................................................................................................................... 222 Appendices .......................................................................................................................................... 227

Appendix A FFQ...................................................................................................................... 227

xxii Validity of dietary questionnaires in Sri Lankan adults and the association of dietary intake with obesity

List of Figures

Figure 2-1: Summarized search protocol .............................................................................................. 42

Figure 2-2: Trends in prevalence in South Asia of a) diabetes mellitus and b) pre-diabetes (Data for individual countries were extracted from the following references; Bangladesh [18]; India [35-39]; Sri Lanka [27, 40, 41]) ...................................................... 43

Figure 2-3: Diabetes epidemicity index of South Asian countries (Ban – Bangladesh; Ind – India; Mal – Maldives; Nep – Nepal; Pak – Pakistan; SL – Sri Lanka; u – urban; r – rural; u+r – urban and rural; Diabetes [ ]; Diabetes Epidemicity Index [ ]) ...................... 44

Figure 2-4: Forest plot showing pooled odds ratios for a) Family history, b) Age, c) Male gender, d) Systolic Blood Pressure, e) Diastolic Blood Pressure, f) Body Mass Index and g) Waist-Hip ratio associated with diabetes (IV-Inverse variance; SE-Standard Error) .................................................................................................................................... 46

Figure 3-1: Trends in the prevalence of obesity (BMI ≥25 kg.m-2) in Sri Lanka, Bangladesh, Nepal, India and Pakistan in adult males ............................................................................. 68

Figure 3-2: Trends in the prevalence of obesity (BMI ≥25 kg.m-2) in Sri Lanka, Bangladesh, Nepal, India and Pakistan in adult females .......................................................................... 68

Figure 4-1: Study design of the Sri Lanka Diabetes and Cardiovascular Study. .................................. 73

Figure 4-2: Map of Sri Lanka with data collection (▀) sites ................................................................. 75

Figure 4-3. Example of a disaggregated recipe showing multiple levels (Chicken Koththu) ............... 88 Figure 4-4 : A typical Sri Lankan lunch ................................................................................................ 96

Figure 5-1: Example of a food photograph (200 g of rice) ................................................................. 115

Figure 12 Percentage energy contribution from macronutrients according to gender, ethnicity and area of residance,BMI,educational level and age groups. ........................................... 141

Figure 9-1: Bland and Altman plots for energy with the mean difference and limits of agreements. Averages = FFQ+&DWR/2. Mean difference (FFQ-7DWR) is green line and 95% limits of agreements in red line. ................................................................... 204

Figure 9-2: Bland and Altman plots for protein with the mean difference and limits of agreements. Averages = FFQ+&DWR/2. Mean difference (FFQ-7DWR) is green line and 95% limits of agreements in red line. ................................................................... 204

Figure 9-3: Bland and Altman plots for fat with the mean difference and limits of agreements. Averages = FFQ+&DWR/2. Mean difference (FFQ-7DWR) is green line and 95% limits of agreements in red line. ......................................................................................... 205

Figure 9-4: Bland and Altman plots for carbohydrates with the mean difference and limits of agreements. Averages = FFQ+&DWR/2. Mean difference (FFQ-7DWR) is green line and 95% limits of agreements in red line. ................................................................... 205

Validity of dietary questionnaires in Sri Lankan adults and the association of dietary intake with obesity xxiii

List of Tables

Table 1-1. Thesis orientation .................................................................................................................. 9

Table 2-1 Prevalence of diabetes and pre-diabetes in South Asian countries ....................................... 37

Table 2-2: Prevalence of diabetes according to area of residence ........................................................ 39

Table 2-3: Prevalence of diabetes in different regions .......................................................................... 41

Table 3-1: National prevalence of obesity (as percentage) in individual South Asian countries (BMI=Body mass index, WC=waist circumference) ........................................................... 65

Table 3-2: Socio-economic factors associated with the prevalence of obesity in the South Asian region. .................................................................................................................................. 67

Table 4-1: Demographic characteristics and BMI characteristics of the sample ................................... 85

Table 4-2: Average dietary intake of servings from different food group by Sri Lankan adults ........... 86

Table 4-3: Comparison of food intake of Sri Lankan adults with national and international recommendations. ................................................................................................................ 86

Table 4-4: Percentage distribution of the study sample according to their consumed foods portions from different food groups ..................................................................................... 87

Table 5-1: Demographic characteristics of the sample of the study population .................................. 112

Table 5-2: Nutrient intake of the study population.............................................................................. 113

Table 5-3: Elements of the food frequency questionnaire ................................................................... 114

Table 6-1: Socio-demographic characteristics of the survey population ............................................. 133 Table 6-2: Energy intake (kcal) of Sri Lankan adults by socio-demographic characteristics ............. 134

Table 6-3 Carbohydrate intake (g) of Sri Lankan adults by socio-demographic characteristics ......... 135

Table 6-4 Protein intake (g) of Sri Lankan adults by socio-demographic characteristics ................... 136

Table 6-5 Fat intake (g) of Sri Lankan adults by socio-demographic characteristics ......................... 137

Table 6-6 Dietary fiber intake (g) of Sri Lankan adults by socio demographic characteristics........... 138 Table 6-7 Sodium intake (mg) of Sri Lankan adults by socio-demographic characteristics ............... 139

Table 6-8: Mean Daily Micronutrient Intake by Sri Lankan Adults. .................................................. 140

Table 7-1. Mean and SD of dietary diversity score (DDS), dietary diversity score of portions (DDSP) and food variety score (FVS) ................................................................................ 163

Table 7-2 Percent consumption of different food groups by DDS for Sri Lankan adults (n=481) ..... 164

Table 7-3 Percent consumption of different food groups by DDSP for Sri Lankan adults (n=481) ............................................................................................................................... 165

Table 7-4 Mean BMI, Waist circumference and energy intake of the subjects according to DDS, DDSP and FVS. ........................................................................................................ 166

Table 8-1: Socio-demographic characteristics, BMI and abdominal obesity categories. .................... 185

Table 8-2: Awareness of body weight and height ............................................................................... 185

Table 8-3: Percentage of adults in each category of weight perception, by BMI category calculated from measured height and weight. .................................................................... 186

Table 8-4: Percentage of adults in each category of waist circumference perception, according to WC cut-offs. ................................................................................................................... 186

Table 8-5: Logistic regression model of under perception, correct perception and over perception of body weight. ................................................................................................. 187

xxiv Validity of dietary questionnaires in Sri Lankan adults and the association of dietary intake with obesity

Table 9-1: Comparison of consumption of nutrients estimated by 7DWR vs. FFQ. .......................... 201

Table 9-2: Percentage of subjects correctly classified by FFQ relative to the 7DWFR ...................... 202 Table 9-3 (Supplementary): Means, Standard Deviations Pearson’s Correlation Coefficients of

Nutrient intakes Based on FFQ 2 and FFQ 1 ..................................................................... 203

Validity of dietary questionnaires in Sri Lankan adults and the association of dietary intake with obesity xxv

List of Abbreviations

BMI Body Mass Index CVD Cardiovascular Disease

d Day

DDS Diet Diversity Score

DDSP Dietary Diversity Score with Portions

FFQ Food Frequency Questionnaire

FVS Food Variety Score

HDL High Density Lipoproteins

IV Inverse Variance

kg kilograms

LDL Low Density Lipoproteins

m meters

NCD Non-Communicable Diseases

NHS National Health Survey

OW Overweight

OR Odd Ratio

SD Standard Deviation

SE Standard Error

SLDCS Sri Lanka Diabetes and Cardiovascular study

TAG Triglycerides

TC Total Cholesterol

WC Waist Circumference

WHO World Health Organization

xxvi Validity of dietary questionnaires in Sri Lankan adults and the association of dietary intake with obesity

Statement of Original Authorship

The work contained in this thesis has not been previously submitted to meet

requirements for an award at this or any other higher education institution. To the

best of my knowledge and belief, the thesis contains no material previously

published or written by another person except where due reference is made.

Signature:

Date: 7th November 2013

Validity of dietary questionnaires in Sri Lankan adults and the association of dietary intake with obesity xxvii

Acknowledgements

I greatly acknowledge the assistance I received from numerous individuals and

institutions for completing this research.

First and foremost, I would like to thank to my supervisory team, Prof. Andrew Hills,

Prof. Nuala Byrne, A/Prof. Mario Soares and Dr. Prasad Katulanda for their support,

advice, experience, and guidance throughout my candidature. I appreciate the

significant amount of time and assistance my supervisors have invested in the

development of my research and professional skills. Prof. Hills was a great mentor

and always provided me warm support and assistance over and above my

expectations. A/Prof. Soares expertise and critical perspectives were invaluable to

the development of this thesis. Dr. Katulanda provided a stimulating environment

with productive discussion through the research that helped make me a better

researcher. I am grateful to all of them for their invaluable support, wisdom and the

kind-hearted assistance extended to me during last three years.

I would like to express my gratitude to staff members of the university. I would like

to thank Queensland University of Technology for offering me a scholarship to

complete my PhD. The university has offered me many opportunities to attend and

present at seminars, trainings and conferences to further enhance my research skills

and disseminate my research findings. I must thank the Faculty of Health for

granting me the tuition fee waiver and living allowance scholarship, without which

my PhD study would not have been possible.

I would like to greatly acknowledge staff members from Diabetes Research Unit

(DRU), Faculty of Medicine, University of Colombo for support for field visits, data

collection, data analysis and data entering. I would like to thank my colleagues and

xxviii Validity of dietary questionnaires in Sri Lankan adults and the association of dietary intake with obesity

friends, Katy Horner, Priyanga Ranasinghe, Fathima Shakira, Shalika Tennakoon

and Upekha Ganegoda. I would also like to thank Connie Wishart for laboratory

analyses at IHBI and Martin Reese who helped me correct the English in this

dissertation.

I would like to thank all my family for their support, especially my mother Nalini,

brother Chathura and my mother-in-law Kusum who encouraged me to travel

overseas to further my studies. I am sure they are thrilled to see the end in sight. I am

deeply grateful to my wife, Kavindya, who accepted my decisions to undertake this

PhD journey, always believes in and stands by me, and continues to bring a smile to

my face. I could not have completed this research without your help.

Additionally, I would like to thank the participants in this study for their

contribution and cooperation. Their valuable input was a major factor in

accomplishing this study.

Validity of dietary questionnaires in Sri Lankan adults and the association of dietary intake with obesity xxix

Dedication

To my loving father, who passed away one month before I started my PhD.

1

Chapter 1: Introduction

BACKGROUND

Traditionally, infectious diseases and under-nutrition have been considered major health

problems in the developing world [1] with little attention paid to obesity and associated Non-

Communicable Diseases (NCDs). In the past, obesity was regarded as a sign of wealth in

developing settings and therefore has long been viewed as desirable. However, the prevalence of

obesity and NCDs are increasing at an alarming rate worldwide [2] and an increasing body of

evidence shows that people originating from the Indian sub-continent have a high risk for NCDs

including diabetes mellitus type 2 (DM), coronary heart disease (CHD) and stroke compared to

Europeans [3]. South Asia has the highest number of diabetics worldwide and 50% of the adult

disease burden in South Asia is attributable to NCDs [4]. Developing countries, particularly Sri

Lanka, have not been spared [5]. It has been identified that recent lifestyle changes, mainly

nutritional factors, may be associated with the increasing prevalence of NCDs globally.

Therefore, it is vital to be able to quantify existing dietary habits and associated health

conditions. Because eating habits vary significantly among ethnic groups, it is not possible to

predict dietary patterns without reliable country-specific information. In the absence of sufficient

and relevant data on diet and obesity levels in South Asian countries, successful interventions to

manage diet associated NCDs would not be possible.

The increasing prevalence of obesity, diabetes and associated NCDs is a major public health

problem in South Asia. The problem is exacerbated by the ethnic susceptibility of South Asians

to NCDs, a rapidly ageing population, socioeconomic changes and the lack of resources to

2 Validity of dietary questionnaires in Sri Lankan adults and the association of dietary intake with obesity

intervene. Sri Lanka recorded 524 deaths per 100,000 from cardiovascular and cerebrovascular

disease, considerably higher than in many affluent countries such as the UK (427), USA (397),

Australia (308) and France (205) [6]. Ischemic heart disease (10.6%) and cerebrovascular

diseases (9.0%) are reported as the leading causes of death in Sri Lanka [7]. According to

mortality data, from 1981 to 2000, there was an exponential increase in hospitalization due to

NCDs in Sri Lanka and it was previously estimated that by 2010 there would be a 40%, 36% and

29% increase in hypertension, diabetes mellitus and ischemic heart disease, respectively [8].

Despite Sri Lanka having a very high prevalence of NCDs and associated mortality, little is

known about the causative factors for this health burden. It is widely believed that the global

NCD epidemic is associated with recent lifestyle changes, especially increased intake of calorie-

dense foods, saturated fatty acids, sugary drinks, refined carbohydrates and lower intake of fruit

and vegetables [9].

In the UK, the National Diet and Nutrition Survey (NDNS) showed a very strong association

between diet and NCDs in adults [10]. The Sri Lankan Nutrition Survey was conducted in 1975,

however the main concern at that time was under-nutrition and protein-energy malnutrition in

children [11]. STEP survey findings noted a number of risk factors associated with NCDs in an

urban province in Sri Lanka, namely smoking, physical inactivity and low fruit and vegetable

intake [12]. The authors were unable to identify specific causes for NCD risk, possibly due to a

lack of comprehensive information on dietary habits. It is believed that the high prevalence and

incidence of NCDs is associated with the Sri Lankan population’s dietary practices. This is the

first diet and nutrition survey in Sri Lanka.

In Sri Lanka, diet-related chronic diseases currently account for 18.3% of all deaths and 16.7%

of hospital expenditure [13]. Despite consensus that diet plays a major role in the epidemic of

NCDs in Sri Lanka, nutritional interventions are far beyond the scope of the current capacity in

the country. Firstly, there are very few nutrition or dietetic experts in Sri Lanka and no dietetic

3

or clinical nutrition training available in the educational system therefore advice to the

population is minimal. Secondly, Sri Lanka has never conducted a food consumption survey due

to the absence of a validated dietary assessment tool and the necessary resources, and no cross-

sectional nutritional information is currently available on dietary habits and associated NCDs in

the country [14]. In addition, the cultural and ethnic diversity of the population may also affect

lifestyle considerably.

On the other hand, dietary diversity also affects disease status. All people need a variety of foods

to meet requirements for essential nutrients, and the value of a diverse diet has long been

recognized [15]. Traditionally, dietary diversity was linked to under-nutrition. There is very

limited evidence on the association between diet diversity and NCDs [16].

Different nutritional assessment tools are commonly used for dietary surveys in many countries,

including the 7-day weighed food approach widely used in the UK [10]. However, the approach

is costly and associated with significant participant burden. On the other hand, various Food

Frequency Questionnaires (FFQs) have been widely used and are recognized as reliable and

suitable for dietary assessment at the population level [17]. The FFQ is the most common dietary

assessment tool used in large epidemiologic studies of diet and health [18]. FFQs assess energy

and/or nutrient intake by determining how frequently a person consumes a limited number (100-

150) of foods which are the main sources of nutrients or of a particular dietary component in

question [19]. Respondents indicate how many times a day, week, month, or year they usually

consume the food items [20]. In some FFQs, standard portion sizes are used but not in all. For

example, an Australian FFQ included photographs of important portion sizes [21]. The strengths

of FFQs are: 1) a modest demand on time and energy of respondents; 2) relatively easy to

administer; 3) some are self-administered and machine readable and thus are relatively

economical to use in large-scale studies [18]. The main limitations of FFQs are that they limit

food lists to 100-150 items even though free-living individuals could be consuming more than

4 Validity of dietary questionnaires in Sri Lankan adults and the association of dietary intake with obesity

this number [22]. Similarly, limiting portion sizes may confuse some respondents. Another

limitation is reliance on the ability of respondents to explain their diet [23]. Despite these

limitations, the FFQ has been used in the US to collect nutritional intake and is considered the

method of choice for research on diet-disease relationships [24]. However, as foods vary by

culture and region, culture- or region-specific FFQs have been developed. The culture- or

region-specific FFQ consists of a list of foods eaten commonly in a particular country or by a

particular population, each food’s commonly eaten portion size and the reported intake

frequency. The FFQ food list typically explains 80–90% of the variability in the nutrients of

interest [18].

Developing a region-specific FFQ would be particularly helpful to identify high diet-related

disease status in Sri Lankan adults and would greatly assist in planning for the conduct of a

national level cross-sectional survey in 2014-2015. Developing the food item list from a

representative population is vital. A restricted food list may not be able to capture the full

variability of the Sri Lankan diet, which includes a variety of foods, ingredients, cooking

practices and brands. In this study, as energy, macro-nutrients and selected micro-nutrients will

be measured it is crucial to establish a comprehensive food list. To ensure that data are

representative of the population for whom the FFQ will be developed, large, representative,

randomly-selected samples are needed.

Public health promotion efforts aimed at overweight and obesity prevention often proceed from

the assumption that most individuals prefer to be thin, and that the first step in motivating

individuals to lose weight and associated health risk is to raise awareness of weight status among

those who are overweight [25]. This approach may be fitting for Western populations that value

thinness in women and lean, muscular physiques in men, and educated societies where

abdominal obesity may considered as a risk factor for metabolic problems such as diabetes.

However, this assumption may not be appropriate for South Asians where body size preference

5

may differ. In most non-Western cultures it is recognized that large bodies in both males and

females are associated with wealth and health [26]. That culture influences weight perception

preference has been the rationale for many studies researching the association between weight

perception and obesity among different ethnic groups. However, many of the studies have either

focused on minority immigrant populations in affluent countries [27] or primarily adolescent age

groups [26]. Results from these two groups may not represent the association between weight

perception and obesity in adults in South Asian countries where obesity has now reached an

epidemic level.

In summary, it is evident Sri Lanka is facing a significant health burden due to diet-related

NCDs. However, large nutritional interventions are far beyond the current capacity of the

country. Sri Lanka has never conducted a food consumption survey mainly due to the absence of

a validated dietary assessment tool and resources. Therefore, there are no available cross-

sectional nutritional data on dietary habits and associated NCDs in Sri Lanka. There is a

considerable cultural and ethnic diversity which may be associated with the dietary intake of the

population. Secondly, the associations between obesity, diet and behaviour, including weight

perception, is an unexplored area of interest.

6 Validity of dietary questionnaires in Sri Lankan adults and the association of dietary intake with obesity

AIMS AND OBJECTIVES

To address the research questions, this research project was separated into two parts. Part 1

comprised a cross-sectional study to obtain details of dietary habits of Sri Lankan adults. In

addition to nutritional data, anthropometric and behavioural data were collected. Validating a

dietary tool necessitated a separate study sample. Part 2 therefore, investigated the validity of the

dietary questionnaire against a reference method in a representative sample.

The aims and objectives for each phase are listed below. These aims and objectives are based on

gaps in existing knowledge identified from the literature which will be discussed in the

respective chapters.

Part 1

1. To identify food consumption according to servings in Sri Lankan adults.

2. To develop a FFQ for Sri Lankan adults to measure habitual dietary intake.

3. To assess the intakes of energy, macro-nutrients and selected other nutrients with respect

to socio-demographic characteristics and the nutritional status of Sri Lankan adults

focusing on diet-related metabolic chronic disease.

4. To explore the association of diet diversity with obesity in Sri Lankan adults.

5. To assess self-perception of body weight among Sri Lankan adults.

Part 2

1. To assess the validity of a newly developed FFQ to estimate nutrient intake compared

with a reference method.

7

THESIS ORIENTATION

This program of research is presented as a Thesis by Publication (Table 1 below). Nine

manuscripts (six published, two in press, one under review) are included as components of the

chapters in this thesis. All manuscripts have been accepted in, or submitted to, international

peer-reviewed journals. Each manuscript is written in the conventional style for the journal,

including reference style and spelling. As each manuscript is designed to stand alone, there is an

inevitable degree of overlap in their Introduction, Methods and Discussion sections.

The first two chapters incorporate the literature review for this thesis. South Asia is home to

almost one quarter of the world’s population. With the rapid emergence of obesity in the region,

an increasing body of evidence suggests that people originating from the Indian sub-continent,

including Sri Lanka, have a higher risk of type 2 diabetes, coronary heart disease and stroke

compared to Europeans. In addition, the socio-economic characteristics of the South-Asian

population are distinct from those seen in developed countries. South Asia has the highest

number of diabetes cases in the world. Therefore, the following section will further review the

current literature on obesity and diabetes in the region. Chapter 2 systematically evaluates the

scientific literature on the prevalence, trends and risk factors for diabetes in the South Asian

region. Manuscript 1 has been published (and tagged as “highly accessed”) in BMC Public

Health (2012). Similarly, Chapter 3 discusses the prevalence of overweight and obesity among

the adult population from individual countries in South Asia using the most recent representative

evidence and identifies and discusses the socio-economic factors associated with obesity in the

region. Chapter 3 is based on Manuscript 2, which has been accepted for publication (in press)

in Obesity Facts.

8 Validity of dietary questionnaires in Sri Lankan adults and the association of dietary intake with obesity

This research work is divided into two parts. Measurement of current food habits and obesity

among Sri Lankan adults comprises part 1, and the development and validation of a food

frequency questionnaire represents part 2. Chapter 4 includes a description of study design,

details methodology and presents the results. This chapter also includes Manuscript 3, based on

part 1, which has been published in the journal, Public Health Nutrition (2012). Importantly,

Chapter 4 provides additional methodological details due to the limited ability to describe

methodology in the published manuscripts. Manuscript 4 reports on the methods used in part 2,

the FFQ. Chapter 5 subsequently presents the methodological details of the development of

Food frequency Questionnaire. Manuscript 4 has been published in the Nutrition Journal

(2012).

Chapter 6 presents the results of part 1. National diet and nutrition surveys provide valuable

information on a possible partial explanation for the health status and disease risk of the

population studied. Manuscript 5 reports on a dietary survey undertaken to assess the intakes of

energy, macronutrients and selected other nutrients with respect to socio-demographic

characteristics and nutritional status of Sri Lankan adults focusing on diet-related metabolic

chronic disease. Manuscript 5 has been accepted in BMC Research Notes and is currently in

press.

Chapter 7 provides details of current obesity level in Sri Lanka and the association with dietary

factors. This chapter includes Manuscripts 6 and 7. Prevalence of obesity among Sri Lankan

adults is reported briefly in manuscript 6. This manuscript has been published in the Asia Pacific

Journal of Public Health (2012). Manuscript 7 provides further detailed information regarding

the association of obesity and dietary diversity. This manuscript has been published (tagged as

“highly accessed”) in the BMC Public Health (2013).

Chapter 8 presents the body weight perception and weight loss practices among Sri Lankan

adults. This chapter discusses the self-perception of body weight and weight loss approaches

9

among Sri Lankan adults. Manuscript 8 has been published in Obesity Research and Clinical

Practice.

Development of the Food Frequency Questionnaire is reported in Chapter 9. Study 2 is

described in detail in this chapter including a description of the methods and presentation of

results. This chapter also includes Manuscript 9, based on the results of part 2, and has been

submitted to the Nutrition Journal.

Finally, Chapter 10 provides a synthesis of the study findings across the three manuscripts, and

discusses the study limitations, directions for future research and the public health and clinical

significance of the research findings.

Table 1-1. Thesis orientation

Section Chapters Manuscripts

Introduction 1 N/A

Literature review 2, 3 1, 2

Methods 4, 5 3, 4

Results 6, 7, 8, 9 5,6,7,8,9

Discussion 10 N/A

N/A: not applicable

SIGNIFICANCE OF THE THESIS

The research and outcomes of this thesis are located within the priority field of nutrition and

obesity. Although the research was conducted among native Sri Lankan adults, many of the

findings can be generalized to native South Asians and South Asians living in other countries

such as Australia. Their significance is summarized in the following points.

10 Validity of dietary questionnaires in Sri Lankan adults and the association of dietary intake with obesity

1. This study was the first to develop and validate a FFQ for Sri Lankan adults using a

nationally representative sample. Dietary assessment of this population is invaluable to

understand the role of nutrition in chronic disease so that preventive strategies can be

implemented. The main weakness of the previous national level NCD survey in Sri

Lanka was the absence of nutritional data on the population and their relationship with

the high NCD risk in the country. One of the main objectives of the current work was to

develop a FFQ to administer in the next national level NCD survey. Moreover, this FFQ

could also be used to assess dietary habits of Sri Lankans living in other countries, as

they practice similar eating patterns to native Sri Lankans.

2. Most Sri Lankan meals are mixed dishes. We described a method to translate a mixed

meal to food group categories. Food which is a mixture of several food types was

systematically disaggregated before ingredients were categorized into appropriate food

groups. Decisions were then made about the point at which to stop the disaggregation

process so that foods or their ingredients could be tabulated in the appropriate food

groups. This study provided the first national estimate of energy and nutrient intake of

the Sri Lanka adult population. It is evident that consumption of high levels of

carbohydrate, fat mainly from saturated sources, low protein, low dietary fiber and high

levels of sodium may have detrimental effects on health and be related to the current

epidemic of NCDs.

3. This thesis is the first to report on dietary habits and nutrient intake of Sri Lankans.

Excess consumption of starchy foods but inadequate intake of dairy products, fruit and

vegetables may be associated with higher prevalence of diet associated NCDs. Dietary

diversity and variety have long been recognized as key elements of high quality diets.

Moreover, this thesis reports on a positive association between high dietary diversity and

11

obesity among Sri Lankan adults. Increased dietary diversity in health promotion may

not be appropriate for combating obesity epidemic in Sri Lanka.

4. The prevalence of obesity has reached epidemic levels in many parts of the world and Sri

Lanka is no exception. During the last two decades the level of obesity has increased

substantially in Sri Lanka. We found nearly a quarter of Sri Lankan adults are obese.

Although obesity levels have reached epidemic proportions, body weight misperception

was common among Sri Lankan adults. Two-thirds of overweight males and 45% of

females considered themselves as ‘about right weight’. Over one-third of both male and

female obese subjects perceived themselves as ‘about right weight’ or ‘underweight’.

12 Validity of dietary questionnaires in Sri Lankan adults and the association of dietary intake with obesity

REFERENCE LIST

1. Muller, O. and M. Krawinkel, Malnutrition and health in developing countries. Canadian

Medical Association Journal, 2005. 173(3): p. 279. 2. James, P.T., et al., The worldwide obesity epidemic. Obes Res, 2001. 9 Suppl 4: p. 228S-

233S. 3. Misra, A. and L. Khurana, Obesity-related non-communicable diseases: South Asians vs

White Caucasians. International Journal of Obesity, 2010. 4. Ghaffar, A., K. Reddy, and M. Singhi, Burden of non-communicable diseases in South

Asia. British Medical Journal, 2004. 328(7443): p. 807. 5. Misra, A. and L. Khurana, Obesity and the metabolic syndrome in developing countries.

Journal of Clinical Endocrinology & Metabolism, 2008. 93(11_Supplement_1): p. s9. 6. Abeywardena, M., Dietary fats, carbohydrates and vascular disease: Sri Lankan

perspectives. Atherosclerosis, 2003. 171(2): p. 157. 7. Jayasekara, R. and T. Schultz, Health status, trends, and issues in Sri Lanka. Nursing &

Health Sciences, 2007. 9(3): p. 228-233. 8. Premaratne, R., A. Amarasinghe, and A. Wickremasinghe, Hospitalisation trends due to

selected non-communicable diseases in Sri Lanka, 2005–2010. Ceylon Medical Journal, 2005. 50(2): p. 51.

9. WHO. Diet. Global Strategy on Diet, Physical Activity & Health 2010 2010 [cited 2010 9/10]; Available from: http://www.who.int/dietphysicalactivity/diet/en/index.html.

10. Henderson, L., J. Gregory, and G. Swan, The national diet & nutrition survey: Adults aged 19 to 64 years2003: Stationery Office.

11. Brink, E.W., et al., Sri Lanka Nutrition Status Survey, 1975. International Journal of Epidemiology, 1978. 7(1): p. 41-47.

12. Somatunga, L.C., NCD Risk Factor Survey in Sri Lanka (STEP Survey), 2004, WHO. 13. Popkin B.M., H.S., Kim S.,, The Nutritional Transition and Diet-Related Chronic

Diseases in Asia: Implications for Prevention. Washington, DC: International Food Policy Research Institute FCND Discussion Paper, 2001. 105.

14. FAO, FAO-Nutrition Country Profiles, 1999, Food and Agriculture organization of the United Nations Rome.

15. Ruel, M., Operationalizing dietary diversity: a review of micronutrient issues and research priorities. J Nutr, 2003. 133: p. 3911 - 3926.

16. Kennedy, G., M. Pedro, and C. Seghieri, Dietary diversity score is a useful indicator of micronutrient intake in Non-Breast-Feeding Filipino children. J Nut, 2007. 137: p. 472 - 477.

17. Cade, J., et al., Food-frequency questionnaires: a review of their design, validation and utilisation. Nutrition research reviews, 2004. 17(01): p. 5-22.

18. Willett, W., Nutrition Epidemiology. 2 ed1998, NEW YORK: Oxford University Press. 19. Subar, A.F., et al., Improving Food Frequency Questionnaires: A Qualitative Approach

Using Cognitive Interviewing. Journal of the American Dietetic Association, 1995. 95(7): p. 781-788.

20. Block, G., Human dietary assessment: methods and issues. Preventive Medicine, 1989. 18(5): p. 653-660.

21. Victoria, C.C. Dietary questionnaires. 2010; Available from: http://www.cancervic.org.au/about-our-research/epidemiology/nutritional_assessment_services.

13

22. Iqbal, R., et al., Refinement and validation of an FFQ developed to estimate macro-and micronutrient intakes in a south Indian population. Public Health Nutrition, 2009. 12(01): p. 12-18.

23. Mullen, B., et al., Validity of a food frequency questionnaire for the determination of individual food intake. American Journal of Clinical Nutrition, 1984. 39(1): p. 136.

24. Centers for Disease Control and Prevention. NHANES III. 2010; Available from: http://www.cdc.gov/nchs/nhanes/nh3data.htm.

25. Wammes, B., et al., The impact of a national mass media campaign in The Netherlands on the prevention of weight gain. Public Health Nutrition, 2005. 8(08): p. 1250-1257.

26. Becker, A.E., S.E. Gilman, and R.A. Burwell, Changes in Prevalence of Overweight and in Body Image among Fijian Women between 1989 and 1998**. Obesity Research, 2005. 13(1): p. 110-117.

27. Brener, N.D., et al., The Association between Weight Perception and BMI among High School Students. Obesity, 2004. 12(11): p. 1866-1874.

14 Validity of dietary questionnaires in Sri Lankan adults and the association of dietary intake with obesity

Chapter 2: Manuscript 1

Contribution of co-authors for thesis by published paper The authors listed below have certified that

1. They meet the criteria for authorship in that they have participated in the conception, execution, or interpretation, of at least that part of the publication in their field o expertise:

2. They take public responsibility for their part of the publication, except for the responsible author who accepts overall responsibility for the publication;

3. There are no other authors of the publication according to these criteria; 4. Potential conflicts of interest have been disclosed to (a) granting bodies, (b) the editor or publisher of

journals or other publications, and (c) the head of the responsible academic unit, and 5. They agree to the use of the publication in the student’s thesis and its publication on the Australasian

Digital Thesis database consistent with any limitations set by publisher requirements.

In the case of this chapter Paper: Prevalence and trends of the diabetes epidemic in South Asia: a systematic review and meta-analysis Contributor Statement of contribution Ranil Jayawardena Study design, data collection, data analysis

and drafted the manuscript Priyanga Ranasinghe Study design and data collection. Nuala Byrne Study design, data interpretation and revision

of the draft and approved the final manuscript.

Mario Soares Study design, data interpretation and revision of the draft and approved the final manuscript.

Prasad Katulanda Study design, data interpretation and revision of the draft and approved the final manuscript.

Andrew Hills Study design, data interpretation and revision of the draft and approved the final manuscript.

Principal supervisor confirmation I have sighted email or other correspondence from all co-authors confirming their certifying

authorship.

Nuala Byrne 18/04/2013

Name signature Date

15

TITLE PAGE

Prevalence and trends of the diabetes epidemic in South Asia: a systematic

review and meta-analysis

Ranil Jayawardena1,2*, Priyanga Ranasinghe2,3, Nuala M. Byrne1, Mario J. Soares4, Prasad

Katulanda2, Andrew P. Hills5

1- Institute of Health and Biomedical Innovation, Queensland University of Technology,

Brisbane, Queensland, Australia

2- Diabetes Research Unit, Department of Clinical Medicine, Faculty of Medicine, University of

Colombo, Colombo, Sri Lanka

3- Department of Pharmacology, Faculty of Medicine, University of Colombo, Colombo, Sri

Lanka

4- Curtin Health Innovation Research Institute, School of Public Health, Curtin University,

Perth, Australia

5- Mater Mothers’ Hospital, Mater Medical Research Institute and Griffith Health Institute,

Griffith University, Brisbane, Queensland, Australia.

Citation

R Jayawardena, P Ranasinghe, NM Byrne, MJ Soares, P Katulanda, AP Hills (2012) Prevalence

and trends of the diabetes epidemic in South Asia: a systematic review and meta-analysis. BMC

Public Health 12:380

16 Validity of dietary questionnaires in Sri Lankan adults and the association of dietary intake with obesity

ABSTRACT

Background: Diabetes mellitus has reached epidemic proportions worldwide. South Asians are

known to have an increased predisposition for diabetes which has become an important health

concern in region. We discuss the prevalence of pre-diabetes and diabetes in South Asia and

explore the differential risk factors reported.

Methods: Prevalence data was obtained by searching the Medline® database with; ‘prediabetes’

and ‘diabetes mellitus’ (MeSH major topic) and ‘Epidemology/EP’ (MeSH subheading). Search

limits were articles in English, between 01/01/1980-31/12/2010, on human adults (≥19 years).

The conjunction of the above results was narrowed down with country names.

Results: The most recent reported prevalence of pre-diabetes:diabetes in regional countries

were; Bangladesh–4.7%:8.5% (2004-2005;Rural), India–4.6%:12.5% (2007;Rural); Maldives–

3.0%:3.7% (2004;National), Nepal–19.5%:9.5% (2007;Urban), Pakistan–3.0%:7.2%

(2002;Rural), Sri Lanka–11.5%:10.3% (2005-2006;National). Urban populations demonstrated a

higher prevalence of diabetes. An increasing trend in prevalence of diabetes was observed in

urban/rural India and rural Sri Lanka. The diabetes epidemicity index decreased with increasing

prevalence of diabetes in respective countries. A high epidemicity index was seen in Sri Lanka

(2005/2006–52.8%), while for other countries, the epidemicity index was comparatively low

(rural India 2007-26.9%; urban India 2002/2005–31.3%, and urban Bangladesh–33.1%). Family

history, urban residency, age, higher BMI, sedentary lifestyle, hypertension and waist-hip ratio

were associated with an increased risks of diabetes.

Conclusion: A significant epidemic of diabetes is present in the South Asian region with a rapid

increase in prevalence over the last two decades. Hence there is a need for urgent preventive and

curative strategies .

Keywords: Diabetes Mellitus; South Asia; epidemiology; prevalence; trends; risk factors

17

BACKGROUND

Diabetes mellitus has reached epidemic proportions worldwide, placing a substantial burden on

healthcare services. Historically, diabetes was considered a disease confined to developed

countries and affluent people. However, recent estimates suggest that the prevelence of diabetes

is rising globally, particularly in developing countries [1]. South Asia, commonly known as the

Indian sub-continent, is home to almost one-quarter of the world’s population and is comprised

of many diverse ethnic, linguistic and religious groups. India, Pakistan, Bangladesh, Nepal, Sri

Lanka, Bhutan and Maldives are the countries of the region. South Asians are known to have an

increased predisposition for Type 2 diabetes [2]. In addition to the large population living in

South Asia, a significant number of immigrants from the region are living in affluent Western

nations. For example, the 2001 UK census reported that around 4.0% (2.3 million) of the

country’s total population were of South Asian origin [3]. As a consequence, a disease such as

Type 2 diabetes affecting the ethnic South Asian sub-population will have potential implications

for global health.

Diabetes mellitus has become an important health concern in the South Asian region with an

estimated increase in the prevalence of diabetes of over 151% between 2000 and 2030 [1].

Studies have consistently demonstrated that South Asians are at an increased risk of developing

diabetes in comparison to other ethnic groups [2]. In the UK, the risk of diabetes is five times

higher for immigrants from Pakistan and Bangladesh and three times higher for Indian

immigrants, with an associated increased risk of complications, morbidity and mortality

compared with the native white Caucasian population [4]. Furthermore, South Asian patients

with diabetes were younger and less obese compared to the native white Caucasians [4].

Progression of diabetes is also known to be more rapid among South Asians and Mukhopadhyay

et al. [5] reported that the decline in glycaemic control over time was much more rapid among

18 Validity of dietary questionnaires in Sri Lankan adults and the association of dietary intake with obesity

South Asians when compared to Europeans. Hence, it is apparent that diabetes among South

Asians represents a significant health concern with differential risk factors and a more

aggressive progression than in other ethnic groups.

Although there have been comprehensive reviews on diabetes in the Asian region [6], among

South Asians immigrants living in developed countries [7] and from individual South Asian

countries such as India [8], to date no studies have explored the prevalence and trends of the

diabetes epidemic for the region. The present study aims to discuss the prevalence of pre-

diabetes and diabetes among adults from individual countries in the South Asian region and

explore the differential factors reported to be associated with the development of diabetes in

these countries.

19

METHODS

The study was conducted in adherence to the PRISMA (Preferred Reporting Items for

Systematic Reviews and Meta-Analyse) guidelines and the PRISMA checklist is provided as a

Supplementary file (Additional File 1). Diabetes prevalence data among South Asian adults in

regional countries was obtained in a three-stage process. In the first stage a search of the online

Medline® database (Medical Literature Analysis and Retrieval System) was performed with a

combination of MeSH® (Medical Subject Headings) terms; ‘prediabetes’ and ‘diabetes mellitus’

where the MeSH major topic and ‘Epidemology/EP’ was the MeSH subheading. The search

limits were; language (‘English’), dates (between ‘1st January 1980’ and ‘31st December 2011’),

Species (‘Humans’) and age (‘all adults: 19+ years’). The conjunction of the above results were

narrowed down by adding the name of each regional country (India, Pakistan, Bangladesh, Sri

Lanka, Nepal, Bhutan and Maldives), South Asian and Indian Asians as key words. In the

second stage the total hits obtained from searching Medline® using the above search criteria were

screened by reading the ‘title’ and ‘abstract’. Studies not satisfying the inclusion criteria were

excluded at this stage. The studies selected for inclusion in stage two were further screened for

suitability during stage three by reading the selected manuscripts. At this stage studies were

excluded based on the following exclusion criteria: being confined to only a specific age group,

being hospital/clinic-based, studies reporting the results of larger studies as duplications and

studies conducted among South Asians residing elsewhere. To obtain additional data a manual

search was performed using the reference lists of selected articles. This process was conducted

by two independent reviewers and the final group of articles to be included in the review was

determined after an iterative consensus process among the reviewers.

20 Validity of dietary questionnaires in Sri Lankan adults and the association of dietary intake with obesity

For the purpose of describing prevalence data for the individual countries, the studies that were

most recent, nationally representative or with the largest sample size were included. For

meaningful comparisons of prevalence data among the countries, age-standardized data are

presented here, unless otherwise stated. Additional data not available in the published

manuscript such as gender and area-specific prevalence were obtained from corresponding

authors or calculated using available raw data. Area of residence and social status are key factors

determining the prevalence of diabetes; therefore, when exploring the secular trend in diabetes

prevalence it is meaningless to plot the prevalence data from studies based on different

populations. Hence, when evaluating secular trends we only considered studies that evaluated

the temporal change in prevalence between similar populations or prospective studies based on

the same population.

Presence of ‘diabetes mellitus’ in the individual studies was defined according to the World

Health Organization (WHO) or American Diabetes Association (ADA) criteria adopted at the

time of the respective studies. ‘Prediabetes’ was defined as the presence of Impaired Fasting

Glucose (IFG) or Impaired Glucose Tolerance (IGT) according to the above criteria. The

diabetes epidemicity index (a prognostic index of the diabetes epidemic in a population) was

defined as the ratio between the prevalence of IGT/IFG (pre-diabetes) and Total Glucose

Intolerance (TGI) (diabetes and pre-diabetes) i.e., the ‘diabetes epidemicity index’ is the

percentage of the TGI made up by IGT/IFG [9].

A meta-analysis of studies examining the risk factors associated with diabetes mellitus in South

Asian populations was conducted for parameters that were defined identically across studies.

Hence the meta-analysis was performed on the following clinical and biochemical parameters;

family history of diabetes, age, male gender, Body Mass Index (BMI), Waist-Hip Ratio (WHR),

21

Systolic Blood Pressure (SBP) and Diastolic Blood Pressure (DBP). A fixed effect analysis was

initially conducted for all comparisons. Heterogeneity was assessed using the χ2 test on

Cochrane’s Q statistic and by calculating I2. If significant heterogeneity was present (p<0.05

from χ2 test) a random effects meta-analysis was carried out. Data were analysed using RevMan

version 5.1.2 (Review Manager, Copenhagen: The Nordic Cochrane Centre, The Cochrane

Collaboration, 2011) statistical software package. In all analyses a p-value < 0.05 was

considered statistically significant.

RESULTS

The number of articles identified using the above methodology for individual South Asian

countries are summarized in Figure 1. However, we were unable to identify any published data

for Bhutan. The International Diabetes Federation’s estimated prevalence for diabetes in Bhutan

for 2010 was 3.6% [10].

Prevalence of diabetes and pre-diabetes

The prevalence of diabetes and pre-diabetes in the respective countries and the sample

characteristics are summarized in Table 1. We were able to identify studies evaluating the

prevalence of diabetes and pre-diabetes for each South Asian country however nationally

representative surveys were only available for India [11], Pakistan [12] and Sri Lanka [13]. Most

surveys reported the prevalence of pre-diabetes for all adults and both males and females,

however there is a considerable heterogeneity in the prevalence, depending on the country, area

of residence and study date. The Maldives STEP survey reported the lowest pre-diabetes

prevalence of 3.0% (M: 2.3%, F: 3.7%) despite being a relatively recent study conducted in an

urban population [14], and similar to results in rural Pakistan in 2002 [15]. The reported

22 Validity of dietary questionnaires in Sri Lankan adults and the association of dietary intake with obesity

prevalence of pre-diabetes elsewhere in South Asia also showed a wide variation from 4.1% in

urban India [16] to 19.5% in urban Nepal [17].

The prevalence of diabetes also demonstrated a wide variation among countries. In Bangladesh

no studies were based on a nationally representative sample, however, regional surveys in urban

and semi-urban populations showed a moderately high prevalence of diabetes (6.8%-10.5%) [18,

19]. In rural Bangladeshi populations the prevalence of diabetes which was 3.8% in 1999-2000

[20], had increased to 8.5% by 2004-2005 [21]. In India, many studies have explored the

prevalence of diabetes with estimates varying considerably between different geographical areas

and between urban and rural populations. The Prevalence Of Diabetes in India Study (PODIS)

reported an age-standardized prevalence of 4.3%, 4.4% and 4.5% for all adults, and males and

females, respectively [11]. However, more recent studies based on urban populations or rapidly

developing regions have reported a higher prevalence of diabetes (10.1%) [16, 22] while other

studies from rural Indian populations have demonstrated an even higher prevalence (12.5%-

13.2%) [23, 24].

Results from the STEPS survey conducted in urban Male, Maldives showed a 4.5%, 4.3% and

4.7% prevalence of diabetes in all adults, males and females, respectively [14]. A survey

conducted in urban Nepal between 2001 and 2002 showed that 10.8% and 13.2% of males

suffered from diabetes and pre-diabetes respectively, with the values for females being 6.9% and

10.2%, respectively [25]. According to the Pakistan National Diabetes Survey (PNDS), 9.3%

males and 11.1% females suffered from diabetes in 1995 [12] and a rural survey showed a

higher proportion of males were affected by diabetes (10.1%) but not females (4.3%) [15]. No

recent data are available to regarding the present situation and therefore explore current trends in

Pakistan. A nationally representative diabetes and pre-diabetes study in Sri Lanka showed that

the age-standardized prevalence of diabetes among Sri Lankan adults was 10.3% [males 9.8%,

23

females 10.9%, P>0.05][13], while a population-based survey conducted in four of the nine Sri

Lankan provinces reported a prevalence of 14.2% and 13.5% of diabetes among males and

females, respectively [26]. In 2000, a regional survey in a Sri Lankan suburb (Maharagama)

showed that 6.5% of all adults, 5.0% of males men and 6.6% of females were affected by

diabetes [27]. According to studies published in the last two decades regarding South Asia, the

prevalence of diabetes showed a wide variation between 3.8% [20] in rural Bangladesh to 13.9%

urban India [28] .

Prevalence of diabetes in South Asian urban and rural populations

The Maldives STEP survey was conducted in the country’s main commercial center, Male with

no prevalence data available for the rural sector [14]. National or regional studies from other

South Asian countries demonstrate a substantial difference in diabetes prevalence between urban

and rural populations with the prevalence consistently higher among urban residents (Table 2).

We evaluated the degree of difference between the respective urban and rural prevalence data by

calculating an Urban:Rural prevalence ratio. The ratio for Bangladesh was 3.5 [29], while for

India it varied from 1.2-2.4 [11, 30-33]. Pakistan demonstrates one of the lowest ratios of 1.4

[12], followed by Sri Lanka 1.9 [13]. Nepal demonstrated the highest ratio for urban and rural

difference in the prevalence of 5.8 [34].

Trends

Studies evaluating secular trends in the prevalence of diabetes and prediabetes were available

only for Bangladesh [18], India [35-39] and Sri Lanka [26, 27, 40, 41]. The prevalence of

diabetes in an urban Indian population has significantly increased from 8.3% in 1989 to 18.6%

in 2005, and during the same period a similar increase from 2.2% to 9.2% was observed in a

rural Indian population (p<0.001)[39]. Similarly, a study in Sri Lanka demonstrated that the age-

standardized prevalence of diabetes had significantly increased from 2.5% in 1990 to 8.5% in

24 Validity of dietary questionnaires in Sri Lankan adults and the association of dietary intake with obesity

2000 (p<0.01) in a rural community [40], with only a slight increase in urban Sri Lanka from

5.3% to 6.5% during the same period [27, 41]. These findings are summarized in Figure 2a. The

trends for the prevalence of pre-diabetes are not as definitive For example, the increased

prevalence observed in urban India in the period 1989 (8.3%) to 2000 (16.7%) had declined to

7.4% by 2006. Prevalence data in rural populations of India and Sri Lanka also showed a decline

in prevalence during a similar period (Figure 2b). An increase in the prevalence of pre-diabetes

has been observed among urban Bangladeshi populations during the last decade.

The diabetes epidemicity index

The temporal change in the diabetes epidemicity index and prevalence of diabetes in the regional

countries are shown in Figure 3. The epidemicity index decreases as the prevalence of diabetes

increases in the respective countries (an epidemicity index calculated as the percentage of total

glucose intolerance made up by impaired glucose tolerance) [9]. The most recent available data

suggests a high epidemicity index in Sri Lanka (2005/2006 – 52.8%) and urban India (54.3%),

while for other countries in the region for which recent data are available, the epidemicity index

is comparatively low (rural India 2007 – 37.7% and urban Bangladesh – 33.1%).

Risk factors

A forest plot of the studies evaluating risk factors associated with diabetes among South Asians

is shown in Figure 4. The pooled odds ratio from random effects analysis for family history is

2.75 (95% CI: 2.11, 3.58; p<0.001). The significant overall effect indicates that family history is

a significantly associated risk factor for diabetes (Figure 4a). The forest plot for age also shows a

similar distinct increase in risk of diabetes with increasing age (Figure 4b). Male gender does not

demonstrate a similar distinct pattern, the increased risk shown by several studies have been

contradicted by others (Figure 4c). The forest plot of SBP demonstrates a significant increase in

risk of diabetes with increasing SBP (Figure 4d). In contrast DBP does not show a similar

25

distinct pattern (Figure 4e). Increasing BMI (Figure 4f) and WHR (Figure 4g) were both

associated with a significantly increased risk of diabetes.

26 Validity of dietary questionnaires in Sri Lankan adults and the association of dietary intake with obesity

DISCUSSION

This is the first comprehensive report to systematically evaluate the scientific literature on the

prevalence, trends and risk factors for diabetes in the South Asian region. Prevalence, based on

the most recent national surveys in the countries of the region were; 4.5% in Maldives (2004)

[14], 4.3% in India (1999-2002) [11], 8.7% (1995) in Pakistan (1995) [12] and 10.3% in Sri

Lanka (2005-2006) [13]. However, it is noteworthy that more recently published data from India

indicates a much higher prevalence of 9.2% (rural) and 18.6% (urban) in 2006 [39]. In addition,

recent reports also highlight a secular increase in prevalence in the region. Hence, it is apparent

that despite the differences in methodology, diagnostic criteria and age of subjects studied, the

region is facing an epidemic of diabetes. This is more evident when the observed prevalence is

compared with available data from other regions (Table 3), with observed prevalence

comparable to recent global and regional estimates by the International Diabetes Federation

(2011) [10].

The increased prevalence of diabetes in the South Asian region could be attributed to regional

changes in disease patterns from communicable to non-communicable diseases [42]. The reasons

attributed to this shift in disease pattern include: increased life expectancy, rapid population

growth, unplanned urbanization, low literacy and increased external debt with resultant cutbacks

on national healthcare expenditure [42]. Collectively, these and related issues have contributed

to the emergence of non-communicable diseases such as diabetes as a substantial regional health

problem. This so-called ‘epidemiological transition’ could also be linked to the rapid

industrialization occurring in the region as evidenced by the high prevalence of diabetes among

urban residents [43]. It is important to note that this epidemiologic transition and the rate of

increase in non-communicable diseases such as diabetes in developing countries is far greater

than that previously observed in high income countries, and hence there is a need to find

27

solutions a much shorter time frame and with far fewer resources [44]. Recent national level data

from Maldives indicates a very low prevalence of both diabetes and pre-diabetes despite

approximately two-thirds of the population being overweight, the highest in the region [14]. The

Maldives is an island nation in the Indian Ocean and relatively isolated from the rest of the

region, and with an economy based on tourism and the fishing industry. Hence it is debatable

whether diabetes in the Maldives presents as a different disease entity compared to the rest of the

South Asian region or differential exposure to risk factors/healthy lifestyles have resulted in a

low prevalence. This difference merits further investigation.

The high prevalence of pre-diabetes observed in many South Asian countries highlights a

potential indicator of further progression of the epidemic in the region. The combined prevalence

of diabetes and prediabetes (IGT/IFG), i.e. total glucose intolerance (TGI), may serve as a useful

measure of the public health impact of the epidemic. It has also been postulated that the

‘diabetes epidemicity index’ (% of the TGI made up by IGT/IFG) has a predictive value in

determining the stage of an epidemic of glucose intolerance in a given population [9]. Our

results also bear evidence to this fact as demonstrated by the decrease in the ‘epidemicity index’

in the different countries with progressive secular increase in the frequency of diabetes increases

(Figure 3). Hence with the prevalent diabetes epidemic in the region at present the recent

‘epidemicity indices’ for most regional countries are relatively low. However, it is noteworthy

that the present prevalent epidemic in the region had been preceded by a high ‘epidemicity

index’. Hence strategies aimed at primary prevention could be helpful to ameliorate a further

increase in the diabetes epidemic in populations such as Sri Lanka where recent data shows a

high prevailing ‘epidemicity index’.

28 Validity of dietary questionnaires in Sri Lankan adults and the association of dietary intake with obesity

Family history, age, male gender, BMI, WHR, systolic and diastolic blood pressure were

significant risk factors for diabetes among South Asians. In addition, few studies have also

demonstrated an association between diabetes and wealth/income [19, 24, 36, 45],

hypercholesterolemia [24], physical inactivity [19, 32, 37, 45], the presence of acanthosis

nigricans [16], graduate education [39] and office-based occupation [45]. A meta-analysis could

not be performed for these risk factors due to the limited number of studies or due to variations

in definitions/classifications of risk factors between studies. The recent epidemic of diabetes in

the region could be primarily due to environmental factors such as diet and physical activity

levels coupled with a genetic predisposition [7, 46]. The strong evidence for the association

between diabetes and family history highlights a genetic contribution the prevalent epidemic

[47]. In addition, in this ethnically diverse population, increasing age and body weight have also

been demonstrated as important contributory factors. This is evident by the association between

diabetes and increasing BMI, waist-hip ratio and abdominal obesity [16, 21, 24, 45]. This may

be the cause of the high susceptibility for diabetes and other metabolic abnormalities among

South Asians [7].

People in South Asia have faced under-nutrition for many generations; they are born smaller

however coupled with subsequent obesity increases risk for insulin resistance syndrome in later

life [48]. A recent review has reported several dietary factors associated with insulin resistance

among South Asians, such as higher intakes of carbohydrate, saturated fatty acids, trans-fatty

acids and n-6 PUFA, and lower intakes of n-3 PUFA and fiber, hence the Asian diet may be an

important contributory factor for the high disease prevalence [46]. During recent years

urbanization has risen unprecedentedly in the South Asian region [42]. There are unhealthy

lifestyle changes that are known to be associated with urbanization such as the lack of physical

activity, changes in dietary habits and stress, all of which increases the risk of diabetes, as

29

evident by the association shown in many South Asian studies. Rural-to-urban migration was

also found to be a major risk factor for diabetes and obesity among South Asians [33]. Migrants

changed their lifestyles considerably within a decade and physical activity status quickly reached

urban levels acquiring a metabolic risk similar to that of urban dwellers [33]. Furthermore, our

results also highlight that the levels are also rising in rural South Asian communities [38, 40].

Increased mechanization of the agriculture industry, automation of daily activities,

popularization of television and increased computer usage in rural areas are leading to changes

in lifestyle with resultant decrease in physical activity.

An intra-urban disparity in the prevalence of diabetes has also been reported in India [49]. In

contrast to developed countries, socially-deprived urban South Asians reported relatively lower

prevalence of diabetes and general obesity compared to their affluent counterparts [4].

Ramachandran et al. reported that age-standardized prevalence of diabetes and impaired glucose

tolerance were significantly lower in the low income urban dwellers compared to an affluent

group in a similar residential area [36]. This observation could be partly explained by the

differential purchasing ability with the affluent having a higher ability to purchase food,

increasing energy intake and obesity; while on the other hand, the less affluent people are more

likely to engage in manual labour increasing their physical activity level. However, socially

deprived diabetes patients demonstrate a poor glycaemic control, which is likely to be lack of

access to proper health care facilities and relative lack of knowledge.

There were several limitations identified in the studies that this review is based upon; all South

Asian prevalence studies reported the prevalence of diabetes with no distinction made between

the different types of diabetes. Therefore this data could represent a sum of both types 1 and 2

diabetes. However, unlike in Europe, South Asians have a considerably lower level of type-1

30 Validity of dietary questionnaires in Sri Lankan adults and the association of dietary intake with obesity

diabetes (1-2%) and thus these prevalence data closely resemble the total prevalence of type 2

diabetes [1]. In addition, all studies included in our review were community-based surveys.

Hence, this data may be an underestimate of the true regional burden, since a significant

proportion of patients with diabetes may well be admitted in hospitals and care centers.

Moreover, some studies have reported the prevalence of only known diabetes. The definitions

and diagnostic criteria have also changed over the last two decades influencing prevalence rates.

However, for the purpose of describing prevalence data for the individual countries the studies

that were most recent were included. Hence the variations in diagnostic criteria are likely to be

minimal as older studies were excluded. In addition when evaluating secular trends (Figure 2)

we have used studies that were on the same population and used the same diagnostic criteria.

The definition of pre-diabetes also varies between studies, with some studies using only IFG [16,

50], some IGT [31, 36] and some using both [13]. There is also a heterogeneity in analytical

methods as some studies applied capillary blood and glucometers whereas others used venous

blood and sophisticate biochemical analysis.

CONCLUSIONS

In conclusion, our review highlights a significant epidemic of diabetes in the South Asian region

with a rapid increase in prevalence over the last two decades. It is evident that several modifiable

and non-modifiable risk factors play an important role in the pathogenesis of diabetes among

South Asians. Hence there is a need for urgent preventive and curative strategies to be

implemented.

31

REFERENCES

1. Wild S, Roglic G, Green A, Sicree R, King H: Global Prevalence of Diabetes. Diabetes

Care 2004, 27:1047-1053.

2. Mather HM, Keen H: The Southall Diabetes Survey: prevalence of known diabetes in

Asians and Europeans. Br Med J (Clin Res Ed) 1985, 291:1081-1084.

3. UK population: by ethnic group: Census update

[http://www.statistics.gov.uk/statbase/ssdataset.asp?vlnk=6588&More=Y]

4. Health Survey for England: The health of minority ethnic groups ’99. In Book The

health of minority ethnic groups ’99 (Editor ed.^eds.). City; 2001.

5. Mukhopadhyay B, Forouhi NG, Fisher BM, Kesson CM, Sattar N: A comparison of

glycaemic and metabolic control over time among South Asian and European

patients with Type 2 diabetes: results from follow-up in a routine diabetes clinic.

Diabetic Medicine 2006, 23:94-98.

6. Ramachandran A, Wan Ma RC, Snehalatha C: Diabetes in Asia. The Lancet 2010,

375:408-418.

7. Barnett A, Dixon A, Bellary S, Hanif M, O’hare J, Raymond N, Kumar S: Type 2

diabetes and cardiovascular risk in the UK south Asian community. Diabetologia

2006, 49:2234-2246.

8. Mohan V, Sandeep S, Deepa R, Shah B, Varghese C: Epidemiology of type 2 diabetes:

Indian scenario. Indian J Med Res 2007, 125:217-230.

9. Dowse GK, Zimmet PZ, King H: Relationship between prevalence of impaired

glucose tolerance and NIDDM in a population. Diabetes Care 1991, 14:968-974.

10. International Diabetes Federation: The Diabetes Atlas. Fifth edn. Brussels: International

Diabetes Federation; 2011.

11. Sadikot SM, Nigam A, Das S, Bajaj S, Zargar AH, Prasannakumar KM, Sosale A,

Munichoodappa C, Seshiah V, Singh SK, et al: The burden of diabetes and impaired

glucose tolerance in India using the WHO 1999 criteria: prevalence of diabetes in

India study (PODIS). Diabetes Res Clin Pract 2004, 66:301-307.

12. Shera AS, Jawad F, Maqsood A: Prevalence of diabetes in Pakistan. Diabetes Res Clin

Pract 2007, 76:219-222.

13. Katulanda P, Constantine GR, Mahesh JG, Sheriff R, Seneviratne RD, Wijeratne S,

Wijesuriya M, McCarthy MI, Adler AI, Matthews DR: Prevalence and projections of

32 Validity of dietary questionnaires in Sri Lankan adults and the association of dietary intake with obesity

diabetes and pre-diabetes in adults in Sri Lanka--Sri Lanka Diabetes,

Cardiovascular Study (SLDCS). Diabet Med 2008, 25:1062-1069.

14. Aboobakur M, Latheef A, Mohamed AJ, Moosa S, Pandey RM, Krishnan A,

Prabhakaran D: Surveillance for non-communicable disease risk factors in Maldives:

results from the first STEPS survey in Male. Int J Public Health 2010, 55:489-496.

15. Basit A, Hydrie MZ, Ahmed K, Hakeem R: Prevalence of diabetes, impaired fasting

glucose and associated risk factors in a rural area of Baluchistan province

according to new ADA criteria. J Pak Med Assoc 2002, 52:357-360.

16. Menon VU, Kumar KV, Gilchrist A, Sugathan TN, Sundaram KR, Nair V, Kumar H:

Prevalence of known and undetected diabetes and associated risk factors in central

Kerala--ADEPS. Diabetes Res Clin Pract 2006, 74:289-294.

17. Ono K, Limbu YR, Rai SK, Kurokawa M, Yanagida J, Rai G, Gurung N, Sharma M, Rai

CK: The prevalence of type 2 diabetes mellitus and impaired fasting glucose in semi-

urban population of Nepal. Nepal Med Coll J 2007, 9:154-156.

18. Rahim MA, Hussain A, Azad Khan AK, Sayeed MA, Keramat Ali SM, Vaaler S: Rising

prevalence of type 2 diabetes in rural Bangladesh: a population based study.

Diabetes Res Clin Pract 2007, 77:300-305.

19. Sayeed MA, Mahtab H, Khanam PA, Latif ZA, Banu A, Khan AK: Prevalence of

diabetes and impaired fasting glucose in urban population of Bangladesh.

Bangladesh Med Res Counc Bull 2007, 33:1-12.

20. Sayeed MA, Mahtab H, Akter Khanam P, Abdul Latif Z, Keramat Ali SM, Banu A,

Ahren B, Azad Khan AK: Diabetes and impaired fasting glycemia in a rural

population of Bangladesh. Diabetes Care 2003, 26:1034-1039.

21. Rahman MM, Rahim MA, Nahar Q: Prevalence and risk factors of type 2 diabetes in

an urbanizing rural community of Bangladesh. Bangladesh Med Res Counc Bull

2007, 33:48-54.

22. Ajay VS, Prabhakaran D, Jeemon P, Thankappan KR, Mohan V, Ramakrishnan L, Joshi

P, Ahmed FU, Mohan BV, Chaturvedi V, et al: Prevalence and determinants of

diabetes mellitus in the Indian industrial population. Diabet Med 2008, 25:1187-

1194.

23. Chow CK, Raju PK, Raju R, Reddy KS, Cardona M, Celermajer DS, Neal BC: The

prevalence and management of diabetes in rural India. Diabetes Care 2006, 29:1717-

1718.

33

24. Vijayakumar G, Arun R, Kutty VR: High prevalence of type 2 diabetes mellitus and

other metabolic disorders in rural Central Kerala. J Assoc Physicians India 2009,

57:563-567.

25. Shrestha UK, Singh DL, Bhattarai MD: The prevalence of hypertension and diabetes

defined by fasting and 2-h plasma glucose criteria in urban Nepal. Diabet Med 2006,

23:1130-1135.

26. Wijewardene K, Mohideen MR, Mendis S, Fernando DS, Kulathilaka T, Weerasekara D,

Uluwitta P: Prevalence of hypertension, diabetes and obesity: baseline findings of a

population based survey in four provinces in Sri Lanka. The Ceylon medical journal

2005, 50:62-70.

27. Malavige G, de Alwis N, Weerasooriya N, Fernando D, Siribaddana S: Increasing

diabetes and vascular risk factors in a sub-urban Sri Lankan population. Diabetes

research and clinical practice 2002, 57:143-145.

28. Ramachandran A, Snehalatha C, Satyavani K, Vijay V: Impaired fasting glucose and

impaired glucose tolerance in urban population in India. Diabet Med 2003, 20:220-

224.

29. Hussain A, Rahim MA, Azad Khan AK, Ali SMK, Vaaler S: Type 2 diabetes in rural

and urban population: diverse prevalence and associated risk factors in

Bangladesh. Diabetic Medicine 2005, 22:931-936.

30. Singh RB, Bajaj S, Niaz MA, Rastogi SS, Moshiri M: Prevalence of type 2 diabetes

mellitus and risk of hypertension and coronary artery disease in rural and urban

population with low rates of obesity. Int J Cardiol 1998, 66:65-72.

31. Zargar AH, Khan AK, Masoodi SR, Laway BA, Wani AI, Bashir MI, Dar FA:

Prevalence of type 2 diabetes mellitus and impaired glucose tolerance in the

Kashmir Valley of the Indian subcontinent. Diabetes Res Clin Pract 2000, 47:135-

146.

32. Mohan V, Mathur P, Deepa R, Deepa M, Shukla DK, Menon GR, Anand K, Desai NG,

Joshi PP, Mahanta J, et al: Urban rural differences in prevalence of self-reported

diabetes in India--the WHO-ICMR Indian NCD risk factor surveillance. Diabetes

Res Clin Pract 2008, 80:159-168.

33. Ebrahim S, Kinra S, Bowen L, Andersen E, Ben-Shlomo Y, Lyngdoh T, Ramakrishnan

L, Ahuja RC, Joshi P, Das SM, et al: The effect of rural-to-urban migration on

obesity and diabetes in India: a cross-sectional study. PLoS Med 2010, 7:e1000268.

34 Validity of dietary questionnaires in Sri Lankan adults and the association of dietary intake with obesity

34. Singh DL, Bhattarai MD: High prevalence of diabetes and impaired fasting

glycaemia in urban Nepal. Diabet Med 2003, 20:170-171.

35. Mohan V, Deepa M, Deepa R, Shanthirani CS, Farooq S, Ganesan A, Datta M: Secular

trends in the prevalence of diabetes and impaired glucose tolerance in urban South

India--the Chennai Urban Rural Epidemiology Study (CURES-17). Diabetologia

2006, 49:1175-1178.

36. Ramachandran A, Snehalatha C, Vijay V: Temporal changes in prevalence of type 2

diabetes and impaired glucose tolerance in urban southern India. Diabetes Res Clin

Pract 2002, 58:55-60.

37. Ramachandran A, Snehalatha C, Latha E, Vijay V, Viswanathan M: Rising prevalence

of NIDDM in an urban population in India. Diabetologia 1997, 40:232-237.

38. Ramachandran A, Snehalatha C, Baskar AD, Mary S, Kumar CK, Selvam S, Catherine S,

Vijay V: Temporal changes in prevalence of diabetes and impaired glucose

tolerance associated with lifestyle transition occurring in the rural population in

India. Diabetologia 2004, 47:860-865.

39. Ramachandran A, Mary S, Yamuna A, Murugesan N, Snehalatha C: High prevalence of

diabetes and cardiovascular risk factors associated with urbanization in India.

Diabetes Care 2008, 31:893-898.

40. Illangasekera U, Rambodagalla S, Tennakoon S: Temporal trends in the prevalence of

diabetes mellitus in a rural community in Sri Lanka. J R Soc Promot Health 2004,

124:92-94.

41. Fernando DJ, Siribaddana S, de Silva D: Impaired glucose tolerance and diabetes

mellitus in a suburban Sri Lankan community. Postgrad Med J 1994, 70:347-349.

42. Islam A, Tahir MZ: Health sector reform in South Asia: new challenges and

constraints. Health Policy 2002, 60:151-169.

43. Mohan V: Why are Indians more prone to diabetes? J Assoc Physicians India 2004,

52:468-474.

44. Misra A, Khurana L: Obesity and the metabolic syndrome in developing countries. J

Clin Endocrinol Metab 2008, 93:S9-30.

45. Ramachandran A, Snehalatha C, Kapur A, Vijay V, Mohan V, Das AK, Rao PV, Yajnik

CS, Prasanna Kumar KM, Nair JD: High prevalence of diabetes and impaired glucose

tolerance in India: National Urban Diabetes Survey. Diabetologia 2001, 44:1094-

1101.

35

46. Misra A, Khurana L, Isharwal S, Bhardwaj S: South Asian diets and insulin resistance.

Br J Nutr 2009, 101:465-473.

47. Mohan V, Shanthirani CS, Deepa R: Glucose intolerance (diabetes and IGT) in a

selected South Indian population with special reference to family history, obesity

and lifestyle factors--the Chennai Urban Population Study (CUPS 14). J Assoc

Physicians India 2003, 51:771-777.

48. Yajnik CS: Early life origins of insulin resistance and type 2 diabetes in India and

other Asian countries. J Nutr 2004, 134:205-210.

49. Mohan V, Shanthirani S, Deepa R, Premalatha G, Sastry NG, Saroja R: Intra-urban

differences in the prevalence of the metabolic syndrome in southern India -- the

Chennai Urban Population Study (CUPS No. 4). Diabetic Medicine: A Journal Of The

British Diabetic Association 2001, 18:280-287.

50. Gupta A, Gupta R, Sarna M, Rastogi S, Gupta VP, Kothari K: Prevalence of diabetes,

impaired fasting glucose and insulin resistance syndrome in an urban Indian

population. Diabetes Res Clin Pract 2003, 61:69-76.

51. Abu Sayeed M, Mahtab H, Akter Khanam P, Abul Ahsan K, Banu A, Rashid AN, Azad

Khan AK: Diabetes and impaired fasting glycemia in the tribes of Khagrachari hill

tracts of Bangladesh. Diabetes Care 2004, 27:1054-1059.

52. Ravikumar P, Bhansali A, Ravikiran M, Bhansali S, Walia R, Shanmugasundar G,

Thakur JS, Kumar Bhadada S, Dutta P: Prevalence and risk factors of diabetes in a

community-based study in North India: the Chandigarh Urban Diabetes Study

(CUDS). Diabetes Metab 2011, 37:216-221.

53. Zaman FA, Pal R, Zaman GS, Swati IA, Kayyum A: Glucose indices, frank and

undetected diabetes in relation to hypertension and anthropometry in a South

Indian rural population. Indian J Public Health 2011, 55:34-37.

54. Vaz NC, Ferreira AM, Kulkarni MS, Vaz FS: Prevalence of diabetes mellitus in a

rural population of Goa, India. Natl Med J India 2011, 24:16-18.

55. Mehta KD, Karki P, Lamsal M, Paudel IS, Majhi S, Das BK, Sharma S, Jha N, Baral N:

Hyperglycemia, glucose intolerance, hypertension and socioeconomic position in

eastern Nepal. Southeast Asian J Trop Med Public Health 2011, 42:197-207.

37

Table 2-1 Prevalence of diabetes and pre-diabetes in South Asian countries

Study date Study setting

[reference] Sample size Age group

Prevalence of pre-diabetes Prevalence of Diabetes Diabetes

Epidemicity

Index

Diagnostic criteria All

Male Female All

Male Female

1999-2000 Rural[20] 4923 ≥20 12.4 12.7 12.1 3.8 5.2 3.4 76.5% ADA

2002 Rural[51] 1119 ≥20 8.4 7.3 9.4 6.4 7.4 5.5 56.8% ADA

2004 Semi-urban[18] 3981 ≥20 5.8 4.4 6.7 6.8 7.3 6.5 46.0% WHO 1997

2002-2003 Urban[19] 5265 ≥20 5.2 4.7 5.5 10.5 10.4 9.9 33.1% WHO 1997

2004-2005 Rural[21] 975 ≥20 4.7† 3.9 5.2 8.5† 9.4 8.0 35.6% WHO 1997

2000 Urban[45] 11216 ≥20 14.0 14.6 14.3 12.1 12.5 11.9 53.6% WHO 1997

2000 Urban[28] 10025 ≥20 8.1 8.4 7.9 13.9 13.3 14.3 36.8% WHO 1997

1999-2002 National[11] 18363 ≥25 5.2 5.6 5.5 4.3 4.4 4.5 54.7% WHO 1997

2002-2003 Urban[22] 10930 20-69 5.3 6.2 3.9 10.1 11.1 8.4 34.4% WHO 1997

2002-2005 Urban[16] 986 >18 4.1 4.3 4.1 9.0 8.7 9.2 31.3% WHO 1997

2005 Rural[23] 4535 ≥30 15.5 16.6 14.3 13.2 14.3 12.0 54.0% ADA

2007 Rural[24] 1645 ≥20 4.6 5.4 4.9 12.5 16.5 13.5 26.9% WHO 1997

Ban

glad

esh

Indi

a In

dia

38 Validity of dietary questionnaires in Sri Lankan adults and the association of dietary intake with obesity

2008-2009 Urban[52] 2227 ≥20 13.2 NR NR 11.1 NR NR 54.3% WHO 1997

2009-2010 Rural[53] 1370 ≥20 12.0 10.5 13.6 19.8 16.1 22.0 37.7% WHO 1997

2011a Rural[54] 1266 ≥20 NR NR NR 10.3 8.4 12.0 NR ADA

2004 National [14] 1556 25-64 3.0 2.3 3.7 4.5 4.3 4.7 40.0% WHO 1997

1999-2001 Urban and rural[34] 1841 ≥20 6.5† 7.0† 6.1† 10.6† 11.6† 9.8† 38.0% ADA

2001-2002 Urban[25] 1012 ≥40 11.5 13.2 10.2 8.5 10.8 6.9 57.5% ADA, WHO 1997

2007a Urban[17] 740 ≥20 19.5 25.0 15.0 9.5 11.8 7.9 67.2% ADA

1995 National[12] 5433 ≥25 10.2† 6.6† 12.1† 8.7† 9.3† 11.1† 54.0% WHO 1994

2002 Rural[15] 2032 ≥25 3.0 4.2 2.3 7.2 10.1 4.3 29.4% ADA

2000 Urban[27] 1042 30-64 NR NR NR 6.5 5.0 6.6 NR ADA

2000-2001 Urban and rural[26] 6047 30-65 14.1† 14.2 14.1 13.8† 14.2 13.5 50.5% ADA, WHO 1997

2005-2006 National[13] 4532 ≥20 11.5 11.0 11.7 10.3 9.8 10.9 52.8% ADA, WHO 1997

† Calculated from available data; ADA = American Diabetes Association 1999 definition; WHO = World Health Organization definition for -

1997 and 1994; NR – Not Reported; a - publication year

Sri L

anka

Pa

kist

an

Nep

al

Mal

dive

s

Chapter 2: Manuscript 1 39

Table 2-2: Prevalence of diabetes according to area of residence Country

[reference] Year

Urban sector Rural sector Urban:Rural

ratio All Males Females All Males Females

Bangladesh[29] 2005a 8.1 7.7 8.5 2.3 1.9 2.5 3.5

India[30] 1998a 5.9 7.0 5.0 2.9 3.0 2.7 2.0

India[31] 1996-1998 2.2 2.6 1.7 1.8 1.8 1.8 1.2

India[11] 1999-2002 5.6 5.6 5.8 2.7 2.5 2.5 2.1

India[32] 2003-2005 7.3 NR NR 3.1 NR NR 2.4

India[33] 2005-2007 13.5 14.0 10.2 6.2 5.6 5.9 2.2

Nepal[34] 1999-2001 14.6 14.9 14.3 2.5 4.1 1.2 5.8

Nepal[55] 2005-2006 22.8 NR NR 20.0 NR NR 1.1

Pakistan[12]† 1995 10.5 11.6 10.3 7.6 8.3 7.4 1.4

Sri Lanka[13] 2005-2006 16.4 NR NR 8.7 NR NR 1.9

† calculated from available data; NR – Not reported; a - publication year

Chapter 2: Manuscript 1 41

Table 2-3: Prevalence of diabetes in different regions Region Year Prevalence of Diabetes

South Asia* 1995-2005/2006 4.5%-10.3%

Global† 2011 8.5%

Middle-East† 2011 11.0%

North America† 2011 10.7%

South America† 2011 9.2%

South-East Asia† 2011 9.2%

Western Pacific† 2011 8.3%

Europe† 2011 6.7%

Africa† 2011 4.5%

* based on most recent national surveys in regional countries

† IDF 2011 [10]

42 Chapter 2: Manuscript 1

Figure 2-1: Summarized search protocol

Chapter 2: Manuscript 1 43

Figure 2-2: Trends in prevalence in South Asia of a) diabetes mellitus and b) pre-diabetes (Data for individual countries were extracted from the following references; Bangladesh [18]; India

[35-39]; Sri Lanka [27, 40, 41])

44 Chapter 2: Manuscript 1

Figure 2-3: Diabetes epidemicity index of South Asian countries. (Ban – Bangladesh; Ind – India; Mal – Maldives; Nep – Nepal; Pak – Pakistan; SL – Sri Lanka; u – urban; r – rural; u+r – urban and rural; Diabetes [ ]; Diabetes Epidemicity Index [ ])

Chapter 2: Manuscript 1 45

Continue to page 46.

46 Chapter 2: Manuscript 1

Figure 2-4: Forest plot showing pooled odds ratios for a) Family history, b) Age, c) Male gender, d) Systolic Blood Pressure, e) Diastolic Blood Pressure, f) Body Mass Index and g)

Waist-Hip ratio associated with diabetes (IV-Inverse variance; SE-Standard Error)

Chapter 3: Manuscript 2 47

Chapter 3: Manuscript 2

Contribution of co-authors for thesis by published paper The authors listed below have certified that

1. They meet the criteria for authorship in that they have participated in the conception, execution, or interpretation, of at least that part of the publication in their field o expertise:

2. They take public responsibility for their part of the publication, except for the responsible author who accepts overall responsibility for the publication;

3. There are no other authors of the publication according to these criteria; 4. Potential conflicts of interest have been disclosed to (a) granting bodies, (b) the editor or

publisher of journals or other publications, and (c) the head of the responsible academic unit, and 5. They agree to the use of the publication in the student’s thesis and its publication on the

Australasian Digital Thesis database consistent with any limitations set by publisher requirements.

In the case of this chapter Paper: Prevalence, trends and associated socio-economic factors of obesity in South Asia Contributor Statement of contribution Ranil Jayawardena Study design, data collection, data analysis

and drafted the manuscript Nuala Byrne Study design, data interpretation and revision

of the draft and approved the final manuscript.

Mario Soares Study design, data interpretation and revision of the draft and approved the final manuscript.

Prasad Katulanda Study design, data interpretation and revision of the draft and approved the final manuscript.

Andrew Hills Study design, data interpretation and revision of the draft and approved the final manuscript.

Principal supervisor confirmation I have sighted email or other correspondence from all co-authors confirming their certifying authorship.

Nuala Byrne 18/04/2013

Name signature Date

48 Chapter 3: Manuscript 2

TITLE PAGE

Prevalence, trends and associated socio-economic factors of obesity in South Asia Ranil Jayawardena1,2, Nuala M. Byrne1, Mario J. Soares3, Prasad Katulanda2, Andrew P. Hills4 1Institute of Health and Biomedical Innovation, Queensland University of Technology, Brisbane, Queensland, Australia 2Diabetes Research Unit, Faculty of Medicine, University of Colombo, Colombo, Sri Lanka 3Curtin Health Innovation Research Institute, School of Public Health, Faculty of Health Sciences, Curtin University, Perth, WA, Australia 4Mater Mother’s Hospital, Mater Medical Research Institute and Griffith Health Institute, Griffith University, Brisbane, Queensland, Australia

Citation

R Jayawardena, NM Byrne, MJ Soares, P Katulanda, AP Hills (2013). Prevalence, Trends and

Associated Socio-Economic Factors of Obesity in South Asia. Obesity Facts (in press) Ms No.:

201202017

Chapter 3: Manuscript 2 49

SUMMARY

Worldwide obesity levels have increased unprecedentedly over the past couple of decades.

Although the prevalence, trends and associated socio-economic factors of the condition have

been extensively reported in Western populations, less is known regarding South Asian

populations. A review of articles using MEDLINE with combinations of the MeSH terms:

Obesity, Overweight, and “Abdominal Obesity” limiting to epidemiology and south Asian

counties. Although the methodological heterogeneity and variation according to country, area of

residence, gender exist, the most recent nationally representative and large regional data show a

clear epidemic of obesity, overweight and abdominal obesity. Prevalence estimates of

overweight and obesity [based on Asian cut-offs; Overweight ≥23 kg/m2, Obesity ≥25 kg/m2]

ranged from 3.5% in rural Bangladesh to over 65% in the Maldives. Abdominal obesity was

more prevalent than general obesity in both sexes in this ethnic group. Countries with the lowest

prevalence had the highest upward trend of obesity. Socio-economic factors associated with

greater obesity in the region included female gender, middle age, urban residence, higher

educational and economic status. In conclusion, South Asia is significantly affected by the

obesity epidemic. Collaborative public health interventions to reverse these trends need to be

mindful of many socioeconomic constraints in order to provide long term solutions.

50 Chapter 3: Manuscript 2

INTRODUCTION

Worldwide obesity levels have increased unprecedentedly over the past couple of decades.

Indeed, according to the World Health Organization’s (WHO) recent global estimates, over one

billion and nearly 300 million adults are overweight and obese, respectively [1]. In many

affluent countries, obesity has reached epidemic levels and is associated with non-communicable

diseases (NCDs) including diabetes, hypertension, dyslipidemia and coronary heart disease, all

major public health issues [2]. In affluent countries, socio-economic status and education level

are negatively associated with the prevalence of obesity, a situation which contrasts to that in

South Asia [3]. Traditionally, infectious diseases [4] and under-nutrition [5] were considered

major health problems in South Asia and little attention was paid to obesity by healthcare

workers, policy makers or researchers. However, with the rapid emergence of the obesity

epidemic in South Asian countries, and an increasing body of evidence that people originating

from the Indian sub-continent have a high risk for NCDs including diabetes mellitus type 2

(DM), coronary heart disease (CHD) and stroke compared to Europeans [6], greater attention is

being paid. Alarmingly, South Asia has the highest number of patients with diabetes worldwide

and 50% of the adult disease burden in South Asia is attributable to NCDs [7].

It is estimated that the total population living in South Asia now exceeds 1.56 billion with India

(2nd), Pakistan (6th) and Bangladesh (7th) among the ten most populated countries in the world

[8]. Moreover, people who originated from the Indian sub-continent are also widespread in most

countries of the world, predominantly in affluent nations. The disease burden in South Asians is

invariably a high priority as a global health issue. Although there have been a few in-depth

reviews on obesity and associated disease in Asia [6,9], none has discussed obesity prevalence

and trends for individual countries in the region. Therefore, the main aim of this study was to

Chapter 3: Manuscript 2 51

discuss the prevalence of overweight and obesity among the adult population from individual

countries in South Asia using the most recent representative evidence. Associated aims were to

plot obesity trends over time across the last few decades, and identify and discuss the socio-

economic factors associated with obesity in the region.

METHODS

In this review, South Asians are defined as people living in the Indian subcontinent which

consists of the following countries: India, Pakistan, Sri Lanka, Bangladesh, Nepal, Bhutan and

the Maldives. Countries from the Far East (Japan, China etc.) and South East Asia (Malaysia,

Thailand, Singapore etc.) were excluded [10]. There is an active collaboration and mutual

assistance (South Asian Association for Regional Cooperation - SAARC) among these countries

in economic, social, cultural, technical and scientific fields [11]. Despite the existence of

considerable heterogeneity among the inhabitants of South Asia, there are several similarities in

the biological and socio-cultural aspects of the people from this region that allows this group to

be considered as a single unit for the purpose of examination of health issues [12].

Overweight and obesity prevalence data among adults in the South Asian countries studied were

obtained by searching Medline with combinations of the MeSH terms: Obesity and Overweight

as separate main key words for papers published in English between 1 January 1980 and 31

December 2011. Secondly, each key word was divided into subheadings and Epidemiology/EP

included for searching with main key words. Thirdly, the conjunction of the above results was

narrowed down by adding the name of each country (India, Pakistan, Bangladesh, Sri Lanka,

Nepal, Bhutan and Maldives) as key words. A manual search was performed for future evidence

using the reference lists of selected articles and corresponding authors were contacted to obtain

additional data. Furthermore, relevant governmental health and WHO websites were browsed.

52 Chapter 3: Manuscript 2

The primary search was focused on research investigating the prevalence of overweight, obesity

or abdominal obesity in each country. Priority was given to larger (n>2000), nationally

representative samples.

Studies done in the clinical settings and patients with especial medical conditions and limited to

especial groups (e.g. doctors) or age category (e.g. age >65 y) were excluded. Studies of South

Asians living in the non-South Asian countries were excluded.

Initial screening of articles was carried out using abstracts. Unless it was clear from the abstract

that this strategy met the inclusion criteria for the review, the article was rejected. For prevalence

data, the most recent, well-designed and nationally representative or large studies were included.

Trends were plotted by available prevalence data from each country according to gender.

RESULTS

National prevalence of obesity in individual countries (Table 1)

No data were found from Bhutan. Limited nationwide surveys were found in the region and most

recent studies were completed between 2004 and 2006. The STEPS survey in the Maldives [13]

and SLDC study [14] in Sri Lanka reported on prevalence of overweight, obesity and abdominal

obesity using similar anthropometric cut-offs and in a similar period of time. The study in the

Maldives reported the highest prevalence of overweight, obesity and abdominal obesity in the

region with 60.8% of males and 65.5% of females overweight and obese. The overall prevalence

of obesity and abdominal obesity were 43.5% and 40.0% with half the women being obese

(48.1%) and abdominally obese (54.1%) [13]. Sharma et al. recently reported a very high

prevalence of overweight among both Nepalese men (59.1%) and women (61.8%), however they

have reported lower BMI cut-offs to define overweight (≥22 kg/m2) [15]. As per the WHO

definition for overweight in Asian adults (BMI ≥23 kg/m2) a quarter of Sri Lankan adults (M:

22.6%, F: 28.0%) were overweight [14]. In Bangladesh, a large survey undertaken on

reproductive age woman reported levels of overweight of 9.6% and 18.9% among rural and poor

Chapter 3: Manuscript 2 53

urban areas [16]. No nationally representative data are available on men, however data from four

sites in Bangladesh showed around 10% of men have BMI scores above 25 kg/m2 [17]. Results

from the National Health Survey of Pakistan showed a high prevalence of overweight (M: 22.0%

F: 27.9%) and obesity (M: 12.5% F: 18.6) in the early 1990s [18] moreover, authors noted a 2.5

times greater prevalence of obesity among urban than among rural residents [18]. In 2007, a

study on a rural population showed 19.5% and 24.7% obesity levels (BMI ≥25 kg/m2) in men

and women, respectively [19].

Prevalence data in India is more complex. For example, the Indian National Family Health

Survey-3 reported prevalence data on obesity in a large sample (n=111781) across 26 states [20]

with moderate levels of obesity; 9.3% for men and 12.6% for women. However in contrast,

Deepa et al. [21] reported 46.1% and 50.2% overweight and obesity in a study in South India. In

addition, using the Asian waist circumference cut–offs, the same study reported that 35.1% of

men and 56.2% of women had abdominal obesity, a higher level than any other national values

for countries in the region [21]. A study undertaken in six different geographical locations in

India (East, South, North, West/Central) showed different levels of obesity according to rural or

urban residence. In urban areas, obesity levels were as high as 30.7% in men and 38.8% in

women; whilst in rural areas values were 9.4% in men and 14.1% in women. In contrast, obesity

levels in slums were intermediate, 16.7% and 26.1%, for men and women respectively [22].

Similar patterns were reported for abdominal obesity.

Time trends in the prevalence of obesity

No well-designed nationally representative studies were found for the Maldives or Bhutan.

Limited time series information is available for other countries. Prevalence data were plotted in

the time trends according to the methodological similarities of the studies. BMI ≥25 kg/m2 was

used as it was the commonly used cut-off for most of the recent and earlier studies, which allows

54 Chapter 3: Manuscript 2

conclusions to be drawn on weight trends. An obvious upward trend was seen in all countries in

the region (figure 1a and 1b). In Sri Lanka, the age-adjusted prevalence of obesity in both men

and women increased from 7.0% (male) and 13.4% (female) in 1990 to 9.9% (male) and 19.2%

(female) in 2000. A further increase in obesity can be seen in 2005 (M: 16.4%; F: 20.7%)

[23,24] [14]. As obesity data in 1990 and 2000 were taken from an urban area (Colombo,

Maharagama) [23,24], the comparison in 2005 was taken from obesity prevalence in the urban

area [14]. Obesity prevalence in males may have be under-reported in 2000 and 1995 as the

authors used a BMI level of >27 kg/m2 as the obesity cut-off for males but >25 kg/m2 for female

counterparts [23,24].

Although the absolute prevalence of overweight and obesity in Nepal and Bangladesh are

currently the lowest in the region, the relative increases over the last two decades are the highest

in the region. A series of national or regional obesity datasets on ever-married, non-pregnant

women in Bangladesh show a clear positive trend in both urban and rural populations [25]. In

1996, only 2.7% of women had a BMI >25 kg/m2 and within three years the proportion had

reached 4.4%. By 2004, a value three times higher than in 1996 (8.9%) [25] was seen. In Nepal,

the prevalence of obesity among women was 1.6% which increased to 6.4% in 2001, then to

10.1% in 2006. This level of change over such a short period is the highest in the region. Despite

the absence of trend data on the prevalence of overweight and obesity in Pakistan, Shah et al.

[19] conducted two independent cross-sectional population surveys in rural Pakistan in 1995 and

2007. The age-adjusted prevalence of overweight and obesity (BMI >25 kg/m2) increased from

13.9% in 1995 to 19.4% in 2007. In men, the increase was from 15.4% to 19.5%; and in women

from 12.5% to 24.7%.

There are a few nationwide and several regional studies in India over the last few decades,

however, there is no series of national level study to cover all parts of the country. This may be

due to the size of the population and lack of resources. The National Nutrition Monitoring

Chapter 3: Manuscript 2 55

Bureau of India conducted a couple of large studies in nine rural states in India in 2000 [26] and

2005 [27]. The obesity prevalence was 5.7% and 8.2% in men and women respectively in 2000,

which increased to 7.8% and 10.9% in 2005. Although values are low in both circumstances,

obesity levels had increased by 37% and 32% in both men and women respectively over the

five-year period. Some regional studies reported very high levels of obesity, in particular in

urban areas [21,22,28]. However, in India, there is a considerable disparity in the prevalence and

in the time trends in the prevalence of obesity by different geographical regions and residents in

different areas of the same geographical location. A recent review noted the complexity of over

and under-nutrition problems in India [29].

Socio-economic factors associated with prevalence of obesity in the South Asian region

Several similar socio-economic factors are associated with the increase in obesity in the region.

Female sex, middle age, urban residence, higher educational and economic status, physical

inactivity and some dietary habits (Table 2) were positively associated with a high prevalence of

obesity. Yajnik [30] suspects the obesity epidemic may be associated with low birth weight in

Indian babies. In contrast to the above factors, smoking and Tuberculosis were negatively

associated [31]. Many studies have shown that smokers have lower body weights than their non-

smoking counterparts, however in contrast a study by Gosh et al (2006), showed that both ex

smoking and never smoking decreased WHR significantly, whereas smoking increased WHR

[32]. There was considerable variation in the prevalence of obesity according to sub-ethnicity,

region of the country, religion, caste and marital status for women.

DISCUSSION

Historically, under-nutrition and deficiencies have been considered the major health issues in

South Asian countries. Even in the most recent literature, the region is considered to have one of

56 Chapter 3: Manuscript 2

the lowest levels of excess body weight [33]. However, this information alone is misleading

because it does not examine the prevalence, trends and associated factors of obesity in the

region. To our knowledge, this is the first systematic review to discuss prevalence trends and

associated socio-economic factors of obesity in South Asian countries. Despite the very limited

recent nationally representative obesity prevalence data from countries in the Indian

subcontinent, our results show that the prevalence of obesity has reached epidemic levels in

almost every country and is more serious in urban areas. Considering the size of the population

of the region, the number of people who are affected by overweight and obesity represents

numbers well above those in most developed countries. These studies have mainly used Asian

BMI and waist circumference cut-offs (OW ≥23 kg/m2; Ob ≥25 kg/m2) to define overweight,

obesity and abdominal obesity (waist circumference: M ≥90 cm; F ≥80 cm) [34,35]. However, a

growing body of evidence suggests that BMI ≥23 kg/m2 is not sensitive enough to identify the

obesity-associated disease risk in South Asian populations.

BMI and waist circumference for obesity in South Asians

Studies from India [36], Pakistan [18], and Sri Lanka [37] have shown that a BMI of 21 kg/m2

would be the appropriate anthropometric cut-off level to identify overweight. Similarly, an

Indian consensus statement also suggested a BMI of ≥21 kg/m2 as the diagnostic cut-off value

for overweight for Asian Indians [38]. Moreover, multi-ethnic studies on body composition [39]

and metabolic risk factor analysis [40] showed that a BMI of 21 kg/m2 is the most appropriate

anthropometric cut-off for South Asian ethnic groups. Considering all factors, if obesity was

defined using a lower BMI level, the prevalence of obesity in the respective countries would be

substantially increased. Similarly, lower abdominal obesity cut-offs have been recommended for

the South Asians [38]. However, a considerable portion of Nepalese and Bhutanese are from

Chapter 3: Manuscript 2 57

Chinese origin, therefore lower anthropometric cut-offs are not equally suitable for all ethnic

groups.

There has been considerable delays between data collection and the publication of findings in

some countries, for instance a 16-year gap between data collection and publication date in a

Pakistan national survey [18]. The rate of increase in the obesity epidemic is very fast globally,

but particularly in the South Asian region, so published reports to date may significantly

underestimate the current prevalence.

Socio-economic factors

If environmental factors have a major role in triggering increased body weight subsequent to

increased prevalence of overweight and obesity, one would expect a lower prevalence of obesity

in rural areas, where people follow a traditional lifestyle. Such an urban–rural difference has

been reported in almost all countries in the region. For example in Sri Lanka, the prevalence of

obesity in urban areas is three times that of rural areas [14] and similar patterns have been

reported in India [22] and Pakistan [18]. However, Shah et al. reported that in rural Pakistan, the

age-adjusted prevalence of overweight and obesity also increased from 13.9% in 1995 to 19.4%

in 2007 [19]. These results suggest that the rate of obesity might also increase in rural

communities as they become more urbanised. Between 1990 and 2000, the mean BMI increased

by nearly 2.5 kg/m2 in rural Sri Lanka [41]. Recent economic development has improved the

availability and accessibility to foods, which has occurred simultaneously with an increased

quality of life in many countries. Advances in both technical and agricultural sectors has helped

to reduce under-nutrition, however, the increased availability of energy-dense foods may lead to

weight gain and subsequently, obesity. This transition has occurred rapidly, particularly in urban

regions of South Asian countries, which compares with a more gradual advancement in many

affluent countries. Interestingly, most South Asian meals consist of excess carbohydrate [42].

58 Chapter 3: Manuscript 2

In 2007-2008, the prevalence of obesity was estimated to be 35.5% in US women [43]. Despite

obesity prevalence among US women being high, over a 10-year period there has not been a

significant upward trend. In comparison, the obesity level increased six-fold in Nepalese women

between 1996 and 2006 [25]. Thus, despite the prevalence of obesity in South Asian countries

being lower that in the USA, the rate at which overweight and obesity has increased during

recent decades (Figures 1 and 2), and the likelihood of further increases, provides substantial

grounds for concern. Obesity trend data from the Asia-Pacific region also shows low absolute

values of obesity in Asian countries such as China and Japan compared to Australia but with

rapid increases in the relative values during the last decades [44].

Worldwide, more females are overweight and obese compared to males [33]. In the UK, an

estimated 25% of women and 23% of men were obese in 2002 [45], while in the US, 32.2% of

men and 35.5% of women suffered from obesity in 2007/2008 [43]. In contrast, the gender

difference in prevalence of obesity in South Asia is significantly higher, for instance, in rural

Bangladesh the prevalence of obesity in women is 2.5 times higher than in males [46]. Socio-

economic characteristics of the epidemic of obesity in South Asia also differ from those reported

in other parts of the world. In South Asia, the highest prevalence is reached in the middle-aged

(30-50 years) group whereas in the UK, obesity prevalence tends to increase progressively with

age (up to 64 years) [45]. In South Asia, obesity is more common in people with high

educational levels, high income or wealth and in skilled workers [14,18,47]. In contrast, the

opposite is seen in the UK [45]. Unlike more affluent countries, a considerable proportion of

South Asian populations suffer from under-nutrition [25], with people with higher education and

income having relatively higher accessibility to energy and nutrient-rich foods. Interestingly,

religion, caste, sub-ethnicity, region of location within the country and marital status are

Chapter 3: Manuscript 2 59

significant socio-economic factors leading to obesity in the region [18,29,31,47]. This is partly

due to the abovementioned factors being strongly associated with their cultural dietary patterns

and freedom of movement or physical activity levels [47]. It is very important to identify key

socio-economic factors prior to initiating weight loss programmes as complex associations

between obesity and socio-economic factors may make the implementation of weight loss

strategies in South Asians more challenging. Prevalence of diabetes is has reached to epidemic

portion in the south Asia [48].

LIMITATIONS

Interpretation of obesity prevalence and trends in the region is difficult due to use of various

anthropometric cut-offs. For example, older studies defined overweight and obesity using global

BMI cut-offs of ≥25 kg/m2 for overweight and ≥30 kg/m2 for obesity whereas in recent studies

ethnic-specific anthropometric cut-offs have been used. Secondly, overweight has been

classified differently in the literature, with some researchers defining overweight/obesity using

one value. For example, in the Maldives study, overweight is considered as a BMI of 23 kg/m2

and above [13], whereas in a Bangladeshi study [49] overweight was classified using the

traditional range (25.0-29.9 kg/m2). Another limitation is that different studies have used various

age groups although this review focused only on adult populations, whereas some countries have

included older adolescents [18,20,49] and the elderly for prevalence studies [14,18,21]. The

inclusion of younger individuals and also older adults may lead to underestimates of the

prevalence of obesity in adults. Similarly, in some countries, prevalence data were restricted to

one gender [25], a specific area of residence [50] and a single time point [13], each of which

limits interpretation of the general obesity prevalence and trends in the region. Prospective

studies are needed to indentify the incidence of the obesity in the region.

60 Chapter 3: Manuscript 2

CONCLUSION

It is evident that overweight and obesity has already reached epidemic proportions in South

Asian countries and based on current trends, the longer-term prognosis is even more threatening.

The widespread use of more appropriate lower anthropometric cut-offs may further increase

current estimates. Furthermore, obesity in South Asia has a unique cluster of associated socio-

economical factors. Immediate action is required in both prevention and management with the

engagement of healthcare workers, policy makers and educators before overweight and obesity

levels achieve more alarming proportions.

Acknowledgements

We are grateful to Mr Peter Sondergeld, who helped us in literature searching. Conflict of interest

The authors declare no conflict of interest.

Chapter 3: Manuscript 2 61

REFERENCES

1 WHO: Obesity and overweight; in WHO (ed): Global Strategy on Diet, Physical Activity

and Health, 2010, 2010,

2 Caballero B: The global epidemic of obesity: An overview. Epidemiologic reviews

2007;29:1.

3 McLaren L: Socioeconomic status and obesity. Epidemiologic reviews 2007

4 Snyder JD, Merson MH: The magnitude of the global problem of acute diarrhoeal

disease: A review of active surveillance data. Bull World Health Organ 1982;60:605-613.

5 Muller O, Krawinkel M: Malnutrition and health in developing countries. Canadian

Medical Association Journal 2005;173:279.

6 Misra A, Khurana L: Obesity-related non-communicable diseases: South asians vs white

caucasians. International Journal of Obesity 2010

7 Ghaffar A, Reddy K, Singhi M: Burden of non-communicable diseases in south asia.

British Medical Journal 2004;328:807.

8 The Central Intelligence Agency: The world factbook: South Asia, 2010,

9 Yoon K, Lee J, Kim J, Cho J, Choi Y, Ko S, Zimmet P, Son H: Epidemic obesity and

type 2 diabetes in asia. The Lancet 2006;368:1681-1688.

10 Sharma M: Designing effective health education interventions for preventing obesity in

South Asian Americans. Californian Journal of Health Promotion 2006;4:119-128.

11 SAARC: South asian association for regional cooperation, 2009, 2010,

12 Ahmed S, Lemkau J: Cultural issues in the primary care of south asians. Journal of

Immigrant Health 2000;2:89-96.

13 Aboobakur M, Latheef A, Mohamed A, Moosa S, Pandey R, Krishnan A, Prabhakaran

D: Surveillance for non-communicable disease risk factors in maldives: Results from the first

steps survey in male. International Journal of Public Health:1-8.

14 Katulanda P, Jayawardena MA, Sheriff MH, Constantine GR, Matthews DR: Prevalence

of overweight and obesity in sri lankan adults. Obes Rev 2010

15 Sharma SK, Ghimire A, Radhakrishnan J, Thapa L, Shrestha NR, Paudel N, Gurung K, R

M, Budathoki A, Baral N, Brodie D: Prevalence of hypertension, obesity, diabetes, and

metabolic syndrome in nepal. International Journal of Hypertension 2011;821971. Epub 2011

Apr 19.

62 Chapter 3: Manuscript 2

16 Shafique S, Akhter N, Stallkamp G, de Pee S, Panagides D, Bloem MW: Trends of

under- and overweight among rural and urban poor women indicate the double burden of

malnutrition in bangladesh. International Journal of Epidemiology 2007;36:449-457.

17 Razzaque A, Nahar L, Van Minh H, Ng N, Juvekar S, Ashraf A, Ahmed SM,

Soonthornthada K, Kanungsukkasem U, Huu Bich T: Social factors and overweight: Evidence

from nine asian indepth network sites. Glob Health Action 2009;2

18 Jafar TH, Chaturvedi N, Pappas G: Prevalence of overweight and obesity and their

association with hypertension and diabetes mellitus in an indo-asian population. CMAJ:

Canadian Medical Association Journal = Journal De L'association Medicale Canadienne

2006;175:1071-1077.

19 Shah S, Hussain A, Jafar T, Reeder B: Obesity in a south asian population: Trends

between 1995 and 2007. Obesity Reviews 2010;11:59.

20 IIPS and Macro International: National family health survey (nfhs-3), 2005–06: India; in

Sciences IIfP (ed). Mumbai, 2007,

21 Deepa M, Farooq S, Deepa R, Manjula D, Mohan V: Prevalence and significance of

generalized and central body obesity in an urban asian indian population in chennai, india (cures:

47). European journal of clinical nutrition 2009;63:259-267.

22 Mohan V, Mathur P, Deepa R, Deepa M, Shukla DK, Menon GR, Anand K, Desai NG,

Joshi PP, Mahanta J, Thankappan KR, Shah B: Urban rural differences in prevalence of self-

reported diabetes in india--the who-icmr indian ncd risk factor surveillance. Diabetes research

and clinical practice 2008;80:159-168.

23 Fernando D, Siribaddana S, De Silva D: Impaired glucose tolerance and diabetes mellitus

in a suburban sri lankan community. British Medical Journal 1994;70:347.

24 Malavige G, de Alwis N, Weerasooriya N, Fernando D, Siribaddana S: Increasing

diabetes and vascular risk factors in a sub-urban sri lankan population. Diabetes research and

clinical practice 2002;57:143-145.

25 Balarajan Y, Villamor E: Nationally representative surveys show recent increases in the

prevalence of overweight and obesity among women of reproductive age in bangladesh, nepal,

and india. The Journal Of Nutrition 2009;139:2139-2144.

26 NNMB: Diet and nutritional status of rural population; in BUREAU NNM (ed): NNMB

Technical Report 2002,

27 NNMB: Diet and nutritional status of population and prevalence of hypertension

amongst adults in rural areas.; in Bureau NNM (ed): National Nutrition Monitoring Bureau

Technical Report, 2007,

Chapter 3: Manuscript 2 63

28 Singh RB, Pella D, Mechirova V, Kartikey K, Demeester F, Tomar RS, Beegom R,

Mehta AS, Gupta SB, De Amit K, Neki NS, Haque M, Nayse J, Singh S, Thakur AS, Rastogi

SS, Singh K, Krishna A: Prevalence of obesity, physical inactivity and undernutrition, a triple

burden of diseases during transition in a developing economy. The five city study group. Acta

Cardiologica 2007;62:119-127.

29 Wang Y, Chen HJ, Shaikh S, Mathur P: Is obesity becoming a public health problem in

india? Examine the shift from under- to overnutrition problems over time. Obesity Reviews: An

Official Journal Of The International Association For The Study Of Obesity 2009;10:456-474.

30 Yajnik CS: Obesity epidemic in india: Intrauterine origins? The Proceedings Of The

Nutrition Society 2004;63:387-396.

31 Subramanian SV, Kawachi I, Smith GD: Income inequality and the double burden of

under- and overnutrition in india. Journal Of Epidemiology And Community Health

2007;61:802-809.

32 Ghosh A: Effects of socio-economic and behavioural characteristics in explaining central

obesity--a study on adult asian indians in calcutta, india. Collegium Antropologicum

2006;30:265-271.

33 Balkau B, Deanfield J, Després J, Bassand J, Fox K, Smith Jr S, Barter P, Tan C, Van

Gaal L, Wittchen H: International day for the evaluation of abdominal obesity (idea): A study of

waist circumference, cardiovascular disease, and diabetes mellitus in 168 000 primary care

patients in 63 countries. Circulation 2007;116:1942.

34 WHO expert consultation: Appropriate body-mass index for asian populations and its

implications for policy and intervention strategies. The Lancet 2004;363:157-163.

35 WHO: Obesity: Preventing and managing the global epidemic. Report of a who

consultation.: World Health Organ Tech Rep Ser, 2000, 894, pp i–xii, 1–253.

36 Misra A, Vikram N, Gupta R, Pandey R, Wasir J, Gupta V: Waist circumference cutoff

points and action levels for asian indians for identification of abdominal obesity. International

Journal of Obesity 2005;30:106-111.

37 Katulanda P, Jayawardena MA, Sheriff MH, Matthews DR: Derivation of

anthropometric cut-off levels to define cvd risk in sri lankan adults. Br J Nutr 2011;105:1084-

1090.

38 Misra A, Chowbey P, Makkar BM, Vikram NK, Wasir JS, Chadha D, Joshi SR, Sadikot

S, Gupta R, Gulati S, Munjal YP: Consensus statement for diagnosis of obesity, abdominal

obesity and the metabolic syndrome for asian indians and recommendations for physical activity,

medical and surgical management. J Assoc Physicians India 2009;57:163-170.

64 Chapter 3: Manuscript 2

39 Deurenberg-Yap M, Schmidt G, Van Staveren W, Deurenberg P: The paradox of low

body mass index and high body fat percentage among chinese, malays and indians in singapore.

International Journal of Obesity 2000;24:1011-1017.

40 Razak F, Anand S, Shannon H, Vuksan V, Davis B, Jacobs R, Teo K, McQueen M,

Yusuf S: Defining obesity cut points in a multiethnic population. Circulation 2007;115:2111.

41 Illangasekera U, Rambodagalla S, Tennakoon S: Temporal trends in the prevalence of

diabetes mellitus in a rural community in sri lanka. The Journal of the Royal Society for the

Promotion of Health 2004;124:92.

42 Jayawardena R, Byrne NM, Soares MJ, Katulanda P, Hills AP: Consumption of sri

lankan adults: An appraisal of serving characteristics Public Health Nutrition 2012;FirstView

Article : pp 1-6

43 Flegal K, Carroll M, Ogden C, Curtin L: Prevalence and trends in obesity among us

adults, 1999-2008. Jama 2010;303:235.

44 The burden of overweight and obesity in the asia-pacific region. Obesity Reviews: An

Official Journal Of The International Association For The Study Of Obesity 2007;8:191-196.

45 Rennie KL, Jebb SA: Prevalence of obesity in great britain. Obesity Reviews 2005;6:11-

12.

46 Zaman MM, Yoshiike N: Prevalence of overweight defined by body mass index in a

rural adult population of bangladesh. Journal Of Health, Population, And Nutrition 2003;21:162-

163.

47 Garg C, Khan SA, Ansari SH, Garg M: Prevalence of obesity in indian women. Obesity

Reviews: An Official Journal Of The International Association For The Study Of Obesity

2010;11:105-108.

48 Jayawardena R, Ranasinghe P, Byrne N, Soares M, Katulanda P, Hills A: Prevalence and

trends of the diabetes epidemic in south asia: A systematic review and meta-analysis. BMC

Public Health 2012;12:380.

49 Khan MMH, Kraemer A: Factors associated with being underweight, overweight and

obese among ever-married non-pregnant urban women in bangladesh. Singapore Medical

Journal 2009;50:804-813.

50 Vaidya AK, Pokharel PK, Nagesh S, Karki P, Kumar S, Majhi S: Association of obesity

and physical activity in adult males of dharan, nepal. Kathmandu University Medical Journal

(KUMJ) 2006;4:192-197.

Chapter 3: Manuscript 2 65

Table 3-1: National prevalence of obesity (as percentage) in individual South Asian countries (BMI=Body mass index, WC=waist circumference)

*≥22 kg.m-2

Country Reference Sample selection Study date Sample size Age Male Female

≥23 kg.m-2

≥25

kg.m-2 WC ≥90

cm ≥23 kg.m-2

≥25

kg.m-2 WC≥80

cm

Bangladesh Shafigue et al. 2007 [16]

Rural Urban poor

(reproductive age women)

2000-2004

242433 39749

15-45

9.6 18.9

4.1 9.1

India

IIPS and Macro

International, 2007 [20]

National (26 states) 2005-2006 111781 15-49 9.3 12.6

Deepa et al. 2009 [21] South India (Chennai) 2001-

2004 2350 ≥20 46.1 24.6 35.1 50.2 31.2 56.2

Mohan et al. 2008 [22] National (6 centres ) 2003-

2005

13524 (rural) 15760 (slum) 15239 (urban)

15-65 9.4

16.7 30.7

12.2 17.9 30.9

14.1 26.1 38.8

29.6 41.1 57.8

Maldives Aboobakur et al. 2010

[13] National 2004 2019 25-64 60.8 38.1 24.2 65.5 48.1 54.1

Nepal Sharma et al. [15] Eastern Nepal 2007 14425 20-100 59.1* 61.8*

Pakistan Jafar et al. 2006 [18] National 1990-

1994 8972 ≥15 22.0 12.5 27.9 18.6

Sri Lanka Katulanda et al. 2010 [14] National 2005-

2006 4532 >18 22.6 14.3 16.5 28.0 19.4 36.3

66 Chapter 3: Manuscript 2

• Overweight and obesity have reached epidemic proportions in many part of South Asia.

• Obesity associated metabolic burden is substantial among South Asians, therefore, lower BMI and waist circumference cut-offs are more appropriate.

• Culturally-appropriate preventive strategies are necessary to handle this epidemic.

Chapter 3: Manuscript 2 67

Table 3-2: Socio-economic factors associated with the prevalence of obesity in South Asia.

Positive Factor1 Positive or negative

factors Negative factors

Female gender [14, 29-31] Sub-ethnicity* [18] Smoking [15, 18, 32]

Age [14-16, 21, 28-29, 33-35] Region of the country

[28-29, 36] Male [18]

Urban residence [14-15, 18, 29-34] Religion [32-33] Tuberculosis [32]

High education level [14, 18, 32-33,

35, 37] Caste [32-33] Rural [35]

Socio-economic Index [14-15, 17-18,

29-33, 35] Marital status [32, 38] Unskilled [35]

Physical inactivity [14, 28, 31, 38]

Healthy dietary habits [18, 31, 38]

Skilled workers [37]

Low Birth Weight [39]

*Sub-ethnicity – minor ethnicity groups; Healthy dietary habits (high fruits and vegetable intake,

low fat meals)

68 Chapter 3: Manuscript 2

Figure 3-1: Trends in the prevalence of obesity (BMI ≥25 kg.m-2) in Sri Lanka [14,23,24], Bangladesh [25], Nepal [25], India [26,27,28] and Pakistan [19] in adult males

Figure 3-2: Trends in the prevalence of obesity (BMI ≥25 kg.m-2) in Sri Lanka [14,23,24], Bangladesh [25], Nepal [25], India [26, 27,28]and Pakistan [19] in adult females

Prev

alen

ce

Prev

alen

ce

Years

Years

Chapter 4: Manuscript 3 69

Chapter 4: Manuscript 3

Contribution of co-authors for thesis by published paper The authors listed below have certified that

1. They meet the criteria for authorship in that they have participated in the conception, execution, or interpretation, of at least that part of the publication in their field o expertise:

2. They take public responsibility for their part of the publication, except for the responsible author who accepts overall responsibility for the publication;

3. There are no other authors of the publication according to these criteria; 4. Potential conflicts of interest have been disclosed to (a) granting bodies, (b) the editor or

publisher of journals or other publications, and (c) the head of the responsible academic unit, and 5. They agree to the use of the publication in the student’s thesis and its publication on the

Australasian Digital Thesis database consistent with any limitations set by publisher requirements.

In the case of this chapter Paper: Food consumption of Sri Lankan adults: an appraisal of serving characteristics Contributor Statement of contribution Ranil Jayawardena Study design, data collection, data analysis

and drafted the manuscript Nuala Byrne Study design, data interpretation and revision

of the draft and approved the final manuscript.

Mario Soares Study design, data interpretation and revision of the draft and approved the final manuscript.

Prasad Katulanda Study design, data interpretation and revision of the draft and approved the final manuscript.

Andrew Hills Study design, data interpretation and revision of the draft and approved the final manuscript.

Principal supervisor confirmation I have sighted email or other correspondence from all co-authors confirming their certifying authorship.

Nuala Byrne 18/04/2013

Name signature Date

70 Chapter 4: Manuscript 3

TITLE PAGE

Food consumption of Sri Lankan adults: an appraisal of serving characteristics Ranil Jayawardena1,2, Nuala M. Byrne1, Mario J. Soares3, Prasad Katulanda2, Andrew P. Hills4 1Institute of Health and Biomedical Innovation, Queensland University of Technology, Brisbane, Queensland, Australia 2Diabetes Research Unit, Faculty of Medicine, University of Colombo, Colombo, Sri Lanka 3Curtin Health Innovation Research Institute, School of Public Health, Faculty of Health Sciences, Curtin University, Perth, WA, Australia 4Mater Mothers’ Hospital, Mater Medical Research Institute and Griffith Health Institute, Griffith University, Brisbane, Queensland, Australia

Citation

R Jayawardena, NM Byrne, MJ Soares, P Katulanda, AP Hills. (2012) Food consumption of Sri

Lankan adults: an appraisal of serving characteristics Public Health Nutrition: 16 (4); 653-658

Chapter 4: Manuscript 3 71

ABSTRACT

Objective

The main aim of this study was to identify food consumption in Sri Lankan adults based on

serving characteristics.

Design

This is a cross-sectional study. Fruits, vegetables, starch, meat, pulses, dairy products and sugar

were assessed in the diet with portion sizes estimated using standard methods.

Setting

Randomly selected twelve clusters from Sri Lanka Diabetes Cardiovascular Study.

Subjects

Six hundred non-institutional adults.

Results

The daily intake of fruits (0.4), vegetables (1.7) and dairy (0.4) portions were well below

national recommendations. Only 3.5% of adults consumed the recommended five fruits and

vegetables per day and over one third of the population consumed no dairy products, and less

than 1% of adults consumed 2 portions per day. In contrast, Sri Lankan adults consumed over 14

portions of starch, and 3.5 portions of added sugars daily. Almost 70% of those studied exceeded

the upper limit of the recommendations for starch intake. The total number of meat and pulse

portions was 2.78 per day.

Conclusion

Dietary guidelines emphasize the importance of a balanced and varied diet however a substantial

proportion of the Sri Lankan population studied failed to achieve such a recommendation. Health

promotion should be focused on improving healthier dietary habits among this population.

72 Chapter 4: Manuscript 3

INTRODUCTION

Sri Lanka is a developing country in South Asia undergoing rapid socioeconomic transition and

both over- and under-nutrition are serious health concerns. In 2005, the prevalence of

hypertension, diabetes and dysglycaemia in Sri Lanka was nearly 20%, 11% and 20%,

respectively [1,2]. Although Sri Lanka is a developing country, it has recorded 524 deaths per

100,000 for mortality from cardiovascular and cerebrovascular disease, a figure which is

considerably higher than the rate in many affluent countries such as the UK (427), USA (397),

Australia (308) and France (205) [3]. Despite Sri Lanka having a very high prevalence of NCDs

and associated mortality, little is known about its causative factors. It is widely believed that the

NCD epidemic in the country is partially associated with unhealthy dietary habits [3].

Food intake patterns play an essential role in the maintenance of health and wellbeing at both

individual and population levels. Food products supply energy, essential macro- and micro-

nutrients, however, over- or under-nutrition have the potential to cause serious health

consequences [4]. A national level dietary survey has several important functions and provides

valuable information. Survey data are also helpful to monitor nutritional status, observe dietary

practices and study the relationships between diet and disease. The main objective of this study

was to identify food consumption according to servings in Sri Lankan adults. In addition, the

present study aimed to derive serving sizes and food exchange information not presently

available for some food groups in Sri Lanka.

METHODOLOGY

Subjects

Participants for the present study were recruited based on the sample from the Sri Lanka

Diabetes and Cardiovascular study (SLDCS), a national study conducted between 2005 and

Chapter 4: Manuscript 3 73

2006. Detailed sampling procedures used in the SLDCS have been previously reported (figure

4.1) [2].

Figure 4-1: Subject selection process of the Sri Lanka Diabetes and Cardiovascular Study.

The current study was conducted between January and March 2011 during which time the

researchers were able to collect data from the previously missing North and Eastern provinces in

the SLDCS because of the improved security situation. In the original study, researchers

randomly selected 100 clusters consisting of 50 subjects according to the probability-

proportional-to-size method, to gain a representative sample from seven of the nine provinces.

74 Chapter 4: Manuscript 3

From the 100 clusters, ten were randomly selected stratifying to the area of residence and

ethnicity. To address the gap in national data from the remaining two provinces, we selected one

cluster of 50 participants from the North and East by using ‘Village Office Units’ voter lists to

randomly select one household. The remaining 49 households were selected applying the

uniform method used in the SLDCS. In summary, the total sample in the present study

comprised 600 subjects (500 from previous SLDCS areas and 100 additional from the Northern

and Eastern provinces). Figure 2 shows the data collecting sites. Those who were pregnant,

lactating, acutely ill or on a therapeutic diet were excluded. The present study was approved by

the Ethics Review Committee, Faculty of Medicine, University of Colombo, Sri Lanka.

Measurements

The selected households were initially contacted via telephone by the study team who provided

information regarding the study and verbal consent was taken. Where telephone facilities or

contact phone numbers were unavailable, households were visited by the study team with prior

postal notice. Subsequently, households were visited on a random day to minimize bias for food

selection. Dietary and demographic details were obtained after final written informed consent

was obtained. An interviewer-administered questionnaire was used for data collection.

Information regarding socio-demographic factors, timing of daily routines and meals were

obtained.

Chapter 4: Manuscript 3 75

Figure 4-2: Map of Sri Lanka with data collection (▀) sites

24-hour Dietary Recall

Two interviewers obtained dietary data by asking the participants what they ate in the previous

24-hours in direct chronological order. To minimize the inter-personal variation at the end of the

day two interviewers reviewed each other’s work and maintained homogeneity of the recording

procedure. Where there was a disparity in the dietary recalls, participants were re-contacted or

the 24-hour recall repeated on a different day. Food portion sizes were obtained using standard

household measurements such as plate, bowl, cup, glass, and different spoons; and these were

clarified by demonstration using real utensils and series of food portion size photographs and

food atlas [5, 6]. When participants recalled the amount of food consumed by weight this value

was entered.

76 Chapter 4: Manuscript 3

Data entry and analysis

The daily food intake was divided into seven food groups, namely 1) Cereal or equivalents

(starchy food); 2) Vegetables; 3) Fruits; 4) Meat or alternatives; 5) Pulses; 6) Dairy, and 7)

Added sugar. Detailed methodology regarding the translation of food eaten into the respective

food groups is provided in Appendix 1 (after this manuscript).

Method for translating food consumed into food group servings

All food recorded in 24-hour recall by each participant was assigned to one of the seven major

food groups defined above. Food was recorded either in household measures (cups, spoons etc.)

or by weight in the 24 hour recall and was translated into serving size for of each food

consumed. Thus, weight of food in grams or amount of household measure of food was divided

by weight of one serving or amount of household measure for one serving and summed to derive

servings of each food group. Food which was a mixture of several food types was disaggregated

before ingredients were categorized into appropriate food groups. An example of disaggregation

is illustrated in figure 4-3. A similar method was used for the US population for food grouping

when food mixtures required disaggregation [7]. The servings of food consumed in mixed foods

were calculated by modifying existing recipe files to develop a cascaded recipe file with multiple

levels of breakdown. Common recipes were accepted after checking for face validity by

consulting nutritionists and when in doubt, respective households were contacted [8]. For

uncommon food items, detailed recipes were collected at the time of the 24-hour dietary recall

from participants or other responsible person from each household.

Statistics

Average daily portion sizes were calculated as the total portion size divided by the number of

participants. The sum of vegetable and fruit portions were divided to obtain average daily fruit

Chapter 4: Manuscript 3 77

and vegetable consumption, and the same method was used to calculate average daily meat and

pulse intake. We analyzed the mean daily consumption of each food group according to gender.

Two sample t-tests were used to determine whether the mean values differed between the

genders. Data were analyzed using SPSS version 14 (SPSS Inc., Chicago,IL, USA) statistical

package. In all analyses a p value <0.05 was considered statistically significant.

RESULTS

Sample size was 490 (with a response rate of 82%), of which 34.5% (n=169) were males. The

socio-demographic profile of the study population is shown in Table 4.1.

The estimated mean daily servings from the five major pyramid food groups from the random

24-hour dietary recall, according to gender is shown in Table 2. In addition, sub-categories of

protein types, namely pulses and meat and alternatives, and added sugar are also reported. Mean

intake of fruits (0.43 portions/day) and vegetables (1.73 portions/day) were well below minimum

recommendations (fruits >2 portions; vegetables >3 portions). The total of fruit and vegetable

intake was 2.16 portions per day. Daily consumption of meat or alternatives was 1.75 portions

and the sum of meat alternatives and pulses was 2.78 portions per day. On average, Sri Lankan

adults consumed over 14 portions of starch daily, moreover males consumed five more cereal

portions compared to females. Sri Lankan adults consumed on average, 3.5 portions of added

sugars per day. Table 3 compares food consumption of Sri Lankan adults with national [9] and

international (US) recommendations [10].

We identified considerable variations in consumption frequency for each food type and their

portion size in the study population. Table 4 illustrates that participants reported an intake of

different portion sizes for main food groups and their combinations. Starchy foods were

consumed by everybody; and over 88% met the minimum daily recommendations. Importantly,

nearly 70% of adults exceeded the maximum daily recommendation for starch portions per day

78 Chapter 4: Manuscript 3

(11/day). More than 12% of men consumed ≥25 starch servings per day. In contrast to their

starch consumption, participants reported a very low intake of other food groups (Table 4). Only

11.6%, 2.1% and 3.5% of adults consume the minimum daily recommended servings of

vegetables, fruits and, combined fruit and vegetable servings, respectively. Six out of ten adult

Sri Lankans sampled did not consume any fruit. Milk and dairy consumption was extremely low,

over one third of the population did not have any dairy products and less than 1% of adults

consumed 2 portions per day. A quarter of Sri Lankans did not report consumption of meat and

pulses. Regarding protein consumption, 36.2% attained the minimum Sri Lankan

recommendation of protein; and significantly more men achieved the recommendation of ≥3

meat or alternative servings per day (M:42.6%; F:32.8%, p<0.05).

DISCUSSION

Recently, the WHO STEP survey reported on some dietary aspects from one health area in the

Western Province [11] but apart from this the present study represents the first national level

dietary survey undertaken in Sri Lanka to obtain habitual dietary intake data of the general

population. As the UK National Nutrition and Dietary Survey (NDNS) collected dietary details

from 1724 participants from a population of 60 million; we believe that the sample size of 600

used in the current study is within adequate limits.

During the last 5 years, Sri Lanka has faced significant urbanization and this has resulted in

some previous study clusters changing from rural to urban status. Whilst the present study

population is reasonably representative of all major ethnic groups in the country, there was a

higher proportion of urban living, mean age and participants with a higher mean BMI compared

to previous surveys [12]. Our results showed a low mean daily intake of fruit and vegetables

amongst Sri Lankan adults (2.16 portions) compared to the US (3.0) and France (3.6) [13]. The

Chapter 4: Manuscript 3 79

low intake of fruits and vegetables may be a contributing factor to the high prevalence of diet-

associated NCDs such as diabetes, non-alcoholic fatty liver and cardiovascular diseases in Sri

Lanka compared to other countries [3]. The specific reason for the low intake of fruit and

vegetables is unclear; studies from developed countries suggest a lack of perceived social

pressure to increase fruits and vegetable intake and suggest that increased public health efforts

require stronger health messages that incorporate consumer awareness of the low consumption

levels [14]. Moreover, peoples’ low purchasing ability and seasonal variation of fruits and

vegetables prices may adversely affect consumption. Despite five servings of fruits and

vegetables per day being considered the minimum daily intake by national dietary guidelines [9]

nearly half of the population eats less than 2 portions of fruits and vegetables, with less than 4%

reaching the minimum recommendation. Somathunga reported that 96.9% of Sri Lankan adults

did not consume five fruits and vegetables daily in the WHO Step Survey (2004) undertaken in

the Western province of Sri Lanka, comparable with our findings [11].

Pulses were the main source of protein, mainly dhal, the most common curry in the local

context, and boiled pulses eaten for breakfast. Although pulses are grouped in the protein

category, the main nutrient is carbohydrate, and thus invariably, consumption of pulses masks

significant amounts of carbohydrate. There is no conclusive evidence regarding protein intake

and disease risk in Sri Lanka. The MASALA study reported that higher levels of protein

consumption are associated with increased odds of diabetes in South Asians independent of age,

sex, waist circumference and hypertension [15]. A significant proportion of Sri Lankan males

(data not shown) consume over 5 servings of meat per day.

Sri Lankans consumed large numbers of starch servings; nearly 65% consumed well above the

upper cut-offs of the food pyramid guidelines and a considerable proportion of males consumed

very high levels of starch. This is mainly due to the average person’s meal being comprised of

three of quarters rice with a small amount of vegetable curry (averaging 15 g), a small piece of

80 Chapter 4: Manuscript 3

meat or fish (15 g) and some starchy curry such as potato or dhal (supplementary file 1).

Relatively low levels of starch portions were consumed by females mainly due to low absolute

food intake. A high carbohydrate meal leads to negative metabolic consequences such as

hyperinsulinaemia, high serum TAG and low HDL-cholesterol levels [16]. Most Sri Lankans

consume the largest starch portion for lunch or dinner and limit themselves to three meals per

day (data not shown); which may cause postprandial hyperglycaemia and

hypertriacylglycerolaemia [16]. More than one fifth of Sri Lankan adults are dysglycaemic and

the prevalence of diabetes is alarmingly high [2]; the high consumption of carbohydrate may be

associated with the diabetes epidemic in the country.

Dairy products provide valuable nutrients such as calcium, which is important for building and

maintaining strong bones. In addition, milk products provide several essential nutrients such as

proteins, vitamins and minerals. Lekamwasam and colleagues reported a 45% prevalence of

osteoporosis among postmenopausal women in Sri Lanka [8]. The CARDIA study revealed that

dairy consumption was inversely associated with the incidence of all individual components of

insulin resistance syndrome among individuals with a BMI ≥25 kg/m2 and increased dairy

consumption may reduce risk of type 2 diabetes and cardiovascular disease. Dairy intake is

substantially lower than Sri Lankan recommendations; over 1/3 of the population did not have

any dairy products and only 5% reached minimum levels. The main reason behind the low dairy

consumption could be the price of dairy products is unaffordable mainly due to the lack of local

production of dairy products and the consumption of dairy products largely depends on imported

milk powder [17];

This first national level dietary survey provides a sound basis for future food policy as it affects

Sri Lankan adults, and for the development of relevant nutrition education programs.

Furthermore, the rational assessment of food portion exchange tables will offer health

Chapter 4: Manuscript 3 81

professionals such as nutritionists, general practitioners, and nurses, valuable insights into Sri

Lankan meals and the development and prescription of meal plans in clinical and community

settings. A major strength of our study was the recruitment of a representative group from all

ethnic, education, areas of residence and age groups. Despite the relatively low participation of

male participants, women’s diet composition is similar to that of their male counterparts as most

Sri Lankan men eat at home. Second, the use of a random 24-hour dietary recall method helped

to obtain accurate results regarding dietary habits. Thirdly, disaggregation of food in Sri Lankan

dishes to guideline-based food groups leads to the more accurate counting of small portions of

foods in respective groups (as shown in figure 4-4). The main limitation of our data collection

and analysis was lack of data on oil consumption. Unlike meals in Western countries, coconut

oil, coconut milk or scraped coconuts are included in most mixed dishes which lead to

significant methodological challenges in obtaining accurate measurements of fat intake [18].

Secondly, portion sizes were estimated by recalling commonly used utensils and demonstrating

standard spoons, cups and plates, in addition to series of food photographs.

CONCLUSION

Dietary guidelines have emphasized the importance of a balanced and varied diet. Meals that

include no servings or very few servings of different food groups such as fruits and vegetables,

dairy products, fish and meat and pulses, lack both balance and variety. It is evident that a

substantial proportion of the Sri Lankan population does not consume a varied and balanced diet

which is suggestive of a close association between the nutrition-related NCDs in the country and

these unhealthy eating habits. We recommend that the government, health institutions and

organizations conduct larger national level dietary and nutrition surveys periodically to identify

associated disease conditions. This would allow practical public health initiatives to improve the

quality of the Sri Lankan diet.

82 Chapter 4: Manuscript 3

Chapter 4: Manuscript 3 83

REFERENCE LIST

1. Wijewardene, K., et al., Prevalence of hypertension, diabetes and obesity: baseline

findings of a population based survey in four provinces in Sri Lanka. The Ceylon

medical journal, 2005. 50(2): p. 62-70.

2. Katulanda, P., et al., Prevalence and projections of diabetes and pre-diabetes in adults in

Sri Lanka—Sri Lanka Diabetes, Cardiovascular Study (SLDCS). Diabetic Medicine,

2008. 25(9): p. 1062-1069.

3. Abeywardena, M., Dietary fats, carbohydrates and vascular disease: Sri Lankan

perspectives. Atherosclerosis, 2003. 171(2): p. 157.

4. Krebs-Smith, S., et al., Characterizing food intake patterns of American adults. The

American Journal Of Clinical Nutrition, 1997. 65(4): p. 1264S-1268S.

5. Michael Nelson et al, A Photographic Atlas of Food Portion Sizes. 1997, UK: MAFF

publications.

6. Suzana Shahar et al. Atlas of Food Exchanges & Portion Sizes. 2009, MDC Publishers:

Kuala Lampur.

7. Cleveland, L., et al., Method for assessing food intakes in terms of servings based on

food guidance. The American Journal Of Clinical Nutrition, 1997. 65(4): p. 1254S-

1263S.

8. Dissanayake, C., Ceylon Cookery. 9 ed. 2010, Sri Lanka: Stamford Lake (pvt) Ltd.

9. U.M.M. Samaranayake et al., Food Base Dietary Guidelines for Sri Lanka. 2011,

Colombo: Nutrition Devision, Ministry of Healthcare and Nutrition, Sri Lanka.

10. United States Department of Agriculture, The Food Guide Pyramid in Home and Garden

Bulletin Number 252 Center for Nutrition policy and Promotion, Editor. 1992. p. 17.

11. Somatunga, L.C., NCD Risk Factor Survey in Sri Lanka (STEP Survey). 2004, WHO.

84 Chapter 4: Manuscript 3

12. Katulanda, P., et al., Prevalence of overweight and obesity in Sri Lankan adults. Obes

Rev, 2010.

13. Tamers, S.L., et al., US and France adult fruit and vegetable consumption patterns: an

international comparison. Eur J Clin Nutr, 2009. 63(1): p. 11-7.

14. Levin, A., Nutrition and Policy. 5: Who Should Teach Patients about Nutrition? Annals

of Internal Medicine, 1999. 131(4): p. 317-318.

15. Wang, E.T., L. de Koning, and A.M. Kanaya, Higher Protein Intake Is Associated with

Diabetes Risk in South Asian Indians: The Metabolic Syndrome and Atherosclerosis in

South Asians Living in America (MASALA) Study. Journal of the American College of

Nutrition, 2010. 29(2): p. 130-135.

16. Misra, A., et al., South Asian diets and insulin resistance. Br J Nutr, 2009. 101(4): p.

465-73.

17. FAO, Sri Lanka –dairy products, in FAO Briefs on Import Surges. 2007, Trade and

Markets Division (EST), Food and Agriculture Organization of the United Nations

(FAO): Rome.

18. Amarasiri, W.A. and A.S. Dissanayake, Coconut fats. Ceylon Med J, 2006. 51(2): p. 47-

51.

Chapter 4: Manuscript 3 85

Table 4-1: Demographic characteristics and BMI characteristics of the sample Variables Males (N=169) Female (N=321)

Age (y) (mean±SD) 48.4±15.6 48.1±14.1

Area of residence % (n)

• Urban

• Rural

• Estate †

27.8 (47)

60.4 (102)

11.8 (20)

36.1 (116)

57.6 (185)

6.2 (20)

Ethnicity % (n)

• Sinhalese

• Muslim

• Sri Lankan Tamil

• Indian Tamil

71.0 (120)

4.7 (8)

11.8 (20)

12.4 (21)

80.1(257)

7.2(23)

7.2(23)

5.6(18)

Education level % (n)

• No Schooling

• Up to 5 years

• Up to 11 years

• Up to 13 years

• Graduate

6.5 (11) 6.5 (21)

27.2 (46) 25.2(81)

34.9(59) 40.5(130)

27.2(46) 22.7(73)

4.1(7) 5.0(16)

BMI (kg/m2) (mean±SD) 21.97±3.45 23.73±4.29

† Tea and rubber plantation zones

86 Chapter 4: Manuscript 3

Table 4-2: Average dietary intake of servings from different food group by Sri Lankan adults Food group Mean portions (SD)

All adults SD Males SD Females SD

Starch 14.06 5.59 17.17 6.17 12.39 4.45

Fruits 0.43 0.62 0.44 0.77 0.43 0.65

Vegetables 1.73 1.25 1.95 1.42 1.61 1.13

Meat or alternatives 1.75 1.63 1.92 1.88 1.65 1.48

Pulses 1.04 1.01 1.29 1.24 0.90 0.83

Dairy 0.39 0.46 0.40 0.48 0.39 0.45

Sugar 3.56 3.10 3.64 3.34 3.51 2.97

Fruit and vegetable 2.16 1.46 2.39 1.65 2.04 1.34

Pulses and meats 2.78 1.87 3.22 2.14 2.55 1.66

Table 4-3: Comparison of food intake of Sri Lankan adults with national and international recommendations.

Food groups Average intake of portions

National recommendations [9]

US recommendations[10]

Starch 14 6-11 6-11

Fruits 0.4 2-3 2-4

Vegetables 1.7 3-4 3-5

Fruits and vegetables 2.1 ≥ 5 ≥ 5

Meat and pulses 2.8 1-2 2-3

Dairy 0.4 1-2 2-3

Sugar 3.6 low Sparingly

Chapter 4: Manuscript 3 87

Table 4-4: Percentage distribution of the study sample according to their consumed foods portions from different food groups

Food group Number of portions All adults Males Females Vegetables >0 93.2 92.3 93.6 ≥1 74.7 70.4 63.4 ≥2 33.1 39.1 29.9 ≥3 11.6 16.6 8.9 Fruits >0 39.8 36.7 41.4 ≥1 12.4 12.4 12.4 ≥2 2.1 2.4 1.9 Fruits and vegetables >0 95.0 93.5 95.9 ≥1 74.1 76.9 72.6 ≥2 47.4 53.8 43.9 ≥3 23.4 26.6 21.7 ≥4 8.5 13 6.1 ≥5 3.5 5.3 2.5 Starch >0 100 100 100 ≥8 88.2 95.3 84.4 ≥11 68.9 84.6 60.5 ≥14 41.6 63.9 29.6 ≥20 13.7 27.2 6.4 ≥25 5.0 12.4 1.0 Pulses >0 74.9 75.1 74.8 ≥1 37.5 43.2 34.4 ≥2 12.4 21.9 7.3 ≥3 4.6 8.9 2.2 Meat >0 78.7 72.2 82.2 ≥1 57.6 57.4 57.6 ≥2 32.5 36.7 30.3 ≥3 17.8 20.7 16.2 Meat and pulses >0 95.9 95.9 95.9 ≥1 83.0 85.2 81.8 ≥2 59.0 65.1 55.8 ≥3 36.2 42.6 32.8 ≥4 19.7 30.8 17.3 ≥5 11.6 18.9 7.6 Dairy ≥0 61.9 60.9 62.4 ≥0.5 30.0 30.8 29.6 ≥1 5.8 4.1 6.7 ≥2 0.8 1.2 0.6

88 Chapter 4: Manuscript 3

Figure 4-3. Example of a disaggregated recipe showing multiple levels (Chicken Koththu)

Food reported

Level 1

Ingredients

Level 2 Level 3

Oil

Flour

Onion

Carrot

Curry leaves

Leeks

Chicken Koththu

Oil

Egg

Meat

Vegetables

Parat roti

Chapter 4: Manuscript 3 89

SUPPLEMENTARY MATERIALS, PART 1

Portion size estimations

Estimation of vegetable portions

Fruits, vegetables and leaves of all kinds whether fresh, canned, frozen, cooked, or raw, and

juices all count in the diet. However, starchy food such as potatoes, yam, roots, jack fruits (not

ripen), bread fruits, jack fruit seeds and ash plantain (without peel) were not included in the fruit

and vegetable group although they were consumed as curries in the Sri Lankan context, they

were counted as for cereal or equivalents. Well-ripened jack fruits (Waraka and Wala) contribute

to the fruits group. However, ash plantain (with peel) is considered a vegetable due to the high

level of dietary fiber and plant nutrients but only counts as a maximum one portion per day with

the remainder included in the starch group. Pumpkin which is a starchy vegetable, was

categorized under the vegetable group. In Sri Lanka, most green leaves are half-cooked or mixed

with coconut scrapes or oil however were included in the vegetable group. Coconut sambol (pol

sambol) is a very common Sri Lankan cuisine and widely consumed in rural communities. As

the main ingredient of coconut sambol is finely grated coconut, chilli, onion, curry leaves and

lime juice, without disaggregation it was considered a vegetable although it contains a

significant amount of fat. Moreover, Lunu-miris (chilli and onion paste), seeni-sambol (cooked

onion with sugar) was also considered in the vegetable group, However, katta-sambol (mixed

with dry fish and onion) was disaggregated to its main ingredients. Other mixed curries were

disaggregated for respective food groups according to recipes. For example, potato and pea curry

was divided to food groups according to respective pre-cooked proportions of potato and peas.

‘Polos’ which is the young jack fruit, is considered a vegetable as it contains less starch. Kiri

hodi (milk curry) is basically prepared mainly with coconut milk and some spices. In contrast to

90 Chapter 4: Manuscript 3

coconut sambol it consists of low plant products and therefore kirihodi is not included in the

vegetable group. However, kirihodi is not categorized under any food group.

Vegetables are prepared as salad, individual curries and mixed curries by using several types of

food preparation methods. While cooking the texture and the moisture content of vegetables are

changed or reduced, thus volume is reduced. Therefore, three heaped table spoons or ½ cup or

80 grams of cooked vegetable is defined as one vegetable serving [1-4]. If there is a vegetable

curry with half amount gravy six table spoons are defined as one vegetable portion. In Sri Lanka,

vegetables are served from table spoons and coconut spoons and thus as a default, one medium

size coconut spoon is considered as three table spoons or one serving. However, investigators

cross-checked and clarified the size of coconut spoons with model coconut spoons and food

images.

Despite ash plantain (with peel) and sweet potato being considered as vegetables they were

calculated for maximum of one portion in a day. One serving of commonly consumed curries is

weighed to define the weight of one portion of individual vegetable curry. When faced with

difficulties to find the weight of one tablespoon of a vegetable curry, the weight of one table

spoon was considered as 15 grams.

Estimation of fruit portions

Fresh, juiced or dried fruits all count in the diet. Fruit juice was included in 'pieces of fruit' if it

was at least a glass of fresh juice in a day. Even if more than one glass per day was reported, it

would only count as one portion of fruit per day [2]. A smoothie or fresh fruit juice containing

all of the edible pulped fruit and/or vegetable may count as more than one portion but this

depends on how it's made. Smoothies count as up to a maximum of two portions per day [3].

Chapter 4: Manuscript 3 91

However, unlike western countries the frequency of fruit/vegetable intake as juice was very

limited. Cordial and artificially flavoured fruit drinks were not categorized and they were

classified in the sugary group.

The portion sizes of fruits were defined as follow.

One portion of fruit:

• Small sized fruits– Ten fruits considered as one portion, example: grapes, veralu, nelli,

lovi, rose apple (jamboo);

• Small–medium size fruits – number may vary (2-6): ambarella, banana (small), naminan,

rambutan, passion fruit, mangosteen, jack fruit ripened (waraka);

• Medium-sized - one medium fruit, such as one apple, banana, pear, orange, guava,

woodapple, belli, mandarin;

• Large-sized - one slice of papaya, one slice of melon (two-inch slice), one large slice of

pineapple, two slices of mango (two-inch slices), pomegranate (1/2 medium), durian (2

pieces);

• Dried fruit: One tablespoon of raisins, currants, sultanas, one tablespoon of mixed fruit,

two figs, three prunes, one handful of banana chips;

• Juice: One medium glass (150 ml) of fruit juice;

• A-half cup of chopped fruits.

Some of the portions were adjusted to Sri Lankan conditions by considering the size of the fruit.

Though pineapple is defined as one longitudinal slice, in Sri Lanka pineapple is commonly cut

into round shapes. Therefore, a pineapple portion was defined as one large slice or two round

shapes slices. The portion size of banana is the equivalent of one medium-sized banana in

several dietary guidelines. Since several types of Sri Lankan bananas are smaller than in Western

92 Chapter 4: Manuscript 3

countries, two bananas were defined as one portion. One portion of fruit is defined as 80 grams

of edible portion of fruit or 100 grams of whole fruit and the average number of fruit items was

counted. Curries prepared from fruits are defined under the vegetable category, for example:

mango curry, papaw salad.

Estimation of pulse portions

Pulses are another sub-food group categorized under meat exchange as it provides protein [5].

Pulses are rich in nutrients including protein, dietary fiber, vitamins (folate) and minerals (zinc,

iron, and magnesium) and are low in total and saturated fat and contain no cholesterol. While

pulses contain fiber, they do not provide the same mixture of vitamins, minerals and other

nutrients as fruit and vegetables [3]. Thus, beans and pulses are not included in the vegetable

group in our classification.

Cooked pulses, ½ tea cup or three full table spoons or 1 coconut spoon is defined as one pulse

portion. The weight of one serving of cooked pulse varieties are defined by considering that one

serving should have 7 grams of protein. ‘Soya meat’ is superior in nutritional quality than other

pulses (http://www.soyfoods.org/soy-products/soy-fact-sheets/soy-meat-alternative-fact-sheet).

It contains more protein and is also a good source of iron and calcium. Soya products (e.g.

texturized vegetable protein) contain high quality protein and approximately 7 g of protein will

be contained in two table spoons.

Estimation of dairy products

All fluid milk products and many foods made from milk are considered part of this food group

[6]. Milk contains numerous beneficial nutrients such as calcium, phosphorous, magnesium,

vitamin B12, vitamin A, zinc and riboflavin. These nutrients are favorable for healthy bones and

teeth, for muscle function, and for immune function.

Chapter 4: Manuscript 3 93

One glass (250 ml) of fresh milk is defined as one portion [4]. As milk powder is used

commonly in Sri Lanka as a primary dairy food source three table spoonfuls is defined as one

serving equivalent to fresh milk. Two small cups of yoghurt (80 g each) and one tea cup or eight

table spoons of curd is considered as one serving [4]. Two slices or two wedges of cheese or 1/8

from 250 g of cheddar cheese are defined as one portion [1, 7]. Malted milk powders and Milo

are drunk as replacements for milk. However, those are defined under the starch group as they

contain a considerable amount of carbohydrate [7].

Estimation of cereal or equivalent portions

Cereals contain significant amount of vitamins, minerals, carbohydrates, fats, oils, and protein in

their natural form (as in whole grain). When a cereal is milled or processed the bran and wheat

germ is removed. Through these processes many of the vitamins, minerals and phytochemicals

are lost and remainder is mostly carbohydrate. Similarly, tubers and starchy vegetables have

high carbohydrate content.

One portion of cereal or equivalent is defined as the amount of starchy food in which 15 g of

carbohydrate is contained. 1/3 tea cup of rice, milk rice and noodles, one slice of bread, ¼ of 10

cm diameter and 0.5 cm thickness coconut roti, 2 string hoppers and ½ hopper is considered as

one serving of each food. 1/3 tea cup of boiled bread fruit, jak and sweet potato, ½ tea cup of

ash plantain and yam is defined as one portion.

Servings of cooked starch vegetables are decided by comparing the amount of curry which

contains 15 g of carbohydrate. Then portion size is calculated as how many household measures

with the above weight of curry. This is used for both cooked and raw foods. As an example, one

portion of manioc curry is 90 g and it comprises three table spoons. Ash plantain curry 90 g is

defined as one serving and six table spoons of it is taken as one portion.

94 Chapter 4: Manuscript 3

Biscuits, cake, short eats (roll, cutlet), vegetable roti and papadam are also included in starch

portions [8]. One piece of 4 cm slice cake and one short eat (small bakery items) is calculated for

one portion cereal or equivalent. As size and weight of biscuits vary, servings of biscuits were

taken from pre-defined portion size from nutrition information leaflets and direct contact with

manufacturers.

Estimation of meat portions

The meat group is large and includes meat and meat alternatives fish, seafood, eggs and pulses

[5]. These foods contain protein and are also a good source of iron and zinc and several B

vitamins.

One egg, 30 g of meat, fish, and 30 g of prawns and meat balls is defined as one meat portion.

The serving size was defined considering 7 grams of protein in that food portion. Since dry fish

contains more protein, 15 g is defined as one portion. But when it is defined for dry fish curry

one portion is considered as 30 g since it contains gravy. Commonly, sprats are served using

table spoons. As one table spoon holds 7-8 sprats weight of one table spoon is considered as 7.5-

8 g. Thus 2 table spoons of sprats are defined as one portion. In Sri Lanka, 1 kg of chicken is cut

into 13-15 pieces and one piece of chicken is considered as two portions. Since non-vegetarian

fried rice contains more than 2.6 g protein than normal cooked rice, it is considered as 1/3 of a

meat portion.

Estimation of sugar portion sizes

All types of glycaemic carbohydrates will be digested, absorbed and ultimately converted to

glucose or metabolized in the body. Although all sugar and starches are indistinguishable in

metabolic effect, there are different health implications (e.g. hyperglycemia) between

carbohydrates in terms of their dietary origin [8]. Extracted sugar from food has virtually no

Chapter 4: Manuscript 3 95

nutrients only energy. A high intake of sugar is associated with negative health consequences;

hence sugar was defined as a separate food group. Five grams of sugar is defined as a portion.

One portion of honey, treacle and jaggery was calculated estimating the weight or volume which

contains 5 g of sugar. The amount of sugar in sweets, desserts and sugary beverages were

estimated by recipes.

Reference list

1. Michael Nelson, M.A., James Meyer, A Photographic Atlas of Food Portion Sizes. 1997,

UK: MAFF publications.

2. The British Dietetic Association (2006) Fruit and Vegetables - Enjoy 5 a day!! Food

Fact.

3. nhs-uk. 5 A DAY: what counts? Popular topics 2009 18/12/2009 [cited 2011 10/06];

Available from: http://www.nhs.uk/Livewell/5ADAY/Pages/Whatcounts.aspx.

4. Non-Communicable Disease Unit, Food Base Dietary Guidelines for Sri Lanka. 2003,

Colombo: Ministry of Healthcare and Nutrition, Sri Lanka.

5. USDA. Protein foods. Food groups 2011 [cited 10/6/2011.

6. USDA, Dairy Group. Food groups. 2011: usda.org.

7. Suzana Shahar, N.A.M.Y., Nik Shamita Safii, Rafidah Ghazau, Roslina Ahmad., Atlas of

Food Exchanges & Portion Sizes. 2009, MDC Publishers: Kuala Lampur.

8. Jayatissa, R., Optimum Nutrition for Beating Diabetes. 1 ed. 2011, Colombo: Lalith

Printers.

96 Chapter 4: Manuscript 3

SUPPLEMENTARY MATERIALS, PART 2:

Figure 4-4 : A typical Sri Lankan lunch

Chapter 5: Manuscript 4 97

Chapter 5: Manuscript 4

Contribution of co-authors for thesis by published paper The authors listed below have certified that

1. They meet the criteria for authorship in that they have participated in the conception, execution, or interpretation, of at least that part of the publication in their field o expertise:

2. They take public responsibility for their part of the publication, except for the responsible author who accepts overall responsibility for the publication;

3. There are no other authors of the publication according to these criteria; 4. Potential conflicts of interest have been disclosed to (a) granting bodies, (b) the editor or

publisher of journals or other publications, and (c) the head of the responsible academic unit, and 5. They agree to the use of the publication in the student’s thesis and its publication on the

Australasian Digital Thesis database consistent with any limitations set by publisher requirements.

In the case of this chapter Paper: Development of a food frequency questionnaire for Sri Lankan adults. Contributor Statement of contribution Ranil Jayawardena Study design, data collection, data analysis

and drafted the manuscript Sumathi Swaminathan Study design and statistics analysis Nuala Byrne Study design, data interpretation and revision

of the draft and approved the final manuscript.

Mario Soares Study design, data interpretation and revision of the draft and approved the final manuscript.

Prasad Katulanda Study design, data interpretation and revision of the draft and approved the final manuscript.

Andrew Hills Study design, data interpretation and revision of the draft and approved the final manuscript.

Principal supervisor confirmation I have sighted email or other correspondence from all co-authors confirming their certifying authorship.

Nuala Byrne 18/04/2013

Name signature Date

98 Chapter 5: Manuscript 4

TITLE PAGE

Development of a food frequency questionnaire for Sri Lankan

adults.

Ranil Jayawardena1,2*, Sumathi Swaminathan3, Nuala M. Byrne1, Mario J. Soares 3,4,

Prasad Katulanda2, Andrew P. Hills5

1Institute of Health and Biomedical Innovation, Faculty of Health, Queensland University of

Technology, Brisbane, Queensland, Australia.

2Diabetes Research Unit, Department of Clinical Medicine, Faculty of Medicine, University of

Colombo, Colombo, Sri Lanka.

3St John's Research Institute, St John’s National Academy of Health Sciences, Bangalore, India.

4Curtin Health Innovation Research Institute, School of Public Health, Curtin University, Perth,

Western Australia.

5Mater Mothers’ Hospital, Mater Medical Research Institute and Griffith Health Institute,

Griffith University, Brisbane, Queensland, Australia.

Citation

R Jayawardena, NM Byrne, MJ Soares, P Katulanda, AP Hills. (2012) Development of a food

frequently Questionnaire for Sri Lankan adults. Nutrition Journal 11:63.

Chapter 5: Manuscript 4 99

ABSTRACT

Background: Food Frequency Questionnaires (FFQs) are commonly used in

epidemiologic studies to assess long-term nutritional exposure. Because of wide variations in

dietary habits in different countries, a FFQ must be developed to suit the specific population. Sri

Lanka is undergoing nutritional transition and diet-related chronic diseases are emerging as an

important health problem. Currently, no FFQ has been developed for Sri Lankan adults. In this

study, we developed a FFQ to assess the regular dietary intake of Sri Lankan adults.

Methods: A nationally representative sample of 600 adults was selected by a multi-stage

random cluster sampling technique and dietary intake was assessed by random 24-h dietary

recall. Nutrient analysis of the FFQ required the selection of foods, development of recipes and

application of these to cooked foods to develop a nutrient database. We constructed a

comprehensive food list with the units of measurement. A stepwise regression method was used

to identify foods contributing to a cumulative 90% of variance to total energy and

macronutrients. In addition, a series of photographs were included.

Results: We obtained dietary data from 482 participants and 312 different food items were

recorded. Nutritionists grouped similar food items which resulted in a total of 178 items. After

performing step-wise multiple regression, 93 foods explained 90% of the variance for total

energy intake, carbohydrates, protein, total fat and dietary fibre. Finally, 90 food items and 12

photographs were selected.

Conclusion: We developed a FFQ and the related nutrient composition database for Sri

Lankan adults. Culturally specific dietary tools are central to capturing the role of diet in risk for

chronic disease in Sri Lanka. The next step will involve the verification of FFQ reproducibility

and validity.

100 Chapter 5: Manuscript 4

INTRODUCTION

It is widely recognized that an unhealthy diet is a major risk factor for many of the chronic non-

communicable diseases and improving dietary habits is not simply an individual but a societal

problem [1]. However, it is difficult to assess the dietary habits of free-living individuals because

of variability in food preference and availability, socio-economic factors, cultural concerns and

educational level [2]. National dietary surveys have several important functions and provide

valuable information on dietary habits and nutritional status. Moreover, nutritional monitoring is

important for implementation of programs related to food, nutrition, and health promotion for

any country serious about promoting the health and wellbeing of its population [3]. Food

Frequency Questionnaires (FFQs) are the most common dietary assessment tool used in large

epidemiologic studies of diet and health [4]. To cater for differences in food based on cultural

and regional factors, numerous FFQs have been developed comprising the list of foods

commonly eaten in a particular country or by a particular population.

Sri Lanka is a ‘low-middle’ income country in South Asia with a population of nearly 21

million. Sinhalese is the main ethnic group but there are significant proportions of Tamils and

Moors living in different parts of the country. With recent economic development, urbanization

and changes in lifestyle patterns, Sri Lanka is experiencing a nutritional transition with the

coexistence of under-nutrition and overweight and obesity [5,6]. A high prevalence of iron

deficiency anemia among pregnant women, and subclinical vitamin A deficiency, stunting and

wasting among pre-school children, are still major public health problems [7]. Recent studies in

Sri Lanka indicate a high prevalence of diabetes mellitus with one in every five adults aged

above 20 years having either diabetes or pre-diabetes [8], and the prevalence of hypertension,

obesity, dyslipidaemia in urban areas are reaching epidemic proportions [9,10]. A quarter of

adults is suffering from metabolic syndrome [11]. In the Sri Lankan context, diet-related chronic

Chapter 5: Manuscript 4 101

diseases currently account for an estimated 18.3% of total mortality and 16.7% of hospital

expenditure [6].

Despite strong indications of a rise in lifestyle-related non-communicable diseases (NCDs) in Sri

Lanka, published guidelines are not justified with sound research evidence on dietary habits

[12]. There is a paucity of data on the dietary habits of Sri Lankans and in order to assess dietary

intake, a culturally specific dietary assessment tool is necessary. This paper describes the

development of a FFQ for Sri Lankan adults designed to assess and monitor dietary intake and

be used to assist in national level programs to combat non-communicable diseases.

METHODS

Study sample

Data were collected from a subset of the national ‘Sri Lanka Diabetes and Cardiovascular Study’

(SLDCS) using a multi-stage, stratified, random sampling procedure (n=500) [8]. However, data

collection in the SLDCS was affected by the prevailing civil war which resulted in no data being

collected from Northern and Eastern provinces. To obtain a nationally representative sample,

additional subjects (n=100) were later recruited from the two provinces using similar selection

criteria. Details of subject selection are published elsewhere [13].

Data collection

Selected households were contacted via telephone and the purpose of the study explained and

verbal consent taken. Where telephone facilities or contact phone numbers were unavailable,

households were visited by the study team with prior postal notice. Subsequently, households

were visited on a random day and dietary and demographic details obtained after informed

written consent was provided. An interviewer-administered questionnaire was used for data

collection and information regarding socio-demographic factors and 24-h dietary recall (24DR)

102 Chapter 5: Manuscript 4

was obtained. Two trained nutritionists retrieved dietary data using a standardized manual of

procedure. Food portion sizes were obtained from participants using standard household

measures such as a plate, bowl, cup, glass, and spoons of different size; as well as using

photographs (Supplementary file 1) of food portion size and a food atlas [14, 15].

Development of a nutrient composition database

It is essential to have food composition values to convert information from an FFQ into

macronutrient and micronutrient values. Currently the database on Sri Lankan dishes is meagre.

We therefore compiled information from the food composition tables of Sri Lanka [16], United

States Department of Agriculture nutrient database (USDA) [17], the Indian Food Composition

Tables [18], and McCance and Widdowson’s food composition tables [19] to develop a

comprehensive and new nutrient composition database as follows:

a) Nutrition values for single food items were taken mainly from the USDA nutrient

database.

b) Nutrition information leaflets or details from direct contact with producers were used for

locally available food products (e.g. biscuits).

c) For mixed dishes and cooked foods, local recipes were taken from popular cookery

books [20] and by interviewing participants. All recipes were accepted after checking

for face validity by consulting local housewives and nutritionists. According to the

recipes, ingredients were weighed to the nearest 1 g for edible portions of the foods, and

the food items were cooked and weighed. Nutritional composition of the final recipe

was calculated by entering nutritional values and weights of individual ingredients into

a spreadsheet. The sum of each nutrient was computed and standardised to 100 g of the

final product. Data on weight loss associated with cooking (e.g. due to water

evaporation) was recorded to ensure accurate nutrient density of the portion size

Chapter 5: Manuscript 4 103

consumed. However, nutrient losses (e.g. vitamins) during food preparation were not

considered.

Newly developed food composition data for each recipe was entered into NutriSurvey 2007

(EBISpro, Germany) nutrient analysis software.

Development of the FFQ

In addition to 24-h recalls, a number of additional methods were used to obtain a more

comprehensive food list.

• Open ended questions were asked to capture details of seasonal fruits and festival foods.

• Alcohol intake and use of dietary supplements were collected separately.

• Local nutrition experts were contacted to obtain unreported foods for the different ethnic

groups.

Food items were divided into eight groups by two independent nutritionists and included: 1)

cereals or equivalents; 2) vegetables; 3) pulses; 4) meat or equivalents; 5) fruits; 6) drinks; 7)

miscellaneous; and 8) alcohol.

• Using stepwise multiple regression analysis, food items that contributed to a cumulative

90% of the variance in energy, carbohydrates, fat, protein and dietary fibre were included

in the FFQ.

• Food items with similar consumption patterns and nutrients were aggregated into groups

on the basis of their energy, carbohydrate, fat, protein and dietary fibre.

To improve the quantification of food intake we included food photographs to estimate habitual

portion sizes for those foods that could not be easily assessed in natural units or household

measures. The FFQ contains colour photographs of 3 different sized portions of four commonly

consumed foods namely rice, vegetable, chicken, and dhal (lentil). For each food, photograph A

represents the 25th percentile, B the median and C the 75th percentile of the distribution of

104 Chapter 5: Manuscript 4

serving sizes reported in this study. Seven different serving sizes can be attributed to each food

class, by selecting serving sizes that are equal to A, B or C, less than A, greater than C and

between A-B or between B-C [21]. However, we found low clarity in determining portion sizes

from pre-test subjects when vegetables, meat and dhal were pictured alone on the plate. In Sri

Lanka, curries are served on rice, not as a side dish; therefore, to improve precision and accuracy

regarding portion sizes, we displayed individual food items on the medium rice plate (B) as the

background.

The majority of FFQs from developed countries have used several frequency categories [22,23].

However, this is not the case in Southern India [24]. To some extent, open-ended response scales

(number of units taken at a time: ‘per day’, ‘week’, ‘month’ or ‘year’) reflect the precision with

which participants can realistically describe their usual intake. We also used an open-ended

response scale. FFQs were designed to incorporate interviewer-administered methods. A

protocol was developed to obtain data uniformly. The questionnaire was pilot tested for clarity,

interpretation and improvement of format in 25 individuals who had similar demographic

characteristics to the study group but who were not participants in the study. All statistical

analyses were undertaken using SPSS version 16 (SPSS Inc., Chicago, IL, USA) and

independent sample T-test was used to compare demographic characteristics and nutrient intake

between men and women. The significance level was set at 0.05 in all analyses.

RESULTS AND DISCUSSION

From the total sample of 600, 482 completed (Male=166; Female=316) all demographic,

anthropometric and dietary profiles. The demographic profile of the study population is shown in

Table 5.1. Overall, there was a preponderance of Sinhalese followed by Tamils and Moors.

Males had lower BMI values compared to their female counterparts (M: 22.0±3.5 vs. 23.7±4.3

kg/m2; p<0.05). Average daily energy intake was 1656.7±535.0 kcal, with significantly higher

Chapter 5: Manuscript 4 105

caloric consumption by men compared to women (p<0.05). The main source of energy was from

carbohydrates for both men and women. Total protein and fat intake for men was 52.8±43.0

g/day and 40.5±18.1 g/day respectively and for women, 40.0 ±13.9 g/day and 31.9 ±14.1 g/day

(Table 5.2).

In this study 312 different food items were recorded. Nutritionists grouped similar food items

which resulted in a total of 178 food items. After performing step-wise multiple regression, 93

foods explained 90% of the variance for total energy intake, carbohydrates, protein, total fat and

dietary fibre. Subsequently, conceptually similar food items were grouped together yielding a

final list of 81 food items (Table 3). An additional nine food items were included to cover

festival and seasonal dietary habits and the final 90 food items were categorized as cereal or

equivalents (n=19), vegetables (n=20), pulses (n=6), meat or alternatives (n=10), fruits (n=9),

beverages (n=7), miscellaneous (n=14), and alcohol (n=5).

The paper describes the process of development of a FFQ for Sri Lankan adults using a

nationally representative sample. Dietary assessment of this population is invaluable to

understand the role of nutrition in chronic disease so that preventive strategies can be

implemented. The aim of dietary assessment of populations is to rank people by a measure of

usual rather than current diet. The strengths of this study include a nationally representative

sample of Sri Lankan adults and the creation of a comprehensive new database for nutrient

analysis. However, males are under-represented in this study which stems from data collection

being on a random day when most males were engaged in active occupations away from home.

However, in Sri Lanka family members consume similar foods; therefore, obtaining dietary data

from females did not significantly affect the food list in our study. The number of food items in a

FFQ is a crucial factor in determining the accuracy of the data and the practicability of the

questionnaire. Many FFQs have between 100–150 items [25] and the risk of over-reporting

through increased subject burden increases with the large number of items [22, 25]. In our FFQ,

106 Chapter 5: Manuscript 4

we have 90 items and 12 photos of food items to enable an accurate estimation of dietary

exposure.

Sri Lanka as a tropical island has no clear four seasons but two monsoons influence cultivation.

Hence, additional seasonal fruits and vegetables are also included in our FFQ. Over 55% of adult

males are current alcohol drinkers [26]; however in our data collection alcohol consumption was

under-reported (0.5% of participants) with no women reporting the consumption of alcohol. In

Sri Lanka, drinking alcohol has negative social and religious stigma. Thus, common alcoholic

beverages were added to the FFQ. Dietary recalls indicated differences between the ethnic

groups in the type of nutrients derived from different food sources. The main carbohydrate

source varied among ethnic groups; Indian Tamils reported consuming wheat flower (as Roti)

whereas Sinhalese eat rice as the main staple food and Sri Lankan Tamils consume Dose, Itale

and Wade frequently. Ethnicity was an important factor in the selection of foods containing

protein, not surprisingly; pork and beef consumption was not reported by Moors (Muslims) and

Tamils, respectively.

A variety of methods are available to collect food consumption data but a common challenge for

individual-based dietary assessment methods is portion size estimation. Although weighing

served portions is often considered the gold standard; for practical reasons, portion estimation

using photographs are used among both adults and children [27]. A study conducted in Burkina

Faso showed that food photographs are valuable for the quantification of food portion size

among rural and less educated middle-aged women [28]. Men usually consume larger portions

than women [29] and the use of photographs helps to categorize gender variation in portion sizes

more precisely. This is crucial to obtaining reliable estimates of macronutrient and micronutrient

intakes. Several countries use FFQs with photo series and scoring systems [30, 31].

Chapter 5: Manuscript 4 107

The main weakness of the previous national level NCD survey (SLDCS) was the absence of

nutritional data on the population and their relationship with the high NCD risk in the country.

One of the main objectives of the current work was to develop a FFQ to administer in the next

national level NCD survey. Moreover, this FFQ could also be used to assess dietary habits of Sri

Lankans living in other countries, as they practice similar eating patterns to native Sri Lankans.

There is no updated nutrient database in the country. Sri Lankan food composition tables were

published in 1979, and since then many chemical analysis techniques have changed. Newer

processed food items have been introduced into the market. We used the USDA food

composition tables as the backbone of our nutrient database. This is arguably the most

comprehensive, standardized, largest and continuously updated database that has used to develop

population-specific food composition tables in other countries [25]. Mixed dishes were not listed

in the USDA database, and for such items we followed calculated values from traditional

recipes. The recipes vary according to ethnic groups in Sri Lanka and were therefore modified to

allow generalization to the whole country.

Limitations

Coconut oil is the main cooking oil in Sri Lanka [32], however, other types of cooking oils are

used in different communities. Our FFQ does not enable us to differentiate the types of cooking

oil consumed which may have important health implications for NCDs. However, we used

additional questions to obtain details of oil consumption. Another limitation is the lack of data

on micronutrients on Sri Lankan mixed dishes, prolonged cooking time and addition of various

spicies and herbs which could alter the nutritional values of the raw ingredients [33].

108 Chapter 5: Manuscript 4

CONCLUSION

This study highlights the development of a FFQ and the related nutrient composition database

for Sri Lankan adults. Culturally specific dietary tools are central to capturing the role of diet in

risk for chronic disease in Sri Lanka. While the reproducibility and validity of this FFQ needs to

be determined, an important ongoing program would be the regular updating of the new nutrient

database we have also developed.

Acknowledgements

The authors would like to acknowledge Miss Fathima Shakira and other members in the

Diabetes Research Unit, Colombo, for their contribution in arranging logistics for the study.

Chapter 5: Manuscript 4 109

REFERENCE LIST

1. Somatunga, L.C., NCD Risk Factor Survey in Sri Lanka (STEP Survey). 2004, WHO.

2. Stamler, J., Assessing diets to improve world health: nutritional research on disease causation in populations. American Journal of Clinical Nutrition, 1994. 59(1): p. 146S.

3. Lee R.D., N.D.C., National Dietary and Nutrition Surveys, in Nutritional Assessments, D.C.N. Robert D. Lee, Editor. 2002, McGraw-Hill Science Engineering. p. 111-143.

4. Willett, W., Nutrition Epidermiology. 2 ed. 1998, NEW YORK: Oxford University Press.

5. FAO, FAO-Nutrition Country Profiles. 1999, Food and Agriculture organization of the United Nations Rome.

6. Popkin B.M., H.S., Kim S.,, The Nutritional Transition and Diet-Related Chronic Diseases in Asia: Implications for Prevention. Washington, DC: International Food Policy Research Institute FCND Discussion Paper, 2001. 105.

7. Meera Shekar, A.S., Lidan Du, , Malnutrition in Sri Lanka: Scale, Scope, Causes, and Potential Response, W. Bank, Editor. 2007, Human Development Unit, South Asia Region.

8. Katulanda, P., et al., Prevalence and projections of diabetes and pre-diabetes in adults in Sri Lanka—Sri Lanka Diabetes, Cardiovascular Study (SLDCS). Diabetic Medicine, 2008. 25(9): p. 1062-1069.

9. Wijewardene, K., et al., Prevalence of hypertension, diabetes and obesity: baseline findings of a population based survey in four provinces in Sri Lanka. The Ceylon medical journal, 2005. 50(2): p. 62-70.

10. Katulanda, P., et al., Prevalence of overweight and obesity in Sri Lankan adults. Obes Rev, 2010.

11. Katulanda, P., et al., Metabolic syndrome among Sri Lankan adults: prevalence, patterns and correlates. Diabetology & Metabolic Syndrome, 2012. 4(1): p. 24.

12. Samaranayake U.M.M. et al., Food Base Dietary Guidelines for Sri Lanka. 2011, Colombo: Nutrition Devision, Ministry of Healthcare and Nutrition, Sri Lanka.

13. Jayawardena R., B.N.M., Soares M.J., Katulanda P., Hills A.P.,, Consumption of Sri Lankan adults: an appraisal of serving characteristics Public Health Nutrition, 2012. FirstView:1-6.

14. Nelson M., A.M., Meyer J.,, A Photographic Atlas of Food Portion Sizes. 1997, UK: MAFF publications.

110 Chapter 5: Manuscript 4

15. Shahar S., Y.N.A.M., Safii N.S., Ghazau R., Ahmad R., , Atlas of Food Exchanges & Portion Sizes. 2009, MDC Publishers: Kuala Lampur.

16. Perera W.D.A., J.P.M., Thaha S.Z., , Tables of food composition for use in Sri Lanka. 1979.

17. USDA. Foods List. National Nutrient Database for Standard Reference 2012 3/30/2012; 24:[Available from: http://ndb.nal.usda.gov/ndb/foods/list.

18. Gopalan C., R.B.V., Balasubramanian S.C.,, Nutritive value of Indian foods, ed. N.I.o. Nutrition. 1989, Hyderabad.

19. Welch A.A., U.I.D., Buss D.H., Paul A.A., Southgate D.A.T., , McCance and Widdowson’s The Composition of Foods. 5th ed. 1995, Cambridge: Royal Society of Chemistry.

20. Dissanayake, C., Ceylon Cookery. 9 ed. 2010, Sri Lanka: Stamford Lake (pvt) Ltd.

21. Hodge A., P.A.J., Brown W.J., Ireland P., Giles G., , The Anti Cancer Council of Victoria FFQ: relative validity of nutrient intakes compared with weighed food records in young to middle-aged women in a study of iron supplementation. Australian and New Zealand Journal of Public Health 2000. 24(6): p. 576-586.

22. Kobayashi, T., et al., Development of a food frequency questionnaire to estimate habitual dietary intake in Japanese children. Nutrition Journal, 2010. 9(1): p. 17.

23. Ireland P., J.D., Giles G., O'Dea K., Powles J., Rutishauser I., Wahlqvist M.L., Williams J.,, Development of the Melbourne FFQ: a food frequency questionnaire for use in an Australian prospective study involving an ethnically diverse cohort. Asia Pacific J Clin Nutr, 1994. 3: p. 19-31.

24. Bharathi, A., et al., Development of food frequency questionnaires and a nutrient database for the Prospective Urban and Rural Epidemiological (PURE) pilot study in South India: Methodological issues. Asia Pacific Journal of Clinical Nutrition, 2008. 17(1): p. 178-185.

25. Dehghan, M., et al., Development of a semi-quantitative food frequency questionnaire for use in United Arab Emirates and Kuwait based on local foods. Nutrition Journal, 2005. 4(1): p. 18.

26. Rahav, G., et al., The influence of societal level factors on men's and women's alcohol consumption and alcohol problems. Alcohol and alcoholism (Oxford, Oxfordshire). Supplement, 2006. 41(1): p. i47-55.

27. Frobisher C., M.S.M., The estimation of food portion sizes: a comparison between using descriptions of portion sizes and a photographic food atlas by children and adults. Journal of Human Nutrition and Dietetics, 2003. 16(3): p. 181-188.

28. Huybregts, L., et al., Validity of photographs for food portion estimation in a rural West African setting. Public Health Nutrition, 2008. 11(06): p. 581-587.

Chapter 5: Manuscript 4 111

29. Caster, W.O., Systematic estimation of food intakes from food frequency data. Nutrition Research, 1986. 6(4): p. 469-472.

30. Victoria, C.C. Dietary questionnaires. 2010; Available from: http://www.cancervic.org.au/about-our-research/epidemiology/nutritional_assessment_services.

31. Ocké, M.C., et al., The Dutch EPIC food frequency questionnaire. I. Description of the questionnaire, and relative validity and reproducibility for food groups. International Journal of Epidemiology, 1997. 26(suppl 1): p. S37.

32. Amarasiri, W., Coconut fats. Ceylon Med J, 2009. 51(2).

33. Khokhar S., R.M., Swan G.,, Carotenoid and retinol composition of South Asian foods commonly consumed in the UK. Journal of Food Composition and Analysis, 2012. 25(2): p. 166-172.

112 Chapter 5: Manuscript 4

Table 5-1: Demographic characteristics of the sample of the study population Variables Males % (169) Female % (321)

Age (y) 48.4±15.6 48.1±14.1

BMI (kg/m2)* 22.0±3.5 23.7±4.3

Area of Residence

• Urban

• Rural

• Estate

27.8 (47)

60.4 (102)

11.8 (20)

36.1 (116)

57.6 (185)

6.2 (20)

Ethnicity (%)

• Sinhalese

• Moors

• Sri Lankan Tamil

• Indian Tamil

71.0 (120)

4.7 (8)

11.8 (20)

12.4 (21)

80.1(257)

7.2(23)

7.2(23)

5.6(18)

Education level (%)

• No Schooling

• Up to 5 years

• Up to 11 years

• Up to 13 years

• Graduate

6.5 (11) 6.5 (21)

27.2 (46) 25.2(81)

34.9(59) 40.5(130)

27.2(46) 22.7(73)

4.1(7) 5.0(16)

Data are mean ± SD. Values in parenthesis are total number. *p<0.05

Chapter 5: Manuscript 4 113

Table 5-2: Nutrient intake of the study population

Values are mean ± SD. *p<0.05

Characteristics Total e (SD) Male Female

Energy (KJ) 1656.7 (535) 1912.7(566.9)* 1513.6 (458.5)

Carbohydrates (g) 304.4(103.1) 352.4 (110.3)* 277.5 (88.3)

Protein (g) 44.6 (28.8) 52.8 (43)* 40 (13.9)

Total fat (g) 35.0 (16.1) 40.5 (18.1)* 31.9(14.1)

Dietary fibre (g) 18.1(8.4) 21.3(9.2) 16.3(7.3)

114 Chapter 5: Manuscript 4

Table 5-3: Elements of the food frequency questionnaire

* Dairy, sweets, desserts, nuts

Cereals or

equivalents

Vegetables Pulses Meat or

alternatives

Fruits Beverages Miscellaneous* Alcohol

Total food items and mixed dishes

36 48 11 17 19 13 29 2

Contribution of 90%

28 21 5 9 9 7 12 2

Grouping of food items

19 18 5 9 9 7 12 2

Inclusion of foods 0 2 1 1 1 0 2 3

Final food items 19 20 6 10 9 7 14 5

Chapter 5: Manuscript 4 115

Supplementary file 1

Figure 5-1: Example of a food photograph (200 g of rice)

116 Chapter 6: Manuscript 5

Chapter 6: Manuscript 5

Contribution of co-authors for thesis by published paper The authors listed below have certified that

1. They meet the criteria for authorship in that they have participated in the conception, execution, or interpretation, of at least that part of the publication in their field o expertise:

2. They take public responsibility for their part of the publication, except for the responsible author who accepts overall responsibility for the publication;

3. There are no other authors of the publication according to these criteria; 4. Potential conflicts of interest have been disclosed to (a) granting bodies, (b) the editor or

publisher of journals or other publications, and (c) the head of the responsible academic unit, and 5. They agree to the use of the publication in the student’s thesis and its publication on the

Australasian Digital Thesis database consistent with any limitations set by publisher requirements.

In the case of this chapter Paper: Energy and Nutrient Intakes among Sri Lankan Adults

Contributor Statement of contribution Ranil Jayawardena Study design, data collection, data analysis

and drafted the manuscript Shalika Tennakoon data collection and data analysis Nuala Byrne Study design, data interpretation and revision

of the draft and approved the final manuscript.

Mario Soares Study design, data interpretation and revision of the draft and approved the final manuscript.

Prasad Katulanda Study design, data interpretation and revision of the draft and approved the final manuscript.

Andrew Hills Study design, data interpretation and revision of the draft and approved the final manuscript.

Principal supervisor confirmation I have sighted email or other correspondence from all co-authors confirming their certifying authorship.

Nuala Byrne 18/04/2013

Name signature Date

Chapter 6: Manuscript 5 117

TITLE PAGE

Energy and Nutrient Intakes among Sri Lankan Adults

R. Jayawardena1,2*, S.N. Thennakoon2, N.M. Byrne1, M.J. Soares3, P. Katulanda2, A.P.

Hills4

1Institute of Health and Biomedical Innovation, Faculty of Health, Queensland University of

Technology, Brisbane, Queensland, Australia.

2Diabetes Research Unit, Faculty of Medicine, University of Colombo, Colombo, Sri Lanka.

3Curtin Health Innovation Research Institute, School of Public Health, Faculty of Health

Sciences, Curtin University, Perth, WA, Australia.

4Mater Mothers’ Hospital, Mater Medical Research Institute and Griffith Health Institute,

Griffith University, Brisbane, Queensland, Australia.

Citation

R Jayawardena, SN Thennakoon, NM Byrne, MJ Soares, P Katulanda, AP Hills. Energy and

Nutrient Intakes among Sri Lankan Adults. BMC Research Notes (in press) MS:

1400644043847201

118 Chapter 6: Manuscript 5

ABSTRACT

Introduction

Dietary practices are a key factor related to health status at both individual and population levels.

Over- and under-nutrition both have the potential to contribute to serious health consequences.

Sri Lanka is undergoing a rapid socioeconomic transition which is related to a significant health

burden related to under-nutrition and an epidemic of non-communicable diseases. However, to

date, detailed data on food consumption in the Sri Lankan population is limited. The aim of this

study was to identify energy and major nutrient intake among Sri Lankan adults.

Methods

A nationally-representative sample of adults was selected using a multi-stage random cluster

sampling technique. An interviewer-administered 24-h dietary recall was used to obtain data

concerning the nutritional intake of the population. NutriSurvey® software was used to analyze

the nutritional composition of typical meals.

Results

Data from 463 participants (166 Males, 297 Females) were analyzed. Total energy intake was

significantly higher in males (1913±567 kcal/d) than females (1514±458 kcal/d). However, there

was no significant gender differences in the percentage of energy from carbohydrate

(Male:72.8±6.4%, Female:73.9±6.7%), fat (Male:19.9±6.1%, Female:18.5±5.7%) and protein

(Male:10.6±2.1%, Female:10.9±5.6%). The average intake of dietary fiber was 21.3 g/day and

16.3g/day for males and females, respectively. There was a significant difference in nutritional

intake related to ethnicities, areas of residence, education levels and BMI categories.

Discussion

The present study provides the first national estimates of energy and nutrient intake of the Sri

Lankan adult population. Regular nutrition surveys are needed at the national level to obtain

valuable information on diet and associated diseases.

Chapter 6: Manuscript 5 119

INTRODUCTION

The epidemic of nutrition related non-communicable diseases (NCDs) such as type 2 diabetes

mellitus, obesity, cardiovascular diseases (CVDs) and certain cancers are continuing to

challenge the health sectors in Asia [1]. Sri Lanka is a low-middle income South Asian country

with a population of approximately 20 million. Despite most Sri Lankans having relatively good

health status, during the last two decades NCDs have become a more prominent health issue in

the country [2]. A quarter of Sri Lankan adults suffer from metabolic syndrome [3]. According

to results from the Sri Lanka Diabetes and Cardiovascular Study (SLDCS), the prevalence of

diabetes among Sri Lankan adults was nearly 11% and one-fifth of adults have diabetes or pre-

diabetes while one third of those with diabetes are un-diagnosed [4]. Premarathna et al. have

also reported that there was an increase in the incidence of hospitalization of Sri Lankan adults

by 36%, 40% and 29% due to diabetes mellitus, hypertensive disease and ischemic heart disease,

respectively, in 2010 compared to 2005 [5]. Diet-related chronic diseases currently account for

18.3% of all deaths and 16.7% of hospital expenditure in the country [1]. There is a significant

health burden due to NCDs and this will be a challenge to the health sector in a developing

country like Sri Lanka.

Some methods to assess the quantity and quality of dietary intake include prospective food

records (with weighed or estimated food portions), retrospective 24-h recalls (24 HDR), and

food frequency questionnaires (FFQs) [6]. The 24HDR which is less time-consuming and has a

low respondent burden, is the method used to gather the quantitative estimate of all foods and

beverages an individual has consumed in the previous 24 hours at a population level. Several

national dietary surveys have used 24 HDR and it is known to be acceptable for gathering

dietary information on a given day at the population level [7,8].

120 Chapter 6: Manuscript 5

National diet and nutrition surveys provide valuable information on a possible partial

explanation for the people’s health status and disease risk [9]. Assessment of the dietary and

nutritional status of the population is also essential to monitor the ongoing nutrition transition in

a country [6]. As a developing country, no studies have been carried out to investigate the

information on the diet of Sri Lankans and their nutritional status at a national level. Since Sri

Lanka is a multi-cultural country, peoples’ foods and dietary habits at a national level should be

assessed with a representative sample of Sri Lankan adults, which will be more useful to

implement health policies and to initiate many interventions. By keeping this view in mind, the

current dietary survey was carried out to assess the intakes of energy, macro-nutrients and

selected other nutrients with respect to socio-demographic characteristics and the nutritional

status of Sri Lankan adults focusing on diet-related metabolic chronic disease.

METHODOLOGY

Study sampling and the subjects

The eligible respondents of this study were healthy Sri Lankan adults aged >18 years recruited

from a sub-sample of the Sri Lanka Diabetes and Cardiovascular Study [4]. In this study, a total

of 600 subjects were randomly selected representing all nine provinces. This sample population

was then stratified for area of residence and ethnicity. Description of sample selection is

published elsewhere [10]. Ethical approval for this study was obtained from the Ethical Review

Committee, Faculty of Medicine, University of Colombo, Sri Lanka.

Measurements

Socio-demographic variables

The selected subjects were initially contacted via telephone or a postal notice by the study team

and the information regarding the study was provided in order to obtain their willingness to

participate in the study. On the study day, the purpose of the study was briefly explained to the

subjects and information sheets related to the study were also given out. Written consent was

Chapter 6: Manuscript 5 121

obtained from each volunteer prior to data collection. Socio-demographic details and diabetes

status were obtained by using an interviewer-administered questionnaire and body weight and

height were measured using a standard method. Areas of residence, ethnicities, and education

levels were categorized according to Sri Lankan governmental standards [11]. Body mass index

(BMI) was calculated by weight (in kilograms) divided by height squared (in meters) and several

cut-offs were presented as recommended by WHO experts for Asian populations [12].

Dietary assessment

Dietary data were obtained from a 24 HDR method. Subjects were asked to recall all foods and

beverages consumed over the previous 24-hour period. Respondents were probed for the types of

foods and food preparation methods. For uncommon mixed meals, the details of recipes and

preparation methods were collected at the time of taking the 24 HDR. Dietary recalls were

collected by two trained nutritionists who had received uniform training and adhered to the

standard operating procedure (SOP). As dietary assessment aids, the standard household

measurements such as plate, bowl, cup, glass, and different spoons etc. and food photograph

atlases were used to facilitate the quantification of portion sizes. One medium-sized coconut

spoon of rice was taken as 100 g, a full plate as 400 g, one cup of liquid as 150 ml, one glass of

liquid as 200 ml, a table spoon as 15 g and a tea spoon was taken as 5 g. For different curries,

weights of average respective amounts were taken. Household measurements were clarified by

demonstration of the real utensils and the food portion size photographs. When subjects recalled

some food amount in grams, that information was directly entered. Further details of dietary

assessment were published previously [10].

Data analysis

All foods recorded in 24 HDR were converted into grams and then, the intake of total energy,

macro nutrients (Carbohydrate, Protein and Fat), sodium and dietary fiber were analyzed using

122 Chapter 6: Manuscript 5

NutriSurvey 2007 (EBISpro, Germany) which was modified for Sri Lankan food recipes. As no

updated nutritional database has been gathered for some Sri Lankan food, we used the US

Department of Agriculture (USDA) nutrient database [13] as our standard to estimate nutrient

content in addition to local and regional food composition databases [14, 15]. Due to the absence

of energy and nutrient information on local mixed cooked dishes, we used a cookery book [16].

All the recipes were accepted after checking for face validity by consulting local housewives and

nutritionists. According to recipes, ingredients were weighed to the nearest 1 g for edible

portions of the foods. Then food items were cooked accordingly and the end product was

weighed. Nutritional composition of the final meal was calculated by entering nutritional values

and the weight of individual ingredients to the spreadsheet. The sum of each nutrient was

computed and standardized to 100 g of final product. We also excluded participants whose

reported daily energy intake was not between 800 and 4200 kcal to identify under- and over-

reporters of food intake [17].

Statistical Analysis

All data were doubly entered and rechecked in Microsoft Excel 2007. Data sorting and cleaning

were carried out before data analysis. Data on energy, macro-nutrients and some selected

nutrient intakes were transferred from the NutriSurvey 2007 to the Minitab version 15.0 for

statistical analysis. Nutrient intake distributions are presented as mean ±SE, median, 25th and

75th percentiles to characterize population intake levels for socio-demographic characteristics

(gender, ethnicity, age groups, and educational levels) and BMI categories. One-way ANOVA

and t-test were used to examine the differences in mean intakes energy and nutrients intakes. P

value < 0.05 was considered statistically significant.

Chapter 6: Manuscript 5 123

RESULTS

Socio-demographic profile

From 600 subjects, 491 (81.8%) participated and 28 under-reported their energy intake.

Accordingly, a total of 463 (77.2%) were included for the analysis. Socio-demographic profiles

and BMI categories of subjects are presented in Table 6.1. The majority of subjects were from

rural areas (59.7%) with 33% of the population from urban areas and the balance from the estate

sector (tea plantation area) 7.3%. The majority were women (n=297). By ethnic group, the

following were represented: Sinhalese (78%), Sri Lankan Tamil (9%), Indian Tamil (7%), and

Muslim (6%). Adults between the age of 41 and 50 years formed the biggest group (25.27%)

while the smallest group was the youngest adults aged between 18-30 yrs (13.17%). It was

significant that a majority of the study population (39%) had received formal education up to

Ordinary Level. The next largest group was adults (25%) who had studied up to Advanced

Level.

Energy intake

Table 6.2 represents the distribution of energy intake of Sri Lankan adults. The mean energy

intake of men was significantly higher (1912.7 kcal/d) than that of women (1513.6 kcal/d)

(p<0.05). People living in the estate sector had a significantly lower energy intake compared to

both the urban and rural subjects (p<0.05). Muslims had the highest intake of daily energy

(1748.8 kcal) while Indian Tamils had the lowest (1437.7 kcal/d) a statistically significant

difference for both men and women (p<0.05). Calorie consumption of both gender groups

declined gradually with age. Energy intake increased gradually with educational level.

According to BMI categories, lower energy levels were reported in both extremes and no distinct

pattern was seen.

124 Chapter 6: Manuscript 5

Carbohydrate intake

The mean daily carbohydrate intake is shown in Table 6.3. The total mean carbohydrate intake

of Sri Lankan adults was approximately 304.4 g (71.2% of total energy from carbohydrates as

shown in Figure 1). By strata, rural adults had a higher intake of carbohydrate (307.7 g) than

their estate counterparts (270.3 g). Mean carbohydrate intake was highest in Sinhalese (308.7 g)

and lowest in Indian Tamils (269.9 g). Male adults’ carbohydrate intake (352.4 g/day) was

significantly higher than that of women (277.5 g/day) and carbohydrate intake declined with age.

Protein intake

Sri Lankan adults recorded a mean daily protein intake of 44.6 g with men’s intake (52.8 g)

significantly higher than that of women (40.0 g). As shown in Table 6.4, rural (42.9 g/day) and

estate (43.7g/day) adults had similar daily intakes of protein. However, by ethnicity, mean

protein intake was significantly higher in Muslims (52.2 g) compared others. The youngest age

group also consumed significantly more protein than others, but only in men.

Fat intake

Estimated daily mean fat intake of Sri Lankan adults was 35 g. A more or less similar fat

consumption was noted for rural and urban residents (Table 6.5) whereas estate people had

significantly lower intake of fat (24.76 g; p>0.05). The youngest age group recorded the highest

fat intake (37.7 g) while the lowest intake was observed in the oldest age group (30.8 g). By

ethnic group, Muslims had the highest fat intake (44.7 g) whilst the Indian Tamils had the lowest

(24 g), being significantly lower than Muslims (p<0.05). With education level, fat consumption

increased, particularly among men. Adults with a normal BMI and BMI >25 - < 27.5 kgm-2 had

a higher fat intake than other BMI categories.

Chapter 6: Manuscript 5 125

Energy contribution from macro nutrients

As a whole, 71.2% of total calories came from carbohydrates, 10.8% from protein and 18.9%

from fat. Comparisons of the percentage of total calories derived from macronutrients according

to socio-demographic profile and BMI categories are shown in Figure 6.1. By ethnic group,

Muslims consumed more energy from fat (22.3%) while Indian Tamils had the lowest amount of

fat (15.5%) and highest intake of carbohydrates (75%). The percentage of calories from protein

was relatively higher among the graduates. In contrast, adults who did not receive a formal

education had a higher percentage of calories from carbohydrates compared to other groups.

There was no difference in energy distribution between diabetic and non-diabetic subjects.

Dietary fiber

The daily mean dietary fiber intake of Sri Lankan adults was 18.1 g (men: 21.3 g; women: 16.3

g; p<0.05). By area of residence, estate adults had a higher dietary fiber intake (20.6 g) than their

urban and rural counterparts (Table 6.6). Mean dietary fiber intake was highest in Indian Tamils

(20.6 g) and lowest in Sinhalese (17.6 g) (p<0.05). Dietary fiber intake increased with

educational level and a similar trend was observed for women as men. Daily dietary fiber intake

was always higher among men than women from different socio-demographic backgrounds.

Adults aged >60 years had the lowest intake of fiber.

Sodium

Daily mean sodium intake was 3.26 g and 2.51 g for men and women, respectively (p<0.05).

Dietary sodium intake of Sri Lankan adults according to demographic and BMI categories is

shown in Table 6.7. Mean sodium intake of rural adults was 2.89 g, followed by urban adults

(2.73 g). The Estate sector had the lowest intake (2.48 g). Muslims and Sri Lankan Tamils had a

higher intake of sodium than Sinhalese and Indian Tamils. With aging, sodium intake declined

and the youngest age group recorded the highest intake (3.04 g).

126 Chapter 6: Manuscript 5

DISCUSSION

Although national dietary and nutrition surveys have a number of important functions and can

provide much valuable information, Sri Lanka had never conducted a national food consumption

survey, probably due to lack of human and financial resources. This is the first attempt to report

energy and macronutrient intakes in a fairly representative sample over the island using updated

food composition data. Subject distribution of ethnic groups, area of residence and educational

levels closely mirror the national statistics [11].

Differences in calorie consumption were seen according to demographic and BMI categories.

Men typically consume larger portions of foods and are expected to derive a higher amount of

energy than their female counterparts [18]. The daily intake of energy by Sri Lankan men was

found to be higher than that of women by about 350 kcal. Similar differences were reported

among Malaysian adults [19] and in Britain where the difference was nearly 700 kcal [20].

When compared to people living in urban and rural areas, estate workers consume fewer

calories. Lower mean energy intake was also reported among Malaysian estate workers [21].

The decline in calorie consumption with age was probably due to a reduction in physical activity

levels and poor appetite, particularly in older adults. Different energy intakes in ethnic groups

may represent their cultural eating habits. For instance, Muslim people tend to have a higher

energy intake and eat more fat rich food items compared to Indian Tamils. Up to A/L (12 years

education) by education level, energy consumption gradually increased, which is probably

associated with increased purchasing power with higher education status; however, graduate

groups may be also aware of health issues associated with excess caloric intake. In developed

countries, calorie consumption is inversely associated with education levels [22]. Except for the

very obese category, consumption of total energy intake rose steadily with BMI category.

Under-reporting of food intake by obese subjects is well documented [23].

Chapter 6: Manuscript 5 127

The total daily intake of protein in Sri Lankan adults is almost half that of US adults and, among

Americans, two-thirds of all protein is derived from animal sources [24]. In contrast, plant

sources (rice and pulses) are the main contributors of protein among Sri Lankan adults [10,25].

American men consume over 100 g of fat daily and for women, 65 g [26]. Corresponding values

for Sri Lankans are 40.5 g and 31.9 g, respectively. In addition to the amount of fat, the type of

fat is crucial for the development of diet-related chronic diseases such as cardiovascular disease.

Although sub-types of fat are not reported in this analysis, the main lipid source in the Sri

Lankan diet is coconut milk/oil which is high in saturated fatty acids [27]. Therefore, it is

important to conduct further studies to explore the coconut consumption and associated

cardiovascular disease risk in this population.

According to the ranges of population nutrient intake goals recommended by WHO, the

percentage of energy from total carbohydrates, fats and proteins should be 15-30%, 55-75% and

10-15%, respectively [28]. British adults consume less than fifty percent of calories (men:

47.7%; women: 48.5%) from carbohydrates, whilst fat intake contributes 35.8% and 34.9% of

total calories for men and women, respectively. The contribution of protein as an energy source

is 16.5% for both sexes [20]. In contrast to Western countries, Malaysians derive nearly 60% of

their energy from carbohydrates, 14% of energy from protein and the rest from fats [19]. In

contrast to Western countries and some Asian countries, Sri Lankan adults consume

proportionally more carbohydrates (>71% of calories) and less fat (<19% of calories) and

proteins (<11%). The prevalence of diabetes in Sri Lanka is 11% and one-fifth of adults are

suffering from diabetes despite low levels of obesity (BMI >30 kg/m2 = 3.7%) [4]. Since the

study is cross-sectional in nature, we cannot conclude that the association between the relatively

larger contribution of energy from carbohydrate and higher prevalence of diabetes/dysglycemia

among Sri Lankan adults, in spite of carbohydrates contributing over 70% of energy for both

128 Chapter 6: Manuscript 5

diabetics and non-diabetics. Longitudinal studies assessing the prospective risk of developing

diabetes and the proportion of energy derived from macronutrients are needed to fully elucidate

an association. A high intake of carbohydrate may lead to hyperinsulinaemia, high serum TAG

and low HDL-cholesterol levels and chronic consumption of large carbohydrate meals may

cause postprandial hyperglycaemia and hypertriacylglycerolaemia and eventually develop

insulin resistance and diabetes [29].

A generous intake of dietary fiber reduces risk of developing many diseases including coronary

heart disease, stroke, hypertension, diabetes, obesity, and certain gastrointestinal disorders as

well as improving metabolic parameters and immune functions [30]. The definition, method of

measuring fiber and recommendations varies in different countries. The backbone of our food

composition data is based on Food Composition Databases USDA. According to US guidelines,

the current recommendation is to consume 14 g fiber per every 1000 kcal, therefore using the

energy guideline of 2000 kcal/day for women and 2600 kcal/day for men, the recommended

daily dietary fiber intake is 28 g/day for adult women and 36 g/day for adult men [31]. Although

Sri Lankan adults consume fewer calories compared to US adults, their dietary fiber intake is

insufficient according to their calorie intake.

Epidemiological, clinical and animal experimental evidence showed a direct relationship

between dietary electrolyte consumption and blood pressure [32]. Furthermore, clinical trials

show that a reduction in salt (NaCl) intake reduces BP levels in normotensive and hypertensive

populations and prevents the development of hypertension [32]. Recommended Na intake is a

maximum of 2.3 g/day [32]. Our findings showed that most Sri Lankan adults exceed current

recommendations. The high consumption of sodium may be associated with the epidemic of

hypertension (Men: 18.8%; Women: 19.3%) among Sri Lankan adults [33].

Chapter 6: Manuscript 5 129

This study has several limitations. Sri Lanka has over 20 million inhabitants. Therefore, diet

records of a sample of 463 subjects may not represent the eating patterns of the whole

population. However, a well-conducted UK NDNS [20] measured the dietary records of 1724

respondents and achieved a lower response rate of 47%. Considering available resources, the

high response rate and satisfactory representation of demographic parameters, we believe this is

a practical sample size. Secondly, 24 HDR may not be the best tool to determine habitual diet,

however, random 24 HDR in a large sample has been used in other national surveys [7]. Thirdly,

our findings were limited to energy and selected major macronutrients due to sub-quality

nutritional information on sub-categories of macronutrients and micronutrients of Sri Lankan

mixed dishes (Table 6.8). Another limitation is that despite reports of high alcohol consumption

among Sri Lankan men [34], alcohol intake was under-reported in our study (<0.5%). In this

survey, low energy reporters (<800 kcal/day) were excluded, therefore exclusion will have

biased the data towards higher intakes. Lastly, we did not attempt to correlate energy intake and

its adequacy to this population as calorie recommendations may vary with several factors such as

gender, age, body weight, body composition and physical activity level.

Acknowledging the limitations of the survey, the present study provides the first national

estimates of energy and nutrient intake of the Sri Lankan adult population. It is evident that

consumption of high levels of carbohydrate, fat mainly from saturated sources, low protein, low

dietary fiber and high levels of sodium may have detrimental effects on health and be related to

the current epidemic of NCDs. Unfortunately, current food-based dietary guidelines are based on

limited research [25]. Therefore, well-designed and nationally representative studies are needed

to explore the association between diet and chronic disease among Sri Lankan adults. Moreover,

regular diet and nutrition surveys should be carried out to obtain information on dietary patterns

130 Chapter 6: Manuscript 5

and nutrient intakes and, ideally, periodical monitoring is needed to identify the changing trends

in food intake and to assess public responses to dietary recommendations.

Chapter 6: Manuscript 5 131

REFERENCE LIST

1. Popkin B.M. HS, Kim S.,: The Nutritional Transition and Diet-Related Chronic Diseases in Asia: Implications for Prevention. Washington, DC: International Food Policy Research Institute FCND Discussion Paper 2001, 105.

2. Jayasekara R, Schultz T: Health status, trends, and issues in Sri Lanka. Nursing & Health Sciences 2007, 9:228-233.

3. Katulanda P, Ranasinghe P, Jayawardena R, Sheriff R, Matthews D: Metabolic syndrome among Sri Lankan adults: prevalence, patterns and correlates. Diabetology & Metabolic Syndrome 2012, 4:24.

4. Katulanda P, Constantine GR, Mahesh JG, Sheriff R, Seneviratne RD, Wijeratne S, Wijesuriya M, McCarthy MI, Adler AI, Matthews DR: Prevalence and projections of diabetes and pre-diabetes in adults in Sri Lanka--Sri Lanka Diabetes, Cardiovascular Study (SLDCS). Diabet Med 2008, 25:1062-1069.

5. Premaratne R, Amarasinghe A, Wickremasinghe AR: Hospitalisation trends due to selected non-communicable diseases in Sri Lanka, 2005-2010. Ceylon Med J 2005, 50:51-54.

6. Walter Willett EL: Nutritional epidemiology. In Monographs in Epidemiology and Biostatistics. Edited by Willett W: Oxford University Press; 1998: 101-147

7. University of Otago and Ministry of Health: A Focus on Nutrition: Key findings of the 2008/09 New Zealand Adult Nutrition Survey. In Book A Focus on Nutrition: Key findings of the 2008/09 New Zealand Adult Nutrition Survey. (Editor ed.^eds.). City: Ministry of Health; 2011.

8. Giskes K, Turrell G, Patterson C, Newman B: Socio-economic differences in fruit and vegetable consumption among Australian adolescents and adults. Public Health Nutr 2002, 5:663-669.

9. Sasaki S: The value of the National Health and Nutrition Survey in Japan. Lancet 2011, 378:1205-1206.

10. Jayawardena R, Byrne NM, Soares MJ, Katulanda P, Hills AP: Consumption of Sri Lankan adults: an appraisal of serving characteristics Public Health Nutrition 2012, FirstView Article : pp 1-6.

11. Statistical Abstract [http://www.statistics.gov.lk/abstract2010/Pages/index.htm] 12. WHO expert consultation: Appropriate body-mass index for Asian populations and

its implications for policy and intervention strategies. The Lancet 2004, 363:157-163. 13. USDA: Foods List. In Book Foods List (Editor ed.^eds.), 24 edition. City; 2012. 14. Perera W.D.A. JPM, Thaha S.Z., : Tables of food composition for use in Sri Lanka. 1979. 15. Gopalan C. RBV, Balasubramanian S.C.,: Nutritive value of Indian foods. Hyderabad;

1989. 16. Dissanayake C: Ceylon Cookery. 9 edn. Sri Lanka: Stamford Lake (pvt) Ltd; 2010. 17. Azadbakht L, Mirmiran P, Esmaillzadeh A, Azizi F: Dietary diversity score and

cardiovascular risk factors in Tehranian adults. Public Health Nutrition 2006, 9:728-736.

18. Caster WO: Systematic estimation of food intakes from food frequency data. Nutrition Research 1986, 6:469-472.

19. Mirnalini K ZM, Safiah MY, Tahir A, Siti Haslinda MD, Siti Rohana D, Khairul Zarina MY, Mohd Hasyami S & Normah H,: Energy and Nutrient Intakes: Findings from the Malaysian Adult Nutrition Survey (MANS). Mal J Nutr 2008, 14:1-24.

132 Chapter 6: Manuscript 5

20. Swan G: Findings from the latest National Diet and Nutrition Survey. Proc Nutr Soc 2004, 63:505-512.

21. Chee SS ZH, Ismail MN, and Ng KK,: Anthropometry, dietary patterns and nutrient intakes of Malaysian estate workers. Mal J Nutr 1996, 2:112-126.

22. Rennie KL, Jebb SA: Prevalence of obesity in Great Britain. Obes Rev 2005, 6:11-12. 23. Heitmann BL, Lissner L: Dietary underreporting by obese individuals--is it specific

or non-specific? BMJ 1995, 311:986-989. 24. Smit E, Nieto FJ, Crespo CJ, Mitchell P: Estimates of animal and plant protein intake

in US adults: results from the Third National Health and Nutrition Examination Survey, 1988-1991. J Am Diet Assoc 1999, 99:813-820.

25. Samaranayake U.M.M. et al.: Food Base Dietary Guidelines for Sri Lanka. Colombo: Nutrition Devision, Ministry of Healthcare and Nutrition, Sri Lanka; 2011.

26. Kennedy ET, Bowman SA, Powell R: Dietary-fat intake in the US population. J Am Coll Nutr 1999, 18:207-212.

27. Amarasiri W: Coconut fats. Ceylon Med J 2009, 51. 28. Report of a Joint WHO/FAO Expert Consultation: Diet, Nutrition and the prevention

of Chronic Diseases. In Book Diet, Nutrition and the prevention of Chronic Diseases (Editor ed.^eds.). City; 2003.

29. Misra A, Khurana L, Isharwal S, Bhardwaj S: South Asian diets and insulin resistance. Br J Nutr 2009, 101:465-473.

30. Anderson JW, Baird P, Davis RH, Jr., Ferreri S, Knudtson M, Koraym A, Waters V, Williams CL: Health benefits of dietary fiber. Nutr Rev 2009, 67:188-205.

31. USDA: The Food Supply and Dietary Fiber: Its Availability and Effect on Health. In Book The Food Supply and Dietary Fiber: Its Availability and Effect on Health (Editor ed.^eds.), vol. 36. City: U.S. Department of Agriculture; 2007.

32. Sacks FM, Svetkey LP, Vollmer WM, Appel LJ, Bray GA, Harsha D, Obarzanek E, Conlin PR, Miller ER, 3rd, Simons-Morton DG, et al: Effects on blood pressure of reduced dietary sodium and the Dietary Approaches to Stop Hypertension (DASH) diet. DASH-Sodium Collaborative Research Group. N Engl J Med 2001, 344:3-10.

33. Wijewardene K, Mohideen MR, Mendis S, Fernando DS, Kulathilaka T, Weerasekara D, Uluwitta P: Prevalence of hypertension, diabetes and obesity: baseline findings of a population based survey in four provinces in Sri Lanka. The Ceylon medical journal 2005, 50:62-70.

34. Rahav G, Wilsnack R, Bloomfield K, Gmel G, Kuntsche S: The influence of societal level factors on men's and women's alcohol consumption and alcohol problems. Alcohol and alcoholism (Oxford, Oxfordshire) Supplement 2006, 41:i47-55.

.

Chapter 6: Manuscript 5 133

Table 6-1: Socio-demographic characteristics of the survey population

Characteristics Total (n = 463) Men (n = 166) Women (n = 297) n % n % n %

Area of Residence Urban Rural Estate

153 276 34

33.04 59.61 7.34

45 102 19

26.51 61.45 11.45

108 174 15

36.36 58.58 5.05

Age group (yrs) 18-29 30-39 40-49 50-59 >60

61 84 117 106 95

13.17 18.14 25.27 22.89 20.52

27 23 38 40 38

16.26 13.85 22.89 20.10 22.89

34 61 79 66 57

12.73 22.85 29.59 24.72 21.35

Ethnicity Sinhala Muslim Sri Lankan Tamil Indian Tamil

360 27 42 34

77.75 5.83 9.07 7.34

118 8 20 20

71.08 4.82 12.05 12.05

242 19 22 14

8.15 6.40 7.41 4.71

Educational Level No Schooling Up to 5 years Up to O/L Up to A/L Graduate

27 113 182 116 25

58.31 24.41 39.31 25.05 5.39

11 43 59 46 07

6.62 25.90 35.54 27.71 4.22

16 70 123 70 18

5.39 23.57 41.41 23.57 6.06

BMI Category < 18.5 kg.m-2

> 18.5 - < 22.9 kg.m-2 > 23 - < 24.99 kg.m-2

> 25 - < 27.5 kg.m-2 > 27.5 kg.m-2

64 163 76 95 65

13.82 35.21 16.41 20.52 14.04

29 75 21 32 09

17.47 45.18 12.65 19.28 5.42

35 88 55 63 56

11.78 29.63 18.52 21.12 18.86

134 Chapter 6: Manuscript 5

Table 6-2: Energy intake (kcal) of Sri Lankan adults by socio-demographic characteristics

Chapter 6: Manuscript 5 135

Table 6-3 Carbohydrate intake (g) of Sri Lankan adults by socio-demographic characteristics

136 Chapter 6: Manuscript 5

Table 6-4 Protein intake (g) of Sri Lankan adults by socio-demographic characteristics

Chapter 6: Manuscript 5 137

Table 6-5 Fat intake (g) of Sri Lankan adults by socio-demographic characteristics

138 Chapter 6: Manuscript 5

Table 6-6 Dietary fiber intake (g) of Sri Lankan adults by socio demographic characteristics.

Chapter 6: Manuscript 5 139

Table 6-7 Sodium intake (mg) of Sri Lankan adults by socio-demographic characteristics

140 Chapter 6: Manuscript 5

Table 6-8: Mean Daily Micronutrient Intake by Sri Lankan Adults.

Micronutrients

All subjects Men Women Mean

SD SE Median

Percentiles Mini mum

Maxi mum

Mean

SD SE Median

Percentiles Mini mum

Maxi mum

Mean

SD SE Median

Percentiles Mini mum

Maxi mum 25th 75th 25th 75th 25th 75th

Vitamin A_µg (n= 393)

215 169 8.57 163 106 254 50.4 954 208.0 172 14.5 150 99.0 239 51.3 954 225 171 11.1 179 108 278 50.4 917

Vitamin C_mg (n=413)

26.5 20.5 1.31 16.8 9.93 32.2 4.80 158 25.1 24.7 2.04 16.5 10.0 26.1 5.40 158 28.0 27.9 1.77 17.2 10.0 33.6 4.80 147

Vitamin D_ µg (n=334)

5.55 9.45 0.52 2.00 1.00 3.93 0.08 47.4 5.70 9.23 0.89 2.00 1.00 4.26 0.08 47.4 5.67 9.79 0.67 2.00 1.00 3.90 0.08 45.1

Vitamin B1_ mg (n=472)

1.36 0.62 0.03 1.27 0.94 1.69 0.15 5.01 1.64 0.68 0.05 1.58 1.19 1.88 0.50 5.01 1.26 0.53 0.03 1.16 0.87 1.54 0.15 3.88

Vitamin B2_ mg(n=472)

0.99 0.76 0.04 0.79 0.48 1.26 0.10 5.23 1.08 0.77 0.06 0.88 0.53 1.35 0.10 5.23 0.98 0.76 0.05 0.76 0.48 1.23 0.12 5.04

Vitamin B6_ mg (n=472)

1.65 5.34 0.25 0.62 0.32 1.11 0.04 63.3 1.93 6.01 0.47 0.78 0.38 1.26 0.04 53.2 1.54 5.06 0.30 0.58 0.32 1.10 0.04 63.3

Vitamin B12 µg (n=454)

1.46 2.28 0.11 0.77 0.33 1.47 0.01 21.2 1.72 3.27 0.26 0.64 0.26 1.51 0.10 21.2 1.43 2.16 0.13 0.78 0.35 1.46 0.01 15.5

Folic acid_ µg (n=414)

31.4 19.1 0.94 30.0 15.9 42.5 0.30 95.0 33.9 22.7 1.78 35.0 18.6 45.0 0.30 118 25.4 19.4 1.15 24.0 10.0 37.5 0.34 95.0

Pottasium_mg (n=472)

1405 578 26.6 1325 1012 1723 294 5119 1649 653 51.2 1532 1216 2071 477 5119 1314 481 28.4 1258 995 1613 294 3180

Calcium_mg (n=470)

408 218 10.0 364 264 494 106 1486 463 250 19.6 404 309 520 133 1486 401 225 13.0 360 262 483 106 1827

Magnesium_mg (n=471)

219 125 5.77 186 133 266 45.0 1217 253 141 11.1 211 156 303 72.8 8446 211 126 7.48 180 128 241 45.0 1217

Phosphorus_mg (n=472)

810 364 16.8 750 540 1007

204 2771 970 421 33.0 915 674 1187

225 2771 751 293 17.3 717 530 927 204 1930

Iron_mg (n=472)

11.1 6.18 0.29 9.81 7.14 13.8 2.54 59.5 10.5 5.10 0.30 9.49 7.08 13.1 2.54 35.0 12.9 7.59 0.60 11.4 8.29 15.9 2.92 59.5

Zinc_mg (n=472)

8.84 6.50 0.29 7.10 5.33 9.90 1.34 45.2 10.8 7.82 0.61 8.26 6.44 11.4 2.03 42.7 7.90 5.39 0.32 6.76 5.27 8.74 1.34 45.2

Chapter 6: Manuscript 5 141

Figure 6.2 Percentage energy contribution from macronutrients according to gender, ethnicity and area of residance,BMI,educational level and age groups

.

Chapter 7: Manuscript 6 and 7 142

Chapter 7: Manuscript 6 and 7

Contribution of co-authors for thesis by published paper The authors listed below have certified that

1. They meet the criteria for authorship in that they have participated in the conception, execution, or interpretation, of at least that part of the publication in their field o expertise:

2. They take public responsibility for their part of the publication, except for the responsible author who accepts overall responsibility for the publication;

3. There are no other authors of the publication according to these criteria; 4. Potential conflicts of interest have been disclosed to (a) granting bodies, (b) the editor or

publisher of journals or other publications, and (c) the head of the responsible academic unit, and 5. They agree to the use of the publication in the student’s thesis and its publication on the

Australasian Digital Thesis database consistent with any limitations set by publisher requirements.

In the case of this chapter Paper: The obesity epidemic in Sri Lanka revisited Contributor Statement of contribution Ranil Jayawardena Study design, data collection, data analysis

and drafted the manuscript Nuala Byrne Study design, data interpretation and revision

of the draft and approved the final manuscript.

Mario Soares Study design, data interpretation and revision of the draft and approved the final manuscript.

Prasad Katulanda Study design, data interpretation and revision of the draft and approved the final manuscript.

Andrew Hills Study design, data interpretation and revision of the draft and approved the final manuscript.

Principal supervisor confirmation I have sighted email or other correspondence from all co-authors confirming their certifying authorship.

Nuala Byrne 18/04/2013

Name signature Date

Chapter 7: Manuscript 6 and 7 143

CHAPTER 7A: MANUSCRIPT 6

Letter to the editor

The obesity epidemic in Sri Lanka revisited.

Ranil Jayawardena MBBS, MSc1,2, Nuala M. Byrne MSc PhD1, Mario J. Soares MBBS

MSc PhD3, Prasad Katulanda MD DPhil2, Andrew P. Hills MSc PhD4

1Institute of Health and Biomedical Innovation, Faculty of Health, Queensland University of

Technology, Brisbane, Queensland, Australia.

2Diabetes Research Unit, Faculty of Medicine, University of Colombo, Colombo, Sri Lanka.

3Curtin Health Innovation Research Institute, School of Public Health, Faculty of Health

Sciences, Curtin University, Perth, WA, Australia.

4Mater Mothers’ Hospital, Mater Medical Research Institute and Griffith Health Institute,

Griffith University, Brisbane, Queensland, Australia.

Citation

R Jayawardena, NM Byrne, MJ Soares, P Katulanda, AP Hills. (2012) The obesity epidemic in

Sri Lanka Revisited. Asia Pac J Public Health. doi: 10.1177/1010539512464650. 2012 Nov 27.

[Epub ahead of print]

144 Chapter 7: Manuscript 6 and 7

Obesity has reached epidemic levels in most affluent countries. In contrast, South Asia is

presently considered a minimally affected region as malnutrition and infectious diseases are still

their main health concerns (1). South Asians have poor attitudes toward obesity and being obese

considered as sign of prosperity (2).

Sri Lanka is a low-middle income South Asian country with a population of over 20 million.

Obesity and associated metabolic problems are emerging as major health problems in the

country with an estimated 20% of all adults suffering from dysglycemia and 11% from Type 2

diabetes (3). The Sri Lanka Diabetes and Cardiovascular Disease Study (SLDCS) was conducted

between 2005-2006 and reported an obesity prevalence (≥25 kg.m-2) of 14.3% and 19.4% in

males and females, respectively (4). In early 2011, we revisited random sub-samples from the

SLDCS and in addition we collected data from the previously missing North and Eastern

provinces in the SLDCS. In total, six hundred adults were approached from 12 clusters of 50

participants each. Details of the study design and sample selection have been described in detail

elsewhere (5). While we believe this is the first report from Sri Lanka to include the North and

Eastern provinces, we did encounter poorer participation of males with only single clusters being

measured in some of these regions. Age adjusted prevalence of overweight (BMI ≥23 kg.m-2),

obesity (BMI ≥25 kg.m-2) and abdominal obesity (Men: WC ≥ 90 cm; Women: WC ≥ 80 cm)

were categorized according to Asia-pacific anthropometric cut-offs (6).

Four hundred and ninety adults participated in the study giving us a response rate of 82%. Mean

age was 48.1 ±14.8 years. The majority of the study population were ‘Sinhalese’ in ethnicity

(n=377, 76.9%), educated up to grade 11 (n=189, 38.6%), were female (n= 321, 65.5 %) and

resided in rural areas (n=287, 58.7%). Age-adjusted prevalence (95%CI) of overweight, obesity

and abdominal obesity among Sri Lankan adults were 17.1(13.8-20.7)%, 28.8(24.8-33.1)% and

30.8(26.8-35.2)%, respectively. Men compared to women, were less overweight but not

Chapter 7: Manuscript 6 and 7 145

statistically [14.2 (9.4-20.5)% vs. 18.5 (14.4-23.3)%, p<ns], obese [21.0 (14.9-27.7)% vs. 32.7

(27.6-38.2)%, p<0.05] and abdominally obese [11.9 (7.4-17.8)% vs. 40.6 (35.1-46.2)%, p<0.05].

The prevalence of obesity in 1990 was 7.0% and 13.4% for men and women in Colombo

suburbs (7), but by 2000 the overall obesity prevalence had doubled to 19.2% in the same study

area (8). Our study which covers a greater area of Sri Lanka shows an obesity prevalence of 21%

for men and 32.5% for women. Compared to the original SLDCS data, we found a higher overall

prevalence of overweight and abdominal obesity. Levels of overweight and abdominal obesity

are clearly higher among women compared to men. In such comparisons of data, there could be

heterogeneity between studies due to sampling, selected study areas, age group representation

and clinical cut-offs of obesity. The large upward shift in the prevalence of overweight between

SLDCS and our data would in part reflect these facets and needs further investigation. However

they would also reflect changes in environmental factors such as increased availability of

calorie-dense foods post-war (4), and improvements in socio-economic status of the country.

Hwang et al. reported that each kg.m-² of BMI gained was associated with an 18% increase in

the risk of developing hypertension and a 26% increase in risk for the metabolic syndrome (9).

Already a quarter of Sri Lankan adults are suffering from metabolic syndrome (10). It is time

that legislators, clinicians and public health authorities give this issue their considered attention

to begin the process of reversing this alarming trend. Recent consensus reports provide a good

framework for action that could be tailored to suit the needs of Sri Lanka.

146 Chapter 7: Manuscript 6 and 7

Reference list

1. Balkau B, Deanfield JE, Després J-P, Bassand J-P, Fox KAA, Smith SC, et al.

International Day for the Evaluation of Abdominal Obesity (IDEA). Circulation. 2007 October

23, 2007;116(17):1942-51.

2. Simkhada P, Poobalan A, Simkhada PP, Amalraj R, Aucott L. Knowledge, Attitude, and

Prevalence of Overweight and Obesity Among Civil Servants in Nepal. Asia-Pacific Journal of

Public Health. 2011 July 1, 2011;23(4):507-17.

3. Katulanda P, Constantine GR, Mahesh JG, Sheriff R, Seneviratne RDA, Wijeratne S, et

al. Prevalence and projections of diabetes and pre-diabetes in adults in Sri Lanka—Sri Lanka

Diabetes, Cardiovascular Study (SLDCS). Diabetic Medicine. 2008;25(9):1062-9.

4. Katulanda P, Jayawardena MAR, Sheriff MHR, Constantine GR, Matthews DR.

Prevalence of overweight and obesity in Sri Lankan adults. Obesity Reviews. 2010;11(11):751-

6.

5. Jayawardena R, Byrne NM, Soares MJ, Katulanda P, Hills AP. Food consumption of Sri

Lankan adults: an appraisal of serving characteristics. Public Health Nutrition.FirstView:1-6.

6. WHO/IASO/IOTF. The Asia-Pacific Perspective: Redefining Obesity and its

Treatment.2000.

7. Fernando D.J.S. SSH, De Silva D.R., Perera S.D.,. The prevalence of obesity and other

coronary risk factors in a suburban Sri Lankan community. Asia Pacific J Clin Nutr. 1994;3:155-

9.

8. Malavige GN, de Alwis NMW, Siribaddana SH, Weerasooriya N, Fernando DJS.

Increasing diabetes and vascular risk factors in a sub-urban Sri Lankan population. Diabetes

research and clinical practice. 2002;57(2):143-5.

9. Hwang LC, Bai CH, Sun CA, Chen CJ. Prevalence of metabolically healthy obesity and

its impacts on incidences of hypertension, diabetes and the metabolic syndrome in Taiwan. Asia

Pac J Clin Nutr. 2012;21(2):227-33.

10. Katulanda P, Ranasinghe P, Jayawardena R, Sheriff R, Matthews D. Metabolic syndrome

among Sri Lankan adults: prevalence, patterns and correlates. Diabetology & Metabolic

Syndrome. 2012;4(1):24.

Chapter 7: Manuscript 6 and 7 147

CHAPTER 7B: MANUSCRIPT 7

Contribution of co-authors for thesis by published paper The authors listed below have certified that

1. They meet the criteria for authorship in that they have participated in the conception, execution, or interpretation, of at least that part of the publication in their field o expertise:

2. They take public responsibility for their part of the publication, except for the responsible author who accepts overall responsibility for the publication;

3. There are no other authors of the publication according to these criteria; 4. Potential conflicts of interest have been disclosed to (a) granting bodies, (b) the editor or

publisher of journals or other publications, and (c) the head of the responsible academic unit, and 5. They agree to the use of the publication in the student’s thesis and its publication on the

Australasian Digital Thesis database consistent with any limitations set by publisher requirements.

In the case of this chapter Paper: The obesity epidemic in Sri Lanka revisited and High dietary diversity is associated with obesity in Sri Lankan adults: an evaluation of three dietary scores Contributor Statement of contribution Ranil Jayawardena Study design, data collection, data analysis

and drafted the manuscript Nuala Byrne Study design, data interpretation and revision

of the draft and approved the final manuscript.

Mario Soares Study design, data interpretation and revision of the draft and approved the final manuscript.

Prasad Katulanda Study design, data interpretation and revision of the draft and approved the final manuscript.

Bijesh Yadav statistical analysis Andrew Hills Study design, data interpretation and revision

of the draft and approved the final manuscript.

Principal supervisor confirmation I have sighted email or other correspondence from all co-authors confirming their certifying authorship.

Nuala Byrne 18/04/2013

Name signature Date

148 Chapter 7: Manuscript 6 and 7

TITLE PAGE

High dietary diversity is associated with obesity in Sri Lankan adults: an

evaluation of three dietary scores

Ranil Jayawardena1,2*, Nuala M. Byrne1, Mario J. Soares3, Prasad Katulanda2, Bijesh Yadav4,

Andrew P. Hills5

1Institute of Health and Biomedical Innovation, Faculty of Health, Queensland University of

Technology, Brisbane, Queensland, Australia.

2Diabetes Research Unit, Faculty of Medicine, University of Colombo, Colombo, Sri Lanka.

3Curtin Health Innovation Research Institute, School of Public Health, Faculty of Health

Sciences, Curtin University, Perth, WA, Australia.

4Department of Biostatistics, Christian Medical College, Vellore, India

5Mater Mothers’ Hospital, Mater Medical Research Institute and Griffith Health Institute,

Griffith University, Brisbane, Queensland, Australia.

Citation

R Jayawardena, NM Byrne, MJ Soares, P Katulanda, AP Hills (2013). High dietary diversity is

associated with obesity in Sri Lankan adults. BMC Public Health 13:314.

Chapter 7: Manuscript 6 and 7 149

ABSTRACT

Background: Dietary diversity is recognized as a key element of a high quality diet. However,

diets that offer a greater variety of energy-dense foods could increase food intake and body

weight. The aim of this study was to explore association of diet diversity with obesity in Sri

Lankan adults.

Methods: Six hundred adults aged >18 years were randomly selected by using multi-stage

stratified sample. Dietary intake assessment was undertaken by 24-hour dietary recall. Three

dietary scores, Dietary Diversity Score (DDS), Dietary Diversity Score with Portions (DDSP)

and Food Variety Score (FVS) were calculated. Body mass index (BMI) ≥ 25 kg.m-2 is defined

as obesity and Asian waist circumference cut-offs were used to diagnose abdominal obesity.

Results: Mean of DDS for men and women were 6.23 and 6.50 (p=0.06), while DDSP was 3.26

and 3.17, respectively (p=0.24). FVS values were significantly different between men and

women 9.55 and 10.24 (p=0.002). Dietary diversity among Sri Lankan adults was significantly

associated with gender, residency, ethnicity, education level but not with diabetes status. As

dietary scores increased, the percentage consumption was increased in most of food groups

except starches. Obese and abdominal obese adults had the highest DDS compared to non obese

groups (p<0.05). With increased dietary diversity the level of BMI, waist circumference and

energy consumption was significantly increased in this population.

Conclusion: Our data suggests that dietary diversity is positively associated with several socio-

demographic characteristics and obesity among Sri Lankan adults. Although high dietary

diversity is widely recommended, public health messages should emphasize to improve dietary

diversity in selective food items.

150 Chapter 7: Manuscript 6 and 7

INTRODUCTION

Dietary diversity and variety have long been recognized as key elements of high quality diets. A

diverse diet increases the probability of nutrient adequacy among adults [1] and leads to positive

health outcomes such as reduced complications of diabetes [2], incidence of several cancers [3,

4] and all-cause mortality [5]. As dietary factors are associated with increased risk of chronic

diseases, local and international dietary recommendations promote increased dietary diversity

but limiting saturate fats, refined sugar and salt. However, lack of dietary diversity is a major

nutritional concern over among deprived people from the low-income countries [6]. Changing

from a monotonous diet to one with varied food types has been shown to improve energy and

nutrient intakes in the people from developing countries. The demographic and economic

transition that many developing countries are undergoing is producing important changes in diet

and lifestyle that greatly impact on disease risks [7]. Despite under-nutrition and nutrient

deficiencies being a major concern in developing countries, the recent nutrition transition and

changes in physical activity patterns, diet-related metabolic problems have emerged as an

alarming public health problem in many developing countries, particularly among urban

dwellers [8].

Sri Lanka is a low-middle income country undergoing rapid epidemiological and nutritional

transition. Despite nutritional deficiencies such as iron deficiency anemia, vitamin A deficiency

and protein energy malnutrition being reported in some segments of the Sri Lankan population

[9], non-communicable diseases (NCDs) are also emerging as the major diet-associated health

problem in Sri Lanka. The prevalence of overweight, obesity and central obesity among Sri

Lankan adults was 25.2%, 9.2% and 26.2%, respectively in 2005-2006, as defined by Asian

Body Mass Index (BMI) cut-offs [10], a clear upward trend [11]. The age-adjusted prevalence of

Metabolic Syndrome among Sri Lankan adults was 24.3% (95% CI: 23.0–25.6) [12]. The

Chapter 7: Manuscript 6 and 7 151

prevalence of obesity-related metabolic problems such as diabetes and hypertention among Sri

Lankan adults was 13-14% and 18-19%, respectively [13]. Moreover, in Sri Lanka, diet-related

chronic diseases currently account for 18.3% of all deaths and 16.7% of hospital expenditure

[14].

Although prevalence rates are higher in affluent countries, obesity and abdominal obesity are

becoming major public health concerns in South Asia [15]. Causes of obesity are multi-factorial,

among them various dietary factors play an important role. Association between individual

nutrients and obesity/abdominal obesity has been widely researched, but little attention has been

given to overall dietary diversity and obesity/abdominal obesity. Dietary diversity is an indicator

of overall diet. Higher diet variety is associated with increased intake of fiber and vitamins [16]

and on the other hand, increased variety contributes to high calorie consumption [17]. Sri Lanka

has an interesting socio-economic relationship with obesity. For instance, higher wealth and

education is positively associated with obesity among Sri Lankan adults [10]. Therefore,

evaluating the association between diet diversity and obesity is interesting to explore in this

population. Exploring the underlying associations between obesity and dietary diversity are very

important as lifestyle interventions can change dietary diversity in different populations.

Accordingly, the aim of this study was to explore association of diet diversity with obesity in Sri

Lankan adults.

METHODOLOGY

Study design and sample selection

Subjects were recruited from a subset of the Sri Lanka Diabetes and Cardiovascular Study [18].

Six hundred adults aged >18 years were randomly selected using a multi-stage stratified sample.

Details of sample selection have been published elsewhere [10, 19]. Ethical approval for this

study was obtained from the Ethical Review Committee, Faculty of Medicine, University of

152 Chapter 7: Manuscript 6 and 7

Colombo, Sri Lanka and informed consent was obtained from the subjects before the data was

collected.

Dietary Assessment

Dietary intake assessment was undertaken by a 24-hour dietary recall by trained nutritionists in a

random day to obtain ‘usual’ intake. Although multiple 24–hour passes may be more

representative of ‘usual’ intake, a single 24-hour recall is considered the best reference period to

assess dietary diversity as longer reference periods result in less accurate information due to

imperfect recall [20]. However, if the previous 24-hour period is atypical due to a special

occasion or illness, a different day was selected for the interview. We collected a detailed

description of the foods eaten and the amount was estimated using food photographs and

common household utensils. For mixed dishes, food types were disaggregated before ingredients

were categorized into appropriate food groups as detailed earlier [19].

Socio-demographic and anthropometric

Socio-demographic details and clinical status (self-reported diabetes) were collected from

interviewer-administrated questionnaire. Height was measured using a portable Holtain

Stadiometer (Chasmors Ltd, London, UK) to the nearest 0.1 cm. Body weight was measured

using a SECA electronic scale (Hamburg, Germany) to the nearest 0.1 kg. Most participants

were weighed wearing light clothes and after fasting. Waist circumference was measured using a

tape to the nearest 0.1 cm at the midpoint between the lower costal border and the top of the iliac

crest, at the end of normal expiration. BMI was calculated by dividing body weight (in

kilograms) by height (in meters squared). Definition of overweight (BMI ≥23 kg.m-2), obesity

(BMI ≥25 kg.m-2) and abdominal obesity (Men: WC ≥90 cm; Women: WC ≥80 cm) were

categorized according to Asia-pacific anthropometric cut-offs [10].

Chapter 7: Manuscript 6 and 7 153

Dietary Diversity Score (DDS)

A DDS was defined as the total count of different food groups irrespective of the amount

consumed by individuals over the 24-hour period. All the food items consumed by subjects were

categorized into 12 food groups which were starch (cereals, tubers, roots and starchy vegetables

such as jackfruits), vegetables, green leafy vegetables (green salads and ‘Mallum’), fruits, fish

(including dried fish and seafood) meat (including poultry, egg), legumes (including nuts and

seeds except coconut), milk (including all dairy products), beverages (tea, coffee and fizzy

drinks), oils and fats (coconut products were included), sweets and miscellaneous (e.g. alcohol).

The choice of the 12 food groups was based on the local and international food grouping

techniques adapting cultural context [20, 21]. So the maximum score was 12, one point given for

each group consumed during the registration period.

Dietary Diversity Score with Portions (DDSP)

We defined DDSP considering major food groups in the Sri Lankan food pyramid as starch,

vegetables, green leafy vegetables, meat [meat/poultry/egg], fish [fish/dry fish/sea foods], milk

[milk/dairy products], pulses and fruits [21]. DDSP was calculated applying a minimum

consumption of one portion for respective food groups. Details of the portion sizes were

published previously [19]. The maximum score for DDSP was 8.

Food Variety Score (FVS)

FVS was defined as the number of different food items eaten during last 24–hour period [16].

The total number of foods included irrespective of quantity consumed. There is no maximum

value here.

Data Analysis

Statistical Package for Social Sciences software version 16 (SPSS Inc., Chicago, IL, USA) was

used to conduct all the statistical analyses. Descriptive data are presented as means and SDs.

Percentage of consumption of different food groups according to DDS and DDSP were sorted.

154 Chapter 7: Manuscript 6 and 7

DDS and FVS were further categorized to groups according to DDS and FVS values. Then BMI,

WC and energy intake were calculated for the groupings of dietary diversity values. Total energy

was analyzed using NutriSurvey 2007 (EBISpro, Germany) software. Independent samples test

and ANOVA were used to compare the means. For all statistical tests, a P value <0.05 was

accepted as significant.

RESULTS

The response rate was 80% (n=481) and details of the subjects’ characteristics are reported in

table 7.1. Mean of DDS for men and women were 6.23 and 6.50 (p=0.06), while DDSP was 3.26

and 3.17, respectively (p=0.24). FVS values were significantly different between men and

women 9.55 and 10.24 (p=0.002). Several socio-demographic parameters were significantly

associated with all three dietary diversity parameters. People living in the estate areas had the

lowest DDS, DDSP and FVS compared to both urban and rural. Similarly, Indian Tamils had

lowest values for all three diet diversity parameters. Higher education level was associated with

increased dietary scores but not for age categories. Adults with BMI ≥25.0 kg.m-2 had the

highest DDS, DDSP and FVS values. Centrally obese participants had significantly higher DDS,

DDSP and FVS values but no significant difference was seen between diabetic and non-diabetic.

Table 7.2 shows the distribution pattern of consumption of foods from different food groups

among Sri Lankan adults according to DDS. Minimum DDS was 2 and maximum was 11 out of

12. As DDS increased, the percentage consumption was increased in most of food groups except

starch as everybody consumes starch from DDS value of 2. Cereals were the most commonly

consumed food groups among Sri Lankans with the lowest DDS and DDSP scores. Milk and

dairy product intake increased slowly, but gradually with both DDS and DDSP, whereas meat

products are consumed by a significant proportion of the population only at higher dietary scores

(DDS ≥8; DDSP ≥5). Pulses reach more than 50% from DDS value of 3, followed by

Chapter 7: Manuscript 6 and 7 155

vegetables, beverages from DDS of 4. However, meat/poultry/egg reached ≥50% at the DDS of

10. Similar to DDS patterns, DDSP also showed maximum value for starch group but lower

values for green leafy vegetables, meat, milk and fruits (Table 7.3).

Mean BMI, WC and energy intakes were gradually increased with DDS, DDSP and FVS

categories (table 7.4). Participants with 2-5 DDS value had a BMI of 22.16 kg.m-2 and WC of

77.0 cm which gradually rose up to a BMI of 23.82 kg.m-2 and WC of 80.04 cm with DDS 8-11

category. Energy consumption also followed the same pattern.

DISCUSSION

Sri Lankan adults had relatively low dietary diversity values, in particular, relatively higher FVS

and DDS and lower DDSP value indicates that although people consume several types of food

items, the amount of consumption is low for many food groups. The WHO STEP Survey

reported that 3% of Sri Lankan consume more than five fruits and vegetable per day [22].

Rathnayake et al. reported much lower mean DDS (4.4) and FVS (8.4) among group of rural

elderly people [23]. DDS, DDSP and FVS values for Indian Tamils were remarkably less than

Sinhalese and Muslim ethnic groups. It is reported that malnutrition and nutritional deficiencies

are highest in the estate sector where most of Indian Tamils are living [9]. Although we have

lack of data on nutrient adequacy in this study sample, one can postulate that low dietary

diversity may cause deficiencies among Sri Lankan adults. People with better education may

have high profile occupations and greater purchasing power which could lead to higher

consumption of different food varieties. Although no previous data are available on dietary

diversity among Sri Lankan adults, children who lived in the estate sector had a lower dietary

diversity [24]. Moreover, lower maternal education was negatively associated with receiving a

diverse diet for those children [24]. Obese and abdominal obese participants had higher DDS,

DDSP and FVS values compared to non-obese and non-abdominally obese groups.

156 Chapter 7: Manuscript 6 and 7

Sri Lankans consume an excess of starchy foods but lower amount of fruits, vegetables and dairy

products [19]. Table 7.2 and 7.3 showed that 100% values for the starch group in every DDS and

DDSP indicated that starchy staple food was the most common food group in Sri Lankan meals.

Nearly five percent participants had almost complete starch meals without a significant amount

of other food groups across the whole day, due to some people consuming cereal (e.g. rice) with

a starchy vegetable (e.g. potato curry). Predominantly carbohydrate diets result in an elevation in

plasma glucose, insulin, triglycerides and non-esterified fatty acids leading to insulin resistance

[25]. Total carbohydrate intake is associated with risk of diabetes among South Indian adults

[26]. High prevalence of diabetes and its complications among Sri Lankan adults may be

associated with starch-based but poor variety meals [18, 27]. Amongst the food groups of the

dietary pyramid, meat, green leafy vegetables, milk and fruits were least frequently consumed.

Increased intake of fruits and vegetables could play a protective role against obesity-associated

metabolic risk factors in South Indians who are prone to premature coronary artery disease [28].

Reasons for the monotonous diet among many Sri Lankan adults needs to be further explored

despite it being associated with a low obesity level. Public health initiatives to improve

appropriate diversity of the diet are important.

Torheim et al. reported a positive correlation between energy intake and DDS, as well as variety

of different food groups in Mali [29]. When a diet is composed of foods that differ on sensory

characteristics such as colour, flavour and shape may cause hyperphagia [30]. One hypothesis

for the increase intake of food consumption with higher food variety is due to hedonic ratings of

a food eaten to sensation decrease with different food items [30]. Animal and human studies

showed that food intake increases when there is more variety in a meal or diet and that greater

dietary variety is associated with increased body weight and subsequently obesity [30]. Dietary

variety within food groups was positively associated with body fatness among healthy adults

[31]. Several studies showed a positive correlation between calorie intake and dietary diversity

Chapter 7: Manuscript 6 and 7 157

[17, 29]. On the contrary, an inverse association between DDS and obesity/abdominal adiposity

was reported among the female students of Isfahan University [32]. In US women, low BMI was

associated with higher DDS; in US men, there was no clear relation of BMI to dietary diversity

[5]. Our results show a positive association between all three dietary diversity indices with

calorie intake suggesting that consumption of a large number of food items may lead to

excessive intake of energy and weight gain. Although many dietary guidelines promote

consumption of varied diet, it should be selective (e.g. vegetables) rather than absolute in

number. Moreover, food guide pyramids are not designed to maintain energy balance, but show

nutritional adequacy and balance [17]. Increased dietary diversity in health promotion may not

be appropriate for combating the obesity epidemic in Sri Lanka. A reduction in dietary variety of

highly palatable and energy-rich foods may be a more appropriate strategy to prevent and treat

obesity in the country. At the same time, to prevent deficiencies foods with high nutrient but low

energy (e.g. green vegetables, low fat milk) should be encouraged.

Limitations

We used a single 24-hour recall to obtain usual intake, however multiple dietary recalls during

weekdays and weekends may provide a better picture of the habitual diet. In the nutritional

literature, DDS and FVS are widely used and show appropriate correlation with nutritional status

and association with chronic disease. Simple counting of food groups or consumed food items

are used to define diet diversity scores. These methods have limitations. First, although it is not

easy to distinguish healthy and unhealthy food items, these counting systems are assigned equal

values for every food item respective of the health outcome (e.g. fruits and sweets). Second, the

distributions of individual food quantities are not considered by count measures. In this exercise

we defined DDSP with consumption of minimum of one portion of respective food groups;

however we did not define an upper limit. Drescher et al. recommend considering health values

158 Chapter 7: Manuscript 6 and 7

of consumed food items in measuring healthy food diversity [33]. Another limitation is that we

did not measure the diversity within food groups and most Sri Lankan dishes are mixed in

nature, which causes considerable practical limitations for food item groupings. Furthermore,

there are no updated food composition tables for Sri Lankan mixed dishes, in particular for

micronutrients. Therefore, we were not able to calculate nutrient adequacy ratio and mean

adequacy ratio. Moreover, lack of physical activity data among this population limits our ability

to calculate daily energy requirements. Absence of economical statues may limit the performing

multivariate analysis. However, the main aim of this study was to explore the associations

between dietary diversity/variety and obesity.

A follow-up study showed an inverse dietary diversity-mortality association was adjusted for

potential dietary and socio-demographic confounders [5]. DDS is population-specific and there

is no standard scoring method, therefore it is invariably difficult to compare DDS values among

different countries. Because of the cross-sectional nature of this study, we cannot express long-

term health outcomes with regarding dietary diversity among Sri Lankan adults. Moreover,

obesity is associated with multiple socio-economic factors which could be possible confounding

factors for diet diversity. Prospective studies are needed to explore association between dietary

diversity and weight gain/obesity.

Acknowledging the limitations of this study, these results showed the dietary diversity, portion

consumption and number of food item intakes according to different socio-demographic

characteristics. Globally, normative data on ‘ideal’ or ‘target’ levels of diversity are usually not

available. Therefore, our results can be used to assess the current picture of the dietary diversity

among Sri Lankan adults. Repeating a similar study in a given time may help to assess

improvements in food security and expected changes in the population. Illangasekara et al.

(2004) reported temporal trends in the prevalence of diabetes mellitus in a rural community in

Sri Lanka which is closely accompanied by an increase in the monthly income [34]. However,

Chapter 7: Manuscript 6 and 7 159

there is a lack of data on changes in dietary habits in this population with related to epidemic of

diabetes and other diet-associated metabolic disorders. As our aim was to assess individual diet

diversity our sample included predominantly housewives as in Sri Lanka the majority of people

consume homemade foods. These results can therefore be used as household dietary diversity

values and may indicate the socio-economic level of the household [20].

In conclusion, our data suggests that dietary diversity and variety are associated with obesity

among Sri Lankan adults. High dietary diversity is widely recommended as it can be used as a

proxy indicator of nutrient adequacy. Therefore, public health messages should emphasize how

to improve dietary diversity in selected food items. Further studies are needed to confirm this

finding on other diet-associated chronic diseases.

160 Chapter 7: Manuscript 6 and 7

REFERENCE LIST

1. Foote JA, Murphy SP, Wilkens LR, Basiotis PP, Carlson A: Dietary Variety Increases

the Probability of Nutrient Adequacy among Adults. The Journal Of Nutrition 2004,

134:1779-1785.

2. Wahlqvist ML, Lo CS, Myers KA: Food variety is associated with less macrovascular

disease in those with type II diabetes and their healthy controls. J Am Coll Nutr

1989, 8:515-523.

3. Fernandez E, D'Avanzo B, Negri E, Franceschi S, La Vecchia C: Diet diversity and the

risk of colorectal cancer in northern Italy. Cancer Epidemiol Biomarkers Prev 1996,

5:433-436.

4. Lucenteforte E, Garavello W, Bosetti C, Talamini R, Zambon P, Franceschi S, Negri E,

La Vecchia C: Diet diversity and the risk of squamous cell esophageal cancer. Int J

Cancer 2008, 123:2397-2400.

5. Kant AK, Schatzkin A, Harris TB, Ziegler RG, Block G: Dietary diversity and

subsequent mortality in the First National Health and Nutrition Examination

Survey Epidemiologic Follow-up Study. The American Journal Of Clinical Nutrition

1993, 57:434-440.

6. Ruel MT: Operationalizing Dietary Diversity: A Review of Measurement Issues and

Research Priorities. The Journal Of Nutrition 2003, 133:3911S-3926S.

7. Popkin B: Nutrition in transition: the changing global nutrition challenge. Asia

Pacific Journal of Clinical Nutrition 2001, 10:13-18.

8. Caballero B, Rubinstein S: Environmental factors affecting nutritional status in

urban areas of developing countries. Arch Latinoam Nutr 1997, 47:3-8.

9. Meera Shekar AS, Lidan Du, : Malnutrition in Sri Lanka: Scale, Scope, Causes, and

Potential Response. In Book Malnutrition in Sri Lanka: Scale, Scope, Causes, and

Potential Response (Editor ed.^eds.). City: Human Development Unit, South Asia

Region; 2007.

10. Katulanda P, Jayawardena MA, Sheriff MH, Constantine GR, Matthews DR: Prevalence

of overweight and obesity in Sri Lankan adults. Obes Rev 2010.

11. Jayawardena R, Byrne NM, Soares MJ, Katulanda P, Hills AP: The Obesity Epidemic

in Sri Lanka Revisited. Asia Pac J Public Health 2012.

Chapter 7: Manuscript 6 and 7 161

12. Katulanda P, Ranasinghe P, Jayawardena R, Sheriff R, Matthews D: Metabolic

syndrome among Sri Lankan adults: prevalence, patterns and correlates.

Diabetology & Metabolic Syndrome 2012, 4:24.

13. Wijewardene K, Mohideen M, Mendis S, Fernando D, Kulathilaka T, Weerasekara D,

Uluwitta P: Prevalence of hypertension, diabetes and obesity: baseline findings of a

population based survey in four provinces in Sri Lanka. Ceylon Medical Journal

2005, 50:62.

14. Popkin B.M. HS, Kim S.,: The Nutritional Transition and Diet-Related Chronic

Diseases in Asia: Implications for Prevention. Washington, DC: International Food

Policy Research Institute FCND Discussion Paper 2001, 105.

15. Ramachandran A, Snehalatha C: Rising burden of obesity in Asia. J Obes 2010, 2010.

16. Hatloy A, Torheim LE, Oshaug A: Food variety--a good indicator of nutritional

adequacy of the diet? A case study from an urban area in Mali, West Africa. Eur J

Clin Nutr 1998, 52:891-898.

17. Mirmiran P, Azadbakht L, Azizi F: Dietary diversity within food groups: an indicator

of specific nutrient adequacy in Tehranian women. J Am Coll Nutr 2006, 25:354-361.

18. Katulanda P, Constantine GR, Mahesh JG, Sheriff R, Seneviratne RDA, Wijeratne S,

Wijesuriya M, McCarthy MI, Adler AI, Matthews DR: Prevalence and projections of

diabetes and pre-diabetes in adults in Sri Lanka—Sri Lanka Diabetes,

Cardiovascular Study (SLDCS). Diabetic Medicine 2008, 25:1062-1069.

19. Jayawardena R, Byrne NM, Soares MJ, Katulanda P, Hills AP: Consumption of Sri

Lankan adults: an appraisal of serving characteristics Public Health Nutrition 2012,

FirstView Article : pp 1-6.

20. Anne Swindale PB: Household Dietary Diversity Score (HDDS) for Measurement of

Household Food Access: Indicator Guide (v.2). In Book Household Dietary Diversity

Score (HDDS) for Measurement of Household Food Access: Indicator Guide (v.2)

(Editor ed.^eds.). City: Academy for Educational Development; 2006.

21. Samaranayake U.M.M. et al.: Food Base Dietary Guidelines for Sri Lanka. Colombo:

Nutrition Devision, Ministry of Healthcare and Nutrition, Sri Lanka; 2011.

22. Somatunga LC: NCD Risk Factor Survey in Sri Lanka (STEP Survey). In Book NCD

Risk Factor Survey in Sri Lanka (STEP Survey) (Editor ed.^eds.). City: WHO; 2004.

23. Rathnayake K, Madushani P, Silva K: Use of dietary diversity score as a proxy

indicator of nutrient adequacy of rural elderly people in Sri Lanka. BMC Research

Notes 2012, 5:469.

162 Chapter 7: Manuscript 6 and 7

24. Senarath U, Godakandage SSP, Jayawickrama H, Siriwardena I, Dibley MJ:

Determinants of inappropriate complementary feeding practices in young children

in Sri Lanka: secondary data analysis of Demographic and Health Survey 2006–

2007. Maternal & Child Nutrition 2012, 8:60-77.

25. Wolever TM, Mehling C: Long-term effect of varying the source or amount of

dietary carbohydrate on postprandial plasma glucose, insulin, triacylglycerol, and

free fatty acid concentrations in subjects with impaired glucose tolerance. The

American Journal Of Clinical Nutrition 2003, 77:612-621.

26. Mohan V, Radhika G, Sathya RM, Tamil SR, Ganesan A, Sudha V: Dietary

carbohydrates, glycaemic load, food groups and newly detected type 2 diabetes

among urban Asian Indian population in Chennai, India (Chennai Urban Rural

Epidemiology Study 59). Br J Nutr 2009, 102:1498-1506.

27. Katulanda P, Ranasinghe P, Jayawardena R, Constantine G, Sheriff MHR, Matthews D:

The prevalence, patterns and predictors of diabetic peripheral neuropathy in a

developing country. Diabetology & Metabolic Syndrome 2012, 4:21.

28. Radhika G, Sudha V, Mohan Sathya R, Ganesan A, Mohan V: Association of fruit and

vegetable intake with cardiovascular risk factors in urban south Indians. Br J Nutr

2008, 99:398-405.

29. Torheim LE, Ouattara F, Diarra MM, Thiam FD, Barikmo I, Hatloy A, Oshaug A:

Nutrient adequacy and dietary diversity in rural Mali: association and

determinants. Eur J Clin Nutr 2004, 58:594-604.

30. Raynor HA, Epstein LH: Dietary variety, energy regulation, and obesity. Psychol Bull

2001, 127:325-341.

31. McCrory MA, Fuss PJ, McCallum JE, Yao M, Vinken AG, Hays NP, Roberts SB:

Dietary variety within food groups: association with energy intake and body fatness

in men and women. The American Journal Of Clinical Nutrition 1999, 69:440-447.

32. Azadbakht L, Esmaillzadeh A: Dietary diversity score is related to obesity and

abdominal adiposity among Iranian female youth. PHNutr 2011, 14:62-69.

33. Drescher LS, Thiele S, Mensink GB: A new index to measure healthy food diversity

better reflects a healthy diet than traditional measures. J Nutr 2007, 137:647-651.

34. Illangasekera U, Rambodagalla S, Tennakoon S. Temporal trends in the prevalence of

diabetes mellitus in a rural community in Sri Lanka. J R Soc Health 2004; 124: 92–

94.

Chapter 7: Manuscript 6 and 7 163

Table 7-1. Mean and SD of dietary diversity score (DDS), dietary diversity score of portions (DDSP) and food variety score (FVS)

164 Chapter 7: Manuscript 6 and 7

Table 7-2 Percent consumption of different food groups by DDS for Sri Lankan adults (n=481)

DDS 1 2 3 4 5 6 7 8 9 10 11

No of Adults 0 1 9 42 89 109 115 72 36 6 2

Percentage of adults with

DDS

0 0.2 1.9 8.7 18.5 22.7 23.9 15.0 7.5 1.2 0.4

Food groups

Starch 0 100.0 100.0 100.0 100.0 100.0 100.0 100.0 100.0 100.0 100.0

Vegetables 0 0 33.3 54.8 76.4 69.7 85.2 86.1 94.4 100.0 100.0

Green leaves 0 0 0 21.4 12.4 38.5 42.6 52.8 80.6 83.3 100.0

Meat/poultry/egg 0 0 0 2.4 21.3 20.2 24.3 45.8 38.9 66.7 50.0

Fish/dry fish/sea foods 0 0 44.4 33.3 52.8 66.1 70.4 87.5 97.2 100.0 100.0

Milk/diary products 0 0 22.2 19.0 59.6 60.6 66.1 79.2 83.3 100.0 100.0

Pulses 0 100.0 55.6 54.8 59.6 67.9 77.4 81.9 86.1 100.0 100.0

Fruits 0 0 0 14.3 12.4 33.0 45.2 45.8 77.8 66.7 100.0

Fat/oil 0 0 11.1 26.2 22.5 35.8 47.8 52.8 61.1 33.3 100.0

Beverages 0 0 33.3 64.3 60.7 78.0 86.1 90.3 91.7 100.0 50.0

Sweets 0 0 0 2.4 6.7 14.7 33.0 43.1 50.0 83.3 100.0

Miscellaneous 0 0 0 7.1 15.7 15.6 21.7 34.7 38.9 66.7 100.0

Chapter 7: Manuscript 6 and 7 165

Table 7-3 Percent consumption of different food groups by DDSP for Sri Lankan adults (n=481)

DDSP 1 2 3 4 5 6 7 No of Adults 23 122 149 128 44 13 2 Percentage of adults with DDS 4.8 25.4 31.0 26.6 9.1 2.7 0.4

Food groups Starch 100.0 100.0 100.0 100.0 100.0 100.0 100.0 Vegetables 0.0 30.3 56.4 71.9 86.4 100.0 100.0 Green leafy vegetables 0.0 3.3 16.1 36.7 38.6 69.2 100.0 Meat 0.0 5.7 20.8 26.6 40.9 53.8 100.0 Fish 0.0 28.7 40.9 64.1 75.0 92.3 100.0 Milk 0.0 3.3 6.0 10.9 27.3 30.8 100.0 Pulses 0.0 24.6 42.3 58.6 77.3 69.2 50.0 Fruits 0.0 4.1 17.4 31.2 54.5 84.6 50.0

166 Chapter 7: Manuscript 6 and 7

Table 7-4 Mean BMI, Waist circumference and energy intake of the subjects according to DDS, DDSP and FVS.

BMI (kgm-2) Waist circumference (cm) Energy intake Mean SD P values Mean SD P values Mean SD P values

DDS 2-5 (n=141) 22.16 4.11 0.002

77.00 10.48 0.034

1705 615 <0.001 6-7 (n=223) 23.38 4.24 79.39 10.50 1792 597

8-11 (n=116) 23.82 3.40 80.04 9.37 2004 580 DDSP 1-2 (n=144) 22.76 3.94

0.027

77.74 9.93 0.009

1652 609 <0.001

3 (n=149) 22.84 4.29 77.70 10.22 1739 540 4 (n=127) 23.24 4.12 79.80 10.88 1985 617 5-7(n=59) 24.54 3.34 82.14 9.19 2079 583 FVS 3–8 (n =121) 21.76 3.97

<0.001

76.16 10.08 0.002

1651 596 <0.001

9-10 (n= 271) 23.33 4.46 79.19 11.08 1804 633 11 (n=68) 23.28 3.35 78.69 9.03 1826 558 12–18 (n= 118) 24.14 3.55 81.16 9.46 2003 570

Chapter 8: Manuscript 8 167

Chapter 8: Manuscript 8

Contribution of co-authors for thesis by published paper The authors listed below have certified that

1. They meet the criteria for authorship in that they have participated in the conception, execution, or interpretation, of at least that part of the publication in their field o expertise:

2. They take public responsibility for their part of the publication, except for the responsible author who accepts overall responsibility for the publication;

3. There are no other authors of the publication according to these criteria; 4. Potential conflicts of interest have been disclosed to (a) granting bodies, (b) the editor or

publisher of journals or other publications, and (c) the head of the responsible academic unit, and 5. They agree to the use of the publication in the student’s thesis and its publication on the

Australasian Digital Thesis database consistent with any limitations set by publisher requirements.

In the case of this chapter Paper: Body weight perception and weight loss practices among Sri Lankan adults Contributor Statement of contribution Ranil Jayawardena Study design, data collection, data analysis

and drafted the manuscript Nuala Byrne Study design, data interpretation and revision

of the draft and approved the final manuscript.

Mario Soares Study design, data interpretation and revision of the draft and approved the final manuscript.

Prasad Katulanda Study design, data interpretation and revision of the draft and approved the final manuscript.

Andrew Hills Study design, data interpretation and revision of the draft and approved the final manuscript.

Principal supervisor confirmation I have sighted email or other correspondence from all co-authors confirming their certifying authorship.

Nuala Byrne 18/04/2013

Name signature Date

168 Chapter 8: Manuscript 8

TITLE PAGE

Body weight perception and weight loss practices among Sri Lankan adults

Ranil Jayawardena 1,2*, Nuala M. Byrne 1, Mario J. Soares 3, Prasad Katulanda 2, Andrew P.

Hills 4

1Institute of Health and Biomedical Innovation, Faculty of Health, Queensland University of

Technology, Brisbane, Queensland, Australia.

2Diabetes Research Unit, Faculty of Medicine, University of Colombo, Colombo, Sri Lanka.

3Curtin Health Innovation Research Institute, School of Public Health, Faculty of Health

Sciences, Curtin University, Perth, WA, Australia.

4Mater Mothers’ Hospital, Mater Medical Research Institute and Griffith Health Institute,

Griffith University, Brisbane, Queensland, Australia.

Citation

R Jayawardena, NM Byrne, MJ Soares, P Katulanda, AP Hills. (2013) Body weight perception

and weight losing practices in Sri Lankan adults. Obesity Research and Clinical Practice

http://dx.doi.org/10.1016/j.orcp.2013.05.003

Chapter 8: Manuscript 8 169

ABSTRACT

Objectives: The purpose of the present study was to evaluate the association between self-

perception of body weight, waist circumference (WC) with body mass index (BMI) and WC cut-

offs and weight loss approaches among Sri Lankan adults.

Methods: A nationally representative sample of 600 adults aged ≥18 years was selected using a

multi-stage random cluster sampling technique. An interviewer-administrated questionnaire was

used to assess demographic characteristics, body weight perception, abdominal obesity

perception and details of weight losing practices. Weight, height and WC were measured and

BMI calculated. According to Asian anthropometric cut-offs levels, underweight (BMI >18.50

kg.m-2), normal-weight (BMI=18.50-22.99 kg.m-2), overweight (BMI=23-24.99 kg.m-2), obesity

(BMI ≥25 kg.m-2) and abdominal obesity (WC ≥90 cm in men and ≥80 cm in women) were

defined.

Results: Body weight misperception was common among Sri Lankan adults. Two-thirds of

overweight males and 44.7% overweight females considered themselves as ‘about right weight’,

moreover, 4.1% and 7.6% overweight men and women reported themselves as being

‘underweight’. Over one-third of both male and female obese subjects perceived themselves as

‘about right weight’ or ‘underweight’. Nearly 32% of centrally obese men and women perceived

that their WC is about right. Of the people who perceived themselves as overweight or very

overweight (n=154) only 63.6% tried to lose weight (n=98), and one quarter of adults sought

advice from professionals (n=39).

170 Chapter 8: Manuscript 8

Conclusion: Body weight misperception was common among underweight, healthy weight,

overweight, and obese adults in Sri Lanka. Over 2/3 of overweight and 1/3 of obese Sri Lankan

adults believe they are in right weight category or are under weight.

INTRODUCTION

The prevalence of obesity has reached epidemic levels in many parts of the world. World Health

Organization (WHO) estimations in 2008 indicated that 1.5 billion adults worldwide were

overweight, while nearly 500 million adults were suffering from obesity [1]. Obesity has also

become an emerging public health problem in Sri Lanka. Despite the limited availability of data,

previous studies have demonstrated a clear upward trend in age-adjusted prevalence of obesity in

Sri Lankan males and females; increasing from 7.0% (males) and 13.4% (females) in 1990 to

9.9% and 19.2%, respectively in 2000 [2]. In 2005, national level obesity prevalence data

showed that 25.2% of adults were overweight (BMI ≥23 kg.m-2) and 16.8% were obese (BMI

≥25 kg.m-2) [3]. One quarter of the Sri Lankan adult population are suffering from central

obesity, in particular, one in every two urban dwelling females are affected by abdominal obesity

[3]. Katulanda et al. have reported that female gender, urban living, higher level of education,

higher income and middle age are risk factors for obesity among Sri Lankans. These socio-

economic factors associated with obesity amongst Sri Lankan adults are in contrast to risk

factors from developed countries, where less educated, economically deprived and people living

in rural area are more obese [3]. Hence, there could be unique socio-economic factors driving

the obesity epidemic in Sri Lanka.

It is well documented that being overweight and obese are associated with many negative

medical, psychological, social and economic consequences. Health promotion efforts aimed at

overweight and obesity prevention often proceed with the assumption that most individuals

prefer to be thin, and that the initial step in motivating individuals who are overweight to lose

Chapter 8: Manuscript 8 171

weight is to raise awareness of their present weight status and associated health risks [4]. This

approach may be fitting for Western populations that value thinness in women and lean muscular

physiques in men, and highly health literate societies that recognize that abdominal obesity is a

risk factor for many deleterious metabolic consequences such as diabetes. However, this

assumption may not be suitable in Sri Lanka where traditionally abdominal obesity has been

considered a sign of wealth and status. This feature is commonplace in many non-western

cultures which traditionally recognize that a large body size, especially abdominal obesity in

either males or females is a sign of prosperity, wealth and health [5]. That culture influences

weight perception preference has been the rationale for many studies researching the association

between weight perception and obesity among different ethnic groups. Many of these studies

have either focused on minority immigrant populations in affluent countries [6] or primarily

adolescent age groups [7]. Sri Lanka is a country in nutritional transition with epidemic levels of

obesity mainly in urban areas and considerable under-nutrition and nutritional deficiencies also

commonplace [8]. Although there is an increased interest in the prevention of obesity and

associated non-communicable diseases by health authorities, professional associations and the

mass media, there are no national level data on body weight perception and weight loss practices

among Sri Lankan adults.

The success of a public health intervention is dependent upon the people’s awareness of the

health issue and their motivation to change. Self-perception of body weight is a strong

determinant of nutritional habits and weight management [6]. A skewed perception of body

weight may be a barrier to successful weight loss [9] and healthy weight management goals

should be set taking into consideration an individual’s weight perception [10]. The purpose of

the present study was to assess the association between self-perception of body weight and WC

172 Chapter 8: Manuscript 8

with BMI and WC cut-offs among Sri Lankan adults. In addition, we report the knowledge of

their body weight, concept about the BMI and weight loss approaches among Sri Lankan adults.

MATERIAL AND METHODS

Study population and sampling

Data were collected from a subset (n=600) of a previously conducted nationally representative

study, the Sri Lankan Diabetes Cardiovascular Study (SLDCS) using a multi-stage, stratified,

random sampling procedure during January to March 2011. The details of sampling of the

SLDCS are described elsewhere [11]. Data relevant to the present study were obtained in

community settings and included demographic, socio-economic, self-reported diabetes mellitus,

anthropometric measurements, body weight and waist circumference perception, and weight loss

practices. This study was approved by the Ethics Review Committee, Faculty of Medicine,

University of Colombo, Sri Lanka.

Anthropometric measurements

Height was measured using a portable Holtain Stadiometer (Chasmors Ltd, London, UK) to the

nearest 0.1 cm. Body weight was measured using a SECA electronic scale (Hamburg, Germany)

to the nearest 0.1 kg. Most of the participants were weighed wearing light clothes and after

fasting. BMI was calculated as body weight (kg) divided by the square of height (m). WC was

measured using a tape to the nearest 0.1 cm at the midpoint between the lower costal border and

the top of the iliac crest, at the end of normal expiration.

Body weight and waist circumference perception

An interviewer-administrated questionnaire was used which included items such as self-reported

height and weight, body weight perception, abdominal obesity perception and details of weight

Chapter 8: Manuscript 8 173

loss practices. Specifically, these questions asked subjects to report their height in feet and

inches or meters (“How tall are you without your shoes on?”) and weight in kilograms or pounds

(“How much do you weigh without your shoes on?”). Self-reported height and weight were

converted to metric units for calculation of ‘Self-reported’ BMI. The weight perception question

asked was “How do you describe your weight?” Choices included: very underweight,

underweight, about the right weight, overweight, and very overweight [6, 10]. However, for

analysis, very underweight and underweight were merged to form one group. Similarly, with

regard to abdominal obesity, the question asked was, “How do you describe your waist

circumference?” answers were; low, about right, and high. In addition, self-reported weight and

height, presence/absence of diabetes mellitus, details of weight loss practices and knowledge of

BMI were also collected.

Statistical analysis

Analysis was undertaken using SPSS version 16 (SPSS Inc., Chicago, IL, USA). Subjects were

classified into four groups according to their ‘Measured’ BMI values as follows: underweight:

<18.5 kg.m-2; normal weight: 18.5-22.9 kg.m-2, overweight: 23.0-25.0 kg.m-2; obese ≥ 25.0

kg.m-2 [12]. Abdominal obesity was defined as a waist circumference >90 cm for males and >80

cm for females [12]. For categorical variables, Pearson's chi-square test was used. Percentages of

responses were reported according to BMI and WC level and respective weight and WC

perception. A multiple logistic regression analysis was carried out with perceived overweight as

the dependent variable and age, ‘Measured’ BMI, ethnicity, gender, and education as

independent variables. All independent variables were simultaneously included in the regression

model regardless of their statistical significance. A similar regression was carried out for

knowledge of BMI. In all analyses a P value < 0.05 was considered statistically significant.

174 Chapter 8: Manuscript 8

RESULTS

Four hundred and ninety adults participated in the study (a response rate of 82%). Table 8.1

shows the socio-demographic characteristics and obesity prevalence of the study population. The

majority of participants were female (n=321, 65.5%) and the mean age was 48.4±15.6 y for

males and 48.1±14.1 y for females. Overall, there was a preponderance of Sinhalese (M: 71.1%;

F: 80.1%), with most residing in rural areas (M: 60.4%; F: 57.6%). In the study population,

10.6% males and 12.8% females had self-reported diabetes mellitus. The prevalence of

overweight and obesity in males was 14.2% and 20.2%, and in females, 20.2% and 35.9%,

respectively. Nearly 45% of females had abdominal obesity; however, in contrast, only 13% of

males had abdominal obesity.

In this sample over half of total population (54.7%) were aware of their own body weight.

However, less than a quarter (24.7%) correctly predicts their weight close to the measured

weight (±2 kg). Similar to body weight, 50.1% population were aware of their height and 32.4%

of subjects reported height close to the measured values (±5 cm) (Table 8.2). Moreover only 57

adults (M=27, F=30) predicted both height (±5 cm) and weight (±2 kg) correctly. Only 94 adults

(19.2%) had knowledge of what is meant by BMI - there was no significant difference between

knowledge levels of males (21.3%) and females (18.1%). Younger age (p<0.001), living in an

urban area (p<0.03) and higher education (p<0.001) was significantly associated with knowledge

of BMI. Weight misperception varied among BMI groups (table 3). According to ‘Measured’

BMI categories, majority of underweight adults perceived themselves correctly as being

‘underweight’. However, subjects who had normal ‘Measured’ BMI values misperceived their

body weight; about one third of these adults perceived themselves as being ‘underweight’ and in

those with normal ‘Measured’ BMI 9.9% males and 11.2% females reported that they are

overweight or very overweight. One third of overweight males and 44.7% females considered

Chapter 8: Manuscript 8 175

themselves as ‘about right weight’, moreover, 4.1% and 7.6% overweight men and women

reported themselves as being ‘underweight’. Over one third of both male and female obese

subjects perceived themselves as ‘about right weight’ or ‘underweight’. Only 3% of obese males

reported themselves as being ‘very overweight’, however in contrast, 17.5% of females who

were obese considered themselves as ‘very overweight’. Table 4 shows the percentage of

abdominally obese adults who reported that they were having ‘low’, ‘about right’ and ‘high’

waist circumference. Nearly 32% of centrally obese men and women perceived that their WC is

about right. Despite having high WC, small percentage of (M: 4.5%; F: 2.1%) adults believed

that they were having a ‘low’ WC. People who perceived overweight or very overweight

(n=154) only 63.6% tried to lose their body weight (n=98), and quarter of adults seek advices

from professionals (n=39). In this population, almost all obtained weight reduction advices from

medical doctors (Doctor: Nutritionist = 38:1).

Table 5 shows the multiple logistic regression models for under perception, correct perception

and over perception of body weight. The Hosmer-Lemeshow goodness-of-fit test was not

significant for all three models. Older age was a significant predictor of under perception of

body weight (OR = 1.02; 95% CI = 1.01 - 1.03). However in contrast correct perception was

significantly associated with younger age (OR = 0.98; 95% CI = 0.97 - 0.99). None of other

variables were significantly associated with both under perception and correct perception.

However for over perception of body weight, there was a significant association with male

gender (OR = 1.85; 95% CI = 1.00 - 3.40). People from ethnic groups other than Sinhalese also

tends to over perceive their body weight (OR = 2.36; 95% CI = 1.25 - 4.45).

DISCUSSION

To the best of our knowledge, this is the first study to measure body weight and WC perception

and weight loss practices in a nationally representative sample of Sri Lankan adults. Most South

Asian countries, particularly in urban populations, have shown evidence of an epidemic of

176 Chapter 8: Manuscript 8

obesity [3, 13, 14]. In addition, unlike their Western counterparts, South Asians suffer from

obesity-associated metabolic complications at very low BMI levels [15]. Accurate body weight

and waist circumference perception, knowledge of BMI and weight loss initiatives are important

indicators of population’s concern and attitudes toward obesity and weight control. This study

provides valuable details regarding body weight and waist circumference perceptions, and

attitudes toward weight loss practices among Sri Lankan adults. The results have practical

implications for future weight management approaches.

In Sri Lanka only less than one quarter of adults could predict their body weight correctly

although most were screened for body weight and weight circumference in SLDCS several years

back. Lack of concern regarding body weight may put such individuals at risk for further weight

gain and associated health consequences [16]. The ability to identify unhealthy weight changes,

knowledge of one’s own weight, measuring body weight frequently and keeping records of body

weight is recognized as essential in the prevention of unhealthy weight gain [17]. BMI is widely

considered an easy tool to identify obesity but less than 20% of Sri Lankan adults surveyed had

knowledge of concept of BMI. Presently, details of BMI have been included in the school

curriculum and pregnancy records, therefore such initiatives may help to improve the knowledge

and understanding of younger generations in this important area. In addition, increased

awareness of obesity in the mass media may have an impact on the urban and educated

population over time.

Findings highlight that weight misperception is highly prevalent among Sri Lankan adults with

over 70% of overweight and 41% of obese males and over 50% overweight females and one

third of obese females not perceiving themselves as overweight. Among US adults, 40% of

overweight and 8% of obese adults considered themselves to be ‘about the right weight’ [18].

Chapter 8: Manuscript 8 177

Similarly, in 2007 53% of the British population had a BMI in the overweight or obese range, of

whom only 75% reported as being overweight, very overweight, or obese [19]. A related study

on a group of adolescent girls in Sri Lanka reported that in those who were overweight, 5.6%

perceived themselves as being underweight, and 11.1% as normal-weight. These values are

lower than our findings, however, in contrast to the present study these investigators used

WHO cut-offs to categorize overweight [20]. It is reported that Sri Lankan adults have an

increased risk for CVD starting from a BMI of 21 kg.m-2 [15]. Thus, it is appropriate to use

lower BMI cut-offs for primary prevention of obesity. Although they are subject to metabolic

complications [15] and have a high body fat percentage [21] at a low BMI, overweight and

obese Sri Lankan adults may not perceive their excess body weight due to several reasons. Sri

Lankans are typically a lean population (3.9% ≥30 kg.m-2) and low obesity perception in the

population is reasonable. Historically, overweight people were wealthy and powerful and in

contrast, lean people were poor manual workers. Many societies still consider overweight as a

sign of wealth and power. Similarly, among a group of South African black women, being

moderately overweight was considered to be acceptable, and was associated with dignity,

respect, health, wealth and strength [23]. In some societies, fat women are considered to be a

sign of well-caring by their husbands [16]. Prevalence of diabetes is extremely common in

urban, middle aged adults, one in every three adults having diabetes in the over 50 years of age

category and a significant portion is undiagnosed [11]. Therefore, low body weight or weight

loss may have a negative social stigma in this society due to weight loss being associated with

undiagnosed diabetes. Similarly, in South Africa, weight loss has a socially negative stigma due

to HIV infection [24].

Two-thirds of centrally obese Sri Lankan adults perceived themselves as having higher WC.

Abdominal obesity misperception being lower than body weight misperception indicates that Sri

178 Chapter 8: Manuscript 8

Lanka adults are more aware of their waist circumference compared to body weight. Changes in

waist circumference can be easily identified by clothing; however, body weight may not be as

evident due the need to measure. Sri Lankan males have a higher prevalence of weight

misperception than females, most notably with a higher proportion of overweight and obese

males incorrectly under assessing their weight category. In general, females are more weight

conscious and attempt to identify weight control strategies [25]. Although there is reasonable

agreement between BMI estimated from reported weight and height and BMI calculated from

measured variables in this population, there is limited practical value of self-reported weight and

height for clinical practices. Rowland reported that obese people underestimate their weight and

overestimate height [26]. BMI calculated from self-reported height and weight had greater

association with weight perceptions than did BMI calculated from measured height and weight.

Among adolescents, self-reporting of height and weight is probably influenced to some degree

by body weight perception [6]. This is due to underestimating their weight and overestimating

their height compared with measured values. Still when weight perceptions were compared with

BMI calculated from self-reported values, a significant number of adults misperceived their

weight status.

It is reported that obese individuals with body size misperception have a lower awareness of

obesity associated health risk [9]. However, a large proportion of adults who are overweight or

obese fail to perceive them as such and, consequently, are unlikely to look for weight reduction

practices such as dieting and exercise to lose weight. Surprisingly, among those who tried to lose

body weight, less than half seek professional advice. It is evident that weight management

requires professional support, preferably from a multi-disciplinary team [27]. Limited facilities

for nutrition counselling and weight management in Sri Lanka are a hindrance to successfully

combat the obesity epidemic. Data on the socio-economic association and body weight

Chapter 8: Manuscript 8 179

perception is limited. Young people are more likely to perceive correct body weight in contrast

to older people. This indicates that younger generations are much more aware of their body

weight and shape than older generations in Sri Lanka.

Future perspectives

There is an urgent public health necessity to initiate health awareness programs to identify

healthy body weight, negative health consequences of excess body weight, and practical lifestyle

strategies for the general public. As the causes of weight misperception could be complex, public

health interventions should be a multifaceted [9]. There should be encouragement for people to

measure their own body weight, WC and maintain BMI records in every hospital or general

practitioner visit. Furthermore, identified cases should be referred to necessary health care

centres for early treatment. It is widely reported that patients cite physicians as the most credible

source of nutrition information and ahead of nutritionists [28]. In Sri Lanka, most obese adults

seek weight reduction advice from doctors therefore, medical professional associations and

medical schools must initiate training programs to improve the competence of nutritional and

lifestyle knowledge and skills of doctors. The General Medical Council (UK) recognized that all

medical graduates should obtain satisfactory knowledge on the role of lifestyle and human

nutrition promoting health and prevent disease and human nutrition should be treated as a

discrete medical discipline for clinicians to specialize [29]. Sri Lanka needs a professional

organization to handle this obesity epidemic and more studies should be conducted to obtain a

better understanding of erroneous perception of body weight and poor weight loss practices in

this population. It is widely reported that distorted weight perception and body image among

adolescents is negatively associated with unhealthy eating habits and disordered eating

behaviour [6,30]. Inability of adults to self-perceive body weight may also be a contributing

factor for misjudgement of their children’s body weight. Therefore, future studies are needed to

obtain data on weight perception of children and adolescents.

180 Chapter 8: Manuscript 8

Limitations

Data collection was at community settings during the day therefore a large proportion of eligible

male participants were not present due to occupational commitments. On the other hand, females

enthusiastically participated in this study. Weight cut-offs of ±2 kg and height cut-offs of 5 cm

are used arbitrarily. We could not obtain accurate details of the economic status or household

income of participants which could have an association with weight perception. Similarly,

metabolic parameters were not measured, abnormal body weight and WC could have been

associated with adverse metabolic risk. Moreover, details of perception of body shape/image and

details of weight loss strategies were not obtained in this study. As this was a cross-sectional

study, causality could not be inferred between perceived weight, actual (estimated) BMI, and

weight loss practices. Future studies are needed to identify whether correct perception of own

body weight has a positive impact on weight reduction behaviour and healthy weight

maintenance in this population.

CONCLUSION

Body weight misperception was common among underweight, healthy weight, overweight, and

obese adults in Sri Lanka. Over 2/3 of overweight and 1/3 of obese Sri Lankan adults believe

they are in the right weight or underweight category. Minorities were more likely to over-

estimate their body weight, as well as males and people with lower educational levels. As

perception of overweight or obesity is an important determinant of lifestyle habits and weight

reduction, many overweight and obese Sri Lankans are unlikely to engage in weight control

practices. A minor percentage of Sri Lankans have an accurate awareness of their own body

weight and height, and knowledge of the BMI concept was also poor. Surprisingly, despite some

who recognized themselves as being overweight did not seek advice from health care providers.

Increasing awareness of the medical definition of overweight, obesity and abdominal obesity and

Chapter 8: Manuscript 8 181

understanding of the importance of body composition amongst medical practitioners may make a

significant contribution to healthier lifestyles of Sri Lankans.

182 Chapter 8: Manuscript 8

REFERENCES

1. WHO. Statistics. Country Health Profile 2008 [cited 2010 2 Nov]; Available from:

http://www.who.int/countries/en/.

2. Illangasekera, U., S. Rambodagalla, and S. Tennakoon, Temporal trends in the

prevalence of diabetes mellitus in a rural community in Sri Lanka. The Journal of the

Royal Society for the Promotion of Health, 2004. 124(2): p. 92.

3. Katulanda, P., et al., Prevalence of overweight and obesity in Sri Lankan adults. Obes

Rev, 2010.

4. Wammes, B., et al., The impact of a national mass media campaign in The Netherlands

on the prevention of weight gain. Public Health Nutrition, 2005. 8(8): p. 1250-1257.

5. Becker, A.E., S.E. Gilman, and R.A. Burwell, Changes in Prevalence of Overweight and

in Body Image among Fijian Women between 1989 and 1998&ast; &ast. Obesity, 2005.

13(1): p. 110-117.

6. Nicolaou, M., et al., Body size preference and body weight perception among two

migrant groups of non-Western origin. Public Health Nutrition, 2008. 11(12): p. 1332-

1341.

7. Brener, N.D., et al., The association between weight perception and BMI among high

school students. Obesity, 2004. 12(11): p. 1866-1874.

8. Meera Shekar, A.S., Lidan Du, Malnutrition in Sri Lanka: Scale, Scope, Causes, and

Potential Response, W. Bank, Editor. 2007, Human Development Unit, South Asia

Region.

9. Powell, T.M., et al., Body Size Misperception: A Novel Determinant in the Obesity

Epidemic. Arch Intern Med, 2010. 170(18): p. 1695-1697.

10. Rahman, M. and A.B. Berenson, Self-Perception of Weight and Its Association With

Weight-Related Behaviors in Young, Reproductive-Aged Women. Obstetrics &

Gynecology, 2010. 116(6): p. 1274-1280 10.1097/AOG.0b013e3181fdfc47.

11. Katulanda, P., et al., Prevalence and projections of diabetes and pre-diabetes in adults in

Sri Lanka—Sri Lanka Diabetes, Cardiovascular Study (SLDCS). Diabetic Medicine,

2008. 25(9): p. 1062-1069.

12. WHO, I.a.I., The Asia-Pacific Perspectives: Redefining Obesity and its treatment. 2000.

13. Wang, Y., et al., Is obesity becoming a public health problem in India? Examine the shift

from under- to overnutrition problems over time. Obesity Reviews: An Official Journal

Of The International Association For The Study Of Obesity, 2009. 10(4): p. 456-474.

Chapter 8: Manuscript 8 183

14. Jafar, T.H., N. Chaturvedi, and G. Pappas, Prevalence of overweight and obesity and

their association with hypertension and diabetes mellitus in an Indo-Asian population.

CMAJ: Canadian Medical Association Journal = Journal De L'association Medicale

Canadienne, 2006. 175(9): p. 1071-1077.

15. Katulanda, P., et al., Derivation of anthropometric cut-off levels to define CVD risk in Sri

Lankan adults. Br J Nutr, 2011. 105(7): p. 1084-90.

16. Faber, M. and H.S. Kruger, Dietary intake, perceptions regarding body weight, and

attitudes toward weight control of normal weight, overweight, and obese Black females

in a rural village in South Africa. Ethnicity & disease, 2005. 15(2): p. 238-45.

17. Linde, J., et al., Self-weighing in weight gain prevention and weight loss trials. Annals of

Behavioral Medicine, 2005. 30(3): p. 210-216.

18. Dorsey, R.R., M.S. Eberhardt, and C.L. Ogden, Racial/Ethnic Differences in Weight

Perception. Obesity, 2009. 17(4): p. 790-795.

19. Johnson, F., et al., Changing perceptions of weight in Great Britain: comparison of two

population surveys. BMJ, 2008. 337.

20. de Lanerolle-Dias M, d.S.A., Lanerolle P, Atukorala S., BMI & body weight perception:

the need to create awareness. Annals of Nutrition and Metabolism., 2009. 55: p. 220.

21. Deurenberg-Yap, M., et al., The paradox of low body mass index and high body fat

percentage among Chinese, Malays and Indians in Singapore. International journal of

obesity and related metabolic disorders : journal of the International Association for the

Study of Obesity, 2000. 24(8): p. 1011-7.

22. Wijewardene, K., et al., Prevalence of hypertension, diabetes and obesity: baseline

findings of a population based survey in four provinces in Sri Lanka. The Ceylon

medical journal, 2005. 50(2): p. 62-70.

23. Puoane T, F.J., Shapiro M, Rosling L, Tshaka NC, Oelofse A, ‘Big is beautiful’ – an

exploration of urban black women in South Africa. South African Journal of Clinical

Nutrition, 2005. 18(1): p. 6-15.

24. Hurley E, C.A., Giddy J, Knight SE, Loots E, Esterhuizen TM, Weight evolution and

perceptions of adults living with HIV following initiation of antiretroviral therapy in a

South African urban setting. S Afr Med J 2011. 101: p. 645-650.

25. Tiggemann, M. and E.D. Rothblum, Gender differences in social consequences of

perceived overweight in the United States and Australia. Sex Roles, 1988. 18(1): p. 75-

86.

184 Chapter 8: Manuscript 8

26. Rowland, M., Self-reported weight and height. The American Journal Of Clinical

Nutrition, 1990. 52(6): p. 1125-1133.

27. Arthur, F., A Multidisciplinary Approach to Obesity Management: The Physician's Role

and Team Care Alternatives. Journal of the American Dietetic Association, 1998. 98(10,

Supplement): p. S44-S48.

28. Levin, A., Nutrition and Policy. 5: Who Should Teach Patients about Nutrition? Annals

of Internal Medicine, 1999. 131(4): p. 317-318.

29. Lean, M. and M. Wiseman, Malnutrition in hospitals. BMJ, 2008. 336(7639): p. 290-

290.

30. Al-Sendi, A.M., P. Shetty, and A.O. Musaiger, Body weight perception among Bahraini

adolescents. Child: Care, Health and Development, 2004. 30(4): p. 369-376.

Chapter 8: Manuscript 8 185

Table 8-1: Socio-demographic characteristics, BMI and abdominal obesity categories. Variables Males (169) Female (321) Age (y) (mean±s.d.) 48.4±15.6 48.1±14.1 Area of Residence

• Urban • Rural • Estate

27.8 (47) 60.4 (102) 11.8 (20)

36.2 (116) 57.6 (185) 6.2 (20)

Ethnicity • Sinhalese • Sri Lankan Tamil • Indian Tamil • Muslim

71.1 (120) 11.8 (20) 12.4 (21) 4.7 (8)

80.1(257) 7.2(23) 5.5(18) 7.2(23)

Education level • No Schooling • Up to 5 years • Up to 11 years • Up to 13 years • Graduate

6.5 (11) 6.5 (21) 27.2 (46) 25.2(81) 34.9(59) 40.6(130) 27.2(46) 22.7(73)

4.2(7) 5.0(16)

Prevalence of Diabetes Mellitus 10.6 (18) 12.8 (41) Underweight (BMI<18.5 kg.m-2) 18.3 (31) 13.4 (43) Normal weight (18.5≥ BMI <22.9 kg.m-2) 47.4 (80) 30.6 (98) Overweight (23.0≥ BMI <24.9 kg.m-2) 14.2 (24) 20.2 (65) Obesity (BMI >25.0 kg.m-2) 20.1 (34) 35.9 (115) Abdominal obesity* 13.0 (22) 44.9 (144) *Abdominal obesity (M: 90 cm>WC ; F: 80 cm>WC)

Table 8-2: Awareness of body weight and height Number of Participants (%)

All Male Female

Body Weight

Awareness

Prediction of weight ± 2 kg

268 (54.7%)

121 (24.7%)

104 (61.5%)

47 (27.8%)

164 (51.1%)

74 (23.1%)

Height

Awareness

Prediction of height ± 5 cm

245 (49.9%)

159 (32.4%)

116 (68.6%)

80 (47.3%)

129 (40.2%)

79 (24.6%)

186 Chapter 8: Manuscript 8

Table 8-3: Percentage of adults in each category of weight perception, by BMI category calculated from measured height and weight.

Weight perception category

BMI categories (n) Underweight

About the right

weight Overweight Very overweight

Underweight

Male (31)

Female (43)

54.9%

62.7%

41.9%

37.3%

3.2%

0

0

Normal

Male (80)

Female (98)

31.3%

31.6%

58.8%

57.2%

8.7%

11.2%

1.2%

0

Overweight

Male (24)

Female (65)

4.1%

7.6%

66.7%

44.7%

29.2%

46.2%

0

1.5%

Obese

Male (34)

Female (115)

2.9%

3.4%

38.2%

30.4%

55.9%

48.7%

3.0%

17.5%

Table 8-4: Percentage of adults in each category of waist circumference perception, according to WC cut-offs. WC perception categories

Abdominal obesity (n) Low WC About right WC High WC

Male (22)

Female (144)

4.5%

2.1%

31.8%

31.9%

63.7%

66.0%

Chapter 8: Manuscript 8 187

Table 8-5: Logistic regression model of under perception, correct perception and over perception of body weight.

Variables

Under perception Correct perception Over perception OR(95%CI) P value OR(95%CI) P

value OR(95%CI) P value

Age (years)

1.02 (1.01-1.03) 0.003 0.98(0.97 – 0.99) 0.002 1.00 (0.98 – 1.02)

0.98

Female (Ref.)

Male

1

0.77(0.53 – 1.12)

0.18

1

1.04(0.71 – 1.52)

0.85

1

1.85(1.00 – 3.40)

1

0.048

Urban(Ref.)

Rural

1

0.80(0.55 – 1.17)

0.25

1

1.03(0.70 – 1.51)

0.9

1

1.89(0.91 – 3.90)

0.086

Graduate(Ref.)

No Schooling

Up to 5 years

Upto O/L

Up to A/L

1

1.21(0.41 – 3.60)

2.29(0.92 – 5.68)

1.95(0.80 – 4.73)

0.95(0.38 – 2.36)

0.73

0.075

0.14

0.90

1

0.81(0.27 – 2.47)

0.75(0.30 – 1.88)

0.85(0.35 – 2.06)

2.00(0.80 – 5.00)

0.72

0.54

0.72

1.35

1

1.00(0.27 – 3.69)

0.31(0.09 – 1.00)

0.36(0.12 – 1.09)

0.22(0.06 – 0.79)

0.99

0.05

0.07

0.02

Sinhala (Ref.)

Others

1

1.02(0.67 – 1.56)

0.92

1

0.68(0.45 – 1.06)

0.09

1

2.36(1.25 – 4.45)

0.008

OR: odds ratio

188 Chapter 9: Manuscript 9

Chapter 9: Manuscript 9

Contribution of co-authors for thesis by published paper The authors listed below have certified that

1. They meet the criteria for authorship in that they have participated in the conception, execution, or interpretation, of at least that part of the publication in their field o expertise:

2. They take public responsibility for their part of the publication, except for the responsible author who accepts overall responsibility for the publication;

3. There are no other authors of the publication according to these criteria; 4. Potential conflicts of interest have been disclosed to (a) granting bodies, (b) the editor or

publisher of journals or other publications, and (c) the head of the responsible academic unit, and 5. They agree to the use of the publication in the student’s thesis and its publication on the

Australasian Digital Thesis database consistent with any limitations set by publisher requirements.

In the case of this chapter Paper: Validation of a Food Frequency Questionnaire to assess nutritional intake among

Sri Lankan adults.

Contributor Statement of contribution Ranil Jayawardena Study design, data collection, data analysis

and drafted the manuscript Nuala Byrne Study design, data interpretation and revision

of the draft and approved the final manuscript.

Mario Soares Study design, data interpretation and revision of the draft and approved the final manuscript.

Prasad Katulanda Study design, data interpretation and revision of the draft and approved the final manuscript.

Andrew Hills Study design, data interpretation and revision of the draft and approved the final manuscript.

Principal supervisor confirmation I have sighted email or other correspondence from all co-authors confirming their certifying authorship.

Nuala Byrne 18/04/2013

Name signature Date

Chapter 9: Manuscript 9 189

TITLE PAGE

Ranil Jayawardena1,2*, Nuala M. Byrne1, Mario J. Soares3, Prasad Katulanda2, Andrew P. Hills4

1Institute of Health and Biomedical Innovation, Faculty of Health, Queensland University of

Technology, Brisbane, Queensland, Australia.

2Diabetes Research Unit, Faculty of Medicine, University of Colombo, Colombo, Sri Lanka.

3Curtin Health Innovation Research Institute, School of Public Health, Faculty of Health

Sciences, Curtin University, Perth, WA, Australia.

4Mater Mothers’ Hospital, Mater Medical Research Institute and Griffith Health Institute,

Griffith University, Brisbane, Queensland, Australia.

Citation

R Jayawardena, NM Byrne, MJ Soares, P Katulanda, AP Hills. Validation of Food Frequency

Questionnaire for Sri Lankan adults. Nutrition Journal (Under review): MS ID:

1813393429968846.

190 Chapter 9: Manuscript 9

ABSTRACT

Background

Sri Lanka is undergoing a nutritional transition and diet-related chronic diseases are emerging as

important health problems. Currently, no validated food frequency questionnaire (FFQ) exists to

measure the habitual dietary intake of Sri Lankan adults. The purpose of the study was to assess

the validity of a semi-quantitative FFQ against a 7-day weighed-intake dietary record (7DWR)

among Sri Lankan adults.

Methods

One hundred apparently healthy adults were randomly recruited from a community sample and

administrated the FFQ. All subjects also completed a 7DWFR. Paired sample t tests, Pearson's

correlation coefficients and Bland-Altman analysis were conducted to determine the validity and

the level of agreement between the two measures of food intake.

Results

Seventy-seven subjects completed the FFQ and 7-day WDR. Estimated mean energy intake (SD)

from FFQ (1794 ±398 kcal) and 7DWR (1698 ± 333 kcal, P < 0.001) was significantly different

due to a significant overestimation of carbohydrate (~10 g/d, P<0.05) and to some extent fat (~5

g/d, P<0.05). Significant positive correlations were found between the FFQ and 7DWR for

energy (r = 0.39), carbohydrate (r = 0.47), protein (r = 0.26), fat (r =0.17) and dietary fiber (r =

0.32). Bland-Altman analysis indicated fairly good agreement between methods with no

relationship between bias and average intake of each nutrient examined. Moreover, the FFQ

could correctly classify ~50% of subjects into their respective tertiles of macro and micro

nutrient intakes.

Conclusions

The developed FFQ appears to be an acceptable tool for assessing nutrient intake of Sri Lankans

adults and will assist proper categorization of individuals by tertiles of dietary exposure.

Chapter 9: Manuscript 9 191

INTRODUCTION

Sri Lanka is a low-middle-income country (LMIC) undergoing a nutritional transition. Although

under-nutrition and anemia are a cause for concern, a significant proportion of adults are

suffering from diet-related non-communicable diseases (NCDs). Specifically, a quarter of Sri

Lankan adults are suffering from the metabolic syndrome [1], the prevalence of obesity (BMI

>25 kg.m-2) is 20% among men and 25% among women [2], and nearly 11% adults have type 2

diabetes mellitus [3]. Not surprisingly, a recent priority area for the Sri Lankan health authorities

is to combat diet-related NCDs. However due to the absence of a valid nutrition assessment tool

[3], there is limited national information on eating patterns or dietary exposure to juxtapose

against national level prevalence data on diabetes and cardiovascular disease.

FFQs are designed to capture food habits over an extended period of time and so they are a

commonly accepted tool for assessing habitual dietary intake in epidemiological studies of diet

and chronic diseases [4]. In comparison to other dietary intake assessment methods, FFQs are

relatively inexpensive, easy for the volunteer to understand, and quick to administer [5]. FFQs

are used in both developed and developing countries to relate fruit and vegetable intake to risk of

cardiovascular disease [6], to study links between cancer and nutrition in several countries [7], as

part of national nutrition surveys [8], and to link maternal nutrition to pregnancy morbidity and

birth outcomes of South Indians [9].

Population-specific FFQs are important to assess the dietary intake of a particular group of

people. Sri Lanka has a multiethnic population. The relative validity of FFQs is usually assessed

by comparing their findings with a reference method and the 7-day weighed-intake dietary

record (7DWR) method is widely considered as the ‘gold standard’ approach to assess habitual

192 Chapter 9: Manuscript 9

diet [10]. The aim of this study was to assess the validity of a newly developed FFQ to estimate

nutrient intake compared to 7DWR among Sri Lankan adults.

METHODS

Background

In the Sri Lanka Diabetes and Cardiovascular Study (SLDCS) a multi-stage random-cluster

sampling method was used to select a nationally representative sample of non-institutionalized

adults aged ≥18 years [3]. A sub-sample of the SLDCS was used to develop a representative

FFQ for Sri Lankan adults. Details of the study design have been published elsewhere [11].

Ethical approval for the study was obtained from the Ethical Review Committee, University of

Colombo, Sri Lanka and written informed consent was obtained from each participant before

data collection.

Study sample

A total of 100 adults were randomly selected to participate in the validation study from the

SLDCS and stratified based on ethnicity and area of residence. Participants adhering to a

prescribed therapeutic diet or on weight reduction diet were excluded from the study. Of the 100

adults initially selected, 18 individuals failed to complete the 7DWR. A further five subjects

were excluded before statistical analyses were undertaken as their dietary records were unlikely

to represent habitual intake based on misreporting.

Dietary assessment

Food frequency questionnaire

The FFQ was developed from a country representative sample, the details of which have been

published previously [12]. Briefly, the FFQ contains colour photographs of 3 different portion

sizes of four commonly consumed foods and a list of food items (n=90) with their portion sizes

and frequencies. Food items were categorized to eight food groups namely 1) cereals; 2)

Chapter 9: Manuscript 9 193

vegetables; 3) pulses; 4) meat; 5) fruits; 6) drinks; 7) miscellaneous; and 8) alcohol. The FFQ

was interviewer-administrated in the local language (Sinhalese and Tamil) by two investigators.

The length of interview ranged from 15-20 minutes during which participants were asked to

recall the usual portion sizes and intake of foods comprising the FFQ over the past month.

Subjects were then instructed to complete a seven-day weighed food record.

Seven-day weighed intake

Subjects were requested to keep a weighed record of all food items and beverages consumed

both in and out of the home, over a period of seven consecutive days. Investigators provided

verbal instructions and demonstration on site and telephone instructions were also provided for

any specific queries. All subjects received a calibrated kitchen scale (Tanita KD-407) and a

recording diary, the ‘Home Record’ diary, to weigh and record home-cooked foods. A smaller

pocket sized ‘Eating and Drinking Away From Home’ diary (the ‘Eating Out’ diary) was also

provided for recording food intake when foods could not be weighed. Generally this was meant

to capture foods eaten away from home.

Analysis

Energy and nutrient intakes were calculated using NutriSurvey 2007 (EBISpro, Germany)

nutrient analysis software which was modified for Sri Lankan food items and recipes.

For statistical analysis, means and SDs of energy, macronutrient and micronutrient intakes were

determined for the FFQ and 7DWR methods. Differences and ratios between mean values

obtained with the FFQ and with the reference methods were calculated. Paired t test was used to

determine significant differences between means and correlation between intake amounts

obtained by the two methods evaluated by Pearson correlation analysis. Furthermore, the

agreement between the FFQ and the 7DWR was also examined by evaluating the proportion of

194 Chapter 9: Manuscript 9

participants who fell within the same tertile of the nutrient distribution for both the methods. To

assess agreement between the FFQ and reference methods, and to detect any bias with the test

method relative to the reference method, differences between the 2 respective methods were

plotted against the means, as suggested by Bland and Altman [13]. Minitab version 15.0 was

used for statistical analysis and P value < 0.05 was considered statistically significant.

RESULTS

Subjects were selected from different ethnic backgrounds and area of Sri Lanka. A total of 77

participants completed both 7DWR and FFQ accurately. Sixty-five of this group were women

and the majority were Sinhalese (n=69). Thirty-eight participants were from rural area, 31 from

urban areas and eight from estates.

Mean (SD) energy intake from 7DWR was 1697.9 (333.3) kcal/d and corresponding values from

FFQ was 1794.1 (397.6) kcal/d. Significantly higher energy values were recorded from FFQ

than the reference method (p<0.05). In both methods, over two-thirds of energy was derived

from carbohydrates, and fat provided 19.8% and 22.1% of energy from 7DWR and FFQ

respectively. Only 12.3% of energy was derived from protein in the 7DWR and the

corresponding value for FFQ was 11.1% (Table 9.1).

FFQ and 7DWR were significantly correlated for energy intake (r= 0.39; p<0.001), percentage

of calories from fat (r=0.34, P =0.002), protein (r=0.52, p<0.001) and carbohydrates (0.40,

p<0.001) dietary fiber (r=0.32, p=0.005), PUFA (r=0.37, <0.001), while dietary cholesterol just

reached significance (r= 0.23, p=0.05). Five out of eight vitamins showed significant correlation

and folic acid had the highest r value (r=0.48; p<0.001), whereas among six minerals, sodium

(r=0.17) and zinc (r=0.12) did not show significant correlation. Cross-tabulations of nutrient

intake assessed by the FFQ and 7DWR showed that FFQ was able to correctly classify most

Chapter 9: Manuscript 9 195

macro and micro nutrients into lowest and highest quintile. Notable exceptions were fat intake,

vitamin B1, B2, C, sodium, calcium and zinc (Table 9.2).

The Bland and Altman plot (Figure 9.1a), showing energy differences between 7DWR and FFQ

for each subject, did not indicate that the difference tended to increase as absolute energy intake

increased. Although FFQ reported higher mean energy values compared to reference method, the

spread around the mean reflected the variation is consistent across all levels of intake.

Carbohydrates, protein and fat also shared the same trends as energy (Figure 9.1). Overall, a few

subjects fell outside the limit of agreements (LOA). For all measurements the mean differences

(bias) were not associated with the average of the two methods. However, LOA were wide

(greater than ±2 SDs of the 7DWR) indicating poorer agreement between FFQ and 7DWR

across the range of intakes. On the other hand, although fat and protein showed low correlation,

the LOA for fat and protein were well within ±2 SDs of the 7DWR.

DISCUSSION

The main objective of this study was to examine the validity of our recently developed FFQ to

guage its relative validity and hence application at the next national level NCD survey. The

7DWR is considered the ‘gold standard’ but contributes considerable subject burden. Work

commitments either at office or working in the fields, places a distinct burden on the weighing of

all food eaten during a particular week. Not surprisingly, most men refused to participate or

discontinued the study. Hence our validation sample was mostly comprised of women. The

National Diet and Nutrition Survey in the UK received less than a 50% response rate for the

7DWR [10], a value much lower than this study.

A small survey suggested that a very high intake of starch foods among Sri Lankan adults may

be related to the epidemic of diabetes in the country [11]. Nearly 70 percent of calories were

196 Chapter 9: Manuscript 9

obtained from starch products in that study. Our FFQ showed a reasonable agreement in ranking

of subjects in their intake of energy, carbohydrate, protein and some micronutrients compared to

the reference method. This was evident in both the correlation analysis and Bland-Altman

analysis.

The Bland-Altman approach is considered the preferred statistical analysis to assess the

agreement between two methods [5]. Our FFQ did not show any systematic drift in bias between

the FFQ and 7DWR for macronutrients. Most importantly, it showed a level of agreement

between nutrients that is acceptable for comparison of such methods.

Previous studies using FFQs have reported correlation coefficients of 0.54-0.86 for nutrients

compared to dietary recalls [7]. A large epidemiological study to assess the risk factors of cancer

reported r values of 0.2 for energy between 12-day weight diet record and FFQ [14]. While an

FFQ administered during trimesters of pregnancy showed that correlation coefficients ranged

from 0.11 for vitamin A to 0.44 for protein intake against multiple 24-hour recalls [15]. Overall,

our FFQ showed a satisfactory range of correlations for energy and macronutrients (Table 9.1)

allowing some confidence in its use for studies on diet related NCDs. In addition, significant

correlation for several micronutrients such as iron, calcium and vitamin D indicate its usefulness

in studies on iron deficiency and osteoporosis in Sri Lanka.

The study of diet and chronic disease requires proper classification of subjects to relate the

exposure variable to its putative disease or outcome. Our analysis in Table 9.2 suggests that the

percentage of subjects correctly classified by tertile categories ranged from good to excellent for

many nutrients. A surprising outcome was the poor categorization of dietary fat intake despite no

significant difference in %fat intake between methods and a significant correlation between the

two intakes (Table 9.1). Sodium intake from the FFQ also suffered from a similar poor

classification. It is possible that from a Sri Lankan context both these dietary components have

much day-to-day variability within each person. While coconut oil is the main edible oil, the

Chapter 9: Manuscript 9 197

FFQ may have missed hidden fat and sodium sources. For example, use of coconut milk in

curries is common, but the precise amount used in home recipes may vary. Perhaps additional

probing questions on fat products and sources need to be included to better capture fat intake.

On the other hand, the FFQ is meant to capture usual intake over a prolonged period and so

minimizes day to day variations. Our 7DWFR captured one random week’s intake with a

limitation that food eaten out of home was estimated and recorded, not weighed. The latter

aspect of the method would have also contributed to the poorer categorization of subjects for fat

and sodium. In the present group food eaten away from home included food purchased from

shops or on the streets, where potentially intakes of fat and sodium would have varied from the

recipes available in the database. Objective sodium intake measurement such as 24-hour urinary

analysis can be used for accurate sodium analysis.

Another limitation in this study is the lack of information on the reproducibility of the FFQ. As

the FFQ captures long-term intake, a judgment of what time interval is appropriate becomes

difficult. However, we readministered the same FFQ (FFQ2) 7-10 days after the first FFQ and

found significant correlations between the two administrations (Table: 9.3; online

supplementary) but accept that to some extent, respondents may recall their previous responses

due to this short time interval [5]. Poor male representation (non-responders) in the study sample

may limit the acceptability of its usage among men. Different ethnic groups may have varied

cooking and dietary patterns, however smaller sample sizes may limit the sub-analysis for each

ethnic groups.

CONCLUSION

The validation of this FFQ was the first attempt to create a practical dietary intake instrument

targeted at a national level nutrition and health survey. This population-specific FFQ provides a

reasonable measure of energy and major nutrients intake in Sri Lankan adults. With some

198 Chapter 9: Manuscript 9

improvements, this FFQ could be a useful tool to examine the role of diet in the etiology of

chronic diseases in this population.

Chapter 9: Manuscript 9 199

REFERENCE LIST

1. Katulanda P, Ranasinghe P, Jayawardena R, Sheriff R, Matthews D: Metabolic

syndrome among Sri Lankan adults: prevalence, patterns and correlates.

Diabetology & Metabolic Syndrome 2012, 4:24.

2. Jayawardena R, Byrne NM, Soares MJ, Katulanda P, Hills AP: The Obesity Epidemic

in Sri Lanka Revisited. Asia Pac J Public Health 2012.

3. Katulanda P, Constantine GR, Mahesh JG, Sheriff R, Seneviratne RD, Wijeratne S,

Wijesuriya M, McCarthy MI, Adler AI, Matthews DR: Prevalence and projections of

diabetes and pre-diabetes in adults in Sri Lanka--Sri Lanka Diabetes,

Cardiovascular Study (SLDCS). Diabet Med 2008, 25:1062-1069.

4. Willett WC, Sampson L, Browne ML, Stampfer MJ, Rosner B, Hennekens CH, Speizer

FE: the use of a self-administered questionnaire to assess diet four years in the past.

American Journal of Epidemiology 1988, 127:188-199.

5. Cade J, Thompson R, Burley V, Warm D: Development, validation and utilisation of

food-frequency questionnaires – a review. Public Health Nutrition 2002, 5:567-587.

6. Bazzano LA, He J, Ogden LG, Loria CM, Vupputuri S, Myers L, Whelton PK: Fruit

and vegetable intake and risk of cardiovascular disease in US adults: the first

National Health and Nutrition Examination Survey Epidemiologic Follow-up Study.

The American Journal Of Clinical Nutrition 2002, 76:93-99.

7. Kroke A, Klipstein-Grobusch K, Voss S, Möseneder J, Thielecke F, Noack R, Boeing H:

Validation of a self-administered food-frequency questionnaire administered in the

European Prospective Investigation into Cancer and Nutrition (EPIC) Study:

comparison of energy, protein, and macronutrient intakes estimated with the

doubly labeled water, urinary nitrogen, and repeated 24-h dietary recall methods.

The American Journal Of Clinical Nutrition 1999, 70:439-447.

8. Mishra G BK, Arbuckle J, Crawford D. : Dietary patterns of Australian adults and

their association with socioeconomic status: results from the 1995 National

Nutrition Survey. European Journal of Clinical Nutrition 2002, 56:687-693.

9. Dwarkanath P, Soares MJ, Thomas T, Vaz M, Swaminathan S, Kurpad AV: Food

Frequency Questionnaire Is a Valid Tool for the Assessment of Dietary Habits of

South Indian Pregnant Women. Asia-Pacific Journal of Public Health 2012.

200 Chapter 9: Manuscript 9

10. Swan G: Findings from the latest National Diet and Nutrition Survey. Proc Nutr Soc

2004, 63:505-512.

11. Jayawardena R, Byrne N, Soares M, Katulanda P, Hills A: Consumption of Sri Lankan

adults: an appraisal of serving characteristics. Public Health Nutr 2012, First View:1

- 6.

12. Jayawardena R, Swaminathan S, Byrne N, Soares M, Katulanda P, Hills A:

Development of a food frequency questionnaire for Sri Lankan adults. Nutrition

Journal 2012, 11:63.

13. Martin Bland J, Altman D: statistical methods for assessing agreement between two

methods of clinical measurement. The Lancet 1986, 327:307-310.

14. Date C, Fukui M, Yamamoto A, Wakai K, Ozeki A, Motohashi Y, Adachi C, Okamoto

N, Kurosawa M, Tokudome Y, et al: Reproducibility and Validity of a Self-

administered Food Frequency Questionnaire Used in the JACC Study. Journal of

Epidemiology 2005, 15:S9-S23.

15. Iqbal R, Ajayan K, Bharathi AV, Zhang X, Islam S, Soman CR, Merchant AT:

Refinement and validation of an FFQ developed to estimate macro- and

micronutrient intakes in a south Indian population. Public Health Nutrition 2009,

12:12-18.

Chapter 9: Manuscript 9 201

Table 9-1: Comparison of consumption of nutrients estimated by 7DWR vs. FFQ.

Energy & nutrient

(n = 77)

Intake from 7-day

diet diary

FFQ r value p value

Mean SD Mean SD

Energy (kcal/d) 1697.9 333.3 1794.1 397.6 0.39 <0.001

Protein (g) 53.4 12.9 50.1 11.0 0.26 0.02

Fat (g) 39.4 9.9 46.1 12.9 0.17 0.14

Carbohydrate (g) 292.4 65.9 303.9 75.7 0.47 <0.001

Dietary fiber (g) 14.1 5.4 21.8 9.4 0.32 0.005

PUFA(g) 2.7 1.4 2.4 1.8 0.37 <0.001

Cholesterol (mg) 15.8 25.0 9.4 7.9 0.23 0.05

Vitamin A (ug) 426.3 172.5 652.3 292.6 0.17 0.19

Vitamin E (mg) 1.9 1.4 2.6 1.3 0.09 0.46

Vitamin B1 (mg) 1.6 0.5 1.5 0.4 0.26 0.02

Vitamin B2 (mg) 1.2 0.6 1.2 0.4 0.25 0.03

Vitamin B6 (mg) 1.2 0.6 1.3 1.0 0.36 0.001

Folic acid (mg) 39.0 16.5 45.5 21.7 0.46 <0.001

Vitamin D (ug) 7.2 7.6 7.6 7.8 0.29 0.01

Vitamin C (mg) 33.9 21.4 67.9 42.3 0.21 0.07

Potassium (mg) 1765.5 484.6 1963.2 577.2 0.26 0.02

Calcium (mg) 540.7 145.2 677.4 229.4 0.33 0.004

Magnesium (mg) 258.0 100.2 308.9 124.7 0.46 <0.001

Phosphorus (mg) 1020.3 225.3 1107.4 292.2 0.36 0.002

Sodium (mg) 1812.7 790.2 1834.3 856.1 0.16 0.17

Iron (mg) 16.7 9.2 19.7 9.7 0.25 0.03

Zinc (mg) 7.1 1.8 7.3 2.3 0.12 0.28

% energy from fat 19.8 3.9 22.1 4.1 0.34 0.002

% energy from protein 12.3 2.3 11.1 1.4 0.52 0.0001

% energy from carbohydrate 67.6 5.1 66.7 4.8 0.40 0.0001

202 Chapter 9: Manuscript 9

Table 9-2: Percentage of subjects correctly classified by FFQ relative to the 7DWFR

NS= non-significant

Variable Lowest tertile Highest tertile Kappa statistic (p value)

Energy 58.3 52.6 0.23 (p<0.001)

Carbohydrate 65.4 52.0 0.35 (P<0.001)

Protein 46.2 44.0 0.17 (P<0.035)

Fat 42.0 40.0 0.11 (P=NS)

Dietary Fibre 53.8 52.0 0.29 (P<0.001)

PUFA 53.8 40.0 0.17(P<0.035)

Cholesterol 34.6 44.0 0.03(P=NS)

Vitamin A 72.1 100.0 0.33(P<0.001)

Vitamin E 48.0 32.0 0.05(P=NS)

Vitamin B1 42.3 48.0 0.13(P=NS)

Vitamin B2 44.4 44.0 0.15(P=NS)

Vitamin B6 57.7 52.0 0.21(P<0.009)

Vitamin B12 100.0 32.6 0.20(P<0.002)

Folic Acid 100.0 42.1 0.60(P<0.001)

Vitamin D 87.5 90.0 0.79(P<0.001)

Vitamin C 50.0 32.0 0.09(P=NS)

Sodium 36.0 44.0 0.13(P=NS)

Potassium 46.2 40.0 0.07(P=NS)

Calcium 53.8 40.0 0.11(P=NS)

Magnesium 61.5 52.0 0.25(P<0.002)

Phosphorous 57.6 52.0 0.25(P<0.002)

Iron 61.5 41.7 0.27(P<0.001)

Zinc 42.3 36.0 0.05(P=NS)

Chapter 9: Manuscript 9 203

Table 9-3 (Supplementary): Means, Standard Deviations Pearson’s Correlation Coefficients of

Nutrient intakes Based on FFQ 2 and FFQ 1

Energy & nutrient (n = 68)

FFQ2 FFQ1 r value p value

Mean SD Mean SD Energy (kcal/d) 1813.5 539.1 1794.1 397.6 0.464** 0.0001 Protein (g) 50.9 15.3 50.1 11.0 0.505** 0.0001 Fat (g) 46.7 16.2 46.1 12.9 0.507** 0.0001 Carbohydrate (g) 307.3 96.6 303.9 75.7 0.455** 0.0001 Dietary fiber (g) 21.5 9.8 21.8 9.4 0.438** 0.0001 PUFA (g) 2.4 1.9 2.4 1.8 0.543** 0.0001 Cholesterol (mg) 11.4 9.2 9.4 7.9 0.496** 0.0001 Vitamin A (ug) 622.2 284.3 652.3 292.6 0.273* 0.024 Vitamin E (mg) 2.7 1.2 2.6 1.3 0.371** 0.002 Vitamin B1 (mg) 1.6 0.6 1.5 0.4 0.333** 0.006 Vitamin B2 (mg) 1.3 0.6 1.2 0.4 0.403** 0.001 Vitamin B6 (mg) 1.3 0.6 1.3 1.0 0.286* 0.018 Folic acid (mg) 44.8 23.1 45.5 21.7 0.686** 0.0001 Vitamin D (ug) 10.8 7.9 7.6 7.8 0.814** 0.0001 Vitamin C (mg) 64.7 38.0 67.9 42.3 0.441** 0.0001 Potassium (mg) 2008.4 732.2 1963.2 577.2 0.490** 0.0001 Calcium (mg) 663.5 256.0 677.4 229.4 0.504** 0.0001 Sodium (mg) 1779.3 852.3 1834.3 856.0 0.417** 0.0001 Magnesium (mg) 314.9 137.8 308.9 124.7 0.364** 0.002 Phosphorus (mg) 1119.0 357.0 1107.4 292.2 0.456** 0.0001 Iron (mg) 20.1 12.7 19.7 9.7 0.474** 0.0001 Zinc (mg) 7.4 2.8 7.3 2.3 0.249* 0.041 % energy from fat 22.0 3.8 22.1 4.1 0.531** 0.0001 % energy from protein 11.1 1.6 11.1 1.4 0.549** 0.0001 % energy from carbohydrate 66.8 4.4 66.7 4.8 0.490** 0.0001

204 Chapter 9: Manuscript 9

2800260024002200200018001600140012001000

1000

500

0

-500

-1000

Averages

Diff

eren

ces

LLA = -897.05

ULA = 704.64

Mean = -96.20

Bland-Altman Plot

Figure 9-1: Bland and Altman plots for energy with the mean difference and limits of

agreements. Averages = FFQ+&DWR/2. Mean difference (FFQ-7DWR) is green line and 95% limits of agreements in red line.

807060504030

50

40

30

20

10

0

-10

-20

-30

Averages

Diff

eren

ces

LLA = -24.95

ULA = 32.06

Mean = 3.55

Bland-Altman Plot

Figure 9-2: Bland and Altman plots for protein with the mean difference and limits of agreements. Averages = FFQ+&DWR/2. Mean difference (FFQ-7DWR) is green line and 95%

limits of agreements in red line.

Chapter 9: Manuscript 9 205

706050403020

30

20

10

0

-10

-20

-30

-40

-50

Averages

Diff

eren

ces

LLA = -35.34

ULA = 22.42

Mean = -6.46

Bland-Altman Plot

Figure 9-3: Bland and Altman plots for fat with the mean difference and limits of agreements. Averages = FFQ+&DWR/2. Mean difference (FFQ-7DWR) is green line and 95% limits of

agreements in red line.

450400350300250200150

200

100

0

-100

-200

Averages

Diff

eren

ces

LLA = -180.09

ULA = 98.25

Mean = -40.92

Bland-Altman Plot

Figure 9-4: Bland and Altman plots for carbohydrates with the mean difference and limits of agreements. Averages = FFQ+&DWR/2. Mean difference (FFQ-7DWR) is green line and 95%

limits of agreements in red line.

206 Chapter 10: General discussion

Chapter 10: General discussion

Chapters two to nine have incorporated separate discussion sections in which a specific

commentary of respective research findings in relation to the local, regional and global literature

have been provided. Further, each chapter has provided an interpretation of factors that may

have contributed to the research findings, the strengths and limitations of each study, and the

implications of the results for health promotion, education and further research. This final

chapter provides an overall discussion of the findings of the three major studies and the nine

manuscripts which collectively address the applicability of different nutritional assessment tools

and nutritional issues in South Asia in relation to current diabetic epidemic. The significance of

the research is discussed in light of its contribution to the current body of knowledge. Moreover,

this chapter discusses the strengths and limitations of the project as a whole. Finally, an overall

conclusion is provided along with a discussion of the application of findings for both clinical and

public health settings, and recommendations for future research.

Chapter 10: General discussion 207

COMPARISON OF DIFFERENT DIETARY ASSESSMENT TOOLS

Many different methods have been developed for the purpose of assessing dietary intake (1).

These range from detailed individual weighed records collected over a certain time period to

food frequency questionnaires, dietary recalls, household survey methods and dietary histories.

The most appropriate dietary assessment tool will depend on the purpose for which it is needed

e.g. to measure nutrients, foods or eating habits and diet-related health risks. It is important to

understand that each method has merits, associated errors and practical difficulties to be

considered when making a choice (2). While the 7-day weighed record is widely considered as

the reference method (3) for large epidemiological surveys, the FFQ is a more appropriate

method (1).

Dietary records

The respondent records the identity and amounts of all foods and beverages at the time of

consumption for a period of time (usually 1-7 days). Food and beverages are quantified by

estimating portion sizes using household measurements, or weighing the food or beverage on

scales. There are two types of food records 1) estimated food records and 2) weighed food

records (2).

For the estimated food record approach, the respondent records the foods and beverages and the

amounts of each consumed over one or more days. The amounts consumed may be measured,

using a scale or household measure (such as cups, tablespoons), or estimated, using models,

pictures, or no particular aid (2). Typically, if multiple days are recorded, they are consecutive

and no more than 3 or 4 days are included. Recording periods of more than 4 consecutive days

are usually unsatisfactory, as reported intakes decrease because of respondent fatigue (4).

The weighed record involves an individual or an investigator weighing every item of food and

drink prior to consumption. A detailed description of the food and its weight is recorded in a

specially designed booklet. Usually a space is left to record any leftovers so that the precise

weight of food eaten can be calculated. The 7-day weighed record has often been referred to as

the ‘gold standard’ against which less detailed and demanding methods can be compared (3). In

208 Chapter 10: General discussion

this thesis, a 7-day weighed record was used to validate the newly developed food frequency

questionnaire. However for collecting the food list, a 24-hour dietary recall was administrated.

24-hour dietary recall

For the 24-hour dietary recall, the respondent is asked to remember and report all the foods and

beverages consumed in the preceding 24 hours or in the preceding day. The recall is typically

conducted by interview, in person or by telephone - either computer-assisted or using a paper-

and-pencil form (5). Well-trained interviewers are crucial to administer a 24-hour recall as much

of the information is collected by asking probe questions. Ideally, the interviewer should be a

nutritionist; however, non-nutritionists who have been trained in the use of a standardized

instrument can also be effective. All interviewers should be knowledgeable about foods

available in the marketplace and about preparation practices, including prevalent regional and

ethnic foods or need to perform face validity (1). The interview is often structured, usually with

specific probes to help the respondent remember all foods consumed throughout the day.

Probing is especially useful in collecting necessary details, such as how foods were prepared. It

is also useful in recovering many items not originally reported, such as common additions to

foods (e.g., curry on rice) and eating occasions not originally reported (e.g., snacks and beverage

breaks). This is particularly important for elderly groups (2). However, interviewers should be

provided with standardized neutral probing questions so as to avoid leading the respondent to

specific answers when the respondent really does not know or remember (1).

Dietary history

Particularly in clinical settings a dietary history is used to assess eating habits and nutrition

levels. A dietary history is a structured interview method consisting of questions about habitual

intake of foods from the core (e.g., meat and alternatives, cereals, fruit and vegetables, dairy and

‘extras’) food groups in the last seven days (1). This is followed by a ‘cross check’ to clarify

information about usual intake in the past 3, 6, or 12 months, depending on the aims of the

assessment. This can be used as an alternative to the 24-hour dietary history or food recall. Usual

portion sizes are generally obtained in household measures and/or with the use of photographic

aids (5).

Chapter 10: General discussion 209

Food Frequency Questionnaire (FFQ)

The FFQ is one of the most commonly used methods in epidemiological studies to assess

individual long-term dietary intake of foods and nutrients (2). The questionnaires are typically

self-administered, asking the respondents to report the usual frequency of consumption of items

from a list of foods for a specified time period. The method is sufficiently simple to be used in

large epidemiological studies. Even though the absolute intake is an estimate, using this method

can rank individuals by levels of past nutrient intake in epidemiological studies (1). The

questionnaire is able to rank the population into levels of exposure which are used in the

calculation of relative risk for the development of the disease in question. Therefore, the FFQ is

the most suitable method for measuring dietary factors for nutrition-related NCDs in a large

survey. Moreover, the FFQ can be used to represent different ethnic groups as well as to

discriminate between people’s intake for nutrients known to be associated with the nutritional

related disease (6). For example, Liu et al. found a FFQ was able to assess dietary glycaemic

load in relation to metabolic risk factors (7).

At its simplest, the FFQ consists of a list of foods and a selection of options relating to the

frequency of consumption of each of the foods listed (e.g., times per day, daily, weekly,

monthly)(1). FFQs are designed to collect dietary information from large numbers of individuals

and are normally self-administered, though interviewer-administered and telephone interview are

possible modifications. Levels of education and facilities will determine the mode of

administration. For example, interviewer-administrated methods have been used in India where a

considerable proportion of the population is illiterate whereas in developed countries, an

internet-based FFQ is widely used (8). FFQs normally ask about intake within a given time

frame (e.g., in the past 1-2 months or 1 year) and therefore aim to capture habitual intake. The

length of the food list can vary depending on the nutrients or foods of interest. The number of

food items varies from few to several hundred (1). Many FFQs also attempt to collect

information about portion size in addition to frequency of consumption (9). These may be

referred to as semi-quantitative FFQs. Although there are difficulties implicit in calculating the

absolute nutrient intake of individuals from food frequency questionnaires, they are useful for

gathering information on groups of individuals as well as for looking at habitual intake of a

range of foods.

210 Chapter 10: General discussion

The appropriateness of the food list is crucial in the food frequency method (10). The full

variability of an individual’s diet, which includes many foods, brands, and preparation practices,

cannot be fully captured with a finite food list. Obtaining accurate reports for foods eaten both as

single items and in mixtures is particularly problematic especially in Asian countries where

many mixed dishes and curries eaten. FFQs can ask the respondent to report either a combined

frequency for a particular food eaten both alone and in mixtures or separate frequencies for each

food used. All FFQs must be associated with a food database to allow for the estimation of

nutrient intakes for an assumed or reported portion size of each food queried (8).

In pursuit of improving the validity of the FFQ, investigators have addressed a variety of

frequency questionnaire design issues such as length, closed versus open-ended response

categories, portion size, seasonality, and time frame (1,10). Frequency instruments designed to

assess total diet generally list more than 100 individual line items, many with additional portion

size questions, requiring 30 to 60 minutes to complete. This raises concern about length and its

effect on response rates.

Accuracy of nutrient estimates

Accuracy of energy and nutrient is extremely important in any nutrition survey. The accuracy of

nutrient estimates depends on two factors: the accuracy of dietary information provided by the

participants and the accuracy of the food composition data. Key considerations related to these

two potential sources of error are outlined below.

Any technique used to measure food intake should not interfere with the subject's dietary habits

as this may alter the parameter being measured. Both under-reporting and over-reporting of food

intake are well-known problems in all types of dietary surveys, regardless of the dietary

assessment method used. If food intake is under-reported, energy and nutrient intakes may also

be underestimated, and estimates of inadequate intake may be overestimated. It is difficult to

quantify under-reporting, but research shows that the degree of under-reporting varies according

to personal characteristics and across types of foods (11,12). For example, under-reporting is

more common in those with a high BMI, and in females. Certain foods are more likely to be

under-reported, especially those perceived as less healthy (e.g., cakes, biscuits, desserts, fats).

On the other hand, over-reporting of fruit and vegetable intake can be seen amongst more

educated groups (11). Moreover, it is widely observed that culturally preferred foods tend to be

over-reported and vice versa (13). Apart from the type of foods, an accurate detail of the amount

of food is equally important. In all dietary assessment methods where food is not weighed,

Chapter 10: General discussion 211

portion sizes must be determined before nutrient output can be calculated. There are a number of

methods by which portion sizes may be obtained. These may include field workers weighing

certain food items on the individual’s behalf, the use of photographic atlases (14, 15) showing

portion sizes of commonly eaten foods to an individual, using data from manufacturers, portion

sizes collected from previous weighed food records, and household measures.

Unlike most developed countries, there is no centrally managed nutrient database in Sri Lanka.

We therefore compiled information from the food composition tables of Sri Lanka (16), the

United States Department of Agriculture nutrient database (USDA) (17), the Indian Food

Composition Tables (18), and McCance and Widdowson’s food composition tables (19) to

develop a comprehensive and new nutrient composition database as follows. a) Nutrition values

for single food items were taken mainly from the USDA nutrient database; b) Nutrition

information leaflets or details from direct contact with producers were used for locally available

food products (e.g., biscuits); c) For mixed dishes and cooked foods, local recipes were taken

from popular cookery books (20), and by interviewing participants. All recipes were accepted

after checking for face validity by consulting local housewives and nutritionists. According to

the recipes, ingredients were weighed to the nearest 1 g for edible portions of the foods, and the

food items were cooked and weighed. Nutritional composition of the final recipe was calculated

by entering nutritional values and weights of individual ingredients into a spreadsheet. The sum

of each nutrient was computed and standardized to 100 g of the final product. Data on weight

loss associated with cooking (e.g., due to water evaporation) was recorded to ensure accurate

nutrient density of the portion size consumed. However, nutrient losses (e.g., vitamins) during

food preparation were not considered. However in ideal circumstances, all food items should be

chemically analysis for their nutrient ingredients.

212 Chapter 10: General discussion

NUTRITIONAL ISSUES IN SOUTH ASIA IN RELATION TO THE CURRENT DIABETES EPIDEMIC

Diet is an important factor in preventing diabetes, managing existing diabetes, and preventing, or

delaying the development of its complications (21). Eating habits are one of the main

determinants of diabetes among South Asians. Although the published data on dietary habits and

development of diabetes in this region is limited, it is believed that dietary habits play an

important role in the epidemic of diabetes among South Asians.

Carbohydrates

Compared to Europeans, the diet of South Asians is predominantly based on starchy foods (22).

Similarly, Indian vegetarians have a higher percentage of carbohydrates in their diet when

compared to American vegetarians and non-vegetarians (23). Our data shows a majority of Sri

Lankan adults consume starchy foods above the upper limit of recommendations (24). Elevated

2-h insulin concentrations have been shown to be positively associated with the proportion of

energy intake from carbohydrate (22). Others have shown that compared with a low-

carbohydrate diet (35% of total energy from carbohydrates), an iso-caloric high-carbohydrate

diet (60% of total energy from carbohydrates) caused a 27.5% increase in plasma triglycerides, a

similar increase in VLDL-cholesterol levels, and an 11% reduction in HDL cholesterol levels

(25). A typical South Asian diet consists of over 60% of carbohydrates which may lead to

undesirable glycaemic and lipid changes. The quality of carbohydrates is also an important

factor in diabetes and a diet with high glycaemic index foods has been shown to increase

postprandial plasma glucose levels in subjects with impaired glucose tolerance (26). Mohan et

al. argued that increased consumption of refined cereals may be more detrimental than the

amount of carbohydrates among Indians (27). Higher intake of white rice was associated with an

increased risk of type 2 diabetes (28). Added sugar consumption is also high in India (29). Sri

Lankans consume over 3.5 portions of sugar day (24) and as sugary foods and refined starch

digest rapidly and are converted to glucose, this increases insulin demand and may lead to

pancreatic b-cell exhaustion in the long run (30).

Dietary fats

In a 14-year follow-up of 84,204 non-diabetic women, total fat and SFA and MUFA intake were

not associated with risk of type 2 diabetes (31). Similarly, another large prospective study on

Chapter 10: General discussion 213

men (n=42,504) found total fat and SFA were not associated with type 2 diabetes incidence

when adjusted for BMI (32). According to the National Sample Survey Organization (2004-

2005), the consumption of fat among Indians was 44 g/d in rural areas and 58.2 g/d in urban

areas (33). In the studies conducted in this thesis, we found that fat intake among men and

women in Sri Lanka was 40.5 g/d and 31.9 g/d, respectively (34). Most South Asians are getting

less than 20% of total calories from fat. According to the ranges of population nutrient intake

goals recommended by WHO, the percentage of energy from total carbohydrates, fats and

proteins should be 55-75%, 15-30% and 10-15%, respectively (35). Total fat consumption as an

energy source is under the safe limits among South Asians. However, type of fats may be

significant in this population. India and other South Asian countries often use ghee for cooking

which contains high TFA (36) whereas Sri Lankans and South Indians often consume coconut

products which contain SFA (37). Full cream milk and dairy products also provide SFA and

cholesterols. Although there is no evidence to suggest fat consumption and diabetes are

associated among South Asians, unhealthy fat consumption might increase the complications of

diabetes, especially cardiovascular complications. Ghee and dairy products also provide SFA

and cholesterols. On the other hand, MUFA and PUFA consumption is low among this

population (38).

Dietary fiber

Large prospective studies support a protective role of dietary fiber for the development of

diabetes (39, 40). A randomized, cross-over study showed that a high fiber diet (total, 50 g; 25 g

of soluble fiber and 25 g of insoluble fiber) compared to the recommended amount (total, 24 g; 8

g of soluble fiber and 16 g of insoluble fiber), significantly improved glycaemic control,

decreased hyperinsulinaemia, and lowered plasma lipid concentrations in patients with type 2

diabetes (41). These benefits most likely occur by slowing the digestion and absorption of food

and by regulating several metabolic hormones (40). Limited available data showed that daily

intake of dietary fiber is low among South Asians (34, 38).

Vitamin and minerals

Zinc is an important structural and functional molecule for insulin. Zinc supplementation in

patients with diabetes demonstrates that zinc supplementation has beneficial effects on

glycaemic control and promotes healthy lipid parameters (42). A meta-analysis of randomized

double-blind controlled trials regarding the effect of magnesium supplementation on glycaemic

control in type 2 DM showed significant reduction of fasting glucose level in the treatment

214 Chapter 10: General discussion

group (43). Mean daily intake of manganese and zinc is lower in Indian vegetarians (23). A

systematic review and meta-analysis of observational studies and clinical trials in adults with

outcomes related to glucose homeostasis showed vitamin D and calcium insufficiency may

negatively influence glycaemia (44). Several studies reported a high prevalence of

hypovitaminosis D and low dietary calcium level among Indians (45, 46). Our data showed low

calcium and vitamin D intakes among Sri Lanka adults. Indians consumed high amounts of salt,

Indian (Ladakh) men showed >200 mmol/day sodium excretion (47). In a Finnish prospective

study, the hazard ratio for diabetes for the highest (>200 mmol/24 h) versus combined lower

quartiles of 24-h urinary sodium excretion was 2.05 (95% CI, 1.43-2.96) after adjusting several

known risk factors. In contrast, potassium may have a protective effect against diabetes (48).

Fruit and vegetables are good sources of potassium.

Fruit and vegetables

Fruit and vegetables contain several nutrients, which may have a number of health benefits. The

effect is beyond the cumulative effects of individual nutrients such as dietary fiber, vitamins and

antioxidants. Although fruit and vegetables are not nutrients, we elaborate separately. Fruit and

vegetable intake is inversely associated with diabetes incidence (49). The EPIC-Norfolk Study

reported that subjects with unknown diabetes that consumed higher intakes of fruits and

vegetables had significantly lower levels of HbA1c (50). In a multivariate analysis, a significant

inverse trend was observed between fruit intake and the probability of having the glycaemic

component (plasma glucose ≥110 mg/dl) of metabolic syndrome features (51). Fruit and

vegetables reduce diabetes-associated complications, especially heart disease and stroke (52).

Fruit and vegetables are widely available in the South Asian countries but consumption is very

low. Average fruit consumption of four cities from Bangladesh was 1.7 servings/day and 1.6

servings/day among men and women, respectively. Corresponding values for vegetable

consumption were 3.4 and 3.0, for men and women (53). Fruit and vegetable intake among

Indian men and women were 1.2 servings/day for fruit and 1.3 servings/day for vegetables.

According to the World Health Survey 2002-2003, Pakistan and Nepal have the highest

prevalence of low fruit and vegetable consumption among 52 countries. Less than 1% of

Pakistani and less than 2% of Nepalese consume a minimum of five fruits and vegetables daily

(54). In Sri Lanka, we found that mean dietary intake of fruit and vegetables was 2.16

portions/day and only 3.5% of adults consumed according to the recommendations (24).

Similarly, only 2.7% of Maldives adults had five or more portions of fruits and vegetables daily

Chapter 10: General discussion 215

(55). The vegetable consumption pattern is very unique among South Asians. Although there is a

considerable variation among different ethnic groups, most of the vegetables are consumed in

the form of a curry, with cooking oils, curd, coconut milk and dairy fats. Moreover, adding

strong spices prevents consumption of vegetables in a large quantity. The cooking methods used

are boiling, steaming, grilling, baking and roasting as opposed to the South Asian countries

where frying is mostly the preferred method.

Occurrence and progression of diabetes and other metabolic diseases are associated with dietary

habits however assessment of dietary factors for chronic diseases is inherently difficult due to

several confounding factors. There is limited published data available on nutrient composition

and dietary habits of native South Asians. Lifestyle factors of immigrant South Asians could also

be different to their native counterparts. Furthermore, dietary habits are considerably

heterogeneous among ethnic groups. Culturally specific and sensitive dietary interventions are

required to identify nutritional risk factors for diabetes among South Asians.

216 Chapter 10: General discussion

STRENGTHS OF THE STUDY

There are several strengths of this research work including the sampling, data collection and

reporting methods. Firstly, studies were based on a sub-sample of the Sri Lanka Diabetes and

Cardiovascular Study (SLDCS). The SLDCS included a nationally representative sample of

5000 adults aged ≥18 years selected using a multi-stage random cluster sampling technique. The

response rate for the first study was over 80% and for the validation study approached 70%.

Having a representative sample is a key strength for any population-based study.

Secondly, although data collection was undertaken in different community settings, all

anthropometric data were collected using standardised equipment and techniques. Similarly, as

discussed in Chapter 2, robust data collection techniques were applied to collect the 24-hour

recall data. The seven-day weighed intake (7DWI) is considered the “gold standard” method to

retrieve dietary data. A satisfactory validation against 7DWI demonstrated the appropriateness of

the FFQ for this population.

Finally, it is extremely difficult to categorize mixed dishes to food groups therefore complex

dishes were disaggregated before ingredients were categorized into appropriate food groups.

This scientifically sound method helped to categorize dishes into the main food groups.

Moreover, defining portion sizes for many local fruit and vegetable, protein and starch items is

based on sound nutrition concepts.

LIMITATIONS OF THE STUDY

Due to the scope and various constraints such as time and funding associated with the

completion of the PhD project within a three-year period, several limitations of this research

Chapter 10: General discussion 217

project must be acknowledged. These relate to sampling, selection and confounding bias, and

limitations of some of the measurement tools used.

The accuracy of cross-sectional studies is based on the selection of a representative sample.

However, participation rate is a significant factor to assess the quality of the sampling. Study 1

had an 82% response rate but male participation was considerably lower. Moreover,

participation of young adults was limited. Although data collection was undertaken with prior

notice, few men and young working people participated due to other commitments. Having a

large proportion of over 40 year-old adults may limit the interpretation for young adults with

diverse eating patterns. Similarly, Study 2 was dominated by middle-aged women. Weighing

their own food was also not practical for many busy individuals.

Sri Lanka is a multi-cultural country with four sub-ethnic groups, namely Sinhalese, Indian

Tamil, Sri Lankan Tamils and Muslims. Each sub-ethnic group has different dietary and

behaviour patterns. Due to the small sample size, the representation of dietary intakes of

minority ethnic groups may not be adequate. The lower number of subjects in minority groups

may have affected an accurate determination of the prevalence of obesity. For example, there

was a high non-response rate from Sri Lankan Tamils in the previously war-affected areas.

Another shortcoming of this study was the limited accuracy of the nutrient values of some of the

food items. Due to highly diverse food items, many local food items were not available in any of

the food composition databases. Furthermore, there is a significant difference in the list of

ingredients in the ‘same’ dishes due to differences in cultural background. Therefore, due to the

absence of accurate nutritional composition of the food items, energy and nutrient values of

similar food items were used.

218 Chapter 10: General discussion

Obesity perception is very subjective. Measurement of obesity using an objective scale is not the

ideal. Self-perception of body weight is associated with additional parameters such as perception

of body shape and associated health risk. Qualitative details of misperception of body weight

would provide a more complete picture and help to better understand misperception of body

weight among this population. Lack of qualitative data with regards to obesity perception may

therefore be a limitation of the studies presented in this thesis.

RECOMMENDATIONS

Recommendations for future research

It is evident that Sri Lanka has a serious diet-related non-communicable diseases burden. A lack

of local data on eating habits and nutrient intake are evident. Our findings showed high intakes

of starchy foods and low fruit and vegetable intake. However, we collected only quantitative

data therefore we do not know the reasons for these less healthy eating habits which may be

associated with several cultural, economic and behavioural factors. Therefore, qualitative studies

among a representative group of adults would be essential to determine the underlying reasons

and causes at the grass root level. Similarly, qualitative data are necessary for a better

understanding of the misperception of body weight among many Sri Lankan adults.

Analytical research is important to obtain accurate nutrient values of local fruits, vegetables,

green leaves and locally made sweets. These foods play an important role in the Sri Lankan diet

but a lack of nutrition composition data hinders the provision of culturally acceptable nutritional

advice. In particular, research on micronutrients such as vitamin, mineral and anti-oxidant levels

is essential. Moreover, as Sri Lankans often consume foods which are cooked under extreme

heat and for a long time, it is hard to predict the nutrient composition of the end meal. Food

science research is therefore important to accurately document nutrient values of Sri Lankan

meals.

Chapter 10: General discussion 219

Children’s dietary patterns are equally important in the prevention of diet-related NCDs.

However, currently there is no country-specific FFQ for children. Dietary habits and portion

sizes in children are very different to adults. In particular, take-away foods are the main choices

in schools. Adolescents also have distinctive eating habits during a life transition period that can

be both physically and mentally taxing. Further research is therefore important to document the

food habits of children and adolescents and associated health risks in Sri Lanka.

Recommendations for public health and clinical initiatives and interventions

Translation of theory to practice is essential in health-related studies. This thesis is the first

nutritional survey undertaken in Sri Lanka and reports several unhealthy eating habits among

adults. However, cross-sectional studies are not adequate to establish the causative relationship

between dietary habits and high NCD levels. With the current findings, it is possible to start

public health intervention studies to encourage the reduction of high starchy food consumption

and increase intake of fruit and vegetables. Furthermore, dairy consumption of Sri Lankans is

also extremely low which may be due to the unavailability of fresh milk. Government policies

should give higher priority to increased milk and dairy food production and consumption.

The number of people suffering from obesity and diabetes has reached epidemic levels.

However, dietary changes and weight reduction are challenging for clinicians. Our data showed

an association between dietary habits and obesity level among Sri Lankan adults. A significant

amount of nutrition knowledge is important to provide a balanced diet with limited food items.

One of the main objectives of this thesis was to develop and validate a country-specific FFQ for

Sri Lankan adults. Researchers and government bodies should utilize this FFQ for the next

national health survey and other dietary intervention studies. The Sri Lankan government should

provide the technical support to improve the practicality of this FFQ for large-scale studies.

220 Chapter 10: General discussion

Firstly, optical scanning facilities are needed to obtain selected food items and secondly,

software development for the analysis of nutrients values and reporting is needed.

Chapter 10: General discussion 221

CONCLUSIONS

This thesis fills the significant research gap regarding dietary habits and obesity in Sri Lankan

adults. Findings from the nutrition survey showed on average, Sri Lankan adults consumed over

14 portions of starch/d; moreover, males consumed 5 more portions of cereal than females. Sri

Lankan adults consumed on average of 3.56 portions of added sugars/d with mean daily intake

of fruits and vegetables well below minimum dietary recommendations. As expected, over 70%

of energy was derived from carbohydrates. Moreover, high dietary diversity was associated with

high obesity levels among Sri Lankan adults. The success of a weight reduction intervention is

dependent upon an individual’s awareness of their own body weight and their motivation to

change. Self-perception of body weight is a strong determinant of nutritional habits and weight

management and misperception of body weight may be a barrier to successful weight loss and

healthy weight management in this population. The development and validation of this country-

specific FFQ will boost nutritional research in the country however more effective collaborations

of clinicians, public health experts and policy makers are needed to improve the health and

wellbeing of Sri Lankan adults.

222 Chapter 10: General discussion

REFERENCE LIST

1. Walter Willett EL. Nutritional epidemiology. In: Willett W, editor. Monographs in

Epidemiology and Biostatistics: Oxford University Press; 1998. p. 101-47.

2. Wendy Wrieden. A short review of dietary assessment methods used in National and

Scottish Research Studies. Dundee2003.

3. Henderson L, Gregory J, Swan G. The national diet & nutrition survey: Adults aged 19 to

64 years: Stationery Office; 2003.

4. Gersovitz M, Madden JP, Smiciklas-Wright H. Validity of the 24-hr. dietary recall and

seven-day record for group comparisons. Journal of the American Dietetic Association.

1978;73(1):48.

5. Buzzard I, Faucett CL, Jeffery RW, McBANE L, McGOVERN P, Baxter JS, et al.

Monitoring Dietary Change in a Low-Fat Diet Intervention Study:: Advantages of Using 24-

Hour Dietary Recalls vs Food Records. Journal of the American Dietetic Association.

1996;96(6):574-9.

6. Shahar D, Shai I, Vardi H, Brener-Azrad A, Fraser D. Development of a semi-

quantitative Food Frequency Questionnaire (FFQ) to assess dietary intake of multiethnic

populations. European journal of epidemiology. 2003;18(9):855-61.

7. Liu S, Manson JE, Stampfer MJ, Holmes MD, Hu FB, Hankinson SE, et al. Dietary

glycemic load assessed by food-frequency questionnaire in relation to plasma high-density-

lipoprotein cholesterol and fasting plasma triacylglycerols in postmenopausal women. Am J Clin

Nutr. 2001 Mar;73(3):560-6.

8. Bharathi AV, Kurpad AV, Thomas T, Yusuf S, Saraswathi G, Vaz M. Development of

food frequency questionnaires and a nutrient database for the Prospective Urban and Rural

Epidemiological (PURE) pilot study in South India: methodological issues. Asia Pac J Clin Nutr.

2008;17(1):178-85.

9. Victoria CC. Dietary questionnaires. 2010; Available from:
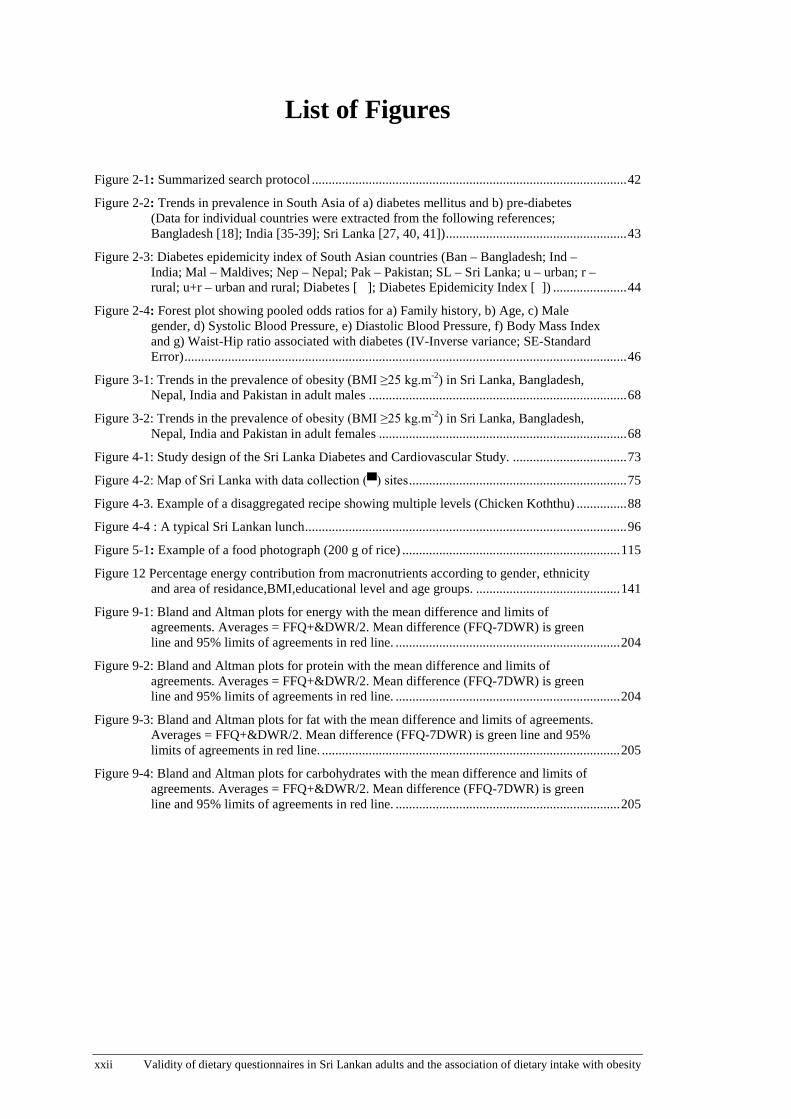
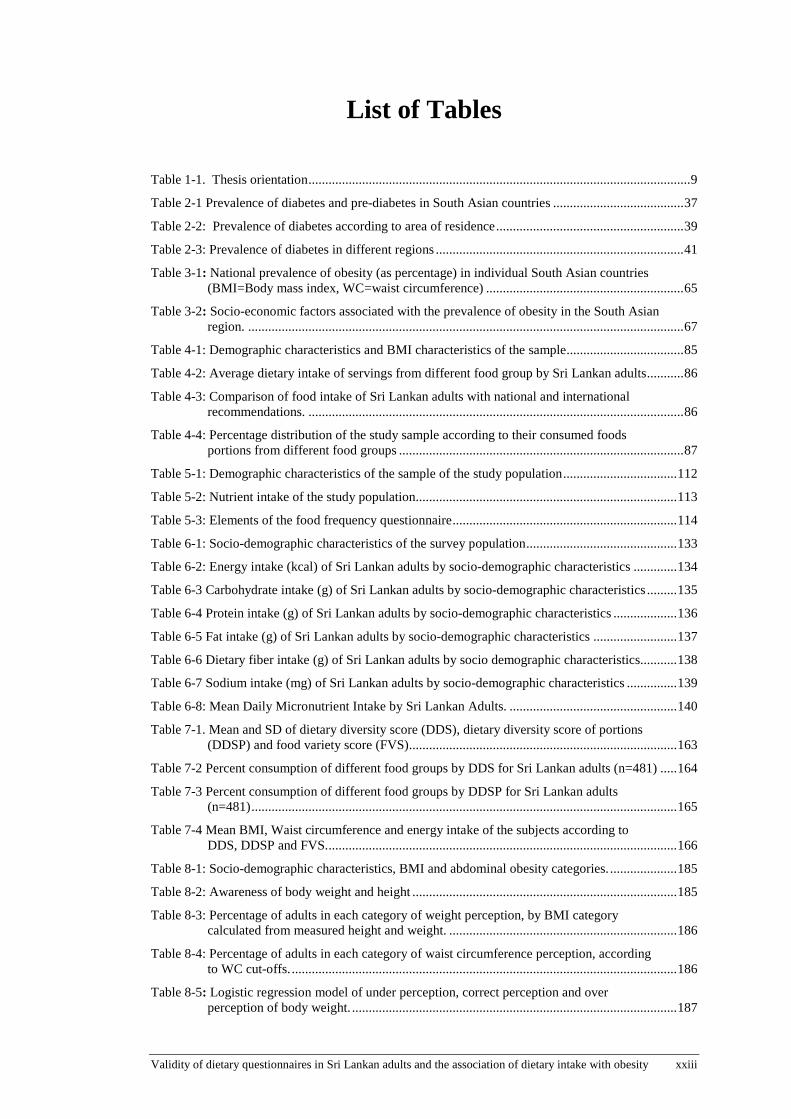
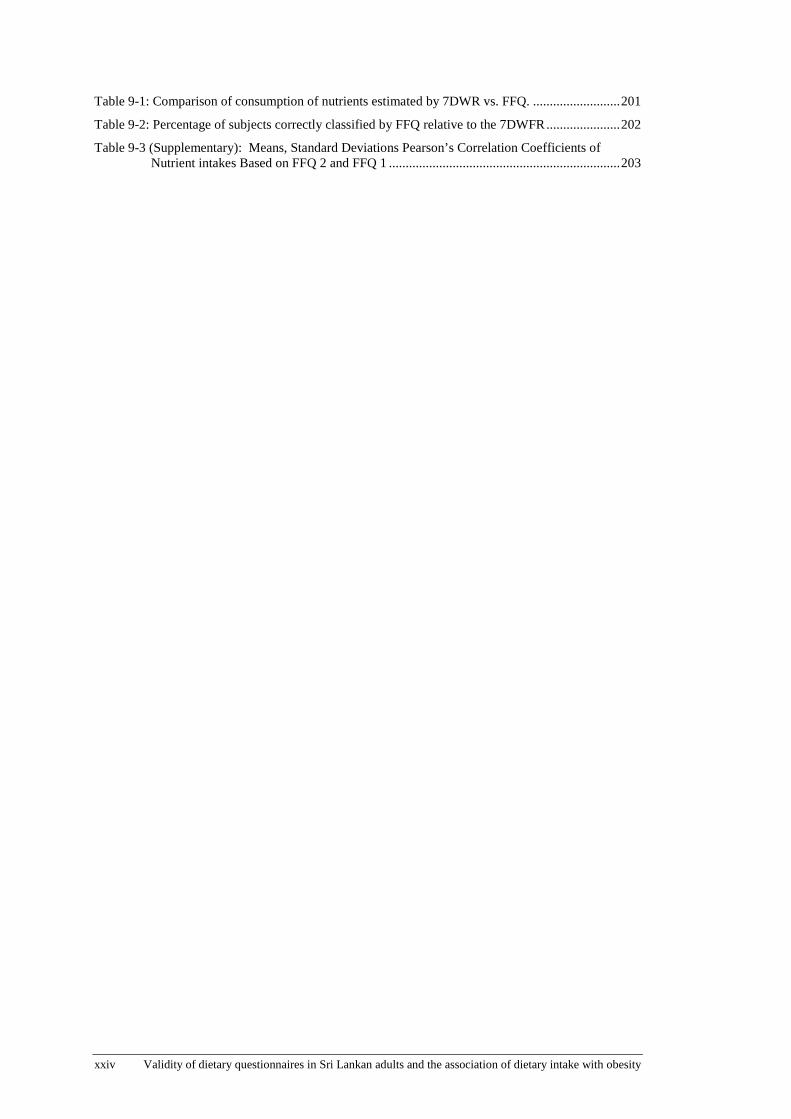
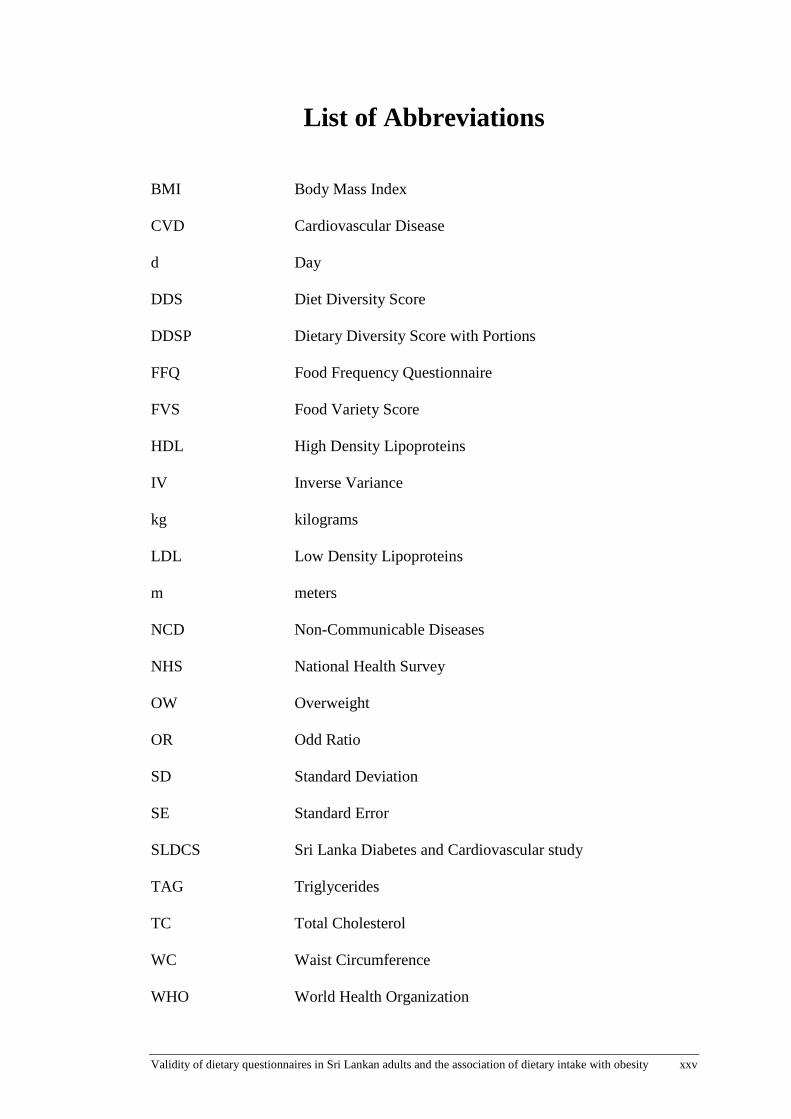
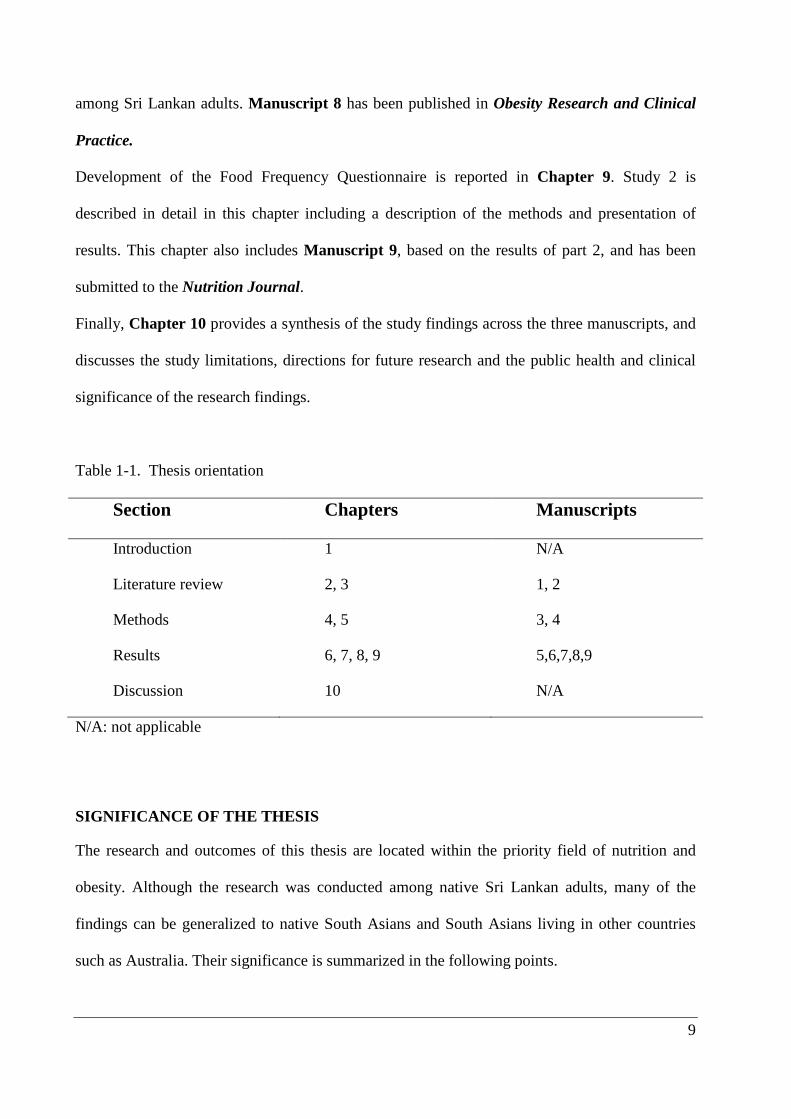
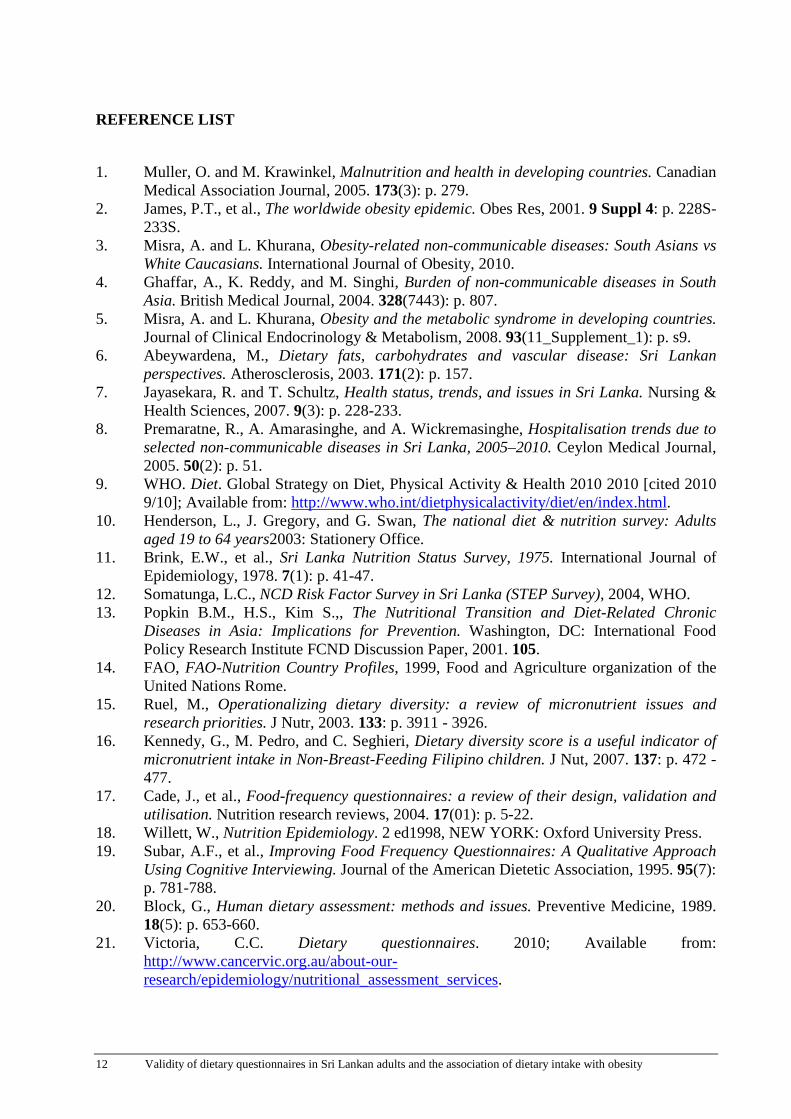
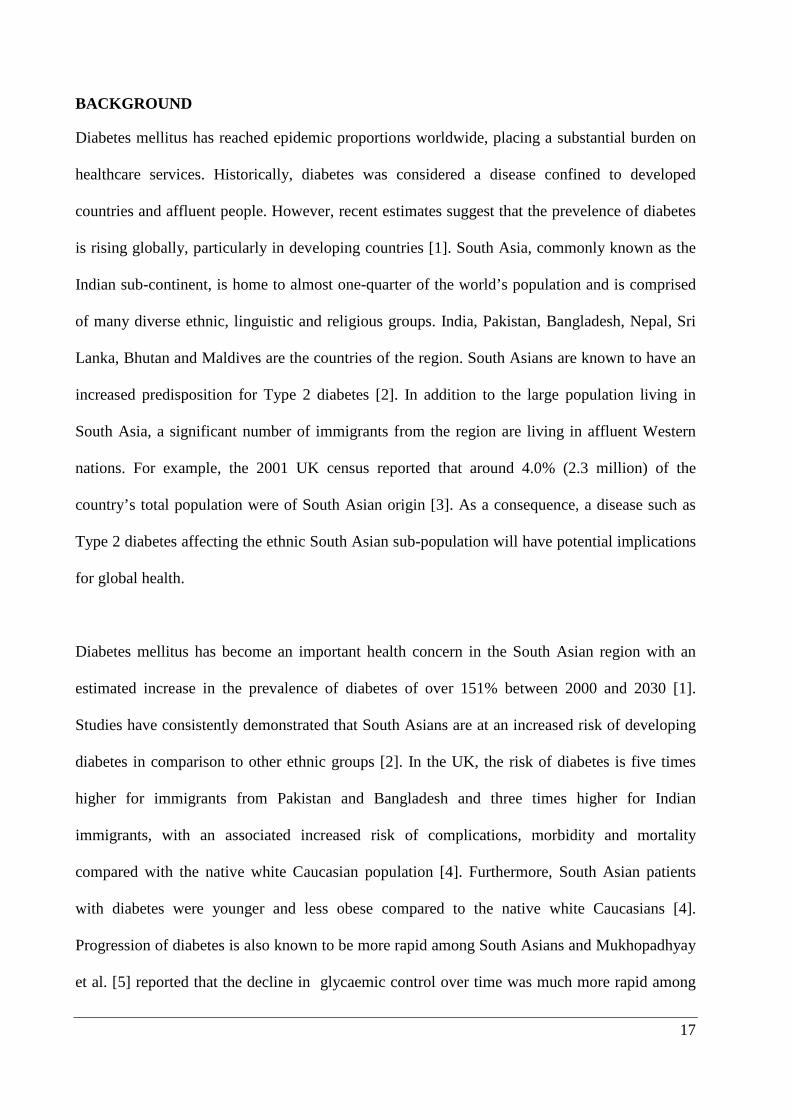
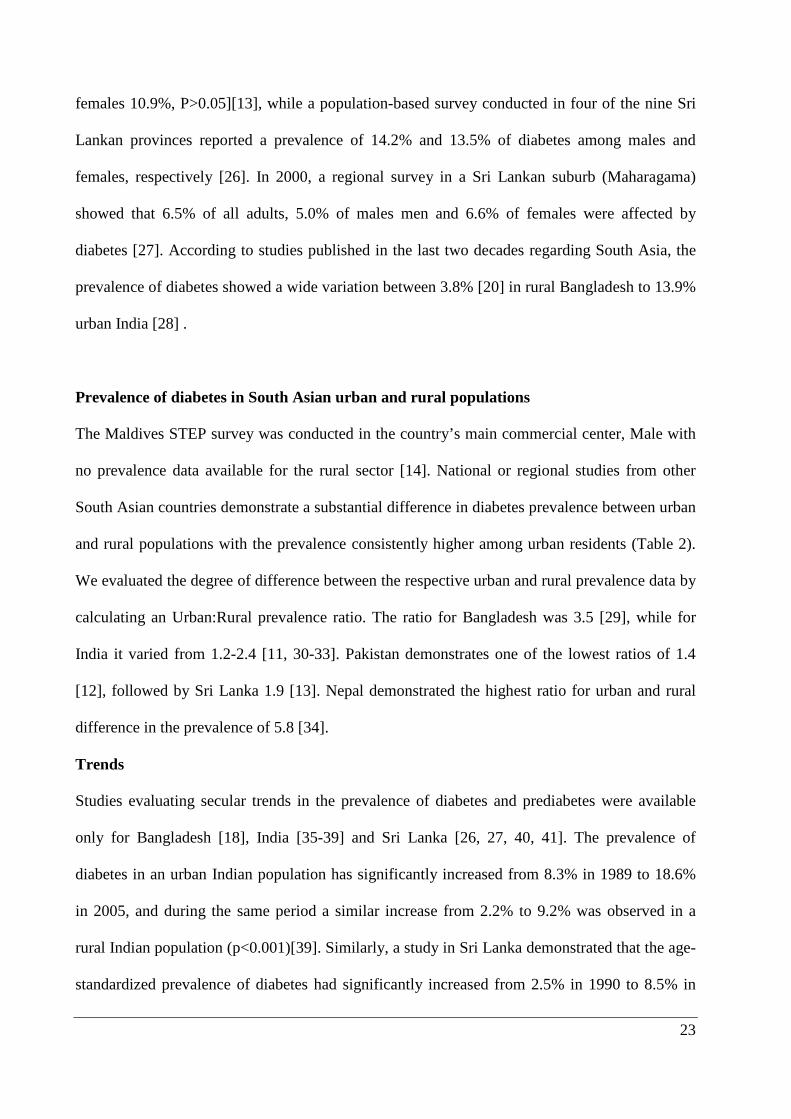
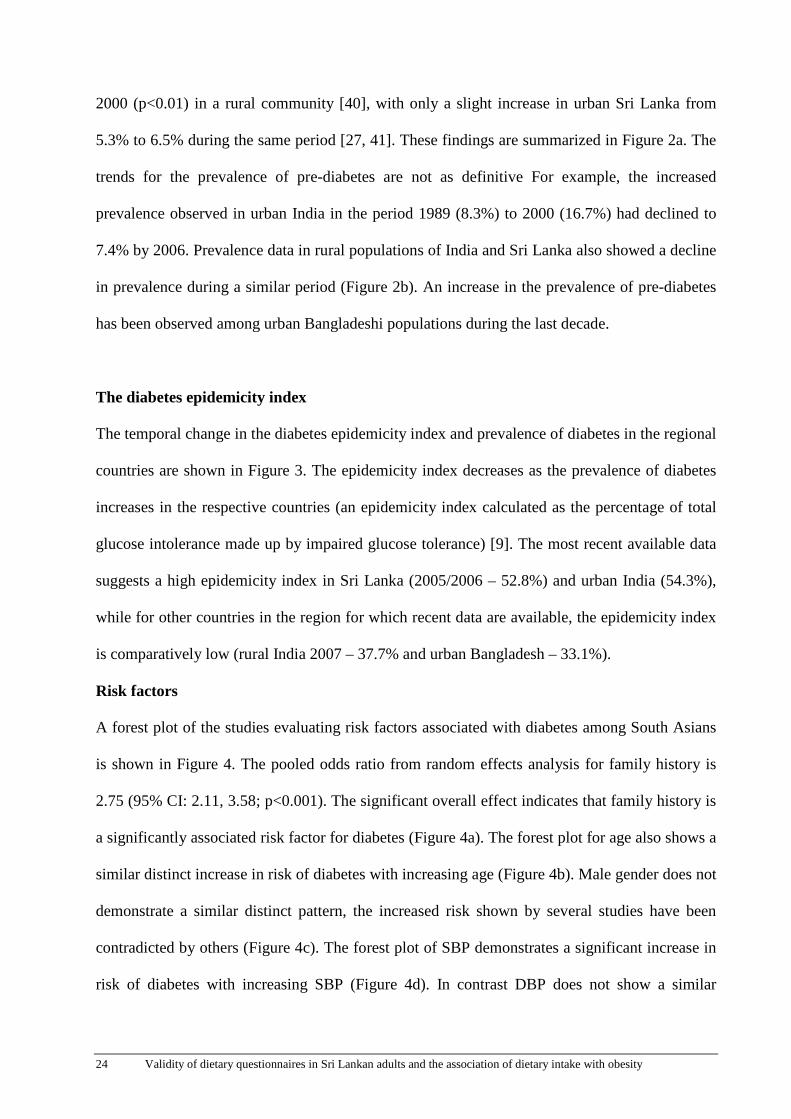
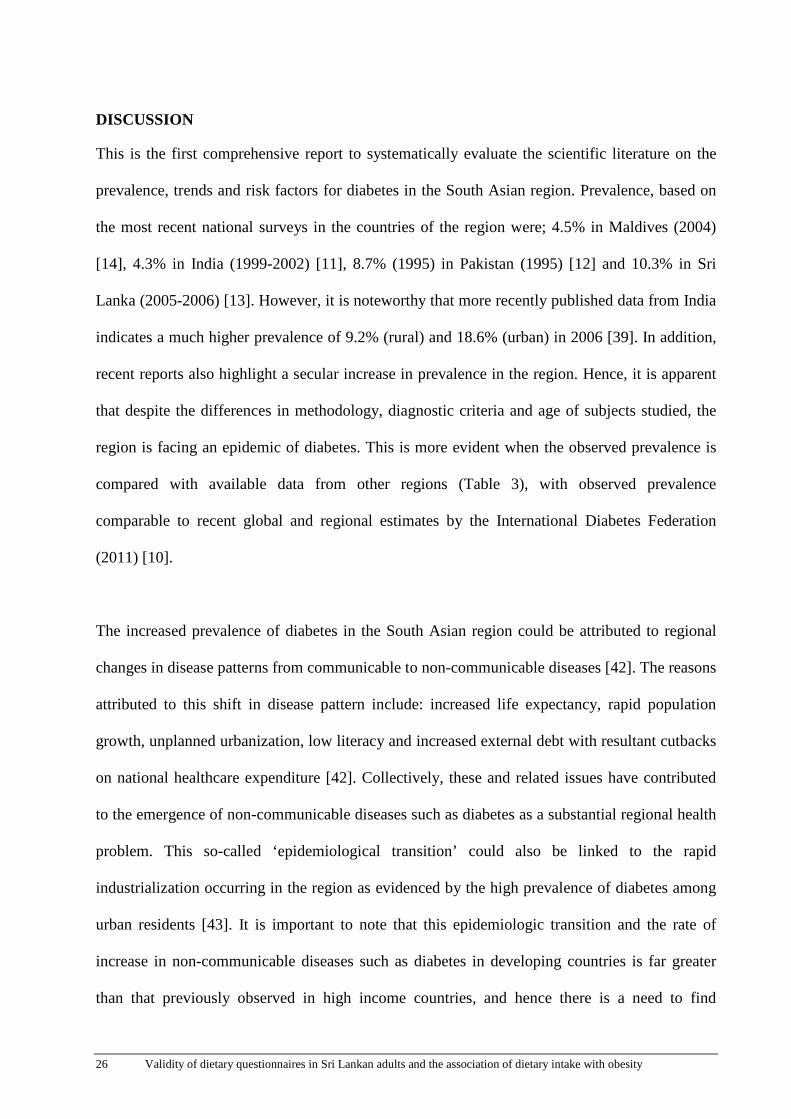
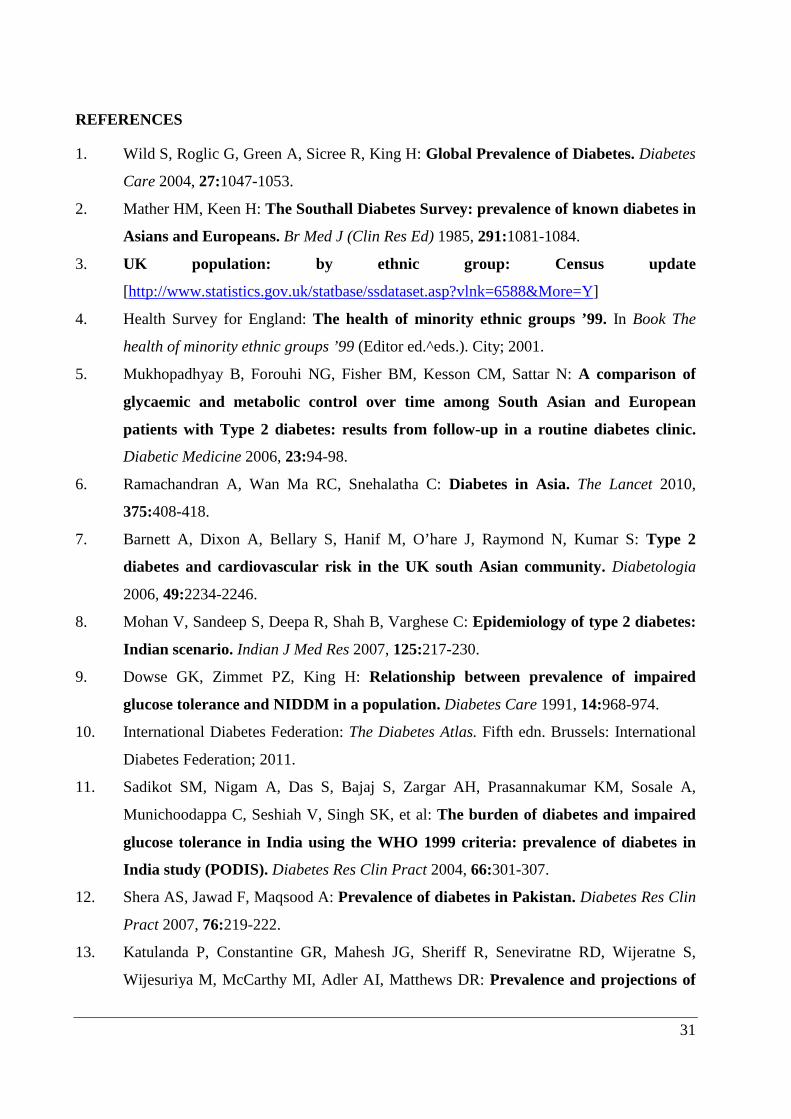
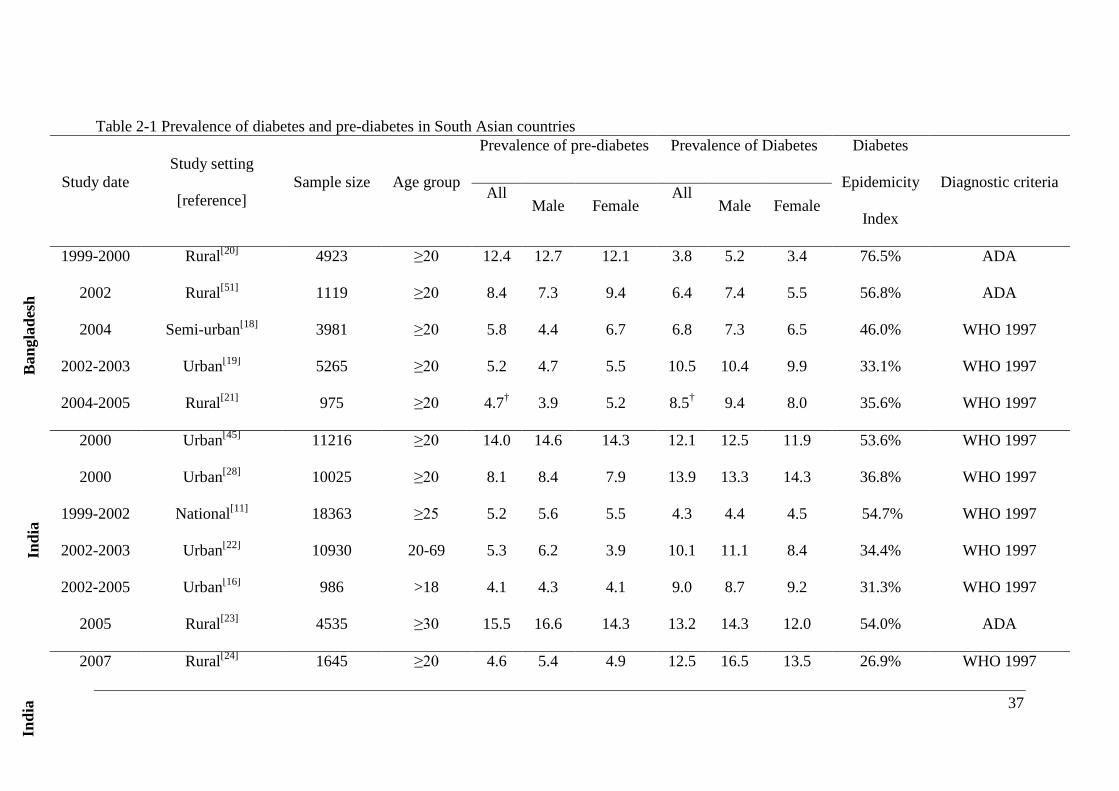
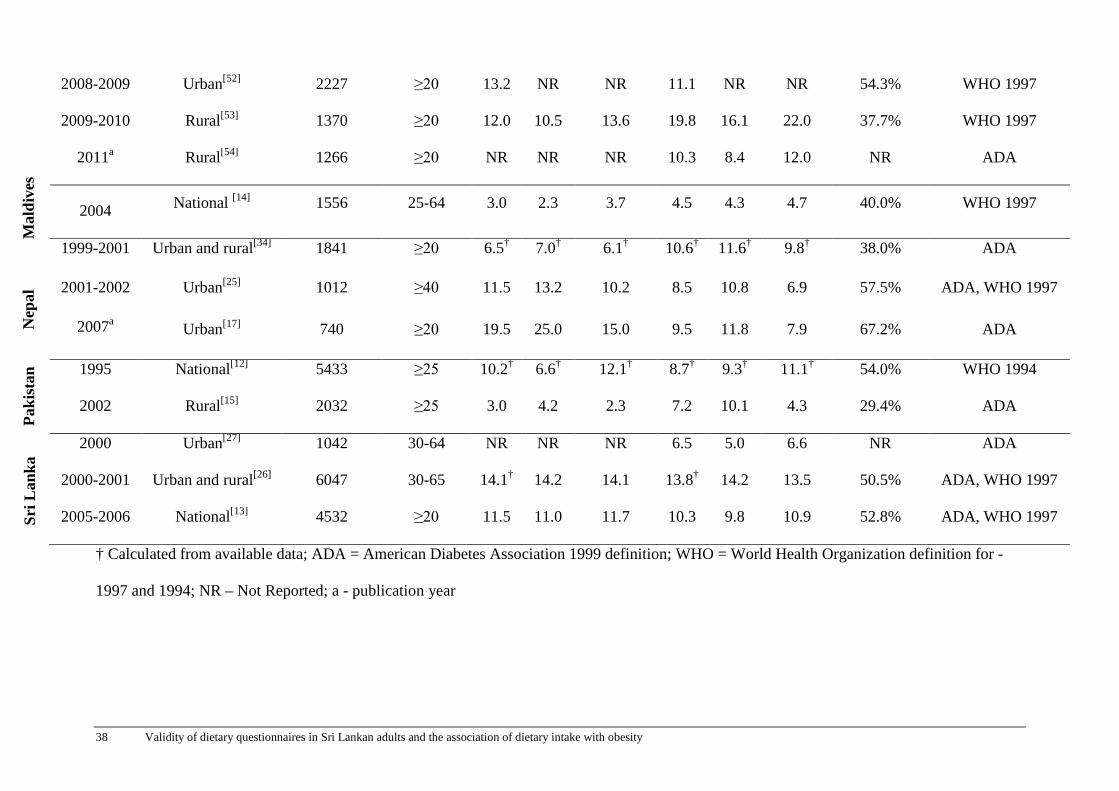
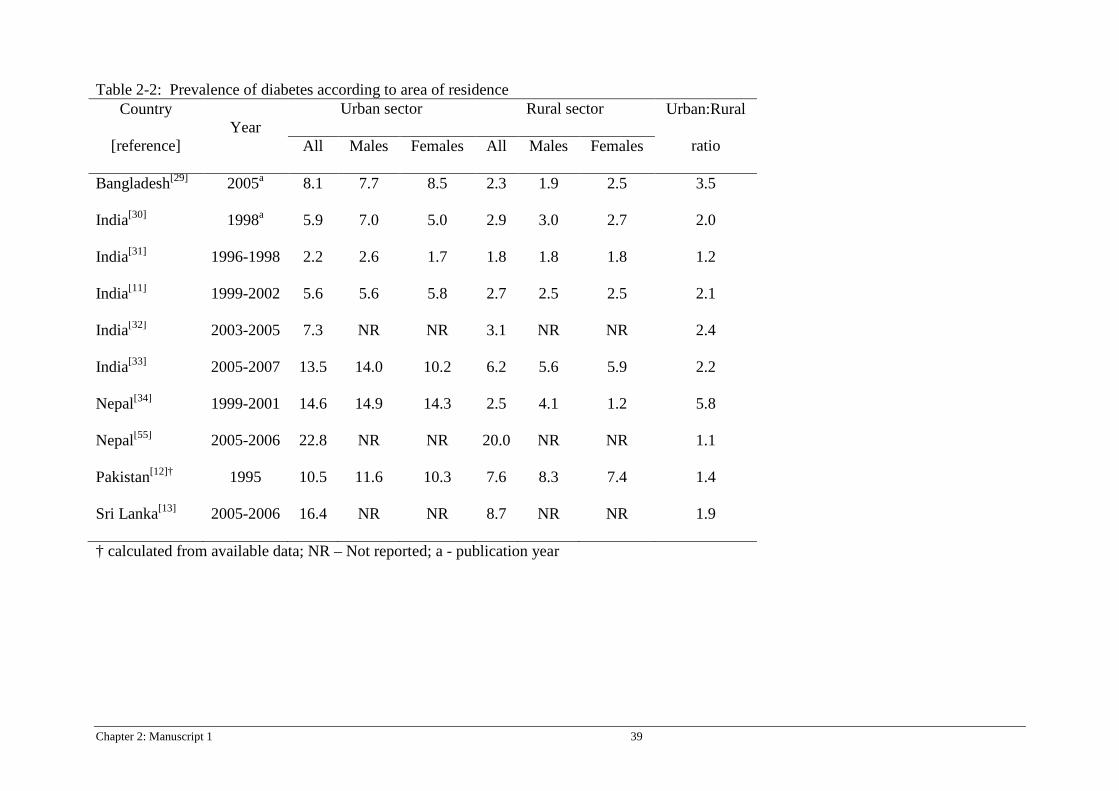
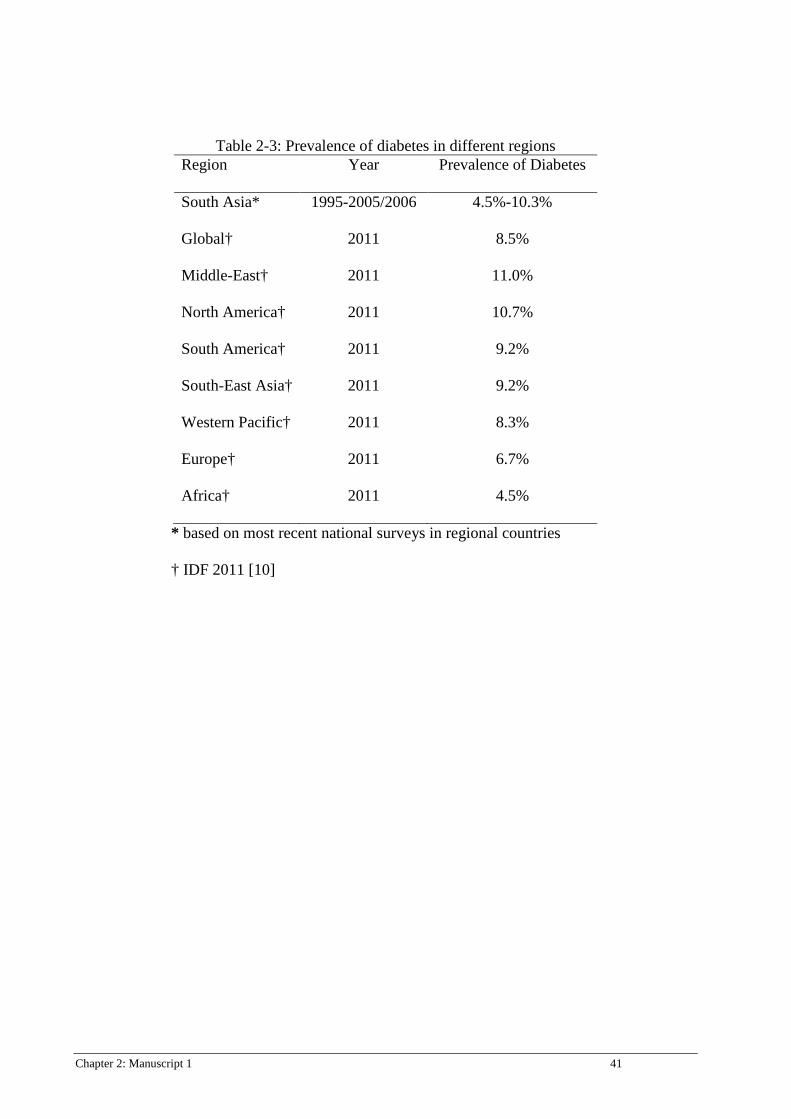
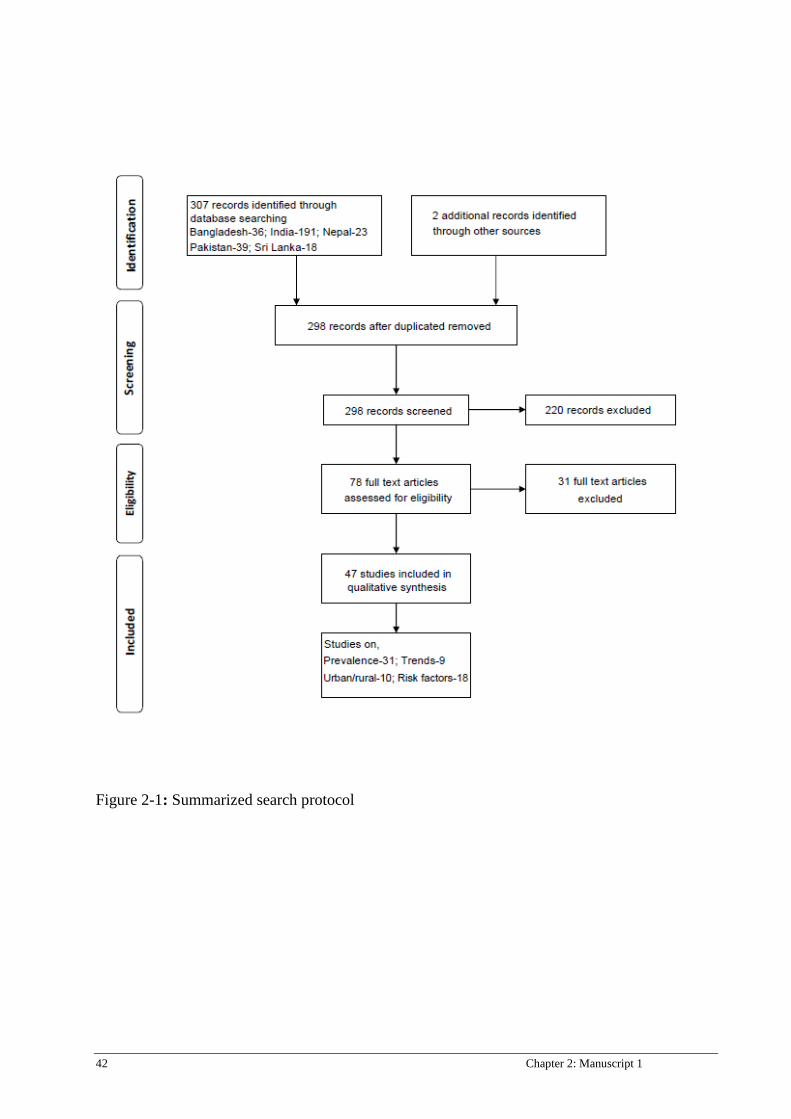
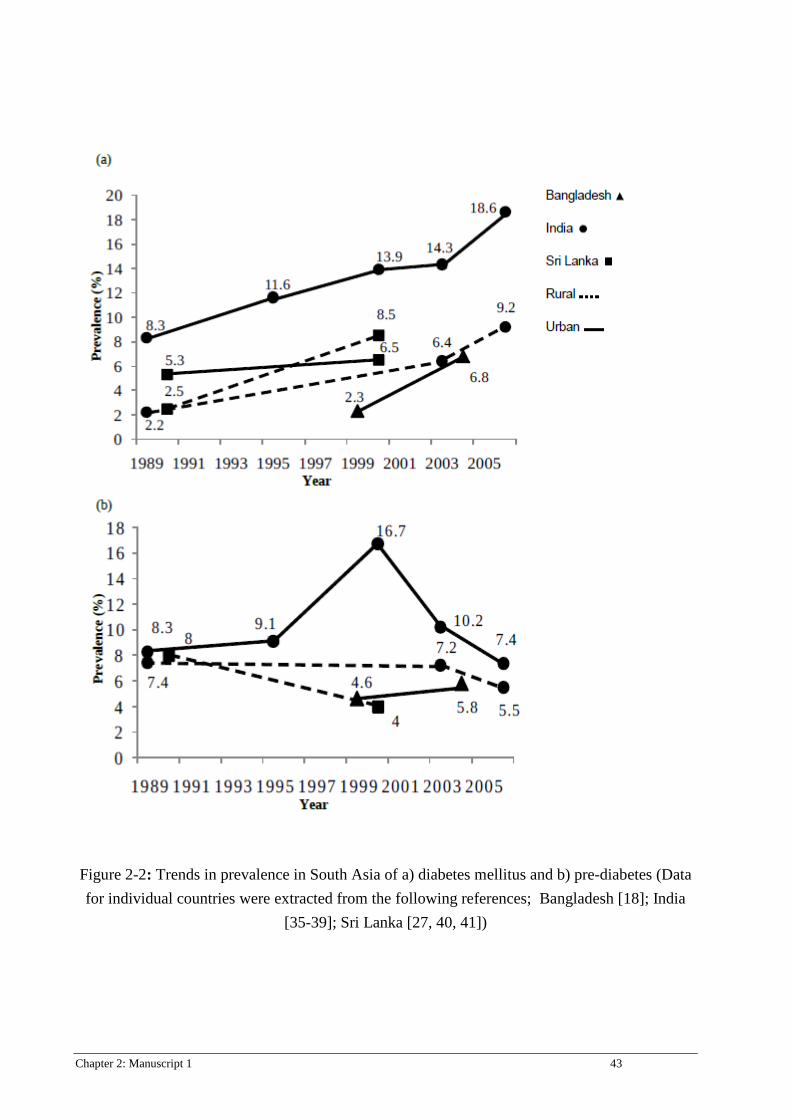
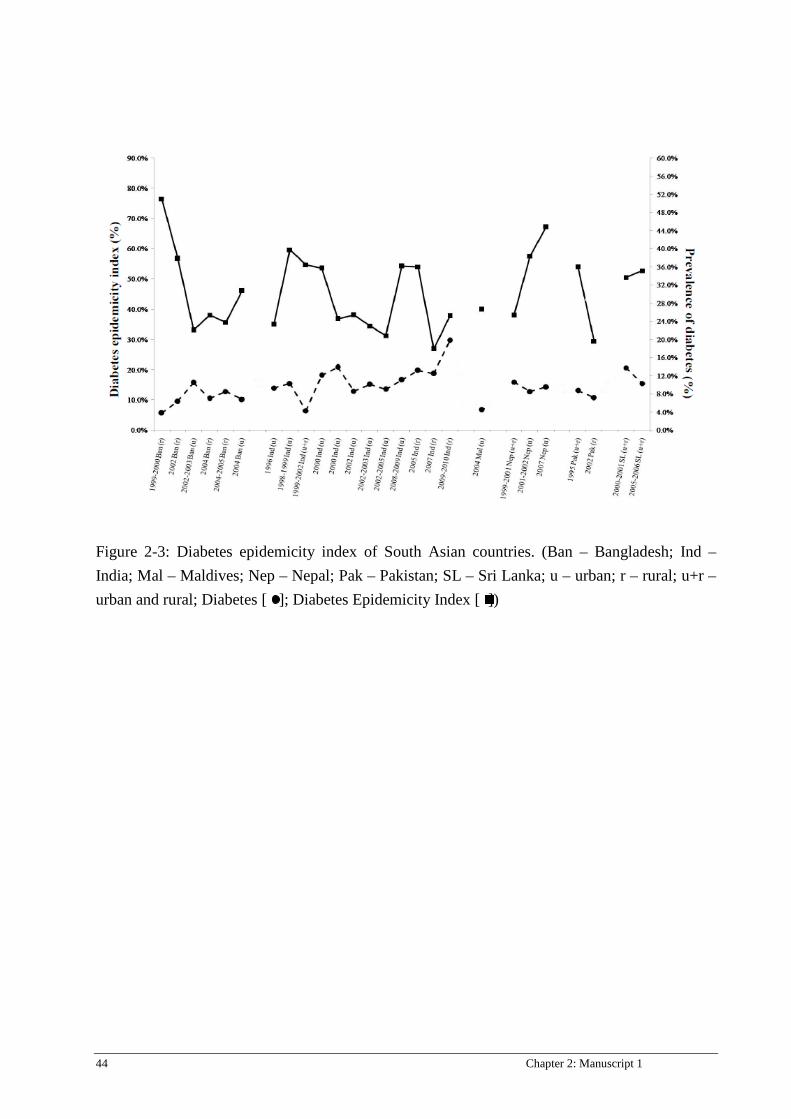
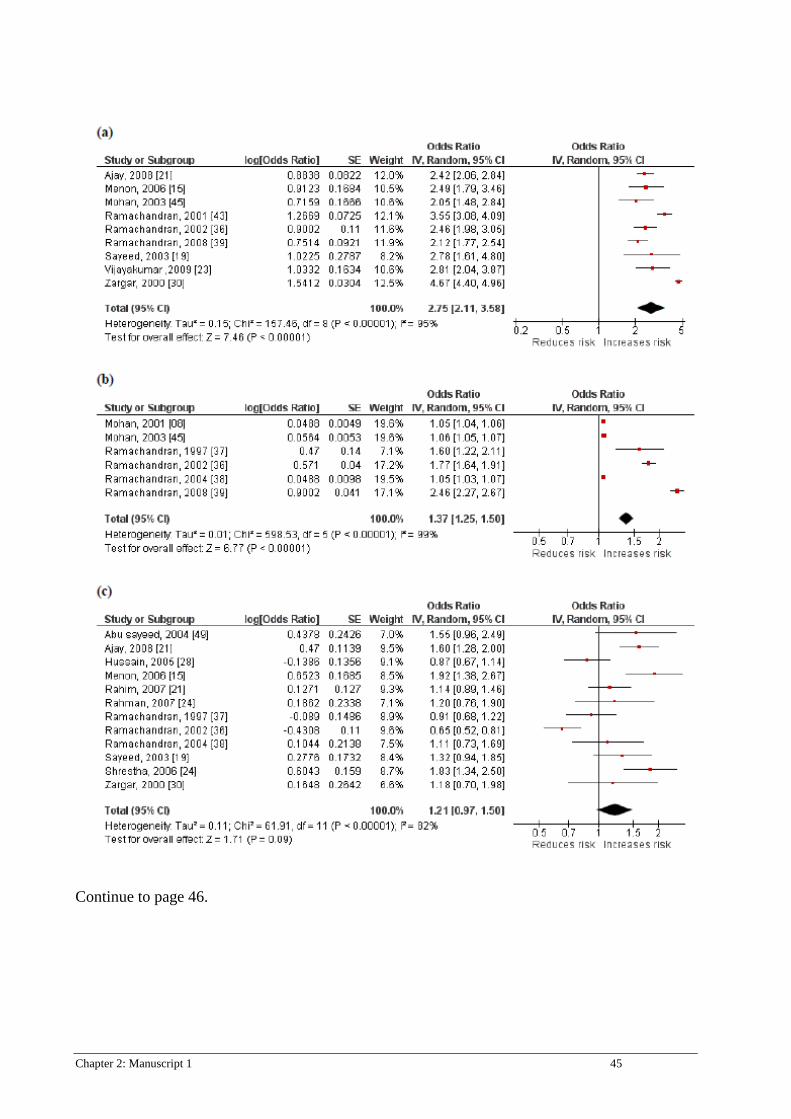
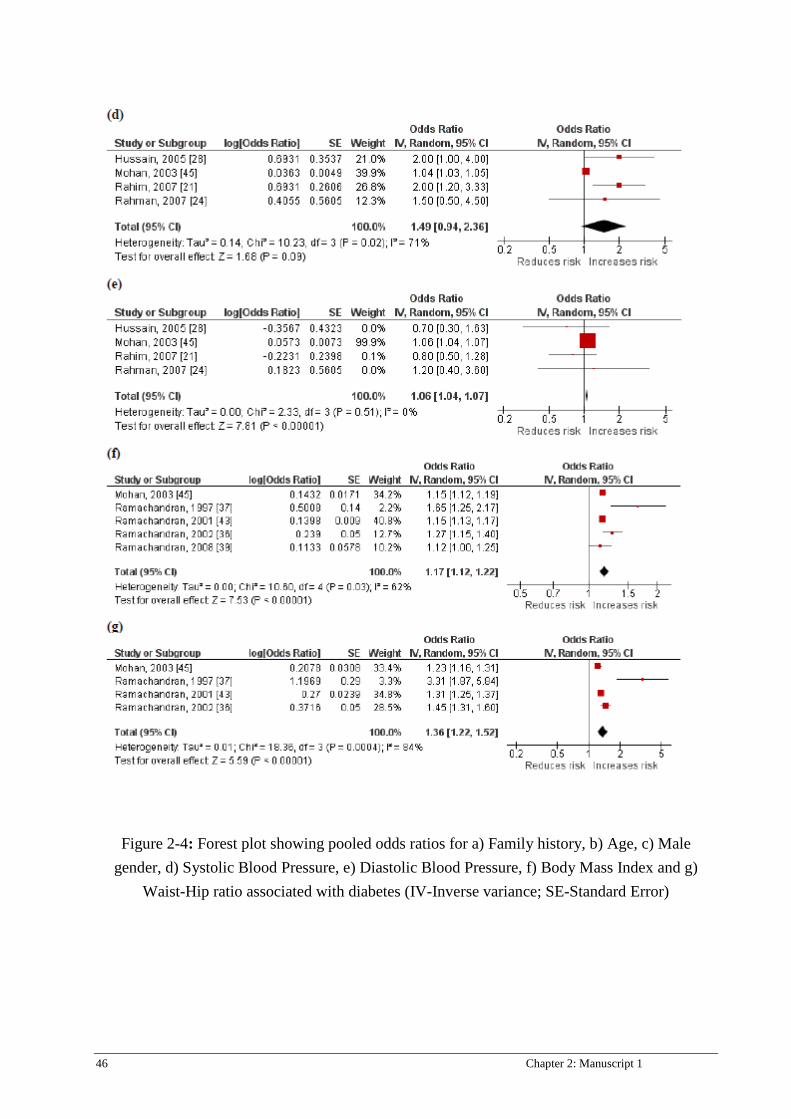
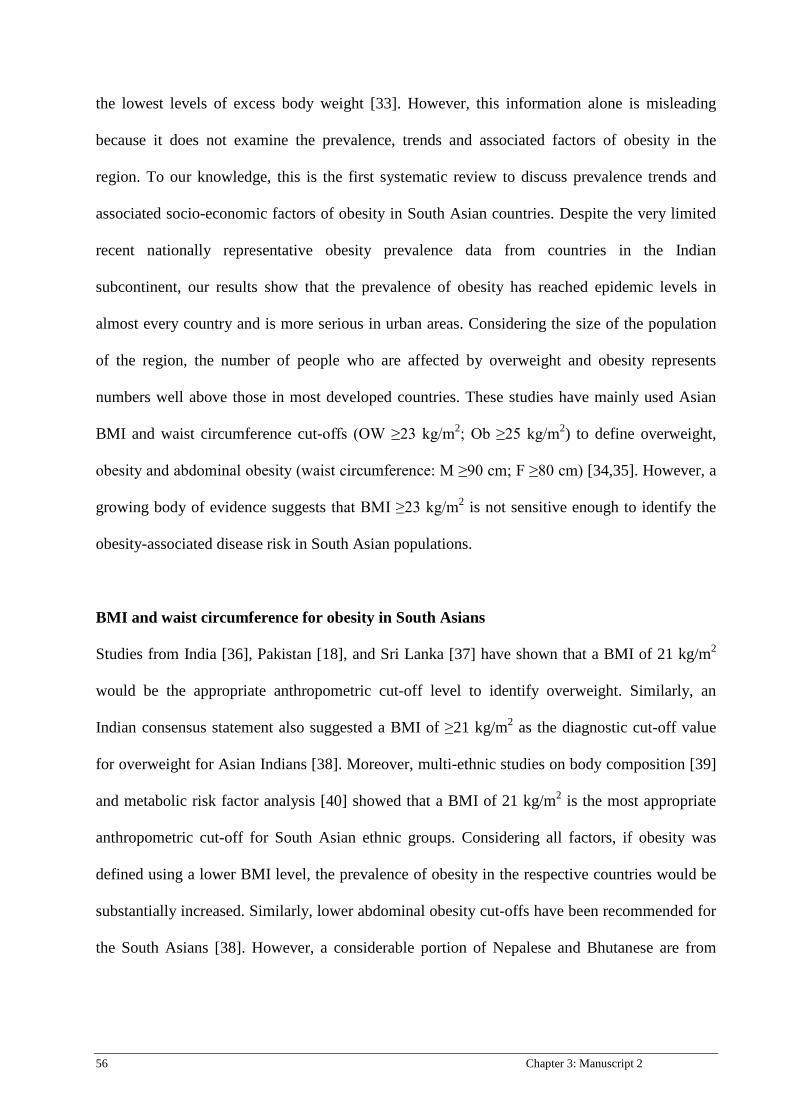
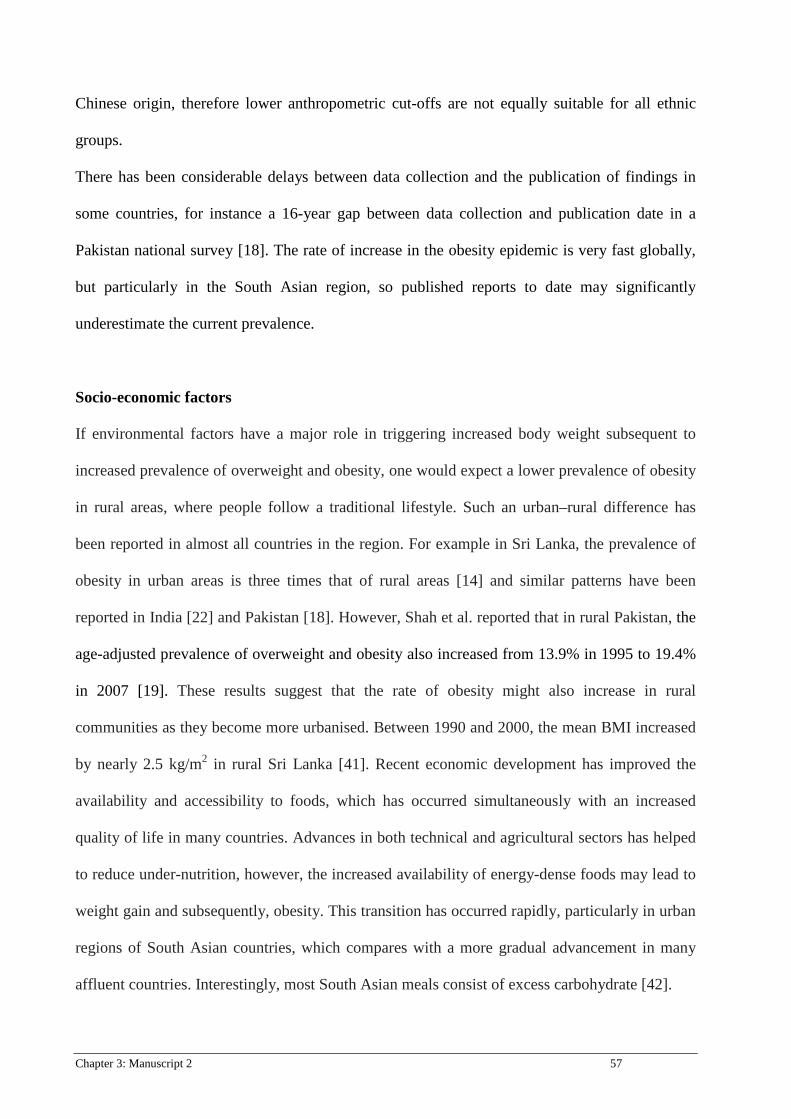
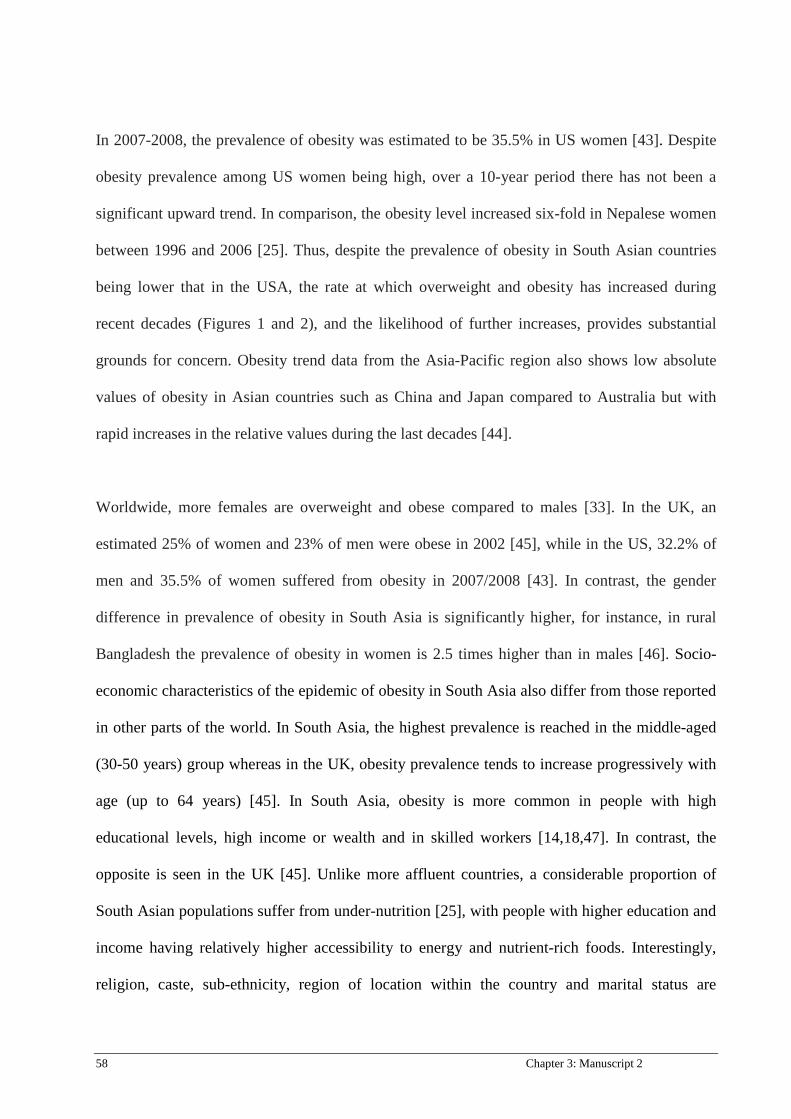
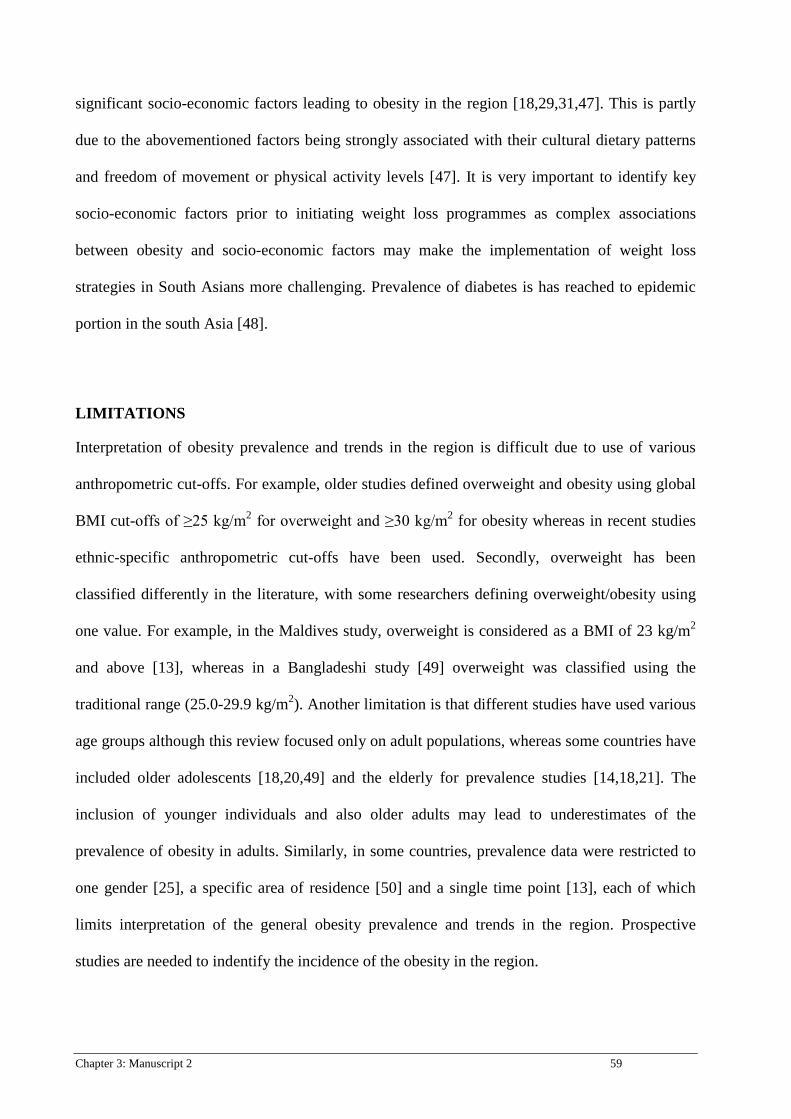
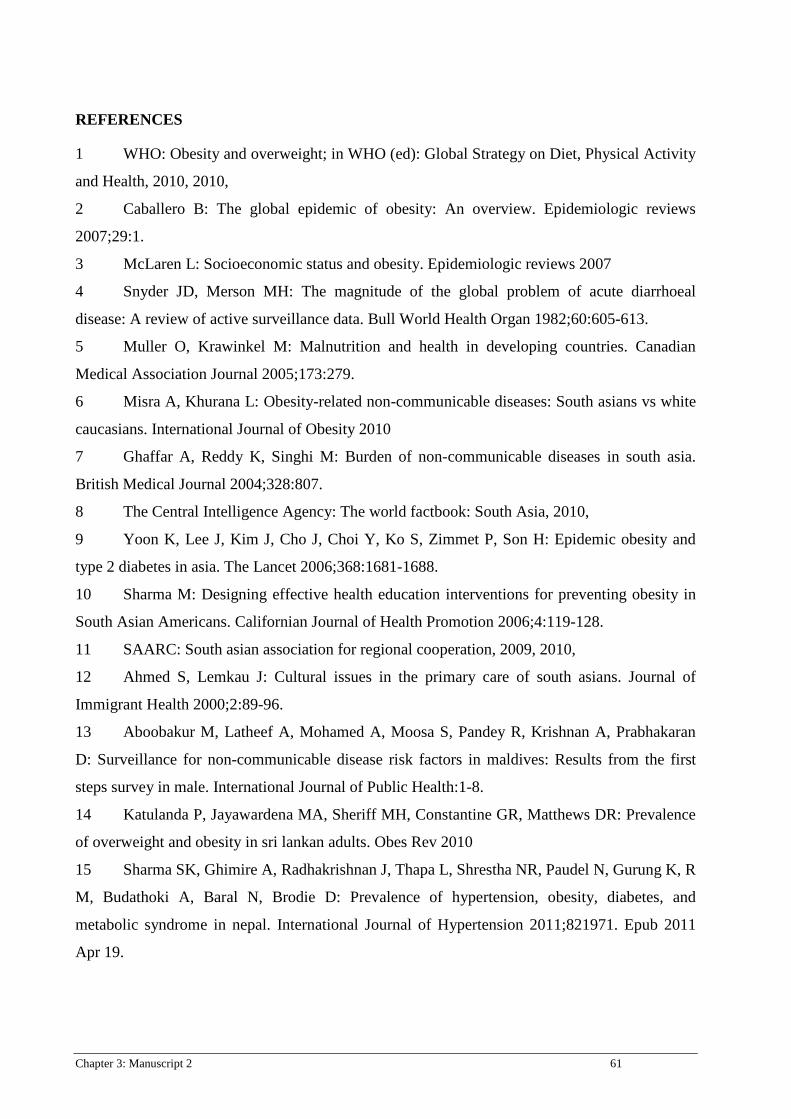
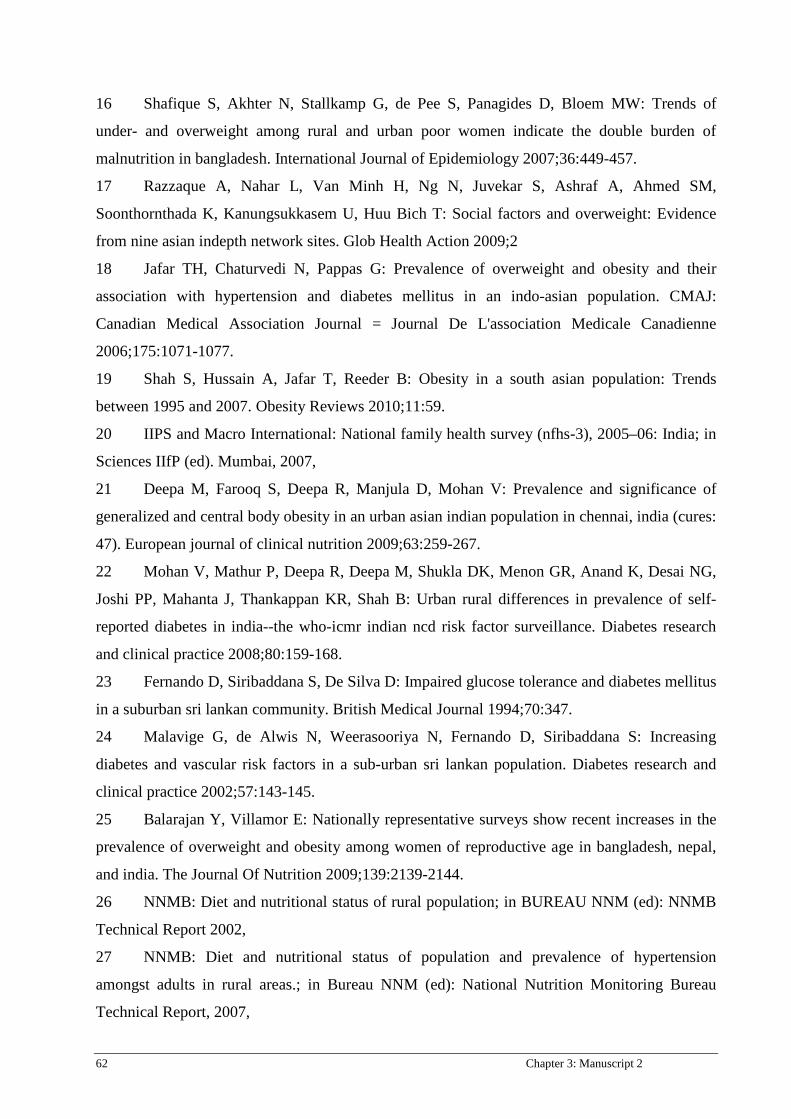
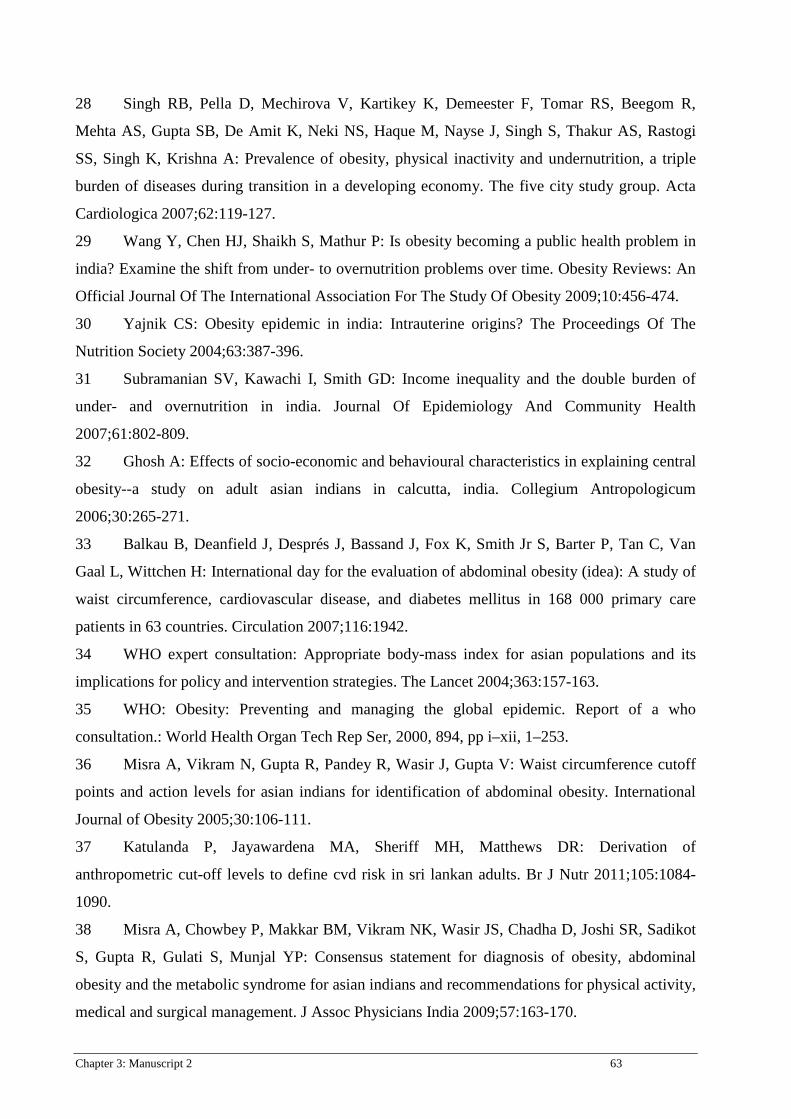
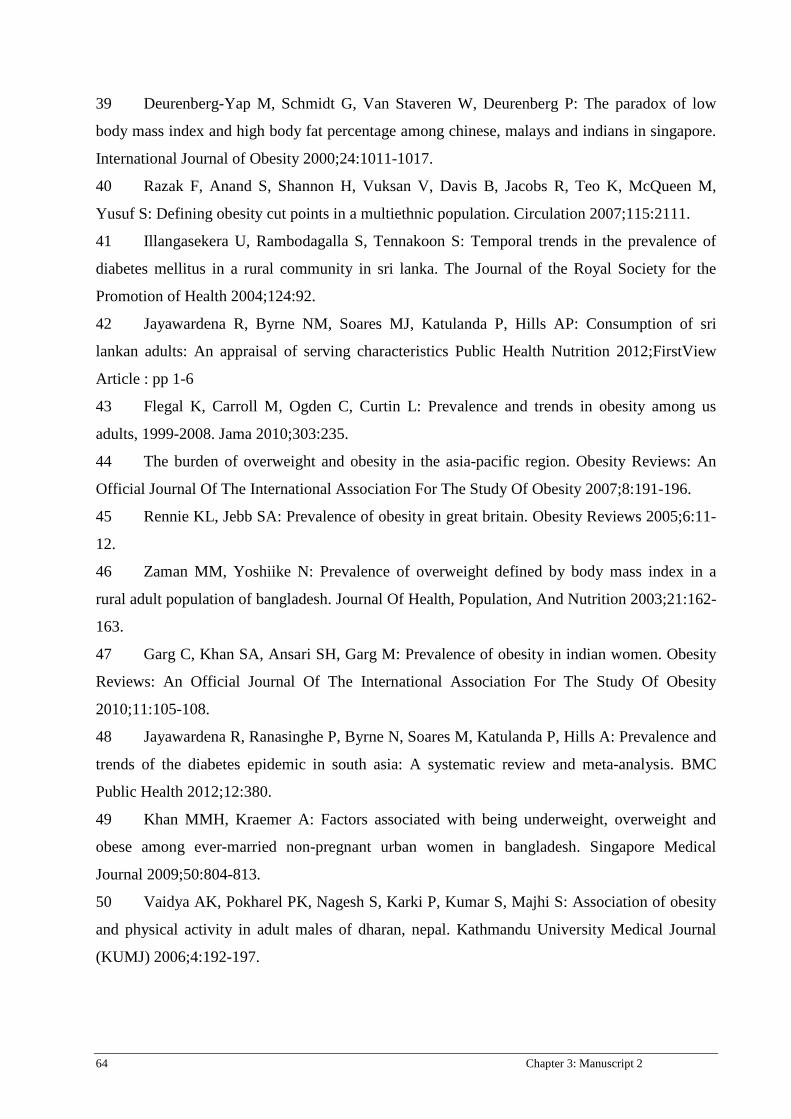
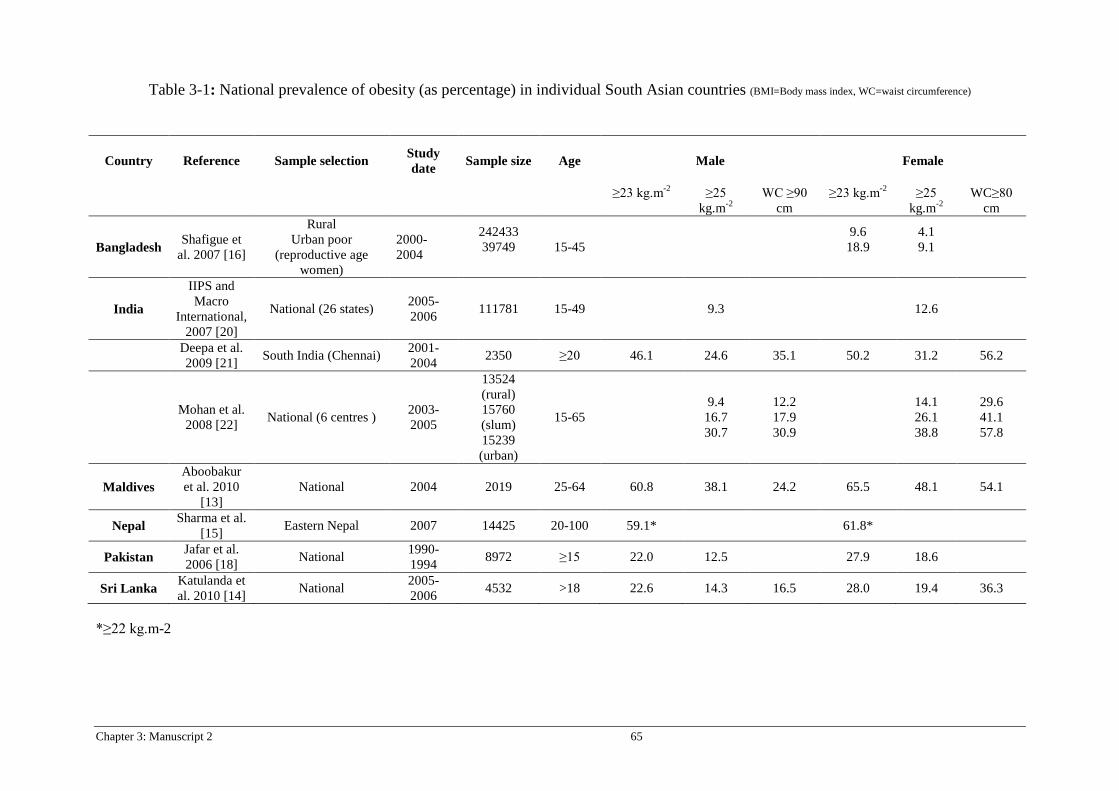
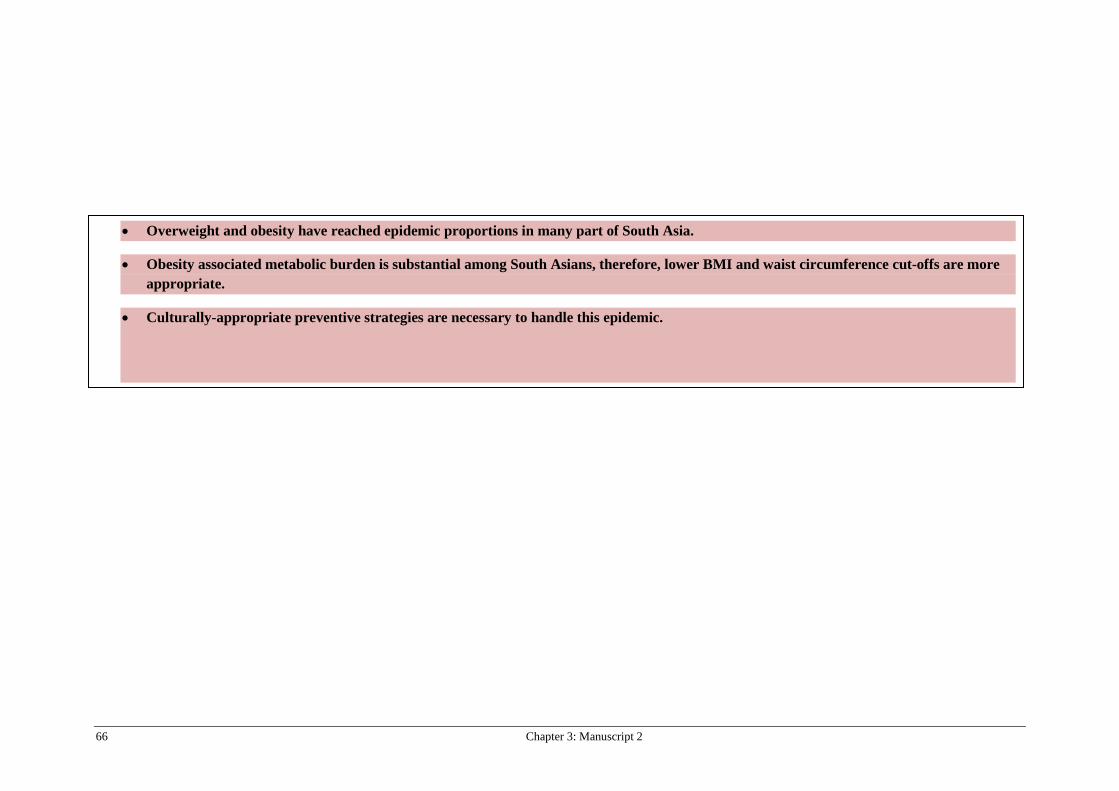
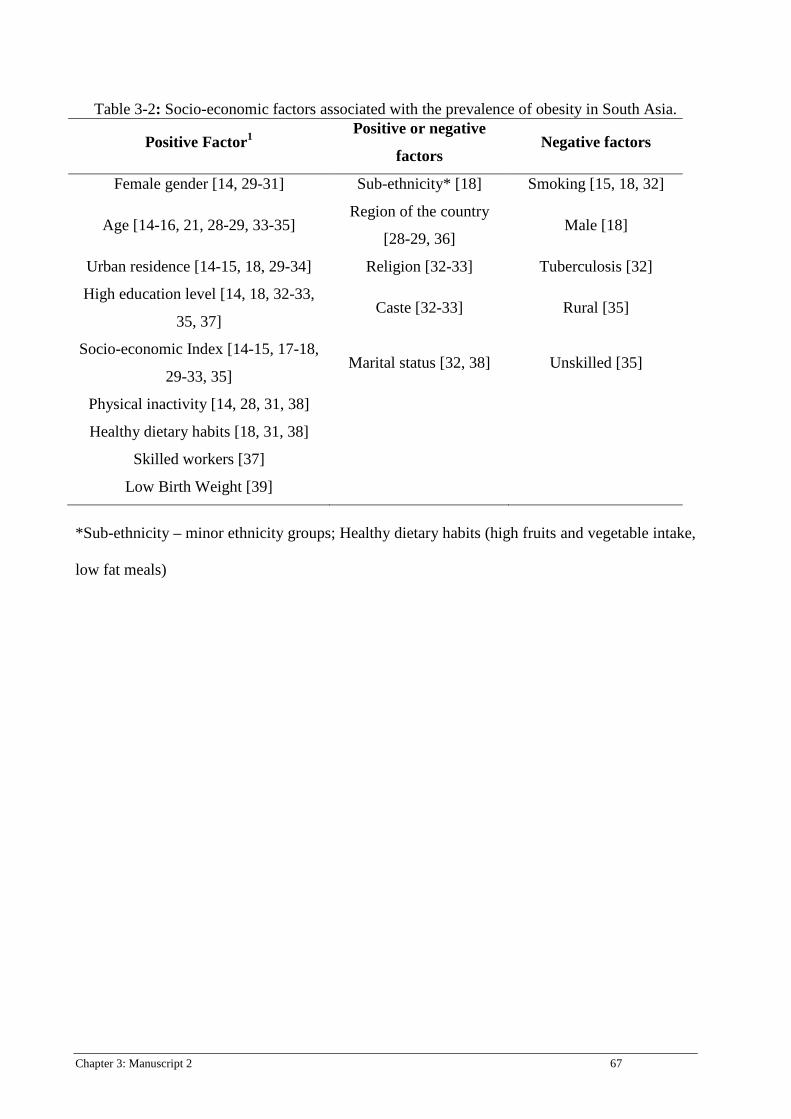
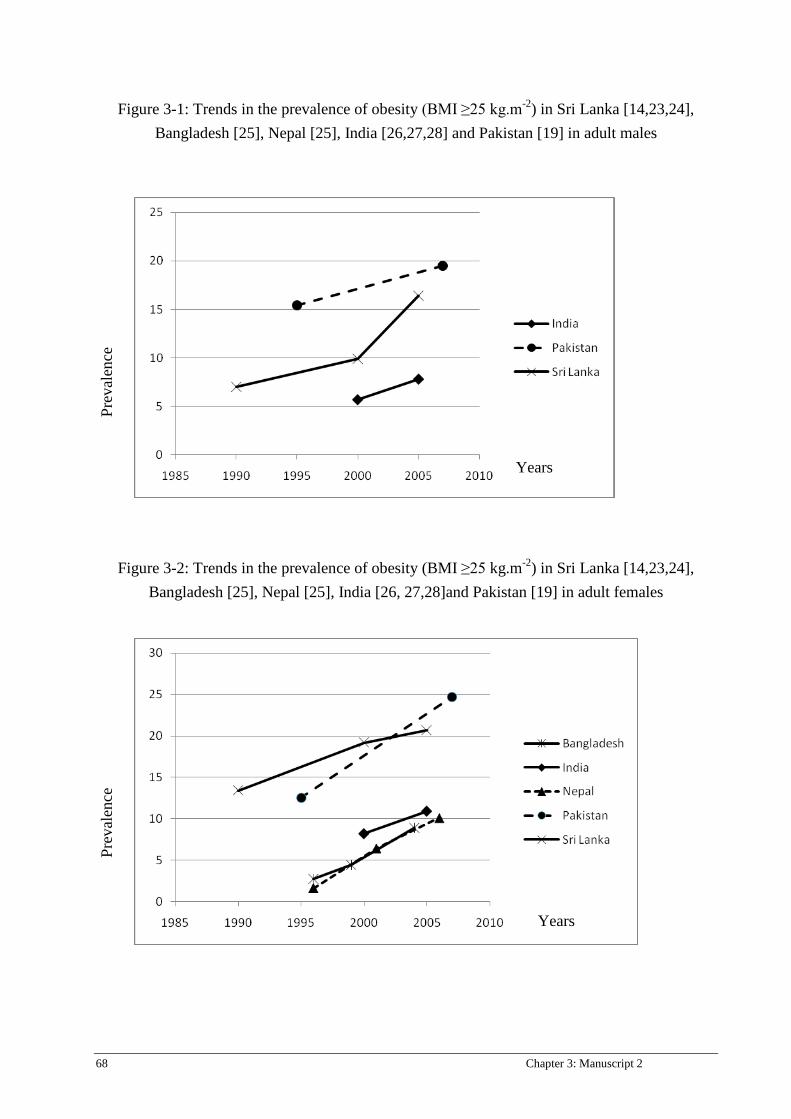
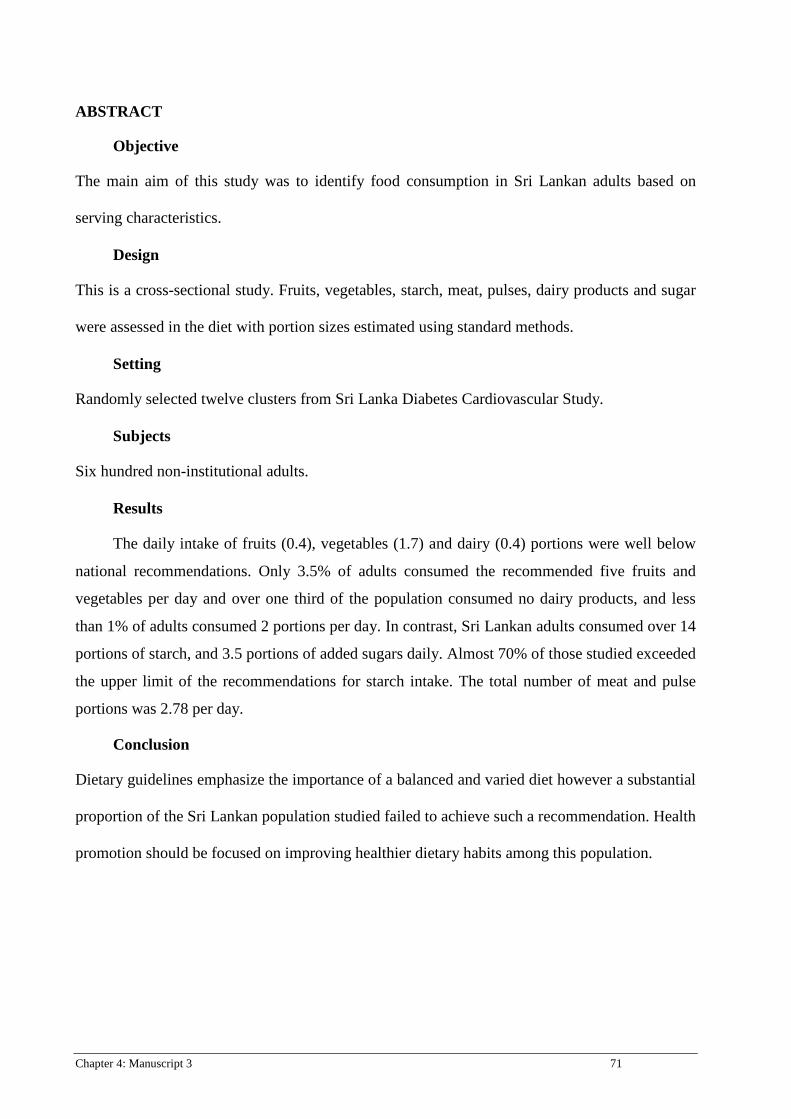
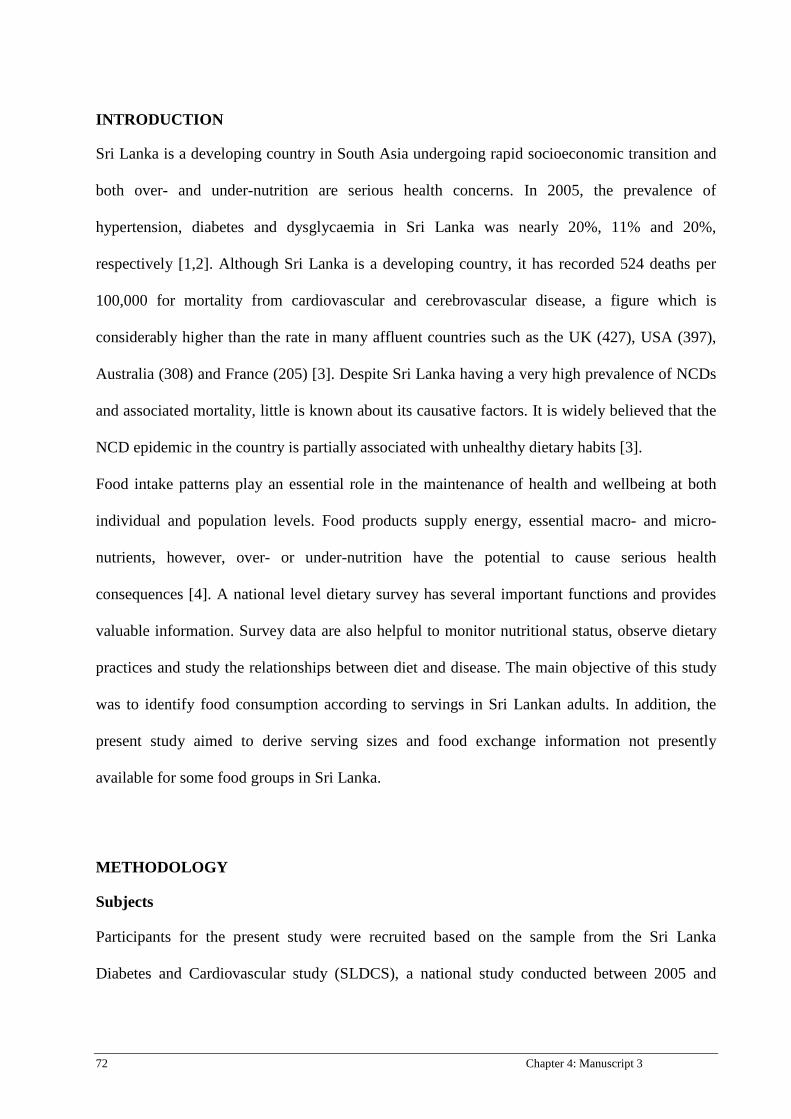
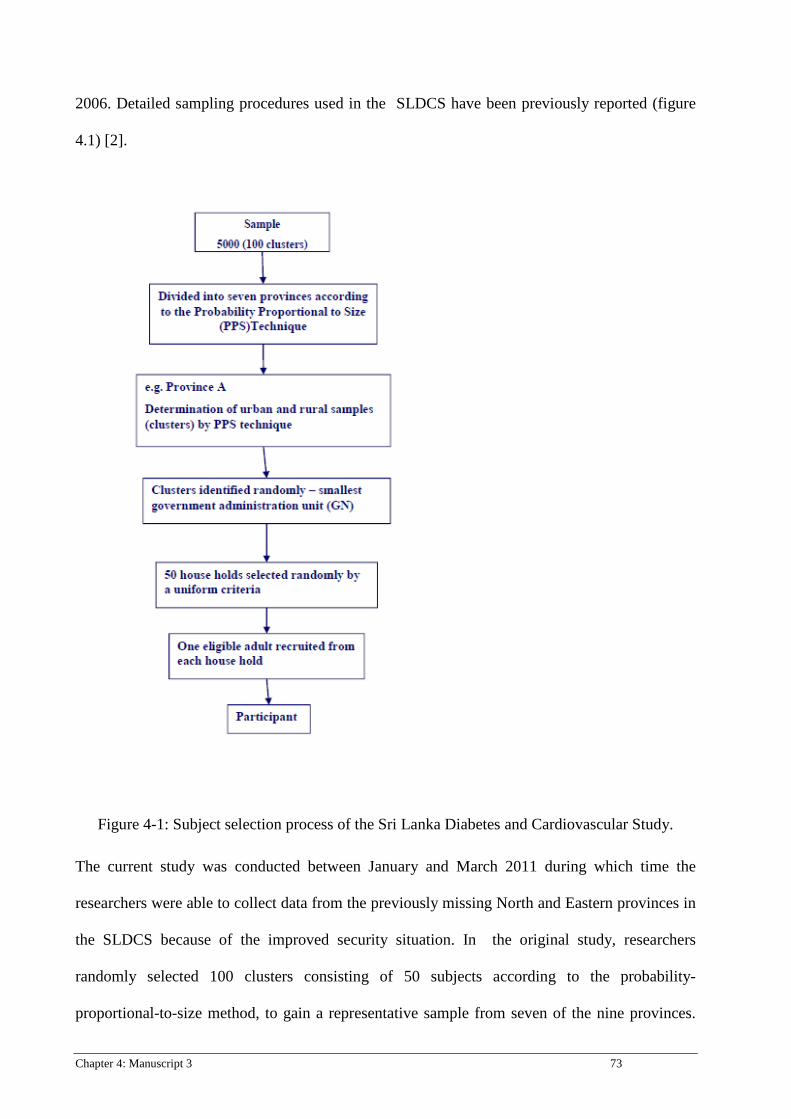
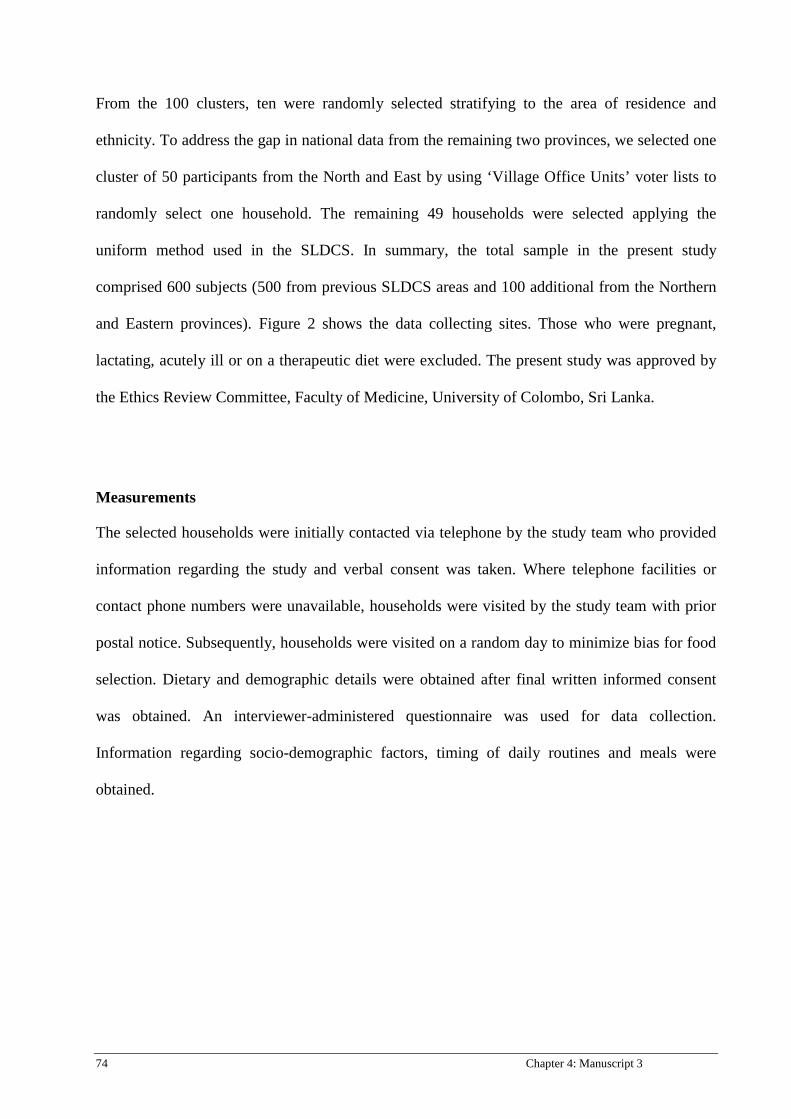
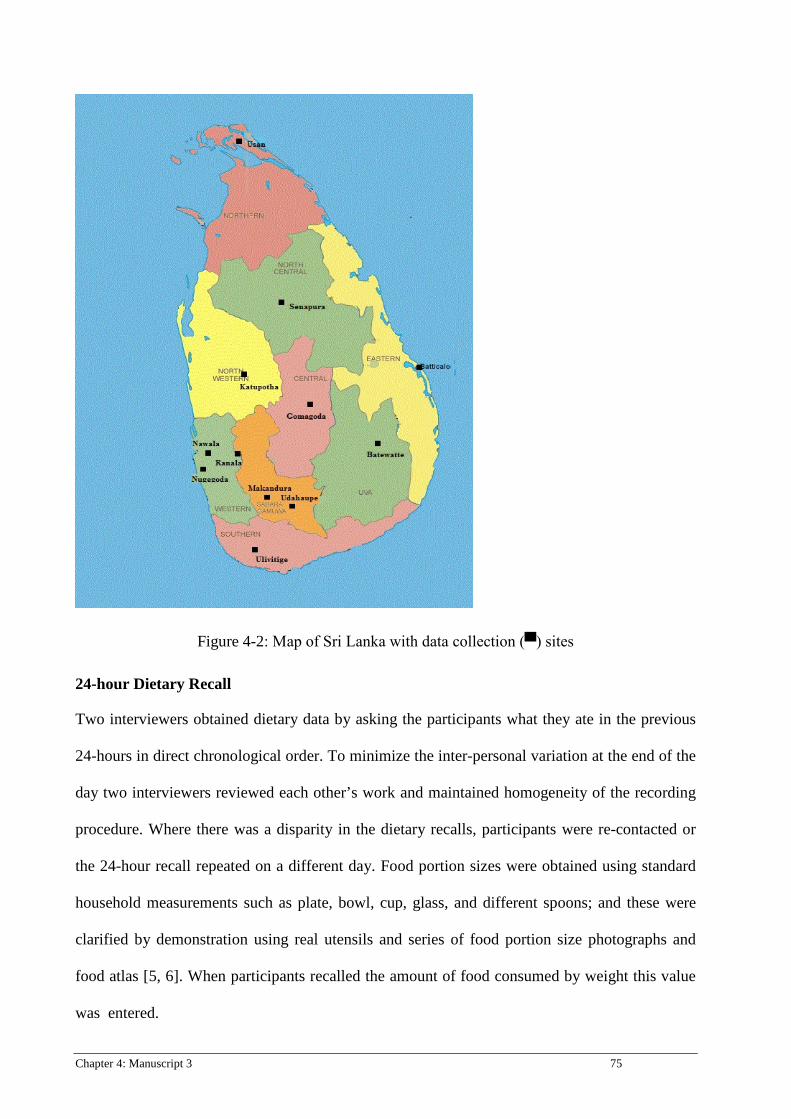
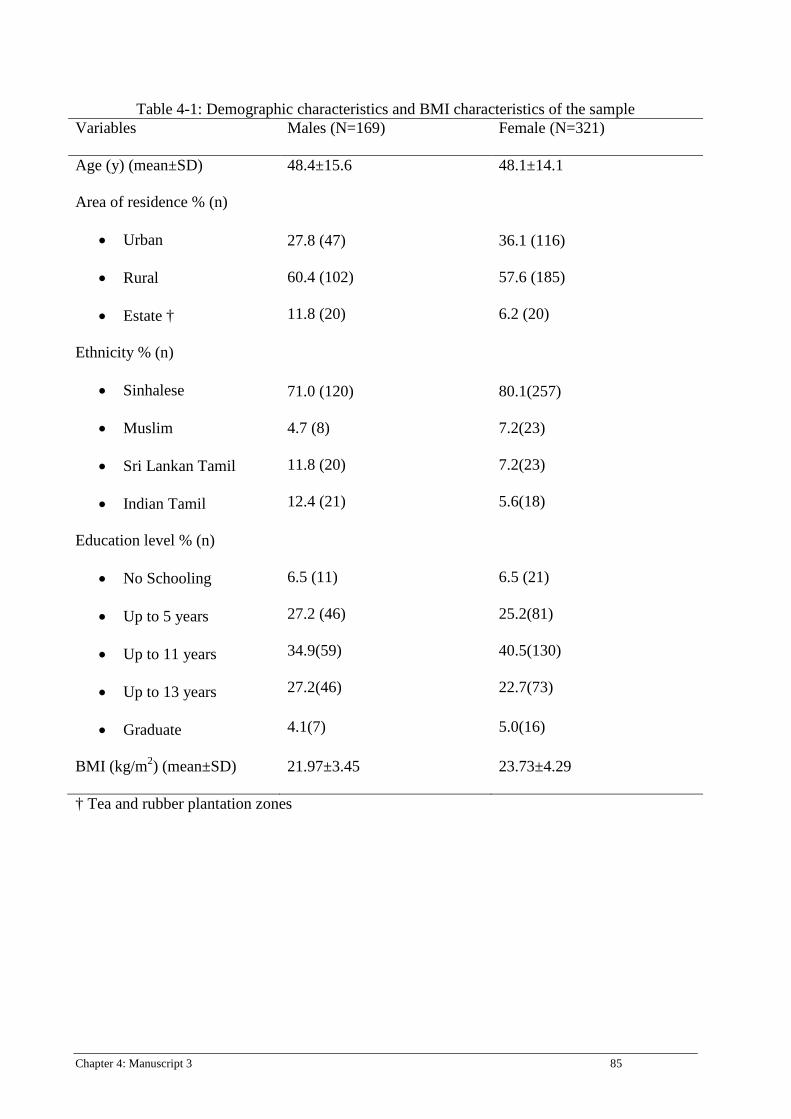
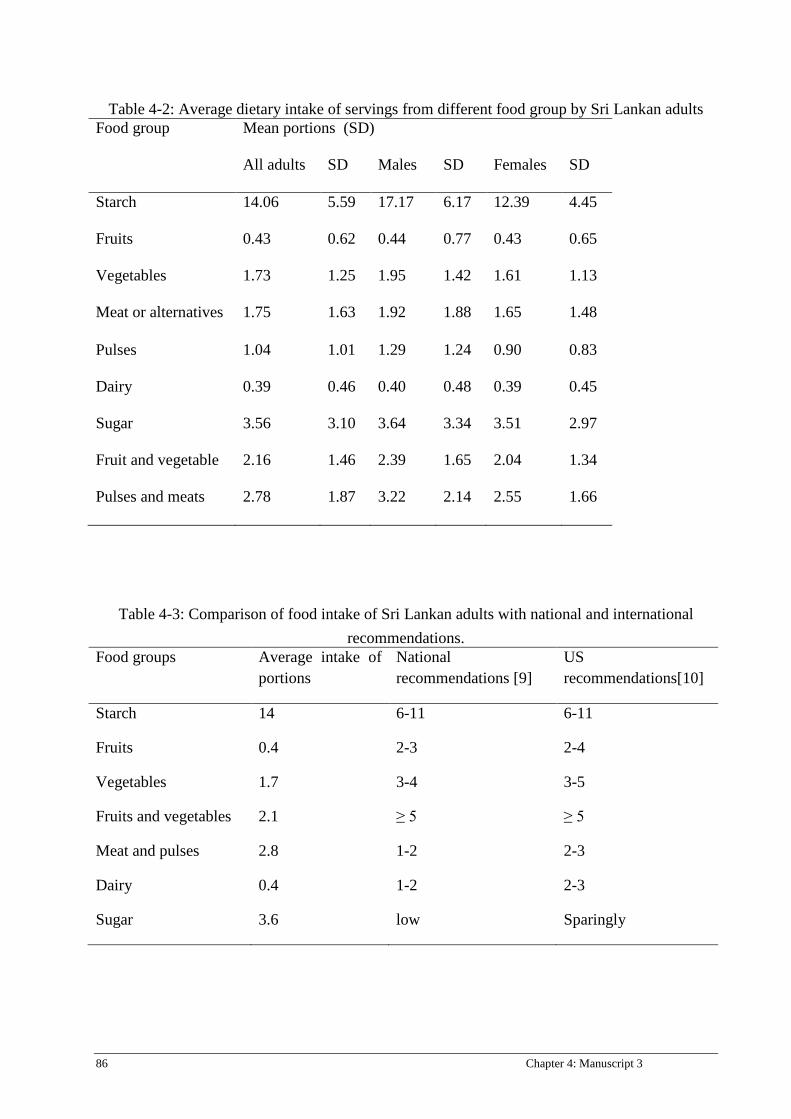
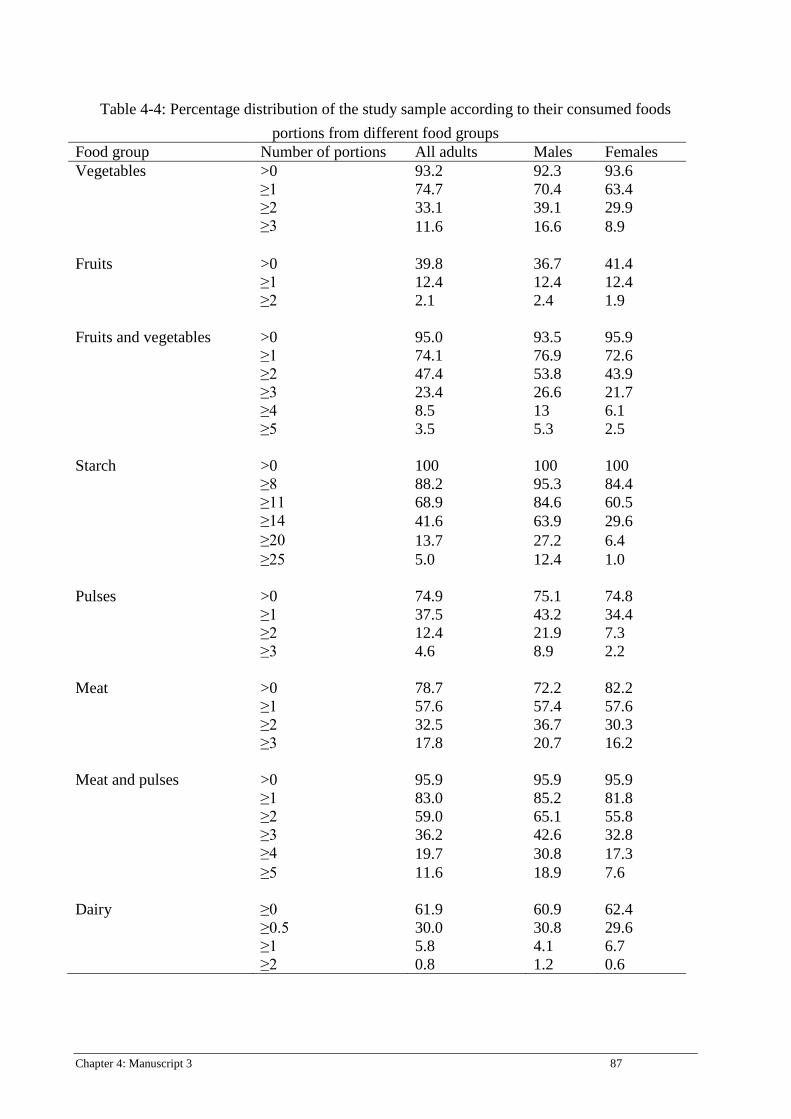
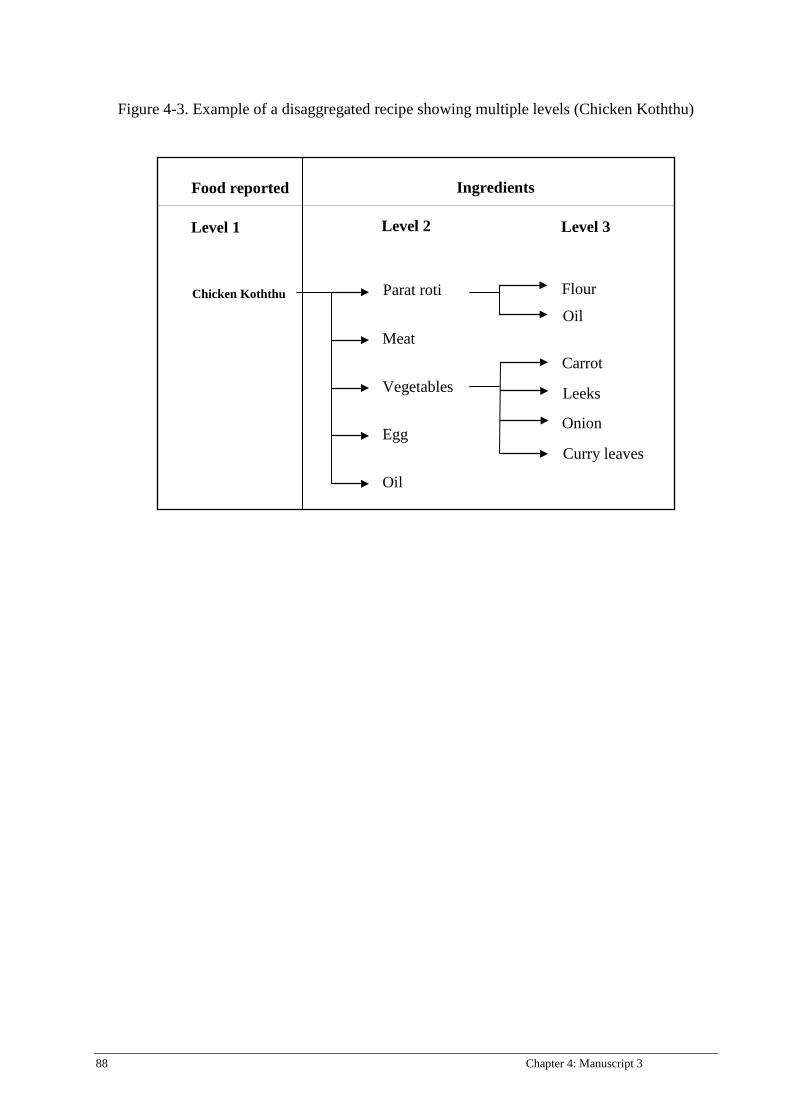
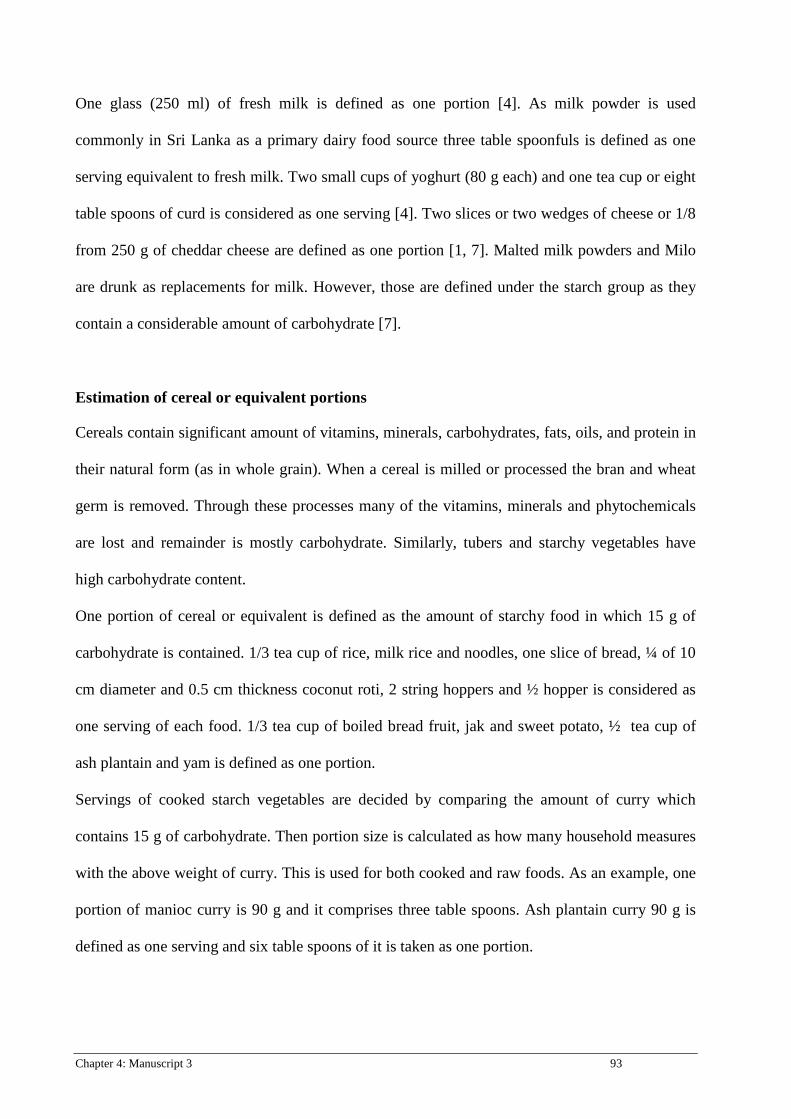
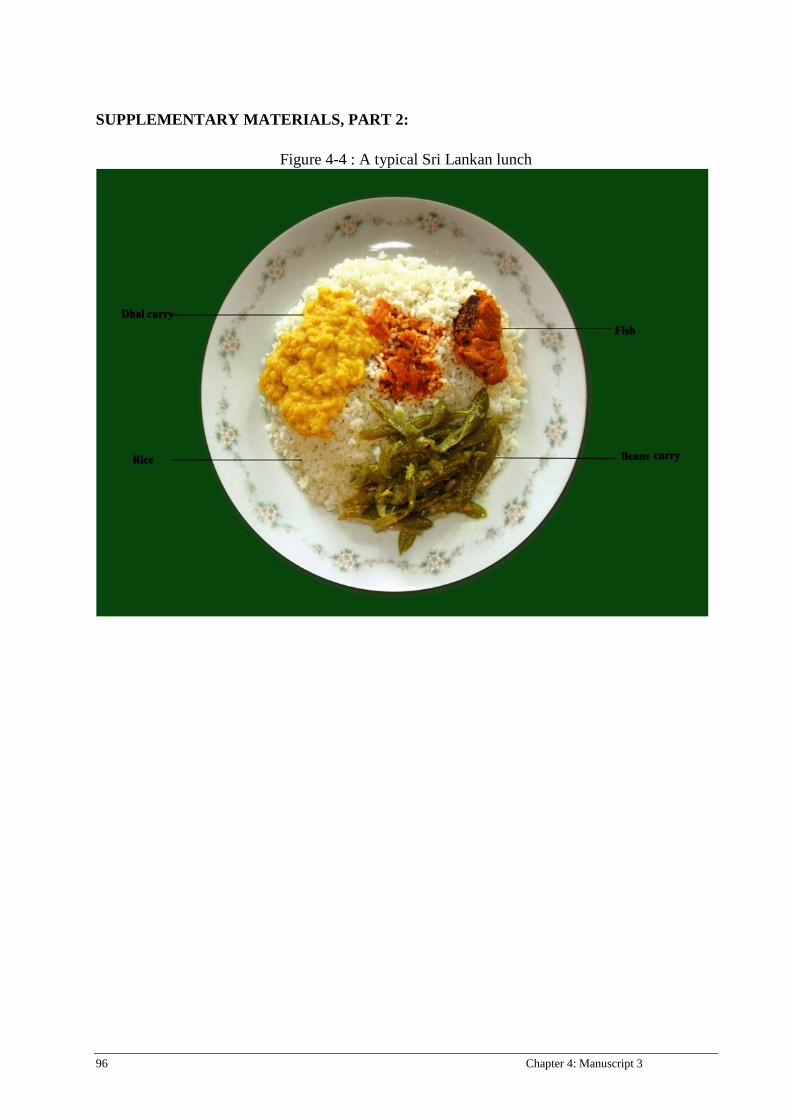
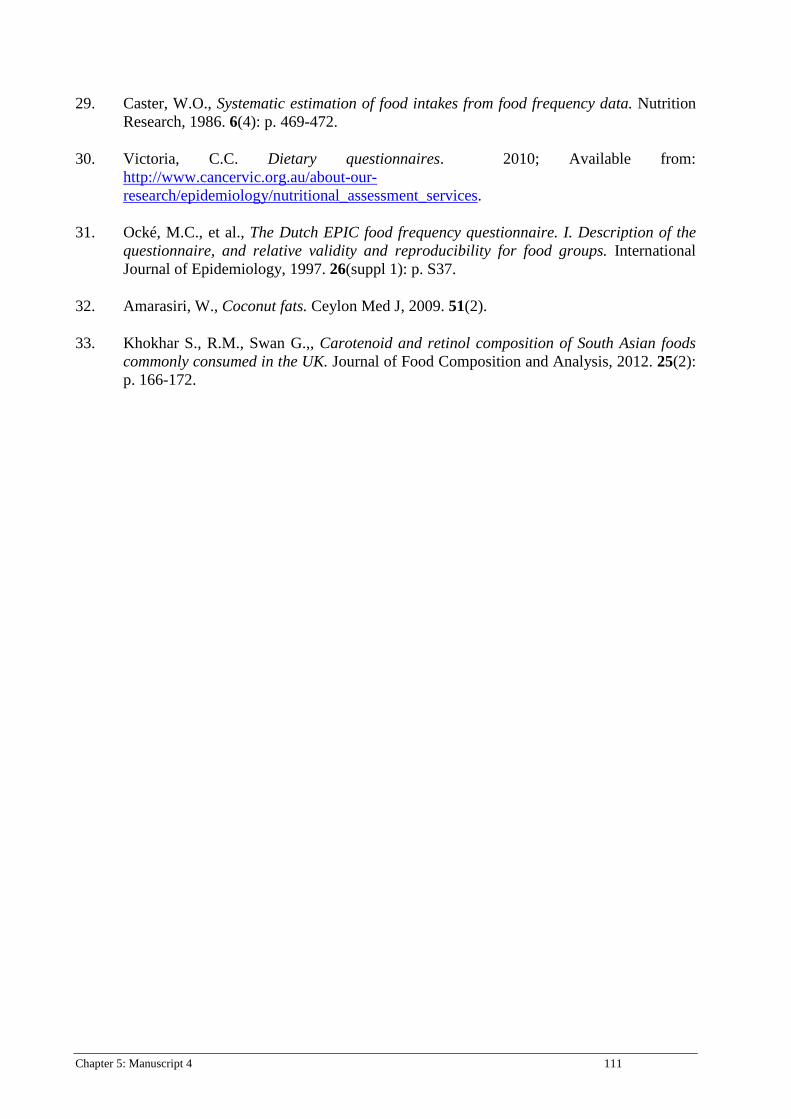
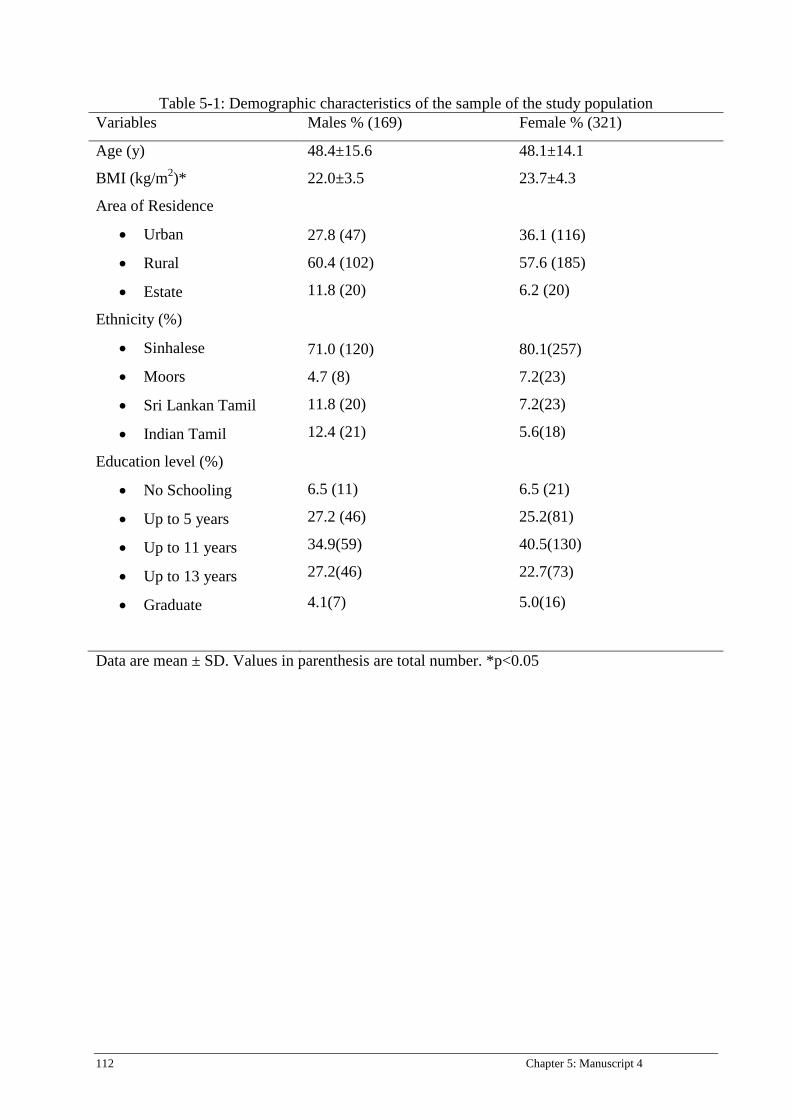
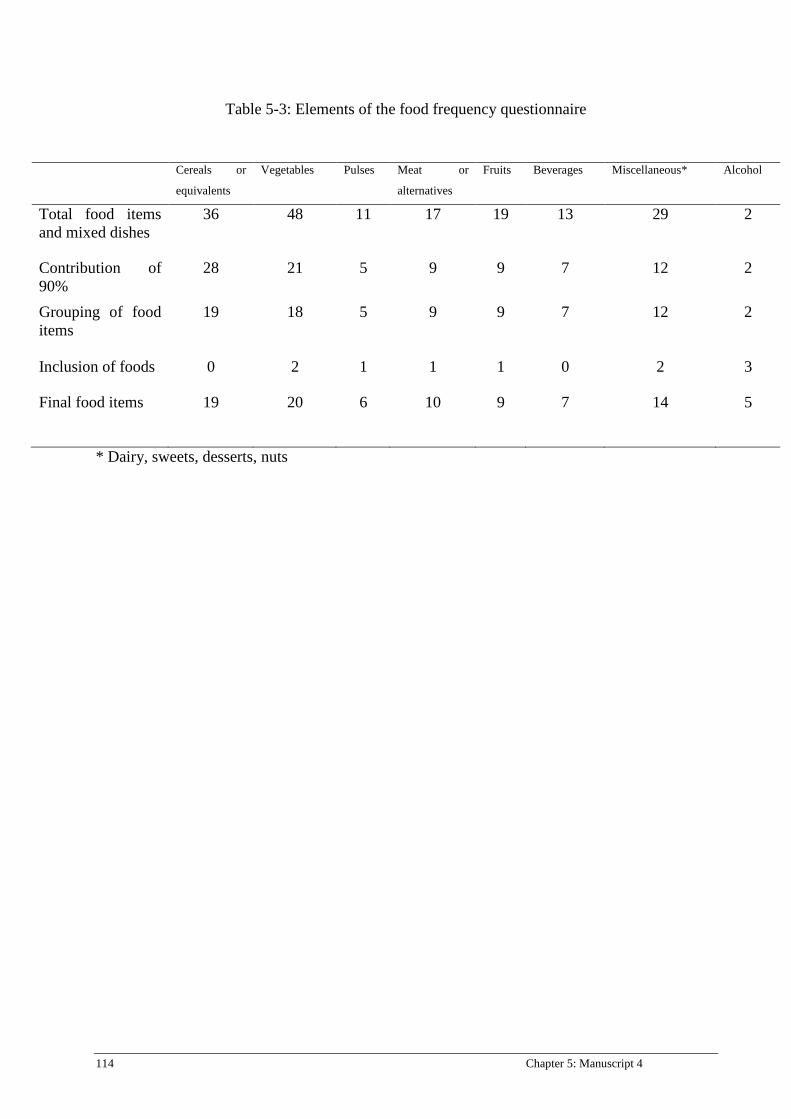
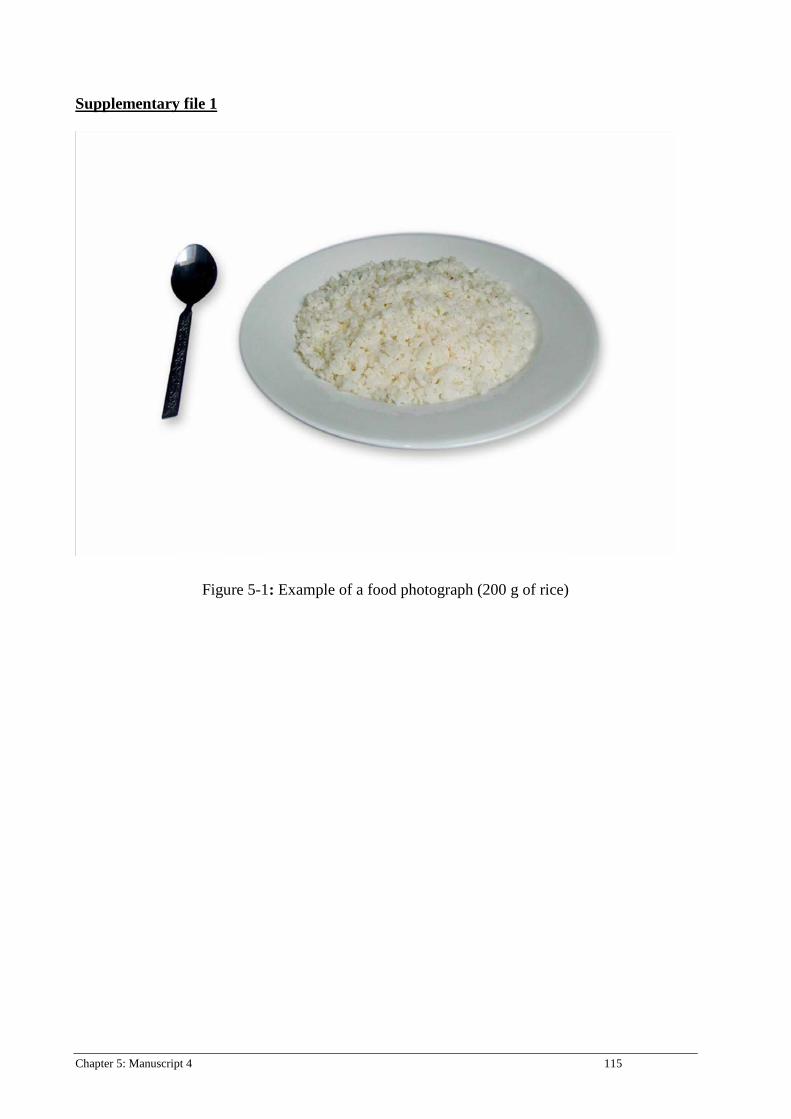
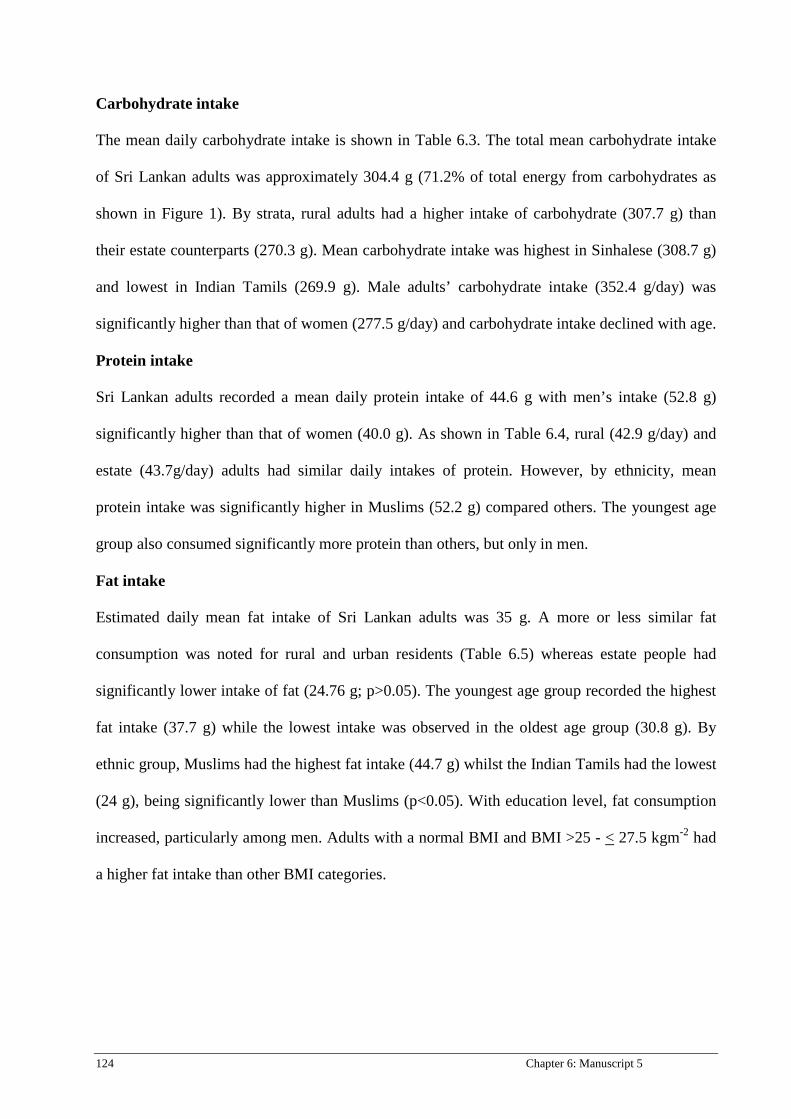
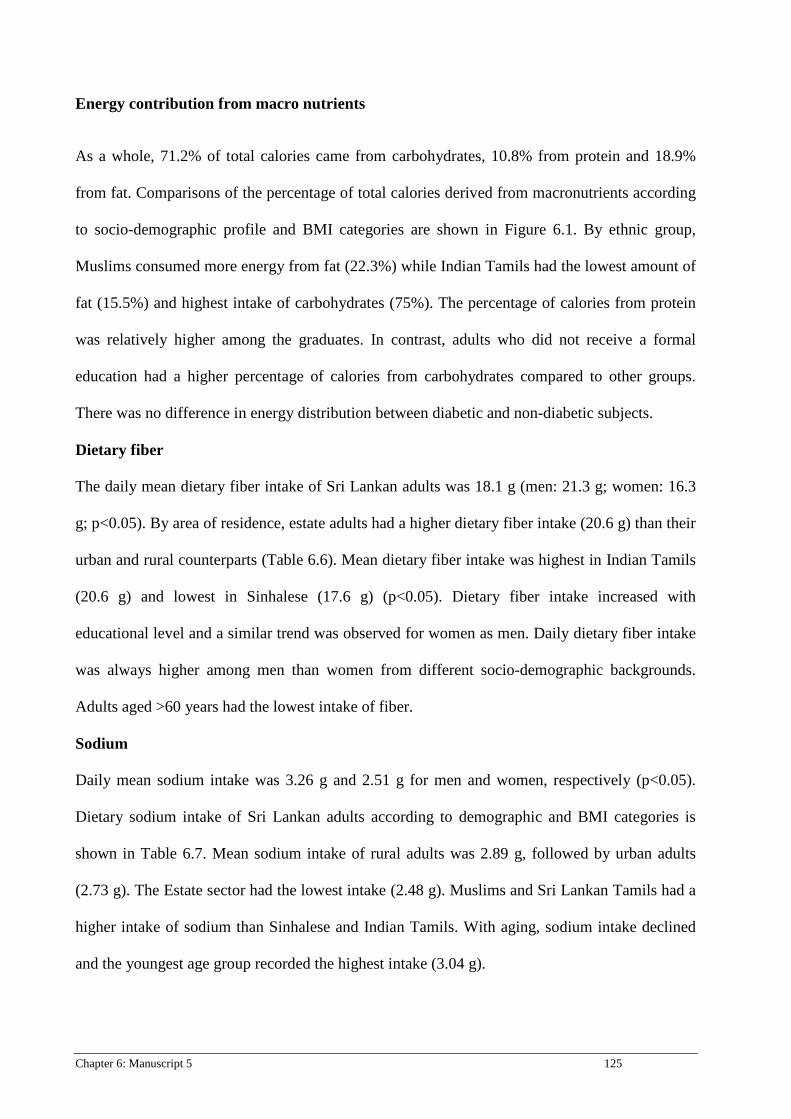
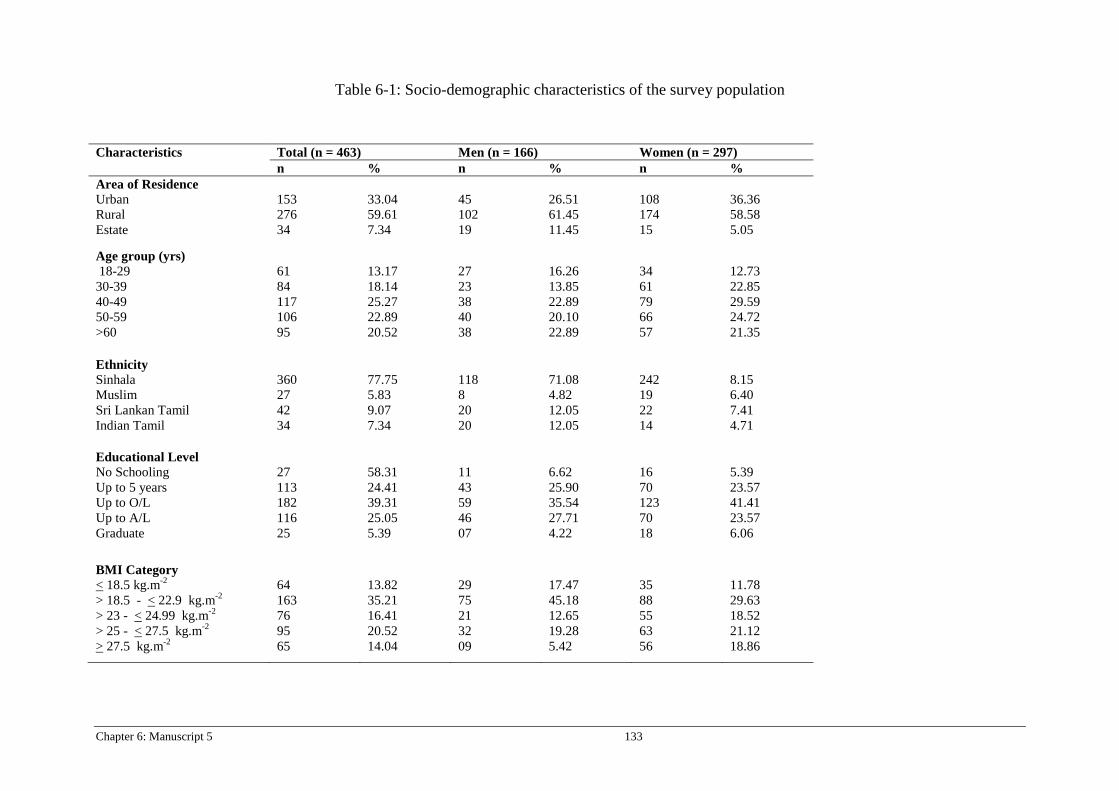
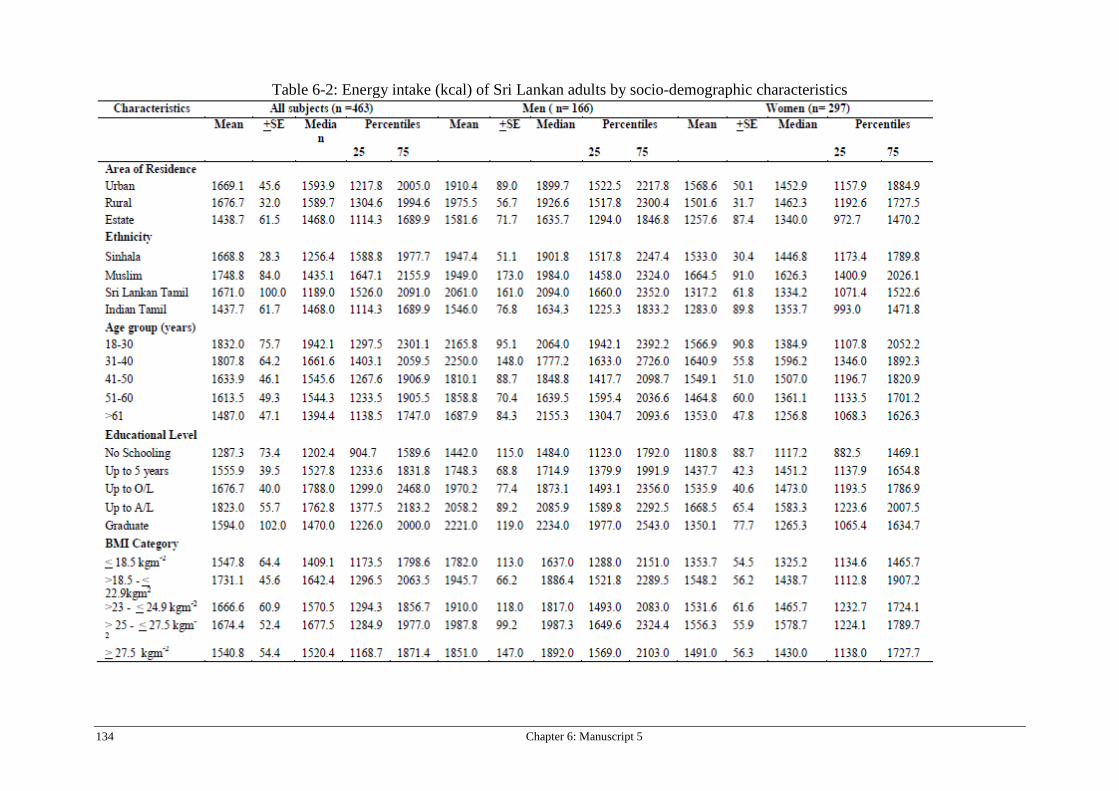
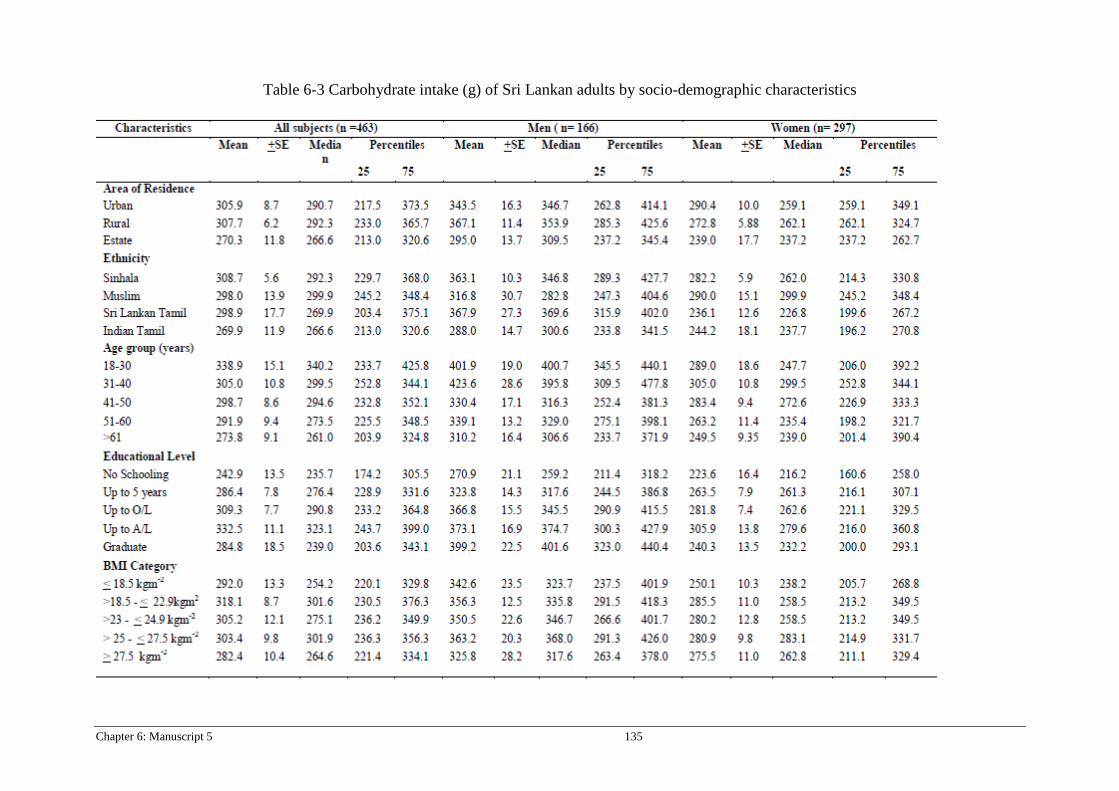
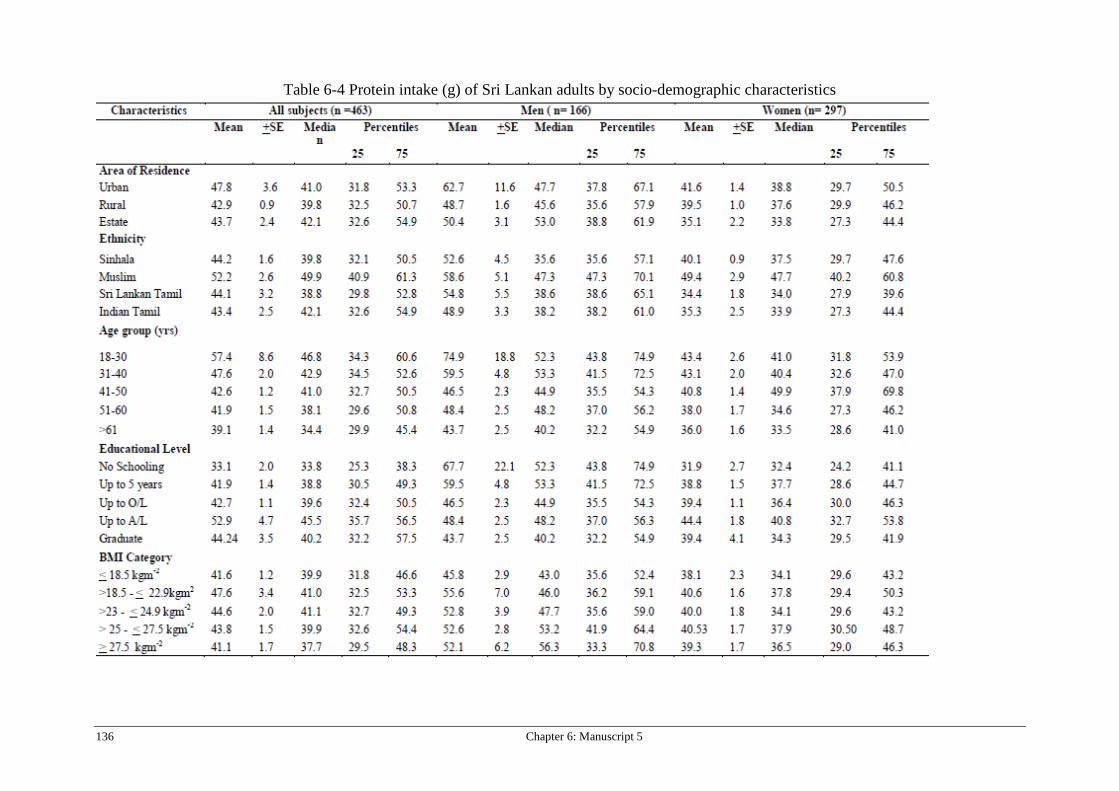
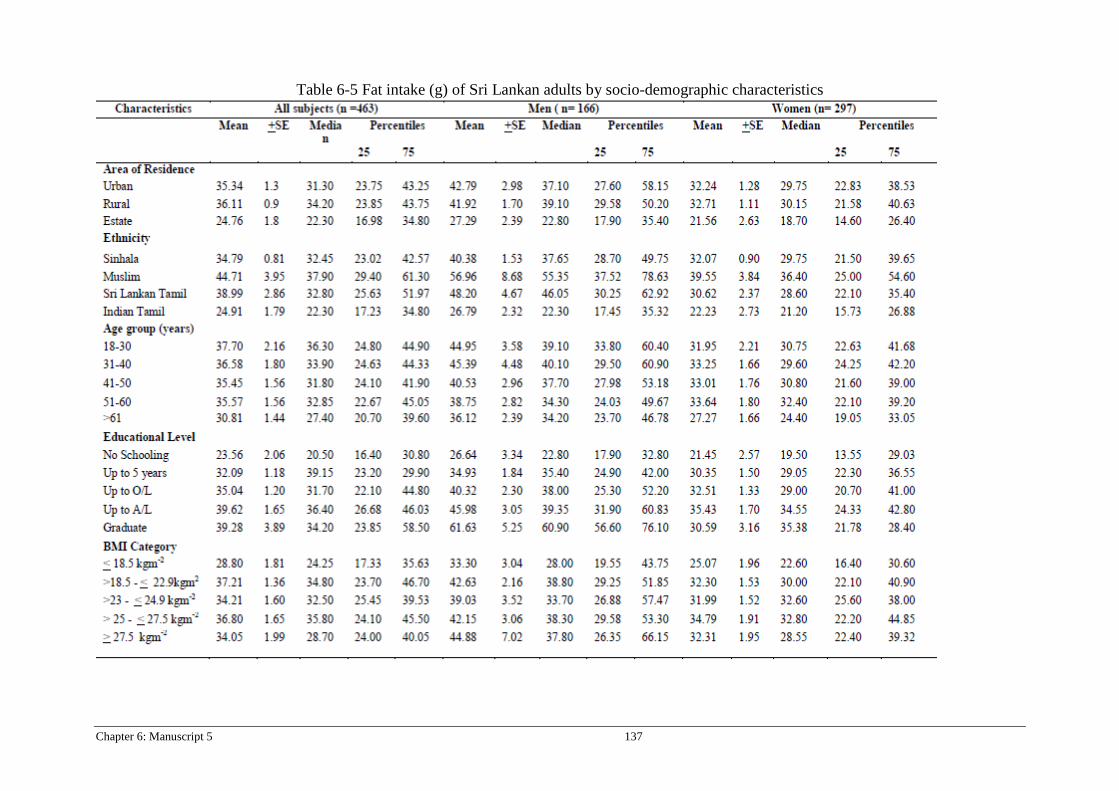
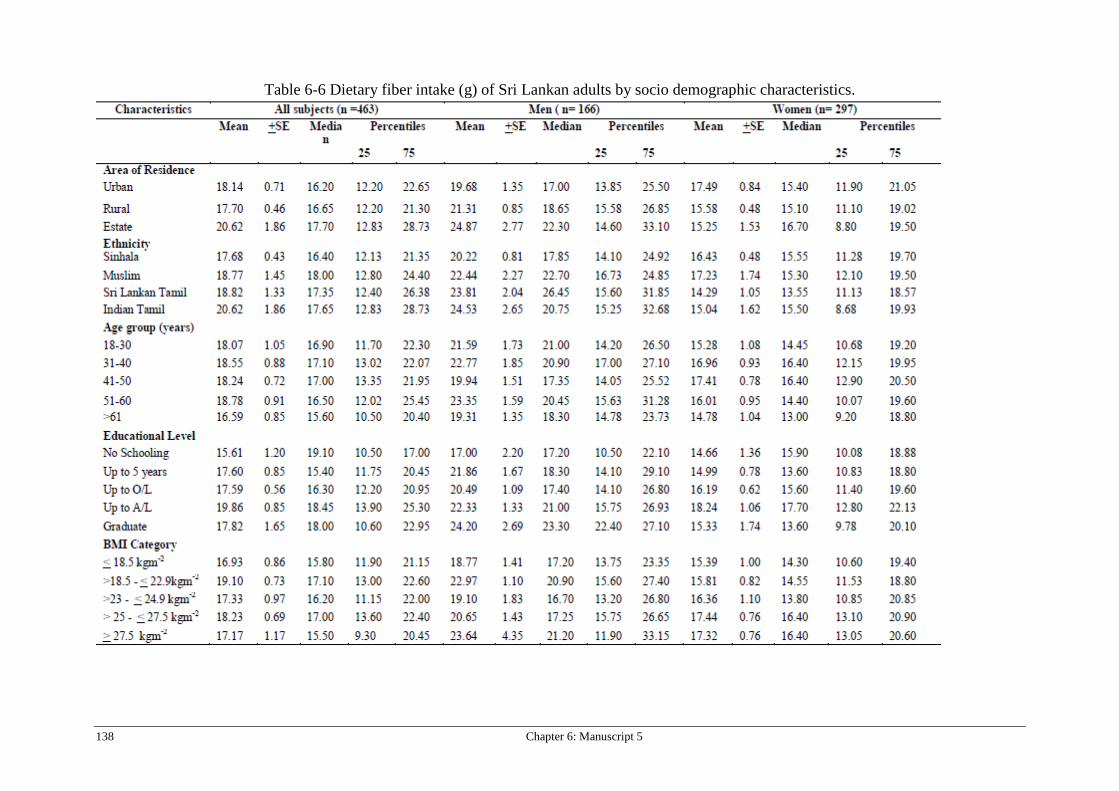
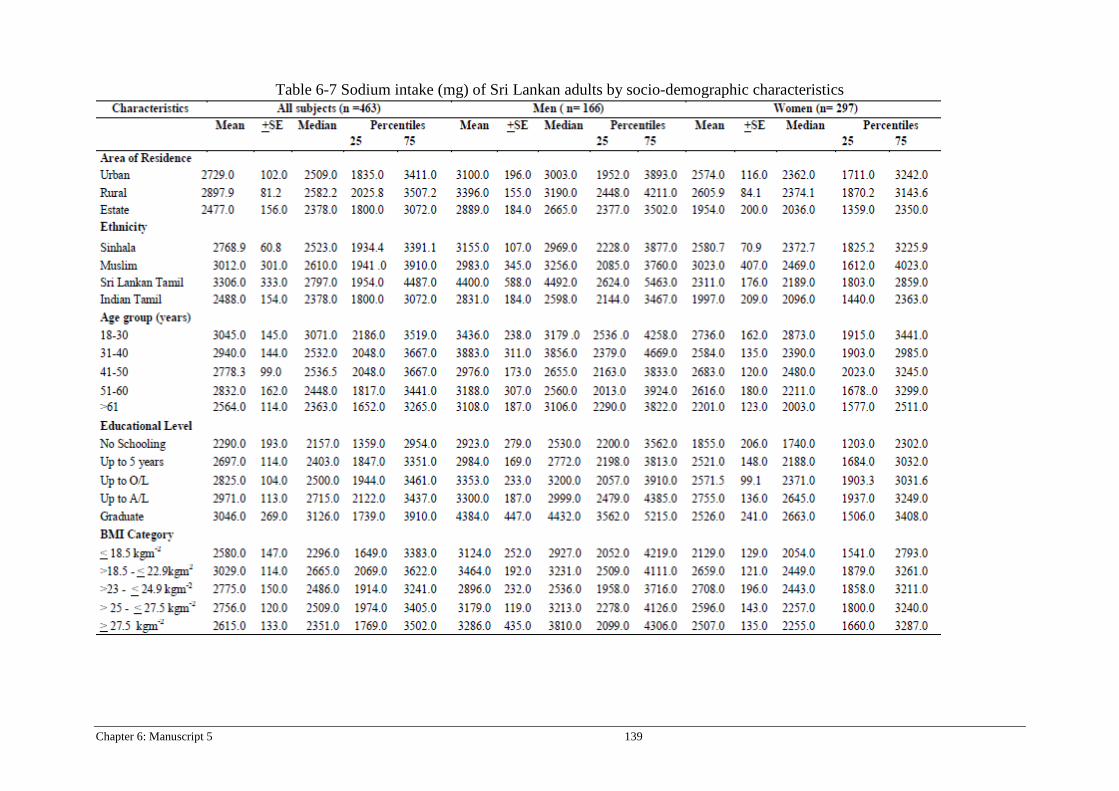
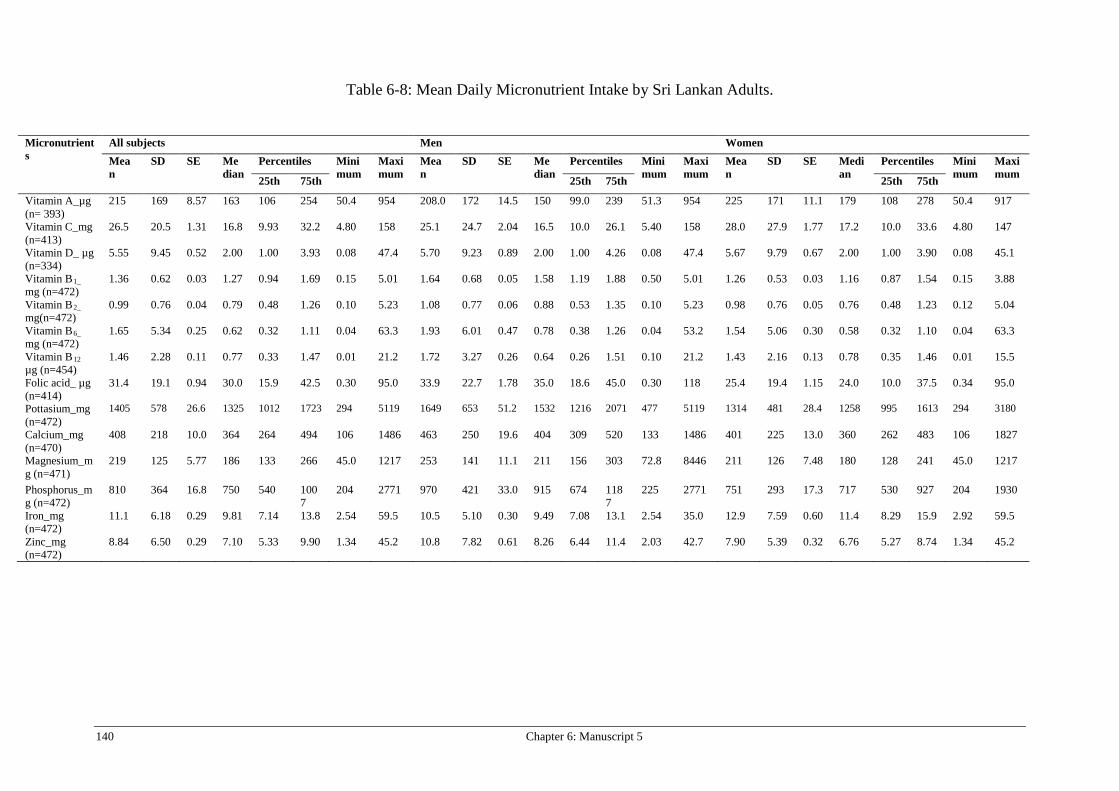
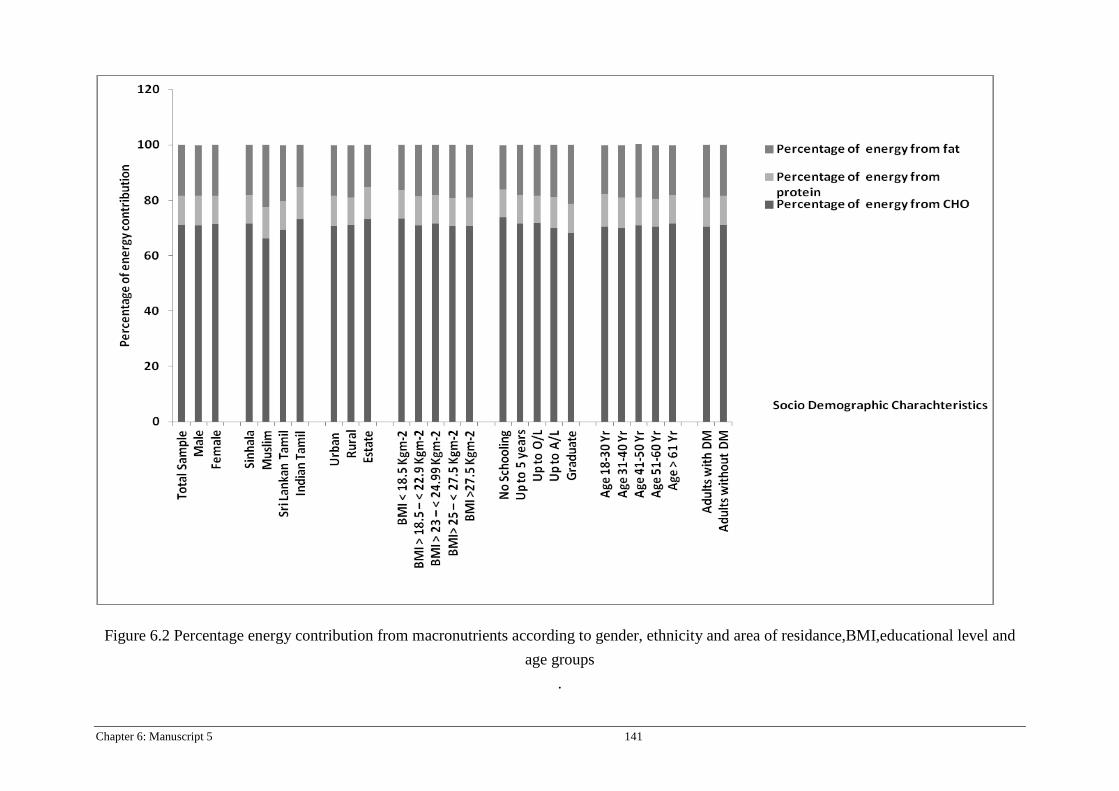
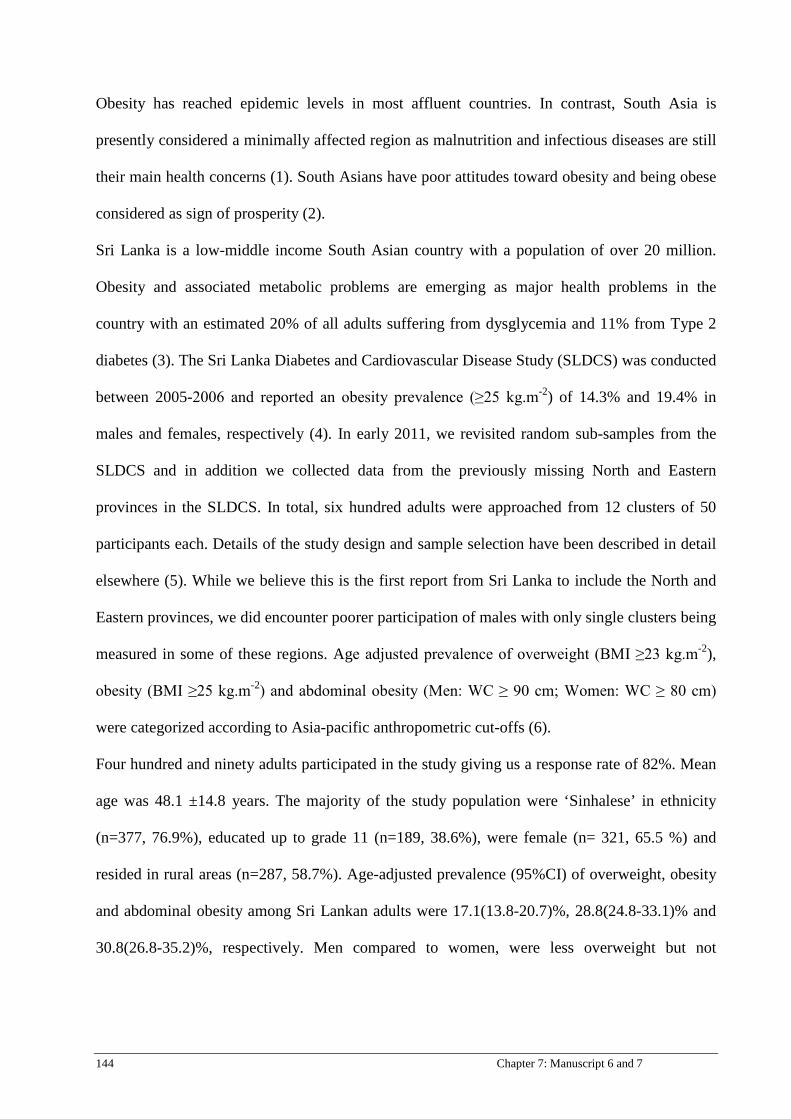
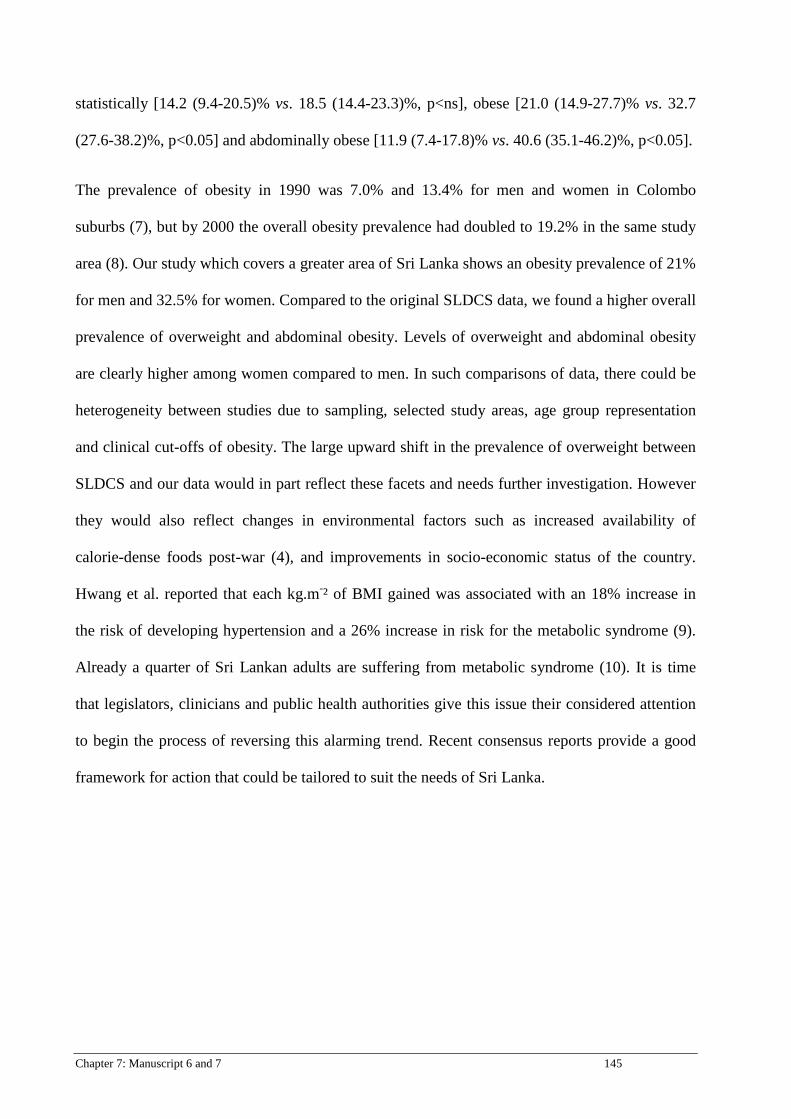
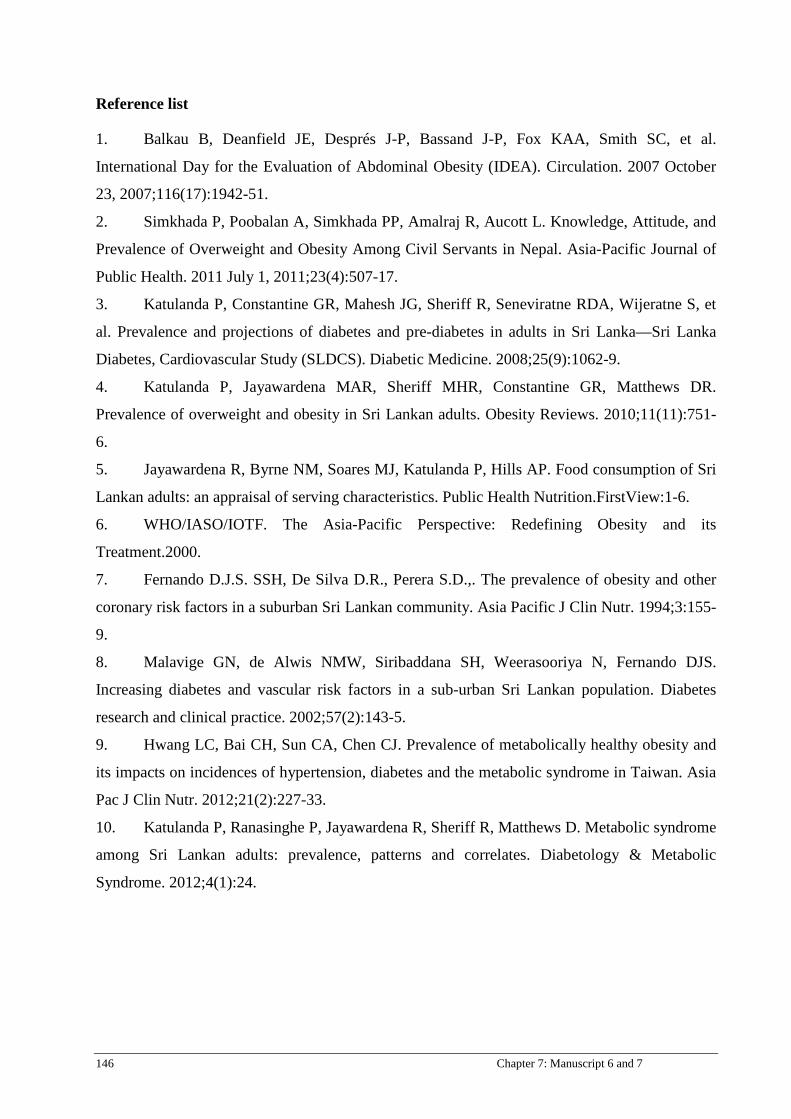
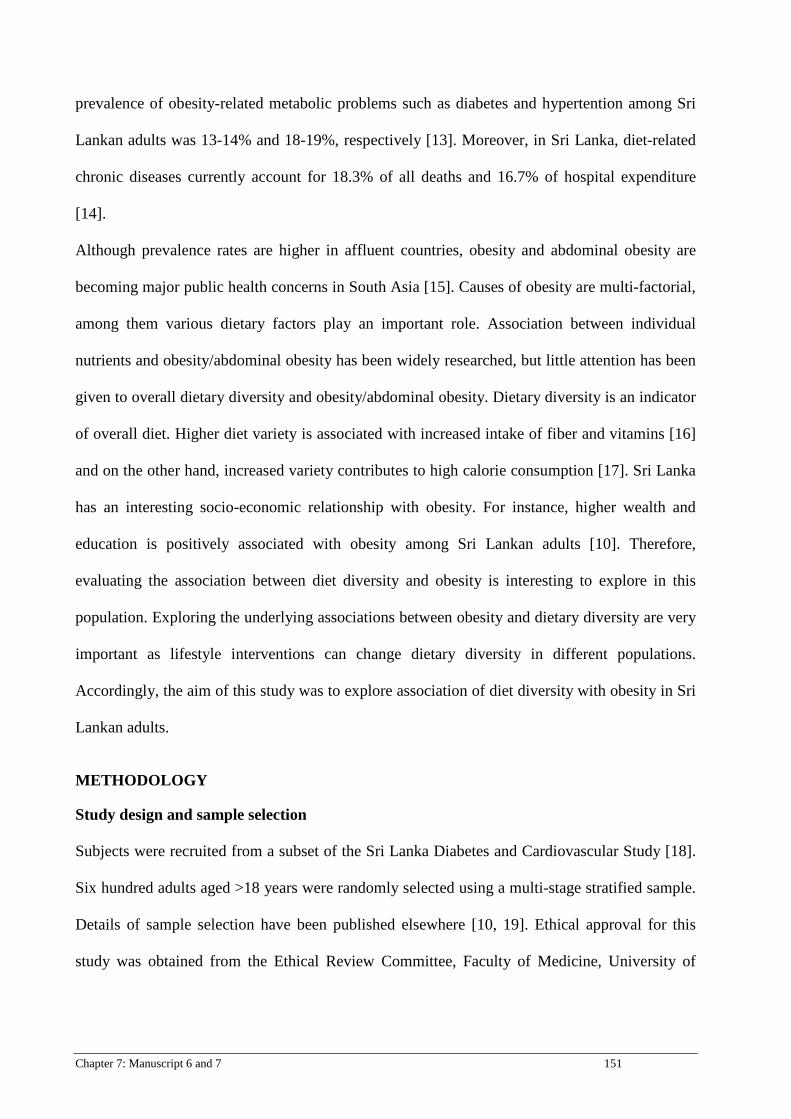
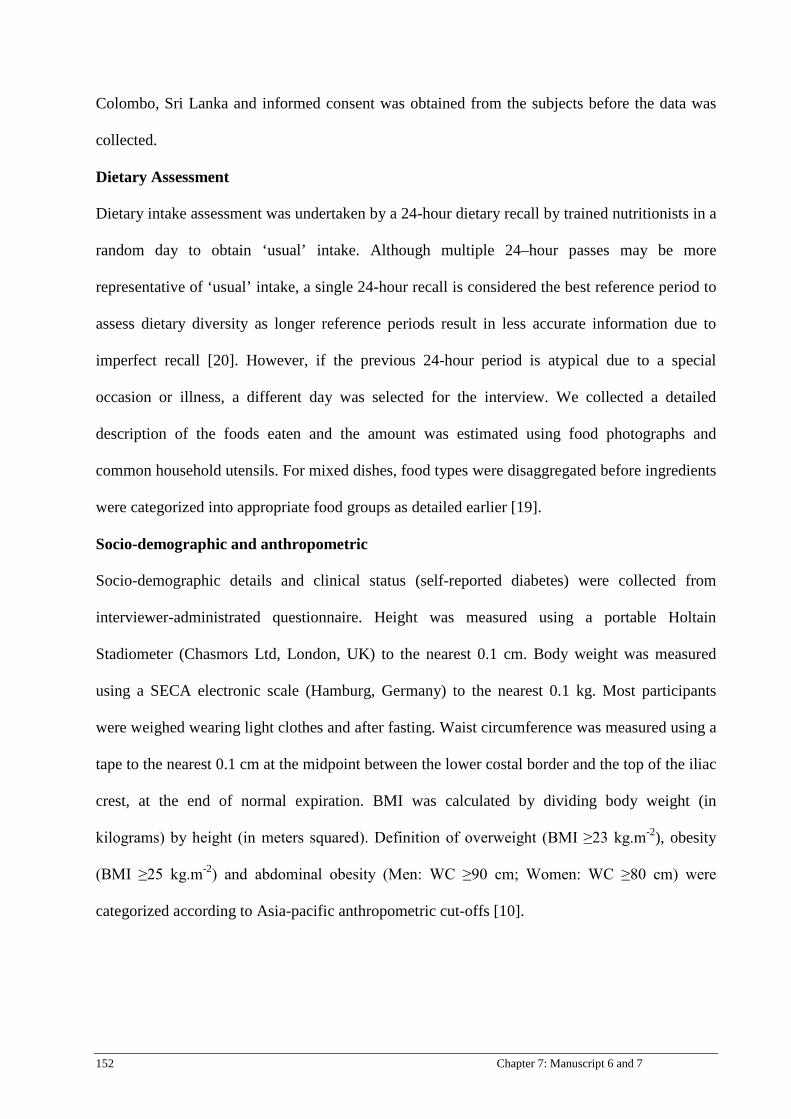
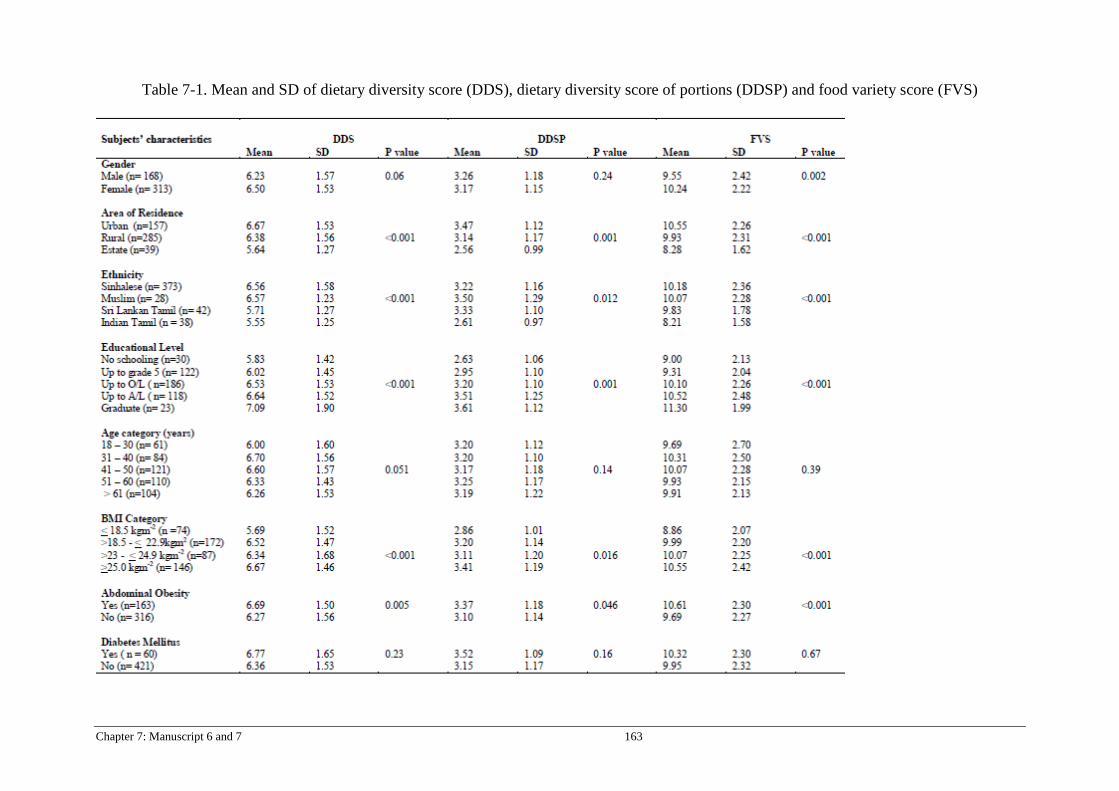
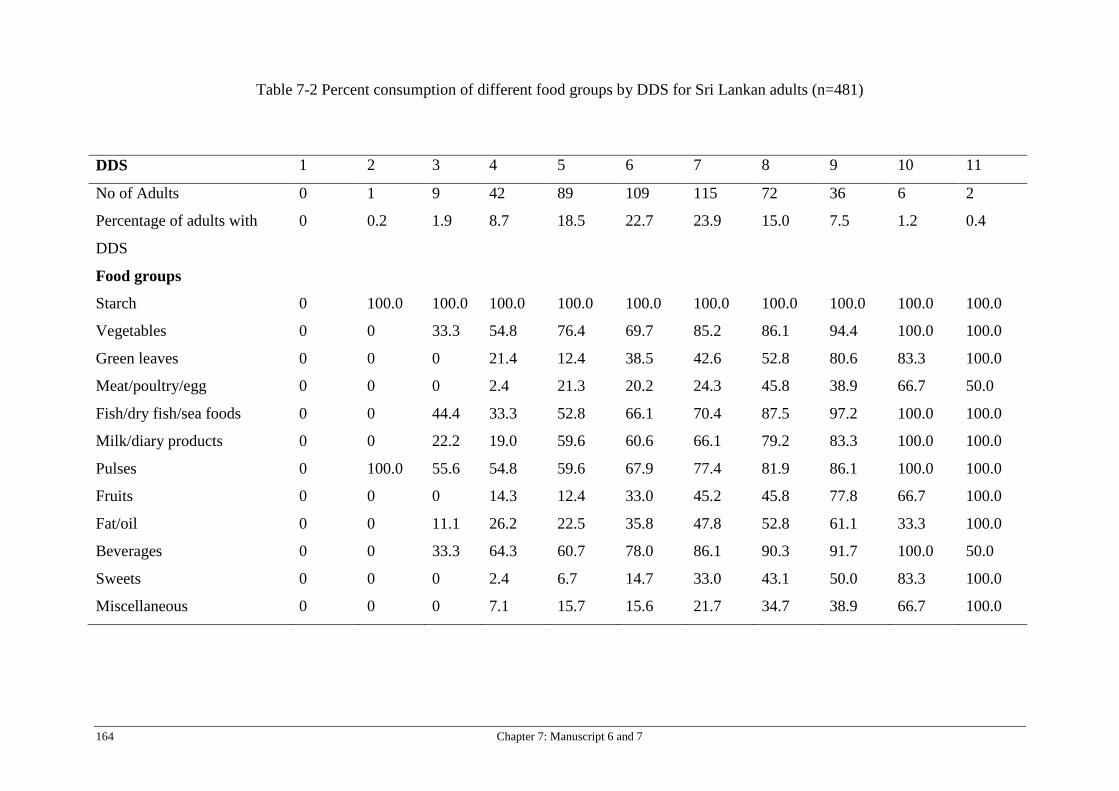
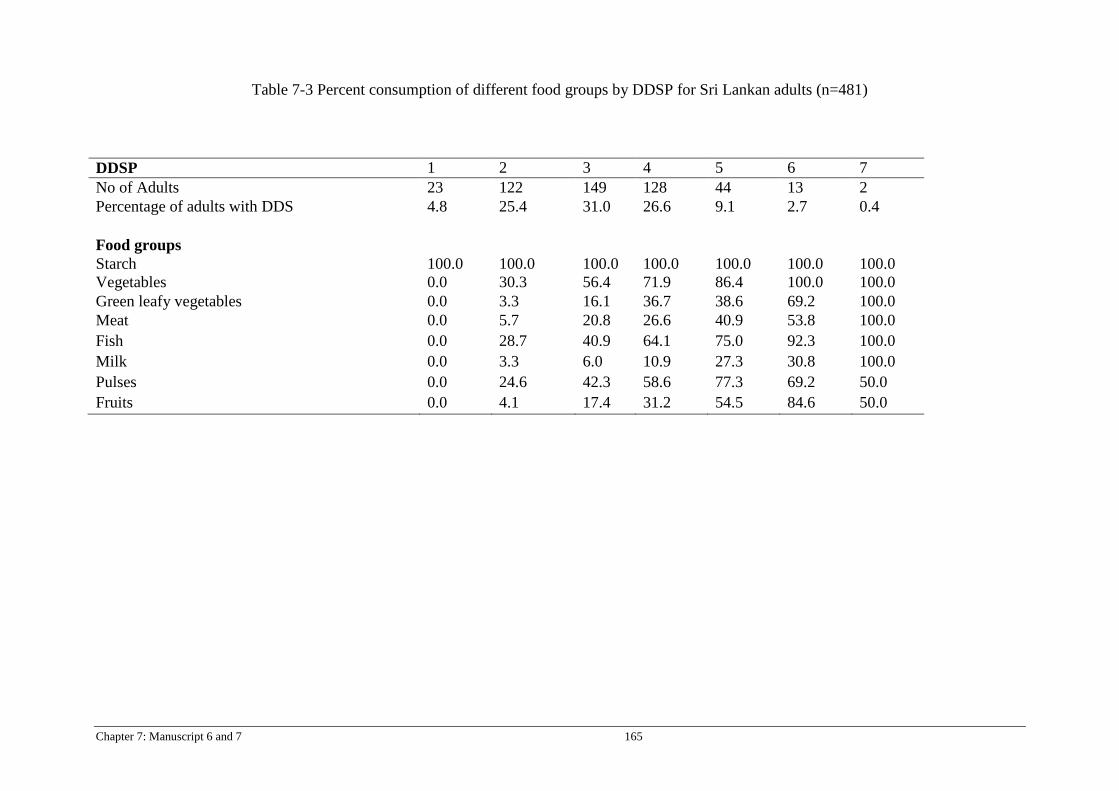
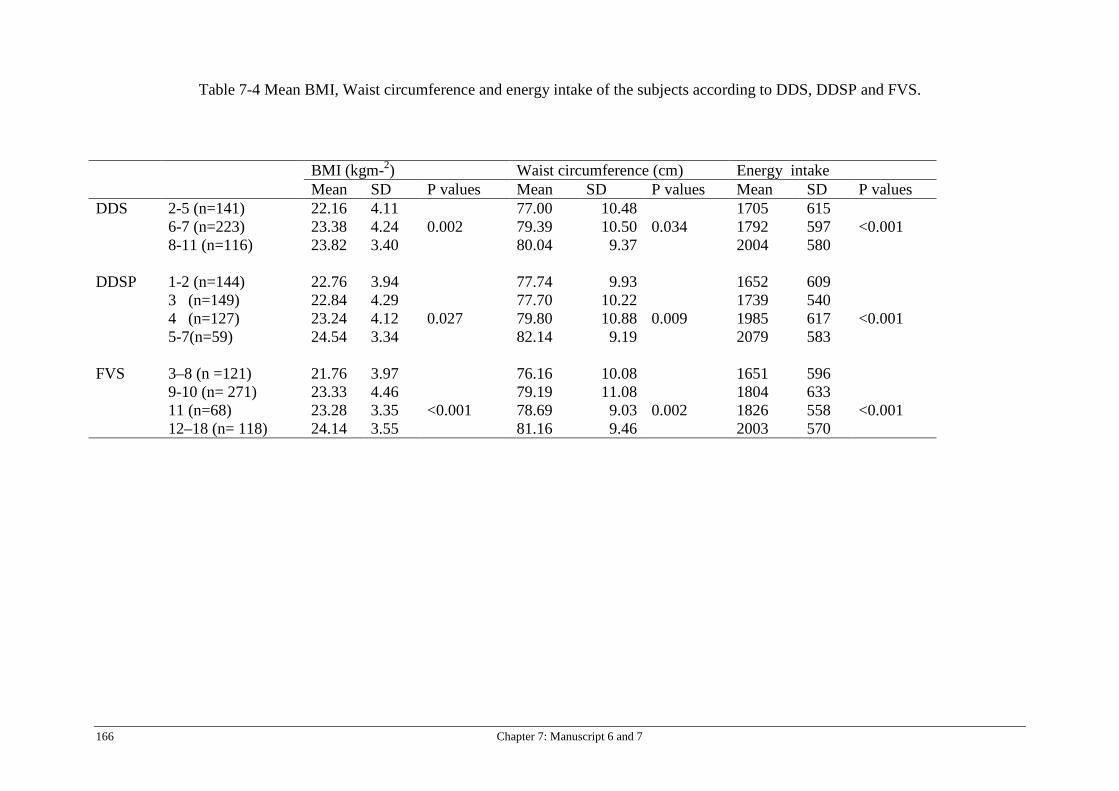
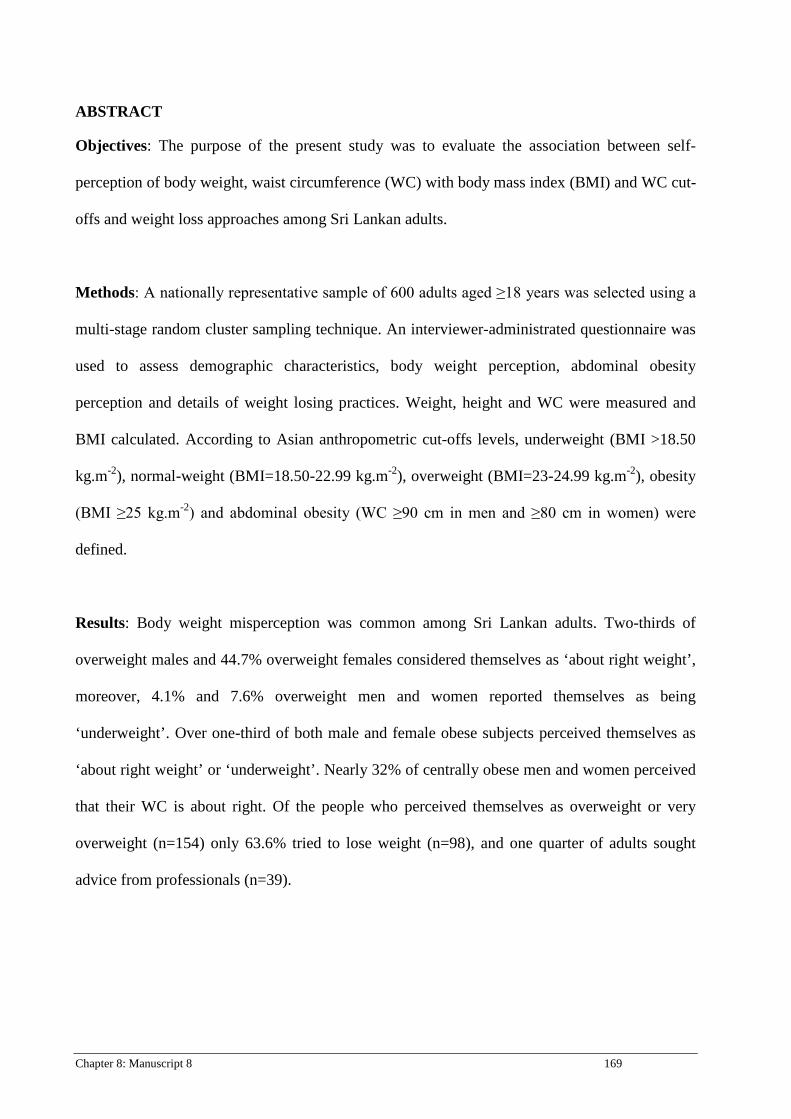
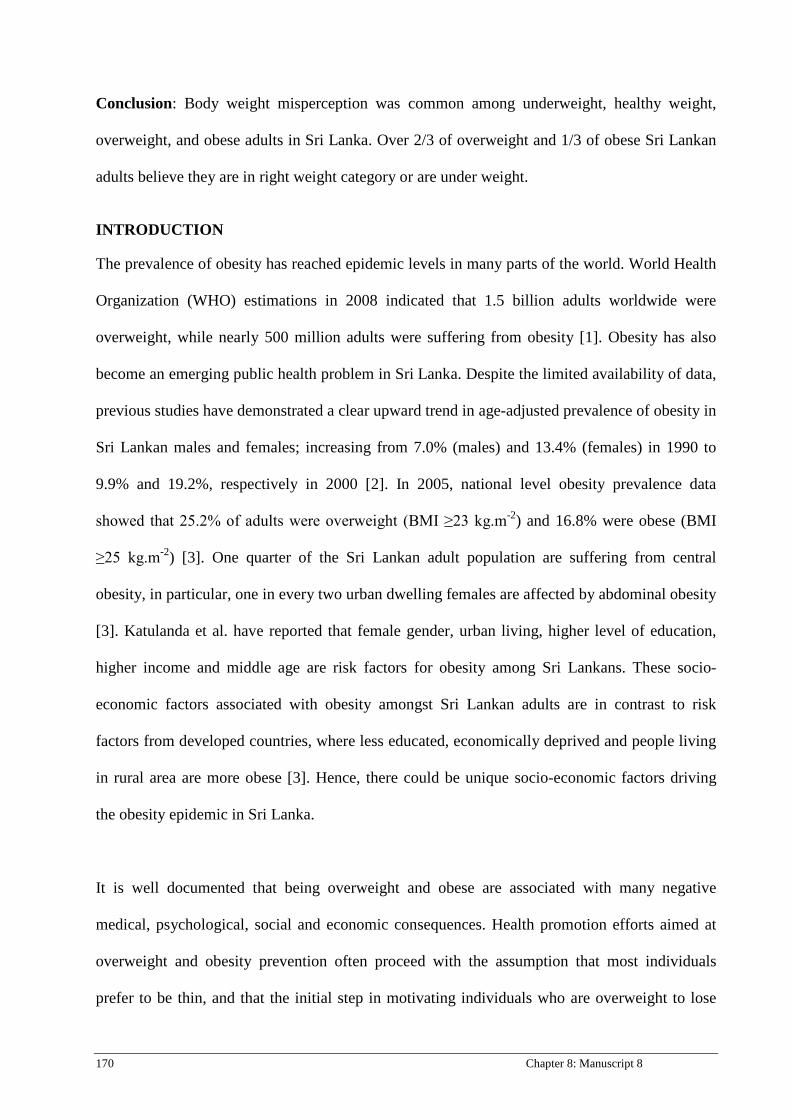
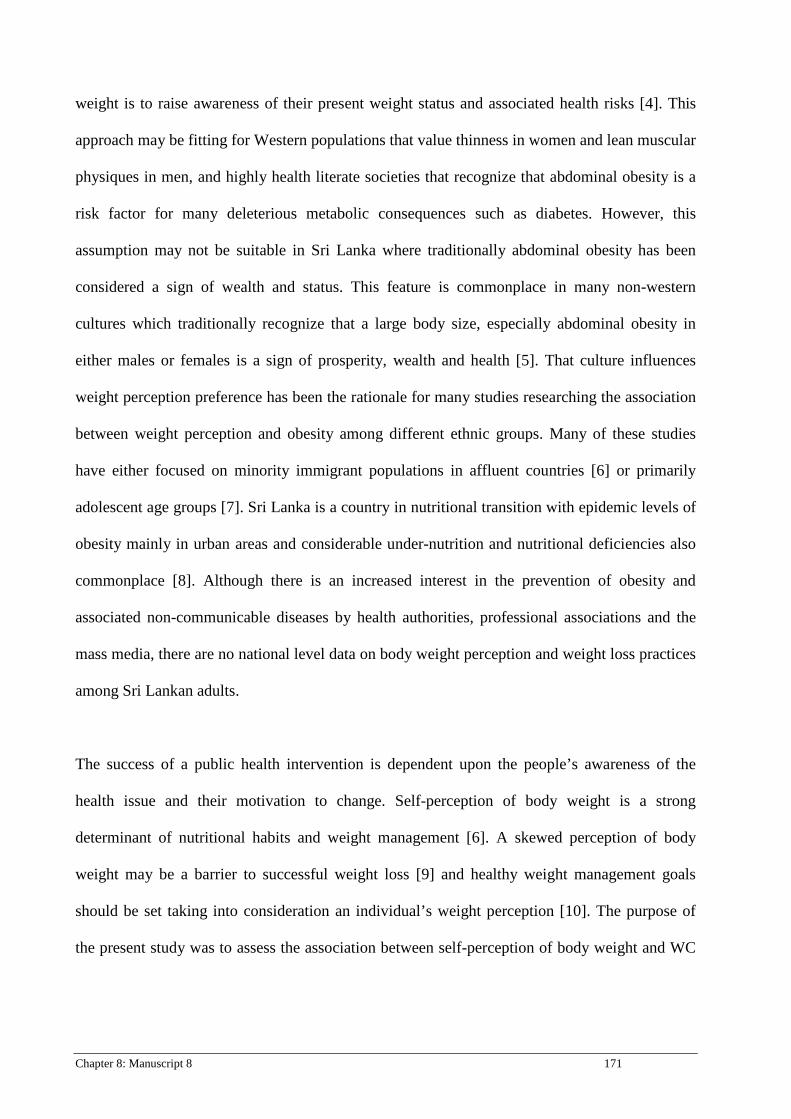
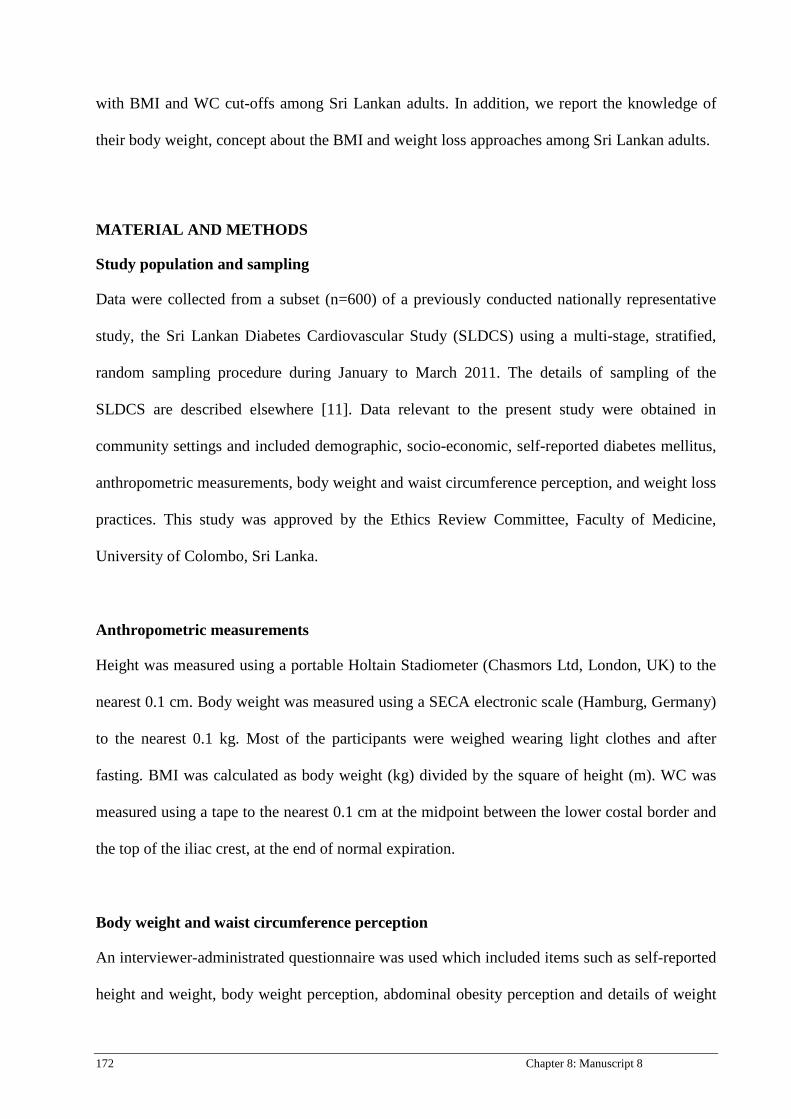
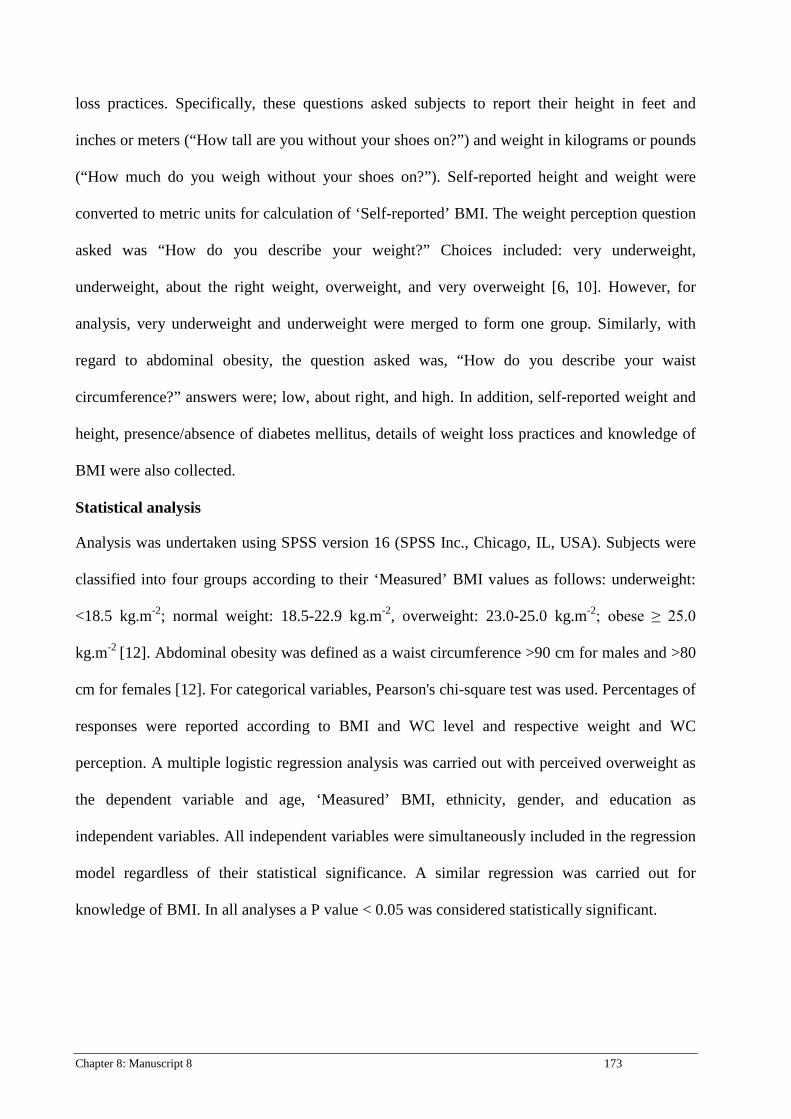
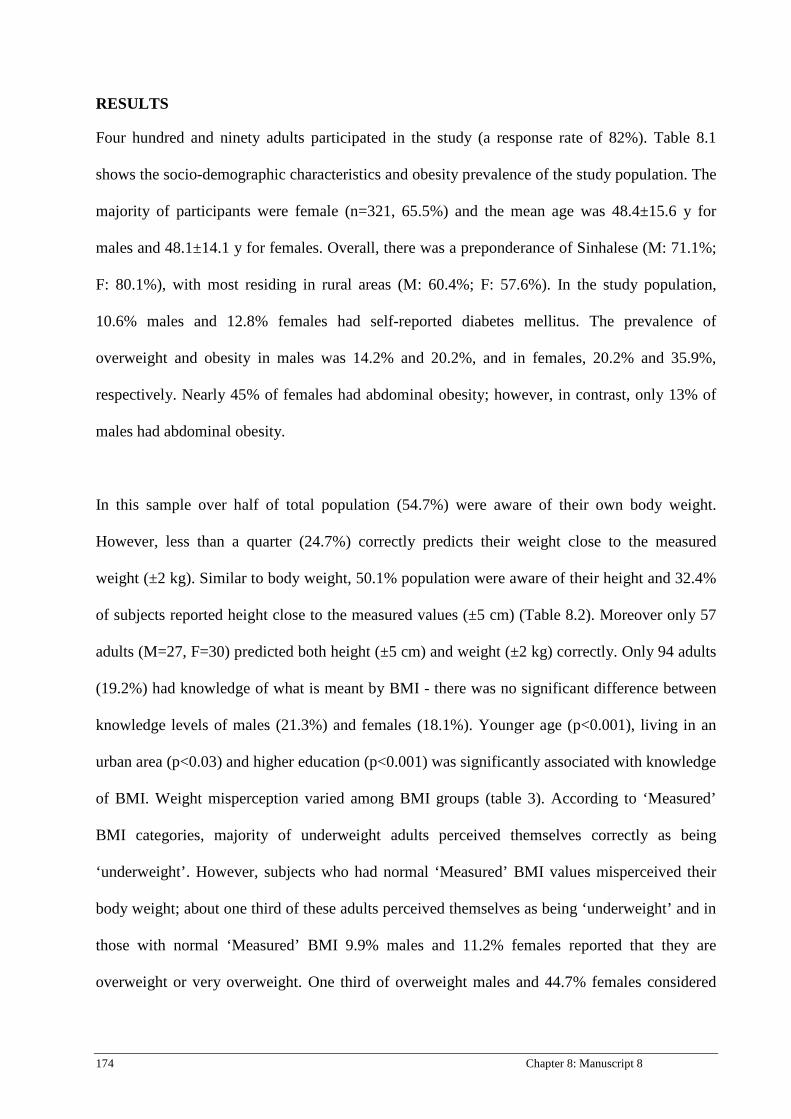
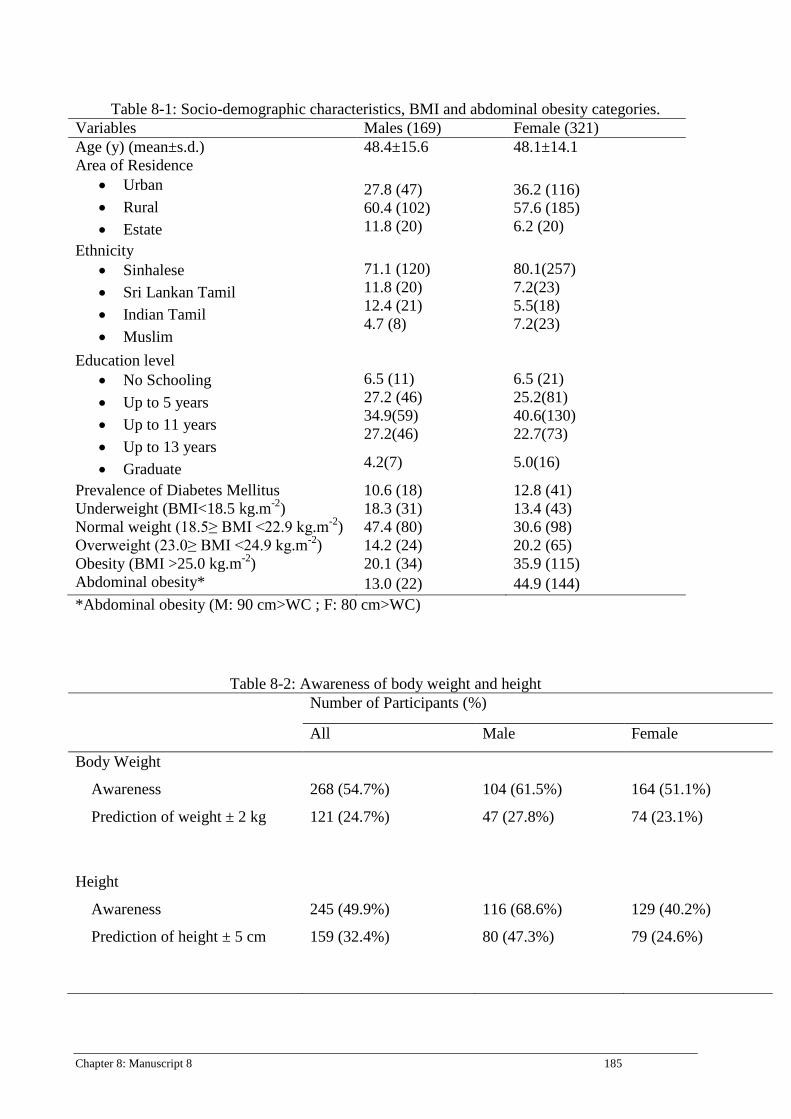
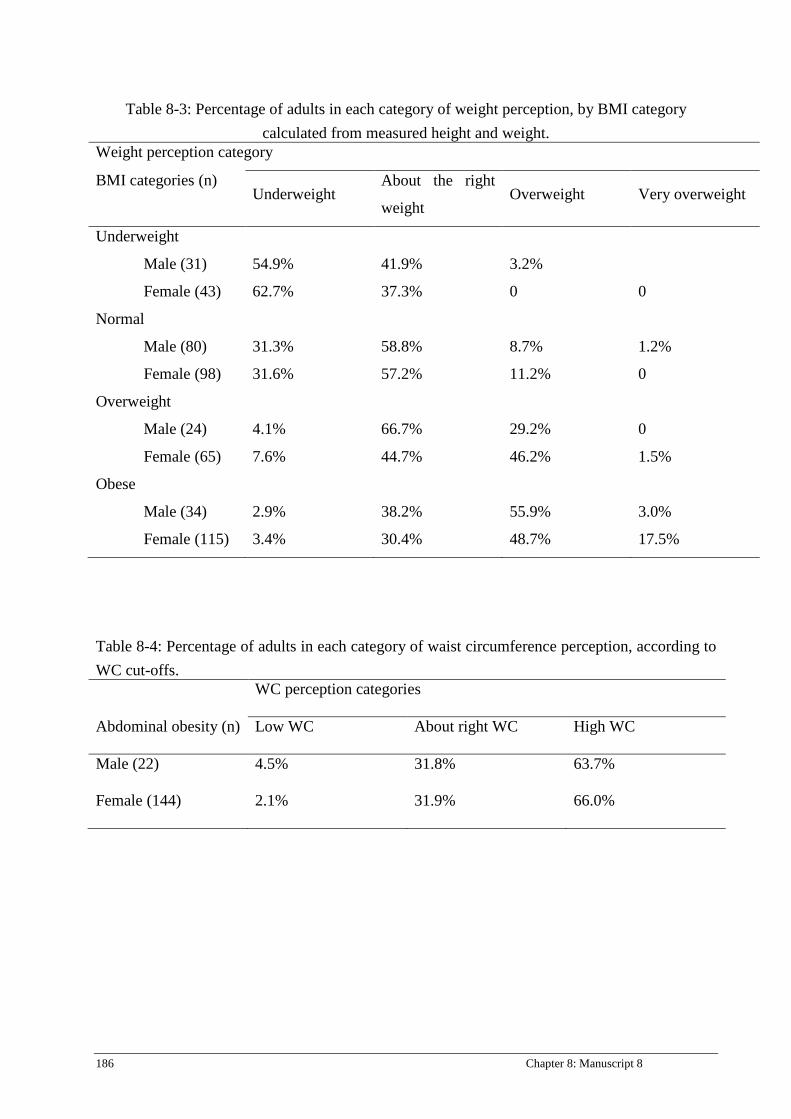
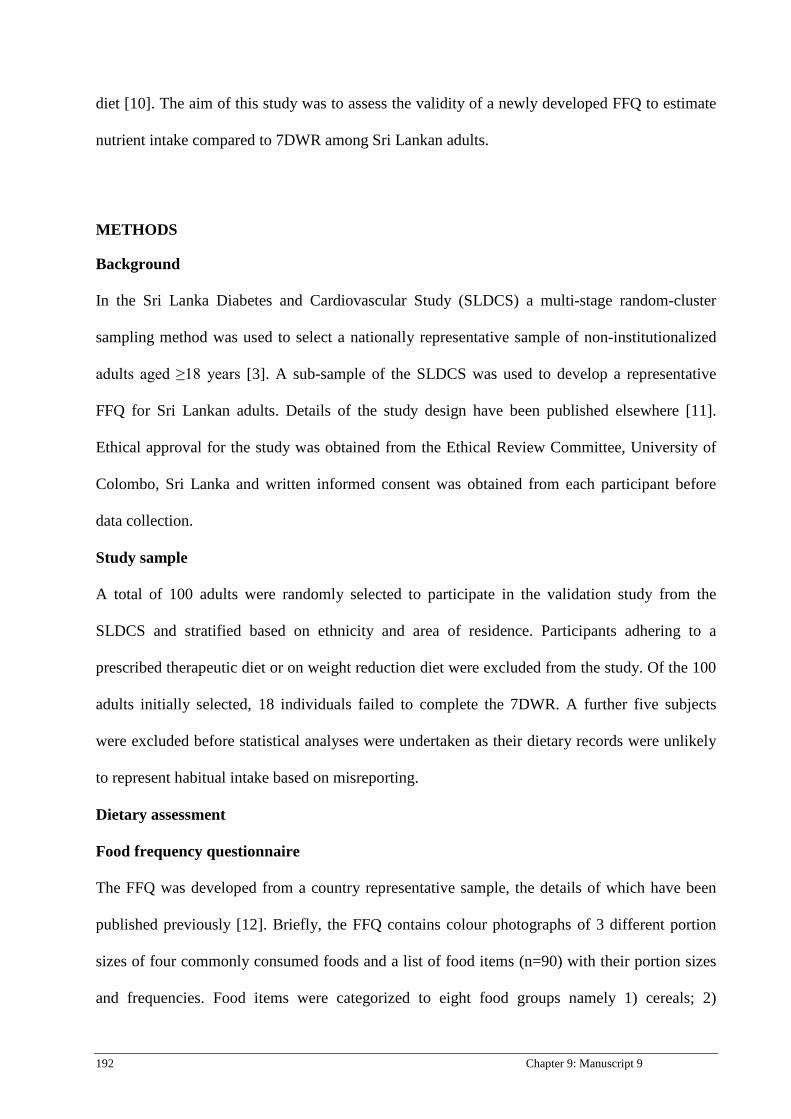
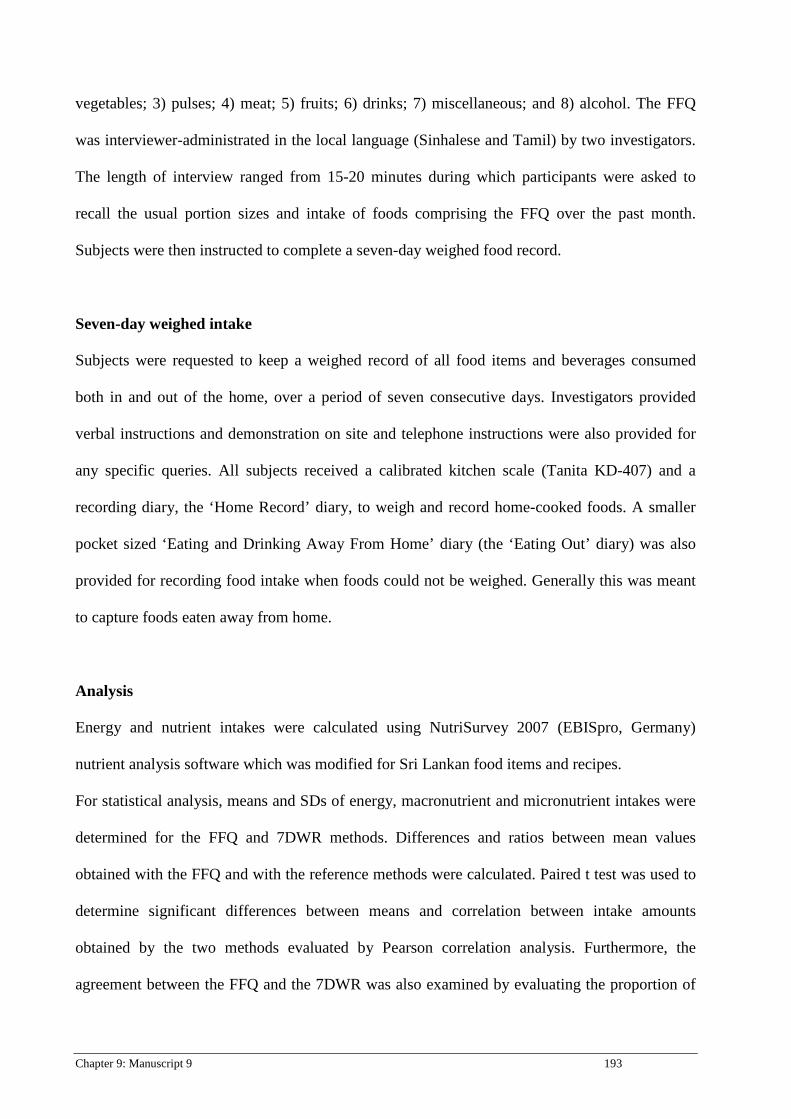
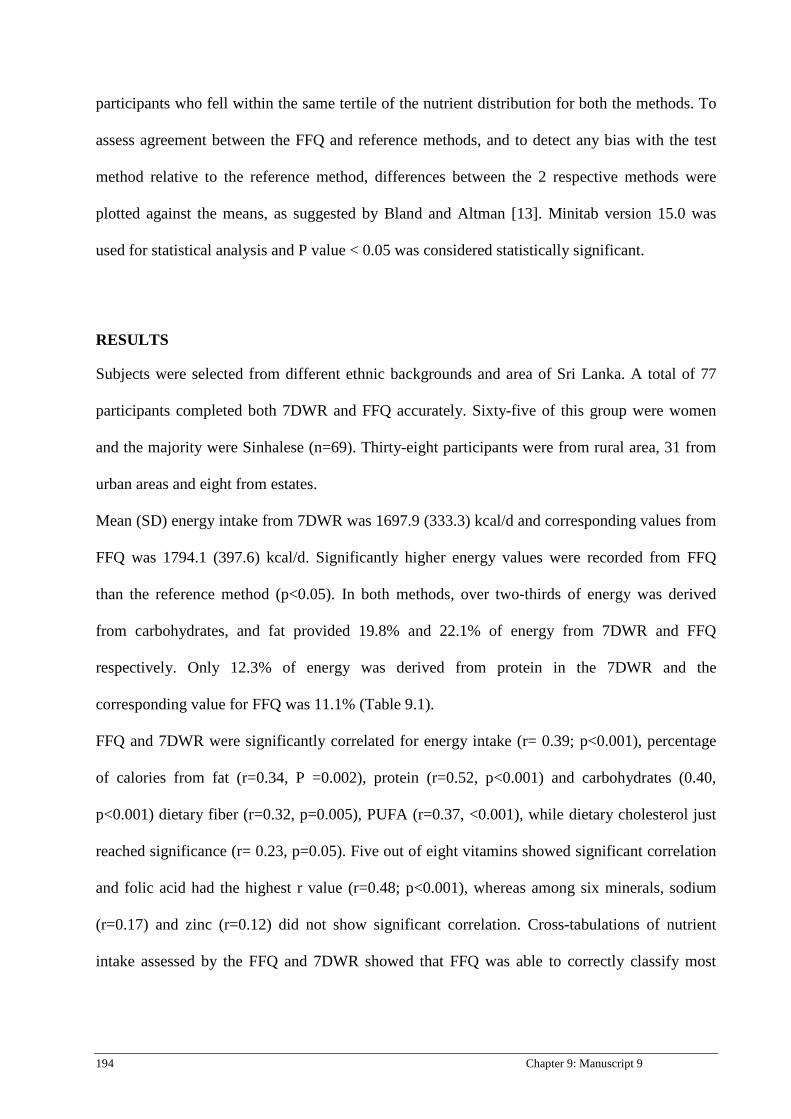
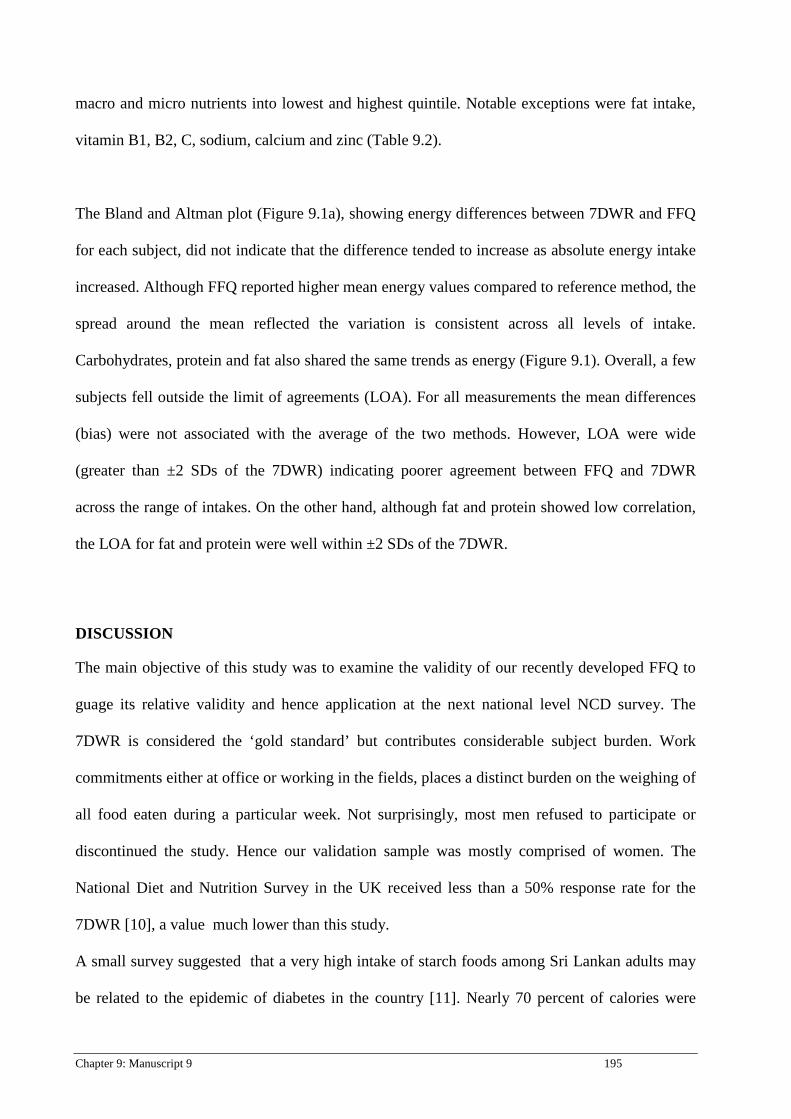
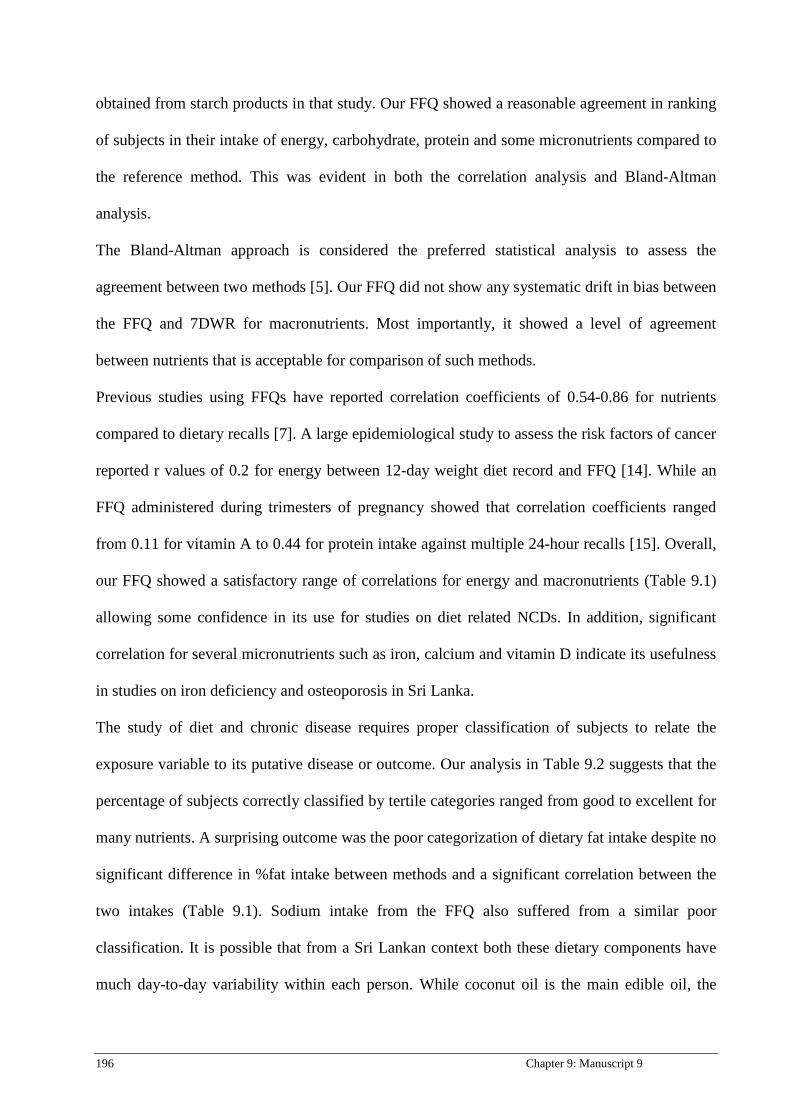
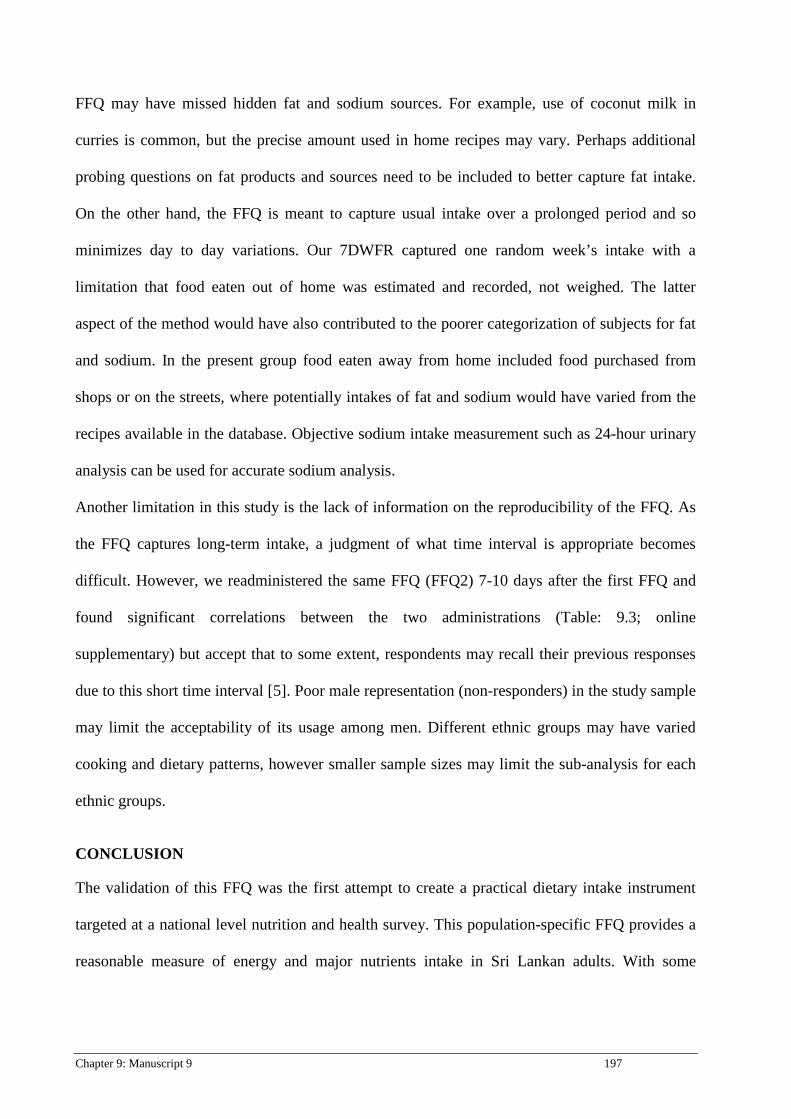
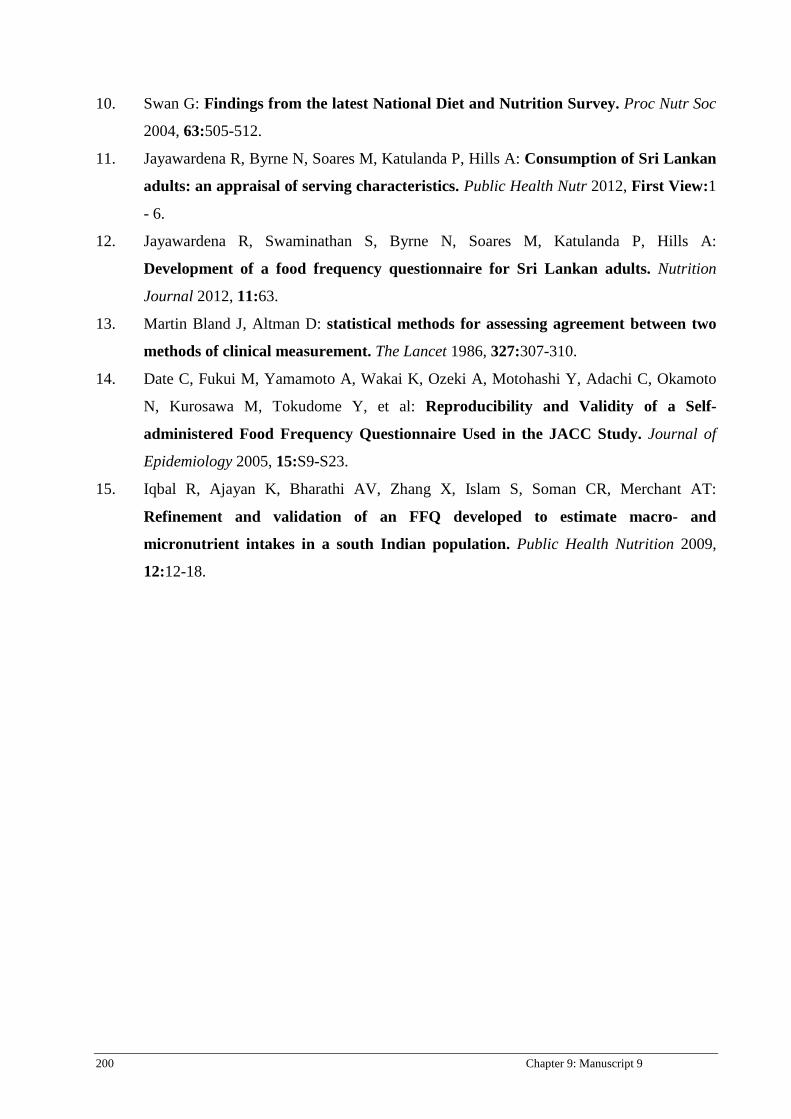
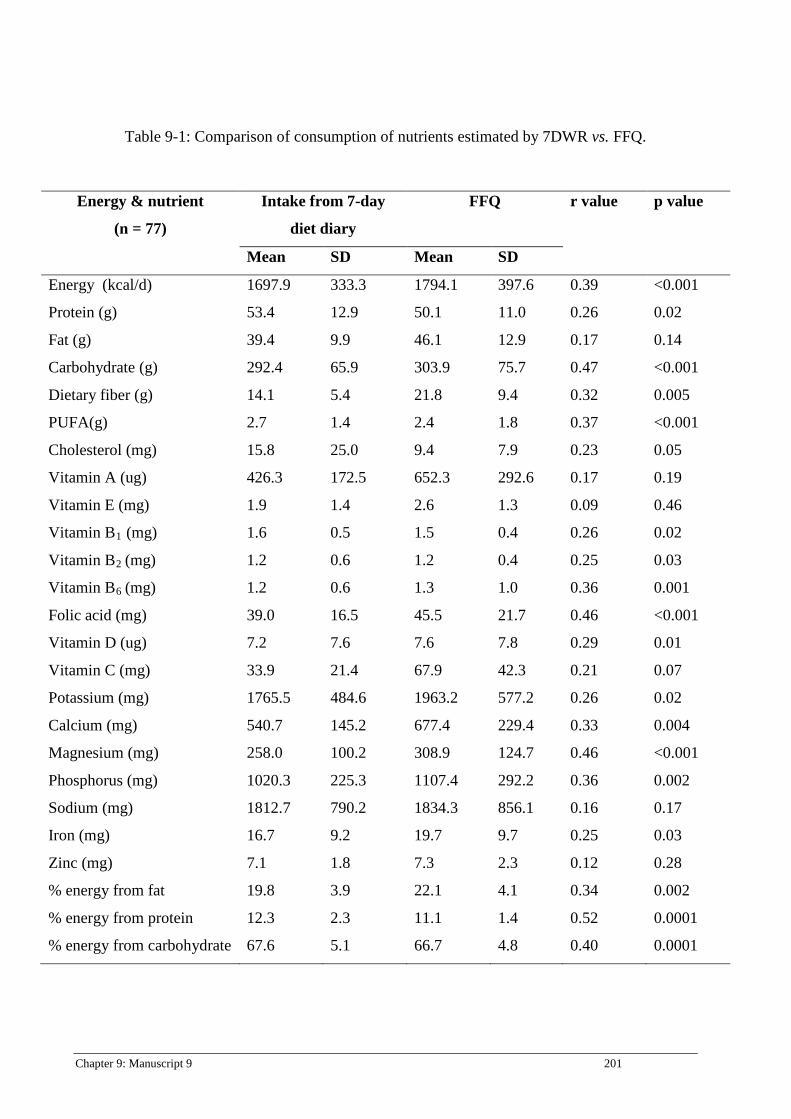
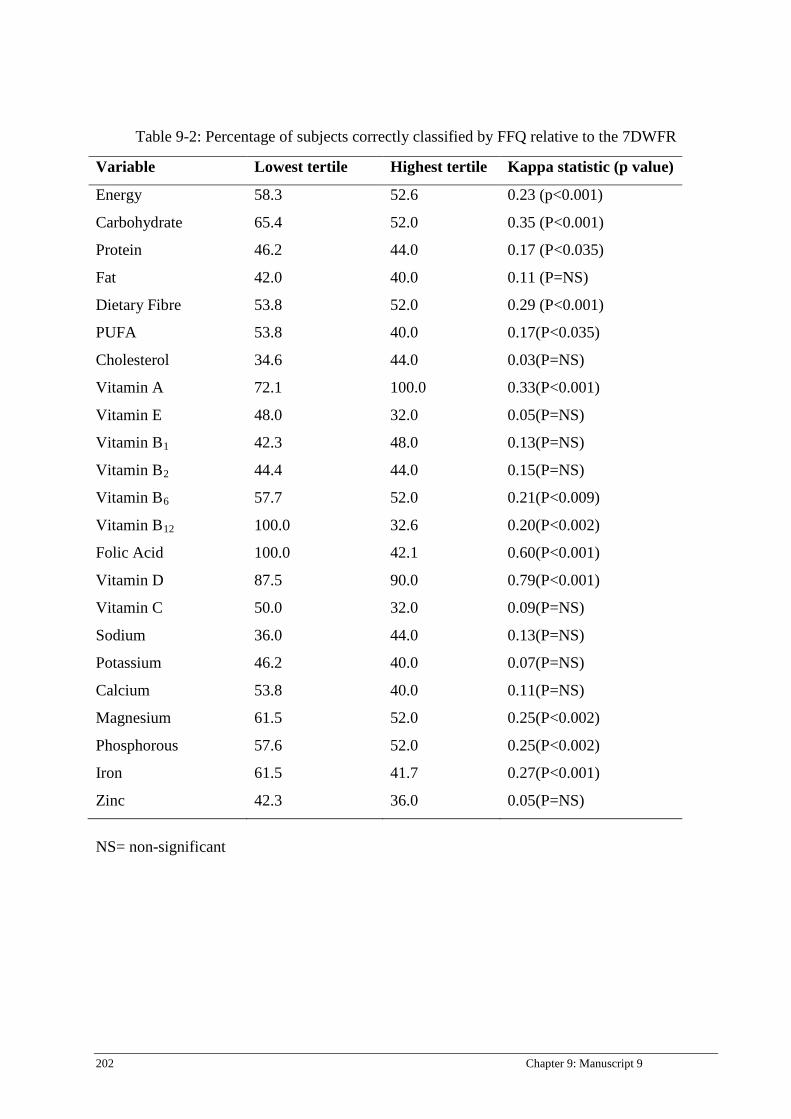
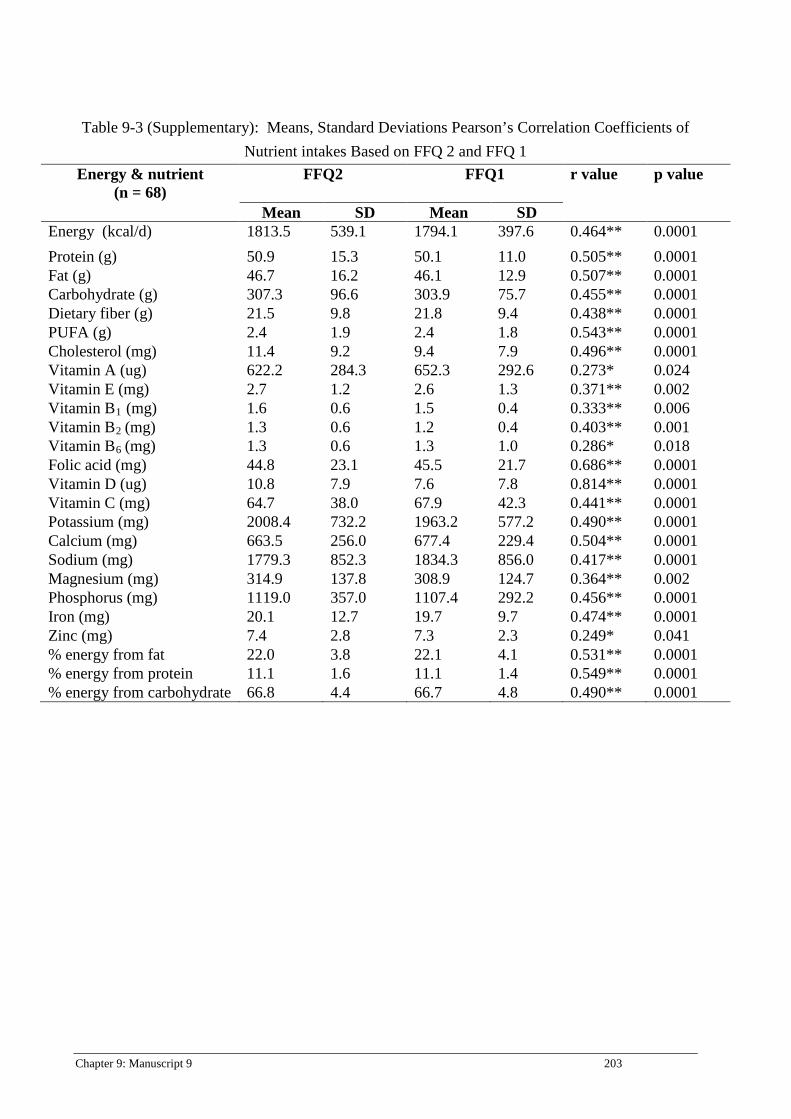
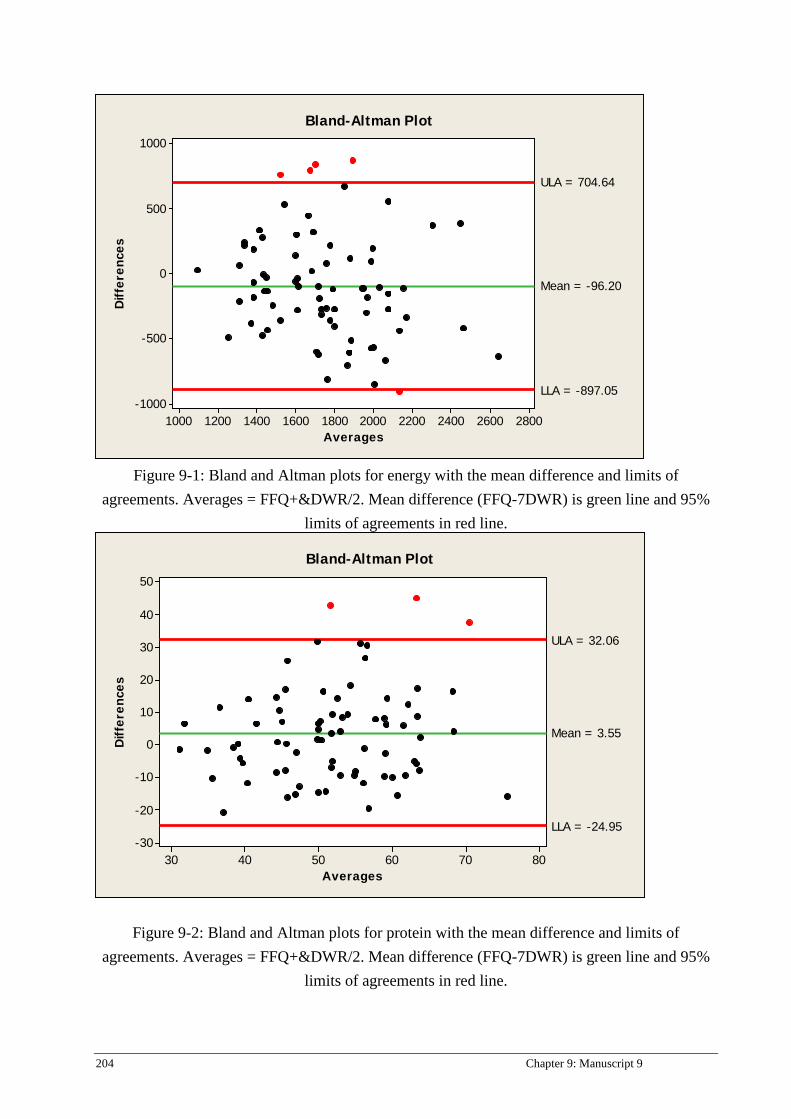
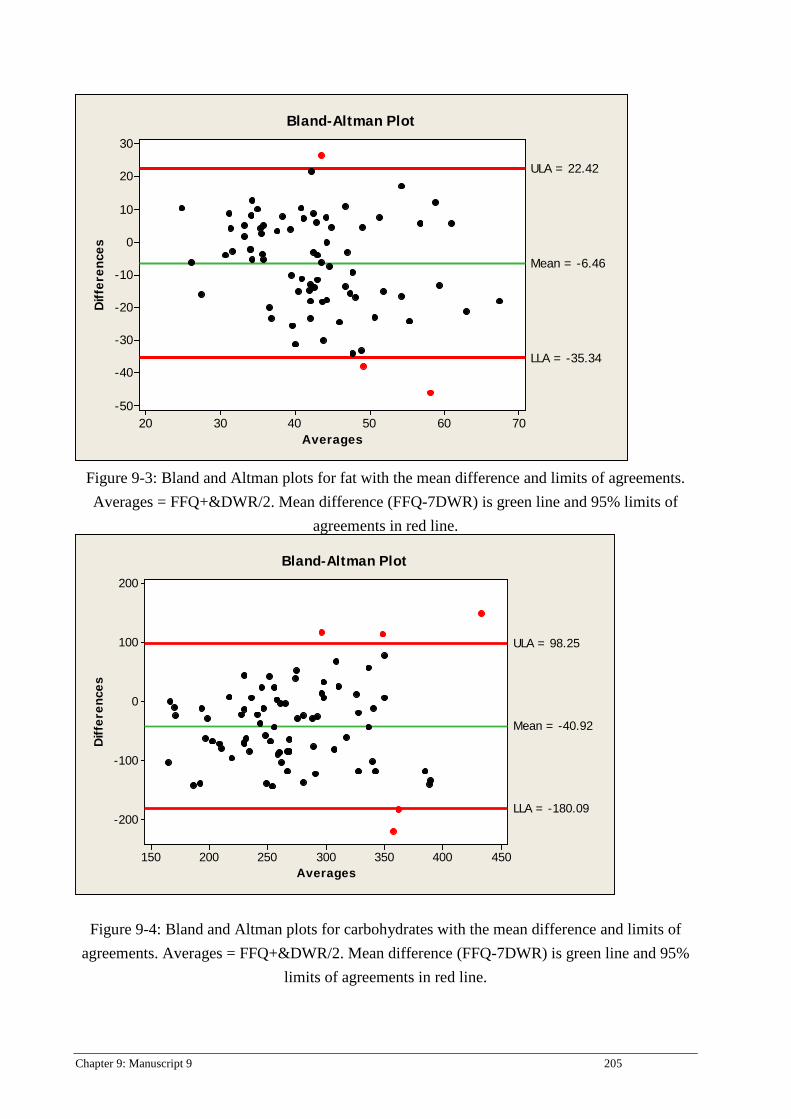
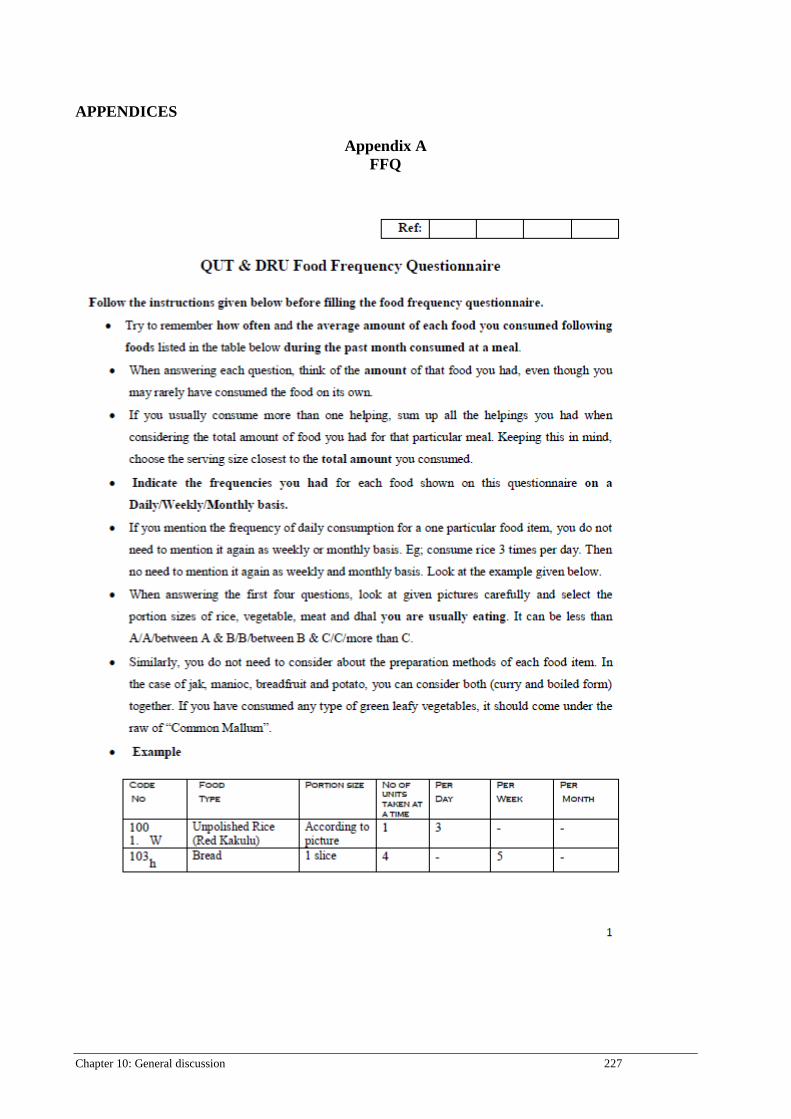
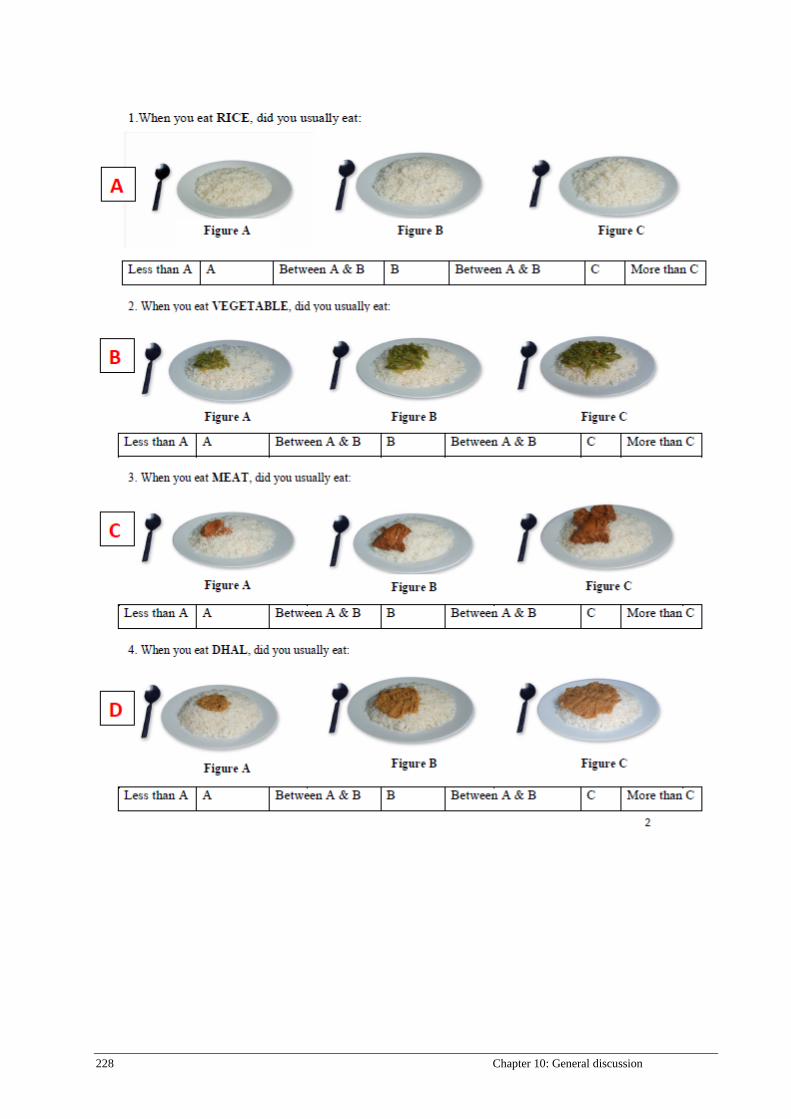
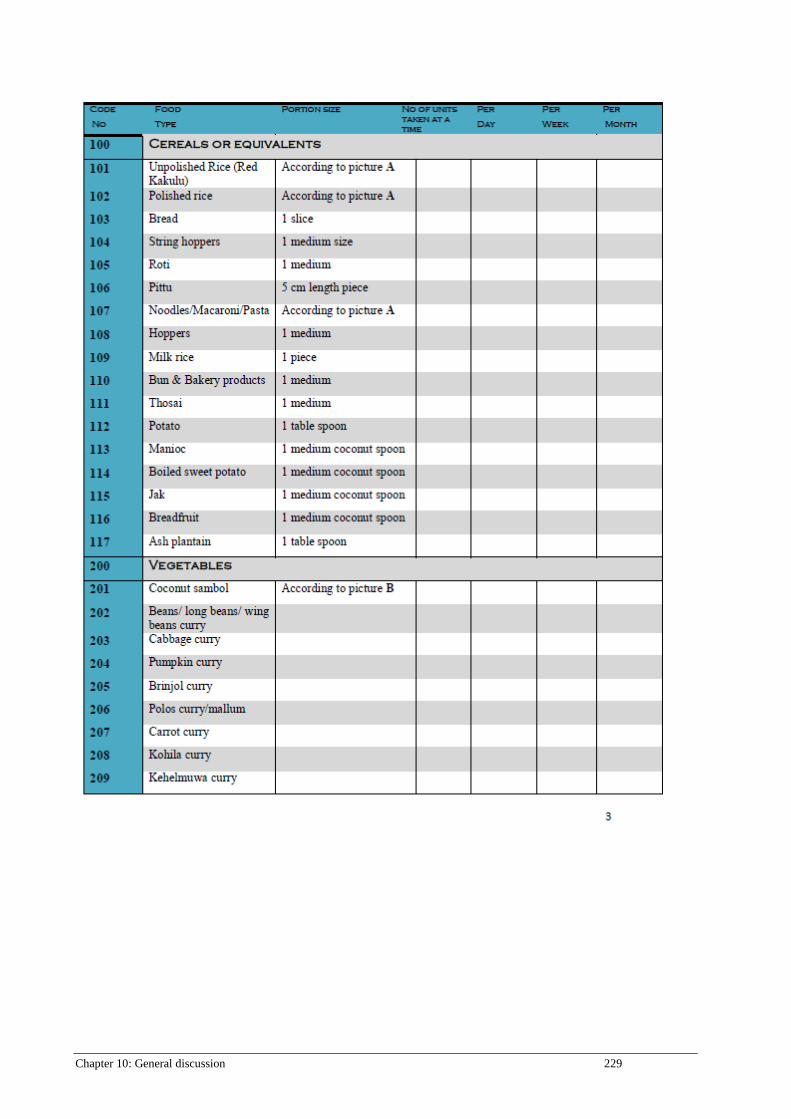
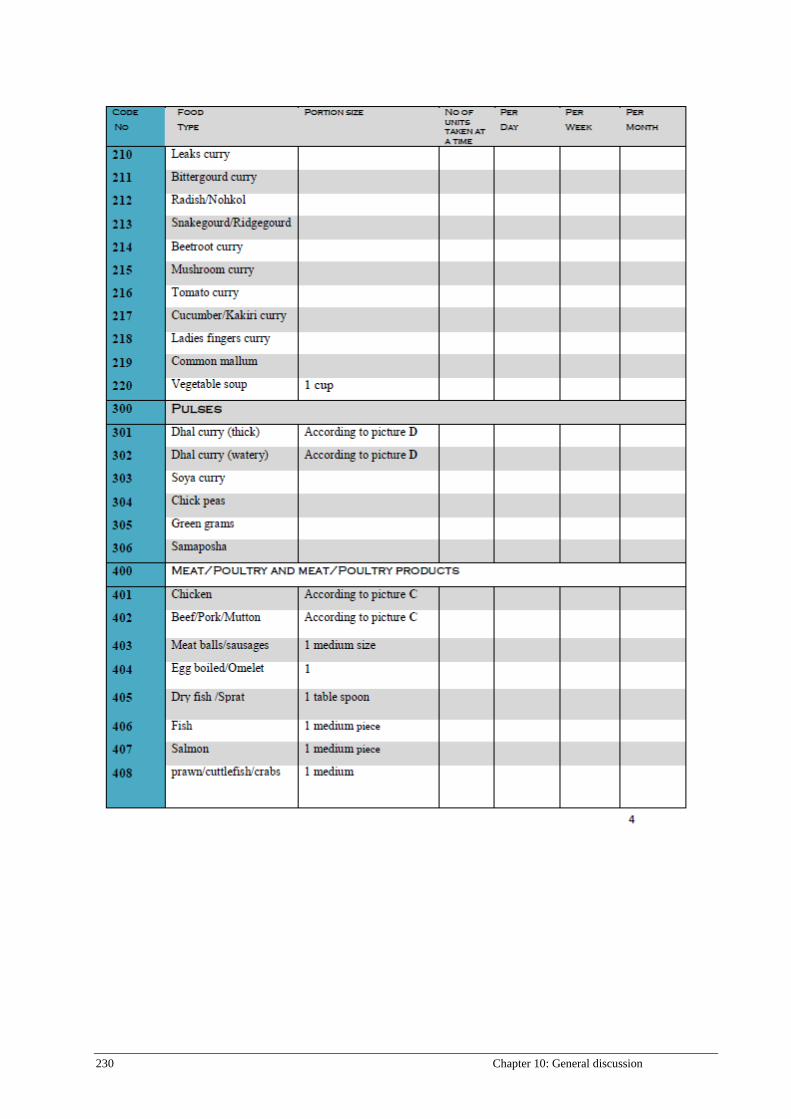
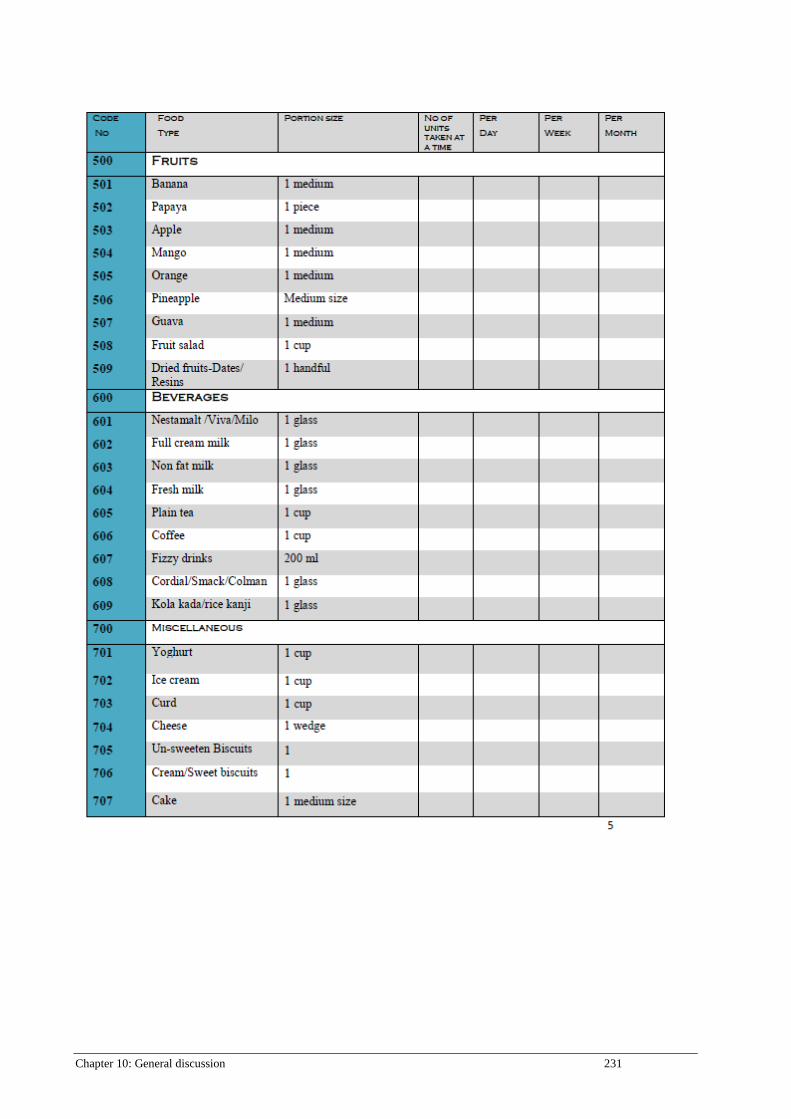
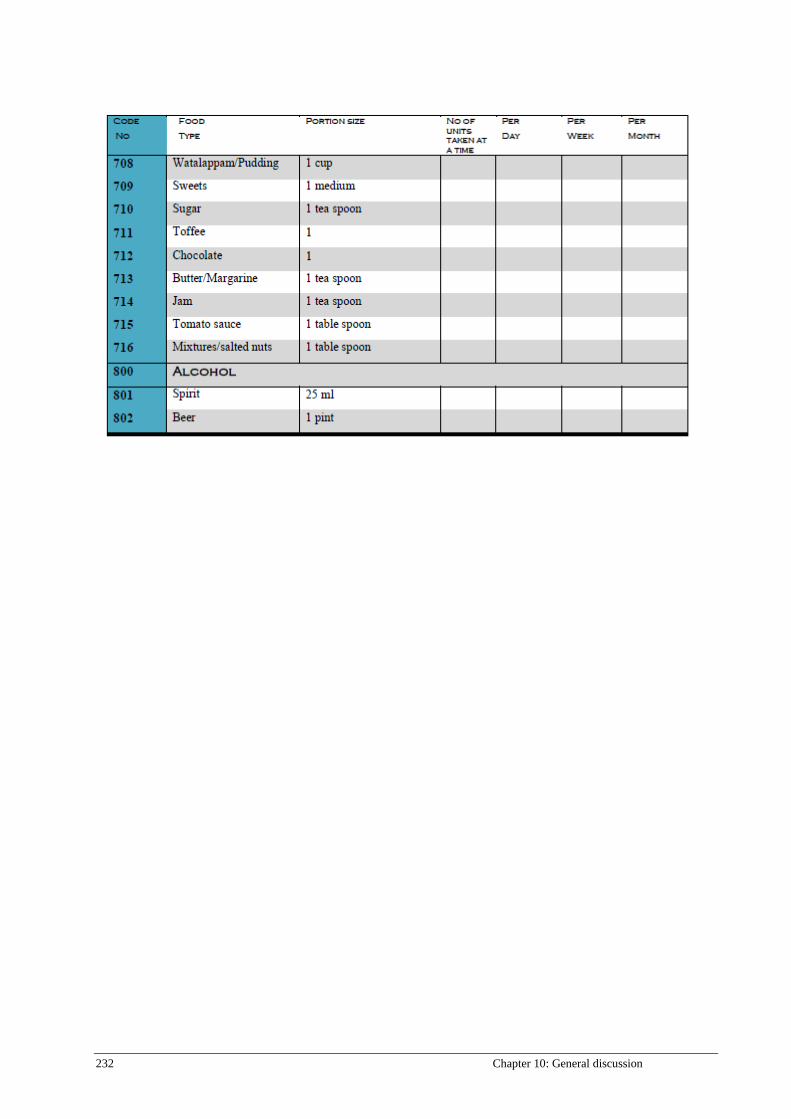
http://www.cancervic.org.au/about-our-research/epidemiology/nutritional_assessment_services.

10. Bharathi A, Kurpad A, Thomas T, Yusuf S, Saraswathi G, Vaz M. Development of food

frequency questionnaires and a nutrient database for the Prospective Urban and Rural

Epidemiological (PURE) pilot study in South India: Methodological issues. Asia Pacific Journal

of Clinical Nutrition. 2008;17(1):178-85.

Chapter 10: General discussion 223

11. Mendez MA, Wynter S, Wilks R, Forrester T. Under- and overreporting of energy is

related to obesity, lifestyle factors and food group intakes in Jamaican adults. Public Health

Nutr. 2004 Feb;7(1):9-19.

12. Azizi F, Esmaillzadeh A, Mirmiran P. Correlates of under- and over-reporting of energy

intake in Tehranians: body mass index and lifestyle-related factors. Asia Pac J Clin Nutr.

2005;14(1):54-9.

13. Mattisson I, Wirfalt E, Aronsson CA, Wallstrom P, Sonestedt E, Gullberg B, et al.

Misreporting of energy: prevalence, characteristics of misreporters and influence on observed

risk estimates in the Malmo Diet and Cancer cohort. British Journal of Nutrition.

2005;94(5):832-42.

14. Michael Nelson MA, James Meyer. A Photographic Atlas of Food Portion Sizes. UK:

MAFF publications; 1997.

15. Suzana Shahar NAMY, Nik Shamita Safii, Rafidah Ghazau, Roslina Ahmad. Atlas of

Food Exchanges & Portion Sizes. Kuala Lampur: MDC Publishers; 2009.

16. Perera WDA JP, Thaha SZ, . Tables of food composition for use in Sri Lanka.

Colombo1979.

17. National Agricultural Library. USDA: Foods List. . 2013.

18. Gopalan C RB, Balasubramanian SC, . Nutritive value of Indian foods. Hyderabad:

National Institute of Nutrition; 1989.

19. Welch AA UI, Buss DH, Paul AA, Southgate DAT, . McCance and Widdowson’s The

Composition of Foods. Cambridge: Royal Society of Chemistry; 1995.

20. Dissanayake C. Ceylon Cookery: Stamford Lake (pvt) Ltd. ; 2010.

21. Association AD. Nutrition Recommendations and Interventions for Diabetes: A position

statement of the American Diabetes Association. Diabetes Care. 2008 January 1,

2008;31(Supplement 1):S61-S78.

22. Sevak L, McKeigue PM, Marmot MG. Relationship of hyperinsulinemia to dietary intake

in south Asian and European men. The American Journal of Clinical Nutrition. 1994 May 1,

1994;59(5):1069-74.

23. Kelsay JL, Frazier CW, Prather ES, Canary JJ, Clark WM, Powell AS. Impact of

variation in carbohydrate intake on mineral utilization by vegetarians. Am J Clin Nutr. 1988

Sep;48(3 Suppl):875-9.

24. Jayawardena R, Byrne NM, Soares MJ, Katulanda P, Hills AP. Food consumption of Sri

Lankan adults: an appraisal of serving characteristics. Public Health Nutrition. 2013;16(04):653-

8.

224 Chapter 10: General discussion

25. Garg A, Grundy SM, Unger RH. Comparison of Effects of High and Low Carbohydrate

Diets on Plasma Lipoproteins and Insulin Sensitivity in Patients With Mild NIDDM. Diabetes.

1992 October 1, 1992;41(10):1278-85.

26. Wolever TM, Mehling C. Long-term effect of varying the source or amount of dietary

carbohydrate on postprandial plasma glucose, insulin, triacylglycerol, and free fatty acid

concentrations in subjects with impaired glucose tolerance. Am J Clin Nutr. 2003

Mar;77(3):612-21.

27. Mohan V, Radhika G, Vijayalakshmi P, Sudha V. Can the diabetes/cardiovascular

disease epidemic in India be explained, at least in part, by excess refined grain (rice) intake?

Indian J Med Res. 2010 Mar;131:369-72.

28. Sun Q, Spiegelman D, van Dam RM, Holmes MD, Malik VS, Willett WC, et al. White

rice, brown rice, and risk of type 2 diabetes in US men and women. Arch Intern Med. 2010 Jun

14;170(11):961-9.

29. Popkin BM, Horton S, Kim S, Mahal A, Shuigao J. Trends in diet, nutritional status, and

diet-related noncommunicable diseases in China and India: the economic costs of the nutrition

transition. Nutr Rev. 2001 Dec;59(12):379-90.

30. Hu FB. Globalization of diabetes: the role of diet, lifestyle, and genes. Diabetes Care.

2011 Jun;34(6):1249-57.

31. Salmeron J, Hu FB, Manson JE, Stampfer MJ, Colditz GA, Rimm EB, et al. Dietary fat

intake and risk of type 2 diabetes in women. Am J Clin Nutr. 2001 Jun;73(6):1019-26.

32. van Dam RM, Willett WC, Rimm EB, Stampfer MJ, Hu FB. Dietary fat and meat intake

in relation to risk of type 2 diabetes in men. Diabetes Care. 2002 Mar;25(3):417-24.

33. Ministry of Statistics & Programme Implementation Government of India.

NUTRITIONAL INTAKE IN INDIA 2004-2005. New Delhi 2007 Contract No.: Report No.

513(61/1.0/6).

34. Jayawardena R, Swaminathan S, Byrne N, Soares M, Katulanda P, Hills A. Development

of a food frequency questionnaire for Sri Lankan adults. Nutrition Journal. 2012;11(1):63.

35. Report of a Joint WHO/FAO Expert Consultation. Diet, Nutrition and the prevention of

Chronic Diseases. Geneva 2003.

36. Ismail J, Jafar TH, Jafary FH, White F, Faruqui AM, Chaturvedi N. Risk factors for non-

fatal myocardial infarction in young South Asian adults. Heart. 2004 Mar;90(3):259-63.

37. Amarasiri WA, Dissanayake AS. Coconut fats. Ceylon Med J. 2006 Jun;51(2):47-51.

38. Misra A, Khurana L, Isharwal S, Bhardwaj S. South Asian diets and insulin resistance.

Br J Nutr. 2009 Feb;101(4):465-73.

Chapter 10: General discussion 225

39. Hodge AM, English DR, O’Dea K, Giles GG. Glycemic Index and Dietary Fiber and the

Risk of Type 2 Diabetes. Diabetes Care. 2004 November 1, 2004;27(11):2701-6.

40. Meyer KA, Kushi LH, Jacobs DR, Slavin J, Sellers TA, Folsom AR. Carbohydrates,

dietary fiber, and incident type 2 diabetes in older women. The American Journal of Clinical

Nutrition. 2000 April 1, 2000;71(4):921-30.

41. Chandalia M, Garg A, Lutjohann D, von Bergmann K, Grundy SM, Brinkley LJ.

Beneficial Effects of High Dietary Fiber Intake in Patients with Type 2 Diabetes Mellitus. New

England Journal of Medicine. 2000;342(19):1392-8.

42. Jayawardena R, Ranasinghe P, Galappatthy P, Malkanthi R, Constantine G, Katulanda P.

Effects of zinc supplementation on diabetes mellitus: a systematic review and meta-analysis.

Diabetol Metab Syndr. 2012;4(1):13.

43. Song Y, He K, Levitan EB, Manson JE, Liu S. Effects of oral magnesium

supplementation on glycaemic control in Type 2 diabetes: a meta-analysis of randomized

double-blind controlled trials. Diabet Med. 2006 Oct;23(10):1050-6.

44. Pittas AG, Lau J, Hu FB, Dawson-Hughes B. The role of vitamin D and calcium in type

2 diabetes. A systematic review and meta-analysis. J Clin Endocrinol Metab. 2007

Jun;92(6):2017-29.

45. Harinarayan CV, Ramalakshmi T, Prasad UV, Sudhakar D, Srinivasarao PV, Sarma KV,

et al. High prevalence of low dietary calcium, high phytate consumption, and vitamin D

deficiency in healthy south Indians. Am J Clin Nutr. 2007 Apr;85(4):1062-7.

46. Shivane VK, Sarathi V, Bandgar T, Menon P, Shah NS. High prevalence of

hypovitaminosis D in young healthy adults from the western part of India. Postgrad Med J. 2011

Aug;87(1030):514-8.

47. Brown IJ, Tzoulaki I, Candeias V, Elliott P. Salt intakes around the world: implications

for public health. Int J Epidemiol. 2009 Jun;38(3):791-813.

48. Colditz GA, Manson JE, Stampfer MJ, Rosner B, Willett WC, Speizer FE. Diet and risk

of clinical diabetes in women. Am J Clin Nutr. 1992 May;55(5):1018-23.

49. Ford ES, Mokdad AH. Fruit and vegetable consumption and diabetes mellitus incidence

among U.S. adults. Prev Med. 2001 Jan;32(1):33-9.

50. Sargeant LA, Khaw KT, Bingham S, Day NE, Luben RN, Oakes S, et al. Fruit and

vegetable intake and population glycosylated haemoglobin levels: the EPIC-Norfolk Study. Eur

J Clin Nutr. 2001 May;55(5):342-8.

226 Chapter 10: General discussion

51. Esmaillzadeh A, Kimiagar M, Mehrabi Y, Azadbakht L, Hu FB, Willett WC. Fruit and

vegetable intakes, C-reactive protein, and the metabolic syndrome. Am J Clin Nutr. 2006

Dec;84(6):1489-97.

52. Van Duyn MA, Pivonka E. Overview of the health benefits of fruit and vegetable

consumption for the dietetics professional: selected literature. J Am Diet Assoc. 2000

Dec;100(12):1511-21.

53. Kanungsukkasem U, Ng N, Van Minh H, Razzaque A, Ashraf A, Juvekar S, et al. Fruit

and vegetable consumption in rural adults population in INDEPTH HDSS sites in Asia. Glob

Health Action. 2009;2.

54. Hall JN, Moore S, Harper SB, Lynch JW. Global variability in fruit and vegetable

consumption. Am J Prev Med. 2009 May;36(5):402-9 e5.

55. Aboobakur M, Latheef A, Mohamed AJ, Moosa S, Pandey RM, Krishnan A, et al.

Surveillance for non-communicable disease risk factors in Maldives: results from the first

STEPS survey in Male. Int J Public Health. 2010 Oct;55(5):489-96.

Chapter 10: General discussion 227

APPENDICES

Appendix A FFQ

228 Chapter 10: General discussion

Chapter 10: General discussion 229

230 Chapter 10: General discussion

Chapter 10: General discussion 231

232 Chapter 10: General discussion


Recommended