Rapid Temperature Swing Adsorption using Polymer/Supported Amine Composite Hollow Fibers Christopher W. Jones, Ryan Lively, Yoshiaki Kawajiri, William J. Koros, Matthew Realff, David S. Sholl Georgia Institute of Technology Katherine Searcy Trimeric Inc. Ryan Lively Algenol Biofuels Post-Combustion Sorbent-Based Capture 2014 NETL CO 2 Capture Technology Meeting Sheraton Station Square, Pittsburgh, PA Tuesday, July 29, 2014 DOE Award #: DE-FE0007804
Transcript
Rapid Temperature Swing Adsorption using
Polymer/Supported Amine Composite
Hollow Fibers
Christopher W. Jones, Ryan Lively, Yoshiaki
Kawajiri, William J. Koros, Matthew Realff, David S. Sholl
Georgia Institute of Technology
Katherine Searcy
Trimeric Inc.
Ryan Lively
Algenol Biofuels
Post-Combustion Sorbent-Based Capture
2014 NETL CO2 Capture Technology Meeting
Sheraton Station Square, Pittsburgh, PA
Tuesday, July 29, 2014
DOE Award #: DE-FE0007804
Budget:
DOE contribution:
Year 1: $ 691,955
Year 2: $ 847,672
Year 3: $ 847,006
Total: $2,386,633 (79%)
Cost Share Partners:
GE Energy: $ 420,000
Algenol Biofuels: $ 183,900
Southern Company: $ 33,147
Total: $ 637,047 (21%)
Total Budget: $3,023,680
Project Performance Dates – October 2011 to September 2014
Key Idea:
Combine:
(i) state-of-the-art supported amine
adsorbents, with
(ii) a new contactor tuned to
address specific weaknesses of
amine materials,
to yield a novel process strategy
Ideal temperature swing adsorption
1000 µm
RP Lively et al., Ind. Eng. Chem. Res., 2009, 48, 7314-7324
Bundle of 40 fibers in a
1.5’ module at GT
Hollow Fiber Contactor:
4
RTSA Qualitative Cycle:
Flue gas
CO2/N2
N2
Cooling
water
Cooling water +
sorption enthalpy
Hot water:
140°C
Hot water
N2 sweep
Concentrated CO2
Hot
water:140°C
N2
N2
Cooling
water
Hot water 140°C 55°C
32 s
60 s
10 s
35 s Concentrated CO2
Hollow Fiber Contactor:
Key Experimental Tasks:
1) Spinning of high solid content (50-66 volume%), flexible hollow fibers, using low
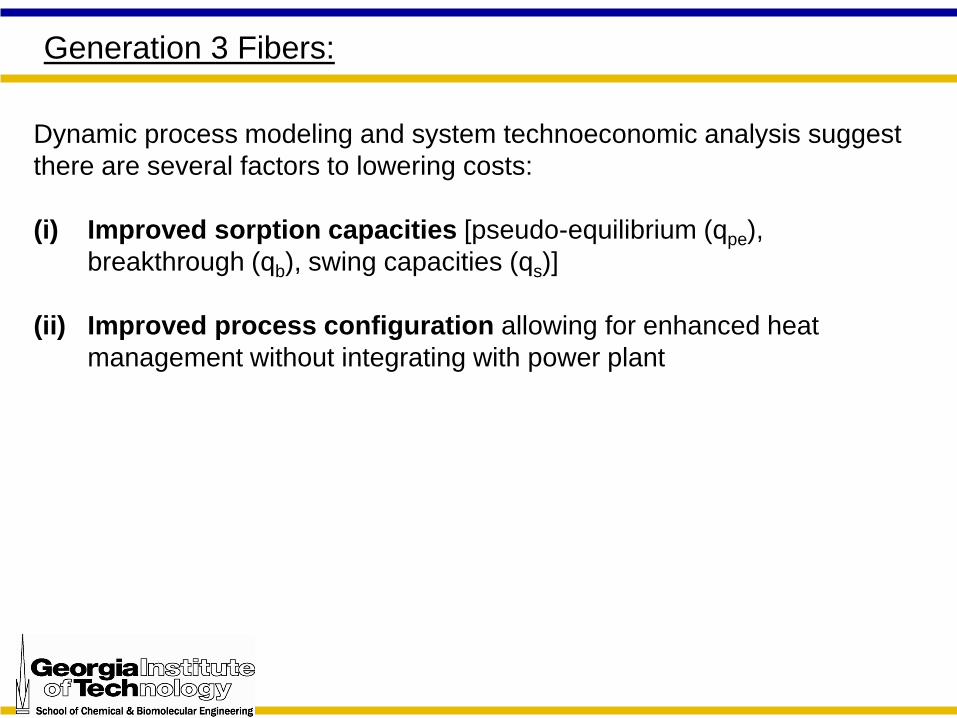
(ii) Improved process configuration allowing for enhanced heat
management without integrating with power plant
(mol/kg fiber) qpe qb qs
Generation 1 fibers: 1.1 0.5 0.30
Generation 2 fibers: 1.5 1.1 0.65
Generation 3 fibers: 2.0 1.3 0.75
(260% increase in qb in 2 years)
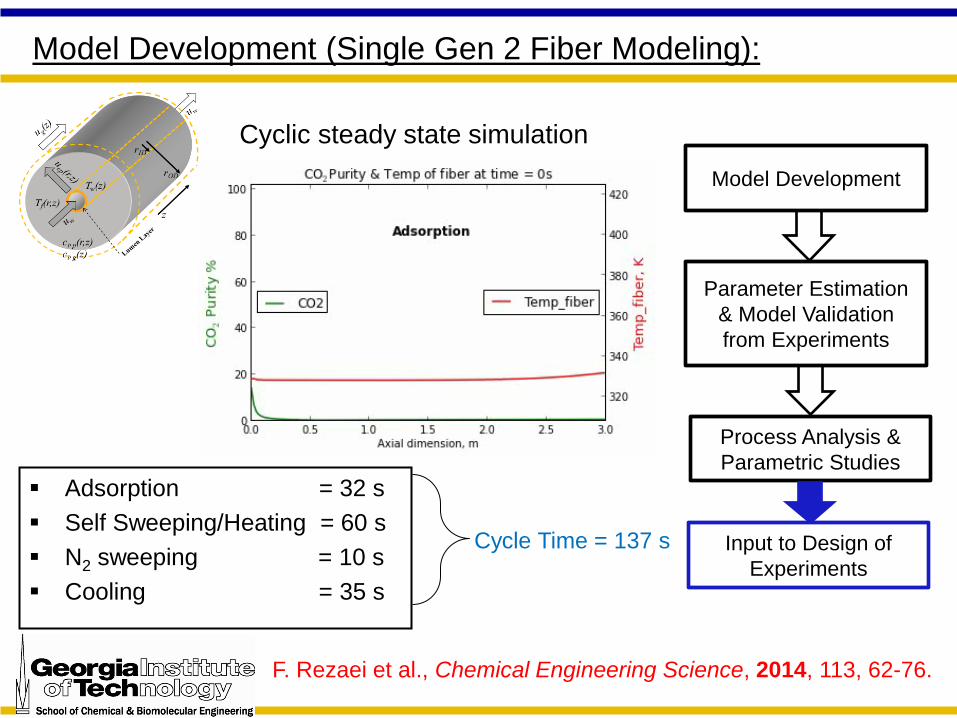
Adsorption = 32 s
Self Sweeping/Heating = 60 s
N2 sweeping = 10 s
Cooling = 35 s
Cycle Time = 137 s
Parameter Estimation
& Model Validation
from Experiments
Process Analysis &
Parametric Studies
Model Development
Input to Design of
Experiments
Model Development (Single Gen 2 Fiber Modeling):
Cyclic steady state simulation
F. Rezaei et al., Chemical Engineering Science, 2014, 113, 62-76.
Model predicts increase in breakthrough capacity due to decrease of mass transfer resistance
Smaller silica particles to be employed experimentally.
Overall mass transfer resistance vs. sorbent size
Process Improvement from Modeling : Effect of Sorbent Size:
Hollow fiber schematic with different mass transfer resistance components
Overall approach:
32 seconds
60
se
co
nd
s
10 seconds
35
se
co
nd
s
Coo
ling
Adsorption
Gas Sweeping
Se
lf-s
we
ep
ing
Cycle Design on Single
Fiber (GT)
Flue Gas
Feed Flue Gas
From FGD
Stack
CO2 to
Injection
CO2 Compression
and Dehydration
Treated Flue
Gas to Stack
KEY TO FLOW LINE COLORS:
RED = Tempered Water System
BLACK = Flue Gas
BROWN = Plant CTW, Plant IP Steam,
and other utility systems
S-101
Trim SO2 Removal
E-101
Trim SO2 Cooler
CWS
CWR
Process
Water
SO2 Removal
Reagent
To Wastewater
Treatment
Fiber Modules in
Adsorption Mode
F-112
Draft Fan 2
Fiber Modules in
Self-sweeping Step
Fiber Modules in
N2-sweeping Step
Fiber Modules in
Cooling Mode
P-102
Trim SO2 Recirculation
Pumps
Notes:
1.Items not shown include:
- Water filtration of closed loop and cooling water
- Details of compression train and CO2
dehydration
- Details of reagent delivery for trim SO2 removal
2. Configuration of inlet gas cooler and
condensate removal is TBD.
Compressor
Stages
Compressor
Scrubbers
After-CoolersE-314
Main
Heater
Co
nd
en
sa
te
EXP-351
Power Recovery
TurbineS-351
Desuperheater
P-351
Condensate
Pump
Condensate
Return to
Hot Well
F-101
Draft Fan 1
E-102
Gas Trim
Cooler
CWR
V-102
Condensate KO
P-506
CO2 Pump
T-303
Hot Water
Tank
P-302
Cool Water
Recirc Pump
Warm Frac
Hot Frac
26.7 C
CWS
E-315
Main
Cooler
CWS
CWR
CWR
130 C
120 C
32 C137 C to
150 C
Cool Frac
35 C15.6 C
26.7 C
Cool Frac
Treated
Flue
Gas
Condensate
LP Steam
Low
Pressure
Steam
T-181
Caustic Tank P-181
Caustic Pump
Condensate
Wastewater
Condensate
To Wastewater
TreatmentP-511
Condensate Pump
Note 4
C-501
C-502
C-503
C-504
C-505
V-501
V-502
V-503
V-504
V-505
E-501
E-502
E-503
E-504
E-505
Dehy
Unit
Warm Frac
P-303
Hot Water
Recirc Pump
T-302
Cool
Water
Tank
CWS
Pre-cooler
15.6 C
32 C
E-500
Fiber Modules in
Cooling Mode
Fiber Modules in
Adsorbing Mode
Fiber Modules in
Self Sweeping Mode
Fiber Modules in
N2 Sweep ModeSweep Gas
Draft Fan
CWS
CWR
Flue Gas
Conditioning
(Cooling, Trim
SO2 Removal)
Flue Gas
From FGD
Cool
Tempered
Water
Steam
Condensate
Warm
Tempered
Water
Inlet Gas
Blower
To CO2
Compression &
Dehydration
To
Stack
Cycle Model Validation
and Scale Up to Module
Level (GT and Trimeric)
Integration with Plant
Design and Escalation for
TEA (Trimeric)
Water Looping for Heat Integration
DOE Metric Calculation. Feedback to
single fiber design and optimization
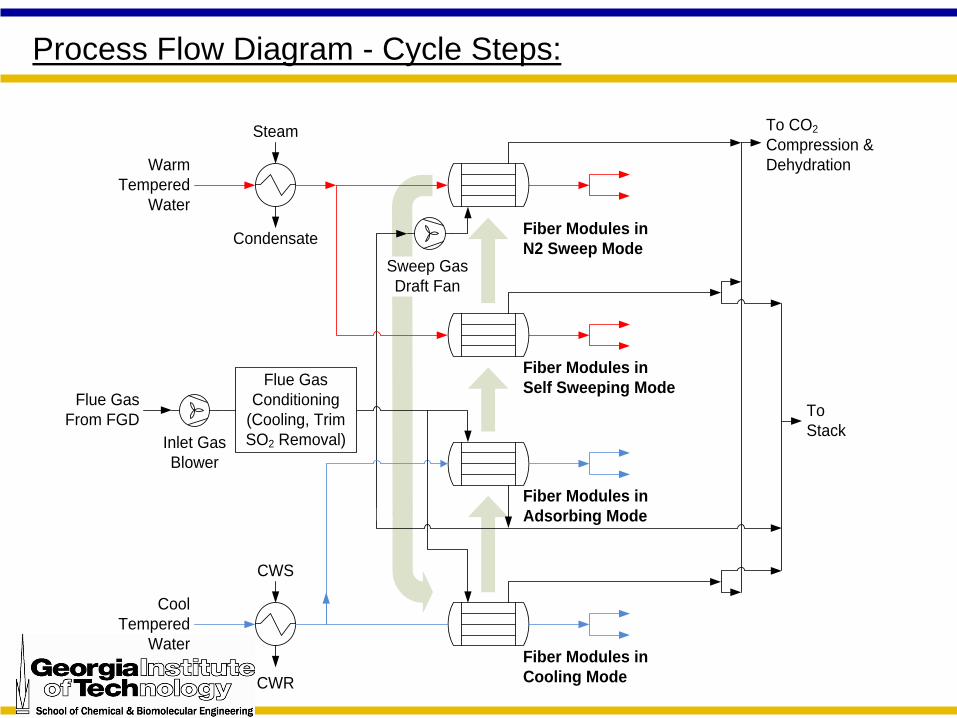
Process Flow Diagram - Cycle Steps:
Fiber Modules in
Cooling Mode
Fiber Modules in
Adsorbing Mode
Fiber Modules in
Self Sweeping Mode
Fiber Modules in
N2 Sweep ModeSweep Gas
Draft Fan
CWS
CWR
Flue Gas
Conditioning
(Cooling, Trim
SO2 Removal)
Flue Gas
From FGD
Cool
Tempered
Water
Steam
Condensate
Warm
Tempered
Water
Inlet Gas
Blower
To CO2
Compression &
Dehydration
To
Stack
CO2 Balance:
CO2 purity of 95% and recovery of 90% per pass
Year 2
Year 3
7%
20%
73%
The current technoeconomic evaluation employs a similar methodology to the first and second year:
• Outputs from cyclic steady state fiber model (e.g., tempered water flow rates and temperatures) were abstracted and used as inputs to steady-state process model
• Heat and material balances were used to size and select equipment
• Capital costs, operating costs, and technoeconomic metrics were calculated according to DOE methodology
Equipment pricing was improved over year 1:
• Equipment cost curves were developed to accommodate more rapid evaluation of process options by overall modeling team.
• Aspen In-plant Cost Estimator replaced PDQ$ as the equipment cost estimating software.
Year 2, CO2 recovery target (93%) was met, but CO2 purity was not (82%).
Year 3, CO2 recovery (90%) and purity targets met, (95%).
Technoeconomic Evaluation Methodology:
DOE Design Basis:
• Specified in solicitation, similar but not identical to DOE baseline reports
• 550 MWe net, 90% CO2 capture• Supercritical steam cycle• Inlet flue gas conditions and composition• Outlet CO2 at 95% purity and 15272 kPa (2215 psia)• Cooling water supply, return, and approach temperatures• Steam delivery conditions:
– IP/LP crossover– 395 C (743 F) and 1156 kPa (168 psia)– Thermal energy penalty of 0.0911 kWh/lb
Energy and Escalation Results Year 3:
Description Units Value
Escalation Factor - 1.532
Energy
Sorption enthalpy MWth 183.2
Sensible heat MWth 1006
Total enthalpy per sorption or desorption step MWth 1190
Main heater duty MWth 550
Main cooler duty MWth -563
Intraprocess heat recovery %
Steam usage kg/h 819000
Derate
Direct Electrical Derate MWe 110.8
Steam Derate MWe 252.6
Steam Turbine Energy Recovery MWe -71.0
Total Derate for CO2 Capture MWe 292
Escalated Capital Costs:
Description Units Year 3 Comments
Total purchased equipment
costs (PEC) MM$ 221.6
1850 modules
Fibers MM$ 135.9 450,000 fibers/module
CO2 capture MM$ 57.6
CO2 compression MM$ 28.1
Process Plant Cost (PPC) MM$ 641.5 PPC = PEC + Direct Costs
Total Plant Cost (TPC)
MM$ 1078.5
TPC = PPC + Engineering +
Process Contingency + Project
Contingency (30%)
Total Plant Investment (TPI) MM$ 1142.6 TPI = TPC + Interest and Inflation
Total Capital Requirement
(TCR) MM$ 1175.3
TCR = TPI + Startup + Initial Fill +
Working Capital + Land + Others
Annual Capital Charge MM$/year 205.7
Technoeconomic Metrics Escalated Case:
Description Units Year 3 Q3
Levelized Costs of Electricity and Steam
Levelized cost of electricity mills/kWh 154
Levelized cost of steam $/1,000 lb 14.0
Cost of CO2 Capture
Total Annual Cost of CO2 Capture MM$/year 303
Impact of CO2 Capture on Plant Efficiency
Net Plant Efficiency without CO2 Capture (HHV) % 39.3
Net Plant Efficiency with CO2 Capture (HHV) % 25.6
Change in Net Plant Efficiency % -11.2
Metrics were calculated using simplified equations specified in the solicitation.
Summary & Future Work:
• Rapid Temperature Swing Adsorption (RTSA) enabled by a new contactor
combined with solid amine sorbents.
• Cycle allows quasi-isothermal adsorption with significant sensible heat
recovery due to nanoscopic shell-tube heat exchanger design.
• Refined Technoeconomic analysis suggests targets for improvement.
-- Current parasitic load, Gen 2 fibers (1.53 escalation factor)
• Refinement Approaches:
-- Gen 3 fibers = 1.43 escalation factor
-- Gen 3 fibers (VTSA, 0.33 bar desorption pressure)
Lower bound steam savings = 30% less heat used
-- Gen 3 fibers (VTSA, 0.33 bar desorption pressure)
Upper bound steam savings = 50% less heat used
-- Multi-bed adsorption
Acknowledgements:
DOE Award #: DE-FE0007804
Algenol Biofuels
GE
Southern Company
Funding
Dr. Ron Chance – Algenol Biofuels
Dr. Ying Labreche – hollow fiber spinning
Dr. Yanfang Fan – experimental system design and testing
Dr. Fateme Rezaei – sorbent synthesis and fiber modeling


![An innovative pressure swing adsorption cycle€¦ · Notable works have been done on temperature swing adsorption co oling systems [8–17], and pressure swing adsorption cooling](https://static.documents.pub/doc/80x56/5fadc53df2ea4919012cf0fc/an-innovative-pressure-swing-adsorption-cycle-notable-works-have-been-done-on-temperature.jpg)


