JOURNAL OF GEOPHYSICAL RESEARCH, VOL. 119, DOI:10.1002/2013JB010448, 2014 Rate- and strain-dependent brittle deformation of rocks N. Brantut 1 , M. J. Heap 2 , P. Baud 2 and P. G. Meredith 1 Abstract. We develop a unifying framework to quantify rate-dependent deformation in the brittle field, and establish links between the microscale time dependent crack growth processes and the macroscopically observed rate dependency. Triaxial deformation experiments have been performed under both constant strain rate and constant stress (creep) conditions, on three types of sandstone. The measured relative evolution of P wave speeds as a function of inelastic ax- ial strain is similar for both types of test, despite differences in strain rate of up to 3 orders of magnitude. This similarity indicates that there exists a direct, time independent link between the microstructural state (as reflected by the variations in P wave speed) and the inelastic ax- ial strain. Comparison of applied stresses between constant strain rate and creep experiments as a function of inelastic strain indicates that creep deformation requires less mechanical work to bring the sample to failure. This energy deficit corresponds to a stress deficit, which can be related to a deficit in energy release rate of the microcracks. We establish empirically that the creep strain rate is given by ˙ e µ exp(DQ/s ⇤ ), where DQ is the stress deficit (negative) and s ⇤ is an activation stress. This empirical exponential relation between creep strain rate and stress deficit is analogous to rate-and-state friction laws. We develop a micromechanical approach based on fracture mechanics to determine the evolution of an effective stress inten- sity factor at crack tips during creep deformation, and estimate the activation volume of the stress corrosion reaction responsible for brittle creep. 1. Introduction Fracturing is the most prevalent deformation mechanism in rocks under upper crustal conditions. Cracks in rocks occur from the grain scale up to the crustal scale. Under all round compressive stress conditions, macroscopic fractures or faults (at the scale of centimeters and above) result from the coalescence of many micro- scopic, grain-scale cracks [Paterson and Wong, 2005]. Slip along preexisting fault zones and discontinuities generally also requires fracturing at local contacts or asperities. Reactivation of ancient, healed fault zones involves refracturing of cemented, cohesive rock masses. Hence, brittle deformation of intact (i.e., cohesive) rocks is expected to be one of the fundamental underlying processes of fault formation, growth, and sliding. Deformation in the crust occurs over a wide range of strain rates, from the very slow rates associated with tectonic loading (of the or- der of 10 -14 s -1 or lower) up to the very fast rates occurring during earthquakes (of the order of 10 3 s -1 or higher). Hence, a complete understanding of fault mechanics requires a detailed knowledge of the time-dependent mechanical behaviour of rocks. Such a knowl- edge should be based on micromechanics but also provide an ade- quate macroscopic description. The goal of this paper therefore is to establish a simple macroscopic description of the rate depen- dency of brittle deformation, and to link it quantitatively to the corresponding microscale processes. To achieve this, a key chal- lenge is the determination of a relationship between the internal or microstructural state of the rock, and macroscopically observable quantities. As stated above, deformation of rocks in the brittle field pro- ceeds by the progressive growth and coalescence of microcracks. Under nominally dry environmental conditions and rapid loading, 1 Rock and Ice Physics Laboratory, Department of Earth Sciences, University College London, London, UK. 2 Laboratoire de Déformation des Roches, Géophysique Expérimentale, Institut de Physique de Globe de Strasbourg (UMR 7516 CNRS, Université de Strasbourg/EOST), Strasbourg, France. Copyright 2014 by the American Geophysical Union. 0148-0227/14/2013JB010448$9.00 crack growth is primarily governed by the applied stresses. Indeed, laboratory experiments show that rock strength is essentially time independent under such conditions [Paterson and Wong, 2005]. At the microscopic scale, time independence means that the crack growth criterion is well modelled by the concept of constant frac- ture toughness, i.e., a critical stress intensity factor at microcrack tips. At lower strain rates and in the presence of aqueous fluids, i.e., under realistic upper crustal conditions, experiments show that rock fracturing becomes time-dependent. This is well demonstrated by the fact that rocks can fail by static fatigue, following a preced- ing period of creep deformation, under conditions of constant ap- plied stress [e.g., Scholz, 1968; Kranz, 1979, 1980; Kranz et al., 1982; Baud and Meredith, 1997; Heap et al., 2009; Brantut et al., 2013b]. Time-dependent crack growth arises from chemically acti- vated subcritical crack growth processes, such as stress corrosion reactions [see Atkinson, 1984]. Establishing quantitative links between microscopic, grain-scale subcritical cracking and macro- scopic, sample-scale to crustal scale brittle creep behaviour is a key challenge for our understanding of the time-dependent mechanics of rocks in the Earth’s crust. Experimental rock deformation provides us with several ways to investigate time-dependent brittle deformation. Two main types of experiments can be distinguished: (1) “constant strain rate” ex- periments in which stress varies as a result of deformation, and (2) “creep” experiments in which deformation and deformation rate vary over time as a result of an imposed constant stress. In the latter case, when a rock is held at constant stress (i.e., both the differential stress, denoted Q, and the effective confining pres- sure, denoted P eff , are maintained constant), it deforms typically in the manner depicted in Figure 1. Three deformation stages have commonly been described, based solely on the observed macro- scopic strain-time behaviour: an initial decelerating stage, termed primary creep, followed by an apparent constant strain rate stage, termed secondary creep, and finally an accelerating tertiary creep stage, after which the sample fails. It is apparent from Figure 1 that the rock experiences a wide range of strain rates as deformation proceeds. Such experiments hence convey very rich information on the time dependency of the brittle deformation process. How- ever, results from brittle creep experiments are usually used to ex- tract only times-to-failure and/or secondary creep strain rates, as functions of the applied differential stress, effective pressure and/or 1
Transcript
JOURNAL OF GEOPHYSICAL RESEARCH, VOL. 119, DOI:10.1002/2013JB010448, 2014
Rate- and strain-dependent brittle deformation of rocks
N. Brantut1, M. J. Heap2, P. Baud2 and P. G. Meredith1
Abstract. We develop a unifying framework to quantify rate-dependent deformation in thebrittle field, and establish links between the microscale time dependent crack growth processesand the macroscopically observed rate dependency. Triaxial deformation experiments have beenperformed under both constant strain rate and constant stress (creep) conditions, on three typesof sandstone. The measured relative evolution of P wave speeds as a function of inelastic ax-ial strain is similar for both types of test, despite differences in strain rate of up to 3 ordersof magnitude. This similarity indicates that there exists a direct, time independent link betweenthe microstructural state (as reflected by the variations in P wave speed) and the inelastic ax-ial strain. Comparison of applied stresses between constant strain rate and creep experimentsas a function of inelastic strain indicates that creep deformation requires less mechanical workto bring the sample to failure. This energy deficit corresponds to a stress deficit, which canbe related to a deficit in energy release rate of the microcracks. We establish empirically thatthe creep strain rate is given by e µ exp(DQ/s⇤), where DQ is the stress deficit (negative)and s⇤ is an activation stress. This empirical exponential relation between creep strain rateand stress deficit is analogous to rate-and-state friction laws. We develop a micromechanicalapproach based on fracture mechanics to determine the evolution of an effective stress inten-sity factor at crack tips during creep deformation, and estimate the activation volume of thestress corrosion reaction responsible for brittle creep.
1. Introduction
Fracturing is the most prevalent deformation mechanism inrocks under upper crustal conditions. Cracks in rocks occur fromthe grain scale up to the crustal scale. Under all round compressivestress conditions, macroscopic fractures or faults (at the scale ofcentimeters and above) result from the coalescence of many micro-scopic, grain-scale cracks [Paterson and Wong, 2005]. Slip alongpreexisting fault zones and discontinuities generally also requiresfracturing at local contacts or asperities. Reactivation of ancient,healed fault zones involves refracturing of cemented, cohesive rockmasses. Hence, brittle deformation of intact (i.e., cohesive) rocksis expected to be one of the fundamental underlying processes offault formation, growth, and sliding.
Deformation in the crust occurs over a wide range of strain rates,from the very slow rates associated with tectonic loading (of the or-der of 10�14 s�1 or lower) up to the very fast rates occurring duringearthquakes (of the order of 103 s�1 or higher). Hence, a completeunderstanding of fault mechanics requires a detailed knowledge ofthe time-dependent mechanical behaviour of rocks. Such a knowl-edge should be based on micromechanics but also provide an ade-quate macroscopic description. The goal of this paper therefore isto establish a simple macroscopic description of the rate depen-dency of brittle deformation, and to link it quantitatively to thecorresponding microscale processes. To achieve this, a key chal-lenge is the determination of a relationship between the internal ormicrostructural state of the rock, and macroscopically observablequantities.
As stated above, deformation of rocks in the brittle field pro-ceeds by the progressive growth and coalescence of microcracks.Under nominally dry environmental conditions and rapid loading,
1Rock and Ice Physics Laboratory, Department of Earth Sciences,University College London, London, UK.
2Laboratoire de Déformation des Roches, GéophysiqueExpérimentale, Institut de Physique de Globe de Strasbourg (UMR7516 CNRS, Université de Strasbourg/EOST), Strasbourg, France.
Copyright 2014 by the American Geophysical Union.0148-0227/14/2013JB010448$9.00
crack growth is primarily governed by the applied stresses. Indeed,laboratory experiments show that rock strength is essentially timeindependent under such conditions [Paterson and Wong, 2005].At the microscopic scale, time independence means that the crackgrowth criterion is well modelled by the concept of constant frac-ture toughness, i.e., a critical stress intensity factor at microcracktips. At lower strain rates and in the presence of aqueous fluids, i.e.,under realistic upper crustal conditions, experiments show that rockfracturing becomes time-dependent. This is well demonstrated bythe fact that rocks can fail by static fatigue, following a preced-ing period of creep deformation, under conditions of constant ap-plied stress [e.g., Scholz, 1968; Kranz, 1979, 1980; Kranz et al.,1982; Baud and Meredith, 1997; Heap et al., 2009; Brantut et al.,2013b]. Time-dependent crack growth arises from chemically acti-vated subcritical crack growth processes, such as stress corrosionreactions [see Atkinson, 1984]. Establishing quantitative linksbetween microscopic, grain-scale subcritical cracking and macro-scopic, sample-scale to crustal scale brittle creep behaviour is a keychallenge for our understanding of the time-dependent mechanicsof rocks in the Earth’s crust.
Experimental rock deformation provides us with several waysto investigate time-dependent brittle deformation. Two main typesof experiments can be distinguished: (1) “constant strain rate” ex-periments in which stress varies as a result of deformation, and (2)“creep” experiments in which deformation and deformation ratevary over time as a result of an imposed constant stress.
In the latter case, when a rock is held at constant stress (i.e., boththe differential stress, denoted Q, and the effective confining pres-sure, denoted Peff, are maintained constant), it deforms typically inthe manner depicted in Figure 1. Three deformation stages havecommonly been described, based solely on the observed macro-scopic strain-time behaviour: an initial decelerating stage, termedprimary creep, followed by an apparent constant strain rate stage,termed secondary creep, and finally an accelerating tertiary creepstage, after which the sample fails. It is apparent from Figure 1 thatthe rock experiences a wide range of strain rates as deformationproceeds. Such experiments hence convey very rich informationon the time dependency of the brittle deformation process. How-ever, results from brittle creep experiments are usually used to ex-tract only times-to-failure and/or secondary creep strain rates, asfunctions of the applied differential stress, effective pressure and/or
1
This version is a "home made" pdf generated from the original LaTeX files, and the formatting differs from the officially published version by AGU. As a consequence, there may be minor editorial differences between this version and the AGU-edited version (e.g., figure numbering, British spelling).
2 BRANTUT ET AL.: RATE-DEPENDENT BRITTLE DEFORMATION
0 5 10 15 200
0.001
0.002
0.003
0.004
0.005
0.006
0.007
time (hours)
axia
l stra
in
10−8
10−7
10−6
10−5
stra
in ra
te (/
s)
Darley Dale sandstonePeff = 30 MPaQ = 134.9 MPa
Figure 1. Typical strain and strain rate vs. time behaviour dur-ing brittle creep. Experiment performed on a cylindrical sampleof Darley Dale sandstone, in a triaxial stress state at an effec-tive pressure of Peff = 30 MPa and a constant differential stressQ = 134.9 MPa.
temperature [see Brantut et al., 2013b, for a review]. The extrac-tion of a single strain rate from a complete nonlinear strain-timecurve evidently obscures the richness and complexity inherent inthe creep process. A more comprehensive approach to understandthe creep process as a whole, including the primary and tertiarycreep stages, remains to be developed.
More generally, if a consistent description of time-dependentbrittle deformation is to be determined, it should explain in a uni-fied manner both creep (constant stress) and constant strain ratedeformation. In a recent theoretical study [Brantut et al., 2012],we used a micromechanical framework to show how the increasingimportance of microcrack interactions with increasing microcracksize could produce the switch from decreasing to increasing crackgrowth rate during deformation at constant stress (i.e., the transi-tion from primary to tertiary creep). It is the same process that isin fact responsible for the existence of a peak stress in deformationexperiments performed at imposed strain rate [Ashby and Sammis,1990]. The specific theoretical approach of Brantut et al. [2012]hence provides a consistent understanding of the rock fracturingprocess as a whole, and in particular establishes a link between theevolution of strain rate during tests at imposed stress and the evo-lution of stress during tests at imposed strain rates. However, themodel of Brantut et al. [2012] is based on strong assumptions aboutthe microcrack geometry, which are appropriate for modelling lowporosity crystalline rocks, but are not necessarily appropriate forother rock microstructures.
In this paper, we aim to establish a unified understanding oftime-dependent mechanical behaviour of rock in the brittle regime,specifically focusing on creep deformation. Our approach is basedon the analysis of a new set of data obtained on a range of sand-stones under triaxial loading conditions. Section 2 summarises thesample materials and experimental techniques used in our study.Then, in section 3, we present new experimental results from elas-tic wave velocity measurements made during both creep and con-stant strain rate deformation. Because elastic wave velocities arevery sensitive to microcrack density and orientation, these resultsallow us to determine how microcracks develop as a function ofthe inelastic deformation of the samples, and hence provide us withan empirical relation between the internal state of the samples andmacroscopically observable quantities such as the inelastic axialstrain. In section 4, we analyse the results of the triaxial defor-mation experiments by comparing, for each increment of changein internal state, the stress and energy required to deform the rock
samples under both creep and constant strain rate conditions. Thisanalysis provides us with an empirical relation between stress andstrain rate which is valid for the whole creep process (and not justduring “secondary” creep). Section 5 is dedicated to the determina-tion of the link between the observed, macroscopic creep law andthe underlying microscale subcritical cracking process. To achievethis, we develop a novel, general methodology that allows the de-termination of empirical micromechanical functions linking the lo-cal effective stress intensity factor at microcrack tips to the appliedstresses. Finally, we discuss the impact and significance of our re-sults in section 6.
2. Experimental methods
2.1. Starting materials and sample preparation
Porous sandstones from Darley Dale (northern England), Ben-theim and Wertheim (Germany) were used. Darley Dale andWertheim sandstones are quartzo-feldspathic; Darley Dale sand-stone contains 66 % quartz, 21 % feldspar, and Wertheim sandstonecontains 58 % quartz and 33 % feldspar. Their average porosity issimilar at around 13 % [Klein and Reuschlé, 2004; Heap et al.,2009]. Bentheim sandstone is composed mostly of quartz (95 %),and its average porosity is 23 % [Baud et al., 2006]. Porosities ofindivudual samples are reported in Table 1. Cylindrical sampleswere prepared by coring sandstone blocks and grinding the ends ofthe cores to ensure parallelism of the two end surfaces (to ±10 µmaccuracy). All the samples were saturated with distilled water forat least 24 hours before testing. All saturated samples were thenjacketed in an impermeable rubber sleeve before insertion into thedeformation apparatus.
2.2. Triaxial deformation experiments
Deformation tests were performed in conventional triaxial appa-ratus at the Experimental Geophysics Laboratory of the Universityof Strasbourg [see full description in Baud et al., 2009], and at theRock and Ice Physics Laboratory of University College London(UCL) [see description in Eccles et al., 2005]. Both machines arecapable of applying servo-controlled axial load, confining pressureand pore fluid pressure. The axial shortening of the samples weremeasured with linear voltage differential transducers (LVDTs) po-sitioned outside the pressure vessel, and the shortening was cor-rected for the deformation of the loading train. All tests were per-formed under drained, constant pore pressure conditions. Pore vol-ume changes were monitored by measuring (with an LVDT) thedisplacement of the actuators applying the servo-controlled porefluid pressure. We use the change in pore volume to estimate thebulk volumetric strain, assuming constant solid volume. A sum-mary of the samples tested and experimental conditions is pre-sented in Table 1. All experiments were performed in the brittleregime, i.e., all samples failed by localised shear faulting.
Two types of experiment were performed. Samples were de-formed either under constant strain rate (e = 10�5 s�1), or underconstant differential stress (creep) conditions. In the latter case, thesamples were initially loaded at constant strain rate (10�5 s�1) un-til the target differential stress was reached. Then, the differentialstress was held constant (using a servo-control system) throughoutthe remainder of the experiment as the sample deformed over time[see Brantut et al., 2013b, for more details].
2.3. Wave velocity measurements
For some targeted deformation tests on Darley Dale sandstone(both creep and constant strain rate), the evolution of elastic wavevelocities with increasing deformation was measured. Here we de-scribe the technique used.
The UCL triaxial apparatus is equipped with 10 piezoelectrictransducers positioned around the sample as shown in Figure 2,connected to a 10 MHz digital recording system. Repeatedly dur-ing the tests, a high voltage (⇠ 100 V), high frequency (⇠ 1 MHz)
BRANTUT ET AL.: RATE-DEPENDENT BRITTLE DEFORMATION 3
Table 1. Summary of the samples tested and experimental conditions. For experiments performed under constant strain rate con-ditions, we report both the imposed strain rate and the observed peak differential stress. For experiments performed under creepconditions, we report the imposed differential stress and time to failure.
Rock type Sample Porosity Peff Strain rate Peak diff. stress Creep diff. stress Time to failure Notes(%) (MPa) (s�1) (MPa) (MPa) (s)
pulse was sent sequentially to each transducer, hence producing amechanical wave with known origin time, while output waveformswere recorded on the 9 remaining transducers. Precise P-wave ar-rival times were extracted from the waveform data by using thecross-correlation technique described by Brantut et al. [2011]; themethod was improved by resampling the cross-correlation resultswith interpolated cubic splines, and the resulting precision on thearrival times was 0.05 µs (i.e., around 0.5% relative error on thewave speed). The arrival times were then used to determine therelative P-wave speed evolution throughout the tests.
The array of transducers, the positions of which are reportedin Figure 2, allowed the determination of P-wave speeds along 4different orientations with respect to the axis of compression: 90�(radial), 39�, 58�, and 28�. For each set of measurements, the rel-ative P wave speeds were fitted to a transversely isotropic elasticmodel, assuming weak anisotropy [Thomsen, 1986]:
V (q) = 12(Vaxial +Vradial)�
12(Vaxial �Vradial)cos(p �2q), (1)
where q is the angle between the compression axis and the ray path,Vaxial is the P wave speed along the compression axis, and Vradial isthe P wave speed perpendicular to the compression axis. Vaxial wasestimated from a least squares inversion of the measured veloci-ties along the 4 available propagation angles. Relation (1) allowedus to fully describe the wave velocities with only two independentparameters, Vaxial and Vradial.
2.4. Inelastic strain calculations
For each test, the sample’s initial Young’s modulus was deter-mined from a fit of the linear part of the differential stress versusaxial strain curves. This allowed the nominal elastic strain at anystress to be determined (i.e., the strain that the intact material wouldhave had at the same level of stress) and subtracted from the total
recorded axial strain to obtain the inelastic axial strain. In this pro-cess, the initial, non-linear deformation (typically of the order of0.02%), which correspond to both sample assembly adjustmentsand closure of preexisiting subhorizontal microcracks within thesample [see David et al., 2012], was also subtracted from the totalinelastic axial strain.
2.5. Strain rate calculations
The recording interval of stress, strain and pore volume was de-liberately varied (within the range 1 s to 1 min) in line with thevery wide range in test durations. Also, the calculation of a timederivative such as strain rate from a discretely recorded signal isnontrivial because high frequency noise is amplified when takingdifferences between successive time steps. We therefore devel-oped a specific method based on Chebyshev interpolation to cir-cumvent this problem. The instantaneous strain rate was estimatedas follows. The creep time was mapped to the interval [�1,1],and the strain-time curve was interpolated on N Chebyshev-Lobattonodes (40 N 100, depending on the total number of initial datapoints). The derivative of strain with respect to the normalised timewas then obtained by multiplying the N ⇥N Chebyshev differen-tiation matrix by the vector formed with the N interpolated points[details of the method and computation can be found in Trefethen,2000]. The strain rate was finally obtained by mapping back thetime from the normalised [�1,1] interval to the real creep time inseconds (i.e., from 0 to the time to failure), and reinterpolated onall the recorded time steps. This last stage does not improve thequality of the strain rate estimates, but is useful to enable all thevariables (stress, strain, etc.) to be correlated within a single timescale.
3. Inelastic strain as a proxy for internal state
4 BRANTUT ET AL.: RATE-DEPENDENT BRITTLE DEFORMATION
–180 –90 0 90 180angle (°)
50
25
75
100
dept
h (m
m)
steel backingand coaxialconnection
PZT crystal
aluminuminsert
molded viton jacket
rock sample
0
Figure 2. (left) Isometric view of the sample and sample jacket used in the UCL system. Sample diameter is 40 mmand length is 100 mm. Ten acoustic transducers were mounted on molded inserts in the jacket. Unused inserts wereblanked with aluminum plugs. (right) Map of sensor positions around the sample.
In this study we want to compare stresses and strain rates be-tween creep (constant applied stress) and constant applied strainrate tests. Such a comparison is meaningful only if it is performedfor samples at the same microstructural state. We thus need todetermine a physical quantity that reflects the overall microstruc-tural state of the samples, and that we can measure systematicallythroughout our experiments. In the brittle regime, evolution ofthe microstructural state during deformation corresponds primar-ily to the growth of dilatant microcracks between or inside thegrains [e.g. Scholz, 2002; Paterson and Wong, 2005]. Becausethey are traction-free internal surfaces, such microcracks have astrong influence on the elastic wave speeds of rocks [e.g., Sayersand Kachanov, 1995; Fortin et al., 2007]. Hence, by monitoringthe evolution of elastic wave speeds during deformation under bothcreep and constant strain rate conditions, we have an indirect mea-sure of the microstructural state of the samples (i.e., microcrackdensity and orientation). Here, we present the wave speed mea-surements performed during selected experiments, and use them todetermine how inelastic axial strain can be used as a convenientproxy for microstructural state.
Figure 3 shows the evolution of the measured P wave speeds, infour different orientations with respect to the axis of compression,as a function of total axial strain, for one constant strain rate exper-iment (a) and two creep experiments (b and c) performed on DarleyDale sandstone at Peff = 40 MPa (samples dd-c2-09, dd-c2-13 anddd-c2-34 in Table 1). The initial P wave speed at Peff = 40 MPabefore deformation is around 4.3 ± 0.1 km s�1. The evolutionof P wave speed with increasing axial deformation follows a wellknown pattern [e.g. Ayling et al., 1995], which appears to be com-mon to both types of test. The radial P wave speed (circle symbols)monotonically decreases with increasing axial deformation. Con-comitantly, the P wave speeds measured along lower angles to thecompression axis, namely 58� (squares), 39� (diamonds) and 28�(triangles), initially increase at the onset of axial deformation, andsubsequently decrease after around 0.6% axial strain. The totaldecrease in P wave speed is larger along the radial direction thanalong the subaxial directions. This evolution is typical of rocks thatcrack progressively under compression [Paterson and Wong, 2005,Chapter 5]: when the differential stress is applied, the rock ini-tially behaves elastically, with subradial cracks closing (hence the
0 0.01 0.023.8
3.9
4
4.1
4.2
4.3
4.4
axial strain
VP (k
m/s
)
cst. strain rate10−5 s−1
(a)0 0.01 0.02
axial strain
creepQ = 157 MPa
(b)
Darley Dale sandstone, Peff = 40 MPa
0 0.01 0.020
30
60
90
120
150
180
axial strain
Q (M
Pa)
creepQ = 154.7 MPa
(c)
Figure 3. Differential stress (red) and evolution of P wave speeds as a function of total axial strain during triaxialdeformation tests performed on Darley Dale sandstone at Peff = 40 MPa, under constant strain rate (a), and creep(b and c). Dotted lines in (b) anc (c) mark the start of creep. Symbols corresponds to the various orientations withrespect to the axis of compression: 90� (radial; circles), 58� (squares), 39� (diamonds) and 28� (inverted triangles).Sample reference numbers are, from left to right: dd-c2-09, dd-c2-13, and dd-c2-34, respectively (see Table 1).
BRANTUT ET AL.: RATE-DEPENDENT BRITTLE DEFORMATION 5
initial increase in subaxial P wave speeds), while subaxial cracksbegin to open. Then, when the stress threshold for crack propaga-tion is reached, i.e., after some amount of axial strain, cracks openpreferentially in the subaxial direction (hence the large decrease inthe radial P wave speed). We hence observe the development of acrack-induced anisotropy.
Comparison of Figures 3a, b and c reveals not only that the qual-itative evolution of the P wave speeds is similar for both creep andconstant strain rate deformation conditions, but also that the quan-titative changes in P wave speeds (aside from some variability inthe initial values) are remarkably similar. Despite several ordersof magnitude difference in times-to-failure (and therefore in strainrate), the rate of decrease in P wave speed per unit of axial strainappears to be similar for all three tests. This observation suggeststhat axial strain is a potential proxy for the microstructural state ofthe samples. However, a significant part of the total axial straincorresponds to the elastic deformation of the specimen, and hencedifferences in applied differential stress from one experiment to an-other will generate differences in axial strain that are not due solelyto crack growth. This introduces a bias that can be avoided by pro-cessing the data to remove the elastic strain, which leads us to usethe inelastic axial strain as our proxy for microstructural state.
Figure 4 shows a synoptic plot of the evolution of the calculatednormalised axial and radial P wave speed as a function of inelasticaxial strain for the same three experiments. The wave-speed varia-tions are normalised by the initial wave speed prior to deformationat the appropriate confining pressure. Remarkably, despite the widerange of strain rates (from 10�5 s�1 down to 6.910�8 s�1) and thedifferent experimental conditions (imposed constant strain rate orapplied stress), the relative change of P wave speed is quantitativelyvery similar for all the tests. This similarity in the evolution of Pwave speeds with inelastic strain between the three tests impliesthat the microstructural state of the samples can be considered tobe a simple function of the amount of inelastic axial strain.
We note that while we consider this interpretation to be validover the range of strain rates and stresses investigated here, it willnot necessarily be valid for other arbitrary stresses, strains andstrain rates. In general, the constitutive behaviour of cracked ma-terials is path dependent, i.e., the stress versus strain response de-pends on the material’s deformation history. This is all the moretrue since the main micromechanism of deformation is cracking,
which is irreversible under the ambient temperature conditions ofour tests.
Despite these limitations, for the range of stress conditions in-vestigated here, the wave velocity data show that the inelastic strainis an appropriate proxy for the microstructural state of the samples.
4. Energy deficit and creep strain rates
0 0.001 0.002 0.003 0.004 0.005 0.006−12
−8
−4
0
4
inelastic axial strain
∆V
P/VP0
(%) axial
radial
Darley Dale sandstone, Peff = 40 MPa
Figure 4. Relative evolution of P wave speed along the axis ofcompression (black) and perpendicular to the axis of compres-sion (red) as a function of the inelastic axial strain. Solid linescorrespond to a constant strain rate (10�5 s�1) experiment (dd-c2-09), dashed lines and dotted lines correspond to creep exper-iments performed under 154.7 MPa (dd-c2-34) and 157.0 MPa(dd-c2-13) differential stress, respectively. The minimum strainrates achieved during the creep tests were 4.510�7 s�1 and6.910�8 s�1, respectively. Experiments performed on DarleyDale sandstone under 40 MPa effective pressure.
0 0.002 0.004 0.006 0.008 0.010 0.0120
50
100
150
inelastic axial strain
diff
eren
tial s
tress
(MPa
)
Darley Dale sandstonePeff = 30 MPa
cst. strain rate (10−5 s−1)creep
0.002 0.004 0.006 0.008 0.010130
135
140
145
150
inelastic axial strain
diff
eren
tial s
tress
(MPa
)
−∆Q = −∂∆Wp/∂εp
∆Wp
Figure 5. Differential stress versus inelastic axial strain for two samples of Darley Dale sandstone deformed at30 MPa effective pressure. One sample was deformed at constant strain rate (grey line), and one sample was de-formed at constant stress (black line), after a preliminary loading stage at constant strain rate. (right) An expandedview of the portion of the curves marked by the dashed rectangle in the left panel. The grey area corresponds to thestrain energy deficit of creep deformation.
6 BRANTUT ET AL.: RATE-DEPENDENT BRITTLE DEFORMATION
In the previous section we established that the inelastic axialstrain is a relevant proxy for the microstructural state of the sam-ples. In this section we make use of this tool to investigate how thecreep strain rate evolution is related to the applied creep stress andto the stress applied (for the same microstructural state) in constantstrain rate experiments.
4.1. Comparison of creep and constant strain rate data
Figure 5 shows the differential stress (denoted Q) as a functionof the inelastic axial strain for one creep experiment (in black) andone constant strain rate experiment (in grey) performed on DarleyDale sandstone at 30 MPa effective pressure. As expected, the be-haviour is the same during the loading stage, since the imposed con-dition (constant strain rate of 10�5 s�1) is the same. In the creep ex-periment, once the creep stress is reached, the stress is maintainedconstant. By contrast, the stress keeps evolving during the constantstrain rate experiment. In the latter case, the differential stress firstincreases until it reaches a peak (around 147 MPa) at 0.005 inelasticaxial strain; it then decreases gradually. No macroscopic dynamicstress drop occurred, since the machine stiffness is high enough toprevent runaway deformation in the strain-weakening regime. Af-ter 0.01 inelastic strain, the stress applied to the sample under creepconditions could no longer be maintained as the deformation rateincreased dramatically (the sample experienced tertiary creep, seeFigure 1).
A striking observation is that the sample deformed under con-stant stress fails macroscopically (i.e., the deformation rate started
0 0.002 0.004 0.006 0.008−15
−10
−5
0
5
inelastic axial creep strain
ΔQ
(MPa
)
Darley Dale sandstone, Peff = 30 MPa
0 0.002 0.004 0.006 0.00810−8
10−7
10−6
10−5
10−4
inelastic axial creep strain
cree
p st
rain
rate
(/s)
Figure 6. (top) Stress deficit DQ (see Figure 5 for a graphicaldefinition) and (bottom) creep strain rate as a function of the in-elastic axial creep strain for Darley Dale sandstone at 30 MPaeffective pressure.
to increase in an uncontrollable manner) when the two curves (con-stant strain rate and constant stress) intersect each other. For thewhole range of inelastic strain experienced by the samples in bothtests, we can calculate the difference DQ between the differentialstress applied during creep (which is constant) and the differen-tial stress applied during deformation at constant strain rate. Creepstarts at DQ = 0, and then becomes negative as the creep stress re-mains below the stress applied during constant strain rate deforma-tion, and we observe in Figure 5 that creep deformation becomesunstable when the stress difference returns to DQ = 0.
Figure 6 shows the evolution of both the stress difference DQand the creep strain rate (on a log scale) as a function of the inelas-tic axial creep strain. There is a remarkable similarity between thetwo curves. Several fundamental observations can be made. First,the creep strain rate is never constant, in qualitative agreement withthe recent micromechanical model of Brantut et al. [2012]. Sec-ond, the minimum creep strain rate is achieved when the stress dif-ference is largest (most negative), i.e., when the differential stressis at the peak during the constant strain rate test.
These observations are presented in a more synoptic manner inFigure 7 for all three sandstones tested at 10 MPa effective stress,by directly plotting the creep strain rates (normalised by the con-stant strain rate of 10�5 s�1) as a function of the stress difference.In the graphs of Figure 7, each curve has two branches: one (solidlines) corresponds to decreasing strain rate, and the other one (dot-ted lines) corresponds to increasing strain rate. The two branchesare not perfectly superimposed, and for the case of Bentheim sand-stone, the accelerating branch is not straight in the log-linear plot.We also note that some curves do not start at DQ = 0 at the on-set of creep (for a normalised strain rate close to 1). This can beattributed to the natural variability between the samples deformedunder constant strain rate and creep conditions, which produces adeviation of the stress-strain curves during the loading stage. Inother words, the stress-strain curves are not always perfectly super-imposed during the loading stage. Nevertheless, we generally ob-serve the following: (1) the minimum strain rate is systematicallyachieved for the minimum DQ; (2) the logarithm of the creep strainrate is proportional to the stress difference (at least in the decreas-ing strain rate branch); and (3) the coefficient of proportionality forthe decreasing strain rate branch is well reproducible for a givenrock type. These observations can be summarised in the followingempirical equation:
ecreep/e0 ⇡ exp(DQ/s⇤), (2)
where ecreep is the instantaneous brittle creep strain rate, e0 is thestrain rate applied during the constant strain rate test (equal to10�5 s�1), and s⇤ is a characteristic “activation” stress that givesthe stress dependency of the creep strain rate. The activation stresss⇤ can be determined from the decreasing strain rate branches ofall the available curves, and ranges from 1.0 to 1.4 MPa for DarleyDale sandstone, from 0.8 to 1.2 MPa for Bentheim sandstone, andfrom 2.2 to 2.7 MPa for Wertheim sandstone.
We note that the transition from the decelerating branch to theaccelerating branch in Figure 7 is equivalent to the peak stress ina constant strain rate experiment, and is therefore also likely to beassociated with the onset of localisation of deformation onto a faultplane.
4.2. Effect of confining pressure
The procedure described above was repeated for a set of experi-ments performed on Darley Dale sandstone under effective pres-sures ranging from 10 to 40 MPa. The results are compiled inFigure 8, which again shows the normalised creep strain rate asa function of the stress difference.
The empirical exponential relation between strain rate and stressdifference (equation (2)) holds for all the effective pressures inves-tigated. Notably, the activation stress s⇤ does not seem to dependupon effective pressure in any systematic manner: s⇤ is around
BRANTUT ET AL.: RATE-DEPENDENT BRITTLE DEFORMATION 7
−10 −5 010−4
10−3
10−2
10−1
100
∆Q (MPa)
norm
alis
ed c
reep
stra
in ra
teDarley Dale
−10 −5 0∆Q (MPa)
Bentheim
−15 −10 −510−9
10−8
10−7
10−6
10−5
∆Q (MPa)
cree
p st
rain
rate
(/s)
Wertheim
Figure 7. Creep strain rate as a function of the stress difference DQ for all three sandstones tested at 10 MPa effectivepressure. For each rock type, each shade of red corresponds to one creep experiment, compared to the same referenceconstant strain rate test (see text for details). The solid lines correspond to the evolution of strain rate and DQ beforethe strain rate reaches its minimum, whereas the dotted lines correspond to the evolution after the minimum strainrate is passed.
1.0 MPa at Peff = 10 MPa (see above), 1.2 MPa at Peff = 20 MPa,2.2 MPa at Peff = 30 MPa, and 1.6 MPa at Peff = 40 MPa. Thesevalues are within the range determined above for all the sandstonestested at Peff = 10 MPa.
4.3. Energy deficit
In the previous sections we established a macroscopic, empiri-cal description of time-dependent brittle deformation of the testedsandstones samples: we discovered that the strain rate was an expo-nential function of the stress deficit and that the confining pressurewas apparently not quantitatively influencing this relation. Here weuse a thermodynamic approach to understand the origin of our em-pirical description, and what it implies in terms of the energetics ofbrittle deformation.
The inelastic strain energy (which we define here as the irrecov-erable work associated with the inelastic deformation) input to arock sample under triaxial conditions is
W p =Z ep
ax
0Qdep
ax +Z ep
vol
0Peffdep
vol, (3)
where epax is the inelastic axial strain, ep
vol is the inelastic volumetricstrain, Q is the differential stress, and Peff is the effective confiningpressure. Under both constant strain rate and creep conditions, weconsider that the inelastic volumetric strain evolution is quantita-tively similar (within the natural sample variability and the preci-sion of our experimental equipment; see Appendix A and Figure14). Hence, for a pair of experiments performed under creep andconstant strain rate conditions, we can define an inelastic strain en-ergy difference as
DW p =Z ep
ax
0DQdep
ax, (4)
where DQ is the stress difference, or stress deficit, defined previ-ously. The inelastic strain energy difference is negative, since DQ isnegative: thus it corresponds to an energy deficit between the creepand constant strain rate deformation. The absolute value of the en-ergy deficit is shown in Figure 5 (right) as the shaded area betweenthe creep and constant strain rate stress-strain curves. Deformationby brittle creep, at constant applied stress, generally requires lessenergy than deformation at an imposed (faster) constant strain rate.The energy deficit is likely to correspond to a decreased dissipa-tion in the case of slower, creep deformation: dissipation includesthermal energy generation, friction at grain contacts, and radiation
of elastic waves (in the form of acoustic emissions, as shown byBrantut et al. [2013a]).
From equation (4) we note that the inelastic strain energy dif-ference DW p is simply the integral of the stress difference DQ; inother words,
DQ =∂DW p
∂epax
. (5)
Hence, the stress difference simply corresponds to a difference inenergy release rate per unit of inelastic axial strain. If we formallyintroduce an internal state variable H, which symbolically encap-sulates the microstructural state of the rock (see Rice [1975]), thenwe can rewrite DQ as:
DQ =∂H∂ep
ax
∂DW p
∂H, (6)
where ∂DW p/∂H is the difference in strain energy release rate perunit of internal state variable H and ∂H/∂ep
ax is the change of stateH per unit of inelastic axial strain. The definition of ∂DW p/∂H isanalogous to a difference in fracture energy release rate. More pre-cisely, if H is viewed as an average microcrack length within thesample, then ∂DW p/∂H is simply the difference between the aver-age fracture energy release rates between the pair of rock samples[Rice, 1975]. In that case, ∂H/∂ep
ax simply corresponds to the rateof crack extension per unit of inelastic axial strain.
In section 3 we showed how the inelastic axial strain is a well-defined, monotonic function of the microstructural state, which wehave now formally introduced as an internal state variable H. If wedenote
H 0 =∂H∂ep
ax, and (7)
DW p0 =∂DW p
∂H, (8)
then we can recast the empirical relation between creep strain rateand stress difference as
Hcreep
H0⇡
⇥∂ep
ax/∂H⇤
0⇥∂ep
ax/∂H⇤
creep| {z }⇡1
exp
H 0DW p0
s⇤
!. (9)
In equation (9), Hcreep and H0 denote the evolution of the inter-nal state variable H with time under constant stress (creep) and
8 BRANTUT ET AL.: RATE-DEPENDENT BRITTLE DEFORMATION
constant strain rate conditions, respectively. The prefactor of theexponential should be close to 1 since we have already establishedthat the inelastic axial strain is a good measure of the internal mi-crostructural state of the samples, and in particular the crackingstate (Figure 4). Considering that H is analogous to a crack growthrate (i.e., it is a rate of change of the internal state), relation (9) isthen analogous to well known subcritical crack growth laws, whichare of the form [e.g. Freiman, 1984; Wan et al., 1990]
v µ exp✓� bK
RT
◆, or (10)
v µ exp✓�b0G
RT
◆, (11)
where v is the crack growth rate, R is the gas constant, T is theabsolute temperature, G is the fracture energy at the crack tip, K isthe stress intensity factor at the crack tip (generally mode I), and band b0 are constitutive parameters describing the sensitivity of thecrack growth rate to K and G, respectively.
The comparison between equations (9) and (11) indicates thatthe activation stress s⇤ should reflect the parameter b0/RT , whichgives the sensitivity of crack growth rate to variations in crack tipenergy release rate. Because the stress intensity factor K is a lin-ear function of the applied stresses, the same observation can bemade (b0/RT being replaced by b/RT ) if we compare equations(2) and (10). These analogies also shows that the activation stressis a combination of the subcritical cracking parameters and a term(e.g., H 0) linking the internal state evolution (e.g., crack length) tothe macroscopically averaged quantity (here, inelastic strain).
Despite the generality of our approach, the practical use of a re-lation like (9) is limited by our poor knowledge, in practice, of thecorrect general meaning of H. Hence, the precise relation betweenDW p0 and, say, the actual energy release rate of the microcrackswithin the rock sample is poorly constrained.
5. Extraction of microscale processes
In the previous section we established an empirical exponentialrelation between strain rate and stress deficit during creep deforma-tion, and showed that such a relation should be linked to small-scalesubcritical crack growth laws. In this section we develop a morespecific framework, based on fracture mechanics, which will allowus to determine precisely a link between the macroscopic stress de-pendency parameter of creep strain rate (the activation stress s⇤)and microscale subcritical crack growth parameters.
−15 −10 −5 010−4
10−3
10−2
10−1
100
∆Q (MPa)
norm
alis
ed c
reep
stra
in ra
te
Darley Dale sandstone
10
2030
40
Figure 8. Creep strain rate normalised by a constant strain rateof 10�5 s�1 as a function of the stress difference DQ for a set ofexperiments performed on Darley Dale sandstone under effec-tive pressures ranging from 10 to 40 MPa.
5.1. Empirical micromechanical functions
One way to determine a precise link between the activationstress s⇤ and the subcritical crack growth parameter b is to makeseveral assumptions as regards the micromechanics of brittle defor-mation. In brittle materials, a common method to establish macro-scopic stress-strain relations from microscale processes is to as-sume that deformation is only due to microcrack closure, sliding,and growth [see Paterson and Wong, 2005, Chapter 6]. Furtherassuming that the solid matrix of the rock remains purely elastic,the crack growth criterion can be written in terms of the stress in-tensity factor, calculated from Linear Elastic Fracture Mechanics(LEFM). At the microscopic level, microcrack growth is mostly inmode I, since cracks that nucleate in other modes do not grow intheir own planes and quickly become pure mode I cracks alignedwith the maximum principal stress [e.g. Nemat-Nasser and Horii,1982]. Following LEFM, a generic form for the mode I stress in-tensity factor, denoted KI, in triaxial conditions, is
KIppc
= a(l)Q+b (l)Peff, (12)
where c is a characteristic microcrack or flaw length (generallycommensurate with the grain size) and a(l) and b (l) are two non-linear functions of the mode I microcrack size l. The expressionfor KI in (12) is in terms of macroscopically applied stresses Q andPeff, and hence it effectively corresponds to an averaged, represen-tative KI. Such an expression would be rigorously exact if all themicrocracks had the same size and geometry.
In conventional micromechanical approaches, one makes pre-cise assumptions about the microcrack geometry with respect tothe applied stresses, and explicit formulations of the functions a(l)and b (l) can then be established. This is the case, for instance,in the “wing crack” model of Ashby and Sammis [1990] for tri-axial conditions (further developed for generalised stress states byDeshpande and Evans [2008]; Bhat et al. [2011]). However, theassumptions about the crack size and geometry are generally veryrestrictive; even then, some simplifications have to be made in orderto access analytical formulations of KI in terms of crack length andstresses. Such ab initio micromechanical models are complex, andneed the introduction of numerous, sometimes poorly constrained,microscopic parameters.
Here we adopt a different approach, based directly on experi-mental data. Instead of looking for a simplified, tractable microc-rack geometry, we will attempt to determine in the most direct waythe functions a(l) and b (l), by inverting experimental data.
5.2. Determination of KI evolution
In order to determine the evolution of an effective KI duringthe experiments, we need to invert for the evolution of a and bat all stages (i.e., as a function of an effective microcrack lengthl) throughout deformation. Here again we make use of the ob-servation that inelastic axial strain is a reasonable proxy for themicrostructural state of the samples, where microstructural state isnow identified relative to an effective crack length l.
We now consider that, during the deformation tests performedat a constant strain rate of 10�5 s�1, the imposed deformation is sofast that the microcracks grow at speeds much higher than the typ-ical subcritical crack growth rates, and therefore the crack growthcriterion is essentially determined by the time independent fracturetoughness. Equivalently, we can also consider that an imposed de-formation rate induces a constant crack growth rate and thereforethat KI remains constant during such tests. In all cases, we as-sume that the effective stress intensity factor is close to the fracturetoughness of the material (KIC) for the samples deformed at con-stant (“fast,” 10�5 s�1) strain rate. KIC is a material constant, equalto 1 MPa m1/2 for pure quartz in wet conditions [Atkinson, 1984].Using this constant value for KI in equation (12), we see that thefunctions a
ppc and b
ppc can be obtained as functions of the in-
elastic axial strain by inverting the evolution of differential stress Q
BRANTUT ET AL.: RATE-DEPENDENT BRITTLE DEFORMATION 9
Figure 9. (left) Differential stress as a function of inelastic axial strain for Darley Dale sandstone samples deformed atconstant strain rate (10�5 s�1), for effective pressures ranging from 10 to 30 MPa (numbers indicated on the curves).Experimental data are shown in black, and least squares fits to equation (12) with KI = KIC = 1 MPa m�1/2 are shownin red. (right) Corresponding evolution of a
ppc and b
ppc with inelastic axial strain.
at various effective pressures Peff during constant strain rate tests.The inversion is performed by a least squares method on the dataobtained at Peff = 10, 20, and 30 MPa. The fits are shown for Dar-ley Dale sandstone in Figure 9 (left), and the resulting empiricalmicromechanical functions a
ppc and b
ppc are shown in Figure
9 (right).The function a , which corresponds to the effect of differential
stress (i.e., a measure of the average shear stress) on the effectivestress intensity factor, is always positive: as expected, larger dif-ferential stress tend to increase KI at crack tips. During deforma-tion, a remains almost constant, only increasing slightly at inelasticstrain larger than 1%. The function b , which quantifies the effect ofeffective pressure on the effective stress intensity factor, is alwaysnegative: this is also expected, since larger confining pressures tendto close cracks and decrease KI. b decreases continuously with in-creasing inelastic deformation. This is also consistent with basicfracture mechanics concepts: large cracks tend to be easier to close(i.e., KI is more sensitive to closing stresses).
We are now in possession of an empirical micromechanicalmodel which allows us to link an effective stress intensity factorto the applied stresses and to a microscopic state variable (here, aneffective crack length, which is well reflected by the inelastic ax-ial strain). Using the inverted values of the functions a and b , we
0 0.002 0.004 0.006 0.008−0.2
−0.15
−0.1
−0.05
0
inelastic axial creep strain
KI −
KIC
(MPa
m1/
2 )
Darley Dale sandstonePeff = 30 MPaQ = 134.9 MPa
Figure 10. KI deficit as a function of inelastic axial creep strainfor a Darley Dale sandstone (sample dds13 in Table 1) deformedunder creep conditions.
are then able to apply the model to our creep experiments, duringwhich the effective stress intensity factor is not constant. Specif-ically, we can relate the stress deficit DQ to a difference betweenthe creep stress intensity factor and the fracture toughness (or a “KIdeficit”):
KI �KIC = a(l)p
pcDQ. (13)
Since the factor a(l)p
pc remains almost constant for inelastic de-formation below 1% (see Figure 9), the KI deficit is in fact approx-imately proportional to the stress deficit. Therefore, the evolutionof the effective KI �KIC with inelastic strain, shown in Figure 10,actually mirrors the evolution of DQ, which is shown in Figure 6.This evolution is qualitatively similar to that obtained by Brantutet al. [2012] from a theoretical micromechanical model, in whichan analytical expression for a(l) and b (l) was used (based on thewing crack geometry of Ashby and Sammis [1990]). The initial de-crease in KI in Figure 10 can be attributed to the progressive crackextension under overall compressive stress, up to the point wheremicrocrack interactions become dominant and any further crack ex-tension produces an increase in KI.
−0.1 −0.08 −0.06 −0.04 −0.02 0
10−3
10−2
10−1
100
KI − KIC (MPa m1/2)
norm
alis
ed c
reep
stra
in ra
te
BentheimPeff = 10 MPa
b/RT = 75
Figure 11. Normalised creep strain rate as a function ofKI � KIC for Bentheim sandstone experiments performed atPeff = 10 MPa. Only the data from the onset of creep to theminimum strain rate were used.
10 BRANTUT ET AL.: RATE-DEPENDENT BRITTLE DEFORMATION
−0.2 −0.15 −0.1 −0.05 0
10−3
10−2
10−1
100
KI − KIC (MPa m1/2)
norm
alis
ed c
reep
stra
in ra
te
Darley DalePeff = 10 MPa
b/RT = 55
−0.2 −0.15 −0.1 −0.05 0
10−3
10−2
10−1
100
KI − KIC (MPa m1/2)
norm
alis
ed c
reep
stra
in ra
te
Darley DalePeff = 20 MPa
b/RT = 44
−0.2 −0.15 −0.1 −0.05 0
10−3
10−2
10−1
100
KI − KIC (MPa m1/2)
norm
alis
ed c
reep
stra
in ra
te
Darley DalePeff = 30 MPa
b/RT = 28
−0.2 −0.15 −0.1 −0.05 0
10−3
10−2
10−1
100
KI − KIC (MPa m1/2)
norm
alis
ed c
reep
stra
in ra
te
Darley DalePeff = 40 MPa
b/RT = 36
Figure 12. Normalised creep strain rate as a function of KI �KIC for Darley Dale sandstone experiments performedat Peff ranging from 10 to 40 MPa. Only the data from the onset of creep to the minimum strain rate were used.
The relation between the normalised creep strain rate and KI �KIC is shown in Figures 12 and 11 for the available data on Dar-ley Dale sandstone and Bentheim sandstone, respectively. In theseFigures, the strain rate data beyond the minimum strain rate (i.e.,beyond the peak stress in the constant strain rate experiments) havebeen omitted, to emphasize the portion of the experiments duringwhich the strain is not yet localised along a fault plane (and hence ismore representative of an effective stress intensity factor and cracksize).
5.3. Interpretation
As shown and discussed in section 3, the inelastic strain is asimple function of the microstructural state (see Figure 4), and weneglect the load-path dependence of the constitutive response of thematerial. In that framework, the normalised creep strain rate (ratioof creep strain rate to the reference constant strain rate) is simplyproportional to the ratio of crack growth rates of the creep and con-stant strain rate experiments. Hence, the graphs in Figures 12 and11, obtained under conditions of triaxial compression, are equiva-lent to the KI � v curves that have been obtained in tensile singlecrack tests [e.g. Atkinson, 1984].
Using the subcritical crack growth relation given by Freiman[1984],
v µ exp✓�bKI
RT
◆, (14)
we determine the values of the parameter b/RT by calculating theaverage slope of the curves in the log linear plots of Figures 12 and11. The factor b/RT (in units of MPa�1m�1/2) ranges from 28 to55 for Darley Dale sandstone and is 75 for the available Bentheimsandstone data. There does not seem to be any consistent trendwith effective confining pressure: this is entirely as expected, sinceequation (13) indicates that confining pressure does not play any
role in the relation between the stress deficit and the difference instress intensity factors. This arises because the contribution of con-fining pressure is the same in both the creep and constant strain ratetests, so that using the stress deficit suppresses the explicit pressuredependence. The range of variation of b/RT can be attributed tothe accumulated errors in the data processing: inversion of a andb , processing to obtain inelastic strain, and offsets in stresses dueto sample variability.
Based on reaction rate theory, Wiederhorn et al. [1980] andFreiman [1984] expressed the subcritical cracking parameter b as
b = (pd)�1/2DV ‡, (15)
where d is a length scale that depends on the crack tip struc-ture (which can be approximated to the crack tip radius of cur-vature) and DV ‡ is the activation volume of the chemical reac-tion producing crack growth (for quartz, most likely stress corro-sion; see [Atkinson, 1984]). Choosing a d value of the order of1 nm, combined with the b values determined from the experimen-tal data, we calculate activation volumes ranging from 3.9⇥ 10�6
to 10.5 ⇥ 10�6 m3 mol�1. These values are of the same orderof magnitude as the molar volume of quartz, which is consis-tent with the concept of stress corrosion by local hydrolysis ofSiO bonds at crack tips. In addition, despite the relative scatterbetween experiments, this range is clearly compatible with doc-umented activation volumes for stress corrosion reactions [e.g.,around 2⇥10�6 m3 mol�1 for stress corrosion of soda-lime glassin water Freiman, 1984].
6. Discussion and Implications
BRANTUT ET AL.: RATE-DEPENDENT BRITTLE DEFORMATION 11
6.1. A general method of analysis: Empirical micromechanical
functions
In section 5.2, we established a general methodology that al-lows the determination of an effective KI throughout a deforma-tion test, using only macroscopic observations. The application ofthis method requires that there exists an appropriate macroscopi-cally measurable proxy for crack length (in our case, inelastic ax-ial strain) in order to make meaningful comparisons between testsconducted under different conditions. Then, the only assumptionrequired is that fast deformation occurs with KI ⇡ KIC at microc-rack tips. If at least two stress-strain curves are available for twodifferent effective pressures, the empirical micromechanical func-tions can be determined using relation (12).
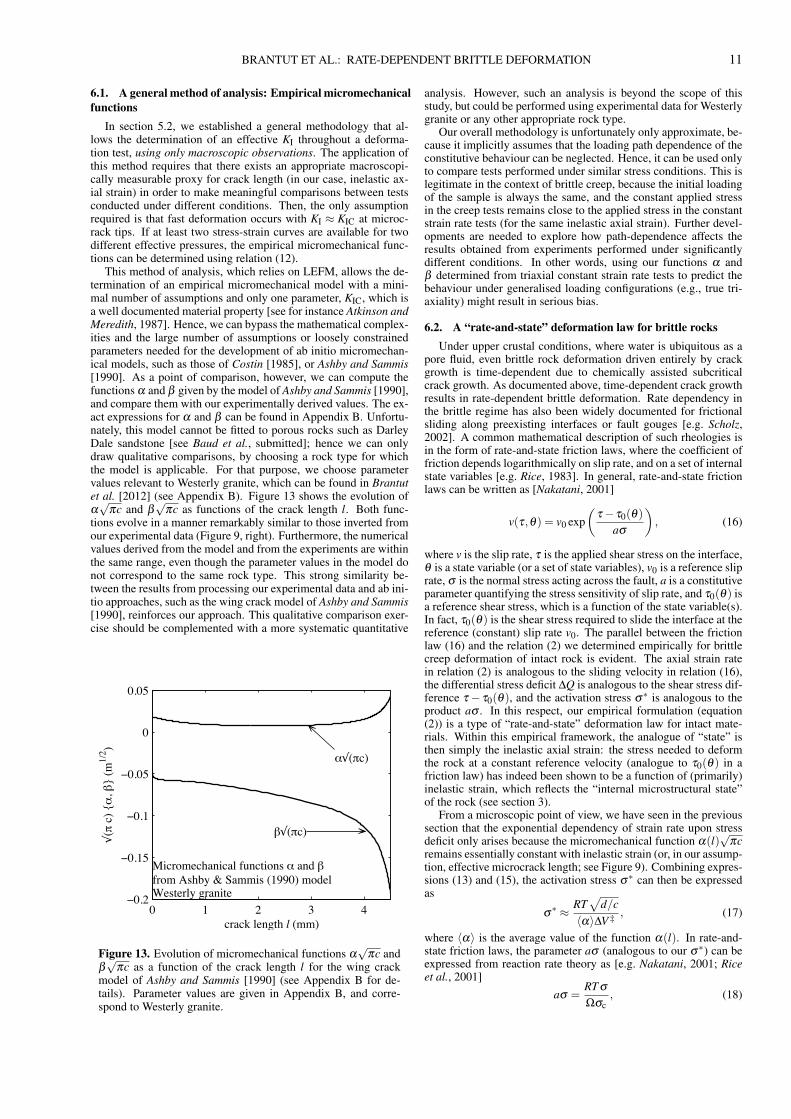
This method of analysis, which relies on LEFM, allows the de-termination of an empirical micromechanical model with a mini-mal number of assumptions and only one parameter, KIC, which isa well documented material property [see for instance Atkinson andMeredith, 1987]. Hence, we can bypass the mathematical complex-ities and the large number of assumptions or loosely constrainedparameters needed for the development of ab initio micromechan-ical models, such as those of Costin [1985], or Ashby and Sammis[1990]. As a point of comparison, however, we can compute thefunctions a and b given by the model of Ashby and Sammis [1990],and compare them with our experimentally derived values. The ex-act expressions for a and b can be found in Appendix B. Unfortu-nately, this model cannot be fitted to porous rocks such as DarleyDale sandstone [see Baud et al., submitted]; hence we can onlydraw qualitative comparisons, by choosing a rock type for whichthe model is applicable. For that purpose, we choose parametervalues relevant to Westerly granite, which can be found in Brantutet al. [2012] (see Appendix B). Figure 13 shows the evolution ofap
pc and bp
pc as functions of the crack length l. Both func-tions evolve in a manner remarkably similar to those inverted fromour experimental data (Figure 9, right). Furthermore, the numericalvalues derived from the model and from the experiments are withinthe same range, even though the parameter values in the model donot correspond to the same rock type. This strong similarity be-tween the results from processing our experimental data and ab ini-tio approaches, such as the wing crack model of Ashby and Sammis[1990], reinforces our approach. This qualitative comparison exer-cise should be complemented with a more systematic quantitative
Figure 13. Evolution of micromechanical functions ap
pc andbp
pc as a function of the crack length l for the wing crackmodel of Ashby and Sammis [1990] (see Appendix B for de-tails). Parameter values are given in Appendix B, and corre-spond to Westerly granite.
analysis. However, such an analysis is beyond the scope of thisstudy, but could be performed using experimental data for Westerlygranite or any other appropriate rock type.
Our overall methodology is unfortunately only approximate, be-cause it implicitly assumes that the loading path dependence of theconstitutive behaviour can be neglected. Hence, it can be used onlyto compare tests performed under similar stress conditions. This islegitimate in the context of brittle creep, because the initial loadingof the sample is always the same, and the constant applied stressin the creep tests remains close to the applied stress in the constantstrain rate tests (for the same inelastic axial strain). Further devel-opments are needed to explore how path-dependence affects theresults obtained from experiments performed under significantlydifferent conditions. In other words, using our functions a andb determined from triaxial constant strain rate tests to predict thebehaviour under generalised loading configurations (e.g., true tri-axiality) might result in serious bias.
6.2. A “rate-and-state” deformation law for brittle rocks
Under upper crustal conditions, where water is ubiquitous as apore fluid, even brittle rock deformation driven entirely by crackgrowth is time-dependent due to chemically assisted subcriticalcrack growth. As documented above, time-dependent crack growthresults in rate-dependent brittle deformation. Rate dependency inthe brittle regime has also been widely documented for frictionalsliding along preexisting interfaces or fault gouges [e.g. Scholz,2002]. A common mathematical description of such rheologies isin the form of rate-and-state friction laws, where the coefficient offriction depends logarithmically on slip rate, and on a set of internalstate variables [e.g. Rice, 1983]. In general, rate-and-state frictionlaws can be written as [Nakatani, 2001]
v(t,q) = v0 exp✓
t � t0(q)as
◆, (16)
where v is the slip rate, t is the applied shear stress on the interface,q is a state variable (or a set of state variables), v0 is a reference sliprate, s is the normal stress acting across the fault, a is a constitutiveparameter quantifying the stress sensitivity of slip rate, and t0(q) isa reference shear stress, which is a function of the state variable(s).In fact, t0(q) is the shear stress required to slide the interface at thereference (constant) slip rate v0. The parallel between the frictionlaw (16) and the relation (2) we determined empirically for brittlecreep deformation of intact rock is evident. The axial strain ratein relation (2) is analogous to the sliding velocity in relation (16),the differential stress deficit DQ is analogous to the shear stress dif-ference t � t0(q), and the activation stress s⇤ is analogous to theproduct as . In this respect, our empirical formulation (equation(2)) is a type of “rate-and-state” deformation law for intact mate-rials. Within this empirical framework, the analogue of “state” isthen simply the inelastic axial strain: the stress needed to deformthe rock at a constant reference velocity (analogue to t0(q) in afriction law) has indeed been shown to be a function of (primarily)inelastic strain, which reflects the “internal microstructural state”of the rock (see section 3).
From a microscopic point of view, we have seen in the previoussection that the exponential dependency of strain rate upon stressdeficit only arises because the micromechanical function a(l)
ppc
remains essentially constant with inelastic strain (or, in our assump-tion, effective microcrack length; see Figure 9). Combining expres-sions (13) and (15), the activation stress s⇤ can then be expressedas
s⇤ ⇡RTp
d/chaiDV ‡ , (17)
where hai is the average value of the function a(l). In rate-and-state friction laws, the parameter as (analogous to our s⇤) can beexpressed from reaction rate theory as [e.g. Nakatani, 2001; Riceet al., 2001]
as =RT sWsc
, (18)
12 BRANTUT ET AL.: RATE-DEPENDENT BRITTLE DEFORMATION
where W is the activation volume of the physical (or chemical) pro-cess responsible for sliding at asperities, and sc is the local stressacting on the microscale asperities. Using typical values for a ob-tained from experimental data, Rice et al. [2001] determined acti-vation volumes W of the order of the molar volume of quartz. Thisclearly parallels our results for DV ‡. Whether the microscale, ther-mally activated process responsible for rate-dependent friction isactually the same as the one responsible for subcritical cracking(for quartz, most likely stress corrosion reactions) remains unclear.This discussion goes far beyond the scope of this paper, and ex-tensive future work on this subject is needed to investigate if thisparallel between time-dependent friction and time-dependent de-formation of intact rock results from a common physical mecha-nism.
Nevertheless, the semiempirical formulation (2) can be seen asa useful description of the rate dependency of deformation in thebrittle regime. This relation is also directly comparable to that ofLockner [1998], which was determined for Westerly granite basedon the most complete data set existing for a single rock type. Lock-ner [1998] included an explicit, empirical description for the non-linearity of the stress-strain behaviour at constant strain rate (i.e.,our reference curves at 10�5 s�1). In our analysis, we bypass thisissue by introducing the concept of stress deficit. Our methodologyallows for a very simple treatment of the time dependency, whichcan be applied routinely to typical triaxial experiments. The deter-mination of the activation stress only requires two experiments: oneat fast, constant strain rate, and one under constant stress conditions(at the same effective pressure). Then, once s⇤ is known, equation(2) can be used to make reasonable predictions of times-to-failureand creep strain rates. Note that the only major problem with usingthis method for making predictions is that sample variability cansignificantly offset the strain rates, and hence the time to-failure, asshown for instance in Figure 6. The problem of sample variability,or, equivalently, the variability in initial microstructural state (seeBrantut et al. [2013b]), remains the main issue for precise predic-tions in natural materials such as rocks.
The validity of equation (2) for strength predictions under dif-ferent imposed constant strain rates could potentially be checkedagainst triaxial data obtained over a range of strain rates. If appliedto estimate the strength (or, more precisely, the stress deficit) ofa rock under deformation at constant strain rates slower than thereference strain rate (10�5 s�1), Equation (2), according to our es-timates for s⇤, would predict a decrease in strength of a few mega-pascals per decade of strain rate. Again, because of natural samplevariability, such small variations in strength would be rather diffi-cult to observe consistently in a data set obtained at different im-posed constant strain rates. A more reliable methodology wouldbe to perform strain rate steps during tests, similarly to the veloc-ity steps typically performed during friction experiments. Such anapproach will be tested and assessed in future work.
7. Conclusions
We performed triaxial experiments on three types of sand-stone, and compared the results obtained under constant strain rate(10�5 s�1) and creep (constant stress) conditions. The evolution ofP wave speeds as a function of inelastic axial strain is the same inboth types of test, despite differences in strain rates of up to threeorders of magnitude. This similarity indicates that inelastic axialstrain is an appropriate proxy for the microstructural state of thesamples, under both creep and constant strain rate conditions.
The comparison of differential stress versus inelastic straincurves for both types of test reveals that creep deformation requiresless mechanical work to bring the sample to failure. This energydeficit corresponds to a stress deficit, which can be related to adeficit in energy release rate for the cracks, or, equivalently, to adeficit in crack tip stress intensity factors. The evolution of strainduring creep tests is well described, empirically, by an exponen-tial of the stress deficit. This description introduces an activation
stress s⇤ that can be easily quantified by measuring the slope of thelogarithm of strain rate versus stress deficit curves. An interestingparticular consequence of these observations is that the creep strainrate is in fact never constant. The so-called secondary creep stage issimply an inflexion period, during which strain rate remains closeto or at its minimum for an extended period of time.
Based on linear fracture mechanics, and the assumption thatcrack growth is the dominant deformation mechanism, we devel-oped a method to estimate the evolution of an effective stress inten-sity factor at crack tips during creep deformation. The estimatedevolution mirrors the evolution of the stress deficit. Further assum-ing that the relation between crack size and inelastic strain rate isapproximately linear before peak stress is reached, we determineda relation between crack growth rate v and stress intensity factorKI. By analysing the slope of those KI � v curves using the stresscorrosion law of Freiman [1984], we determined an activation vol-ume for the stress corrosion reaction responsible for brittle creep inour samples. This activation volume is of the same order of mag-nitude as the molar volume of quartz, and is close to the activationvolumes determined independently from typical subcritical crackgrowth tests [Freiman, 1984].
The exponential relation between strain rate and stress deficitdetermined for brittle deformation of intact rocks has the same formas rate-and-state friction laws which relate slip rate to applied shearstress on an interface. The stress dependency of slip rate in rate-and-state friction laws arises from thermally activated processes[e.g. Nakatani, 2001; Rice et al., 2001] which have an activationvolume very similar to the one determined in our analysis for stresscorrosion cracking. This similarity opens the way for further stud-ies aimed at establishing the precise the relation between fractureof intact rocks and friction along rock interfaces.
Acknowledgments. N.B. is grateful to Harsha Bhat for useful discus-sions and especially clarifying some thermodynamical aspects of brittle de-formation. We thank reviewer Hiroyuki Noda and Associate Editor ReidCooper for their useful comments. The authors also thank Thierry Reuschléfor his contribution in setting up the triaxial equipment in Strasbourg. Partof this research was funded by UK NERC grant NE/G016909/1 to P.G.M.
Figure 14. Inelastic volumetric strain as a function of inelasticaxial strain for a creep test (in black) and a constant strain ratetest (in grey) performed at 30 MPa effective pressure.
BRANTUT ET AL.: RATE-DEPENDENT BRITTLE DEFORMATION 13
Here we compare the evolution of inelastic volumetric strain asa function of inelastic axial strain for both constant strain rate andcreep experiments. The inelastic volumetric strain was calculatedfrom the porosity change of the samples (measured with a porevolumometer), corrected from the drained modulus estimated inthe elastic part of the differential stress versus volumetric strain be-haviour. Figure 14 shows the inelastic volumetric strain as a func-tion of inelastic axial strain for two experiments performed on Dar-ley Dale sandstone at 30 MPa effective pressure, under constantstrain rate (grey) and creep (black) conditions. The evolution isremarkably similar between the two experimental conditions. Forthe case of creep, the volumetric strain oscillates near the referencecurve of the constant strain rate experiment. This oscillation canbe attributed to thermal effects (the experiment was conducted overseveral days). These thermal effects affect most of our creep data,and cannot be easily corrected. For the purpose of this study, weconsider therefore that the inelastic volumetric strain does not sig-nificantly differ from one test to another when the effective pressureconditions are the same.
Appendix B: Wing crack model
In the approach of Ashby and Sammis [1990], rocks are mod-elled as an elastic material containing initial flaws oriented at 45�from the axis of compression. Under increasing differential stress,the flaws extend and generate “wing” cracks, which are mode Icracks oriented parallel to the axis of compression. Interactionsbetween cracks is taken into account in a global manner, by bal-ancing the crack extension force and the force exerted by confiningpressure onto the uncracked ligaments between the wing crack ele-ments. In this approach, the internal state parameter can be identi-fied to the wing crack length (or, equivalently, the wing crack den-sity). The details of the approach and calculations are not reportedhere, and readers are referred to Ashby and Sammis [1990]; Desh-pande and Evans [2008]; Bhat et al. [2011]; Brantut et al. [2012]for developments on the subject. The mode I stress intensity factorat the tips of the wing cracks is expressed as [Ashby and Sammis,1990]
KIppc
=�A1Q+(A1 �A3)Peff
��c1(l)+ c2(l)
�� c3(l)Peff, (B1)
where
A1 = pr
B3�q
1+µ2 +µ�, A3 = A1
p1+µ2 +µp1+µ2 �µ
,
c1(l) = p�2(l/c+B)�3/2,
c2(l) = 2(pg)�2(l/c)1/2/[r�2/30 � (1+ l/(gc))2],
c3(l) = (2/p)(l/c)1/2.
In the preceding equations, l is the wing crack length, B is anondimensional factor, µ is the friction coefficient on the initialflaws, g = sin(45�), and r0 is the initial flaw density. For West-erly granite, the parameter values are as follows [Brantut et al.,2012]: B = 1.1459, µ = 0.7, r0 = 0.0028, and the initial flaw sizeis c = 1.1 mm. From equation (B1) we obtain the following ex-pressions for a(l) and b (l):
a(l) = A1�c1(l)+ c2(l)
�, (B2)
b (l) = (A1 �A3)�c1(l)+ c2(l)
�� c3(l). (B3)
References
Ashby, M. F., and C. G. Sammis, The damage mechanics of brittle solids incompression, Pure Appl. Geophys., 133(3), 489–521, 1990.
Atkinson, B. K., Subcritical crack growth in geological materials, J. Geo-phys. Res., 89(B6), 4077–4114, 1984.
Atkinson, B. K., and P. G. Meredith, The theory of subcritical crack growthwith applications to minerals and rocks, in Fracture mechanics of rock,edited by B. K. Atkinson, pp. 111–116, Academic Press, London, 1987.
Ayling, M. R., P. G. Meredith, and S. A. F. Murrell, Microcracking duringtriaxial deformation of porous rocks monitored by changes in rock phys-ical properties, I. Elastic-wave propagation measurements on dry rocks,Tectonophysics, 245, 205–221, 1995.
Baud, P., and P. G. Meredith, Damage accumulation during triaxial creep ofDarley Dale sandstone from pore volumometry and acoustic emission,Int. J. Rock Mech. Min. Sci., 34(3–4), 368, 1997.
Baud, P., V. Vajdova, and T.-F. Wong, Shear-enhanced compaction andstrain localization: Inelastic deformation and constitutive modelingof four porous sandstones, J. Geophys. Res., 111, B12401, doi:10.1029/2005JB004101, 2006.
Baud, P., S. Vinciguerra, C. David, A. Cavallo, E. Walker, and T. Reuschlé,Compaction and failure in high porosity carbonates: Mechanical dataand microstructural observations, Pure Appl. Geophys., 166, 869–898,2009.
Baud, P., T.-F. Wong, and W. Zhu, Effects of porosity and crack density oncompressive strength of rocks, Int. J. Rock Mech. Min. Sci., submitted.
Bhat, H. S., C. G. Sammis, and A. J. Rosakis, The micromechanics of West-erly granite at large compressive loads, Pure Appl. Geophys., 168(12),1–18, 2011.
Brantut, N., A. Schubnel, and Y. Guéguen, Damage and rupture dynamicsat the brittle-ductile transition: the case of gypsum, J. Geophys. Res.,116, B01404, doi:10.1029/2010JB007675, 2011.
Brantut, N., P. Baud, M. J. Heap, and P. G. Meredith, Micromechan-ics of brittle creep in rocks, J. Geophys. Res., 117, B08412, doi:10.1029/2012JB009299, 2012.
Brantut, N., P. Baud, M. J. Heap, and P. G. Meredith, Mechanics of time-dependent deformation in crustal rocks, in Poromechanics V, edited byC. Hellmich, B. Pichler, and D. Adam, pp. 407–414, American Societyof Civil Engineers, doi:10.1061/9780784412992.048, 2013a.
Brantut, N., M. J. Heap, P. G. Meredith, and P. Baud, Time-dependentcracking and brittle creep in crustal rocks: A review, J. Struct. Geol.,52, 17–43, 2013b.
Costin, L. S., Damage mechanics in the post-failure regime, Mech. Mat., 4,149–160, 1985.
David, E. C., N. Brantut, A. Schubnel, and R. W. Zimmerman, Sliding crackmodel for nonlinearity and hysteresis in the uniaxial stress-strain curveof rock, Int. J. Rock Mech. Min. Sci., 52, 9–17, 2012.
Deshpande, V. S., and A. G. Evans, Inelastic deformation and energy dis-sipation in ceramics: A mechanism-based constitutive model, J. Mech.Phys. Solids, 56, 3077–3100, 2008.
Eccles, D., P. R. Sammonds, and O. C. Clint, Laboratory studies of electri-cal potential during rock fracture, Int. J. Rock Mech. Min. Sci., 42(7-8),933–949, 2005.
Fortin, J., Y. Guéguen, and A. Schubnel, Effects of pore collapse andgrain crushing on ultrasonic velocities and vp/vs, J. Geophys. Res., 112,B08207, doi:10.1029/2005JB004005, 2007.
Freiman, S. W., Effects of chemical environments on slow crack growth inglasses and ceramics, J. Geophys. Res., 89(B6), 4072–4076, 1984.
Heap, M. J., P. Baud, P. G. Meredith, A. F. Bell, and I. G. Main, Time-dependent brittle creep in Darley Dale sandstone, J. Geophys. Res., 114,B07203, doi:10.1029/2008JB006212, 2009.
Klein, E., and T. Reuschlé, A pore crack model for the mechanical be-haviour of porous granular rocks in the brittle deformation regime, Int.J. Rock Mech. Min. Sci., 41(6), 975–986, 2004.
Kranz, R. L., Crack growth and development during creep in Westerly gran-ite, Int. J. Rock Min. Mech. Sci., 16, 23–35, 1979.
Kranz, R. L., The effects of confining pressure and stress difference on staticfatigue of granite, J. Geophys. Res., 85(B4), 1854–1866, 1980.
Kranz, R. L., W. J. Harris, and N. L. Carter, Static fatigue of granite at200�C, Geophys. Res. Lett., 9(1), 1–4, 1982.
Lockner, D. A., A generalized law for brittle deformation of Westerly gran-ite, J. Geophys. Res., 103(B3), 5107–5123, 1998.
Nakatani, M., Conceptual and physical clarification of rate and state fric-tion: Frictional sliding as a thermally activated rheology, J. Geophys.Res., 106(B7), 13,347–13,380, 2001.
Nemat-Nasser, S., and H. Horii, Compression-induced nonplanar crack ex-tension with application to splitting, exfoliation, and rockburst, J. Geo-phys. Res., 87(B8), 6805–6821, 1982.
Paterson, M. S., and T. F. Wong, Experimental Rock Deformation – TheBrittle Field, 2nd ed., Springer-Verlag, Berlin Heidelberg, 2005.
Rice, J. R., Continuum mechanics and thermodynamics of plasticity in re-lation to microscale deformation mechanisms, in Constitutive Equationsin Plasticity, edited by A. S. Argon, pp. 23–75, MIT Press, Cambridge,MA, 1975.
14 BRANTUT ET AL.: RATE-DEPENDENT BRITTLE DEFORMATION
Rice, J. R., Constitutive relations for fault slip and earthquake instabilites,Pure Appl. Geophys., 121(3), 443–475, 1983.
Rice, J. R., N. Lapusta, and K. Ranjith, Rate and state dependent fric-tion and the stability of sliding between elastically deformable solids,J. Mech. Phys. Solids, 49, 1865–1898, 2001.
Sayers, C., and M. Kachanov, Microcrack-induced elastic wave anisotropyof brittle rocks, J. Geophys. Res., 100(B3), 4149–4156, 1995.
Scholz, C. H., Experimental study of the fracturing process in brittle rocks,J. Geophys. Res., 73(4), 1447–1454, 1968.
Scholz, C. H., The Mechanics of Earthquake and Faulting, 2nd ed., Cam-bridge University Press, Cambridge, United Kingdom, 2002.
Trefethen, L. N., Spectral methods in MATLAB, vol. 10, Society for Indus-trial Mathematics, 2000.
Wan, K.-T., S. Lathabai, and B. R. Lawn, Crack velocity functions andthresholds in brittle solids, J. Eur. Ceram. Soc., 6, 259–268, 1990.
Wiederhorn, S. M., E. R. Fuller, and R. Thomson, Micromechanisms ofcrack growth in ceramics and glasses in corrosive environments, Met.Sci., 14, 450–458, 1980.
N. Brantut and P. G. Meredith, Rock and Ice Physics Laboratory, Depart-ment of Earth Sciences, University College London, Gower Street, LondonWC1E 6BT, UK. ([email protected])
P. Baud and M. J. Heap, Laboratoire de Géophysique Expérimentale,Institut de Physique de Globe de Strasbourg (UMR 7516 CNRS, Univer-sité de Strasbourg/EOST), 5 rue René Descartes, 67084 Strasbourg cedex,France