24
Prepared by Aon Benfield Analytics Rate Monitor Report and Quarterly U.S. Property & Casualty Profitability Analysis Fourth Quarter 2016

Prepared by Aon Benfield Analytics
Rate Monitor Report and Quarterly U.S. Property & Casualty Profitability Analysis Fourth Quarter 2016
Aon Benfield | Analytics | Market Analysis Proprietary & Confidential 2
Table of Contents
Section 1 Rate trends
Section 2 Quarterly performance metrics and analysis
Section 3 Year-To-Date (YTD) performance metrics and analysis
Section 4 Additional information
Aon Benfield | Analytics | Market Analysis Proprietary & Confidential 3
Rate Trends – 4th Quarter 2016
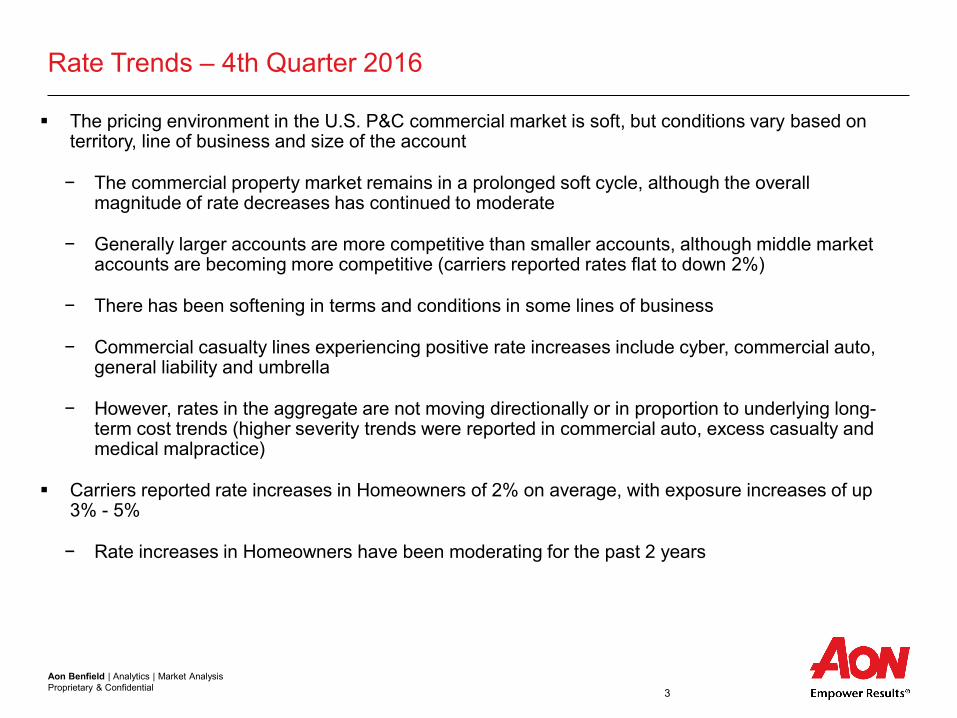
The pricing environment in the U.S. P&C commercial market is soft, but conditions vary based on territory, line of business and size of the account
− The commercial property market remains in a prolonged soft cycle, although the overall magnitude of rate decreases has continued to moderate
− Generally larger accounts are more competitive than smaller accounts, although middle market accounts are becoming more competitive (carriers reported rates flat to down 2%)
− There has been softening in terms and conditions in some lines of business
− Commercial casualty lines experiencing positive rate increases include cyber, commercial auto, general liability and umbrella
− However, rates in the aggregate are not moving directionally or in proportion to underlying long-term cost trends (higher severity trends were reported in commercial auto, excess casualty and medical malpractice)
Carriers reported rate increases in Homeowners of 2% on average, with exposure increases of up 3% - 5%
− Rate increases in Homeowners have been moderating for the past 2 years
Aon Benfield | Analytics | Market Analysis Proprietary & Confidential 4
Rate Trends – 4th Quarter 2016
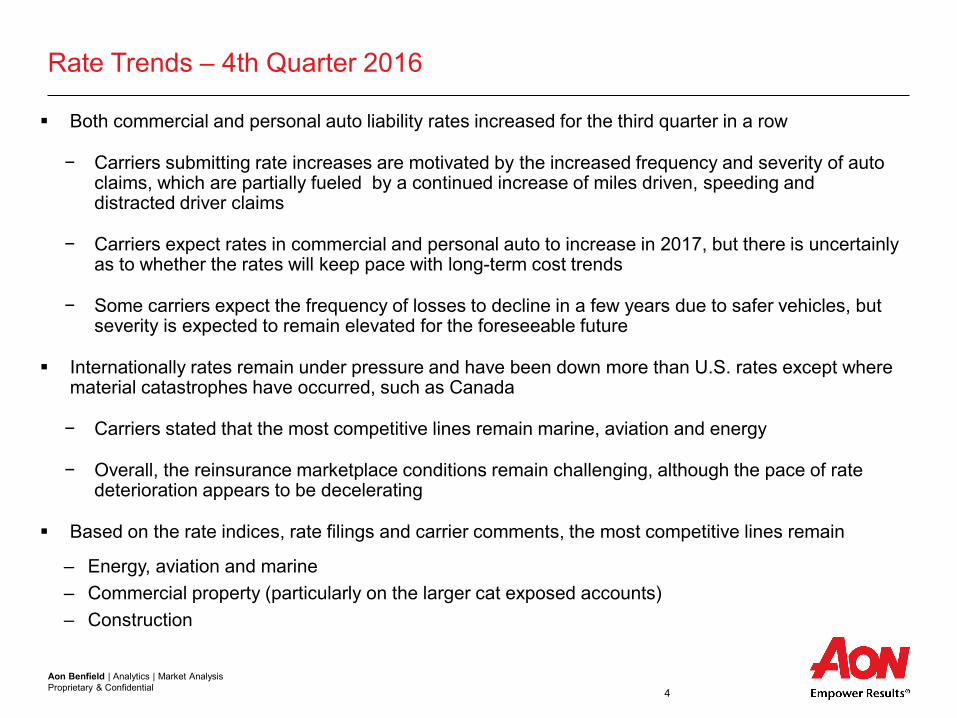
Both commercial and personal auto liability rates increased for the third quarter in a row
− Carriers submitting rate increases are motivated by the increased frequency and severity of auto claims, which are partially fueled by a continued increase of miles driven, speeding and distracted driver claims
− Carriers expect rates in commercial and personal auto to increase in 2017, but there is uncertainly as to whether the rates will keep pace with long-term cost trends
− Some carriers expect the frequency of losses to decline in a few years due to safer vehicles, but severity is expected to remain elevated for the foreseeable future
Internationally rates remain under pressure and have been down more than U.S. rates except where material catastrophes have occurred, such as Canada
− Carriers stated that the most competitive lines remain marine, aviation and energy
− Overall, the reinsurance marketplace conditions remain challenging, although the pace of rate deterioration appears to be decelerating
Based on the rate indices, rate filings and carrier comments, the most competitive lines remain
– Energy, aviation and marine – Commercial property (particularly on the larger cat exposed accounts) – Construction

Aon Benfield | Analytics | Market Analysis Proprietary & Confidential 5
Aon Benfield Commercial Casualty Rate Indices
Most carriers state that commercial casualty rates have been flat to declining, but some lines of business are achieving rate increases
Commercial auto has been one line that has seen high single-digit rate increases
There has been an uptick in demand for cyber – Carriers are reporting single digit rate
increases in cyber, but the increases are less than in prior quarters
Carriers reported that overall rates in general liability and umbrella are up marginally for the year
Workers compensation has experienced an increase in competition with some carriers reporting rate decreases in the mid single digit range
In professional lines, several carriers reported that overall rates declined 2%, with D&O rates down as much as 4%
Standard: Chubb Limited., American International Group, Inc., Hartford Financial Services Group, Inc., Travelers Companies Inc., XL Group plc, W.R. Berkley Corporation and CNA Financial Corporation Specialty: Arch Capital Group Ltd, Allied World Assurance Company Holdings, AG, Markel Corporation, RLI Corp., W.R. Berkley Corporation and CNA Financial Corporation. Some groups report a Commercial Line rate change which includes both property and casualty.
Source: Aon Benfield Inc.
-10%
-8%
-6%
-4%
-2%
0%
2%
4%
6%
8%
10%20
09, Q
420
10, Q
120
10, Q
220
10, Q
320
10, Q
420
11, Q
120
11, Q
220
11, Q
320
11, Q
420
12, Q
120
12, Q
220
12, Q
320
12, Q
420
13, Q
120
13, Q
220
13, Q
320
13, Q
420
14, Q
120
14, Q
220
14, Q
320
14, Q
420
15, Q
120
15, Q
220
15, Q
320
15, Q
420
16, Q
120
16, Q
220
16, Q
320
16, Q
4
Rat
e C
hang
e
All Co. Avg
Specialty Co. Avg
Standard Co. Avg
Aon Benfield | Analytics | Market Analysis Proprietary & Confidential 6
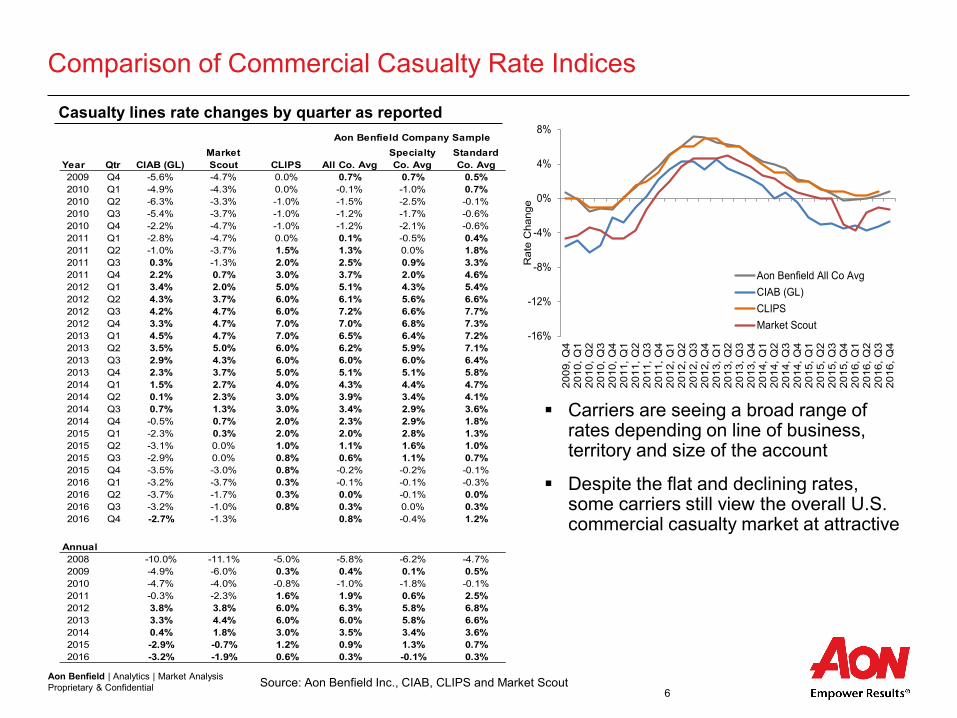
Comparison of Commercial Casualty Rate Indices Casualty lines rate changes by quarter as reported
Source: Aon Benfield Inc., CIAB, CLIPS and Market Scout
Carriers are seeing a broad range of rates depending on line of business, territory and size of the account
Despite the flat and declining rates, some carriers still view the overall U.S. commercial casualty market at attractive
Aon Benfield Company Sample
Year Qtr CIAB (GL)Market Scout CLIPS All Co. Avg
Specialty Co. Avg
Standard Co. Avg
2009 Q4 -5.6% -4.7% 0.0% 0.7% 0.7% 0.5%2010 Q1 -4.9% -4.3% 0.0% -0.1% -1.0% 0.7%2010 Q2 -6.3% -3.3% -1.0% -1.5% -2.5% -0.1%2010 Q3 -5.4% -3.7% -1.0% -1.2% -1.7% -0.6%2010 Q4 -2.2% -4.7% -1.0% -1.2% -2.1% -0.6%2011 Q1 -2.8% -4.7% 0.0% 0.1% -0.5% 0.4%2011 Q2 -1.0% -3.7% 1.5% 1.3% 0.0% 1.8%2011 Q3 0.3% -1.3% 2.0% 2.5% 0.9% 3.3%2011 Q4 2.2% 0.7% 3.0% 3.7% 2.0% 4.6%2012 Q1 3.4% 2.0% 5.0% 5.1% 4.3% 5.4%2012 Q2 4.3% 3.7% 6.0% 6.1% 5.6% 6.6%2012 Q3 4.2% 4.7% 6.0% 7.2% 6.6% 7.7%2012 Q4 3.3% 4.7% 7.0% 7.0% 6.8% 7.3%2013 Q1 4.5% 4.7% 7.0% 6.5% 6.4% 7.2%2013 Q2 3.5% 5.0% 6.0% 6.2% 5.9% 7.1%2013 Q3 2.9% 4.3% 6.0% 6.0% 6.0% 6.4%2013 Q4 2.3% 3.7% 5.0% 5.1% 5.1% 5.8%2014 Q1 1.5% 2.7% 4.0% 4.3% 4.4% 4.7%2014 Q2 0.1% 2.3% 3.0% 3.9% 3.4% 4.1%2014 Q3 0.7% 1.3% 3.0% 3.4% 2.9% 3.6%2014 Q4 -0.5% 0.7% 2.0% 2.3% 2.9% 1.8%2015 Q1 -2.3% 0.3% 2.0% 2.0% 2.8% 1.3%2015 Q2 -3.1% 0.0% 1.0% 1.1% 1.6% 1.0%2015 Q3 -2.9% 0.0% 0.8% 0.6% 1.1% 0.7%2015 Q4 -3.5% -3.0% 0.8% -0.2% -0.2% -0.1%2016 Q1 -3.2% -3.7% 0.3% -0.1% -0.1% -0.3%2016 Q2 -3.7% -1.7% 0.3% 0.0% -0.1% 0.0%2016 Q3 -3.2% -1.0% 0.8% 0.3% 0.0% 0.3%2016 Q4 -2.7% -1.3% 0.8% -0.4% 1.2%
Annual2008 -10.0% -11.1% -5.0% -5.8% -6.2% -4.7%2009 -4.9% -6.0% 0.3% 0.4% 0.1% 0.5%2010 -4.7% -4.0% -0.8% -1.0% -1.8% -0.1%2011 -0.3% -2.3% 1.6% 1.9% 0.6% 2.5%2012 3.8% 3.8% 6.0% 6.3% 5.8% 6.8%2013 3.3% 4.4% 6.0% 6.0% 5.8% 6.6%2014 0.4% 1.8% 3.0% 3.5% 3.4% 3.6%2015 -2.9% -0.7% 1.2% 0.9% 1.3% 0.7%2016 -3.2% -1.9% 0.6% 0.3% -0.1% 0.3%
-16%
-12%
-8%
-4%
0%
4%
8%
2009
, Q4
2010
, Q1
2010
, Q2
2010
, Q3
2010
, Q4
2011
, Q1
2011
, Q2
2011
, Q3
2011
, Q4
2012
, Q1
2012
, Q2
2012
, Q3
2012
, Q4
2013
, Q1
2013
, Q2
2013
, Q3
2013
, Q4
2014
, Q1
2014
, Q2
2014
, Q3
2014
, Q4
2015
, Q1
2015
, Q2
2015
, Q3
2015
, Q4
2016
, Q1
2016
, Q2
2016
, Q3
2016
, Q4
Rat
e C
hang
e
Aon Benfield All Co AvgCIAB (GL)CLIPSMarket Scout

Aon Benfield | Analytics | Market Analysis Proprietary & Confidential 7
U.S. National Average Rate Change
Source: Aon’s National Casualty Quarterly Rate Report
The Aon National Rate Index captured rate increases in workers compensation, GL commercial auto, GL, workers compensation and umbrella
This contrasts with several carriers reporting casualty rates down in workers compensation and flat in most other commercial casualty lines
-6%
-4%
-2%
0%
2%
4%
6%
8%
10%
2014
, Q1
2014
, Q2
2014
, Q3
2014
, Q4
2015
, Q1
2015
, Q2
2015
, Q3
2015
, Q4
2016
, Q1
2016
, Q2
2016
, Q3
2016
, Q4
Auto Liab
WC
Excess WC
GL
Lead Umbrella
Total Umbrella / ExcessLiab

Aon Benfield | Analytics | Market Analysis Proprietary & Confidential 8
Year QtrMarket Scout
(Personal Lines)Aon Benfield (HO-
only)2010 Q4 -- 6.4%2011 Q1 -- 6.4%2011 Q2 -- 6.0%2011 Q3 -- 6.4%2011 Q4 -- 6.8%2012 Q1 1.7% 6.7%2012 Q2 1.7% 6.8%2012 Q3 2.7% 6.9%2012 Q4 3.7% 7.4%2013 Q1 3.7% 7.6%2013 Q2 3.7% 6.8%2013 Q3 3.3% 6.9%2013 Q4 3.0% 6.3%2014 Q1 2.3% 5.7%2014 Q2 3.3% 5.3%2014 Q3 3.0% 4.1%2014 Q4 2.7% 3.6%2015 Q1 2.0% 3.7%2015 Q2 1.0% 2.6%2015 Q3 1.7% 3.1%2015 Q4 -0.7% 2.7%2016 Q1 -0.7% 2.4%2016 Q2 1.0% 2.2%2016 Q3 0.7% 2.3%2016 Q4 1.3% 2.0%
Annual2012 2.4% 7.4%2013 3.4% 6.3%2014 2.8% 3.6%2015 1.0% 2.7%2016 0.6% 2.0%
Personal Lines Rate Indices
Personal lines rate changes by quarter as reported
Rates in personal lines continue to increase, although the increases in homeowners rates continue to moderate
Personal auto has experienced an increase in severity and frequency in recent accident years
Carriers are expecting the positive rate momentum in personal lines to continue in 2017
Source: The Aon Benfield Homeowners rate index is based on approved rate filings for the top twenty insurance groups in each state.
-1%
0%
1%
2%
3%
4%
5%
6%
7%
8%
201
0,
4Q
201
1,
1Q
201
1,
2Q
201
1,
3Q
201
1,
4Q
201
2,
1Q
201
2,
2Q
201
2,
3Q
201
2,
4Q
201
3,
1Q
201
3,
2Q
201
3,
3Q
201
3,
4Q
201
4,
1Q
201
4,
2Q
201
4,
3Q
201
4,
4Q
201
5,
1Q
201
5,
2Q
201
5,
3Q
201
5,
4Q
201
6,
1Q
201
6,
2Q
201
6,
3Q
201
6,
4Q
Rate
Change
Aon Benfield All Co Avg (HO only - Filed)Market Scout Barometer (Personal Lines)
Aon Benfield | Analytics | Market Analysis Proprietary & Confidential 9
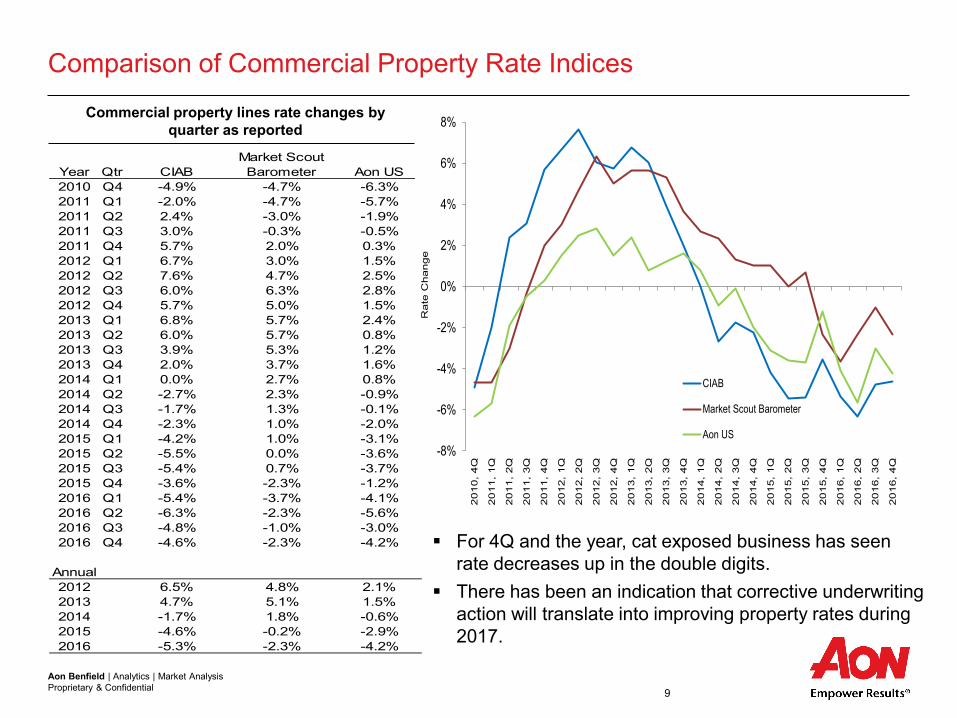
Year Qtr CIAB Market Scout Barometer Aon US
2010 Q4 -4.9% -4.7% -6.3%2011 Q1 -2.0% -4.7% -5.7%2011 Q2 2.4% -3.0% -1.9%2011 Q3 3.0% -0.3% -0.5%2011 Q4 5.7% 2.0% 0.3%2012 Q1 6.7% 3.0% 1.5%2012 Q2 7.6% 4.7% 2.5%2012 Q3 6.0% 6.3% 2.8%2012 Q4 5.7% 5.0% 1.5%2013 Q1 6.8% 5.7% 2.4%2013 Q2 6.0% 5.7% 0.8%2013 Q3 3.9% 5.3% 1.2%2013 Q4 2.0% 3.7% 1.6%2014 Q1 0.0% 2.7% 0.8%2014 Q2 -2.7% 2.3% -0.9%2014 Q3 -1.7% 1.3% -0.1%2014 Q4 -2.3% 1.0% -2.0%2015 Q1 -4.2% 1.0% -3.1%2015 Q2 -5.5% 0.0% -3.6%2015 Q3 -5.4% 0.7% -3.7%2015 Q4 -3.6% -2.3% -1.2%2016 Q1 -5.4% -3.7% -4.1%2016 Q2 -6.3% -2.3% -5.6%2016 Q3 -4.8% -1.0% -3.0%2016 Q4 -4.6% -2.3% -4.2%
Annual2012 6.5% 4.8% 2.1%2013 4.7% 5.1% 1.5%2014 -1.7% 1.8% -0.6%2015 -4.6% -0.2% -2.9%2016 -5.3% -2.3% -4.2%
Comparison of Commercial Property Rate Indices
Commercial property lines rate changes by quarter as reported
For 4Q and the year, cat exposed business has seen rate decreases up in the double digits.
There has been an indication that corrective underwriting action will translate into improving property rates during 2017.
-8%
-6%
-4%
-2%
0%
2%
4%
6%
8%
20
10,
4Q
20
11,
1Q
20
11,
2Q
20
11,
3Q
20
11,
4Q
20
12,
1Q
20
12,
2Q
20
12,
3Q
20
12,
4Q
20
13,
1Q
20
13,
2Q
20
13,
3Q
20
13,
4Q
20
14,
1Q
20
14,
2Q
20
14,
3Q
20
14,
4Q
20
15,
1Q
20
15,
2Q
20
15,
3Q
20
15,
4Q
20
16,
1Q
20
16,
2Q
20
16,
3Q
20
16,
4Q
Rate
Change
CIAB
Market Scout Barometer
Aon US
Aon Benfield | Analytics | Market Analysis Proprietary & Confidential 10
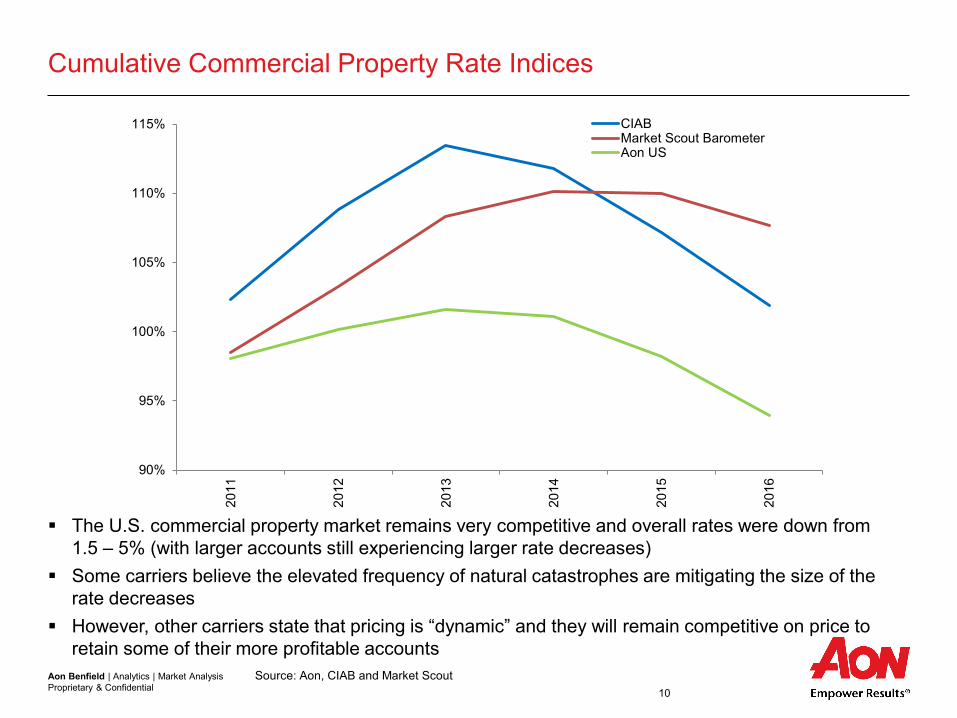
Cumulative Commercial Property Rate Indices
The U.S. commercial property market remains very competitive and overall rates were down from 1.5 – 5% (with larger accounts still experiencing larger rate decreases)
Some carriers believe the elevated frequency of natural catastrophes are mitigating the size of the rate decreases
However, other carriers state that pricing is “dynamic” and they will remain competitive on price to retain some of their more profitable accounts
Source: Aon, CIAB and Market Scout
90%
95%
100%
105%
110%
115%
2011
2012
2013
2014
2015
2016
CIABMarket Scout BarometerAon US
Aon Benfield | Analytics | Market Analysis Proprietary & Confidential 11
Table of Contents
Section 1 Rate trends
Section 2 Quarterly performance metrics and analysis
Section 3 Year-To-Date (YTD) performance metrics and analysis
Section 4 Additional information

Aon Benfield | Analytics | Market Analysis Proprietary & Confidential 12
4Q 2016 Profitability Observations
Catastrophe losses for most groups were elevated, fueled by Hurricane Matthew
Overall reserves redundancies were lower, as there was a significant amount of reserve strengthening by some groups in commercial and personal auto, workers compensation, A&E as well as lines in run-off
Earned premiums increased overall, fueled by acquisitions
Overall this led to an 4.4 pp increase in the combined ratio (to 97.8%) and a 2.3% decrease in ROE (to 6.6%)
– Just over half of the P&C groups beat their initial quarterly consensus earnings estimates groups, which was on par with 4Q 2015

Aon Benfield | Analytics | Market Analysis Proprietary & Confidential 13
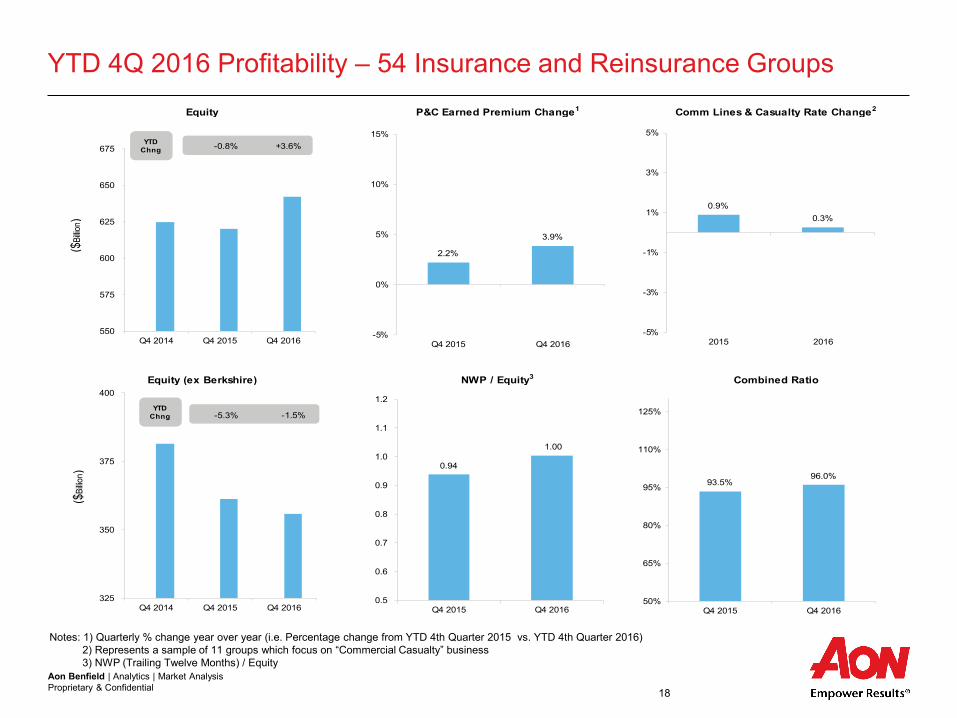
YTD 4Q 2016 Profitability Observations
2016 Year-to date results mirrored the fourth quarter results
– Catastrophe losses were elevated, due to Hurricane Matthew, the Fort McMurray wildfire, flooding in the gulf area as well as an increase in wind and hail losses
– Reserve redundancies decreased from 3.9% to 2.6%
– Earned premiums increased from 2.2% to 3.9%
Investment results were mixed, with most groups reporting increases, but a few groups reporting sharp declines
Total equity (excluding Berkshire) decreased 1.5%
– Driven by share buybacks and dividends of $31B, offset by net income of $23B and unrealized gains of $2B

Aon Benfield | Analytics | Market Analysis Proprietary & Confidential 14
Miss Beat
% Beat EPS
Target
0% 20% 40% 60% 80% 100%
Large Cap (6)
Commercial (7)
Personal (9)
Specialty (13)
Small Cap Specialty (7)
Reinsurance (9)
Industry (51) 53
44
57
46
67
43
27
4
4
6
6
3
4
24
5
3
7
3
4
2 67
4Q 2016 Actual vs. Estimated EPS by Sector
Note: There are 54 insurance and reinsurance groups included in this report. However, an EPS estimate was not available for 3 groups. The number next to each sector represents the number of groups in that sector. “Miss” or “Beat” refers to the number of groups that did not meet (Miss) or exceeded (Beat) the consensus EPS estimate.
Missed Target Est. Beat Target Est.
EPS estimated vs. actual

Aon Benfield | Analytics | Market Analysis Proprietary & Confidential 15
4Q 2016 Profitability – 54 Insurance and Reinsurance Groups
Notes: 1) Quarterly % change year over year (i.e. Percentage change from 4th Quarter 2015 vs. 4th Quarter 2016) 2) Represents a sample of 11 groups which focus on “Commercial Casualty” business 3) NWP (Trailing Twelve Months) / Equity
Equity (ex Berkshire)
Equity P&C Earned Premium Change¹
NWP / Equity3 Combined Ratio
Comm Lines & Casualty Rate Change2
+1.1% +1.9% +1.4% -0.9%
550
575
600
625
650
675
Q4 2015 Q1 2016 Q2 2016 Q3 2016 Q4 2016
+1.1% +2.0% +0.7% -5.2%
300
325
350
375
400
425
Q4 2015 Q1 2016 Q2 2016 Q3 2016 Q4 2016
QuarterChng
QuarterChng
0.970.95 0.94 0.94
1.00
0.5
0.6
0.7
0.8
0.9
1.0
1.1
Q4 2015 Q1 2016 Q2 2016 Q3 2016 Q4 2016
3.8%
6.1%
3.8%
2.1%3.4%
-5%
0%
5%
10%
15%
Q4 2015 Q1 2016 Q2 2016 Q3 2016 Q4 2016
93.4% 93.2%
98.9%
94.7%97.8%
50%
65%
80%
95%
110%
Q4 2015 Q1 2016 Q2 2016 Q3 2016 Q4 2016
($Bi
llion)
-0.2% -0.1%
0.0%0.3%
0.8%
-5%
-3%
-1%
1%
3%
5%
Q4 2015 Q1 2016 Q2 2016 Q3 2016 Q4 2016
($Bi
llion)

Aon Benfield | Analytics | Market Analysis Proprietary & Confidential 16
CY Quarter YOY Point Change
4Q 2016 Profitability – 54 Insurance and Reinsurance Groups
Note: CY Quarter = Current Year Quarter; YOY Point Change = Percentage point change from 4th Quarter 2015 vs. 4th Quarter 2016
Return on Equity P&C Earned Premium Change Combined Ratio
Reserve Development to Premium Catastrophe Losses to Premium Combined Ratio ex-Cat & Reserve Development
+1.4
+5.2
+2.5
+0.2
-4.7
-2.5
-0.7
50% 65% 80% 95% 110% 125%
SCSpec
Reins
Pers
Industry
Spec
Comm
LargeCap
+4.9
+1.9
+1.7
-2.3
-2.3
-3.7
-8.4
-15% -10% -5% 0% 5% 10% 15%
LargeCap
Pers
SCSpec
Spec
Industry
Comm
Reins
16.1%
-12.0%
+5.9
+4.5
+0.1
+4.3
+2.2
+1.8
-1.4
-10% -5% 0% 5% 10%
LargeCap
Comm
Pers
SCSpec
Industry
Spec
Reins
+6.8
+8.2
-1.9
+4.4
+4.4
+8.7
+0.7
50% 65% 80% 95% 110% 125%
LargeCap
SCSpec
Pers
Industry
Comm
Reins
Spec
-5% 0% 5% 10% 15%
SCSpec
Spec
Comm
Reins
Industry
LargeCap
Pers
+4.9
+2.0
+3.6
+2.5
+2.5
-4.4
+1.6
0% 2% 4% 6% 8% 10%
Reins
Industry
Spec
Comm
SCSpec
Pers
LargeCap
YOY Chng
YOY Chng
YOY Chng
YOY Chng
YOY Chng
Aon Benfield | Analytics | Market Analysis Proprietary & Confidential 17
Table of Contents
Section 1 Rate trends
Section 2 Quarterly performance metrics and analysis
Section 3 Year-To-Date (YTD) performance metrics and analysis
Section 4 Additional information
Aon Benfield | Analytics | Market Analysis Proprietary & Confidential 18
YTD 4Q 2016 Profitability – 54 Insurance and Reinsurance Groups
Notes: 1) Quarterly % change year over year (i.e. Percentage change from YTD 4th Quarter 2015 vs. YTD 4th Quarter 2016) 2) Represents a sample of 11 groups which focus on “Commercial Casualty” business 3) NWP (Trailing Twelve Months) / Equity
Equity P&C Earned Premium Change1
NWP / Equity3 Combined Ratio
Comm Lines & Casualty Rate Change2
Equity (ex Berkshire)
-5.3% -1.5%
325
350
375
400
Q4 2014 Q4 2015 Q4 2016
-0.8% +3.6%
550
575
600
625
650
675
Q4 2014 Q4 2015 Q4 2016
YTD Chng
0.94
1.00
0.5
0.6
0.7
0.8
0.9
1.0
1.1
1.2
Q4 2015 Q4 2016
2.2%
3.9%
-5%
0%
5%
10%
15%
Q4 2015 Q4 2016
93.5%96.0%
50%
65%
80%
95%
110%
125%
Q4 2015 Q4 2016
($Bi
llion)
YTD Chng
0.9%0.3%
-5%
-3%
-1%
1%
3%
5%
2015 2016
($Bi
llion)

Aon Benfield | Analytics | Market Analysis Proprietary & Confidential 19
CY Quarter YOY Point Change
YTD 4Q 2016 Profitability – 54 Insurance and Reinsurance Groups Return on Equity P&C Earned Premium Change Combined Ratio
Reserve Development to Premium Catastrophe Losses to Premium Combined Ratio ex-Cat & Reserve Development
+1.7
-1.3
+0.8
+0.3
+1.0
-0.3
+0.3
50% 65% 80% 95% 110% 125%
Pers
Spec
SCSpec
Industry
Reins
Comm
LargeCap
-0.3
+4.8
+3.6
+2.5
+2.0
+1.4
+3.5
50% 65% 80% 95% 110% 125%
Pers
SCSpec
LargeCap
Industry
Comm
Spec
Reins
+2.9
+0.4
-0.8
-1.1
-1.9
-3.3
-4.5
-15% -10% -5% 0% 5% 10% 15%
Spec
Pers
Industry
LargeCap
SCSpec
Reins
Comm
+1.7
+0.4
+2.3
+0.8
+1.3
+1.5
+0.8
-10% -5% 0% 5% 10%
LargeCap
Pers
SCSpec
Comm
Industry
Spec
Reins
-5% 0% 5% 10% 15%
Spec
SCSpec
LargeCap
Industry
Comm
Reins
Pers
+1.7
+1.5
-2.3
+1.7
+0.9
+1.6
+1.2
0% 2% 4% 6% 8% 10%
SCSpec
Comm
Pers
Reins
Industry
LargeCap
Spec
YOY Chng
YOY Chng
YOY Chng
YOY Chng
YOY Chng

Aon Benfield | Analytics | Market Analysis Proprietary & Confidential 20
Table of Contents
Section 1 Rate trends
Section 2 Quarterly performance metrics and analysis
Section 3 Year-To-Date (YTD) performance metrics and analysis
Section 4 Additional information
Aon Benfield | Analytics | Market Analysis Proprietary & Confidential 21
Objectives
A primary objective of this report is to provide an update on U.S. P&C rate trends
– Casualty rate trends are derived from a variety of public sources and represent Aon Benfield’s best estimate of casualty rate changes
– Casualty rate trends are also extracted from Aon’s National Casualty Quarterly Rate Report
– The Aon Benfield Homeowners rate index is based on approved rate filings for the top twenty insurance groups in each state
– The Aon Benfield rate change indices are compared to other rate change indices including: CIAB, CLIPS and Market Scout
– The Aon US Commercial Property index is taken from “Aon’s Global Risk Insight Platform” (GRIP)
– The report also provides insight into the profitability of the U.S. P&C Industry
– The U.S. P&C Industry is represented by 54 public insurance and reinsurance groups
– The groups are predominantly U.S. non-life and have been categorized into six sectors
Aon Benfield | Analytics | Market Analysis Proprietary & Confidential 22
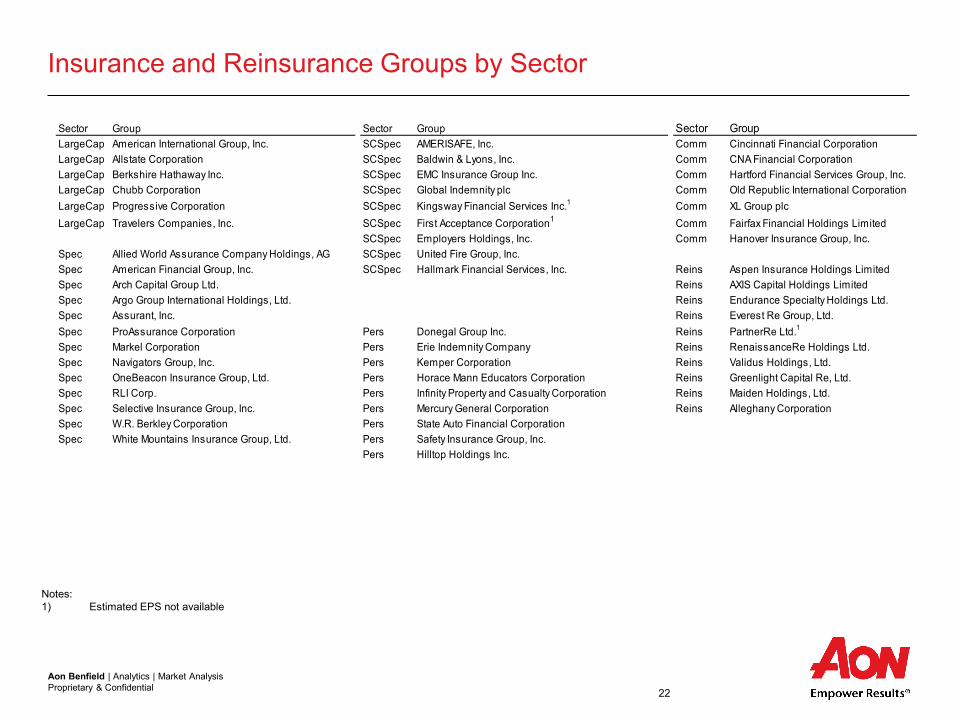
Insurance and Reinsurance Groups by Sector
Notes: 1) Estimated EPS not available
Sector Group Sector Group Sector GroupLargeCap American International Group, Inc. SCSpec AMERISAFE, Inc. Comm Cincinnati Financial CorporationLargeCap Allstate Corporation SCSpec Baldwin & Lyons, Inc. Comm CNA Financial CorporationLargeCap Berkshire Hathaway Inc. SCSpec EMC Insurance Group Inc. Comm Hartford Financial Services Group, Inc.LargeCap Chubb Corporation SCSpec Global Indemnity plc Comm Old Republic International CorporationLargeCap Progressive Corporation SCSpec Kingsway Financial Services Inc.1 Comm XL Group plcLargeCap Travelers Companies, Inc. SCSpec First Acceptance Corporation1 Comm Fairfax Financial Holdings Limited
SCSpec Employers Holdings, Inc. Comm Hanover Insurance Group, Inc.Spec Allied World Assurance Company Holdings, AG SCSpec United Fire Group, Inc.Spec American Financial Group, Inc. SCSpec Hallmark Financial Services, Inc. Reins Aspen Insurance Holdings LimitedSpec Arch Capital Group Ltd. Reins AXIS Capital Holdings LimitedSpec Argo Group International Holdings, Ltd. Reins Endurance Specialty Holdings Ltd.Spec Assurant, Inc. Reins Everest Re Group, Ltd.Spec ProAssurance Corporation Pers Donegal Group Inc. Reins PartnerRe Ltd.1
Spec Markel Corporation Pers Erie Indemnity Company Reins RenaissanceRe Holdings Ltd.Spec Navigators Group, Inc. Pers Kemper Corporation Reins Validus Holdings, Ltd.Spec OneBeacon Insurance Group, Ltd. Pers Horace Mann Educators Corporation Reins Greenlight Capital Re, Ltd.Spec RLI Corp. Pers Infinity Property and Casualty Corporation Reins Maiden Holdings, Ltd.Spec Selective Insurance Group, Inc. Pers Mercury General Corporation Reins Alleghany CorporationSpec W.R. Berkley Corporation Pers State Auto Financial CorporationSpec White Mountains Insurance Group, Ltd. Pers Safety Insurance Group, Inc.
Pers Hilltop Holdings Inc.

Aon Benfield | Analytics | Market Analysis Proprietary & Confidential 23
Contact Information
Greg Heerde Head of Americas Analytics Aon Benfield Analytic +1.312.381.5364 [email protected] Brian Alvers Head of Americas Actuarial Aon Benfield Analytics +1.312.381.5355 [email protected]
Tracy Hatlestad COO of Analytics Aon Benfield Analytics +65.6512.0244 [email protected] Mike McClane Market Analysis - Americas Aon Benfield Analytics +1.215.751.1596 [email protected]
National Casualty Quarterly Rate Indices All Other Aon Rate Indices Michael Gruetzmacher Chris Cortese +1.312.381.5364 +1.215.751.1595 [email protected] [email protected]
For information on Aon rate indices, please contact:

Aon Benfield | Analytics | Market Analysis Proprietary & Confidential 24
About Aon Benfield
Aon Benfield, a division of Aon plc (NYSE: AON), is the world’s leading reinsurance intermediary and full service capital advisor. We empower our clients to better understand, manage and transfer risk through innovative solutions and personalized access to all forms of global reinsurance capital across treaty, facultative and capital markets. As a trusted advocate, we deliver local reach to the world’s markets, an unparalleled investment in innovative analytics, including catastrophe management, actuarial and rating agency advisory. Through our professionals’ expertise and experience, we advise clients in making optimal capital choices that will empower results and improve operational effectiveness for their business. With more than 80 offices in 50 countries, our worldwide client base has access to the broadest portfolio of integrated capital solutions and services. To learn how Aon Benfield helps empower results, please visit aonbenfield.com.
© Aon Benfield Inc. 2017. This document is intended for general information purposes only and should not be construed as advice or opinions on any specific facts or circumstances. This analysis is based upon information from sources we consider to be reliable, however Aon Benfield does not warrant the accuracy of the data or calculations herein. The content of this document is made available on an “as is” basis, without warranty of any kind. Aon Benfield disclaims any legal liability to any person or organization for loss or damage caused by or resulting from any reliance placed on that content. Members of the Aon Benfield Analytics will be pleased to consult on any specific situations and to provide further information regarding the matters discussed herein.
Sources: Commercial Lines Insurance Pricing Survey (CLIPS), Council of Insurance Agents and Brokers (CIAB), Market Scout, SNL Financial, LC and Aon plc


