33
StoneMor Partners L.P. Raymond James Investor Conference March 2016
| Date post: | 26-Jan-2017 |
| Category: |
Investor Relations |
| Upload: | stonemor |
| View: | 640 times |
| Download: | 0 times |
StoneMor Partners L.P. Raymond James
Investor Conference March 2016
Forward-Looking Statements
This presentation contains forward-looking statements that involve a number of assumptions, risks and
uncertainties that could cause actual results to differ materially from those contained in the forward-
looking statements. The Partnership cautions readers that any forward-looking information is not a
guarantee of future performance. Such forward-looking statements include, but are not limited to,
statements about future financial and operating results, the Partnership’s plans, objectives,
expectations and intentions and other statements that are not historical facts. Risks, assumptions and
uncertainties that could cause actual results to materially differ from the forward-looking statements
include, but are not limited to, those associated with the cash flow from our pre-need and at-need sales,
our trusts, and financings, which may impact our ability to meet our financial projections, our ability
to service our debt and pay distributions, and our ability to increase our distributions; future revenue
and revenue growth; the integration or anticipated benefits of our recent acquisitions or any future
acquisitions; our ability to complete and fund additional acquisitions; the effect of economic
downturns; the impact of our leverage on our operating plans; the decline in the fair value of certain
equity and debt securities held in our trusts; our ability to attract, train and retain an adequate number
of sales people; the volume and timing of pre-need sales of cemetery services and products; increased
use of cremation; changes in the death rate; changes in the political or regulatory environments,
including potential changes in tax accounting and trusting policies; litigation or legal proceedings that
could expose us to significant liabilities and damage our reputation; the effects of cyber security
attacks due to our significant reliance on information technology; the financial condition of third-
party insurance companies that fund our pre-need funeral contracts; and other risks, assumptions and
uncertainties detailed from time to time in the Partnership’s reports filed with the U.S. Securities and
Exchange Commission, including quarterly reports on Form 10-Q, reports on Form 8-K and annual
reports on Form 10-K. Forward-looking statements speak only as of the date hereof, and the
Partnership assumes no obligation to update such statements, except as may be required by applicable
law.
2
StoneMor At-a-Glance
Second largest owner and operator of cemeteries in the U.S.
307 cemeteries / 105 funeral homes, located across 28 states and Puerto Rico
Complete range of funeral merchandise and services, along with cemetery property, merchandise and services, both at the time of need and on a pre-need basis
Over 15,900 acres of land, as of December 31, 2015, equivalent to a weighted average sales life of 237 years
54,837 burials performed in 2015 / 15,838 funeral service calls
$772.5 million in Merchandise and Perpetual Care Trusts as of December 31, 2015
We are the only deathcare company structured as a master limited partnership (MLP)
3
Strategy Overview
Experts at owning / operating a cemetery-focused deathcare business
‒ We purchase lucrative real estate assets, introduce cost efficiencies and grow revenues
& cash flow through pre-need sales
Acquisition strategy that is measured and repeatable
‒ 175 cemeteries and 98 funeral homes acquired since 2004 IPO*
Effective management of trust fund assets provides predictable cash
flows
‒ Target 4%-5% annual returns
Maintain conservative financial profile
‒ $119mm excess cash and assets net of debt, Merchandise Trust liability, AP & Accrued
Liabilities
4
*Net of sales, divestitures and consolidation
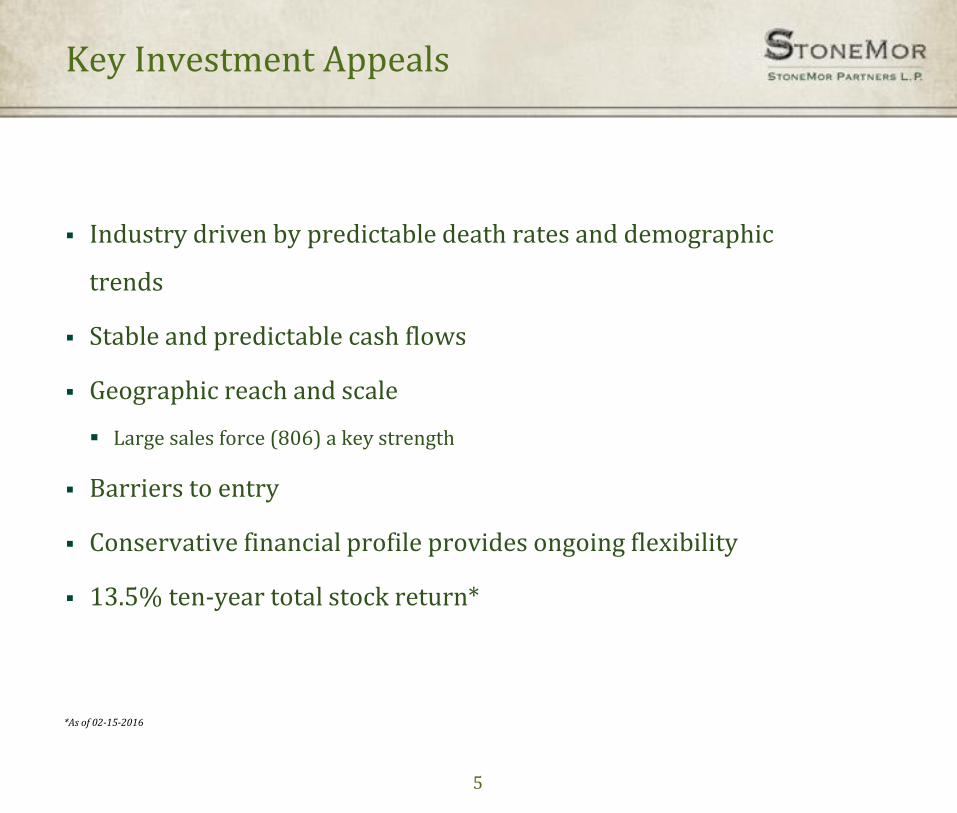
Key Investment Appeals
Industry driven by predictable death rates and demographic
trends
Stable and predictable cash flows
Geographic reach and scale
Large sales force (806) a key strength
Barriers to entry
Conservative financial profile provides ongoing flexibility
13.5% ten-year total stock return*
5
*As of 02-15-2016
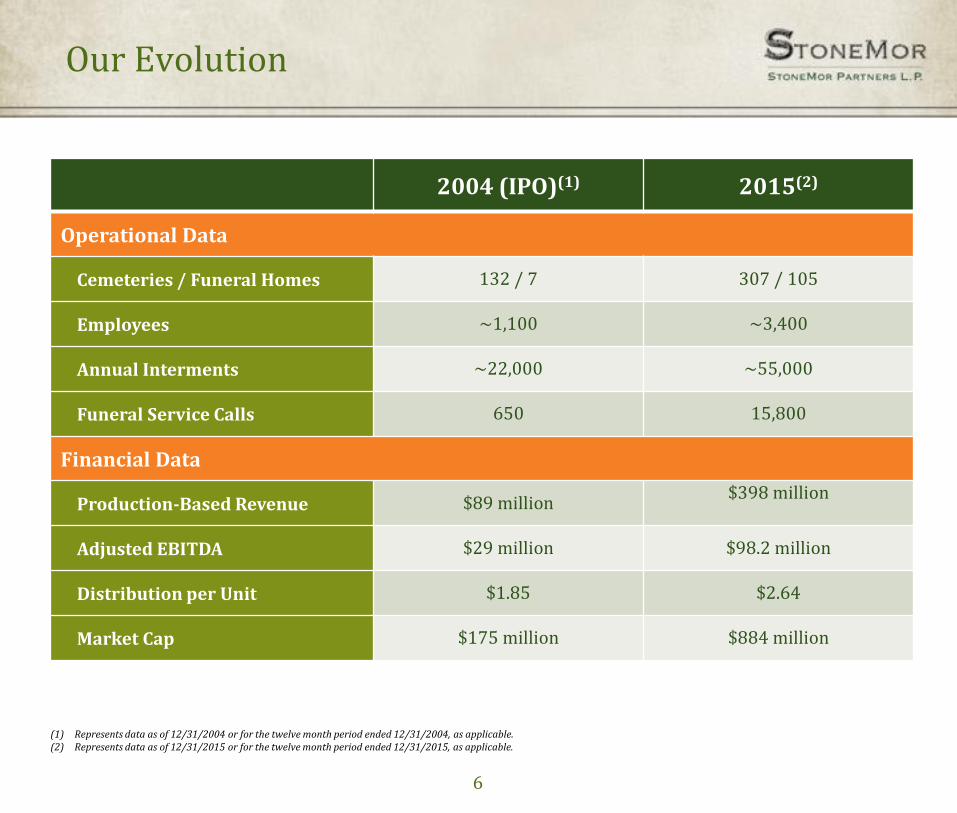
Our Evolution
2004 (IPO)(1) 2015(2)
Operational Data
Cemeteries / Funeral Homes 132 / 7 307 / 105
Employees ~1,100 ~3,400
Annual Interments ~22,000 ~55,000
Funeral Service Calls 650 15,800
Financial Data
Production-Based Revenue $89 million $398 million
Adjusted EBITDA $29 million $98.2 million
Distribution per Unit $1.85 $2.64
Market Cap $175 million $884 million
(1) Represents data as of 12/31/2004 or for the twelve month period ended 12/31/2004, as applicable. (2) Represents data as of 12/31/2015 or for the twelve month period ended 12/31/2015, as applicable.
6
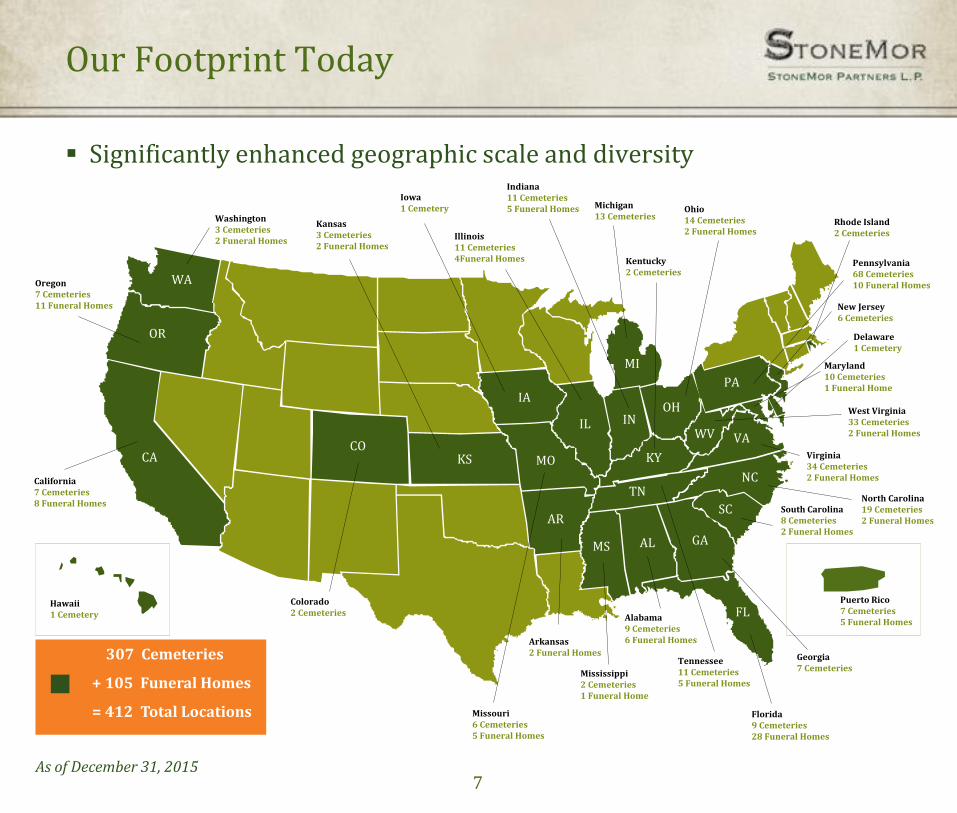
Our Footprint Today
Significantly enhanced geographic scale and diversity
307 Cemeteries
+ 105 Funeral Homes
= 412 Total Locations
WA
OR
CA CO
KS
IA
IL
MO
AR
IN
MI
OH
PA
WV
KY
TN
VA
NC
SC
GA AL MS
FL
Washington 3 Cemeteries 2 Funeral Homes
Oregon 7 Cemeteries 11 Funeral Homes
California 7 Cemeteries 8 Funeral Homes
Colorado 2 Cemeteries
Kansas 3 Cemeteries 2 Funeral Homes
Hawaii 1 Cemetery
Iowa 1 Cemetery
Illinois 11 Cemeteries 4Funeral Homes
Indiana 11 Cemeteries 5 Funeral Homes Michigan
13 Cemeteries
Kentucky 2 Cemeteries
Ohio 14 Cemeteries 2 Funeral Homes
Rhode Island 2 Cemeteries
Pennsylvania 68 Cemeteries 10 Funeral Homes
New Jersey 6 Cemeteries
Delaware 1 Cemetery
Maryland 10 Cemeteries 1 Funeral Home
West Virginia 33 Cemeteries 2 Funeral Homes
Virginia 34 Cemeteries 2 Funeral Homes
North Carolina 19 Cemeteries 2 Funeral Homes
South Carolina 8 Cemeteries 2 Funeral Homes
Puerto Rico 7 Cemeteries 5 Funeral Homes
Georgia 7 Cemeteries
Florida 9 Cemeteries 28 Funeral Homes
Tennessee 11 Cemeteries 5 Funeral Homes
Alabama 9 Cemeteries 6 Funeral Homes
Mississippi 2 Cemeteries 1 Funeral Home
Arkansas 2 Funeral Homes
Missouri 6 Cemeteries 5 Funeral Homes
As of December 31, 2015 7
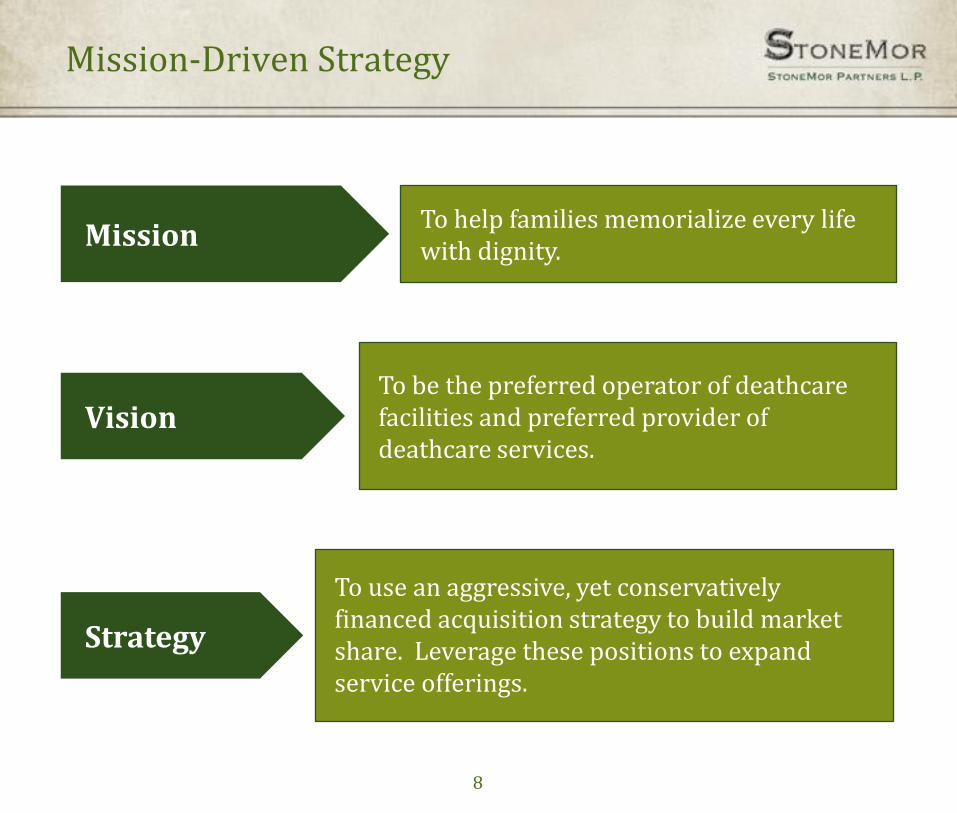
Mission-Driven Strategy
Mission
Vision
Strategy
To help families memorialize every life with dignity.
To be the preferred operator of deathcare facilities and preferred provider of deathcare services.
To use an aggressive, yet conservatively financed acquisition strategy to build market share. Leverage these positions to expand service offerings.
8
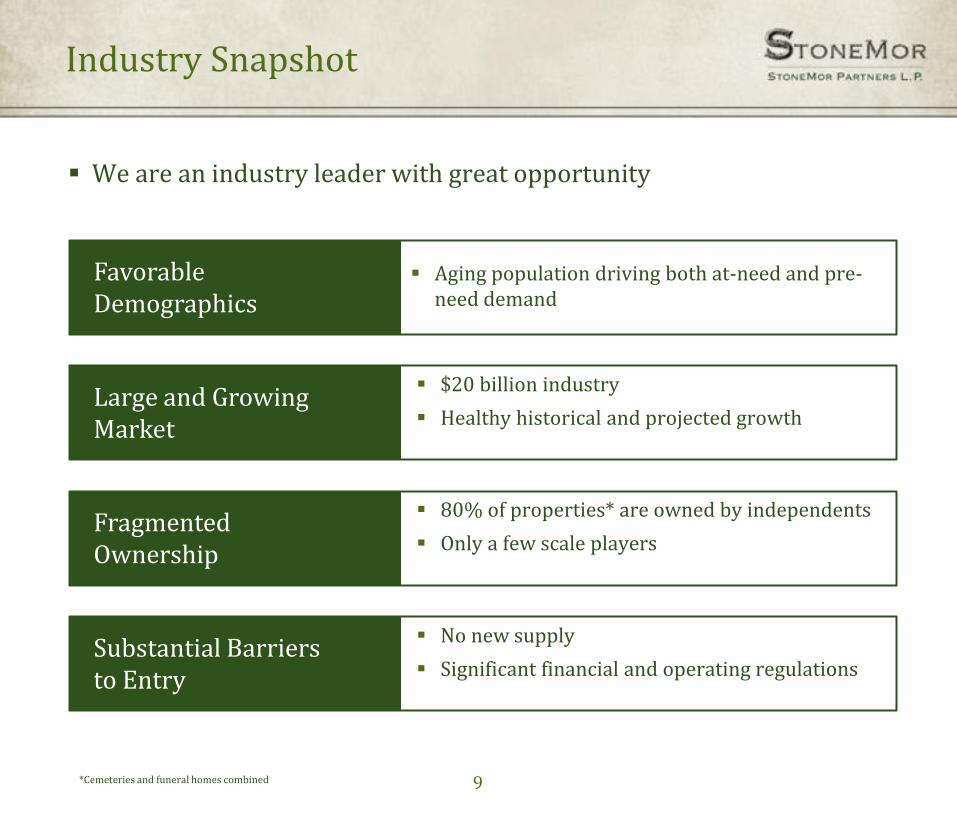
Industry Snapshot
We are an industry leader with great opportunity
Aging population driving both at-need and pre-need demand
$20 billion industry
Healthy historical and projected growth
80% of properties* are owned by independents
Only a few scale players
No new supply
Significant financial and operating regulations
Favorable Demographics
Large and Growing Market
Fragmented Ownership
Substantial Barriers to Entry
*Cemeteries and funeral homes combined 9
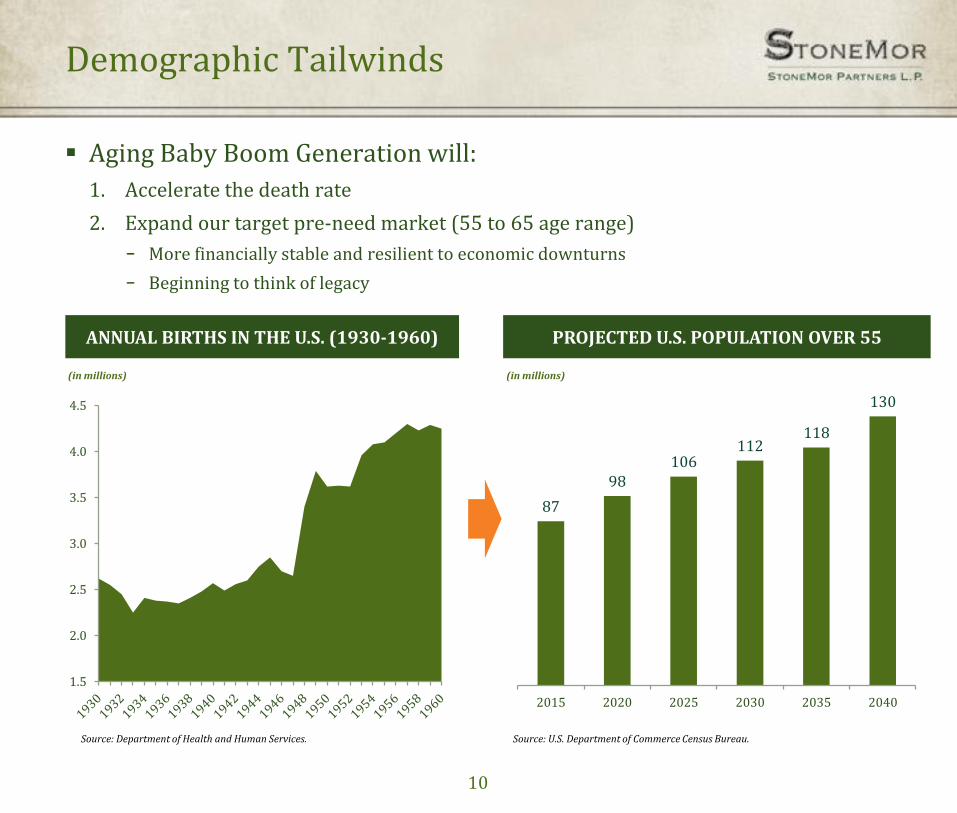
Demographic Tailwinds
Source: Department of Health and Human Services.
ANNUAL BIRTHS IN THE U.S. (1930-1960)
Aging Baby Boom Generation will:
1. Accelerate the death rate
2. Expand our target pre-need market (55 to 65 age range)
− More financially stable and resilient to economic downturns
− Beginning to think of legacy
Source: U.S. Department of Commerce Census Bureau.
PROJECTED U.S. POPULATION OVER 55
87
98 106
112 118
130
2015 2020 2025 2030 2035 2040
(in millions)
1.5
2.0
2.5
3.0
3.5
4.0
4.5
(in millions)
10
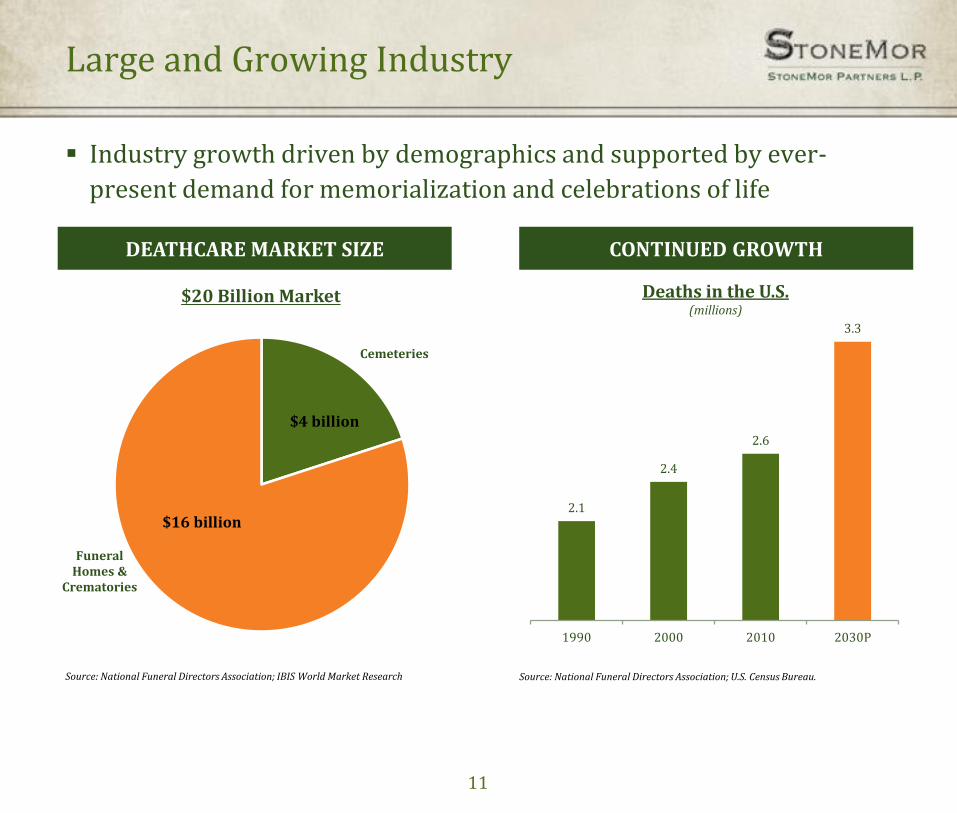
Cemeteries
Funeral Homes &
Crematories
$16 billion
$4 billion
Source: National Funeral Directors Association; IBIS World Market Research Source: National Funeral Directors Association; U.S. Census Bureau.
$20 Billion Market
DEATHCARE MARKET SIZE
Large and Growing Industry
CONTINUED GROWTH
2.1
2.4
2.6
3.3
1990 2000 2010 2030P
Deaths in the U.S. (millions)
Industry growth driven by demographics and supported by ever-
present demand for memorialization and celebrations of life
11
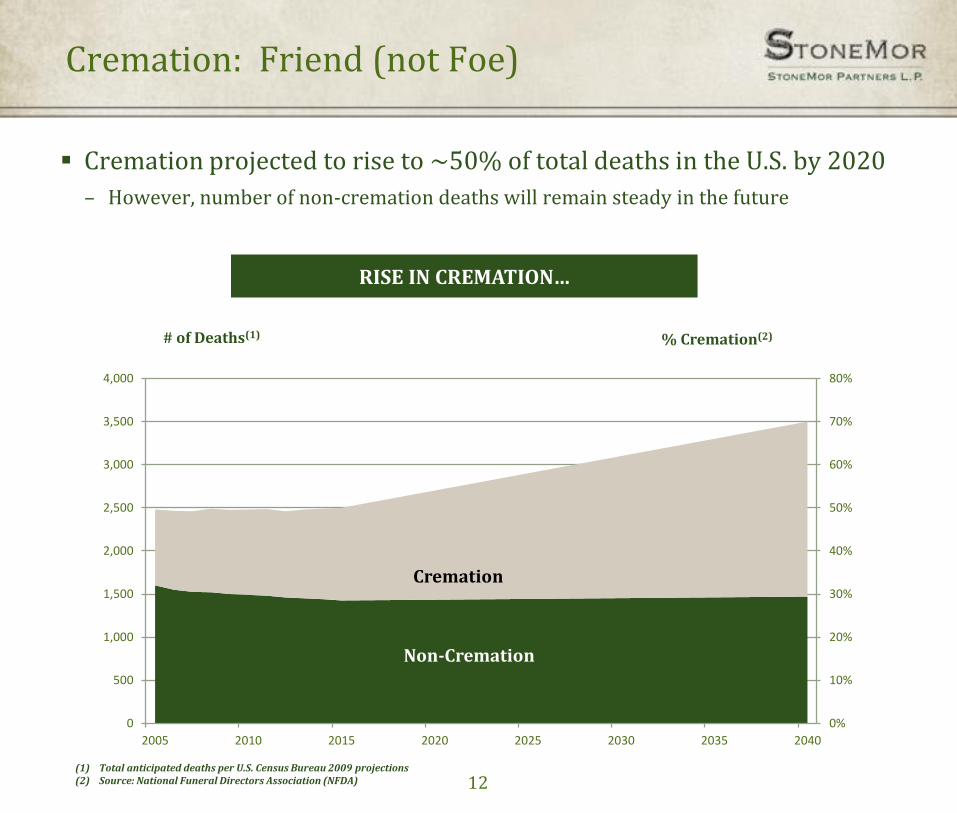
Cremation projected to rise to ~50% of total deaths in the U.S. by 2020
– However, number of non-cremation deaths will remain steady in the future
Cremation: Friend (not Foe)
RISE IN CREMATION…
0%
10%
20%
30%
40%
50%
60%
70%
80%
0
500
1,000
1,500
2,000
2,500
3,000
3,500
4,000
2005 2010 2015 2020 2025 2030 2035 2040
Cremation
Non-Cremation
12
# of Deaths(1) % Cremation(2)
(1) Total anticipated deaths per U.S. Census Bureau 2009 projections (2) Source: National Funeral Directors Association (NFDA)
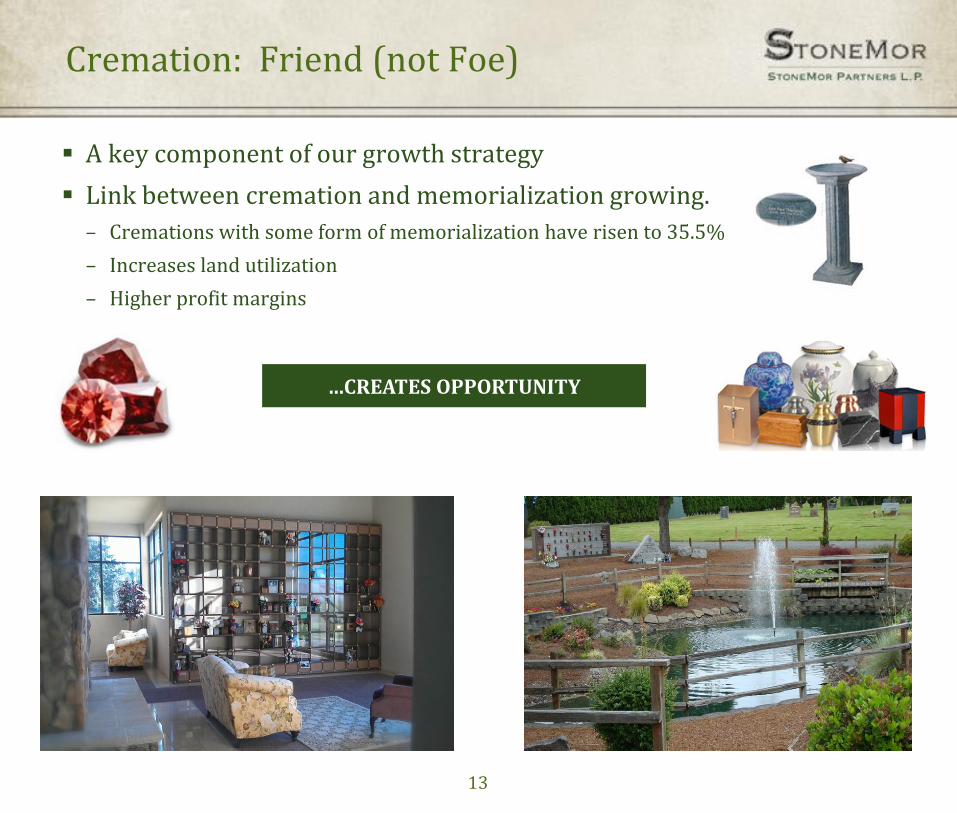
A key component of our growth strategy
Link between cremation and memorialization growing.
– Cremations with some form of memorialization have risen to 35.5%
– Increases land utilization
– Higher profit margins
Cremation: Friend (not Foe)
…CREATES OPPORTUNITY
13
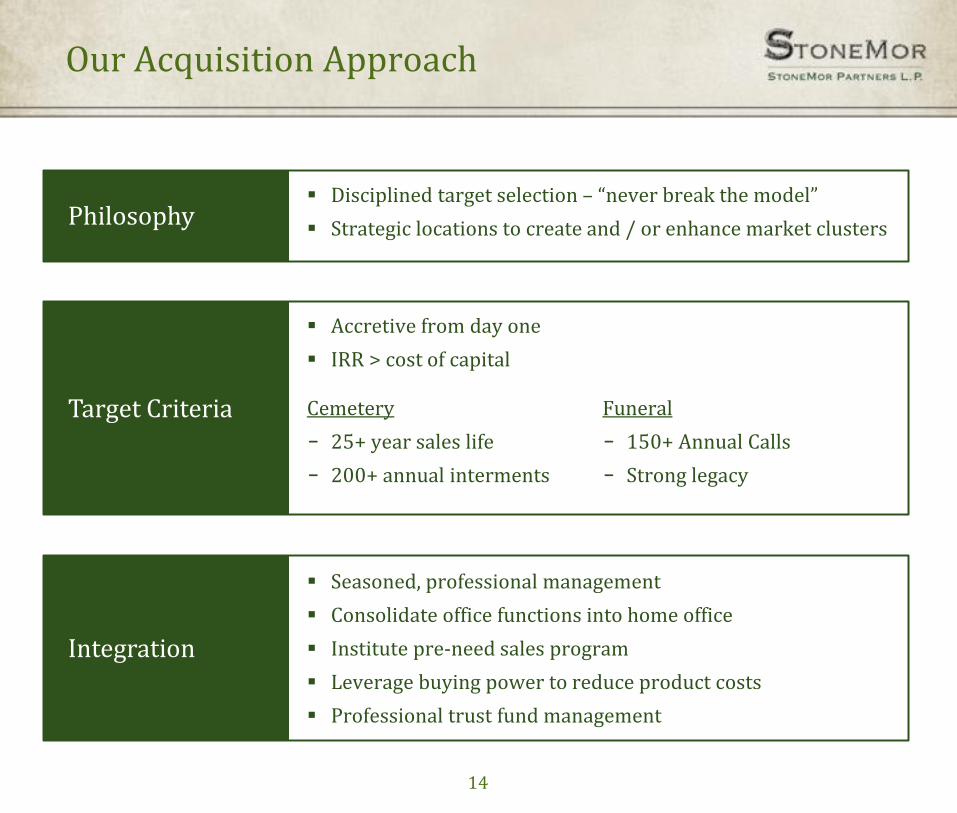
Our Acquisition Approach
Disciplined target selection – “never break the model”
Strategic locations to create and / or enhance market clusters
Cemetery
− 25+ year sales life
− 200+ annual interments
Seasoned, professional management
Consolidate office functions into home office
Institute pre-need sales program
Leverage buying power to reduce product costs
Professional trust fund management
Philosophy
Target Criteria
Integration
Funeral
− 150+ Annual Calls
− Strong legacy
Accretive from day one
IRR > cost of capital
14
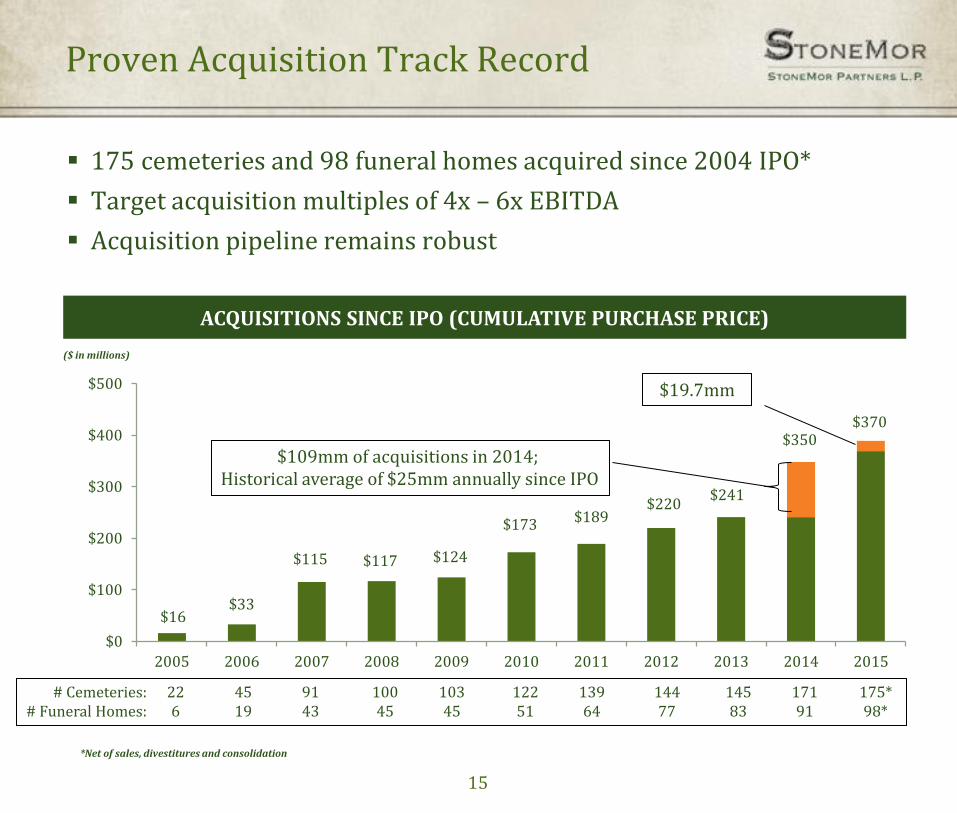
Proven Acquisition Track Record
175 cemeteries and 98 funeral homes acquired since 2004 IPO*
Target acquisition multiples of 4x – 6x EBITDA
Acquisition pipeline remains robust
$16 $33
$115 $117 $124
$173 $189 $220
$241
$350 $370
$0
$100
$200
$300
$400
$500
2005 2006 2007 2008 2009 2010 2011 2012 2013 2014 2015
ACQUISITIONS SINCE IPO (CUMULATIVE PURCHASE PRICE)
# Cemeteries: # Funeral Homes:
($ in millions)
22 6
45 19
91 43
100 45
103 45
122 51
139 64
144 77
145 83
171 91
$109mm of acquisitions in 2014; Historical average of $25mm annually since IPO
175*
98*
$19.7mm
15
*Net of sales, divestitures and consolidation
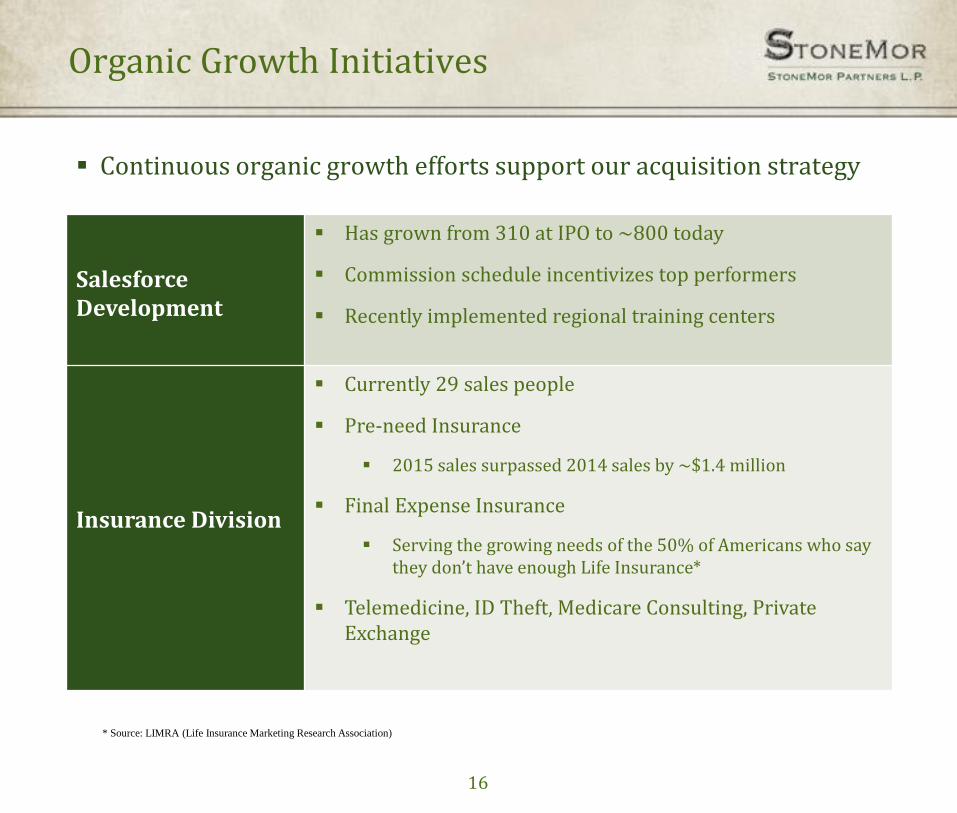
Organic Growth Initiatives
Continuous organic growth efforts support our acquisition strategy
Salesforce Development
Has grown from 310 at IPO to ~800 today
Commission schedule incentivizes top performers
Recently implemented regional training centers
Insurance Division
Currently 29 sales people
Pre-need Insurance
2015 sales surpassed 2014 sales by ~$1.4 million
Final Expense Insurance
Serving the growing needs of the 50% of Americans who say they don’t have enough Life Insurance*
Telemedicine, ID Theft, Medicare Consulting, Private Exchange
* Source: LIMRA (Life Insurance Marketing Research Association)
16
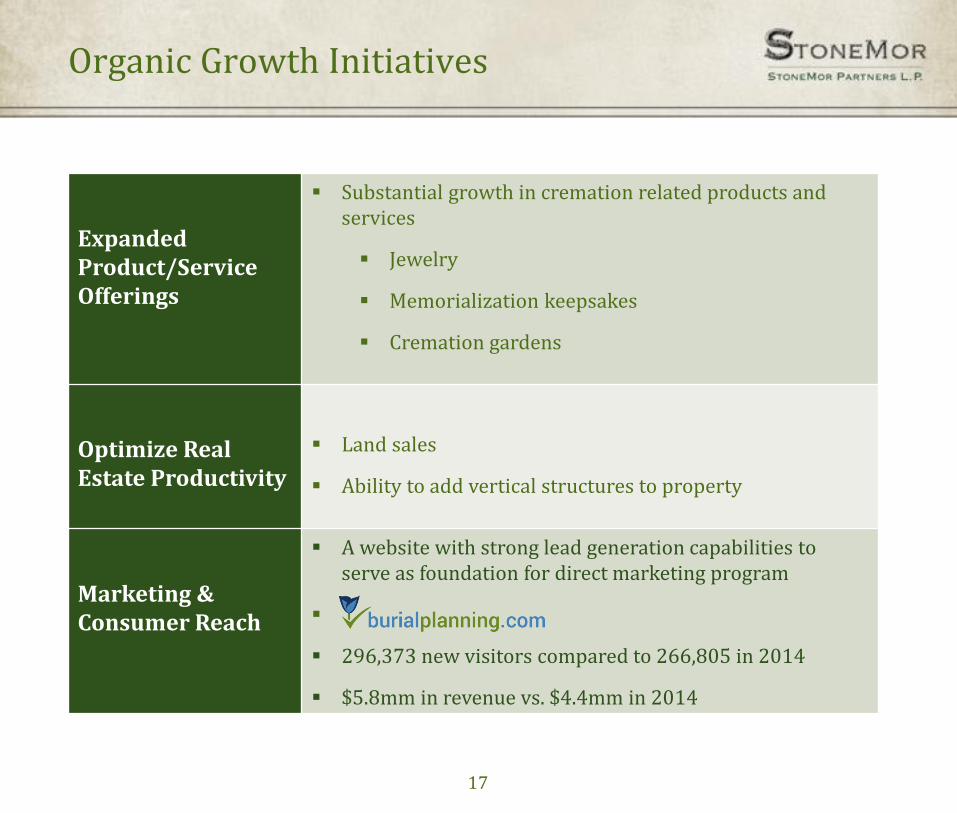
Organic Growth Initiatives
Expanded Product/Service Offerings
Substantial growth in cremation related products and services
Jewelry
Memorialization keepsakes
Cremation gardens
Optimize Real Estate Productivity
Land sales
Ability to add vertical structures to property
Marketing & Consumer Reach
A website with strong lead generation capabilities to serve as foundation for direct marketing program
296,373 new visitors compared to 266,805 in 2014
$5.8mm in revenue vs. $4.4mm in 2014
17
Growth Through
Disciplined Acquisition
Strategy
Prudent Balance Sheet Management
Deliver Reliable,
Consistent Value to
Unitholders
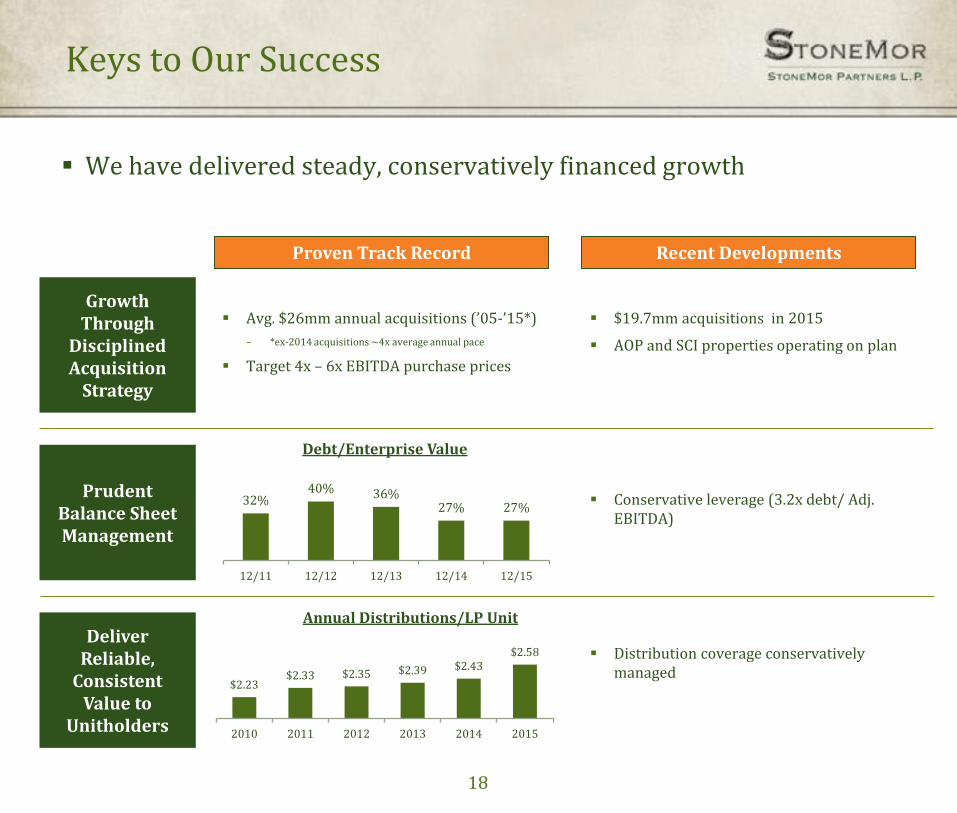
We have delivered steady, conservatively financed growth
Avg. $26mm annual acquisitions (’05-’15*)
– *ex-2014 acquisitions ~4x average annual pace
Target 4x – 6x EBITDA purchase prices
Proven Track Record
Keys to Our Success
Recent Developments
$19.7mm acquisitions in 2015
AOP and SCI properties operating on plan
Conservative leverage (3.2x debt/ Adj. EBITDA)
Distribution coverage conservatively managed
32% 40% 36%
27% 27%
12/11 12/12 12/13 12/14 12/15
Debt/Enterprise Value
$2.23 $2.33 $2.35 $2.39 $2.43
$2.58
2010 2011 2012 2013 2014 2015
Annual Distributions/LP Unit
18
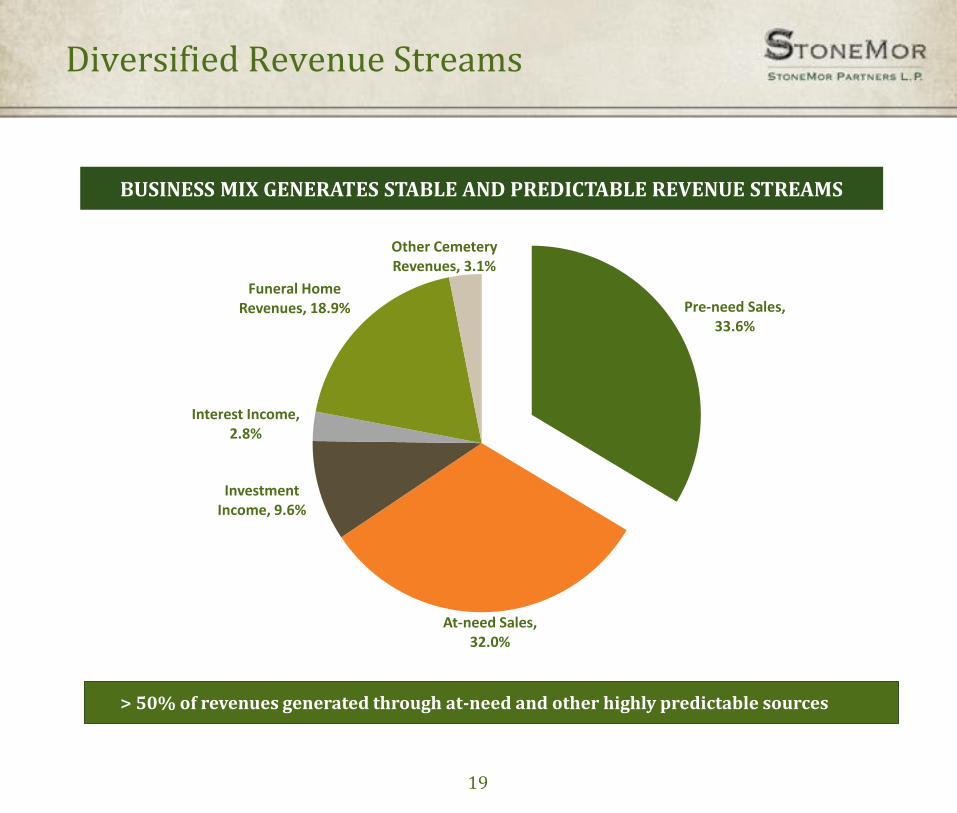
Diversified Revenue Streams
> 50% of revenues generated through at-need and other highly predictable sources
BUSINESS MIX GENERATES STABLE AND PREDICTABLE REVENUE STREAMS
19
Pre-need Sales, 33.6%
At-need Sales, 32.0%
Investment Income, 9.6%
Interest Income, 2.8%
Funeral Home Revenues, 18.9%
Other Cemetery Revenues, 3.1%
20
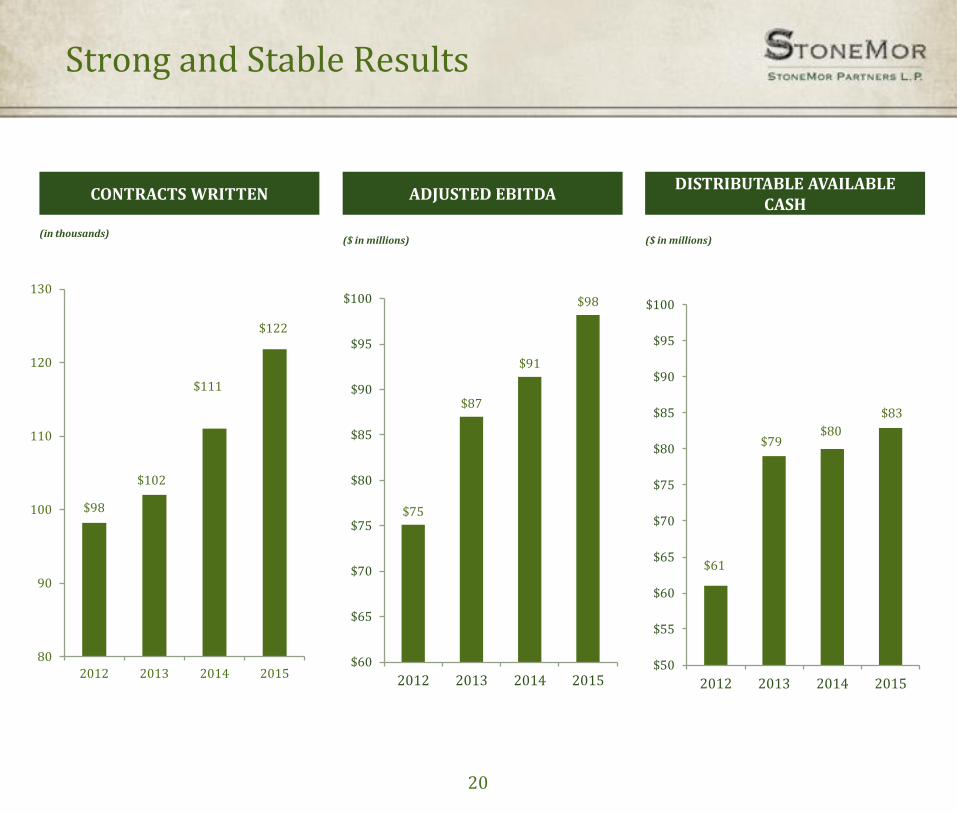
Strong and Stable Results
CONTRACTS WRITTEN ADJUSTED EBITDA
($ in millions)
DISTRIBUTABLE AVAILABLE
CASH
($ in millions)
$75
$87
$91
$98
$60
$65
$70
$75
$80
$85
$90
$95
$100
2012 2013 2014 2015
$61
$79 $80
$83
$50
$55
$60
$65
$70
$75
$80
$85
$90
$95
$100
2012 2013 2014 2015
$98
$102
$111
$122
80
90
100
110
120
130
2012 2013 2014 2015
(in thousands)
21
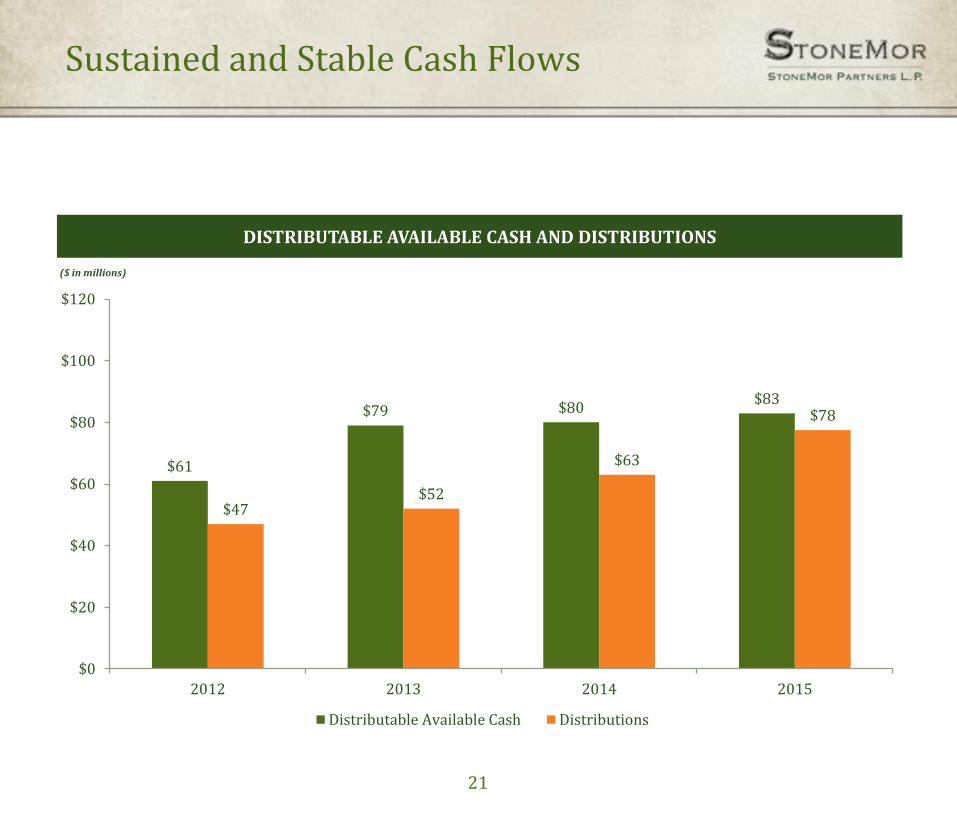
($ in millions)
DISTRIBUTABLE AVAILABLE CASH AND DISTRIBUTIONS
$61
$79 $80 $83
$47 $52
$63
$78
$0
$20
$40
$60
$80
$100
$120
2012 2013 2014 2015
Distributable Available Cash Distributions
Sustained and Stable Cash Flows
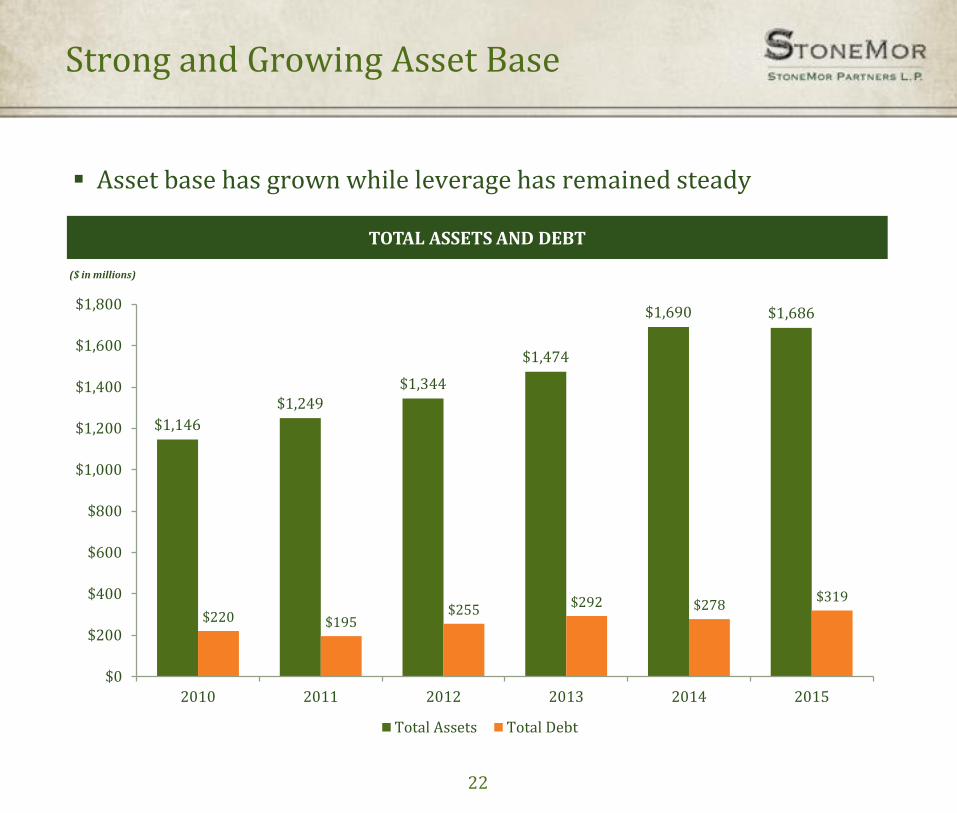
Strong and Growing Asset Base
Asset base has grown while leverage has remained steady
TOTAL ASSETS AND DEBT
($ in millions)
$1,146
$1,249 $1,344
$1,474
$1,690 $1,686
$220 $195 $255
$292 $278 $319
$0
$200
$400
$600
$800
$1,000
$1,200
$1,400
$1,600
$1,800
2010 2011 2012 2013 2014 2015
Total Assets Total Debt
22
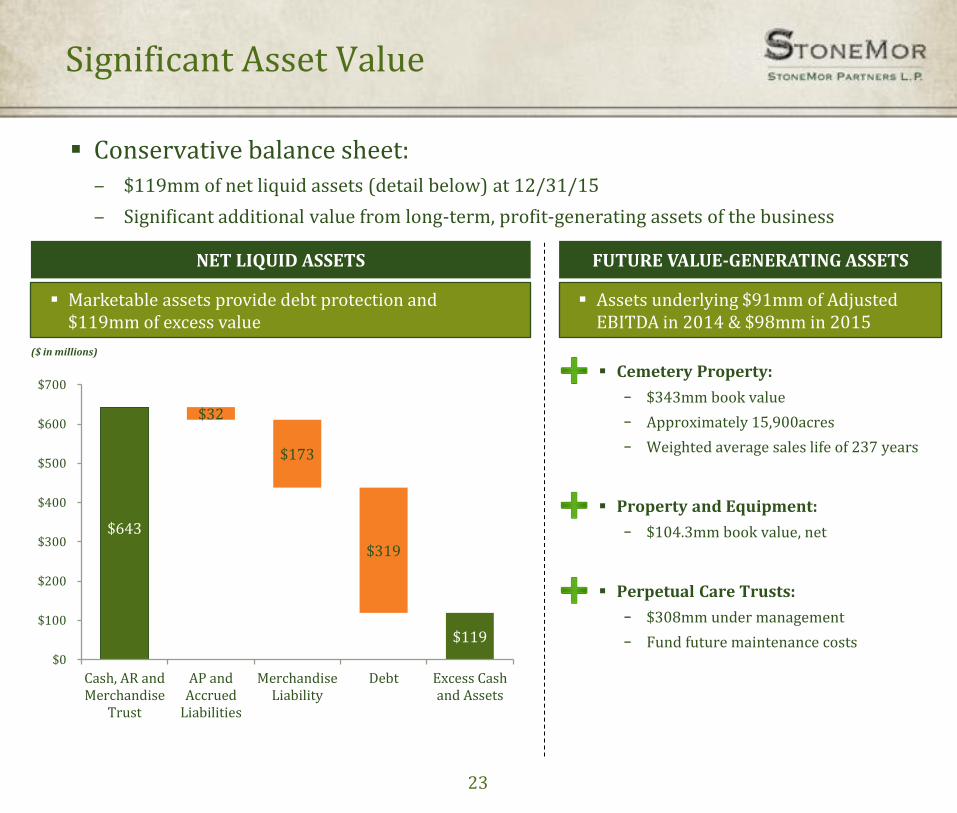
Significant Asset Value
NET LIQUID ASSETS
($ in millions)
FUTURE VALUE-GENERATING ASSETS
Cemetery Property:
− $343mm book value
− Approximately 15,900acres
− Weighted average sales life of 237 years
Property and Equipment:
− $104.3mm book value, net
Perpetual Care Trusts:
− $308mm under management
− Fund future maintenance costs
Marketable assets provide debt protection and $119mm of excess value
Assets underlying $91mm of Adjusted EBITDA in 2014 & $98mm in 2015
Conservative balance sheet:
‒ $119mm of net liquid assets (detail below) at 12/31/15
‒ Significant additional value from long-term, profit-generating assets of the business
$643
$119
$32
$173
$319
$0
$100
$200
$300
$400
$500
$600
$700
Cash, AR andMerchandise
Trust
AP andAccrued
Liabilities
MerchandiseLiability
Debt Excess Cashand Assets
23
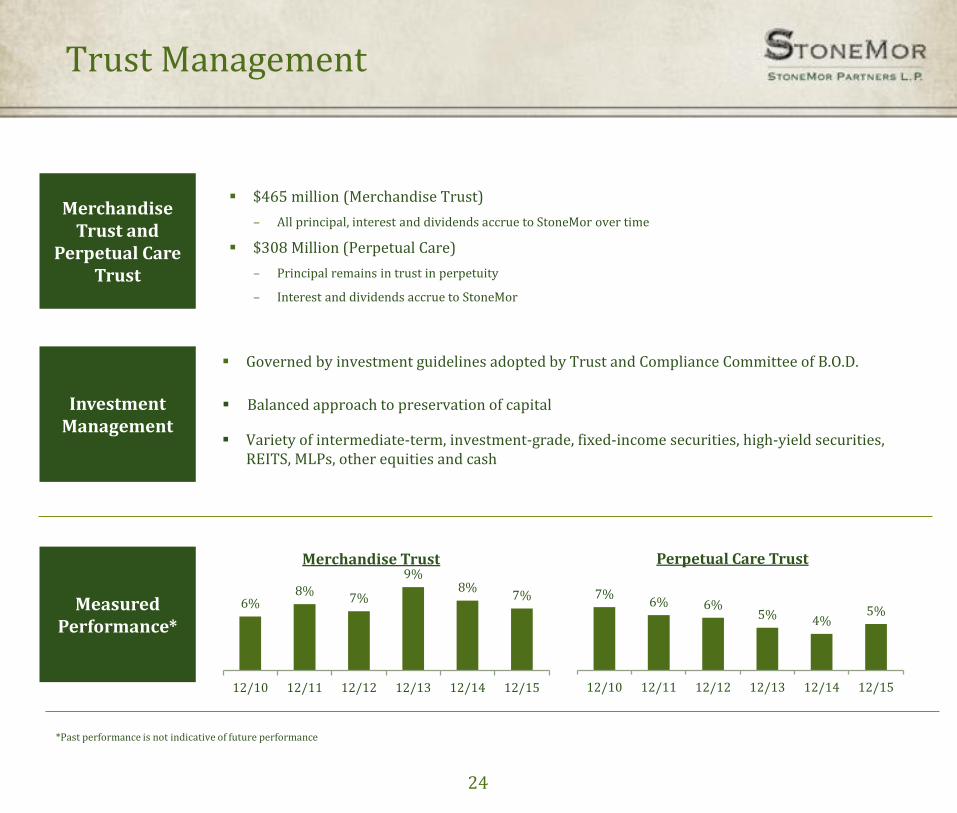
Merchandise Trust and
Perpetual Care Trust
Measured Performance*
$465 million (Merchandise Trust)
– All principal, interest and dividends accrue to StoneMor over time
$308 Million (Perpetual Care)
– Principal remains in trust in perpetuity
– Interest and dividends accrue to StoneMor
Trust Management
6% 8%
7%
9% 8%
7%
12/10 12/11 12/12 12/13 12/14 12/15
Merchandise Trust
Investment Management
Governed by investment guidelines adopted by Trust and Compliance Committee of B.O.D.
Balanced approach to preservation of capital
Variety of intermediate-term, investment-grade, fixed-income securities, high-yield securities, REITS, MLPs, other equities and cash
7% 6% 6%
5% 4% 5%
12/10 12/11 12/12 12/13 12/14 12/15
Perpetual Care Trust
*Past performance is not indicative of future performance
24
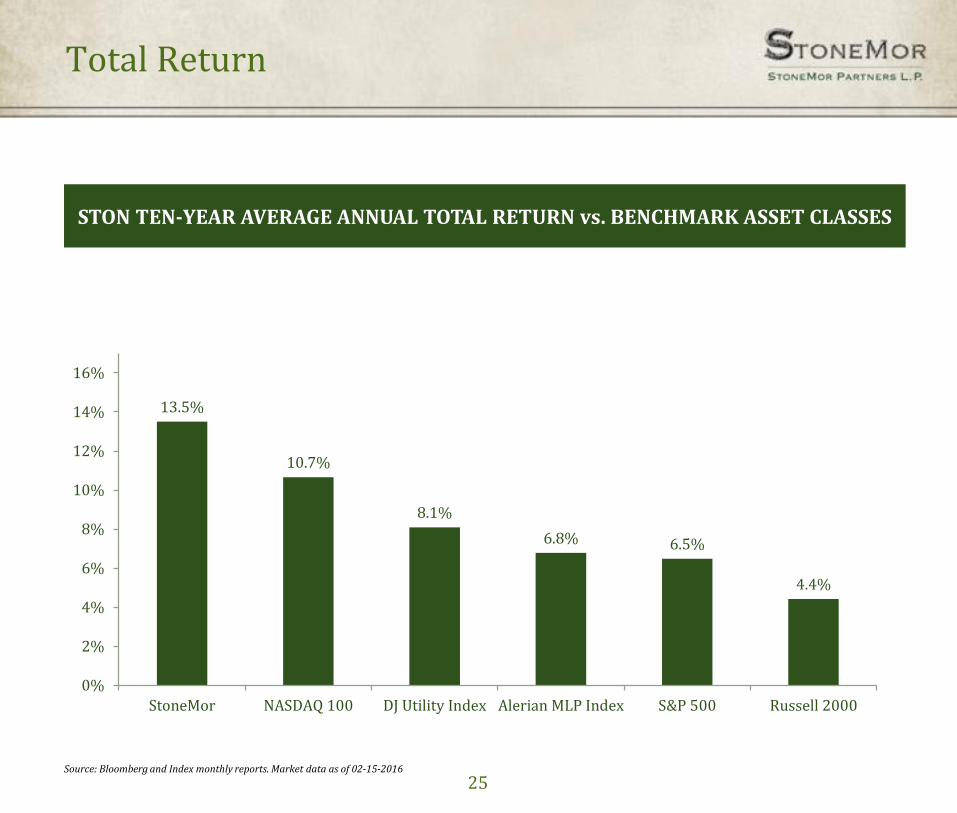
Total Return
Source: Bloomberg and Index monthly reports. Market data as of 02-15-2016
13.5%
10.7%
8.1%
6.8% 6.5%
4.4%
0%
2%
4%
6%
8%
10%
12%
14%
16%
StoneMor NASDAQ 100 DJ Utility Index Alerian MLP Index S&P 500 Russell 2000
STON TEN-YEAR AVERAGE ANNUAL TOTAL RETURN vs. BENCHMARK ASSET CLASSES
25
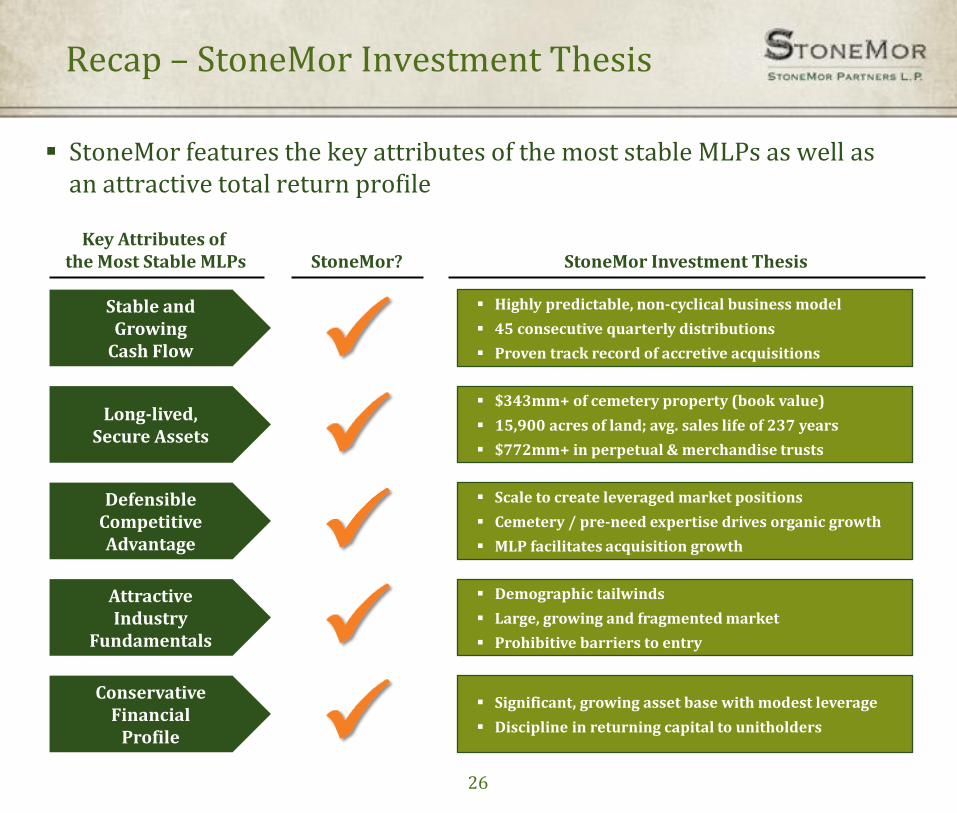
Recap – StoneMor Investment Thesis
Key Attributes of the Most Stable MLPs
StoneMor?
StoneMor Investment Thesis
StoneMor features the key attributes of the most stable MLPs as well as an attractive total return profile
Conservative Financial
Profile
Attractive Industry
Fundamentals
Defensible Competitive Advantage
Long-lived, Secure Assets
Stable and Growing
Cash Flow
Highly predictable, non-cyclical business model
45 consecutive quarterly distributions
Proven track record of accretive acquisitions
$343mm+ of cemetery property (book value)
15,900 acres of land; avg. sales life of 237 years
$772mm+ in perpetual & merchandise trusts
Scale to create leveraged market positions
Cemetery / pre-need expertise drives organic growth
MLP facilitates acquisition growth
Demographic tailwinds
Large, growing and fragmented market
Prohibitive barriers to entry
Significant, growing asset base with modest leverage
Discipline in returning capital to unitholders
26
Appendix
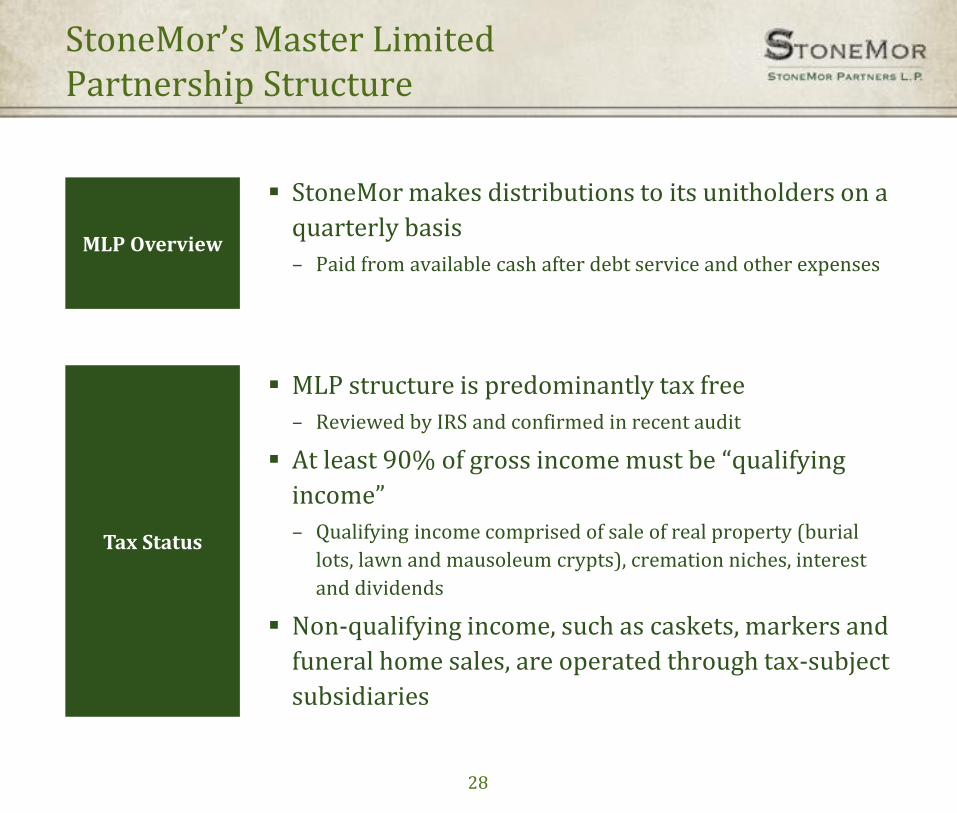
StoneMor’s Master Limited Partnership Structure
StoneMor makes distributions to its unitholders on a
quarterly basis
– Paid from available cash after debt service and other expenses
MLP structure is predominantly tax free
– Reviewed by IRS and confirmed in recent audit
At least 90% of gross income must be “qualifying
income”
– Qualifying income comprised of sale of real property (burial
lots, lawn and mausoleum crypts), cremation niches, interest
and dividends
Non-qualifying income, such as caskets, markers and
funeral home sales, are operated through tax-subject
subsidiaries
28
MLP Overview
Tax Status
29
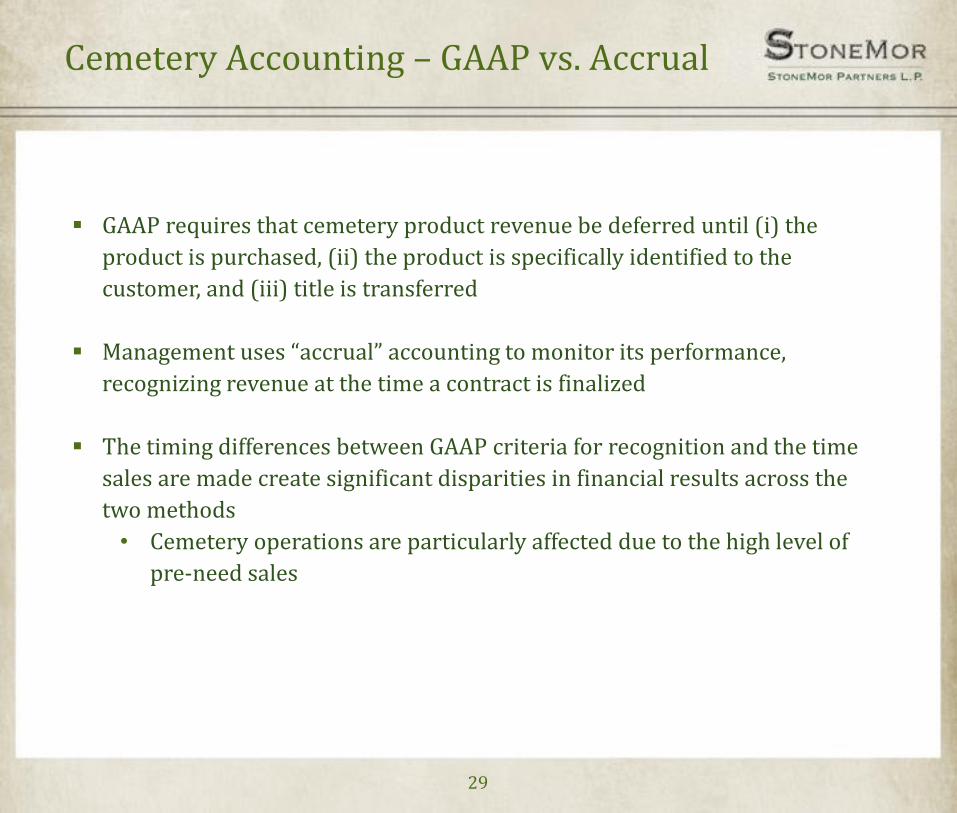
Cemetery Accounting – GAAP vs. Accrual
GAAP requires that cemetery product revenue be deferred until (i) the
product is purchased, (ii) the product is specifically identified to the
customer, and (iii) title is transferred
Management uses “accrual” accounting to monitor its performance,
recognizing revenue at the time a contract is finalized
The timing differences between GAAP criteria for recognition and the time
sales are made create significant disparities in financial results across the
two methods
• Cemetery operations are particularly affected due to the high level of
pre-need sales
30
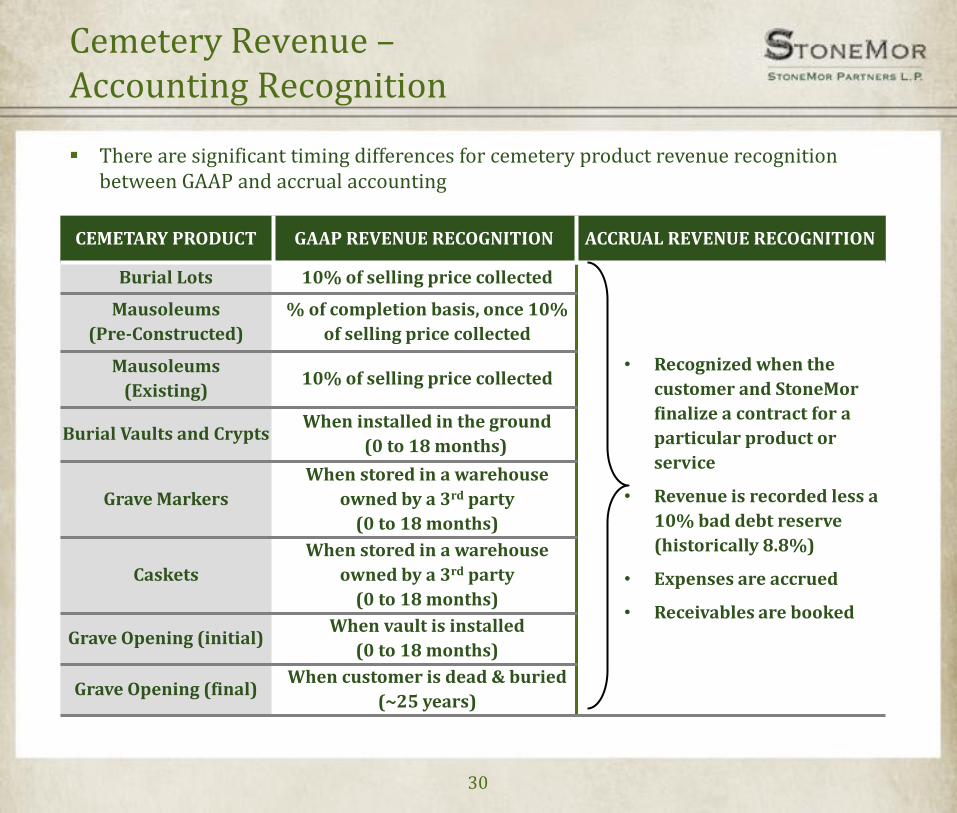
There are significant timing differences for cemetery product revenue recognition between GAAP and accrual accounting
CEMETARY PRODUCT GAAP REVENUE RECOGNITION ACCRUAL REVENUE RECOGNITION
Burial Lots 10% of selling price collected
• Recognized when the
customer and StoneMor
finalize a contract for a
particular product or
service
• Revenue is recorded less a
10% bad debt reserve
(historically 8.8%)
• Expenses are accrued
• Receivables are booked
Mausoleums
(Pre-Constructed)
% of completion basis, once 10%
of selling price collected
Mausoleums
(Existing) 10% of selling price collected
Burial Vaults and Crypts When installed in the ground
(0 to 18 months)
Grave Markers
When stored in a warehouse
owned by a 3rd party
(0 to 18 months)
Caskets
When stored in a warehouse
owned by a 3rd party
(0 to 18 months)
Grave Opening (initial) When vault is installed
(0 to 18 months)
Grave Opening (final) When customer is dead & buried
(~25 years)
Cemetery Revenue – Accounting Recognition
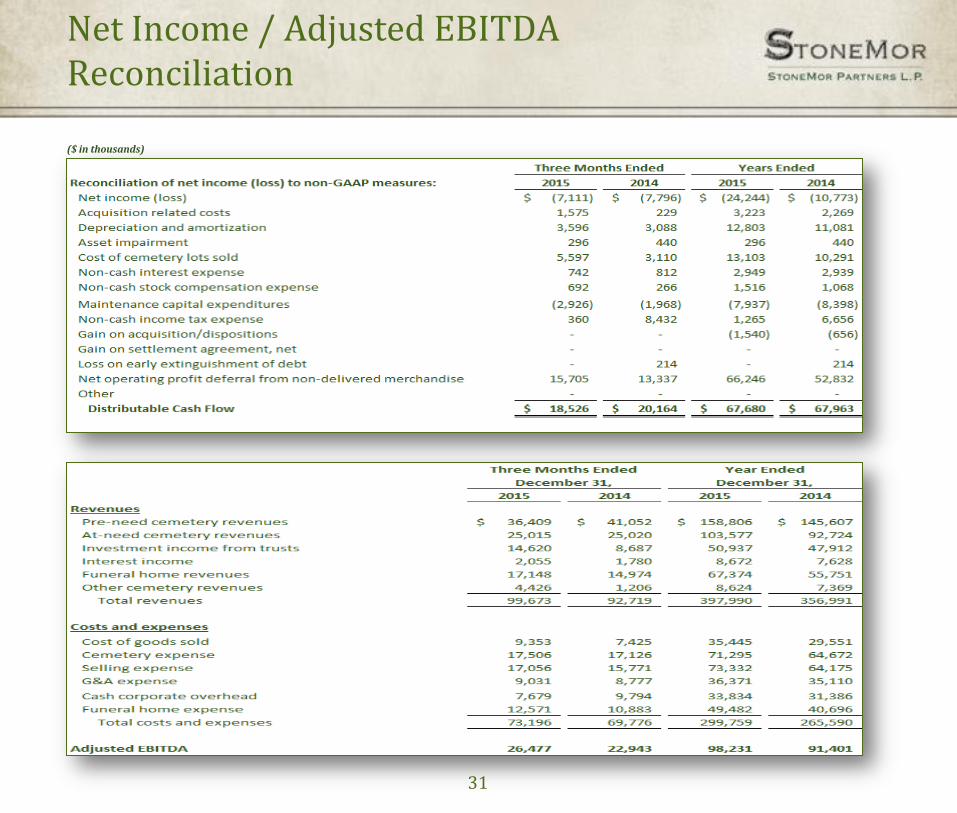
Net Income / Adjusted EBITDA Reconciliation
31
($ in thousands)
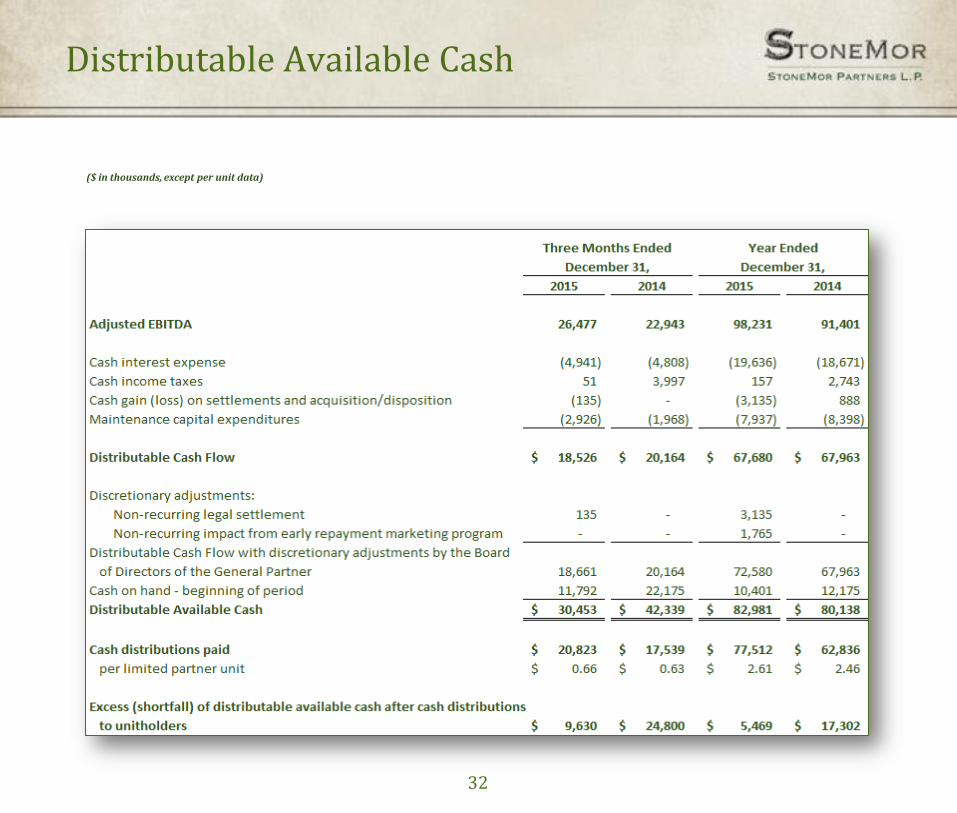
Distributable Available Cash
32
($ in thousands, except per unit data)
Thank You


