THE ECONOMIC AND SOCIAL RESEARCH INSTITUTE WELFARE STATE DEVELOPMENT IN EUROPE SINCE 1930: IREI~\ND IN A COMPARATI\rE PERSPECTIVE WAISFER KORPI TWEN’IS" THIRD GEARY LECTURE, 1992 Copies of this paper may be obtained fivm The Economic and Social Research Institute (Limited Company No. 18269). Regislered Office: 4 Burlington Road, Dublin 4, Ireland. Price l R£5.00 ISBN 0 7070 0140 4
Transcript
THE ECONOMIC AND SOCIAL RESEARCH INSTITUTE
WELFARE STATE DEVELOPMENT IN EUROPE SINCE 1930:IREI~\ND IN A COMPARATI\rE PERSPECTIVE
WAISFER KORPI
TWEN’IS" THIRD GEARY LECTURE, 1992
Copies of this paper may be obtained fivm The Economic and SocialResearch Institute (Limited Company No. 18269). Regislered Office:
4 Burlington Road, Dublin 4, Ireland.
Price l R£5.00ISBN 0 7070 0140 4
Walter Korpi is Professor of Social Policy at the Swedish Institutefor Social Research of the University of Stockholm. This paperhas been accepted for publication by the Institute which is notresponsible for either the content or the views expressedtherein.
Welfare State Development in Europe Since 1930:h’eland in a CompaTntive Perspective
The development of the modern welfare state is one of
the major social and political changes in the Western countriesduring the past century. Together with a group of colleagues atthe Swedish [nstitt|te for Social Research, Stockbolm University, lhave for some time been involved in a comparative study of tbischange in 18 OECD countries. The purpose of this comparativeresearcb programme is to describe welfare state development inthe Western countries, to attempt to explain tbis development,and also to look at some of the consequences of welfare statedevelopment.I To use tile vocabulary of T. H. Marshall ([950)one coutd say that we are studying the development of socialrights and the emergence of social citizensbip in the Westerncountries.
My lecture is based on this comparative researchprogramme on welfare state development. I will here begin b),outlining tbe basic feattn’es of our comparative data base.Thereafter I will describe some features of the development ofWestern welfare states with respect to old age pensions andsickness insurance. In this context ! will attempt to putdevelopments in h’eland into an international perspective, andnote some examples of what for a foreign observer appear aspeculiarities in the development of the h’ish welfare state.Finally, 1 will take tip the question of different strategies forequality, make an attempt to assess their relative effectiveness,
and also briefly look at developments in the labour market.
The Comparative Data Base on ~l~lfare State Development
In the comparative welfare state research pl’ogranlme wehave constructed a data base which includes Australia, Austria,Belgittm, Canada, Denmark, Finland, France, Germany, h’eland,hal),, Japan, Tile Netherlands, New Zealand, Norway, Sweden,Switzerland, the United Kingdom and tile United States. Theseare the more or less rich and indusu’ial OECD eounu’ies with a
population above one million and a history of uninterruptedpolitical democrat), during the post-war period. The main socialillStlr.2nce plogvatllmes in these COLiiltries have becll exalnilledin 1930, 1933, 1939, 1947, 1950 and then every fifth year tip to1985. Data for 1990 arc now in progress.
The programmes inchided are the five main legislatedsocial insurance programmes - old age pensions, sicknessinstlrance, Wol’k accident il/suranee, unemploynlent instlrance,and family benefits. These programmes are intended to providefor ahet-native solll’ces Of incon’le Whel’l incon’*e from normalSOtll*Ces are strained or interrupted - pernlarlently as in the caseof old age or temporarily as in terms of sickness, work accidentsor unenlployment.
We have described the development of these fiveprogrammes in terms of the social rights they give to citizens vialegislation. Thus we bare coded and attempted to quantif), socialinsurance legislation in terms of the extent to and the conditionsunder which they replace lost income or provide income forcitizens.
Cenu’al aspects here concel*l) income replacenaent i’ates.As a baseline for comparing income replacement in socialinsurance progr;ullmes over time and between COtlntries, wehave chosen to relate benefits to the wage of an averageindustrial worker. Such a baseline is more inforrnative andrelevant than nlost alternative olles, based for example Ollexchange rates. Here both benefits and wages are taken net oftaxes and social security contributions. We have computed net
benefit rates for different types of households - single persons,couples with children, and couples without children.
We have also described conditions for eligibility forbenefits - conditions in ternts of requiremenLs tbr contributions,labour Iorce i:~articipation, waiting days before benefits are paidout in sickness and unemplo),ment, duration of benefits, and thefinancing of benefits. In addition, we have tried to determinethe coverage of social insurance, that is what proportion ofrelevant population groups that have the righl to the benefit.
Here it is only possible to present to you a very smallsamp|e of the data we have. I will focus on development of oldage pension and sickness insurance in a few Et~ropean cotlnu’ies,which should be of inlerest in this context- Ireland, tile UnitedKingdom, France, Germany and Sweden. In addition I will give)’ou some averages for tile 13 European countries and for all our18 countries.
OMAgePensions
Let us begin with old age pensions, the programmewlfich is the Siilgle most COSI.ly one and ill i11ally wa),s a key socialinsurance programme. In F.urope, besides means testedprogramn~es, we find at least two other types of pensionprogrammes. 011e of d’tese is the classical "corporatisuc" modelof pensions, where entiLlenlents to pensions are based ozl workrequirements, different occupational groups have had differentpension schemes, and pensions al’e related to pl’eviolls incol|le.
Another type of old age pension is the so called Peoples’Pension or Folkpension. In this model entitlements to pensionsare in principle being based on citizenship, not on work record,and flat rate pensions have been typical. The Peoples’ pensiot’tidea meLtllS that most citizens receive a pension, but a nfinimun~level pension, a safer), net which does not provide incomesecurity.2
Replacement Rates: To what extent do pension programnlesreplace previous income? We have computed different types ofreplacement measures - for minlnlttna pensions, minimum work-related pensions, pensions for a typical industrial worker withvarying degrees of labour force participation, and maximttmpensions.
The replacement ratio I will present here is calculated interms of the pension a newly retired industrial worker will get,assuming that he has just passed the normal pension age andthat he has worked for 35 ),ears. I will present replacement ratesas an average for a single person and for a married couple,where both are above pension age but only one of the spouseshas been working (that is the classical single-earner family).
It should be noted that the replacement t,’ates here referto the pension for a newly retired worker. If we were to includeall elderl), citizens oJ1 pensions, the ceplacement rates ~,ould belower, often considerably lower. This is because man), of theelderly have entitlements to pensions based on earlier rules,which often have been improved Ibr later age groups.
How generous have old age pensions been? In the early1930s, legislated old age pensions programmes existed in 13 ofour 18 countries. During the 1930s in the countries withlegislated old-age pensions, average income replacement forpensioners ~’r, ts low, around 2.5 per cent oF at] average industrialworker’s wage (Diagram I). It increased with about 10 per centin the immediate post-war years. However, the main accelerationczune in the 1960s, in the Golden Age of western capitalism. Inspite of the post-1973 economic difficulties, the increase hastended to continue throughout the 1980s. To a large extent thisincrease reflects the naal.lll’ation of income i’elated pensiollprogrammes.
As is well known, h’eland inherited the British meanstested pension programme of 1908. In h’eland in the 1930s,replacement l’ates were above the average of the F_.tll’opeall
-- Iz ~C~Ci ... e-.. Av orog*g for -- AverOg~t forEutopeon count de~ eight een cce~ntdes
COUtatl’ie5. There were some improvements in Irish social welfareprogrammes in the 1930s.3However, the peak in the h’ishpension replacement rate indicated by our data for 1933 was notthe result of reform activity during the depression. ThroughotJtthe 19305 pensions remained at a maxinatma of 10 shillings perweek, £26 per )’ear pet- person. Changes in replacement r:.ttcsrel]eet instead the fact that while benefiLs Wel’e unchanged, there3 Onc:lnpll,)’mcrnt tL~i~utllce "~".L~ inll(xhl,:ed ill 1933 alld wid~,w’~ i~nsi,)ns in 1939 (Magllile) It.18G.
5
was a considerable change in industrial wage levels, first alowering of wages in 1933 and then some increase up to 1939.
From 1939 to 1960, h’ish pension replacement ratesstagnated at around tile 30 per cent level. After 1958, however,Ireland experienced a rather drastic change in the politicalclimate (l?ween et aL 1990). The introduction of the contributorypensions in 1960 improved replacement rates considerably. Vet,with statutory pensions based on flat rate I)enefik% in spite ofincreasing benelits h’ish replacement rates could not catch upwith those in the other Western countries, where income relatedprogr.7|nlmes were common. There was, however, a COlasideral)Ieincrease in h’ish flat rale benefits fi’om 1980 to 1985.
Let us now COIlip.~ll’e the development o1" [rish petasionswith those in the United Kingdom, France, Germany, andSweden (Diagram 2). In the 1930s Irish placement rates were atthe German level. Although both Ireland and Britain paid 10shillings per week in old age pensions, because of the higherwage levels in Britain, British replacement rates wereconsiderably lower than in h’eland. In the post-war period h’ishpension replacement rates have followed the British ones quiteclosely.
Of the countries considered here, especially Germanybut also France represent the classical corporatist model. InGermany, all pensions have thus been tied to a work record,requiring a minimum of 25 years of insured employment and
taking into account up to 45 years of contril)utions. This workrequirement means that a relatively large proportion of citizens -especially women - have not been qualified for a pension. In the1980s the German average pension level was relatively low:ompared to that in many other countries. This reflects the [’,acthat our figures give an average pension for a single person and
for a couple, where one of the spouses has no work record, andthus has no pension. By 1985, Irish pension levels have thuscaught up with and surpassed the German ones. Howevel, in
German), ,15 ),ears of work inste~ld o1:35 would increasereplacement I’~1t¢2s b)’ 6 -7 i)el" cent, bringing tile :tver:~ge Germazlrepl~lcement ,’ares up to the Irish level.
Jl3 FI’,qI1CC, p~nsiol’l replacement i’:lles :.llso increased inthe post-war period up to 1965. lqowever, in the French I:legi.leGenre’ale there was a ceiling for wages taken into accottJlt. JZFom
1955 to 1975, tbis ceiling remail~ed stable. As a t’esult of ~¢ageincreases above the ceiling, French pension replacement ratesdropped q~ite a bit u~til I.he ceilil~g was illcrea,~ed at the end ofthe 1970s.
Tile Nordic cotmtries, irlcluding Sweden, bave beentypical exponents of the universal flat rate Peoples’ Pensions. Upto 1955, Sweden therefore had lower replacement rates thanIreland and many continemal I~ul"opean countries. In the 1950sand 1960s, however, Sweden as well as Finland at’td Norwayadded an incolne related work pension to the flat rate pension.This new pension system thus combined the idea of universalismwith the idea of earnings relatedness, creating what could becalled an "institutional" model of pensions. When thisinstitutional system matured in tbe 1980s, Swedish pensiotareplacement levels became the highest among these 18COUll I.l’ies,
Also in Britain, some efforts were made to add anear~lings related pension to the natio~al minimt~m o~le.Attempts at such reforms did however generate politicalcontrovc’rs): Tbe earnings related component in British pe~lsio~shas therefore been relatively small. However, as a resuh of ataearnings related pension J~ltroduced by the Labour governmentin 1978, replacement rates in Britain increased considerablyduring the Conserwltive government in the 1980s.4
In 198.5 there was considerable variation betwee~acountries in terms OJ" pension replacement rates. Among out" 18
countries the highest replacement levels in old age pensionswere found in Sweden, Finland, Belgium, Norway, Italy andAustria. As mentioned above, Sweden, Finland and Norway barecomplemented their flat rate Peoples’ Pensions with eart~ingsrelated pensions, l?,elgium, Italy and Austria represent classical"cocporatist" pension systems with relatively strong earningsrelated pensions.
’l I lel,lr we Ill tl~[ i elllellll~l- their llli5 eai’ll]l~gs I elattltd ~llpplglllell I ill I~l il~lill i~ giVell I III J}’ tO tht ~f.e
t’el:t:lltly i el~l e(I. [n ~51"it~l{ll, 1h¢2 m:~il I1" p~ll’l ill’the ~![llerly. I hl~l’efol e. Ila~’e ~mly hil{| 11112 nlillilll~llll level
fiat I~,lte pellsit ~ll. This Ill ~babl}’ expl:ti/ls the I~tl’gt: pml~}rtion tlf l:~r ;ullllllg the elderly.
Wilh a 61 per cent l’eplacement l~,te in 1985, h’eland fellinto a middle category together with Dennlark, France, NewZealand,.iapan, USA, Switzerland and the United Kingdom. Theclearly lowest replacement level was found in Austr:dia, which 17),1985 h:ld moved back to its Iraditional means tesled pension
programHlc.
Coverage: Another :lspcct of the pension systcnl it the proportic~nof citizerts who have a right to an inclividual pension when the),
retire. This we can refer to :is the coverage rate ofpe~zsio’lzprofframmes. In the c:lse of pensions it it reasonal]le to relate theilllnlber of insured persons I.O l.he poptdatiort in the ;tges 15-65ye~lrs.
In the 15 countries which had legislated old age i~ensionsiri the 1930s, about half of the citizens were insured, and thush:ld :l right to ~l pension when the), attained normal pension age.This coverage r;ite increased up to arottnd 80 per cent in 1960and has remained at that level up to 1985.
In 1985, however, pension coverage rates variedconsiderably. Eight countries (Canada, Denmark, Finland, TheNetherlands, Norway, Switzerland, Sweden, and New Zealzlnd)had universal systems of basic pensions with complete coverageof the population. In countries wilh work related pensionsystems, such as.lapan, Germany, USA, Austria, France, Italy andI?,elgium, coverage was however much lower. In Ireland, in spiteof the extension in 1973, the proportion covered 17), old agepelasions remains among the lowest, arottl’td 50 per cent(inchtdiog public employees).
Sic]¢lless hlsura*lce
Let us now also look at sicklleSS instll’ance, one O[" the
soci:d instwzuace progran’Ul~eS intended to protect for shol’t-lerm
losses of income. I am here concerned only wiLh C~tSll bellCfik~,
not with hospital Lreatment, etc. As is well known, h’eland tookover the 191 I British insurance programmes for sickness andLII1elllp Jo)qllell z..
Replacement rates: In sickness insurance I will discuss thedevelopment of average net repk~cement levels, defined as anaverage of four measures: benefits for a single person with
respect to short-term illness (one week) as well as long-termillness (26 weeks) and benefits for a couple with a dependentspouse anfl I.WO nlinOl" childl’en, also here shol’t-tel’nl illness aswell as long-tm’m illness.
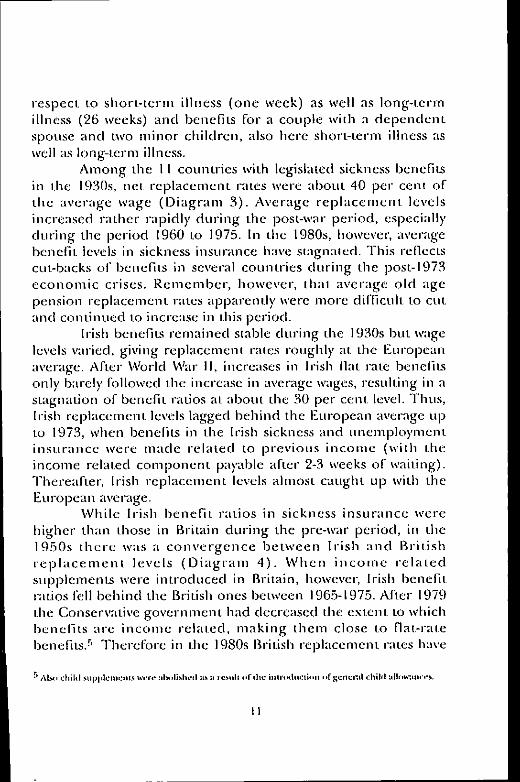
Among tile I I countries with legislated sickness benefitsin Ihe 1930s, net replacen~ent rates were about’f0 per cent oftile average wage (Diagram 3). Average replacement levelsincreased rather rapidly during file post-war period, especiallyduring the period 1960 to 1975. In the 1980s, however, averagebenefit levels in sickness insurance have stagnated. This rellcclScut-backs of benefits in several countries during the post-1973economic crises. Remember, however, that average old agepension replacement rates appa]’enlly were more difficuh to cutand continued to increase in this period.
h’ish benefik~ remained stable during tile 1930s but wagelevels varie0, giving replacement rates roughly at the Europeanaverage. After World War II, increases in h’ish Ilat rate benefik~only barely followed the increase in average wages, resulting in astagnation of benefit ratios at about tile 30 per cellt level. Thus,h’ish rcplacenmnt levels lagged behind the European average upto 1973, when benefit.s in the h’ish sickness and unemploymentinsurance were made related to previous income (with theincome related coml)onent payable after 2-3 weeks of waiting).Thereafter, Irish replacement levels ahnost caught up with theEuropean average.
While Irish benefit ratios in sickness insurance were
higher than those ill Britain during tile pre-war period, in tile1950s there was a convergence between h’ish and Britishreplacement levels (Diagram 4). When income relatedsupplements were introduced ill Britain, however, Irish benefitratios fell behind the l?witish ones between 1965-1975. After 1979the Conservative government had decreased tile extent to whichbenefits are income related, making them close to flat-talebenefits.5 Therefore in the 1980s British replacement rates have
been brought down almost to their pre-war levels. At the sametime h’ish benefit levels have incre:Lsed as a result of income
rc kil.ed supplcnlents.
Since tile 1970s the highest replacement rates are fotmd
in West German),. There the regular untaxed sickness insurance
"~-- Swe43 8¢~ II elo~cI ~ uKFro~fl .... Gelmc1’~¥
bellellLS w~-Is colnpJenlented with ~| w~|ge COI1LiI1LI~ILJOI1 schelne J~of
workers, which was introduced in two steps (1957 and 1969).This Loh.forlzahht~lgs~eselz gives the full wage during the first sixweeks of illness. Thus for long-term illness, in combination thetwo German systems give more than full ct)mpensaLion of wages,
with .~m average at arotulcI 1 l0 per cent.Up Io 1955 Sweden had a voJtlnl;iry, stale-snpported
sickness illSlil’;ince SVSI.enl with very low rcphLcemcnt rales, lowert.h;m those for example in IrelanlcI. In 1955, however, a universalprogramme with income related benefils w:ls introduced. In I.he1970s benefit levels were made laxal)le and increased to 90 perCeill oJ" earnings,fi In l’~l’;lllee repl~lccnlent rates have notincreased m:wkcdly tluring tile post-w~.|r period and are nowlower t.h:m in Ireland.
In the period before World War 11, differences between
countries in replacement rates were relatively limited. In theposl-w:lr period, however, variation among the Europe;Lncountries has increased. The full range of v:u’iation in averagerepl;lcenlenl levels in our 18 eottntries in 1985 is considerable.x,.Vt: find the highest rcplacenaent levels (at least 100 per cent) inGermany Austria, and Norwa); where employers continue to payfull wages during the first period of illness. In Sweden andFinland about 90 per cent of wages were replaced. Switzerlandhas a very pluralistic but state supporte¢l sickness insurancesystem, with rephteement rates at’Otlnd 80 pet" cent. 7 h’ishbenefit levels (70 per cent) came in a middle category oFcountries, including Belgium, New Zealand, .Japan, Denmark,It:dy and The Nedaerlands. The weekly earnings benefits in13ritain were lower than the means tested belaefits in Australia.h’ish Family Ideolog),: There is one rather unique characteristicabout betael’it levels in Irish sickness and unemph)yment
1) IIJ 1~)1 Swedi~.h t~llefil Ic".’e I~ Inawe. how c".’l: r. I~ren I~ ~,~’er Ird ~tnd am ~lhen (leon ea~4" i~ ~h~r(tllled I~w
’7 Thet e. c~ur d:lla lle~:r’il:¢ tile relatively Iglrneroet~ I:~:nelil.~ ~c~iIli~ to Ineml:~’I ’* in llle ~lrongesl tlllion
:ull~.lg wq~t kers. dir Schtt;d:.~i~clu. IJhr~J-und ,~fclallatbdt,.n~,rband.
13
insurance. This is the extent to which families arc given aprivileged position in these two social insurance systems(Diagram 5). In the 1950s rclativel), generous increments fi~r adependent spouse and I’o1" children were introduced in sicknessinsurance.8 As a resuh, in Ireland the replacement rate for afamil), was aboul 20-9_5 per cent higher than that for a single
8 Similar stlpplcmellI.’l "~el’c ;tl~ [nuo(hlct’(l in tlllt~lnpll )~’znell[ inlu i~,1 iiI" (.
14
person (,~lf[I.~l- 1973 rel~lacement t~, tes for long-term illness wereincreased with an income related component).
The extent to which the family is given a favouredposition appears to be greater in h’eland than in tile othercountries. Perhaps it reflects tile strong influence of CatholicidcologT in h’eland. The result is that for families with long-termillness, the Irish replacement ratio at around 100 per cent is oneof the highest in Europe.
DIAGRAM 6. SICKNESS INSURANCE,
1930-1985:Net Income replacement rate (26 weeks) for a
Coverage: With respect to coverage in sickness insurance, it isreasonable to relate the number of insured to the size of thelabour force, that is to the number of citizens dependent on astream of earned income. Among the | 1 countries Lhat h~td
sickness insurance in 1930, coverage was around 50 per cent ofthe labour force (Diagram 7). Also in sickness insurancecovel’~tge ilacl’eased durillg the first post-war decades as illstll’ance
sonlewhat I)elow tile European average but have increased with
rough])’ the same rate as in Europe.
Tal)le I : Coverage of Sickn~s Insurance (Cash Benefits)
in l~zbour Force (%) 1985
I. l)ennlark 100
2. Finland 100
3. N orv,,ay 100
,I. Sweden 100
5. Switzerland I O0
6. Canada 89
7. France 88
8. Belgium 84
9. Ausu’ia 83
10. United Kingdom 79
I I. Italy 77
12. The NetheHands 77
13. Germany 76
14. Ireland 73
15. J:lpan 56
16. Austr:dia 0
17. New Zealand 0
18. USA 0
17
The extension of coverage in Ireland to all employees in1973 can be noted here as a slight increase in 1975 (cf Diagt’am7). However in 1980, covelq, ge drops somewhat. A sinlilar dropin the 1980s can be observed also in some other countries, andcat’J prol)ably I)e interpreted as a resuh of increasing levels ofunemployment.
If we look al the coverage of sickness cash insurance inthe labour force in our 18 countries in 1985 we find thefollowing picture (Table I). The Nordic countries as well asSwitzerland have universal coverage of the working population.Coverage is high, above 80 per cent, also in Canada, France,Belgium and Austria. With 73 i)er cent covet,’age, h’eland comesin a middle category together with Germany The Netherlands,ltal),, and the United Kingdom, where coverage ranges fl’om 76to 79 per cent. The.lapanese coverage is I)elow 60 per cent. InAustralia and New Zealand onl), illeans tested programmes exist,thus no soci:d insurance programmes. In 1992 the United Statesis the only western country which lacks a national sicknessinstlrallce progralll me.
Why No Corpm’ati.wn in h~sh .Social h~surance?
When I compare the institutional structures of h’ishsocial insurance programmes with those in Europe, it so’ikes methat something is missing in the Irish system. ’~’~,qaat one mighthave expected to lind in a country with such a strong Catholic
church are the classical corporatist arrangements in theinstittltions of social insurance programmes. On continentalEurope such corporatist institutional arranget’nenls havetypically taken the form of different insul=mce programmes fordiffcrent occupational groups and tripartite participation byemployers, employees, and the state in the governing of socialinsurance systems. Such institutional aspects have I)een clearlyvisible for example in German)- Austria, haly, France, Belgiumzmd The Netherlands.
18
My reading on h’ish developmenL~ indicate that at leastthroughout the 1940s there have I)cen attempts to createcorporatist (in h’eland the)’ were referred to as "vocational")instittltions, ill the constitution as well as in social insurancesystems (Wh),te, 1971; Lee, 1989). In social insurance theNational Health Insurance Society, which was in charge ofsickness insurance betwcen 1933 and 1950, apl)ears to have beenthe best example o!’such a "vocational" institution.
However, in Ireland, attempts to introduce"vocationalism" into social insurance instilutions appears to havedisappeared since the 1950s. The background to thisdisappearance would not al)pear to have I)een Fully explained.
St,’ateg#e_~" for Equality
An important issue ill the development of social policyhas been the question how we should arrange social insuranceprogranHnes so that we c:.ln increase equa]it), and decrease
poverty. These issues have been discussed and debated I)etween,as well as within, various political parties but also within thelabour movements in many counu’ies. Flere we find at least threemajor apl)roaches.
The means testing stratelo, argues thai by making benefiLSine~.lllS tested we cat] ensure that social programmes areredistributive. In this strategT, means- or income testing is usedto guarantee that only those who are ill greatest need of pul)licsupport will be supported. "File restdt is that I)enefits are givenprimarily to the poor.
It is obvious that per pound or dollar of money spent onsocial programmes, the means testing su’ategy has a strongrcdistributive effect, or what could be called a sleepredistributive gradient. A strong reliance on such programmescreates what - following Richard Titmuss -we call term ;t"marginalistic" Wl)e of welfare state (Korpi, 1980a).
19
[11 recent decades, the means testing strateg3, has beenwell developed for example in the United States, where theneedy have been defined in terms of an official poverty line. InPresident Lyndon Johnson’s "War on Poverty" in the 1960s,serious attempts were made to assure that only those below theofficial poverty line would get support.
In tile Vietnam wal, the US Air Force used the concept of"target efficiency" to measure tile proportion of all boml)s thatactually fell on the targets. At approximately the same time,social scientists evaluating the success of antl-poverlyprogrammes in the War on Poverty, also used the concept of"target efficiency", to measure the proportion of all dollars spentin the War on Poverty that actually fell oil tile pool, that is tilecitizens below the official poverty line. This was seen as animportant criterion for the efficiency of the programmes (Korpi,1980b). Also in other countries the means testing su’ategy has
traditionally been a very important one in attempts to improvetile situation of the poor.
In tile flat rate strategy it is proposed that we shouldattempt to increase equality by providing all recipients with thesame benefits. Such universal flat rate benefits shotlld provide asafety net below which no citizen is allowed to fall. This type ofargument has been relatively common not only among liberalparties but also among social democratic parties in Europe. Sucha flat rate strategy was, of course, also central for WilliamBeveridge.
While both the means testing and flat rate strategies havesteep redistrlbutive gradients, in the long run, however, they arelikely to have other effects which will tend to counteractredistribution. Citizens who have been accustomed to a relativelyhigh standard of living are not likely to accept a considerable fallin their living standard when tile), get sick or when they retire.Therefore high-income earners are likely to search for private(individual or occupational) alternatk,es or complements to tile
20
flat. rate or minimum benefits supplied b), the public sector. Suchef[’orts in turn may tend to increase inequality.
As an alternative, therefore, the institutional strategy hasbeen discussed in several European countries since the 1950s.The central idea in this strategy is that benefits should beuniversal and income related. This third type of strategy thuscombines the liberal, Beveridgean idea of universalism with theidea of earnings related benefits of the classical corporatistprogrammes on continental Europe. Such an institutionalwelfare st;lie would give a guarantee that in the case of illness
and old age, public programmes will secure all citizens roughl),the same standard of living to which they have been accustomed.
When applied, for example, to old age pensions it. hasthus been argtted in support of the flat rate strateg), that weshould create equalit)’ among citizens at least in old age by givingevcr),bod), the same pension irrespective of their previousearnings. Those being in favour of universal and earningsrelated pensions have admitted that in the short run the effectsof such a strategy would appear to be to conserve inequalitiescreated in the labour market. However, the proponents of thisinstitutional strategy maintain that in the long run publicprogrammes of the institutional type will have equalising effects
by limiting the scope of private or market-based programmes,which are likely to generate much more inequality.
The issue here boils down to a trade-off between twofactors. On the one hand we have the redistributivc gradient of
the public sector, that is the proportion of each pound or dollarspent that f.~lVOtlrs the poor more than the rich. Oi1 Lhe other
hand we have the total size of the public sector, or the number ofpounds or dollars that can be used for redistribution. Where thepublic sector is large, a much lower degree of redistribution isreqttired to achieve the same amount of redistribution than
where tile public sector is small (Aberg, 1989).
21
Public SlrategTes and Pffvate Solutions
From various sources we can put together empirical dataof relevance for illuminating tile question wllicll of the strategiesdiscussed above are best suited for limiting inequality amongcitizens. Let us begin by looking at the extent to which differentlegislated pension progtnmmaes have generated private pension[)rogrammes, inclividual or occupational ones. An importantfactor in this context is the level of the maximum pensionsattainable within the public systems. The higher the incomelevels which can be protected within public systems, the smallerwould the incentive to establish private pension programmesappear to be.
In our data base set we have inclucled information onmaximum pensions available within public pension systems. Thismaximum pension can be expressed as a percentage of t.heaverage worker’s wage. For one year, 1980, we have alsoinformation on the size of pl’ivate pension expenditure aspercentage of the Gross Domestic Product. For 1980, we canthus relate the maximum extent to which public pensionprogrammes replace previous wages, and the extent to whichprivate or non-public pension programmes have developed inthe various countries (Diagram 8).
In our 18 countries public pension systems differconsiderably in terms of the maximunl earnings that can bereplaced. Maximum replacement rates of more than 100 percent of an average worker’s wage were found in Austria, Italy,Finland, and Germany.9 At the othel" extreme, maximumreplacement rates were only about 50 per cent on" less inAusu-alia, Canada, Swi~erland, Denmark, the United Kingclom,lu’eland and New Zealand.
ha spite of a few "outliers", there is an observable
22
relationshiI) between the level of m~cnimunl public pensions andthe size o1" private (individual or collective) pension schemes as apercentage of the Gross Domestic Product (GDP). Thus inFinland, Austria, and hal)’, where maximum levels in i)enslonsrelated to previous income constitute about 1_90-170 per ccllL of
an aw,~r;agc indtlstrial worker’s net wage, private pel]SiOI]$ al’e OJ:
very small iml)ortance and make up only about 0.2 per cent of
the GDP. In these countries, apparently high income earners
DIAGRAM 8. MAXIMUM PUBLIC PENSIONS AND RELATIVE
EXPENDITURE ON PRIVATE PENSIONS AS PERCENTAGE OF GDP
(AROUND 1980)
1,8
1,6
1,4
R° 1,2
g 0,6
"~0,4
0,2
¯ ¯ SWIAUS CAN
i.DEN
BEL ¯
NOR SWE
G:.
.it F;.
I t I � I’~A i i
20 40 60 80 100 120 140 160
Net Incomo replocement tare for ~dngle pennon re.celvlngmaxlmum public pension (as percentoge of an average
worker’s wage)
180
2B
also can get a public pension which tile), regard as sufficientlyhigh so that they do not have to look [or private pensions tocomplement tile i)ublic ones.
Private pension schemes are of medium importance inNorway, Sweden, Japan, and Belgium. There nlaxinlum publicpensions are relatively high, about 80-100 per cent of an averageworkcr’s wagc.
In Swilzerland, Australia, Canada, USA, Denmark, TheNetherlands, and Bvilain, however, maximum i)ttblic pensionsreplace only about 50 per cent of an average worker’s netinconle. In these countries high income eacners have tht:rcforeseen il necessary to complement the low public pensions wil.hprivate pensions. In Ihcst: countries cxpendilures for privalepcHsions constilute I-2 per cent of the GI)P, abottt ten times asmuch as in Italy, Finland and Austria.
There are some "otttliers" in this diagram, however. Therelatively large role of privatc pensions in Gernl:Ul), probablyi’c~ccts that top inconlc cal’l]crs ~|s well ;is housewives areexcluded from the public pension schemes and therefore areforced to use private altern~ltives. In the other direction, NewZealand has limited private pensions in spite of low nlaximutnpt~blic pensions. Also in Ireland private pensions could havebeen expected to be more common, considering tile lowmaximttm replacement rates in the public pension s)’stems. Inthe 1980s, however, private pension s),stems appear to have beenincreasing in h’eland.
Do Policy Stmtegqes Affect h*come Inequality ?
The next question is what effccts different combinationsof public and private pension s,vstems have for income inequalitya111011g the elclerly? From the so callecl Luxemburg InconleStudy data base, we can get information on Ihe composition of
24
income for pensioners in nine different countries around 1980(Kangas atld Palme, 1993).
Let us first look at public pensions mid measure incomeinequality in pul)lic pension income among those 65 years orolder using the Gini coefficient (Diagram 9).1° We lind then that
DIAGRAM9. INEQUALITY IN PUBUC PENSIONS IN NINE
COUNTRIES (GINI, AROUND 1980)
0,2 FIN
0.15
0,1
_o
0.05
?iz
®
-0,05
-0,!
SWE
GERNOR USA
, ,
U’AUS
the means tested Australian pension programme is actuall), themost strongly redistributive one. As means tested progranmaesare expected to do, Australian public pensions thtts give more toelderly persons with low gross income than to those with highergross income. Public pension programmes have somereclistril)utive effecLs also in Canada and in the United Kingdom.
In Finland, Sweden, Germany and Norway, on thecontrary, public pension income is much nlore unequallydistributed. In these countries those with higher total income gettntlch higher pensiolls than persons with lower total earnings. Inthe United States and The Netherlands, pul)lic pension incomeis less unequally disu’ibuted.
However, if we look at the distributiotl of total incomeamong tile elderly in these nine countries, the picture changesdrastically (Diagram 10). Inequality in total income among theelderly is actually smallest in Finland, Sweden, Norway andGermany, tile countries where inequalities in public pensionincome is largest. On the other hand, inequality in total incomeis c~.~nsiclerably higher in Australia, Canada, the UnitedKingdom, and The Netherlands, tile countries where publicpension programmes in themselves are most clearlyredistributive or neutral.
These results thus indicate that the efl’ecl~s of differentforms of public pension programmes on income inequalityzmlong the elderly come in different stages. In fact their mostimportant effects are likely to be felt before public pensions arepaid out to the elderly. In cotmu-ies with re¢lisu’il)otive but lowmaximttm public pensions, groups of citizens accustomed torelatively high incomes have found it necessary to complementlow public pensions with private or collective pensions, or withother t}’])es of incolne, lneollle fl’Olll StlCh SOl_lrces tencls to bemuch more unequally clistributed than income fl’om most pttblic
pension programmes, also from those which have the highesllevel of inequality. Thus, in countries where public pension
26
sch12111e5 }|l’e flat rate or means tested, they tend to be
rcdistributive oll paper o111},.
Political Cml.wquences of WelJhre State Institutions
Different institutional structures of the well,ire state ma),
also have important political effects, including ef[ects on the
political support I’~w the welfare state. Since marginalistic social
programmes tend to generate conflicting interests amongcitizens, in this type oF welfare state the eleetorale tends to be
DIAGRAM 10. INEQUAUTY IN GROSS INCOME AND IN PUBLICPENSION AMONG THE ELDERLY IN NINE COUNTRIES
(AROUND 1980)0,4
0,35
0,3
0,25
"~ 0,2
0,15
0 0,1
0,05
0
-0,05
-0,1
FiN SWE GER NOR USA NET UK CAN AU5
27
split in terms of views on social policy programmes. Especiallysignificant here is the split that the poverty line tends to createwithin the working class (Diagram II). If welfare state benefitsgo primarily to those below a poverty line, the better-off sectionsamong workers have little incentive to SUl)port suchprogrammes. Instead they are likely to join with the middle classin a coalition against the poor. The marginalistic welfare statethtls creates a large constituency for a "welfare backlash",something which h~s been noted, for example, in the UnitedStates.
DIAGRAM 11. MARGINAL WELFARE STATES CREATE A LARGER
CONSTITUENCY FOR "WELFARE BACKLASH" THAN
INSTITUTIONAL WELFARE STATES
Marginal Institutional
TopIncomes
28
In the institutional type of welPare state, on the contrary,
all categories of households have at least some direct benefitsfi’om social policy progranmles. By defending what they havecome to perceive of as Iht;ir oron inlmesl.~ in existing mliversal andincome related social policy I)rogrammes, the better-off citizensare also defending the interests of the poor. Therel)y, theconstituency for a welfare backlash is decreased. As, for exmnple,
successive governments in Sweden have discovered, in aninstitutional lype of welfare state it is very difficult to introducecut-backs since most citizens feel that this is a threat to their ownlegitimate interesLs. The poor are thus not left to their interestsalone.
U’nemJJloyme~zt and Labom Ma:rket Policies
Since the mid-1970s, mass unemployment has returnedto Europe. In terms of tmemployment levels we are now back tothe years before World War 11. The post-war period, when mostWestern countries (but Ireland, Italy, the United States andCanada to a lesser degree than others) had full employment(defined as 2-3 per cent of unemployment) have now passed(Korpi, 1989). We are in the process ofestal)lishing what inGermany has been called "the two-thirds society", that is a socieg,wiaere two-thirds o[ citizens are qttile well off but the remainingthird is excluded from employment and a normal place insociety.
In spite of the protracted boom during the 1980s, the
average unemployment levels in the Common Market countrieshave ranged around 10 per cent. In 1992, in the OECD area thenumber of the unenlployed is about 30 million persons, almostten times the size of the hish population. In addition, ill severalcountries more than one-half of men above 5fi years of age havebeen forced Otlt of elnl)loyment. In many COUlltries the increaseof labour force participalion of women has been slowed down orhahed.
29
In the 1950s, lil)erals such as William Beveridge but alsomany olhers took it for granted that tile absence of massunemployment was a defining characteristic of a welfare state. Inthe 1980s this defining characteristic has disappeared in mostEuropean cotllltries.
However, social policy and lal)oor market policy is ofsome relevance also in this situation. Of particular importance isIhe difference between passive and active labour market policies.Passive labour market policies pay a more or less generouscompensation to Ihe unemployed, either throughunemployment insurance or through pre-retirement pensions.Active labour market policies give occupational training orcreate jobs, such as special programmes for youth and Ibr long-term unemployed. Thereby, tile)’ have much more positiveconsequences for the situation of tile unemployed as well as forhuman capital in terms of occupational skills.
What is often forgotten, however, is that the costs foractive labour market policies generally are not higher l:laan forthe passive ones, at least if one pays tile tmeml)loyed a decentcompensation. Yet nlost countl’ies Contilltle to spend most of
their money in passive programmes. In several Europeancountries in the 1980s, the costs for such passive policies havebeen roughly of tile size of costs for military defence, a few ofthem even higher.
Together with Spain, h’eland is the country in Europewhere unemployment has been the highest, around 15-16 percent (Table 2).II h’eland spends a sizeable prol)ortion of itsGDP (in 1990, 4.3 per cent) on labour market programmes.About two-thirds of these expenditures were used For "passive"unemployment compensation and one-third for "acl.ive" policies,such as labour market training, youth measures, and subsidisedemployment. Here Ireland follows a relatively commonEuropean pattern of allocating most expenditure on passivemeasures. In gel’lllany, active measures have accounted for a
I l Dam frl,ln OECl) I~.)1. Empbtymmtt Outll~k.
3O
qable 2: Unemployment and ILvpenditure on Labour MaThaProgrammes 1990
somewhat larger share of expenditttres. This has 11105| clearlybeen the case in Sweden, where the bulk of expenditures havetradiLionall)’ been directed towards active measures and tq:) I.o1991, open tmemplo),ment has been kept relativel), low. 12
In closing I would like to remind you about the debatethat is going on among social scientists as well as amongpoliticians about the mixed blessings of the welfare state. As youare well aware, there is a long tradition of questioning thebenefits of welfare state growth. Especially among economists ofa neo-classical bent, many have pointed to the possible negative
31
consequences of tile welfare state for economic efficiency andeconomic growth. Thus, For example, some years ago Arthtn"Okun (1975) the late American economist, used tile image of"the leaky bucket" to indicate how tile welfare state wastesresources on the way when moving diem from the rich to tileROOF via taxation and social policies.Is
Those of you who have faith in the hypothesis of "theleak), I)ucket" may find some comfort in tile figures which I havepresented here. Ireland would not appear to have been in the
most dangerous risk zone, so to speak, when it comes to leakageof economic resources via all overdeveloped welfare state.Several other countries would appear to have I)een takinggreater risks in the welfare state area during tile post-war period.
Oil tile other hand, those of you who set value on socialcitizenshil), as it was once expounded by T. H. Marshall, mayperhaps also find some hope in the data I have presented. Whenthe h’ish compare themselves with their great neighbour in theeast, tile}, will notice that Irish pension levels for the elderly areof about tile same quality. In addition, Irish sickness andtnlemploynlent insurance programmes now have considerablyhigher benefits than the British ones. Thtts, during the post-warperiod h’eland has been steadily moving, although with varying
. speed, in the direction of improved social rights and tileextension of social citizenship.
I -~ Fl~r empirical data of r ele~mce fol c~flttatlng tile "leaky bucket’ hypt,thesis, of. f.v example Con teand Darrat 1~.18~.~, anll Korpi It.~85.
o
ABERG, RUNE, 1989. "Distribtttive Mechanisms of the WelfareState - A Formal Analysis and an Empirical Application",European Sociological Reviero, Vol. 2, pp. 1 67-182.Scptcnaber.
BREEN, RICHARD, DAMIAN F. HANNAN, DAVID B.ROTTMAN, CHRISTOPHER T. WHELAN, 1990.U’aderstandi’ag Contemporary Ireland: State, Class a’adDevelopment in the Republic of Ireland, Hampshire andl.,ondon: Gill and Macmillan.
CONTE, MICHAEL A. ~md ALl F. DARRAT, 1988. "EconomicGrowth and the Expanding Public Sector: A Re-exanaination", The I~tnJieto of Eco?zomics a?zd Statistics, Vol.70, No. 2, pp 322-330.
ESPING-ANDERSEN, GOSTA, 1990. The 77zree Worlds of I,l~lfczreCapitalism, Cambridge: Polity Press.
ESPING-ANDERSEN, GOSTA AND WALTER KORPI, 1984."Social Policy as Class Politics in Post-War Capitalisnl:Scandinavia, Ausn’ia and Germany" in J. H. Goldtllorpe(ed.) in Order and Conflict in West Europea~ Capitalism.I~olitical Economy a~zd the End of the laost-War Pmiod, Oxford:Oxlord University Press.
I~\NGAS, OLLI, 199 I. The Politics of Social RighL~: Studies on theDimensio’o.s of Sickness Insurance i~z the OECD Countries,Dissertation series. Stockholm: Swedish Institute forSocial Reseal’ch, Stockholn~ University.
KANGAS, OLLI and JOAKIM PALME, 1993. "Eroding Statism?Labor Market Benefits and the Scandinavian WelfareState" in E.J. Hansen, S. Ringen, H. Unsialo and R.Erikson (eds.) Welfitre Trends in Scandinavia, New ~%rk: M.E. Sharpe.
KORPI, WALTER, 1980a. "Social Policy and DistributionalConflict in the Capitalist Democracies: A I~re[iminaryComparative Framework", West European Politics, Vol. 3,No. 3, October.
KORPI, WALTER, 1980b. "Approaches to the Study of Poverty inthe United States: Critical Notes from a EuropeanPerspective", in Vincent T. Covello, (ed.), Poverty andPublic Policy: An Evaluation of Social Science Research,Boston: G. K. Hall & Co.
KORPI, WALTER, 1985. "Economic Growth and the WelfareStale. Leaky Bucket or Irrigation System?" EuropeanSociolog~callbrvieTo, Vol. 1, No. 2, pp. 97-118.
KORPI, WALTER, 1989. "Can Wc Afford to Work?" in MartinBulmer, Jane Lewis, and David Piachaud (eds.), The Goalsof Social Policy, London: Uilwin.
KORPI, WAUFER, 1991. "Political and Economic Explanations
for Unemployment: A Cross-national and Long-termAnalysis", British Journal of Political Science, Vol. 21, pp.315-348.
MAGUIRE, MARIA, 1986. "Ireland", in Peter Flora (ed.), Growthto Limits: The Western European I’Ve~are States since I’VorldWar IL Vol. 2, Berlin and New York: Walter de Gruyter.
OKUN, ARTHUR M., 1975. Eq~tality and Efficiency - The Big7)adeoff, Washington, D.C.: The l?,rookings Institution.
PALME, JOAKIM, 1990. Pension Rights in Welfare Capitalism,Dissertation series, Stockhohn: Swedish Institute for
Social Research, Stockholm University.
VAIS?\NEN, ILKI~\, 1992. "Conflict and Consensus in SocialPolicy Developments in 18 OECD Countries", European
Jouo*al of Political Research, Vol. 2".4, pp. 307-327.
WENNEMO, IRENE, 1992. "The Development of Family Policy -A Comparison of Family BenefiLs and "l’m~: Reductions forFamilies in 18 OECD Countries", Acta Sociologica, Vol. 35,pp. 20 I-217.
WI-I’~q’E, .l. Iq., 1971. Church and State in Modern Ireland 1923-1970, Dublin: Gill and Macmillan.