© JUL 2019 | IRE Journals | Volume 3 Issue 1 | ISSN: 2456-8880
IRE 1701314 ICONIC RESEARCH AND ENGINEERING JOURNALS 9
Reactive Power Compensation for Reduction of Losses in
Nigeria 330kV Network Using Static Compensator
(STATCOM)
ENGR. UZOWULU IFEANYI NNANEDU1, DR. J. ATUCHUKWU
2, DR. JOHNPAUL ILOH
3
1National Power Training Institute of Nigeria
2,3Department of Electrical/Electronic Engineering, Chukwuemeka Odumegwu Ojukwu University, Uli,
Anambra State, Nigeria
Abstract -- This work is focused on Reactive Power
Compensation to reduce losses in Nigeria 330kV Power
Transmission lines. Management of reactive power and
voltage control constitute part of the major challenges in a
power system. Adequate reactive power control solves
power quality problems like voltage profile maintenance
at all power transmission levels, transmission efficiency
and system stability. Power demand increases steadily
while the expansion of power generation and transmission
has been severely limited due inadequate resources and
environmental forces in Nigeria. A Flexible Alternating
Current Transmission System (Facts) called Static
Synchronous Compensator (Statcom) device was adopted.
Using the relevant data obtained from Transmission
Company of Nigeria (TCN) control centre Oshogbo, the
system soft-model of 330kV 57 buses of the Nigeria
transmission line was built with the help of Electrical
Transient Analyzer Program software (Etap 12.6). The
results show voltage magnitude where voltage drops were
noticed at buses Damaturu (0.9992pu), Gombe
(0.9880pu), Yola (0.9900pu), Jalingo (0.9904pu), Ikeja
West (0.9892pu), and Maiduguri (0.0504pu) respectively.
When Statcom was integrated into the network, the new
voltage magnitudes of these buses improved to 1.2062,
1.0327, 1.0319, 1.1682, 1.1600, and 1.0374pu respectively;
The simulation result obtained showed improvement of
weak bus voltages and loss reduction to 85 percent.
Indexed Terms: Statcom, Etap, VSC, Matlab
I. INTRODUCTION
The engineer who works in the electrical power
industry will encounter some challenges in designing
future power systems to deliver increasing amounts
of energy in a safe, clean and economical manner
(Annual Energy Outlook 2006 with Projections to
2030, 2006). The origin of the Nigeria Electric power
System can be traced back to the year 1898 (Acha,
2004) when a small generating plant was installed in
Lagos. The first power interconnection was a 132kV
link constructed in 1962 between Lagos and Ibadan.
By 1968 the first National grid structure emerged
with the construction of the kainji hydro station
which supplied power via a 330kV, primarily radial
type transmission network into the three members’
132kV subsystem then existing in the Western,
Northern and Eastern parts of the country. The
330kV and 132kV systems were initially run by two
separate bodies- “Nigeria Dams Authority (NDA)”,
and “Electricity Corporation of Nigeria (ECN)”
respectively. Central control for the 330kV Network
was coordinated from kainji power supply control
room, while the 132kV Network was run by load
dispatcher located at Ijora Power Supply Lagos.
These two bodies were merged formally into single
power utility known as National Electric Power
Authority (NEPA) in 1972 thus ushering in
centralized regulation and coordination of the entire
rapidly growing 330KV and 132kV National
network. These networks are characterized by many
disturbances which cause various hindrances and
outages [19].
II. NETWORK DESCRIPTION
The Nigerian power network like many practical
systems in developing countries consists of a few
generating stations mostly sited in remote locations
near the raw fuel sources which are usually connected
to the load centers by long transmission lines.
Generation, transmission, distribution and marketing
of electricity in Nigeria are the statutory functions of
the Power Holding Company of Nigeria (PHCN)
which has now been privatized into three (3)
constituents: Transmission Company of Nigeria
(TCN), Generation Companies of Nigeria (GENCOS)
and Distribution Companies of Nigeria (DISCOS).
Presently, the national electricity grid consists of
twenty nine (29) generating stations comprising three
© JUL 2019 | IRE Journals | Volume 3 Issue 1 | ISSN: 2456-8880
IRE 1701314 ICONIC RESEARCH AND ENGINEERING JOURNALS 10
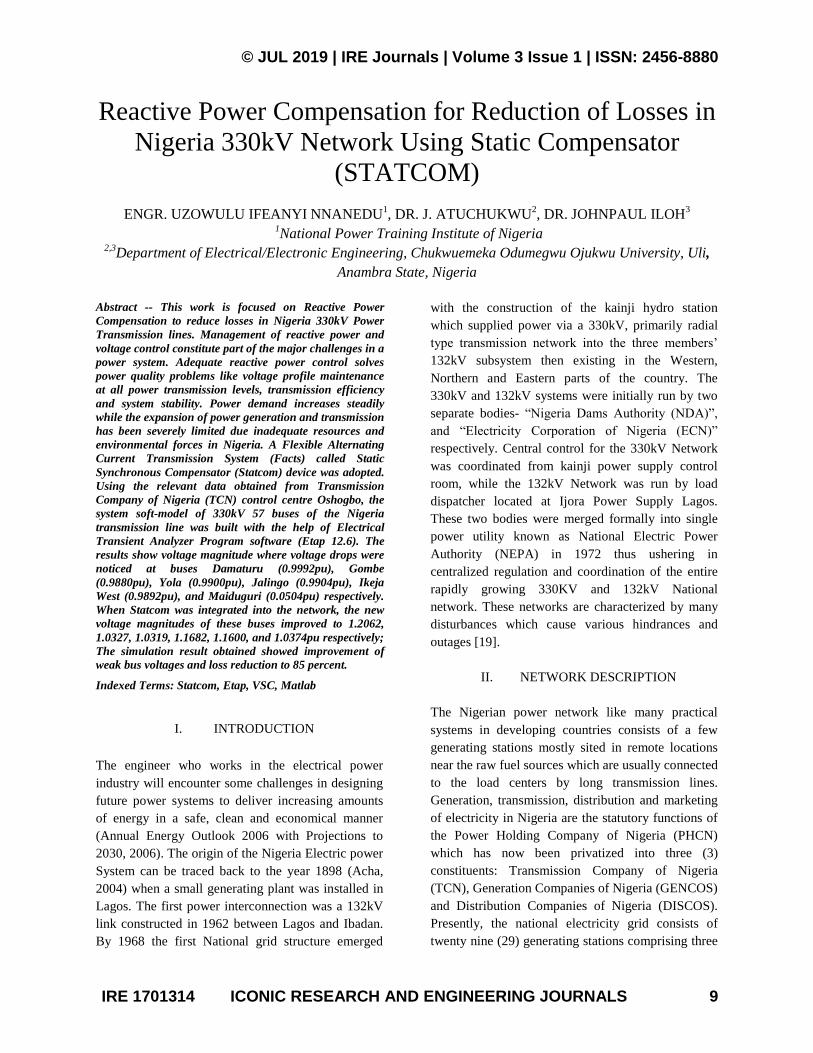
(3) hydro and twenty six (26) thermal with a total
installed generating capacity of 13,063MW. The
thermal stations are mainly in the southern part of the
country located at Afam, Okpai, Delta (Ughelli),
Egbin and Sapele. The hydroelectric power stations
are in the country’s middle belt and are located at
Kainji, Jebba and Shiroro. The transmission network
is made up of 5395km of 330kV lines, 6889km of
132kV lines. Although, the installed capacity of the
existing power stations is about 13,063MW the
maximum load ever recorded was 4,000MW (TCN
Daily Operational Report Jan., 2018).
Fig. 1.1: Nigeria Grid Configuration
III. NETWORK CONSTRUCTION
An electrical network consists of various electrical
elements such as generator, load, transmission line,
transformer etc. Here we assume that all the data for
generator, load, and transmission line parameters are
given in per unit system and common MVA base.
After data have been collected, suitable software
called Electrical Transient Analyzer Program (Etap)
was selected for the network design.
This software offers both graphical and tabular data
entry modes, single-line diagram drawing options.
This user-friendly software is implemented and
practically used to determine not only the power flow
in transmission lines but also to identify weak buses
for installing the compensating device in order to
minimize the unwanted losses on the 57 Bus power
grid system. The simulated 57-bus 330kV Nigerian
Transmission network used as the case study is
shown in fig 3.8a below. The network consists of
nine generating stations, fourteen loads stations and
thirty one transmission Lines.
In the case of Nigeria, the power network is
constructed to generate and wheel power to load
centers at specific voltage and frequency levels with
statutory limits. The nominal frequency is 50Hz
±2.5%. Even though there are possibilities for system
stress; the power system variation, statutorily, could
be 50Hz± 2.5%. (i.e. 48.75 Hz-51.25Hz). On the
other hand, the nominal transmission system voltage
levels are 330kV and 132kV; in the case of the latter,
it has a statutory limit stated as 132kV ±5%.
However, when the power system is under stress or
during system faults, voltages can deviate outside the
© JUL 2019 | IRE Journals | Volume 3 Issue 1 | ISSN: 2456-8880
IRE 1701314 ICONIC RESEARCH AND ENGINEERING JOURNALS 11
limits by a further 5% except under transient and sub-
transient disturbances.
The grid is divided into three 3 sections: North,
South – East and the South – West sections. The
North is connected to the South through one triple
circuit lines between Jebba and Oshogbo while the
West is linked to the East through one transmission
line from Oshogbo to Benin and one double circuit
line from Ikeja to Benin [19].
Structurally Statcom is a voltage-source inverter
(VSI) based device (Fig. 3.8a), which converts a
direct current input voltage into an alternating current
output voltage in order to compensate the reactive
power needs of the system.
In case the system voltage drops sufficiently to force
the Statcom output to its ceiling, still its reactive
power output is not affected by the grid voltage
magnitude. Therefore, it exhibits constant current
characteristics when the voltage is low. Statcom can
provide instantaneous and continuously variable
reactive power in response to grid voltage transients,
enhancing the grid voltage stability. The Statcom
operates according to voltage source principles,
which together with unique PWM (Pulsed Width
Modulation) switching of power switches gives it
unequalled performance in terms of effective rating
and response speed [21]. This performance can be
dedicated to active harmonic filtering (The Changing
Structure of the Electric Power Industry 2000) and
voltage flicker mitigation, but it also allows
providing reactive power compensation of the load.
Table 1.1: Daily Operational Report 26/06/2019 – Transmission Company of Nigeria NCC, Oshogbo
© JUL 2019 | IRE Journals | Volume 3 Issue 1 | ISSN: 2456-8880
IRE 1701314 ICONIC RESEARCH AND ENGINEERING JOURNALS 12
IV. STATCOM
Static Synchronous Compensator is a static
synchronous generator operated as a parallel
connection static reactive power compensator whose
capacitive or inductive output current can be
controlled independent of the ac system voltage. In
addition to system voltage control, which typically is
the main task of the Statcom, it may also be
employed for additional tasks such as damping of
power system oscillations, which results in
improvement of the transmission capability.
The Statcom provides operating characteristics
similar to a rotating synchronous compensator
without the mechanical inertia, due to the Statcom
employed solid state power switching devices it
provides rapid controllability of the three phase
voltages, both in magnitude and phase angle.
Statcom provide voltage support to buses by
modulating bus voltages during dynamic disturbances
in order to provide better transient characteristics,
improve the transient stability margins and to damp
out the system oscillations due to these disturbances.
The principle of Statcom operation is as follows. The
VSC (Voltage Source Converter) generates a
controllable alternating current voltage source behind
the leakage reactance. This voltage is compared with
the alternating current bus voltage system; when the
alternating current bus voltage magnitude is above
that of the VSC voltage magnitude, the alternating
current system sees the Statcom as an inductance
connected to its terminals. Otherwise, if the VSC
voltage magnitude is above that of the alternating
current bus voltage magnitude, the alternating current
system sees the Statcom as a capacitance connected
to its terminals. If the voltage magnitudes are equal,
the reactive power exchange is zero. If the Statcom
has a direct current source or energy storage device
on its direct current side, it can supply real power to
the power system. This can be achieved adjusting the
phase angle of the Statcom terminals and the phase
angle of the alternating current power system. When
the phase angle of the alternating current power
system leads the VSI phase angle, the Statcom
absorbs real power from the alternating current
system; if the phase angle of the alternating current
power system lags the VSC phase angle, the Statcom
supplies real power to alternating current system.
Statcom could have many topologies, but in most
practical applications it employs the direct current to
alternating current converter, which can also be
called a Voltage Source convertor (VSC) in 3-phase
configuration as the primary block. The basic theory
of VSC is to produce a set of controllable 3-phase
output voltages/ currents at the fundamental
frequency of the alternating current bus voltage from
a direct current input voltage source such as a
charged capacitor or a direct current energy supply
device. By varying the magnitude and phase angle of
the output voltage and current, the system can
exchange active/reactive power between the direct
current and alternating current buses, and regulate the
alternating current bus voltage.
Reactive power has been recognized as an important
factor in the design and operation of alternating
current electric power systems. Since the impedance
of the network components are mainly reactive, the
transmission of active power requires a difference in
angular phase between the voltages at the sending
end and the receiving end, while the transmission of
reactive power requires a difference in magnitude of
these same voltages. Reactive power is consumed not
only by most of the network elements, but also by
most of the consumer loads. The required reactive
power must be supplied somewhere and if we cannot
transmit it very easily then it must be generated at the
point where it is needed. The reactive power must be
supplied at the same voltage of the load that requires
it.
The Statcom consists of a three phase inverter
(generally a PWM inverter) using SCRs, MOSFETs
or IGBTs, a direct current capacitor which provides
the direct current voltage for the inverter, a link
reactor which links the inverter output to the
alternating current supply side, filter components to
filter out the high frequency components due to the
PWM inverter from the direct current side.
© JUL 2019 | IRE Journals | Volume 3 Issue 1 | ISSN: 2456-8880
IRE 1701314 ICONIC RESEARCH AND ENGINEERING JOURNALS 13
Figure 3.8a: Simplified Model of STATCOM
V. STATCOM CONTROL PRINCIPLE
The sets of equations given below are derived from
the analysis of figure 3.8a, where: X = Coupling
transformer reactance, Vs׳: rms line-to-neutral
alternating current grid voltage with a phase angle of
0 referred to Statcom side.
VC: RMS line-to-neutral Statcom fundamental
voltage
Is: RMS source current
IL: RMS load current
IC: RMS Statcom current
Qs: Source reactive power
QL: Load reactive power
Qc: Statcom reactive power
δ: Phase angle between fundamental voltage of
Statcom and AC grid.
If Vc is equal to Vs, reactive power generation is
zero.
If Vc < Vs, a current is induced which lags VX. This
current also lags Vs since VX is in phase with Vs.
Therefore, Alternating Current grid sees this current
as inductive and STATCOM is said to be operating in
inductive mode.
If Vc > Vs, a current is induced which lags VX.
However, this current leads Vs since VX is in
opposite direction with Vs. Therefore, Alternating
Current grid sees this current as capacitive and
Statcom is said to be in operating capacitive mode.
It can be deduced from (3.57) and (3.58) that Statcom
absorbs active power even at zero reactive power
because of converter losses.
Assuming the relationship between Vc and dc link
voltage Vd is given in terms of a constant k, since Vc
α Vd.
By substituting (3.61) in (3.57) and (3.58), (3.62) and
(3.63) are obtained.
(3.61)
© JUL 2019 | IRE Journals | Volume 3 Issue 1 | ISSN: 2456-8880
IRE 1701314 ICONIC RESEARCH AND ENGINEERING JOURNALS 14
In order to approximate input voltage of VSC to a
pure sinewave at fundamental frequency, Pulse
Width Modulation (PWM) or Pulse Amplitude
Modulation (PAM) technique can be applied.
For this case, peak value of fundamental component
of VSC input voltage (line-to neutral) can be related
to dc link voltage in terms of modulation index (ma)
as given in (3.64) by assuming a two-level line-to-
neutral ac voltage.
By using (3.61) and (3.64) one obtains:
Substituting of (3.65) in (3.62) and (3.63) gives:
This assumption simplifies the term which is going to
be controlled to 0.35mVd. It can therefore be
concluded that reactive power absorbed or delivered
by Statcom can be controlled by one of the following
techniques:
i) Varying modulation index (ma) while keeping
direct current link voltage Vd constant
ii) Varying Vd while keeping (ma) constant, or
iii) A combination of i and ii [5].
VI. RESULTS
The Nigerian transmission network was used as a
case study. The case study consists of 57 buses, 128
transmission lines and 22 generators. The proposed
algorithm was developed in the Etap programming
language using version Etap 12.6.0. The steady-state
and dynamic performance of the Statcom, the
behavior of the system with and without Statcom is
studied, with objective of determining the best
location of the Statcom to improve the voltage in the
grid, and to observe the grid response to with and
without Statcom.
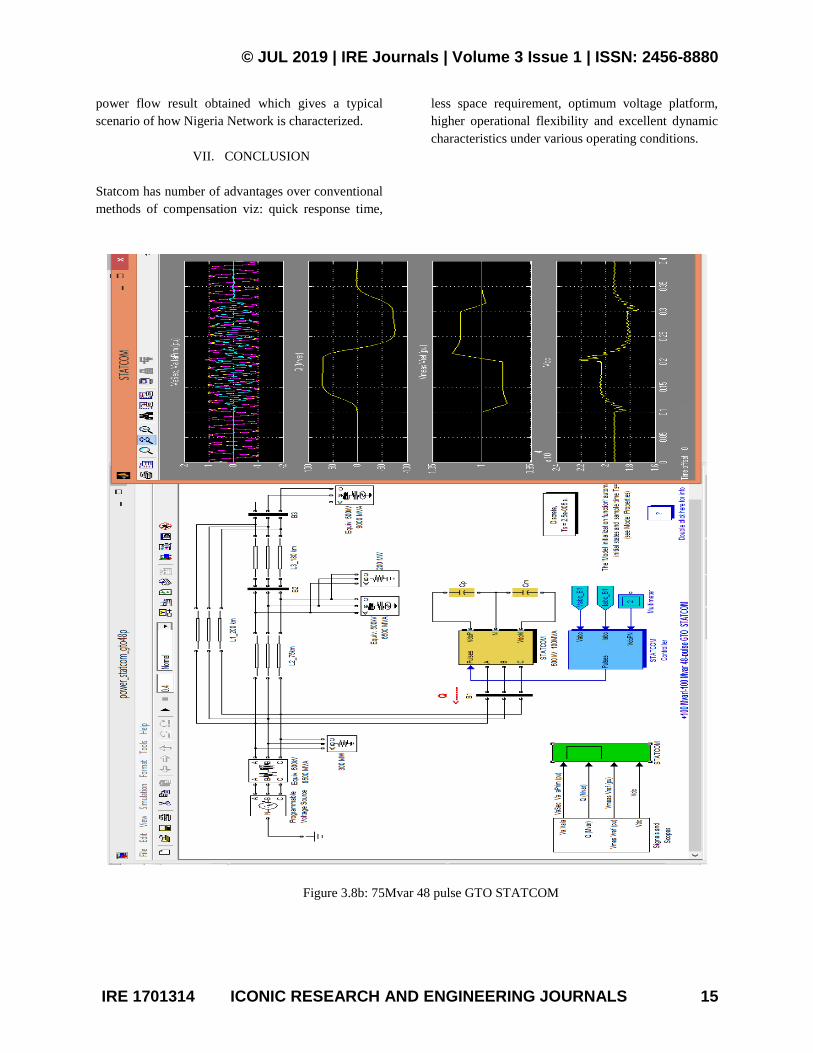
For the system without Statcom, the voltage
magnitude of load buses given by the load flow
program, design that the losses and the percentage of
the voltage drop magnitude at buses, most of the
voltage drop are very significant up to 4.85%. When
Statcom is connected at buses in figure 3.8c,
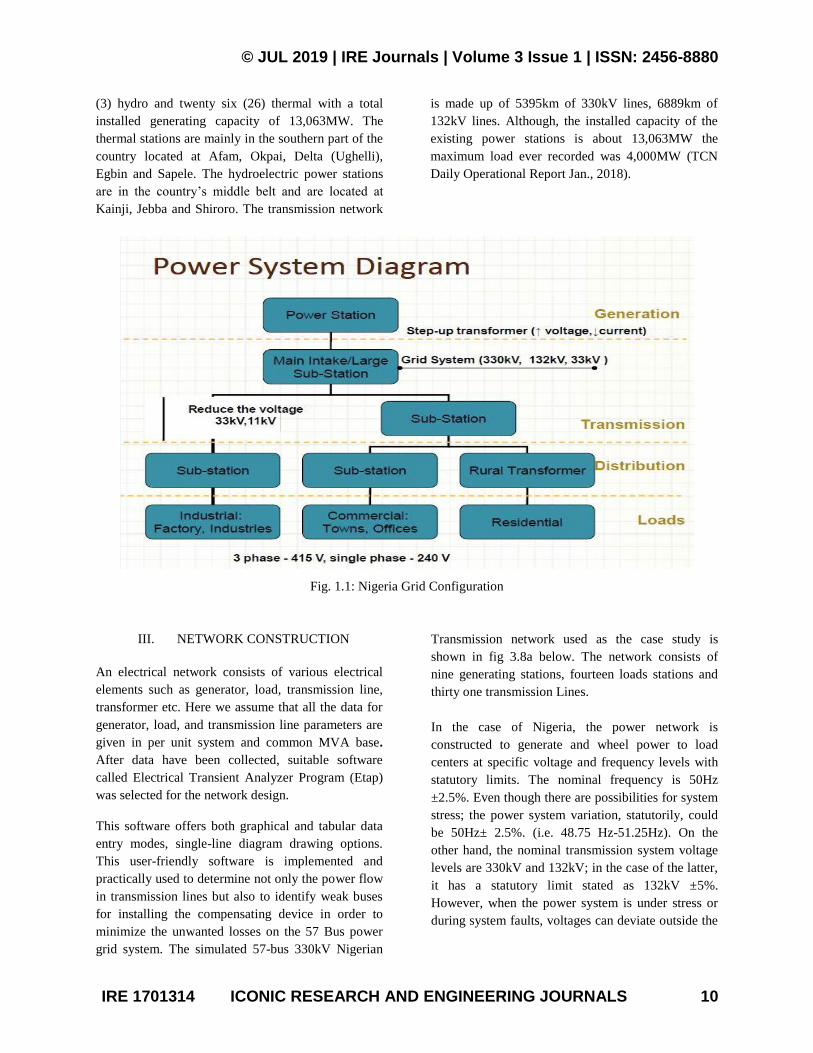
Initially the programmable voltage source in Matlab
environment is set at 1.0491pu, resulting in a 1.0pu
voltage at bus B1 when the Statcom is out of service.
As the reference voltage Vref is set to 1.0pu, the
Statcom is initially floating (zero current). The direct
current voltage is 19.3kV as shown in figure 3.8b
below:
a. At t = 0.1s, voltage is suddenly decreased by 4.5%
(0.955pu of nominal voltage). The Statcom reacts by
generating reactive power (Q = +70Mvar) to keep
voltage at 0.979pu. The 95% settling time is
approximately 47ms. At this point the direct current
voltage has increased to 20.4 kV.
b. Then, at t = 0.2s the source voltage is increased
to1.045pu of its nominal value. The Statcom reacts
by changing its operating point from capacitive to
inductive to keep voltage at 1.021pu. At this point the
Statcom absorbs 72Mvar and the direct current
voltage has been lowered to 18.2kV. Observe on the
first trace showing the Statcom primary voltage and
current that the current is changing from capacitive to
inductive in approximately one cycle.
c. Finally, at t = 0.3s the source voltage in set back to
its nominal value and the Statcom operating point
comes back to zero Mvar.
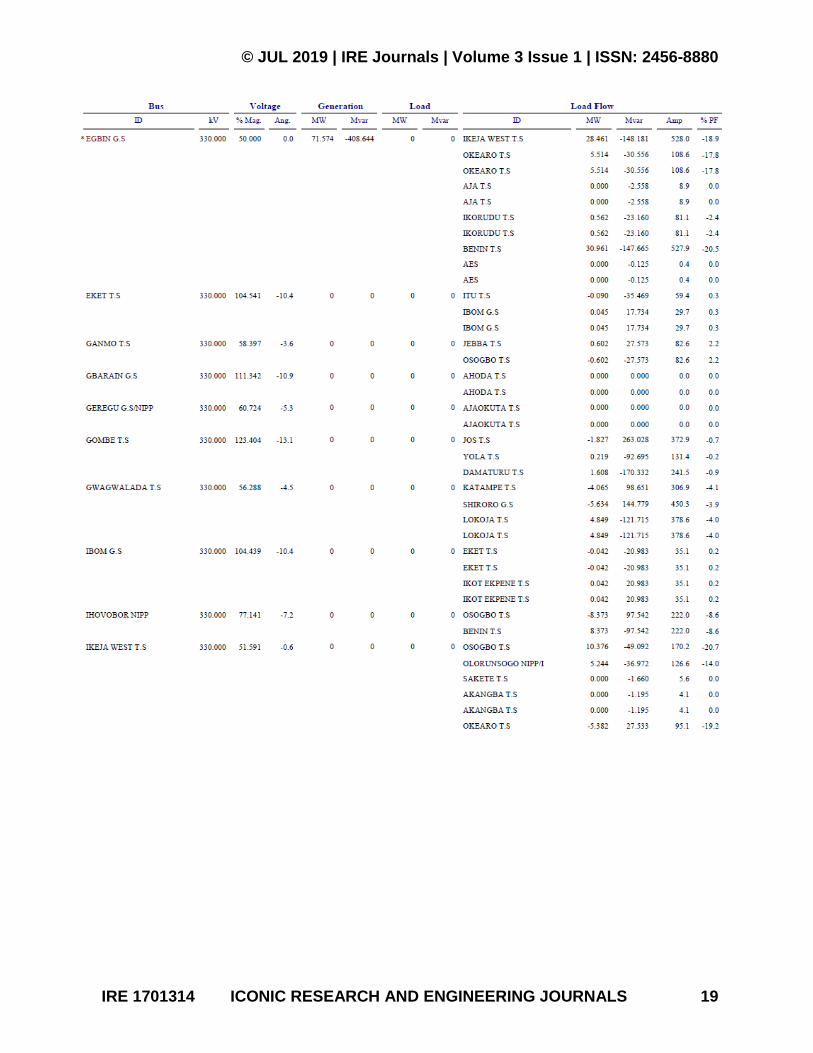
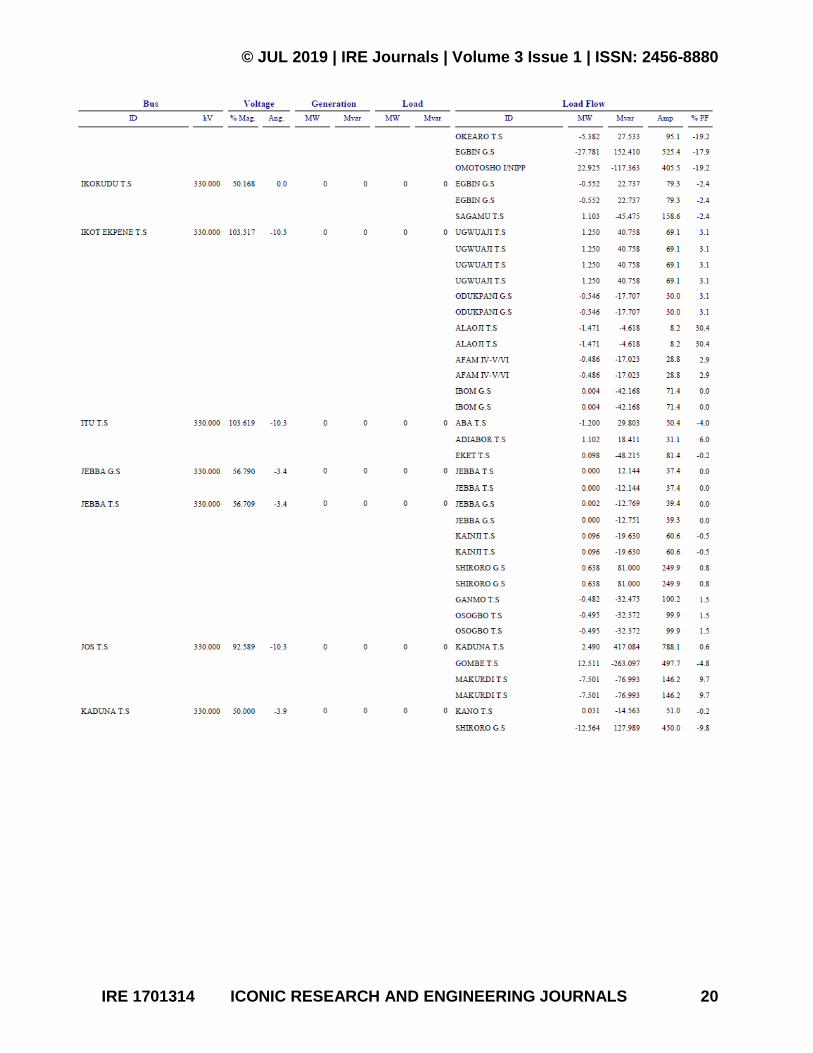
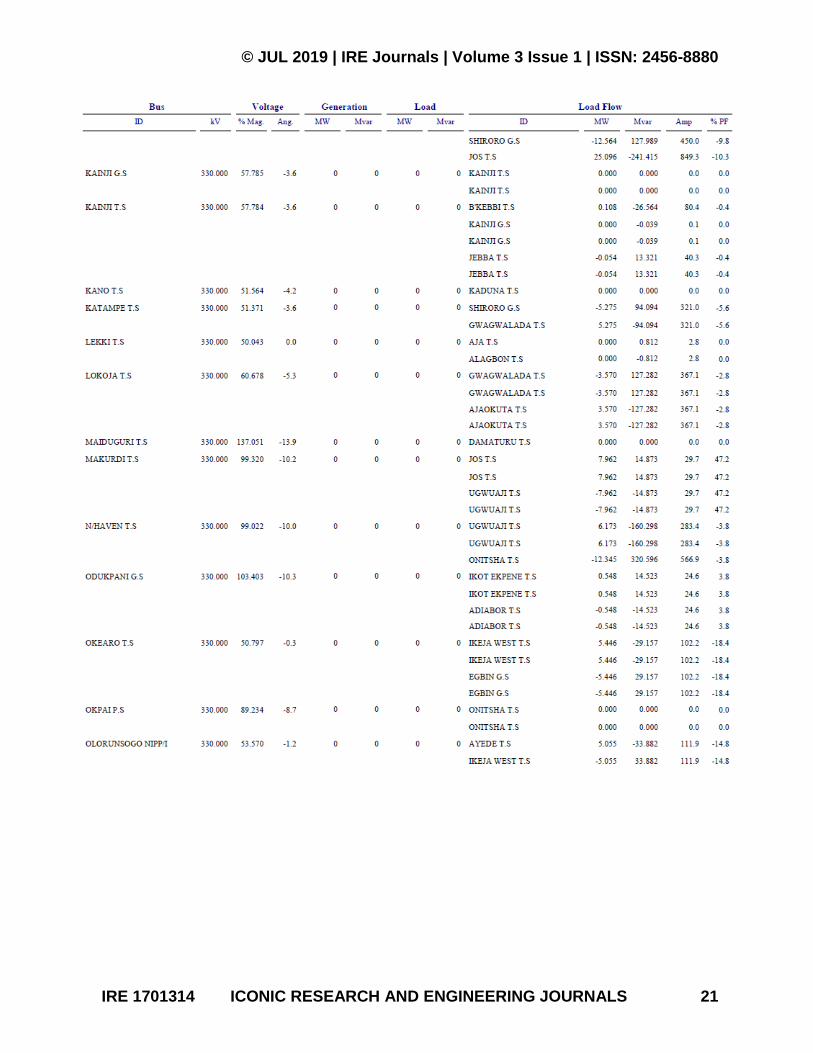
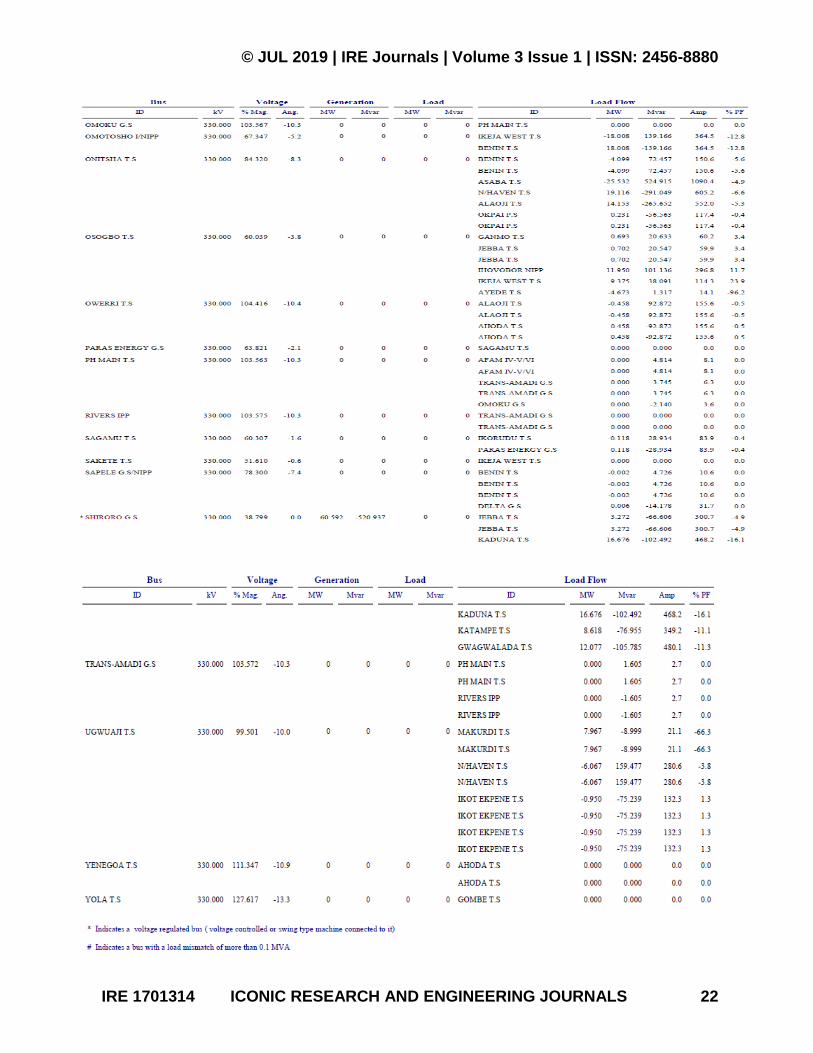
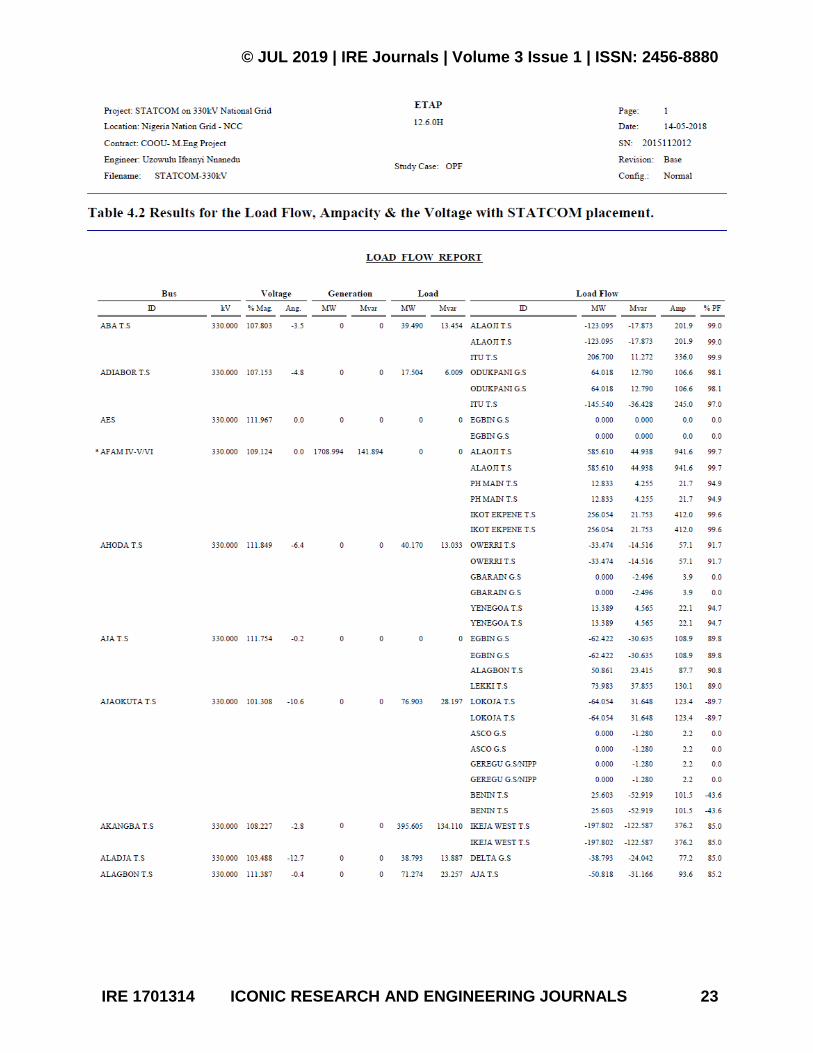
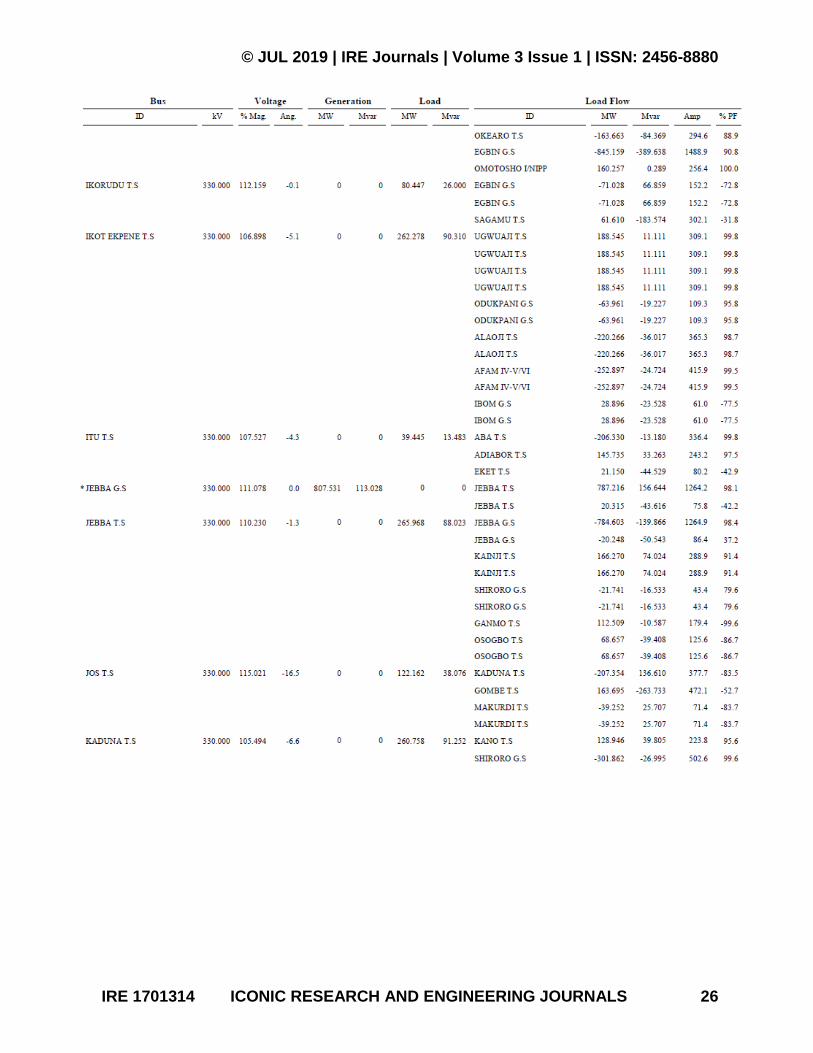
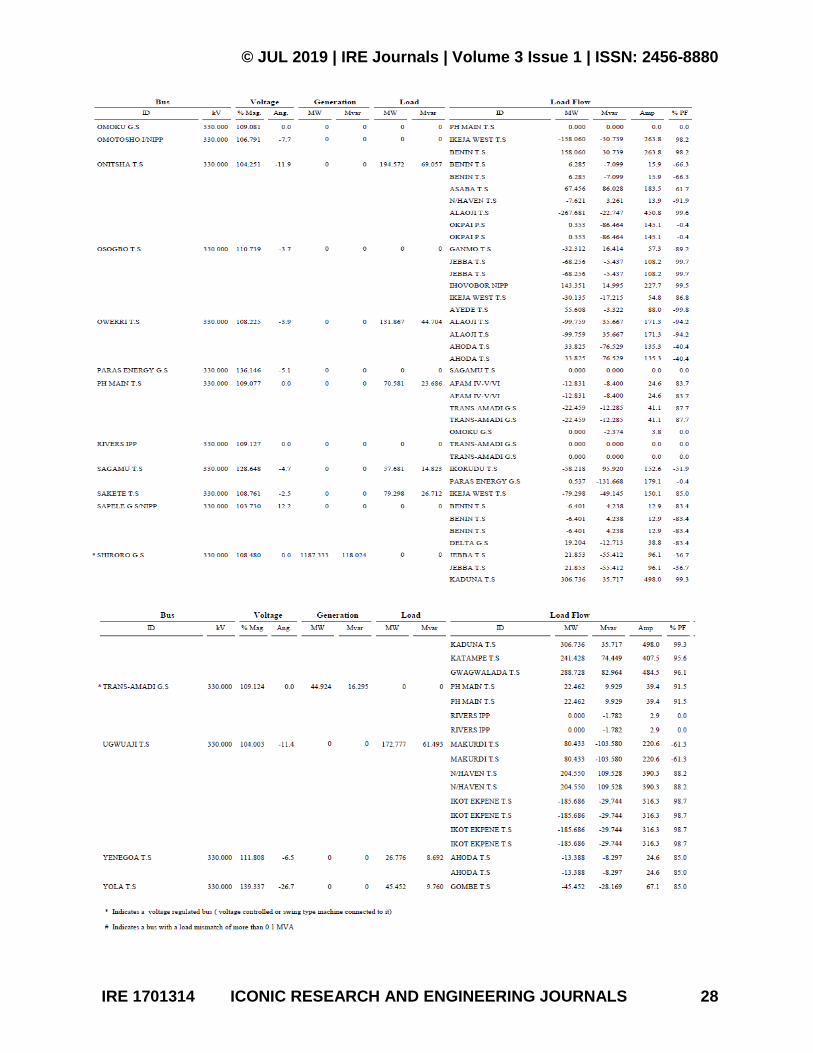
Similarly, Simulating the 57 bus in Etap environment
it observed that the voltage magnitude at those buses
improved. Table 4.1 and 4.2 respectively: Show the
(3.62)
(3.63)
(3.64)
(3.65)
(3.66)
(3.67)
(3.68)
© JUL 2019 | IRE Journals | Volume 3 Issue 1 | ISSN: 2456-8880
IRE 1701314 ICONIC RESEARCH AND ENGINEERING JOURNALS 15
power flow result obtained which gives a typical
scenario of how Nigeria Network is characterized.
VII. CONCLUSION
Statcom has number of advantages over conventional
methods of compensation viz: quick response time,
less space requirement, optimum voltage platform,
higher operational flexibility and excellent dynamic
characteristics under various operating conditions.
Figure 3.8b: 75Mvar 48 pulse GTO STATCOM
© JUL 2019 | IRE Journals | Volume 3 Issue 1 | ISSN: 2456-8880
IRE 1701314 ICONIC RESEARCH AND ENGINEERING JOURNALS 16
Figure 3.8c: 57 bus of Nigeria 330kV Grid simulated in Etap
© JUL 2019 | IRE Journals | Volume 3 Issue 1 | ISSN: 2456-8880
IRE 1701314 ICONIC RESEARCH AND ENGINEERING JOURNALS 17
© JUL 2019 | IRE Journals | Volume 3 Issue 1 | ISSN: 2456-8880
IRE 1701314 ICONIC RESEARCH AND ENGINEERING JOURNALS 18
© JUL 2019 | IRE Journals | Volume 3 Issue 1 | ISSN: 2456-8880
IRE 1701314 ICONIC RESEARCH AND ENGINEERING JOURNALS 19
© JUL 2019 | IRE Journals | Volume 3 Issue 1 | ISSN: 2456-8880
IRE 1701314 ICONIC RESEARCH AND ENGINEERING JOURNALS 20
© JUL 2019 | IRE Journals | Volume 3 Issue 1 | ISSN: 2456-8880
IRE 1701314 ICONIC RESEARCH AND ENGINEERING JOURNALS 21
© JUL 2019 | IRE Journals | Volume 3 Issue 1 | ISSN: 2456-8880
IRE 1701314 ICONIC RESEARCH AND ENGINEERING JOURNALS 22
© JUL 2019 | IRE Journals | Volume 3 Issue 1 | ISSN: 2456-8880
IRE 1701314 ICONIC RESEARCH AND ENGINEERING JOURNALS 23
© JUL 2019 | IRE Journals | Volume 3 Issue 1 | ISSN: 2456-8880
IRE 1701314 ICONIC RESEARCH AND ENGINEERING JOURNALS 24
© JUL 2019 | IRE Journals | Volume 3 Issue 1 | ISSN: 2456-8880
IRE 1701314 ICONIC RESEARCH AND ENGINEERING JOURNALS 25
© JUL 2019 | IRE Journals | Volume 3 Issue 1 | ISSN: 2456-8880
IRE 1701314 ICONIC RESEARCH AND ENGINEERING JOURNALS 26
© JUL 2019 | IRE Journals | Volume 3 Issue 1 | ISSN: 2456-8880
IRE 1701314 ICONIC RESEARCH AND ENGINEERING JOURNALS 27
© JUL 2019 | IRE Journals | Volume 3 Issue 1 | ISSN: 2456-8880
IRE 1701314 ICONIC RESEARCH AND ENGINEERING JOURNALS 28
© JUL 2019 | IRE Journals | Volume 3 Issue 1 | ISSN: 2456-8880
IRE 1701314 ICONIC RESEARCH AND ENGINEERING JOURNALS 29
REFERENCES
[1] Abdel-Salam, T.S., Chikhani, Hackam, R
(1994). A New Technique for loss reduction
using compensating capacitors applied to
distribution systems with varying load
condition. IEEE, pp 819-827.
[2] Acha, E. (2004): FACTS Modeling and
Simulation in Power Networks. US: John
Wiley & Sons.
[3] Afsari, M., Singh S. P., Raju G. S (1999). An
Efficient Load Flow Technique for Radial
Distribution Network .
[4] Akagi, H., Watanabe E.H., Aredes, M. (2006).
Instantaneous Power Theory and Applications
to Power Conditioning. USA, New Jersey:
John Wiley & Sons.
[5] Alper Çetin (2007): Design and
Implementation of A voltage Source Converter
Based Statcom for Reactive Power
Compensation and Harmonic Filtering.
[6] Anderson, P.M, Fouad, A. A. (2003). Power
System Control and Stability, John Wiley and
Sons.
[7] Annel Kumar Akhani (2014): Principles of
Shunt Compensation. Engineering Articles
May, 2014.
[8] Civanlar, S., Grainger, J. J, Yin, H. and Lee, S.
H (1998). Distribution Feeder Compensator
(STATCOM) modeling and analysis
Techniques by Matlab.
[9] Koterev, D.N., Taylor C.W. and Mittlestadt
W.A., (2004). Model validation for August
10, 1996 WSCC System outage”, IEEE , pp
967-979.
[10] Grainger, J. J. & Civanlar, S. (1985). Volt/Var
Control on Distributions Systems with Lateral
Branches Using Shunt.
[11] Hingorani, N. (1988). High power electronics
and flexible AC transmission system. IEEE
Power Engineering Review, Vol.8, No.7, July
1998.
[12] Grainger, J. J., Stevenson, W. D (1994). Power
System Analysis. McGraw-Hill, International
Edition.
[13] John J. Conti, Paul D. Holtberg, Joseph A.
Beamon. Annual Energy Outlook 2006 with
Projections to 2030. Department of Energy
Study. US: DOE/EIA.
[14] Kothari, D. P. and Nagrath, I. J (2003).
Modern Power System Analysis; 3rd Edition.
New Delhi: Tata McGraw-Hill.
[15] Krievs, O., Ribickis L. (2009). Frequency
selective control of a parallel active filter with
resonance filter regulators. Riga Latvian
Journal of Physics and Technical Sciences,
Vol. 46.
[16] Lazlo, N. H. Understanding FACTS: Concepts
& technology of flexible AC Transmission
Systems.
[17] Lee, S. H, and Grainer, J. J. (1981). Optimum
Placement of Fixed and Switched Capacitors
on Primary Distribution.
[18] Ogbuefi, U. C, Madueme, T. C (2015). A
Power Flow Analysis of the Nigerian 330 KV
Electric Power System. Journal of Electrical
and Electronics Engineering, pp 46-57.
[19] Ogbuefi, U. C, Madueme T. C (2015). A
Power Flow Analysis of the Nigerian 330 KV
Electric Power System. IOSR Journal of
Electrical and Electronics Engineering, e-
ISSN: 2278-1676, p-ISSN: 2320-3331, Volume
10, Issue 1 Ver. I , pp 46-57, (Jan – Feb. 2015).
[20] Oluseyi, P. O., Adelaja, T. S. and Akinbulire,
T. O (2017). Analysis of the Transient Stability
Limit of Nigeria’s 330kV Transmission Sub-
network (Vol. Vol. 36). Nsukka, Nigeria:
Nigerian Journal of Technology (NIJOTECH),
January 2017.
[21] Principles for Efficient and Reliable Reactive
Power Supply and Consumption. Federal
Energy Regulatory Commission [FERC],
2005.
[22] “Reactive Power Project Meeting”, ORNL
Reactive Power Laboratory, (September 2005).
[23] Salama, M. M. and Chikhani, A. Y (1993). A
Simplified
[24] Network Approach to the VAR Control
Problem for Radial Network.
[25] Shekhappa Ankaliki, Kulkarn, A. D., Pabla,
A.S (1983).
© JUL 2019 | IRE Journals | Volume 3 Issue 1 | ISSN: 2456-8880
IRE 1701314 ICONIC RESEARCH AND ENGINEERING JOURNALS 30
[26] Neural Network Based Distribution System.
Tata McGraw Hill.
[27] Steiks, I., Krievs, O., Ribickis, L (2010). A
PLL Scheme for Estimation of the Voltage
Vector Position in a Parallel Active Filter
System, 7th International Symposium Topical
Problems of Education in the Field of
Electrical and Power Engineering. Pärnu,
Estonia.
[28] Stankovic, A.M., Stefanov, P.C., Tadnor, G.
and Somajic, D.J (1999). “Dissipativity as a
unifying control design framework for
suppression of low frequency oscillations in
power systems”. IEEE transaction on power
system vol.14, no.1 , pp 192-199.
[29] Rajapakse, A.D., (2005). Electromagnetic
transient’s simulation models for accurate
representation of switching losses and thermal
performance in power electronic systems.
IEEE.
[30] Rajapakse, A.D., Gole, A.M. and Wilson, P.L.
"Electromagnetic transient’s simulation
models for accurate representation of
switching losses and thermal performance in
power electronic systems”. IEEE Trans. on
Power Delivery, Vol. 20, Issue 1, pp. 319 –
327.
[31] The Changing Structure of the Electric Power
Industry 2000: An Update” Prepared by the
Electric Power Division . Electric and
Alternate Fuels; Office of Coal, Nuclear
Energy Information Administration (EIA),
U.S. Department of Energy.
[32] Tyil, H. K (2004). FACTS Technology for
Reactive Power Compensation and System
Control, IEEE/PES.
[33] Ulasi, A.J., Anumaka, M. C., Mbachu, C.B.,
Iloh, J.P., Offor, K.J (1999). Energy
Generation in Nigeria: Challenges and
Solution, Researchgate journal, 2014.
[34] Virulkar, V. B., Bhardwaj, D. G (1999):
Reduction of Energy Losses by Computer.