Microsoft Project Management Certification: How to Get Started
By Dian Schaffhauser Originally published March 20, 2008 Now that Microsoft has the elements in place for a full-fledged program to certify experts on its Project products, maybe it's time for you to consider enhancing that Project Management Institute credential with something more tool-specific. Even if you're not a PMP, the Microsoft certification program provides an effective way for you to prove what you know to yourself and those in a position to hire project managers.
Plus, according to studies by CompTIA and other organizations, the very process of preparing for an exam can make you more effective in the use of the tools upon which you're being tested. That means that becoming a specialist or professional (terms used in the titles of the certifications) can help you to run your projects better
Also, by achieving a new title, you'll join an elite group of people who have proven their knowledge and expertise of complex and vital software tools. Of the 16 million Project licenses that Microsoft has in the world, currently, only a few hundred people who use that software have certification on the Project products.
The Microsoft Project Certifications
Microsoft currently has three levels of Project certification:
• Microsoft Certified Technology Specialist (MCTS): Managing Projects with Office Project 2007. • Microsoft Certified Technology Specialist (MCTS): Enterprise Project Management with Office Project
Server 2007 • Microsoft Certified IT Professional (MCITP): Enterprise Project Management with Office Project Server
2007.
The first two credentials -- one for Project and the other for Project Server -- each require you to pass a single test. The IT Professional title requires three exams, those first two tests, as well as an additional one.
Let's drill down on each.
MCTS in Project: 70-632
You'll probably decide to start with that first Project exam, otherwise known as 70-632, which validates your knowledge of desktop features in Microsoft Office Project Standard 2007 or Microsoft Office Professional 2007.
This exam, according to Microsoft, is intended for people who work on projects as a team member, project lead, project manager, scheduler or some other role that requires the ability to formulate well thought-out project plans and to manage projects effectively. MCTS candidates may be responsible for the scheduling, estimating, coordinating, controlling, budgeting and staffing of projects. Candidates may also provide support to other Project users. Candidates should be familiar with key project management concepts and terminology.
Here's how Microsoft has broken down the major areas of the exam:
• Configuring tools and options (12%) • Setting up a project (10%) • Estimating, scheduling, and budgeting tasks (30%) • Resourcing project plans (24%) • Updating and reporting on project performance (24%)
Each percentage refers to the number of questions you can expect in that area relative to the other topic areas.
At the exam resource page for 70-632, you'll find specific skills that you can expect to be tested on. For example, under the category of "Tools and Options," you may find questions about setting up schedule options, calculation options, interface options, view options, general options, calendar options and security options.
To prepare for this test, you can take an official class from an authorized training center. That's course 5927, Microsoft Office Project 2007, Managing Projects, which is three days long. That is a great place to start in your exam preparation.
Microsoft also has published self-study material, in case training budget is a challenge. In May 2008, the Self-Paced Training Kit (Exam 70-632), was made available. Among the authors, MPUG certification columnist Bonnie Biafore. This type of training allows you to work at your own pace through lessons and lab exercises. The book-CD package also includes 250 practice and review questions so that you can evaluate your readiness to tackle the real thing.
MCTS in Project: 70-633
Once you've aced that Project 2007 exam, you may be inspired to continue your certification efforts with Project Server, exam 70-633. This exam is particularly relevant if you're already a PMP through the Project Management Institute.
According to Microsoft, this MCTS certification shows that you have an understanding of best practices and methodologies as established by the PMI. Candidates may use Project 2007 or Project Server 2007 to manage project and non-project efforts, risks, issues, documents, task progress and timesheets. You should be familiar with the key project management concepts and terminology found in the PMI's A Guide to the Project Management Book of Knowledge (PMBOK Guide).
Interestingly, according to an online presentation by instructors from the International Institute for Learning (IIL), you won't need much exposure to the administrative role within Project Server to tackle this exam. So if you work in a company that limits access to that aspect of Project, not to worry. Study up on it in other ways.
Here are the major topic areas for this exam, according to the exam page for 70-633:
• Initiating projects • Planning projects • Executing projects • Monitoring and controlling projects • Managing Project Professional and Project Web Access environments
That same page provides a breakdown of skills that you may be asked about during your exam. For instance, under "Executing Projects," you may find questions about matching and replacing resources, building a project team with named resources, distributing information to project stakeholders, creating and managing a timesheet and reviewing and approving a timesheet.
To prepare for 70-633, you can take instructor-led training. That's course 5928, Microsoft Office Project Server 2007, Managing Projects, a three-day class. You can also do self-study. In September 2008, Microsoft published the MCTS Self-Paced Training Kit (Exam 70-633). As with the training kit for the Project test, this one includes both lessons and exercises on CD -- along with practice questions to help you assess your skills.
There are no prerequisites for taking either test. You simply contact Prometric online to schedule the exam (which is done in person at a testing center near you), pay the fee of $125 and tackle the questions, which will be shown to you on a computer screen. It's a timed test, and all questions for this exam are multiple choice or simulation. A simulation question shows you a part of the interface for Project and asks you to do a particular activity or task. You simulate how it would be done in the actual version of Project.
According to "Ask the Teacher" author Ellen Lehnert, these tests have 55 questions. And, chances are, you won't get the same version of the exam that a co-worker gets. Microsoft tends to switch in questions and potential answers to prevent "exam cram" websites from publishing the full contents of the tests.
MCITP: Enterprise Project Management
After you've tackled the previous two exams -- for Project and Project Server -- it makes sense to complete the package by going after the next level of credential. That would be the elite Microsoft Certified IT Professional.
The Microsoft page for this title explains that the EPM certification is intended for project managers and other professionals who use Project and Project Server 2007 to manage and support projects in an enterprise project management (EPM) environment. Candidates for this certification are able to manage project and non-project efforts, risks, issues, documents, task progress and timesheets. Candidates should have in-depth knowledge of key project management concepts and terminology found in the PMI's PMBOK Guide.
Exam 70-634 takes testing to a new level. Whereas the previous tests included multiple choice and simulation questions, this one has scenario questions. You're presented with a screen of information about a fictional company that needs your services. Your job is to read through the information, then tackle question screens, in which you need to evaluate various choices of how to approach the work and pick the best one, given the specifics of the scenario. You'll face multiple scenarios.
According to Microsoft, you'll be facing the following topics in this scenario-based test:
• Managing data access and collaboration • Planning and troubleshooting active projects and programs • Controlling projects and programs • Managing resources • Reporting and analyzing business data
The exam page for 70-634 lists specific skills you'll want to familiarize yourself with in preparation for taking the test. Under the category of "Controlling Projects and Programs," for example, you could face questions regarding such matters as accounting for time, creating non-project time categories, identifying variances outside the threshold and controlling changes.
Classroom training is the five-day Course 5929: Microsoft Office Project Server 2007, Managing Projects and Programs. The class was still in development at the time of this writing.
There is no official self-study training planned for the exam, though it's possible that a company other than Microsoft will eventually publish something to address how to study for the test, presuming that there appears to be strong interest in the credential.
IIL instructor Alan Bearder, in a presentation about the exams, offered several useful tips for tackling this scenario exam (or any of the ones developed by Microsoft):
1. Read the entire question or scenario. 2. Pay attention to details. 3. Read each multiple-choice option. 4. Re-read the question or applicable scenario section. 5. Answer the question. 6. Mark questions for review. 7. Use other questions to help validate previous questions. 8. Watch your time. 9. Use the review tool to review marked questions.
But he noted that whereas in the other tests, you can go back and change an answer later on if time remains, in this exam, once you've completed one set of scenario questions and moved onto the next set of scenario questions, you can't return to the previous one.
What Are You Waiting For?
Although there's very little recognition for the Microsoft Project credentials at this time, it hardly matters. Tackling these tests will help you hone your skills like nothing else can. You'll be forced to explore those little-visited corners of the products that you may never have thought to try out before. You'll face virtual situations in which you may have to think differently from the way your current work asks you to. In other words, you'll be placing yourself into a position where you are saying to yourself and others, "What I do is important and
how I do it makes a difference, and I want to be the best I can at it." Good luck!
Dian Schaffhauser is the editor for MPUG. Contact her with your certification and project management stories, questions and ideas at [email protected].
Best Practices for Microsoft Project By Jim Park, PMP First published October 19, 2009
No matter what features Microsoft introduces into its latest release of Microsoft Project, it will forever fail to address some basic needs for project managers as they approach the tool. Here are six practical suggestions when using any version of Microsoft Project.
Understand the Challenges to Using Microsoft Project
There's a reason that spreadsheets are the most commonly used software tools to manage projects. Spreadsheets are more intuitive and predictable than Microsoft Project. Project is relatively easy to use when starting to coordinate tasks, but it can quickly become cumbersome and unmanageable when attempting to optimize resources and control your schedule or budget. A streamlined approach to using the most appropriate features is highly recommended. I have generally found that a project manager can effectively plan and control their projects with far less than half of the tool's functionality. One way to streamline your approach to the tool is to minimize data entry to certain key fields (e.g. Task Name, Predecessor, Duration, Actual Start, Actual Duration, and Remaining Duration, to name a few).
Know the Planning Limitations
Microsoft Project isn't a project management tool. Let me repeat that last sentence: Microsoft Project is not a project management tool. It was developed as a schedule tracking application, but has become accepted over the years as a comprehensive project management tool. It is not the most effective tool when it comes to brainstorming activities like project planning. Many project managers get challenged when they drag their teams through a planning session with nothing but a Gantt chart. Gantt charts aren't very conducive to team interaction during the planning process. Teams often respond better and produce higher quality planning information when using affinity diagramming tools like mind maps and work breakdown structures. That brings up another good suggestion…
Integrate a Work Breakdown Structure (WBS)
For all the years that Microsoft Project has been in use, there has never been a built-in WBS feature. This has always amazed me. Previous versions have attempted to integrate with Microsoft Visio to create WBS diagrams, but this was never an effective feature. Project managers will often utilize summary tasks and subtasks (i.e. indenting tasks) in order to create a hierarchy of work within a Gantt chart. This is a good start, but I would go a step further and use an add-on tool such as WBS Chart Pro (criticaltools.com) which integrates the Work Breakdown Structure into Microsoft Project for reporting as well as front-end planning functionality.
Improve Estimation Techniques
Often times the weakest link in the planning process is the quality of work and cost estimates for project activities. There are several things to keep in mind as you enter Duration, Work, or Cost estimates into Microsoft Project. First, it is your responsibility as the project manager to challenge and validate estimates you receive from various sources. If you have gone through enough projects, you know that you can't assume every estimate will be accurate. Refer to historical data, break down components to smaller work packages, and push back on those Subject Matter Experts (SMEs) until you're more confident in the quality of the estimates. In addition, you can use various techniques such as Delphi to gain consensus on estimates or Stochastic Modeling to leverage three-point estimates and improve the confidence in your overall schedule or budget. There are built-in PERT Analysis features, add-on tools (e.g. Risk+ from Deltek) and even macros for Monte Carlo simulation available to integrate three-point estimation and risk management into Project plans.
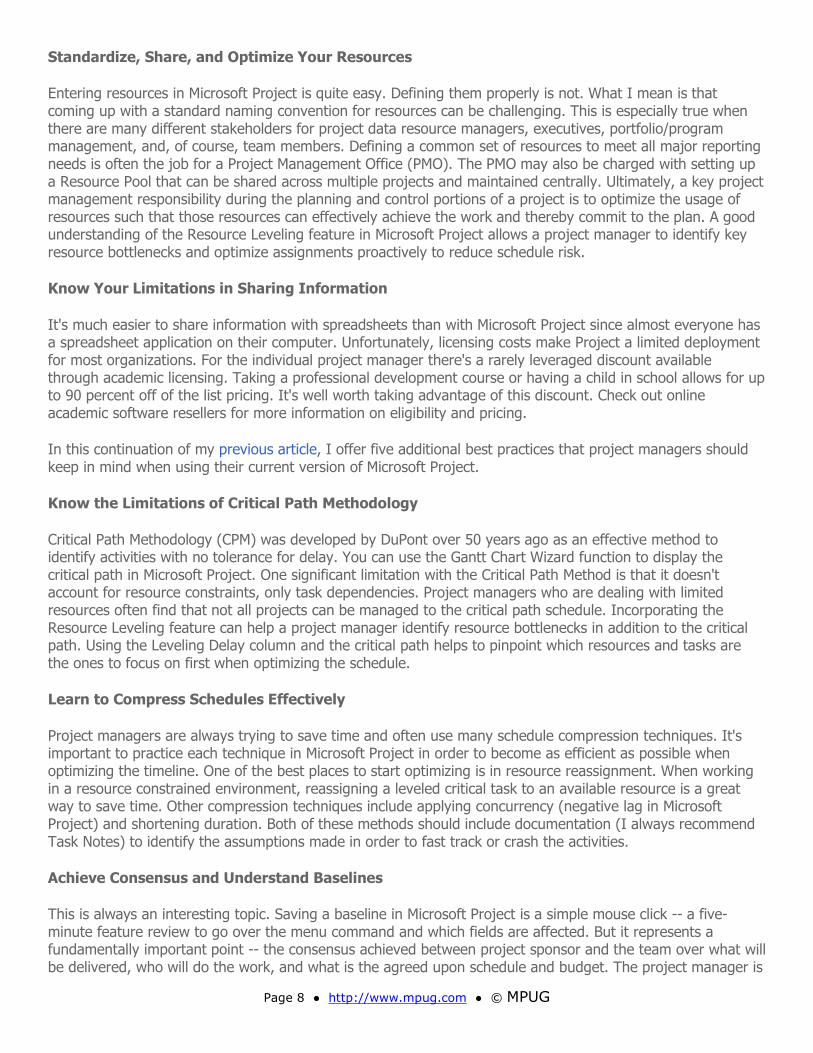
Entering resources in Microsoft Project is quite easy. Defining them properly is not. What I mean is that coming up with a standard naming convention for resources can be challenging. This is especially true when there are many different stakeholders for project data resource managers, executives, portfolio/program management, and, of course, team members. Defining a common set of resources to meet all major reporting needs is often the job for a Project Management Office (PMO). The PMO may also be charged with setting up a Resource Pool that can be shared across multiple projects and maintained centrally. Ultimately, a key project management responsibility during the planning and control portions of a project is to optimize the usage of resources such that those resources can effectively achieve the work and thereby commit to the plan. A good understanding of the Resource Leveling feature in Microsoft Project allows a project manager to identify key resource bottlenecks and optimize assignments proactively to reduce schedule risk.
Know Your Limitations in Sharing Information
It's much easier to share information with spreadsheets than with Microsoft Project since almost everyone has a spreadsheet application on their computer. Unfortunately, licensing costs make Project a limited deployment for most organizations. For the individual project manager there's a rarely leveraged discount available through academic licensing. Taking a professional development course or having a child in school allows for up to 90 percent off of the list pricing. It's well worth taking advantage of this discount. Check out online academic software resellers for more information on eligibility and pricing.
In this continuation of my previous article, I offer five additional best practices that project managers should keep in mind when using their current version of Microsoft Project.
Know the Limitations of Critical Path Methodology
Critical Path Methodology (CPM) was developed by DuPont over 50 years ago as an effective method to identify activities with no tolerance for delay. You can use the Gantt Chart Wizard function to display the critical path in Microsoft Project. One significant limitation with the Critical Path Method is that it doesn't account for resource constraints, only task dependencies. Project managers who are dealing with limited resources often find that not all projects can be managed to the critical path schedule. Incorporating the Resource Leveling feature can help a project manager identify resource bottlenecks in addition to the critical path. Using the Leveling Delay column and the critical path helps to pinpoint which resources and tasks are the ones to focus on first when optimizing the schedule.
Learn to Compress Schedules Effectively
Project managers are always trying to save time and often use many schedule compression techniques. It's important to practice each technique in Microsoft Project in order to become as efficient as possible when optimizing the timeline. One of the best places to start optimizing is in resource reassignment. When working in a resource constrained environment, reassigning a leveled critical task to an available resource is a great way to save time. Other compression techniques include applying concurrency (negative lag in Microsoft Project) and shortening duration. Both of these methods should include documentation (I always recommend Task Notes) to identify the assumptions made in order to fast track or crash the activities.
Achieve Consensus and Understand Baselines
This is always an interesting topic. Saving a baseline in Microsoft Project is a simple mouse click -- a five-minute feature review to go over the menu command and which fields are affected. But it represents a fundamentally important point -- the consensus achieved between project sponsor and the team over what will be delivered, who will do the work, and what is the agreed upon schedule and budget. The project manager is
responsible for reaching this agreement as a result of the project planning process. Setting a baseline essentially takes a snapshot of the planning data and saves it for future reference in the tracking and control phase of the project. The importance of this step within the process of using the tool can't be overstated.
Control Projects by Variance Analysis
Here's where Microsoft Project shines. Once an effective planning process is completed and a good baseline is set, the Tracking Gantt View and Tracking Table can be used to collect actual status and provide quality decision-making data for corrective actions. Fields like Actual Start, Actual Duration, and Remaining Duration are far more effective than % Complete. Team members are much more accountable to task updates when asked for remaining duration or work as opposed to % complete. Good project managers will go around and gather actual status from team members prior to any status meetings and then use the team meetings for more important activities such as problem solving, risk management, scope change control, and additional planning.
Support Multiple Project Managers
Whether it's a large well established PMO or a single project manager who wants to improve the way projects are managed in the organization, there are many best practices in supporting a group of project managers. The easiest place to start is by standardizing many of the useful objects within Project and replicating them to other plans or templates with the Organizer feature. These objects usually include tables, filters, views, and calendars (for example, to establish working time for various countries). Organizing a regular company user group meeting can be an effective way to share lessons learned and keep everyone on the same page. Other useful techniques that support project management in the enterprise include Shared Resources, usage of master and subprojects, project-to-project dependencies, and portfolio resource management.
This article first appeared in the University of California Santa Cruz (UCSC) Extension blog, The Art of Project Management.
Jim Park, PMP, provides training and consulting services focused on developing methodology, tools, and a PMP credentialed workforce. Companies benefiting from Jim's PMO support include Oracle, Hitachi, PG&E, Lockheed, Kaiser Permanente, ALZA Pharmaceuticals, Ingersoll-Rand, Symantec, and the U.S. Air Force. He's an instructor at UCSC Extension in Silicon Valley and has taught public courses in project management since 1998. Jim has over 15 years of experience in the software development, information technology, pharmaceutical, and medical device
industries primarily focused on managing projects and developing better project management organizations, processes, and tools. Contact him at [email protected].
Tips and Tricks for Microsoft Project 2007: Creating Useful Custom Views
By Dale Howard, MVP First published October 5, 2009
With the exception of Combination Views that consist of two Views in a split-screen arrangement, remember that Microsoft Office Project 2007 defines a View as:
View = Table + Filter + Group + Screen
In order to extract meaningful information from your projects, you may need to create your own custom View so that you can see:
• The columns of data you want to see (the Table). • Only the rows of data you want to see (the Filter). • The rows grouped the way you want to see them (the Group). • Your data displayed on the screen using your desired layout (the Screen).
MSProjectExperts recommends a "best practice" approach for creating custom Views, which is to apply a four-step method:
1. Select or create a Table. 2. Select or create a Filter. 3. Select or create a Group. 4. Create a new View using the desired Table, Filter, Group, and Screen.
TIP: Before you create a new custom View, MSProjectExperts recommends that you first open any production project in Read-Only mode. Create your new custom View in the project and test the View on "live" data. When satisfied with the new custom View, copy it to the Global.mpt using the Organizer. This makes the custom View available to all current and future projects. After saving the new View in the Global.mpt file, you can safely close the project without saving the changes.
Create a Duration Variance View
Your goals for the custom Duration Variance view include:
• Creating a custom Table that shows all Duration-related columns. • Creating a custom Filter that selects tasks whose current Duration exceeds the original Baseline
Duration. • Applying the custom Filter as a Highlight Filter that highlights all tasks meeting the Filter criteria. • Using Cell Background Formatting to accentuate the highlighted tasks. • Displaying a Tracking Gantt on the right side of the View.
Create a Duration Variance Table
The easiest way to create a new custom Table is to make a copy of an existing Table, and then to modify the copy. Create a Duration Variance table by completing the following steps:
1. In a Read-Only project, click View | Table | More Tables. 2. In the More Tables dialog, select the Work table and then click the Copy button. 3. In the Table Definition dialog, enter a name such as _msPE Duration Variance in the Name field and
4. Replace each of the Work fields listed in the dialog with their Duration field counterparts, as shown in the table below:
5. For each of the Duration fields listed in the dialog (such as Baseline Duration), use the Backspace key to delete the information in the Title field (don't use the Delete key or you'll remove the entire field).
6. Click the OK button and then click the Apply button to display the new Duration Variance table. 7. Click and hold the Duration Variance column header to select it and then "drag and drop" the column
to the immediate right of the Task Name column.
Create a Duration Variance Filter
The purpose of a Filter is to display only those tasks or resources that meet your Filter criteria. Create a Duration Variance filter completing the following steps:
1. Click Project | Filtered for | More Filters. 2. In the More Filters dialog, click the New button. 3. In the Filter Definition dialog, enter a name such as _msPE Duration Variance > 0d in the Name field
and select the Show in menu option. 4. In the data grid, enter the following Filter criteria:
Duration Variance is greater than 0
5. Select the Show related summary rows option. 6. Click the OK button and then click the Apply button to test the new Duration Variance filter. 7. When satisfied that the Filter performs as desired, press the F3 function key on the keyboard to
reapply the All Tasks filter. 8. Click View | Table | Entry to reapply the Entry table.
Because this custom Duration Variance view doesn't require using a Group, you can immediately create the custom View using the new custom Table and Filter.
Create the Duration Variance View
The easiest way to create a custom View is to copy an existing View and then edit the copy. Create your custom Duration Variance view by completing the following steps:
1. Click View | More Views. 2. In the More Views dialog, select the Tracking Gantt view and then click the Copy button. 3. In the View Definition dialog, enter a name such as _msPE Duration Slippage in the Name field. 4. Select the following options in the View Definition dialog:
5. Click the OK button and then click the Apply button to test the new Duration Variance view.
The software highlights all tasks that meet the Filter criteria using a Blue font. In a large project, however, the blue tasks can be difficult to distinguish from the rest of the tasks.
Specify Cell Background Formatting for the Highlight Filter
Set up your new Duration Variance view to use Cell Background Formatting with the Highlight Filter by completing the following steps:
1. Click Format | Text Styles. 2. In the Text Styles dialog, click the Item to Change pick list and select the Highlighted Tasks item. 3. Change the Color value to Black and change the Font style value to Bold. 4. Change the Background Color value to Yellow (or any color you want). 5. Optionally select a Background Pattern value, if you wish. 6. Click the OK button.
The software re-highlights tasks that meet the Filter criteria, but now the highlighting uses Cell Background Formatting instead.
Create a Nearly Critical Path View
Your goals for the custom Nearly Critical Path view include:
• Displaying the true Critical Path in the project using red Gantt bars for all tasks that have 0 days of Total Slack.
• Displaying the "Nearly Critical" Path for tasks that have Total Slack greater than 0 days. • Allowing the user to determine how many days of Total Slack constitute the "Nearly Critical" Path. • Highlighting the "Nearly Critical" tasks using a Highlight Filter with Cell Background Formatting.
Copy an Existing View and Format the Gantt Chart to Display the Critical Path
Create a new View and format the Gantt Chart to display the Critical Path by completing the following steps:
1. Click View | More Views. 2. In the More Views dialog, select the Gantt Chart view and then click the Copy button. 3. Enter a name such as _msPE Nearly Critical Path in the Name field, click the OK button, and then click
the Apply button. 4. Click the Gantt Chart Wizard button on the Formatting toolbar. 5. Click the Next button and then select the Critical path option. 6. Click the Finish button, then click the Format It button, and finally click the Exit Wizard button.
Notice how the Gantt chart now automatically shows all Critical tasks with red Gantt bars. Remember, however, that Critical tasks are only those tasks with zero days of Total Slack. Wouldn’t it be nice to know which tasks are "nearly" Critical, such as tasks that have one to five days of Total Slack?
Create a Custom Filter to Display "Nearly Critical" Tasks
To display "nearly" Critical tasks, create a custom Filter by completing the following steps:
1. Click Project | Filtered for | More Filters. 2. In the More Filters dialog, click the New button. 3. In the Filter Definition dialog set up the Filter criteria shown in the following table:
In the preceding table, the ellipsis character (...) in the filter name is the standard naming convention to indicate an interactive filter that prompts you to enter the filter criteria manually. The question mark character in the Value(s) field indicates that Microsoft Project 2007 must display a dialog requesting a manually entered value. The text between the quotation marks indicates the text the software will display in the dialog.
4. Click the OK button and then click the Close button.
Edit the Nearly Critical Tasks View
Edit the _msPE Nearly Critical Path view to include the new Filter by completing the following steps:
1. Click View | More Views. 2. Select the _msPE Nearly Critical Path view, if necessary, and then click the Edit button. 3. In the View Definition dialog, click the Filter pick list and select the _msPE Nearly Critical Tasks... filter. 4. Select the Highlight Filter option and then click the OK button. 5. Click the Apply button to apply the new custom View. 6. In the _msPE Nearly Critical Tasks dialog, any value and then click the OK button.
Notice how the Highlight Filter highlights Nearly Critical tasks with a blue font color. In a large project, it can get difficult to spot the blue tasks in the sea of black tasks!
Format the Highlighted Tasks Using Cell Background Formatting
Microsoft Project 2007 allows you to use Cell Background Formatting to format the cell background color of the highlighted tasks. To change the highlighting color, complete the following steps:
1. Click Format | Text Styles. 2. Click the Item to Change pick list and select the Highlighted Tasks item. 3. Change the Color value to White and change the Font style value to Bold. 4. Click the Background Color pick list and select the Red item. 5. Change the Font style value to Bold. 6. Click the OK button.
Notice how changing the Cell Background Formatting colors make it easier to see the "nearly" Critical tasks in the project, while the red Gantt bars make it easy to see the true Critical Path of tasks that have zero days of Total Slack.
Create a Dependency Analysis View
Your goals for the custom Dependency Analysis view include:
• Creating a View that displays the immediate Predecessor and Successor tasks for any task you select. • Determining which Predecessor task is the Task Driver for any task you select.
To meet these goals, create a custom Combination View by completing the following steps:
1. Click View | More Views. 2. In the More Views dialog, click the New button. 3. Select the Combination view option and click the OK button. 4. In the Name field, enter a useful name for your custom view, such as _Dependency Analysis. 5. Click the Top pick list and choose the Gantt Chart view. 6. Click the Bottom pick list and choose the Relationship Diagram view. 7. Select the Show in menu option and then click the OK button. 8. Click the Apply button to apply the new custom View.
After creating the custom View, select any task in the Gantt Chart pane (top pane) and you'll see the Predecessor and Successor tasks in the Relationship Diagram (bottom pane).
Assuming you have multiple Predecessors, you can determine which Predecessor task is actually the Task Driver by clicking Project | Task Drivers (or by clicking the Task Drivers button on the Standard toolbar). Reselect the task in question and the Task Drivers pane will reveal which task is the Task Driver for the selected task.
Copy the New Custom Views to the Global.mpt File
After creating any new custom View, you must copy the custom View and its components (custom Table, Filter, and Group) into the Global.mpt. This action makes the custom View available to all current and future projects. To copy the View to the Global.mpt file, complete the following steps:
1. Click Tools | Organizer. 2. In the Organizer dialog, select the new custom View in the list of Views on the right side (in the current
project) and click the Copy button to copy the custom View to the Global.mpt file. 3. Click the Tables tab and copy the new custom Table to the Global.mpt file. 4. Click the Filters tab and copy the new custom Table to the Global.mpt file. 5. Click the Close button.
There you have it, the four-step process for creating useful custom views.
Dale Howard. MVP, MCT, MCITP, is the VP of Education for MSProjectExperts. The company was founded in 2002 by Gary Chefetz, MVP and focuses on Microsoft Office Project and Project Server implementation, consulting, training, and custom development. The firm works with Microsoft Office Windows SharePoint Services and Microsoft Office SharePoint Server. Contact Dale at [email protected] or call the company at (646) 736-1688.
Creating Milestone Reports in Microsoft Project By Chris Mauck, PMP, MCITP First published November 16, 2009
If you're managing complex programs or large projects, a summary milestone report may be the best way to share information that shows the status of key deliverables. Yet, out of the box Microsoft Project views are limiting and don't provide the visual summary level views that give an executive the quick overview of project or program health he or she needs for making quick and accurate business decisions. In this article I explain how to configure a view within Project that provides an executive rollup of a program showing the projects in the program with milestone status. Figure 1 shows the view that will be created through these configurations.
Figure 1. The summary views we'll create in this step-by-step guide.
To display the status of each milestone graphically, milestone bar styles need to be configured for each unique status. The following logic was applied to distinguish milestones that haven't been baselined, milestones that are on track, milestones that are delayed, and baselined milestones for those milestones that are delayed.
I've selected the following shape types and colors to designate the status of the milestone being shown:
Shape Types:
• Solid diamond: Completed milestone • Framed diamond: Incomplete milestone • Dashed framed diamond: Baseline of milestone • Circle around diamond: Attention Required – Delayed incomplete milestone
Color coding:
• Black: Not baselined • Green: On or ahead of schedule • Red: Delayed
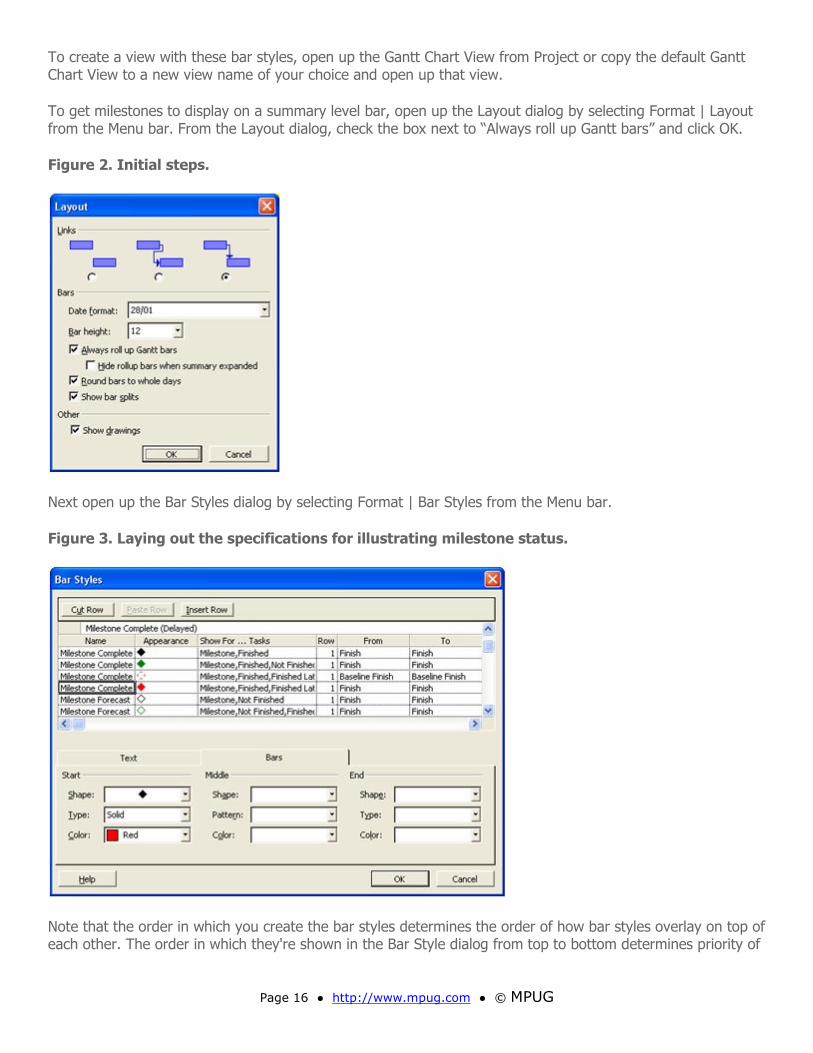
To create a view with these bar styles, open up the Gantt Chart View from Project or copy the default Gantt Chart View to a new view name of your choice and open up that view.
To get milestones to display on a summary level bar, open up the Layout dialog by selecting Format | Layout from the Menu bar. From the Layout dialog, check the box next to “Always roll up Gantt bars” and click OK.
Figure 2. Initial steps.
Next open up the Bar Styles dialog by selecting Format | Bar Styles from the Menu bar.
Figure 3. Laying out the specifications for illustrating milestone status.
Note that the order in which you create the bar styles determines the order of how bar styles overlay on top of each other. The order in which they're shown in the Bar Style dialog from top to bottom determines priority of
sequencing or ordering of how they're drawn on the Gantt chart view. Hence, as you're creating bar styles, pay attention that you don't hide something behind another bar style that you want to display.
Starting at the current bar style named Milestone, rename Milestone to Milestone Complete (No Baseline) and modify the bar properties as shown in the chart below. Insert the remaining bar style names and properties after the bar style you've just modified. The logic of the order of these milestones creates a solid black milestone for all finished milestones and then overwrites the black milestone with a solid green milestone for those that are baselined and on time and a solid red milestone for those that are baselined and late. The same logic follows for the incomplete milestones.
Table 1. How we're ordering the milestones for this report.
To add the names and dates of the milestones to the graphical display on the Gantt chart view, click on the Text tab from the Bar Style dialog and select the field to display as shown in Figure 4.
Note that if you do this for the Milestone Complete (No Baseline) and Milestone Forecast (No Baseline), the names and dates will show up for all the task level milestones, since the green and red milestones are just writing over current black milestones.
Next, create bar styles for rolled up milestones. From the Bar Style menu scroll down the list of bar styles to the current *Rolled Up Milestone bar style. Change this bar style to *Rolled Up Milestone Complete (No Baseline) with the properties shown in the table below and then insert the remaining bar styles listed.
Figure 4. Specifying what shows up on the graphical display.
Tip: Using * in the name excludes this item from the legend when printing the Gantt chart view.
To change the color of the various workstreams or project summary bars, if displaying a program level view, select the individual task row. From the Menu bar select Format | Bar to open the Bar dialog. From the Bar Shape tab, change the color under Middle, and click OK. Repeat with a different color for each workstream or project summary.
Table 2. Details for bar styles to show summarized milestones.
Finally, to print a view for distribution, from the Menu bar select File | Print Preview. Click on the Page Setup button to open up the Page Setup dialog and customize the header and footer with a logo and custom text.
Note that the legend at the bottom of the printout shows bar styles that have been designated for display.
Chris Mauck, PMP, MCITP, is the lead of the PMO with Jacobs Advanced Systems Group, a subsidiary of Jacobs Engineering, in Dumfries, VA, which provides advanced technical services to the government. Contact Chris at [email protected].
Critical Path 2.0 By Eric Uyttewaal First published February 22, 2010
The content of this article is a brief preview from Eric Uyttewaal’s new, upcoming book, Forecast Scheduling with Microsoft Project 2010.
The first version of the Critical Path Method (CPM 1.0) is soon celebrating its 60th birthday. It was just about 60 years ago -- during the 1950s -- that DuPont constructed a model for projects that encompasses a list of a project's activities, the time each will take to be completed, and their dependencies. CPM, of course, is that path of activities from beginning to end that defines project duration -- the earliest it can begin and the latest it can end without becoming any longer.
I find CPM 1.0 still a beautiful thing. CPM helps project managers focus on a subset of activities that affect the project end date. However, some people say it takes too much time to identify and enter all the dependencies. Some say they hardly ever see a complete and reliable critical path in their schedule. Others say critical path stops working when you start to level the workloads. And who among us doesn't live in a resource-constrained situation nowadays?
Yes, these are all real issues. But your thinking shouldn't stop there. Each can be addressed with some simple techniques and new tools. In this article, you'll find out how to overcome most of these obstacles. I'm confident you'll gain a new perspective on CPM -- in fact, I'm so certain, I'm calling it "Critical Path 2.0."
This article examines the questions: Does CPM 1.0 still deserve a place in our project management body of knowledge? Can it stand up against the challenges and practices of our current times? Can its weaknesses be overcome? Along the way, I'll discuss our state-of-the-art scheduling software and whether it addresses CPM 1.0 deficiencies. Between the lines, we'll also explore whether CPM 1.0 can survive the next decade.
The Forgotten Assumptions of CPM 1.0
It sometimes surprises me when people make remarks like: "Well, the critical path method doesn't work in my resource-loaded schedule!" When I hear this, I often think: "It wasn't supposed to work in your situation!" Many people have forgotten that CPM 1.0 was based on some seemingly far-fetched assumptions. When CPM 1.0 was first formulated, the creators also gave us their assumptions:
Assumption 1: Task estimates are normally distributed; an estimate has an equal chance of being under or over when compared to actuals. (My comment: This assumption is often wrong because we all know that task durations tend to extend out much more often than they shrink.)
Assumption 2: There's no merge bias or path convergence; the fact that multiple paths need to come together doesn't affect the on-time probability of the overall project. (My comment: This assumption is often wrong because we all know that parallel paths do affect the likelihood of project delays.)
Assumption 3: You have unlimited resources available. (My comment: This assumption is often wrong because most of us now use experts and are managing a resource-constrained project.)
Assumptions 1 and 2 haven't been true right from the start; but only since about 2000 have they been adequately addressed. That's when we had sufficient computer power to really put Monte Carlo Simulation to the test, a technique that's actually been around since the 1930s. It took all those years in between before software would surface that would allow us to generate the random numbers and perform all the calculations in our project schedules to get a more realistic sense of task estimate and multiple path accuracy.
Regarding assumption 3, many construction projects are still scheduled under the assumption that they have access to unlimited resources. Construction companies rarely allow their project to extend if they can remedy the situation by putting more resources on site, particularly if there are contractual penalties for delivering late. Penalty clauses are common in construction, and general contractors will hire 10 more carpenters for next week if they need to. However, using unlimited resources is becoming less of an option, even for construction companies. In practice, I see more construction schedules being loaded with resources. So, assumption 3 becomes untenable even for construction.
Another point: IT projects have always relied on expert resources. I define these as resources that aren't always available when you need them. Therefore, projects that use experts are almost always resource-constrained. In most IT-projects, the assumption of unlimited resources has decreased the value of CPM 1.0 to the point of being useless. Many other types of projects also use experts: pharmaceutical, defense, telecommunications... and whenever you need experts, you can't simply assume any longer that you can always add resources to solve your time problems.
Critical Chain vs. CPM 1.0
CPM 1.0 lost a lot of influence with the arrival of Critical Chain project management thinking in the late 1990s, which formed the focus of a book, titled Critical Chain, by Eliyahu Goldratt. Goldratt made some very astute observations about the weaknesses of CPM and proposed to replace it with an entirely new system of scheduling, Critical Chain:
• Switching from 90 percent to 50 percent confidence level estimates or aggressive estimates. • Adding a project buffer to the most critical path and measuring project health in terms of buffer
consumption. Critical chain is essentially buffer management. • Scheduling the secondary paths as late as possible and inserting buffers where the secondary paths
connect to the main critical path. • No multi-tasking of resources. Each resource works with 100 percent focus on a task until it's finished
or until roadblocks appear in the way, and only then does the resource move onto the next task. • Making sure that the schedule stays within the constraint of availability of resources. Critical Chain
respects the limited resource availability and finds the resource-critical path in a schedule rather than the critical path.
Critical Chain seems to be firmly entrenched in certain niches such as new product development in high-tech. Likewise, many a project manager has adopted some aspect of critical chain -- single-tasking resources is popular. However, from my perspective critical chain hasn't overthrown CPM 1.0; the majority of project managers exhibit a continued interest in CPM 1.0.
Agile vs. CPM 1.0
More recently, the Agile movement has mounted an attack on CPM. Like advocates of Critical Chain, these devotees would also like to kill CPM and dispose of its body of knowledge. Agile works well, particularly in software development and research projects. However, I believe that CPM will survive Agile attacks as well because project management doesn't start and stop in IT.
Sometimes, I even like to ponder that CPM will perhaps enjoy a revival in software and in research projects if we manage to address some of the issues that Agile thinking has brought to us, for example, the proper chunking of large projects to promote the creation of prototypes and builds early, resulting in the early creation of benefits (quick wins). There's no reason this practice couldn't be implemented with CPM 1.0, and therefore I don't believe it'll make CPM go away.
The survival of CPM will depend on two things. First, the critical path method needs a makeover -- CPM 2.0 -- to address the assumptions and issues of CPM 1.0 as well as integrate several facets of Critical Chain and Agile thinking. Second, those who develop scheduling software need to add new features into their applications to address the assumptions and issues of CPM 1.0 by giving us tools with which we can perform most or all aspects of CPM 2.0 in an automated fashion.
The limitations of CPM 1.0 that we need to address in CPM 2.0 are:
• Incomprehensible critical paths: Why is the critical path what it is? • Incomplete critical paths: Why does the critical path in a schedule often only explain part of the project
duration? • Hidden critical paths: Are you looking at the right path? • Resource critical paths: Do you have unlimited resources -- anybody? • Program critical paths: Can you trace your critical path across multiple subprojects? • Protecting the critical paths: Can you protect the main critical path from impacts of other secondary
paths?
If we can make our scheduling tools address most or all of these issues, we'll have arrived at version 2.0 of CPM. CPM 2.0 scheduling applications should have features that resolve all six challenges we have with our current scheduling software. Amazingly, I think all but one of these limitations have already been addressed. Let's drill down a bit.
Incomprehensible Critical Paths: Maybe you're looking at your schedule and asking, why is the duration of this critical task so long? Critical tasks may be longer than their duration suggests because your resource is going on a vacation while working on it. The scheduling tools need to make readily visible when a resource vacation stretches a task bar. Another issue surfaces when there's a gap between two critical tasks. The cause for this can be a lag on a dependency, a task calendar, or resource calendar. Again, the scheduling tool should explain this in the Gantt chart. My company, ProjectPro, sells a Microsoft Project add-in, Complete Critical Paths, that can do this.
Incomplete Critical Paths: What breaks a critical path? How can you repair it? What do you need to do in your current scheduling software to display a complete critical path that explains the entire project duration? There are only six factors that can break a critical path, and since this list is finite, our scheduling tools should be able to handle this and explain any gaps. There's a technique of increasing the threshold for criticality from zero days to x days with which you can make a critical path complete. Again, my company's product, Complete Critical Paths, will present the complete critical path automatically.
Hidden Critical Paths: Our scheduling software may not tell us the real critical path, particularly when there are many parallel paths that have similar durations. The problem is not that our software is lying to us; the issue is that only Monte Carlo simulation can reveal the path that is the most critical to monitor when there are parallel paths. In my view simulation is essential for every schedule, and every scheduler needs to do this. There are two solid add-ins for Microsoft Project with which we can find the hidden critical paths in our schedule: Risk+ from Deltek and @Risk from Palisade.
Resource Critical Paths: How does workload leveling impact the critical path? Microsoft Project still doesn't have resource-critical path features yet -- a major omission in my view. However, two add-ons for Microsoft Project can come to our rescue by implementing critical chain capabilities: ProChain Project Scheduling from ProChain Solutions and cc-Pulse from Spherical Angle. If you don't want to implement the other aspects of Critical Chain, you can use our company's add-on, Complete Critical Paths.
Program Critical Paths: Several tracing tools that are available as add-ons to Microsoft Project can display the critical path leading up to a milestone. They do a good job as long as you stay within one schedule. They typically stop when the critical path goes across to another schedule via cross-project links. We need tracing tools that can go across subproject schedules via the handoffs between the subprojects. Currently, we're aware of only one such add-in, which we publish: Program Management Solution.
Protecting the Critical Path: How can you schedule backwards from milestone events on the main critical path to schedule the activities of secondary importance? How can you schedule secondary paths as late as possible and still protect the main critical path by using a buffer? How can you further enhance the critical path method by adding features like backward scheduling from critical path events and create dynamic due dates -- due dates that move when the main critical path moves?
For this particular set of challenges, there's more needed than just tools. It requires the creation of a new class of dependencies, the "earlier-than" dependencies. Currently, we only have later-than dependencies in our scheduling tools. For example, a Finish-to-Start (FS) relationship means the successor can start later than the finish date of the predecessor. Start-to-Start (SS), Finish-to-Finish (FF), and Start-to-Finish (SF) all work in a later-than fashion as well. If we add an entirely new class of earlier-than dependencies, we can create dynamic due dates and dynamic windows of opportunity in our schedules, and we can do backward scheduling properly. On the other hand, we'd also have to re-think the critical path algorithm and reprogram it in our scheduling tools. This will take longer to agree upon and to resolve.
Can CPM Survive?
CPM 1.0 was based on major assumptions that also reveal its shortcomings. CPM 2.0 addresses six limitations of the critical path method as we currently understand it. A review of currently available scheduling software, solutions, and add-ins suggests that we have solved five of these problems already. Now, if those solutions were simply bundled into our primary scheduling applications that we use for managing our projects, we'd be able to realize the vision of CPM 2.0.
So, can CPM survive for another decade? With the makeover I propose, I believe so. Nothing else comes close to addressing the scheduling challenges of today's projects.
You can listen to two recorded MPUG WebNLearns with the author, presented in April 2010. Log into MPUG.com and visit the Knowledge Library. Look for these on-demand recordings:
Apr 13: WebnLearn: Critical Path 2.0 with Eric Uyttewaal (Part 1) Apr 14: WebnLearn: Critical Path 2.0 with Eric Uyttewaal (Part 2)
Eric Uyttewaal is one of the foremost authors, trainers, and consultants on the use of project management tools from Microsoft. He wrote the best-selling book, Dynamic Scheduling with Microsoft Office Project 2003, and is working currently on a new book, Forecast Scheduling with Microsoft Project 2010. Eric is founder and president of ProjectPro, a company specializing in Microsoft Project and Project Server. He's the president of the MPUG-Ottawa chapter. Contact Eric at [email protected] or visit his website at http://www.projectprocorp.com.
Forecasting Schedule Issues with a Deadline Dashboard By Sam Huffman, PMP First published January 10, 2010
This article illustrates the value of using deadlines instead of constraints to make forecasting easier. Constraints make forecasting more difficult because they take flexibility away from a schedule.
Deadlines don't take flexibility away from a schedule. Whenever possible, I recommend that you use deadlines in Microsoft Project instead of constraints. The use of a Deadline Dashboard enables the user to see schedule and deadline problems before they jeopardize the project. With a Deadline Dashboard we can't predict the future, but now we can see schedule vulnerabilities.
How to create a Deadline
Deadlines are set by typing a date into the Deadline field located on the Advanced tab of the Task Information dialog box. You get to this by double clicking on the task name of the task on which you wish to impose a deadline. See Figure 1 below.
Figure 1: Location of the Deadline field.
Once the Deadline is entered and OK'd, a deadline marker is noted in the task's row on the Gantt chart. It looks like an Arrow pointed down. See Figure 2.
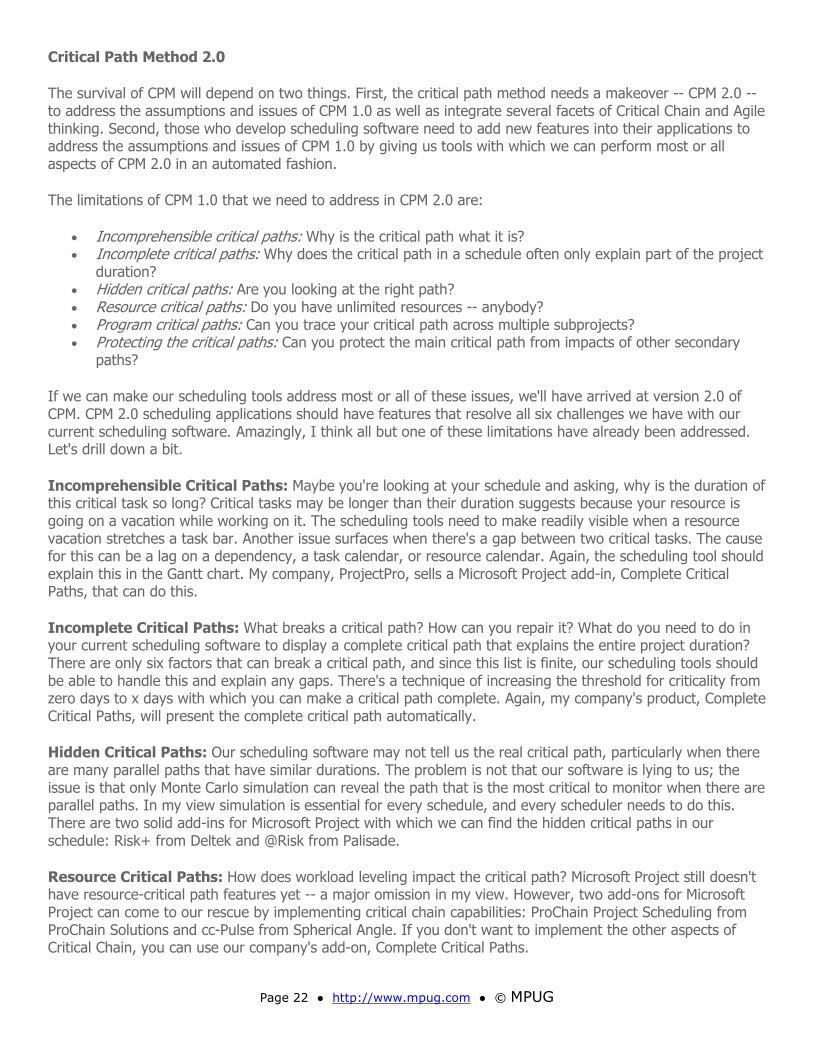
Now that a deadline is set, Project will compare the Finish Date of the task to the task Deadline. If the Finish Date is the same as or later than the Deadline, a graphic indicator will show up in the Indicators field. Project's default is to show this field just to the right of the ID Number. Holding the mouse cursor over the indicator will give you more details. In Figure 3, the duration of the task has increased to a later date than the deadline, triggering the indicator.
Figure 3: Missing the deadline triggers a warning indicator.
You now know how to set a Deadline. But you'll only see the warning indicator when the task Finish Date is the same as or later than the Deadline. In other words, if you didn't notice the Gantt bar's finish date and the Deadline date converging, you wouldn't see a warning indicator until the deadline is missed.
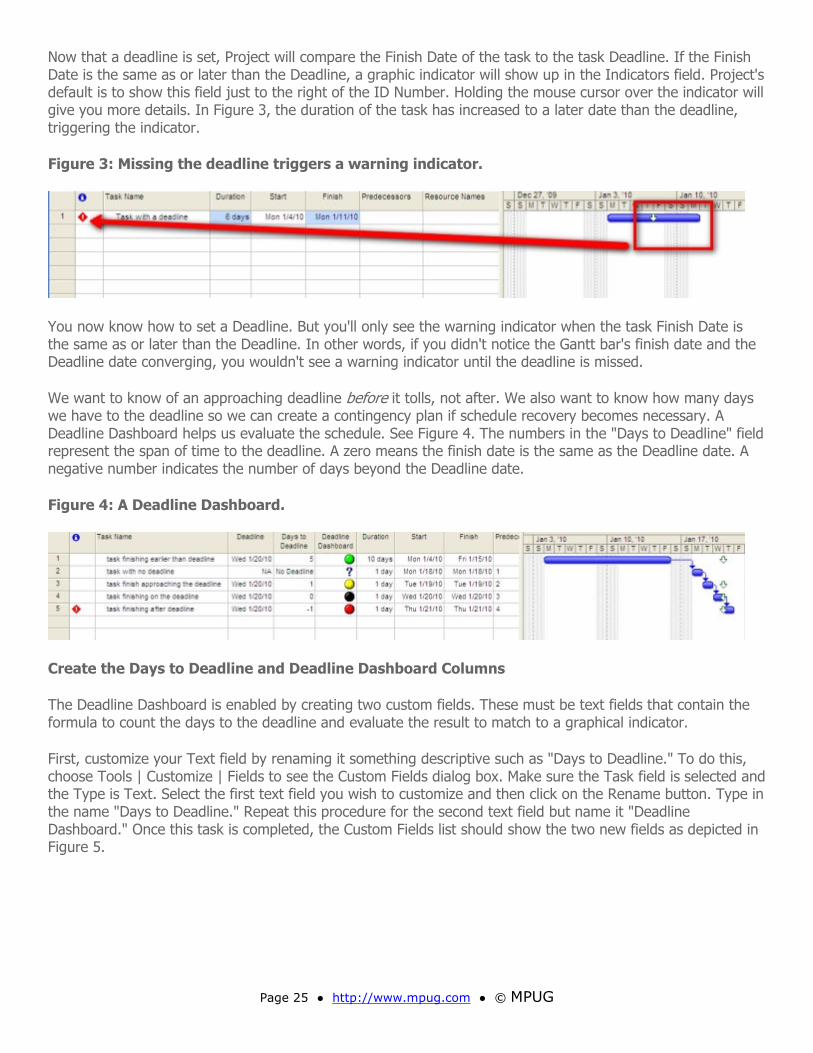
We want to know of an approaching deadline before it tolls, not after. We also want to know how many days we have to the deadline so we can create a contingency plan if schedule recovery becomes necessary. A Deadline Dashboard helps us evaluate the schedule. See Figure 4. The numbers in the "Days to Deadline" field represent the span of time to the deadline. A zero means the finish date is the same as the Deadline date. A negative number indicates the number of days beyond the Deadline date.
Figure 4: A Deadline Dashboard.
Create the Days to Deadline and Deadline Dashboard Columns
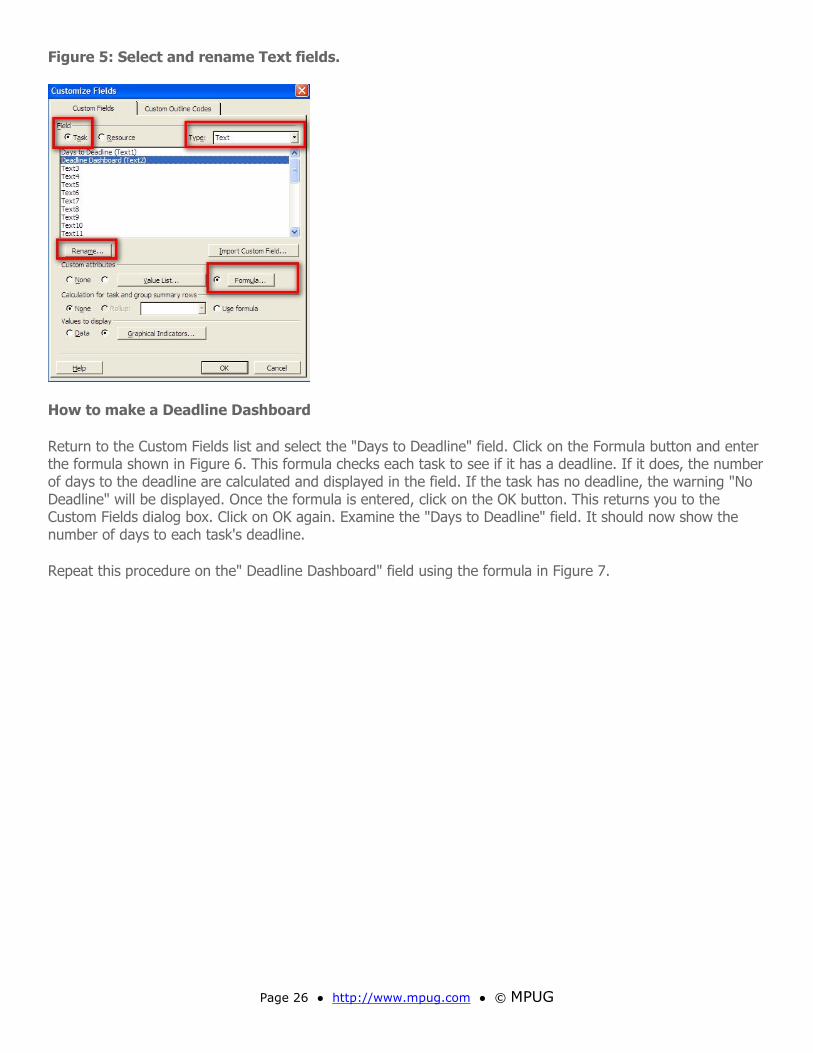
The Deadline Dashboard is enabled by creating two custom fields. These must be text fields that contain the formula to count the days to the deadline and evaluate the result to match to a graphical indicator.
First, customize your Text field by renaming it something descriptive such as "Days to Deadline." To do this, choose Tools | Customize | Fields to see the Custom Fields dialog box. Make sure the Task field is selected and the Type is Text. Select the first text field you wish to customize and then click on the Rename button. Type in the name "Days to Deadline." Repeat this procedure for the second text field but name it "Deadline Dashboard." Once this task is completed, the Custom Fields list should show the two new fields as depicted in Figure 5.
Return to the Custom Fields list and select the "Days to Deadline" field. Click on the Formula button and enter the formula shown in Figure 6. This formula checks each task to see if it has a deadline. If it does, the number of days to the deadline are calculated and displayed in the field. If the task has no deadline, the warning "No Deadline" will be displayed. Once the formula is entered, click on the OK button. This returns you to the Custom Fields dialog box. Click on OK again. Examine the "Days to Deadline" field. It should now show the number of days to each task's deadline.
Repeat this procedure on the" Deadline Dashboard" field using the formula in Figure 7.
Figure 6: Enter the formula to calculate the number of days to task deadline.
Figure 7: The formula for the Deadline Dashboard.
Creating the Graphical Indicators
Graphical indicators represent the result of the "Days to Deadline" formula and set the type of graphic to be displayed for the results. For example, the green ball represents a finish date for a task that's more than two
days prior to the deadline. A yellow ball indicates the finish within two days of the deadline. You'll need to enter these conditions and the graphics that represent them. The Values field must be exactly the same values indicated in the formula for the Deadline Dashboard. See Figure 8.
Figure 8: Create graphical indicators for the Deadline Dashboard.
The Deadline Dashboard is a tool to evaluate scheduling and make contingencies. Similarly, using this technique to create a Baseline Dashboard, a Variance Dashboard, and a Cost Dashboard also helps evaluate projects.
Try it out! Let me know if you have questions and if it worked for you.
Sam Huffman, PMP, has been delivering training for The Versatile Company since 1996. Prior to joining Versatile, he gained insight into Microsoft Project while working at Microsoft as a member of the Microsoft Project development and support team. He has maintained his intimate knowledge of Microsoft Project with each new release and is considered a leading authority on the tool, including the newest enterprise features of Project 2003, 2007, and Project Server. During his tenure at Versatile, Sam has honed his instruction skills by delivering programs for
thousands of people. His reputation for delivering practical wisdom with an upbeat style makes him one of Versatile's most requested instructors. Sam may be reached professionally at [email protected] or personally at [email protected].
By William Raymond, MVP First published March 31, 2010
Beginning in mid-2010 the rules of project management changed. Before Microsoft Project 2010 officially appeared, older versions of Microsoft Project are still enforcing strict and formal compliance to project management standards, and we hold project managers accountable to own and deliver on a project schedule that is near perfection without exception. We expect our experienced team leads in Microsoft Project Server to follow a path already laid out for them in a schedule; making critical changes is considered taboo without the project manager entering the changes for them.
With Microsoft Project 2010 much of this formality is now be optional.
Wait! Don't worry! It's OK! For you purists and sticklers for detail, the features and functions you need won't go away. For people who have abandoned Microsoft Project for Excel and PowerPoint, it's time for a second-look at this very powerful project management tool.
In evaluating Microsoft Project 2010, it'll be important to know the significant new changes to adopt them effectively. This guide is intended to help you better understand what you need to do to prepare yourself and your organization.
What's New
At the top of this article I made a bold statement that the rules will change and Excel users should take notice -- so let's look at one of the most significant new changes in the Desktop version of Project 2010.
Manual scheduling is essentially an Excel-like approach to setting up your plan without having to know all the details. Where Project would modify dates and change your schedule "for you" with a very powerful scheduling engine, you can now turn that off for tasks.
Figure 1. Schedules don't have to be perfect from the outset. Tasks can be manually scheduled where dates aren't defined.
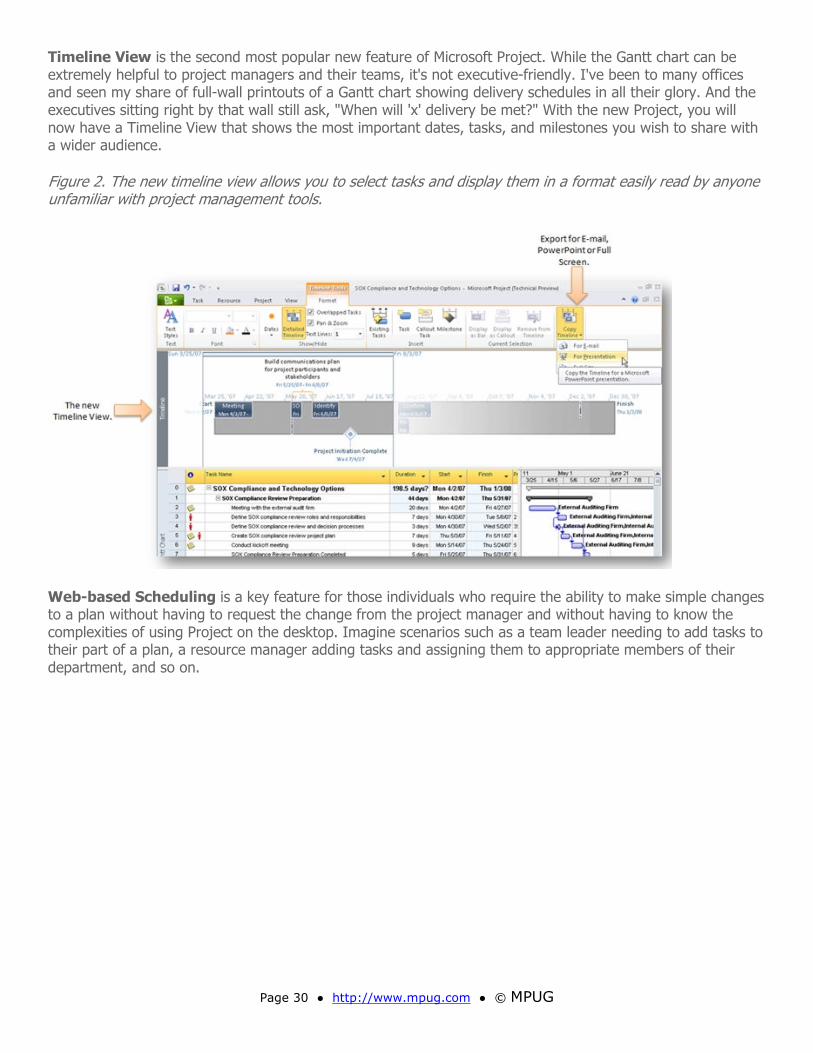
Timeline View is the second most popular new feature of Microsoft Project. While the Gantt chart can be extremely helpful to project managers and their teams, it's not executive-friendly. I've been to many offices and seen my share of full-wall printouts of a Gantt chart showing delivery schedules in all their glory. And the executives sitting right by that wall still ask, "When will 'x' delivery be met?" With the new Project, you will now have a Timeline View that shows the most important dates, tasks, and milestones you wish to share with a wider audience.
Figure 2. The new timeline view allows you to select tasks and display them in a format easily read by anyone unfamiliar with project management tools.
Web-based Scheduling is a key feature for those individuals who require the ability to make simple changes to a plan without having to request the change from the project manager and without having to know the complexities of using Project on the desktop. Imagine scenarios such as a team leader needing to add tasks to their part of a plan, a resource manager adding tasks and assigning them to appropriate members of their department, and so on.
Figure 3. It's now possible to give security rights to users that need to edit a project plan online using Project Server 2010.
SharePoint Integration enables you to share your plan online whether in Microsoft Project Standard with lightweight task management integration or with Microsoft Project Professional connecting to Project Server. SharePoint itself has been updated to provide more features that will be of particular interest to project teams such as new and improved workflow and document management.
Portfolio Server is now part of Project Server, so you can provide a fully integrated project intake, optimization, and selection process via the SharePoint-based Project Server environment.
Reports Central in Project Server is a central location for sharing reports and will make heavy use of Excel and SharePoint's Excel Services. You will find creating reports a familiar experience by using Excel as the primary interface to write and publish reports online.
Many more features are included in this significant new release, including the Fluent (tabbed) user interface, feature-rich copy/paste with Excel, and Compare Projects. The features I share in more detail are the ones I think you should really be preparing for.
Preparing for Project 2010
As you may have surmised, Project 2010 is a significant release and Microsoft has gone to great pains to really improve the experience of managing project schedules. With that, let's look at what we should be focusing on in the next release. Included are some important next steps in preparing you and your organization for Project 2010.
Microsoft Project is a leading project management tool, which is sometimes considered too complex for the average user. If you or your staff have used Project in the past but struggled with these complexities, there are powerful new features in Project 2010 that would suggest a second look is in order.
With integrated portfolio management, business users will have a powerful tool that manages the entire lifecycle of a project, from initial conception to budgeting and delivering on the projects. Reports are typically delivered via a SharePoint website that can be presented in the form of dashboards.
In preparation for Project 2010, there are some key elements business users will want to consider.
• In regards to portfolio management, consider how you want to capture new project ideas. Perhaps you just want to capture some simple details like a name for the idea and a general description. You may want to capture more advanced data like scope, requesting business units, value to the business, and so on.
• Using the portfolio optimization engine will allow you to identify a set of five to seven key business drivers. These business drivers will be used to select projects that will add the most value to your organization.
• In the area of reporting, consider having an end-to-end solution for identifying, selecting, and delivering on projects. What are the key metrics you'll want to track? These metrics will help put scope around a Project 2010 implementation. Also, since the reporting solution is based on SharePoint and Excel, consider different ways in which you would want to see this data.
For Program or Project Managers
Whether you're a seasoned project manager with an extensive background in critical path management or new to the role, you'll find features here for you. Some are powerful and will more than likely change how you work in Microsoft Project.
Get Ready for Manual Scheduling
In a perfect world, we know all the dates we plan to deliver. Reality is, we never know all these details. Manual scheduling can be a boon to those project teams where there really are unknowns or the project isn't critical enough that certain dates must absolutely be on the mark.
Even if you don't have Project 2010 on your desktop today, consider the following to prepare for manual scheduling.
Standards
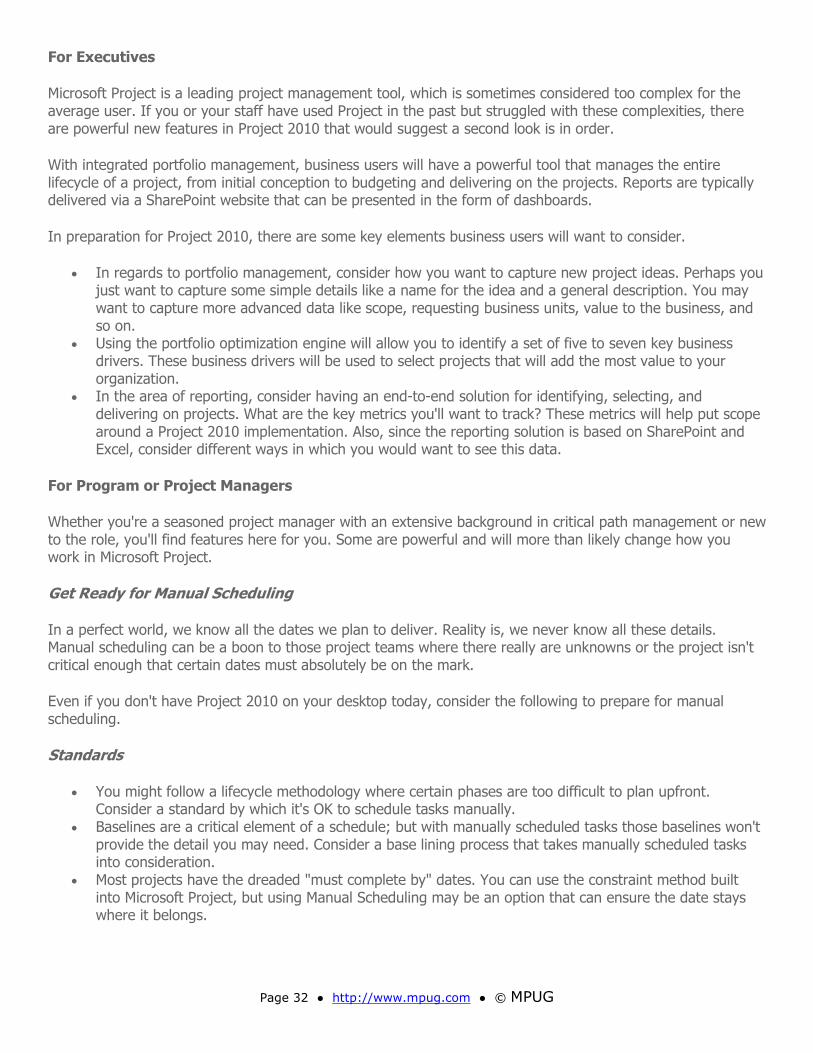
• You might follow a lifecycle methodology where certain phases are too difficult to plan upfront. Consider a standard by which it's OK to schedule tasks manually.
• Baselines are a critical element of a schedule; but with manually scheduled tasks those baselines won't provide the detail you may need. Consider a base lining process that takes manually scheduled tasks into consideration.
• Most projects have the dreaded "must complete by" dates. You can use the constraint method built into Microsoft Project, but using Manual Scheduling may be an option that can ensure the date stays where it belongs.
Figure 4. Project 2010 manages the entire lifecycle of a project from concept to delivery. Reports are delivered via a familiar web-based reporting environment.
Project types
Perhaps you -- or your company -- demand absolute schedule over and above a certain budget threshold. You might consider manually scheduled tasks to be an option for those projects that don't fall into that category.
Training and PM Maturity Growth
Considering many project managers are very often subject matter experts and not project management practitioners, they often turn to Excel spreadsheets because Microsoft Project's scheduling engine can be too complex for their needs. With Manual Scheduling, there's an opportunity to bring those Excel users into the fray of using a formal project management tool, allowing them to ease into more advanced features.
Figure 5. Sample Excel Reporting Dashboard displayed in SharePoint.
As a project manager, you'll still be making use of the desktop version of Microsoft Project 2010. You may want to make quick schedule changes via the web. Depending on how significant the changes are, you could go to SharePoint and make the updates.
Another scenario may be that you have a group of people who would also like to update the schedule. With previous versions of Project, we would typically lock people out of doing this since making updates could negatively impact the schedule. Although this tends to be a best practice, it may not be practical, especially if you have different team leads that own specific parts of the plan.
To prepare for web-based scheduling, consider the following:
• If there are other people that need to edit the plan, come up with a clear and concise structure and naming convention so there are fewer chances of someone changing tasks that shouldn't be edited.
• Should you have concerns about many people editing your plan, consider using Manual Scheduling. This way, if someone makes a change you aren't comfortable with, it doesn't make a major change to the rest of the schedule.
Table 1. Considerations for when to use Auto vs. Manual scheduling.
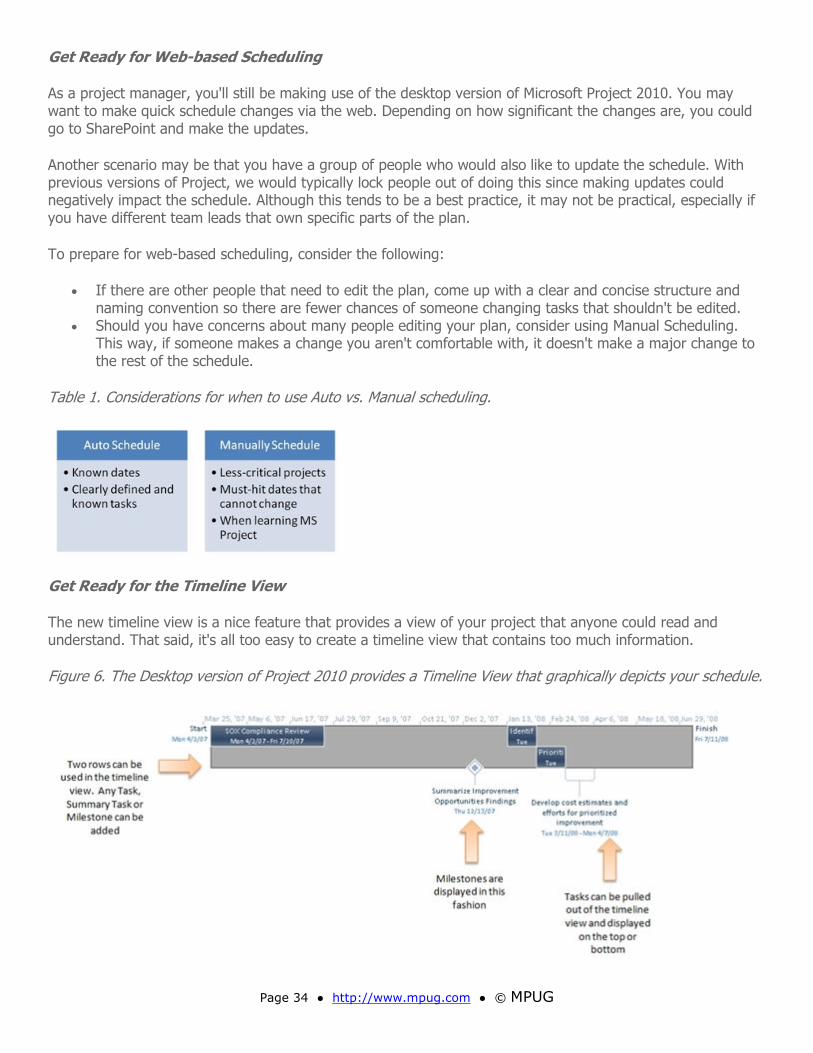
Get Ready for the Timeline View
The new timeline view is a nice feature that provides a view of your project that anyone could read and understand. That said, it's all too easy to create a timeline view that contains too much information.
Figure 6. The Desktop version of Project 2010 provides a Timeline View that graphically depicts your schedule.
In preparing for the timeline view, consider the following:
• Identify any critical Tasks, Summary Tasks or Milestones that you would want to share with your team, executives, or any outside parties. Gain confirmation with all the appropriate parties that these are the components of the plan you'll all agree to track. Of course, there may be other elements, but by getting agreement on the Timeline View, you can always pull out a slick report that doesn't require editing or modification.
• Name your tasks accordingly. As you can see in Figure 6, the timeline view is really designed for simplicity. Don't use verbose task names for items you'll put on this view or you'll find yourself tweaking and editing the graphic in PowerPoint anytime you want to share it.
• Limit the number of Timeline items you'll add to the graphic. As you can see in Figure 6, there are only two rows that tasks can be added to, with an outside area at the top and bottom to place more task information. Adding too much detail will make it difficult for those trying to read the information.
As you can see, Microsoft Project 2010 is a fairly significant departure from the product you used to use. I hope that by taking some of these key steps, you'll feel better prepared for tapping into the power of this new application.
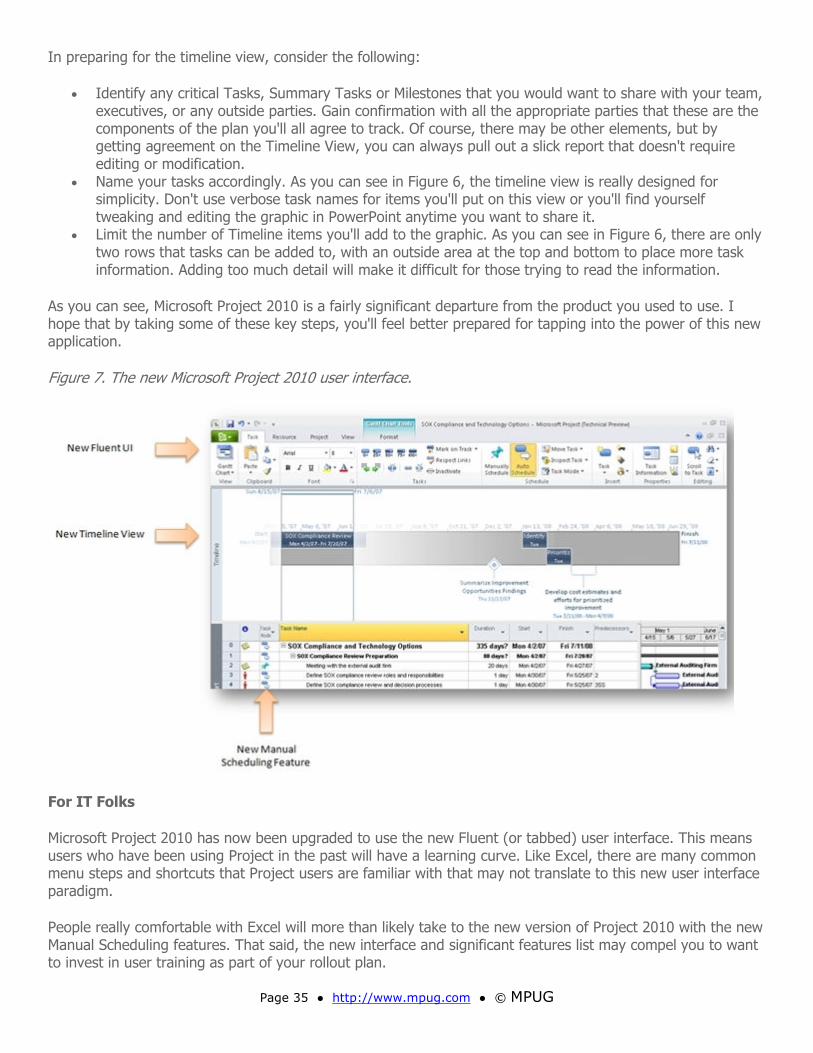
Figure 7. The new Microsoft Project 2010 user interface.
For IT Folks
Microsoft Project 2010 has now been upgraded to use the new Fluent (or tabbed) user interface. This means users who have been using Project in the past will have a learning curve. Like Excel, there are many common menu steps and shortcuts that Project users are familiar with that may not translate to this new user interface paradigm.
People really comfortable with Excel will more than likely take to the new version of Project 2010 with the new Manual Scheduling features. That said, the new interface and significant features list may compel you to want to invest in user training as part of your rollout plan.
Since there are very many new features, here's a checklist of considerations to prepare your IT organization for a successful deployment of Microsoft Project 2010:
Prepare the Desktop Environment
• Project relies heavily on other Office products, like PowerPoint for generating status reports, Excel for analyzing data and building reports, Visio for diagramming work breakdown structures, and so on. Although Project 2010 doesn't require these products, consider Office 2010 as part of your rollout strategy.
• Due to the sheer amount of data Project handles, you may want to consider upgrading the power users to a 64-bit platform of Windows 7 or Vista.
Prepare the Server Environment
• Microsoft is investing heavily in SharePoint as a web-based collaboration platform. I sometimes liken it to "Windows for the Web." All products will be integrated to SharePoint in some way, shape or form. Microsoft's server products will all be based on 64 bits, so plan on upgrading any 32-bit servers now in anticipation of this new requirement. SharePoint 2010 will be a must for an enterprise solution, so you'll want to plan an infrastructure to support Project Server.
Get Trained on the New Stack
• Microsoft Project Server will have some very powerful new portfolio, program, and management features. With these advances, you'll want to start learning how to write SharePoint workflows so you can tightly couple the project management process to the toolset.
• Project Server 2010 will have a significant reliance on Excel Services and Excel-based reporting. Many organizations are familiar with using Excel, but not necessarily working with live data and building dashboard pages in SharePoint. Learning the new capabilities of Excel 2010 and SharePoint 2010 will be a must to provide best practices for your users.
Planning is Essential
Microsoft Project 2010 is a significant new release and provides a powerful set of new features that make it easier to run projects. Planning out how you will use these new features is critical to the success of your implementation. I hope this review helps you in this effort.
Bill Raymond, Microsoft Project MVP, is a consultant with Pcubed. He's also an amateur photographer and diehard Nikonian and publishes the popular project management blog, Project Nation.
By Ismet Kocaman, MCTS, PMP First published May 3, 2010
Microsoft Project 2007 offers many features to customize the components of a Gantt chart. If you're presenting your schedule using a Gantt chart, you can use Project 2007's advanced formatting features to visually emphasize the crucial project data displayed on the chart. I'll demonstrate five techniques herewith by using the short sample schedule shown in Figure 1.
Figure 1. Our sample schedule.
Note: Always do formatting on a copy of your original project plan file and use that copy for the presentation.
Tip 1. How to Change the Date Display Format on the Gantt Chart
Project displays milestone dates by default on a Gantt chart. Date display format applies to all the dates displayed on the chart, and it can be easily changed in the Layout dialog box as follows: Right click at any point in the blank chart area to open the shortcut menu and then select Layout on the menu. In the Layout dialog box, select a date format in the Date format box and click OK.
Figure 2. The shortcut menu and Layout dialog box.
Note that if you select Default on the list, the Date format selection on the View tab of the Options dialog box in the Tools menu determines the date display format for all the Gantt chart dates.
Tip 2. How to Change the Position of the Date Displayed on a Milestone
As Figure 1 shows, there's a deadline arrow just on the top of the date displayed on the right of the milestone. It's possible to place the milestone date to another position -- to the left, up, down or inside the milestone diamond.
The left of the milestone diamond seems the best position to place the date. To change the position, double-click the diamond to open the Format Bar dialog box and then click the Bar Text tab. Delete Finish field in the Right box and then enter or select Finish in the Left box as shown in Figure 3.
Figure 3. The Format Bar dialog box.
Click OK button to close the dialog box and apply the changes that you've made. The date will now be displayed on the left of the diamond as shown in Figure 4.
Figure 4. The milestone date on the left.
Note that the new setting will apply only to the Finish - Ph A milestone. The Bar Styles dialog box is used to change the position of the date displayed for all the existing milestones and the new ones to be created. There are several ways to open the Bar Styles dialog box as listed below:
• Right click at any point in the blank chart area to open the shortcut menu and then select Bar Styles command on the menu.
• Or double-click at any point in the blank chart area.
• Or use the Bar Styles menu command on the Format menu.
In the Bar Styles dialog box, click the Milestone line on the Name column and then make the necessary changes in the Text tab in exactly the same way as you did in the Format Bar dialog box. Click OK to close the dialog box and apply changes to all the milestone dates on the chart.
Tip 3. How to Change Text Formatting of the Milestone Date
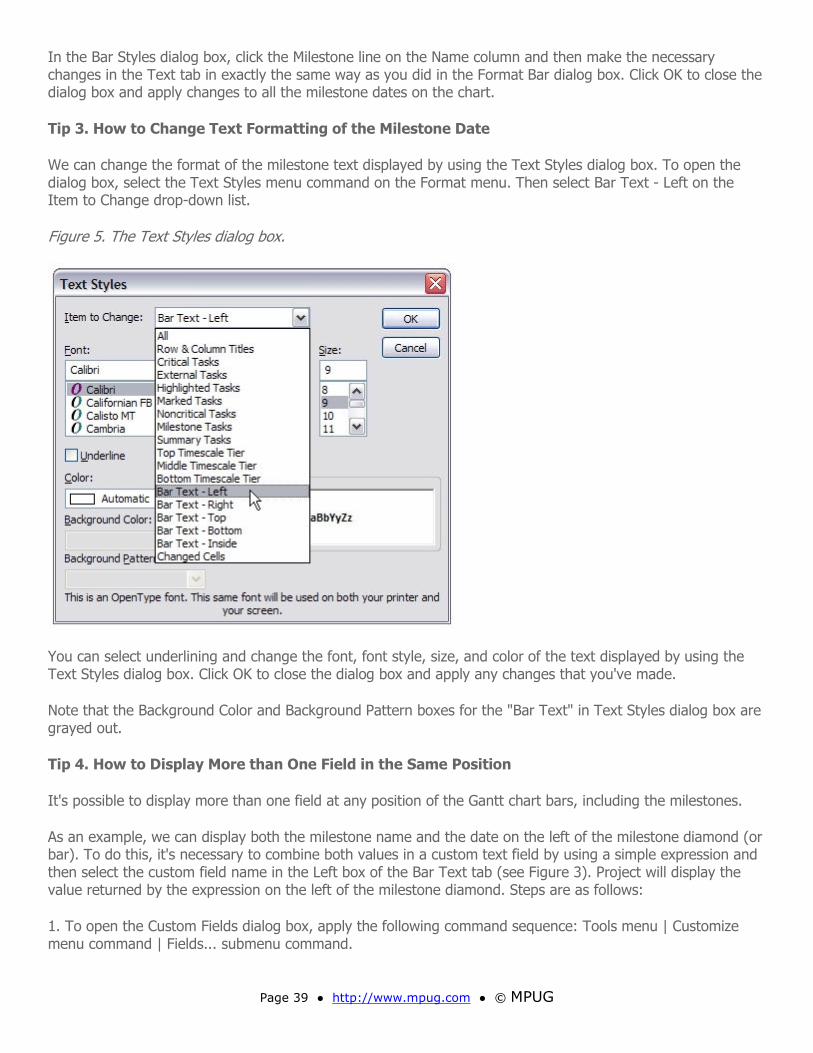
We can change the format of the milestone text displayed by using the Text Styles dialog box. To open the dialog box, select the Text Styles menu command on the Format menu. Then select Bar Text - Left on the Item to Change drop-down list.
Figure 5. The Text Styles dialog box.
You can select underlining and change the font, font style, size, and color of the text displayed by using the Text Styles dialog box. Click OK to close the dialog box and apply any changes that you've made.
Note that the Background Color and Background Pattern boxes for the "Bar Text" in Text Styles dialog box are grayed out.
Tip 4. How to Display More than One Field in the Same Position
It's possible to display more than one field at any position of the Gantt chart bars, including the milestones.
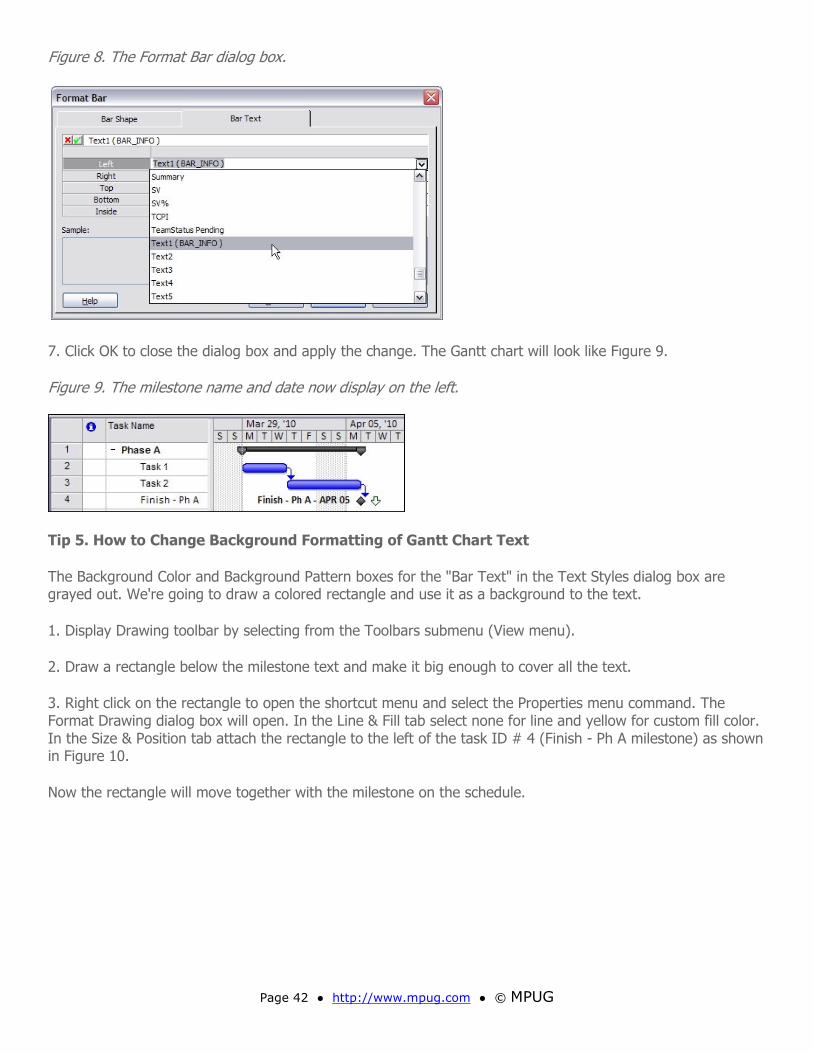
As an example, we can display both the milestone name and the date on the left of the milestone diamond (or bar). To do this, it's necessary to combine both values in a custom text field by using a simple expression and then select the custom field name in the Left box of the Bar Text tab (see Figure 3). Project will display the value returned by the expression on the left of the milestone diamond. Steps are as follows:
1. To open the Custom Fields dialog box, apply the following command sequence: Tools menu | Customize menu command | Fields... submenu command.
2. In the Custom Fields dialog box, select Text1 field and click the Rename... button; then enter BAR_INFO in the Rename Field dialog box and click OK to return to the Custom Fields dialog box.
Figure 6. The Custom Fields dialog box.
3. Click the Formula... button to open the Formula for "BAR_INFO" dialog box. We're now going to build an expression to combine the field values in the Edit formula box below the BAR_INFO= label.
A simple expression (or formula) would be as follows: [Name] & [Finish]. We can type the formula in or build it by using the buttons.
Brackets around the field names are required by syntax. If you insert a field name to the formula by selecting from the list opened by clicking the Field button, Project will automatically put brackets around the field name.
Ampersand ("&"), one of the operators available, is called a string concatenation operator. It combines two strings into a single string. You can select any operator from the Formula Toolbar to build an expression.
4. Now let's make a couple of improvements in the formula. It's possible to display the date in a format independent of the date display format setting in the Layout dialog box. For this purpose, we'll use the ProjDateConv and Ucase function in the formula. Those functions can be found in the Conversion and Text submenu of the Function button list. Click the Help button to have more information on the functions and operators.
Instead of the [Finish] expression we're going to use the following one:
Ucase( ProjDateConv( [Finish], pjDate_mmm_dd ) )
In the above expression ProjDateConv function gets the finish date from the first parameter and then formats and returns the date as specified by the second parameter pjDate_mmm_dd.
The Ucase function converts any text in the returned value by the ProjDateConv function to uppercase. The finished expression will be as follows:
with a hyphen and spaces added in between the date and the task name for clarity. Cut, copy, and paste functions work in the formula box.
5. Enter the formula in the formula box and then click OK. A confirmation dialog box will pop up. Click OK again to close it. Click OK once again in Custom Fields dialog box to close it.
Project will now automatically evaluate the formula and populate the BAR_INFO field on each task line with the returned string value. We don't need to add BAR_INFO field to the table.
6. Next, we'll display the BAR_INFO value only for the milestone Finish - Ph A. Double-click the diamond and replace Finish with BAR_INFO by selecting from the field list in the Bar Text tab of the Format Bar dialog box (To browse quickly to the fields starting with "T", just press <T> on the keyboard.)
7. Click OK to close the dialog box and apply the change. The Gantt chart will look like Fıgure 9.
Figure 9. The milestone name and date now display on the left.
Tip 5. How to Change Background Formatting of Gantt Chart Text
The Background Color and Background Pattern boxes for the "Bar Text" in the Text Styles dialog box are grayed out. We're going to draw a colored rectangle and use it as a background to the text.
1. Display Drawing toolbar by selecting from the Toolbars submenu (View menu).
2. Draw a rectangle below the milestone text and make it big enough to cover all the text.
3. Right click on the rectangle to open the shortcut menu and select the Properties menu command. The Format Drawing dialog box will open. In the Line & Fill tab select none for line and yellow for custom fill color. In the Size & Position tab attach the rectangle to the left of the task ID # 4 (Finish - Ph A milestone) as shown in Figure 10.
Now the rectangle will move together with the milestone on the schedule.
4. Next, reposition the yellow rectangle over the text displayed by using the mouse. Project will automatically adjust Horizontal and Vertical values in the Format Drawing dialog box. Resize the rectangle if necessary. Right click the rectangle and select Order in the shortcut menu and then select Send To Back in the submenu (Figure 11).
Figure 11. Place the yellow rectangle as background to the text.
If we now change the task durations, the text position and date value will be adjusted accordingly as seen in Figure 13. On the other hand, if we change the date display format, the milestone date display format won't be affected.
Figure 13. Text with a colored background with a new position and string value adjusted automatically. The date display format remains unchanged.
Ismet Kocaman, MCTS, PMP, is a Mechanical Engineer based in Turkey. He has more than 15 years of project management experience in the manufacturing sector. He currently provides consultancy to small to mid-sized companies on project management, reorganizing, and streamlining the manufacturing operations. He also conducts training seminars for engineers on Project 2007. Contact Ismet at [email protected].
How to Achieve a More Realistic Schedule in Your Project Planning
By Aric Katz, PMP, MCTS First published January 26, 2010
Project management has moved front and center in organizations as an antidote to heightened competitiveness, greater appetite for innovation, and ever-shrinking budgets and resources. The project management profession is rapidly evolving, bringing in new methodologies, tools, and utilities to do the best job possible. Yet, quite often project managers still lack some key techniques for achieving better project planning and scheduling. In this article, I share some tools and methods that can aid PMs in improving the quality of their planning and in achieving a more realistic project plan that they feel confident of committing to.
The Nature of the Scheduling Challenge
Statistics show that between 60 and 70 percent of projects don't meet their schedule, budget, or predefined scope. Why is this?
In many companies the process of planning a project consists of compiling a predefined list of tasks with logical connections and duration estimates in a deterministic or constant quantity. Some companies do this plus also add in information about resource assignments. Still others use enterprise project management applications as a timing engine with no resource constraints.
An additional means of honing a schedule is to analyze various scenarios, performing resource leveling to discover conflicts and critical chains, and mapping critical paths that could cause the entire project to deviate from its planned finish date.
Another challenge that directly affects the quality of planning is the experience level of the project manager in charge of maintaining the schedule. Frequently, these newbies have no planning experience, no management experience, and no project management experience. All of a sudden they're expected to deal for the first time with building a project plan, assigning resources, creating a budget, and managing the scope.
Is it any wonder that so many projects start off underfunded or under-scheduled from their very first day?
In all of these cases, scheduling is a critical ingredient during the first stages of a project, no more so than in companies where pricing of projects is done according to a project's Gantt chart with some added predefined cost buffer. There must be a better way to achieve a more realistic schedule and map critical paths/chains.
Pre-measuring a One-time Event
A project is a concentrated effort done once to achieve a product or a service. If it's unique (done once), how can the effort it will require be measured accurately?
By using known tools, you can "release" the constraint of uniqueness and of those deterministic durations that don't reflect the "real world." What it takes is the application of simple Monte-Carlo techniques. Running each project numerous times using simulation wears away the uniqueness constraint. Each simulation represents a different scenario or a different mix of durations for the same project plan. Each time a new random duration is produced for each task -- based on the task's distribution/curve and the predefined deviation range -- a new project plan or scenario is created.
What's a task's distribution? Time for a quick stats lesson. A task distribution is a random occurrence that can be defined as an asymmetric right-tailed beta curve/distribution. (The use of a triangular distribution is a common way to simplify statistical problems in project management.) What's that right-tail curve with an
asymptote at y=0 represent? The project or task may never end, but with a minor probability. That means the minimal expected duration of a task will always have a positive value. It's common to assume 80 percent success for a given task's duration, meaning that if that task were done 10 times, then eight out of 10 times it would meet its deadline or finish before it.
Figure 1: A task's duration according to beta and triangular distribution.
For each scenario we need to concoct for our Monte Carlo simulation, relevant data is collected and stored as for the project's finish date/remaining duration, the critical path/chain, and the critical resources. The exit point for each batch we run is the definition of estimated task deviations. This can be one range for all tasks, such as 30 percent above and 10 percent below, or it can be defined task by task.
Here are some key points to keep in mind as you're building a simulation utility in your project plan.
• Say you're going to use a defined task deviation of 30 percent probability that the project will be late and a 10 percent probability of it being early. That sets a task with an estimate of 10 days to an upper bound or delay of 13 days and a lower bound or early delivery of nine days. The deviated data can be entered into the project's pert fields by task or can be set as a generic deviation to all tasks. The former configuration combined with a random function to randomly set task durations between the pre-configured deviations would create a large range of different scenarios for a single project.
• Work with "remaining work." Bolster your analysis in both the planning stage and the execution stage by using the durations of tasks that haven't begun and the remaining durations of tasks that have begun. Exploit what you already know.
• Use the built-in leveling algorithm in Project to differentiate between critical path and critical chains. Confused about the difference? A critical path is the longest path of tasks that starts at a project’s start date and ends at a project’s finish date; as I mentioned, any delay on a task in this path will cause the entire project to deviate from its planned finish date. The emphasis is on the task order. A critical chain is just like a critical path in regards to resource constraints. But in a critical chain if two tasks share the same resource and are in parallel to one another, they'll shift in priority according to the predefined resource leveling settings. The emphasis is on the resource.
• Display the results of the calculated finish dates and durations in a descending order (Pareto) to see the percentile for each total duration/finish date and the number of times it occurred in the simulation run.
Once you have the simulation run, what's next? The outputs are the result of a wide range of scenarios where each scenario has tasks with both optimistic durations and pessimistic durations. These have been randomly generated according to the predefined distribution function. These task deviations can cause planned serial connected tasks to become parallel and vice versa.
For example, let's say a project's deterministic duration is 18 months. That's what your initial plan calls for (deterministic durations). Yet the simulation utility shows that in 85 percent of the cases (from all of the checked scenarios), the project actually finishes in 24 months. This insight should raise a red flag. If this project is priced predicated on being finished in 18 months, both the client and the contractor would lose -- the contractor because he or she had resources planned for 18 months, yet there's a high probability they'll
still be working on the project for another six months, and the customer because not getting the project done on time may affect the viability of the effort as well as his or her reputation in the organization.
Map Hidden Paths or Chains
The hidden critical chains or paths in a project is an array of feasible paths that connect a project from its beginning to its end, yet in their deterministic state they don't hold the longest path. A hidden critical path or chain can become the critical path or chain if one of its tasks deviates -- takes more time than planned -- causing that hidden path or chain to become the longest path from start to end.
How do you counter this possibility? Go through the simulation process keeping in mind the project's critical path or chain for each iteration. Due to a different scenario generated (tasks take longer or shorter than their original duration) different paths and chains show up.
For example, a critical path in the deterministic project might be based on tasks 1, 2, 5, 7, and 9. Yet the output from the simulation runs might show that 70 percent of the time the path might follow 1, 2, 3, 7, 8, and 9. How would that affect the schedule?
Improve the Quality of the Project Plan
The project plan is the base for all project progress and status. A well-built project plan is a key factor for estimating the project's progress and overall success. The closer the project plan is to reality, the more successful it's likely to be. So how can you improve a project's plan?
An obvious solution is to reuse historical knowledge that can supply immediate feedback to a project's manager during all stages of the initiative regarding its progress and its chances of finishing on time, in scope, and on budget.
I suggest adding as part of a company's project management process a list of automated checks. The checklist can be run manually. Or, if you have the capabilities, you can automate it. This involves running through business rules. An initial set of rules can be marked as critical. Saving or publishing of project plans can be blocked if a critical rule doesn't pass.
I'd advise dividing the project's checklist into three parts: project level checks, resource level checks, and task level checks. The checklist can be used in all stages of a project (initiation, progress, and so on) as can be seen in the following predefined checklist:
• The total slack for this task is negative. • There is no work planned for... • The task is critical and was scheduled to be finished by now. • The task has no predecessors. • According to ______ the task's progress it is going to miss its planned schedule. • The task should have started but is 0% completed. • The task is scheduled to start in the future yet it is partially complete. • The task is not a summary task nor is it a milestone, yet there are no resources assigned to it. • The task is partially complete, yet not all of its predecessors are done.
This checklist is an infrastructure element that can be modified, added to, or deleted from, enabling companies to force their own business rules or just relay best practices.
In this article I've pointed out a few of the more common challenges regarding project plans; yet these are only a small portion of the daily problems project managers and companies face every day. I've also offered some techniques for improving a project plan. With just a small effort, you can achieve great added value from analyzing what you already know in different ways as part of your on-going process for continuous
improvement.
Aric Katz is president of Katsoft, an Israeli project management consulting firm. Aric has experience in applications, utilities, and methodologies and is highly skilled with problem solving and systems design. Contact him at [email protected] or (972)-(0)72-2324655.
By Cindy Lewis, PMP, PMI-SP, MCITP, with contributions from Prakash Vaidhyanathan, PMP,PMI-SP First published July 20, 2009
Want to begin or enhance a career in project management or complement your Microsoft Project certification? Earning the Scheduling Professional (PMI-SP) certification from the Project Management Institute (PMI) could be the direction to head. This new credential, introduced in May 2008, offers a professional level certification for anyone who specifically wants to demonstrate knowledge in the skill of scheduling.
Earning the PMI-SP proves a level of knowledge and experience in the area of scheduling. If you're new to the field, this might be a great start to a career in project management. It allows you to hold an internationally recognized credential while accumulating the experience hours needed to apply for the PMP. Plus, you'll gain experience applying for and testing for a PMI credential.
If you're trying to break into a career in IT project management and the only certification and training you currently have is technical, the PMI-SP is a good credential to earn for two reasons. You'll most likely already have the software experience to complement this credential, plus you'll learn about some generally accepted project management principles.
We're two people who work in the field of project management. In the course of deciding to pursue this certification, we formed an international study group. During the course of this process we discovered that figuring out the new certification -- and the preparation process that went with it -- was challenging, confusing, and even frustrating. Recently, we became the first two people in our study group to earn the credential. In this three-part set of articles, we share our experiences and impressions about what it takes to earn the PMI-SP.
Basics of the PMI-SP Certification
According to the PMI-SP Handbook, individuals holding this certification can create and maintain the project schedule, are able to analyze the project schedule, and should be able to report and communicate the schedule to the project team.
To qualify to tackle the PMI-SP, you need to possess one of the following sets of qualifications:
Option 1
• A high school diploma/associates degree/recognized international equivalent. • 5,000 hours of scheduling experience within the prior five years (equating to about 25 weeks of full-
time scheduling work per year). • 40 education hours.
Option 2
• A bachelor's degree/recognized international equivalent. • 3,500 hours of scheduling experience within the prior five years (equating to about 18 weeks of full-
time scheduling work per year). • 30 education hours.
The exam domains as listed by PMI's Scheduling Professional Exam Specification and the percentage of exam questions consist of the following:
If you already possess the PMI Project Management Professional (PMP) certification, you may be wondering if the scheduling credential is something you should pursue. The fact is that you may not need this additional credential because you've already been tested on scheduling during your PMP exam. However, if you want to illustrate a specialization or enhanced understanding of scheduling, this certification is one way to do so.
If you have some type of Microsoft Project certification, your current certification demonstrates expertise in a particular scheduling tool. If this meets the needs of your career, you may not need an additional certification -- it will complement, not replace, your Microsoft credential. However, if demonstration of scheduling project management concepts is important to your job role, then go for it!
Cindy, who took the exam in January 2009, sums up her experience this way: I think this certification is really geared towards testing your understanding of the scheduling process from a project management perspective. Just being an expert at Microsoft Project won't give you sufficient knowledge or experience to pass the exam. To get through it, you really have to understand how to manage a schedule beyond using a given software tool. That understanding needs to encompass such areas as communicating with individuals, establishing processes to handle changes, managing risks, obtaining authorizations, and archiving of records.
Prakash, who took the exam in March 2009, has this to say: Many project managers in real life use scheduling tools like Microsoft Project as a Work Breakdown Structure (WBS) or as a timesheet system. They rarely venture into project tracking and communicating the performance of the projects to stakeholders in a timely manner. These reasons are manifold:
• Quantification of percentage complete is subjective. This discourages project managers and even entire organizations from relying on project status and forecasts where percentage complete is used.
• Scheduling tools such as Microsoft Project lack the sophistication to handle resource requirement challenges like Resource Constrained Project Scheduling Problem (RCPSP).
• Padding the estimates and unrealistic buffers don't help either. • Tapping into the many add-ons to Microsoft Project to handle some of these challenges can become a
costly proposition.
The PMI-SP credential exam tests you on scheduling practices and its influence on project management as a whole. It's no magic wand for solving some of the aforementioned scheduling issues, but can arm you with ideas to turn these challenges to opportunities. We consider it a useful add-on for project managers who already have PMP certification to refine their skills on best practices surrounding project scheduling through PMI-SP.
The Application Process and Getting through the Exam
Here's what I remember of my experience in tackling the Project Management Institute Scheduling Professional (PMI-SP) exam: sitting in a room full of stressed out people, an urgent need to run to the restroom, frantically watching the clock countdown, wracking my brain to come up with knowledge and details that I don't recall ever learning in the first place. Sound like a journey you'd like to take too? Keep reading.
Once I learned I had been picked to be the "guinea pig" for the PMI-SP credential at my company, I diligently began my process of getting ready. Of course, that included downloading the relevant handbook and working on the application.
My study partner, Prakash Vaidhyanathan, had a rude jolt upon receiving the PMI Scheduling Professional (PMI-SP) Exam Specification Guide that's available from PMI for around $35. The specification guide contained about 15 pages and appeared to have very little information about the credential. Since we had both already earned our PMPs, we assumed the process for this certification would be similar. (More on that in Part 3!)
Once I knew I'd be taking the test, the first stop was filling out the PMI-SP application, which requires you to prove you meet the certification criteria (covered in Part 1 of this series). You have two options: You can fill it out online or go the paper route. Based on tips I could glean from various sources, I believed the paper application was the best way to go.
While working on the application, of course, I had numerous questions, so I figured calling PMI was the most efficient route for getting answers. Not really. The person who answered the phone read from a script of questions and answers that were available on the website and couldn't provide any additional information. During the process of gathering information, I decided just for the heck of it to glance at the online application to see how it compared with the paper application. As it turned out, this was the way to go. The online application had lots of limitations on word count, and I only had to provide a summary of my scheduling experience for each project instead of a detailed document that the paper-based application seemed to want.
Thinking that I would be able to complete my online application in one day turned out to be wishful. The application had four major sections requesting various information about contacts, certifications, education background, and scheduling experience. Back in my PMP days, all you had to do was indicate your supervisor's name on the application. With the new online application you actually have to provide current contact information. Tracking down people who have moved proved especially challenging. At the same time I figured I'd better ask for their permission just in case I got audited. Asking for permission was a good idea, but it also meant that these people were going to check up on me to make sure I got certified. (Does the term "peer pressure" mean anything?)
I made it through the application process. Pretty soon I started getting hounded with emails asking me to pay my fee. I was under the impression that if I didn't pay the fee, my application would get cancelled. (I recently spoke to another candidate who had waited a few months before paying the fee on another credential without any problem.)
My study partner Prakash said he'd wished that he had taken the exam earlier as there was a two-month (early bird) 50-percent discount offer that PMI had announced in June 2008, which would have saved my company a few dollars.
Eventually, I was approved to take the test. But no sooner had I tried to register for the exam when Prometric, the testing company, rejected my "authorized number," which meant I had to call PMI. Incidentally PMI mentioned that I should have received an email asking me to wait 48 hours before registering for my exam. Believe me: I had read every email PMI sent to me relating to this exam and not one of them mentioned the need to wait before registering for the exam. (I guess it has something to do about a project manager's skill in being detail oriented.)
Finally, it was time to study. More about my preparation process in part 3 of this article.
Before I took the exam, I figured I'd better check up the exam site. Hoping to bring my favorite calculator and comfortable pen, I soon found that I would be forced to use an online calculator and the testing center's pencils and papers. Thank goodness, I made a second phone call about my identification. In the State of
Michigan, when you renew your license, they cut the corner off and give you a sheet a paper that indicates you have requested a renewal. Although this is the correct procedure, it meant my ID had been "defaced" and couldn't be used as identification at the testing center. Knowing this in advance, I brought along my passport.
Getting started with the test seemed fairly normal except that as soon as I sat down, I wanted to do a "brain dump" just like I did for my PMP. However, the exam administrator came in and told me I had a minute to start my exam. Evidently I missed my first "attempt" to start the exam and if I missed another one, I would be asked to leave. So, I started what turned out to be the exam tutorial on how to answer questions.
Tip: Start the exam tutorial and do it quickly. Whatever time is on the clock is the only time you have to do a "brain dump" before the test automatically starts.
I experienced normal exam stress throughout. Once, I almost got kicked out because I took off my bracelet and watch, setting them on the table. (I was just trying to avoid making too much noise because they were up against the keyboard.) Wrong move! The exam administrator asked me to put them on or return them to my locker while my exam clock kept ticking.
Nearly running out of paper, and still unsure about a few questions, I finally clicked finish. Guess what? No exam result. Just an irritating survey about my exam feedback. Suppressing all my anxiety I completed the survey, and -- Voila! My score report came up. Scrolling up and down I noticed words such as "proficient," but couldn't figure out if I had passed. Finally, I located the small word, "PASS," and knew my ordeal was done.
What You Need to Study
In my journey to conquer the Project Management Institute Scheduling Professional (PMI-SP) exam, the first thing I did was search on both Google and Microsoft Bing for preparation guides. Amazingly, I came up empty handed. The only study materials I found were books from PMI. In the hopes of finding someone else who had passed the exam, I posted "looking for study buddies" on my Western Michigan's PMI chapter forum site. As it turned out, several people wanted to know more about the exam, so I initiated an email study group. I also added a few people whom I had run across at the last PMI conference.
After months of searching for anyone who had taken the test before, I received responses from a few people who had tackled the beta version of the exam. Their suggestions were to study the PMBOK Guide, which turned out to be an excellent tip. I had a few things going for me regarding preparation: I teach a class related to Microsoft Project every week, and I had already memorized anything related to this software.
To identify any scheduling software gaps, I went through Chapter 4 of PMI's Practice Standard for Scheduling and made sure I knew all the components and that I could define them in my own words. I didn't memorize every detail, but I did focus a lot of time on anything related to the Critical Path Method. In terms of the Practice Standard for Scheduling, I read everything and memorized as many lists and definitions that I had time for. As it turned out, I ran short on time beginning with Chapter 4 on and that didn't really seem to hurt me.
Since I knew the PMBOK Guide was important, I decided to focus a lot of time on learning inputs, tools and techniques, and outputs. Back when I took the PMP exam, this was something I didn't spend a lot of time on, and I thought it hurt me. I tried very hard to memorize those items for time, cost, and communication and it really did help. However, I forgot to thoroughly read and memorize all the definitions, which left gaps in my test-taking preparations. Luckily, I read through other sections of the PMBOK Guide and there seemed to be a random scattering of questions through many other knowledge areas. Having passed the PMP exam before, this test was definitely a blessing, because I didn't have to learn every concept from scratch.
The only other book I spent a lot of time studying was PMP: Project Management Professional Study Guide by Kim Heldman. I spent countless hours calculating manual critical paths and doing forward/backward passes. This proved to be helpful during exam time.
Test-taking Tips for the Scheduling Professional Exam
By Raul A. Römer
1. Know the PMBOK 4th edition. You'll definitely need it, since questions may come from every angle.
2. Applicants without a good planning background should purchase the PMI-SP, the Practice Standard for Scheduling.
3. Understand activity sequencing in network diagrams as the precedence diagramming method (PDM).
4. Understand the calculation of the critical path method (CPM), free float, etc.
5. Understand the tools and techniques of time management.
6. Understand the earned value technique (EVT) as schedule variance (SV), cost variance (CV), schedule performance indicator (SPI), cost performance index (CPI), estimate to complete (ETC), and estimate at completion (EAC) concepts, and when to apply them, including what SPI and CPI indicate when they're less than one or greater than one.
Raul A. Römer, PMP, PMI-SP, is Senior Consultant Planner at the Decommissioning Services Ignalina Nuclear Power Plant in Visaginas, Lithuania. He has vast experience in estimating, planning, and scheduling projects using multiple tools. Contact him at [email protected].
PMI's suggested reading included the PMI-Scheduling Professional Examinations Specification guide. Because -- as I reported in part two of this series -- that guide was all of 15 pages long. How important could it really be? I gave it a quick glance. Bad idea. The specification guide provided both the structure for the exam and an explanation of what a scheduler does in each domain. During the exam I could have used this information to figure out what did or didn't belong in the multiple choice options. My advice would be to invest your money and then scrutinize what the guide states.
All I can say is that I'm glad the exam is over. Now I'm working with my employer to develop a preparation course for the certification. If you've read through this series and you're still interested in tackling the exam, we're seeking individuals for upcoming webinars and courses. Send me an email to be added to the list.
In the meantime, good luck with your own study efforts!
Cindy Lewis, PMP, PMI-SP, MCITP, is Director, EPM Training and Consulting for the International Institute for Learning and conducts numerous classes on Microsoft Project and Project Server via traditional classroom and e-learning. She was also selected as a subject matter expert by Microsoft to help develop the Microsoft certification and official curriculum for Project 2007. Contact Cindy at [email protected].
Prakash Vaidhyanathan, PMP,PMI-SP, is a project manager for Cognizant Technology Solutions, managing IT projects in the retail domain. He handles project management training within his company and is an associate editor for PMI-ISSIG. Contact Prakash at [email protected].
• Learning and networking opportunities that take place in person through regional chapter events and online, through the new MPUG portal.
• Professional development opportunities, including publishing, chapter leadership,
mentoring, and training activities. Plus, you can earn PMI PDU credits with your participation!
• Access to the Members-only library, with archived
presentations, how-to articles, templates and other Microsoft Project and Project Server tools.
• Access to the MPUG career center and job board.
• A weekly subscription to the MPUG e-newsletter, which delivers informative articles,
profiles, project management news and downloads, jobs, cartoons, and event alerts, delivered to your inbox.
• Special discounts and opportunities exclusively for members.
As a Microsoft Project practitioner you need to stay informed, networked, and fully resourced to remain at the top of your game. After all, you are your best asset. As the only official association for Microsoft Office Project, MPUG membership is essential to staying competitive. Best, the price of an individual, annual membership is only US$119 — far less than the price you'd have to pay for a day's worth of Project training. New membership: www.mpug.com/Pages/IndividualRegistration.aspx Renew your membership: http://www.mpug.com/Pages/renewal.aspx What other members are saying: "I wanted to let you know that I really enjoy reading your MPUG 'Ask the Expert' articles."
“Since joining MPUG several years ago, I have consistently received excellent value from my membership. It's clear to me that MPUG offers — bar none — the best PM professional