16
Attitudes to reading at ages nine and eleven: full report NATIONAL FOUNDATION FOR EDUCATIONAL RESEARCH Marian Sainsbury and Rebecca Clarkson
| Date post: | 27-Mar-2018 |
| Category: |
Documents |
| Upload: | nguyendieu |
| View: | 226 times |
| Download: | 1 times |
Attitudes to reading atages nine and eleven:full report
NAT IONAL FOUNDAT ION FOR EDUCAT IONAL RESEARCH
Marian Sainsbury and Rebecca Clarkson
2 Attitudes to reading at ages nine and eleven: full report
Introduction
This NFER survey of 4477 primary school pupils in summer 2007 investigat-ed their attitudes to reading – both enjoyment and confidence. It found thatlevels of enjoyment had held steady since 2003 – a contrast to the five yearspreceding that, when levels of enjoyment had declined very significantly.Levels of confidence, which had increased in the preceding five years, alsoremained unchanged since 2003.
This full report explains the background to the survey, sets out the findings indetail and discusses them in relation to contextual factors.
Background
The 2003 NFER survey, based on the same questionnaire as in 2007,responded to concerns raised by the PIRLS study of 2001. In this interna-tional survey of pupils’ reading attainment and attitudes, pupils in Englandhad recorded very low levels of reading enjoyment as compared to theirinternational peers (Twist et al., 2003). The NFER survey sought to find outmore about this, including whether there had been a decline since a similarsurvey in 1998. Children’s enjoyment of reading had indeed declined signifi-cantly over these five years, while their confidence as readers had improved(Sainsbury and Schagen, 2004). At the same time, PIRLS noted high levels ofreading attainment amongst English pupils. It was hypothesised that thiscombination of high attainment but poor enjoyment could have been relatedto the National Literacy Strategy, which had been introduced in a fairly pre-scriptive form across schools in England in 1998.
In 2003, government policy was adjusted with the publication of a documentcalled Excellence and Enjoyment (DfES, 2003), together with the replace-ment of the National Literacy Strategy by the Primary National Strategy. Thisreduced the number of objectives in the literacy framework and placed a newemphasis on speaking and listening. The renewed framework also gaveguidance to teachers on using assessment to inform their everyday teaching,and personalise learning. The overall thrust of this policy was to introducemore flexibility into the primary curriculum. Four years on, therefore, in 2007,it was appropriate to measure attitudes again in the same way. This coincid-ed once again with a PIRLS study, which was carried out in 2006 andreported in 2007 (Twist et al., 2007).
There is a well-established research literature on attitudes to reading (forexample, Guthrie and Wigfield, 2000; McKenna et al., 1995; Baker andWigfield, 1999), while Twist et al. (2004) specifically consider complexitieswithin the reading attitude findings of PIRLS 2001. A working definition ofattitude to reading can be derived from this research and underpins theNFER surveys. Central to such a definition is the idea of intrinsic motivation
in the form of a positive self-concept as a reader, a desire and tendency toread and a reported enjoyment of or interest in reading; and its opposite, anegative self-concept as a reader, a desire and tendency to avoid readingand a reported dislike of the activity. The previous research, however, giveslittle attention to the particular qualities of the reading experience that mightgive rise to such feelings. The motivation literature tends to deal with readingin the same way as other school subjects.
Involvement in reading, however, may offer an emotional engagement thatgoes beyond that of other subjects, and it is to children’s literature researchthat one must turn in order to find an elaboration of these ideas (for example,Appleyard, 1991). Benton and Fox (1985), for example, say that stories ‘pro-vide the possibility of educating the feelings and can offer their readerspotential growth points for the development of a more subtle awareness ofhuman behaviour’ (Benton and Fox, 1985, p.15). Involvement in books allowschildren to experience through imagination other worlds and other roles, andthis involvement contributes to their personal and social development as wellas to their reading abilities. Perhaps even more than for other school sub-jects, attitude to reading has a central importance, alongside acquisition ofreading skills.
Method
Since measuring change over time was part of the aim of this research, it wasnecessary to use a comparable instrument and sample. The 2003 and 2007questionnaires were the same, consisting of 18 questions. The first 13 werefirst-person statements expressing an attitude to reading, some negative andothers positive. The children were asked to agree or disagree with each ofthese statements by ticking one of three options: ‘yes’, ‘not sure’ or ‘no’. Inorder to ensure that they understood that a ‘yes’ response meant agreementwith the statement (even if negative), three practice items were included.Question 14 asked how often children read at home, with four options: ‘everyday’, ‘most days’, ‘not often’ and ‘never’. Question 15 was multiple-responseand asked what reading material children read at home: story books, comics,magazines, newspapers, information books and poems. The final threequestions asked about support for reading at home: whether adults read tothe child or listened to the child reading, and whether anyone else at homeread with the child.
The questionnaires were posted to schools for administration by the classteachers in June 2007, approximately the same time in the school year as the2003 administration. All the children in years 4 and 6 in the participatingschools were invited to complete a questionnaire. The teachers wereinstructed to work through the practice items with the children, to give anyhelp needed with reading the questionnaire, and to reassure children thattheir individual views were being sought, rather than any ‘right answers’.
Attitudes to reading at ages nine and eleven: full report 3
The sample
The main sample in 2003 had been nationally representative in its composi-tion. For 2007, a nationally representative sample was again drawn, butcomposed in part of schools that had participated in 2003 and had also par-ticipated in the original research of 1998. The numbers of schools and pupilsachieved in 2007 are given in Table 1, alongside the comparable figures for2003 and 1998. It can be seen that 27 schools out of the total 61 had partic-ipated in both the previous surveys.
Table 1 Achieved sample numbers
Chi-square tests showed that the main sample of 61 schools was not signif-icantly different from the national population of schools in terms of schoolsize, region of England and overall attainment as judged by key stage 2 testresults. There was a slight significant difference in terms of school type, andLondon boroughs were slightly over-represented at the expense of counties.The findings of this survey can be taken as a good representation of thenational picture. The repeat subsample, by contrast, had a very significantover-representation of lower-attaining schools and of schools in London bor-oughs and metropolitan authorities, although in fact questionnaire responsesdiffered little between the main sample and the repeat subsample.
Results
Current attitudes: results for the main sample
The initial analysis consisted of calculating frequencies for each response.Table 2 gives these raw results for the main sample.
The figures in Table 2 show generally positive attitudes, for example in thesubstantial majorities answering in the affirmative to ‘I like reading stories’and ‘I enjoy reading’ in both age groups. Overall, attitudes in year 4 wererather more positive than in year 6. This finding is consistent with theresearch conducted by McKenna et al. (1995) in the United States, whichsurveyed attitudes in grades 1 to 6 and found a gradual but steady declineacross this entire age range. Differences between the age groups can also
4 Attitudes to reading at ages nine and eleven: full report
2007main
sample
2007repeat
subsample
2003main
sample
2003repeat
subsample
1998sample
Schools 61 27 74 28 28
Year 4pupils
2278 1053 2459 1158 1137
Year 6pupils
2199 964 2617 1206 1170
Total pupils 4477 2017 5076 2364 2307
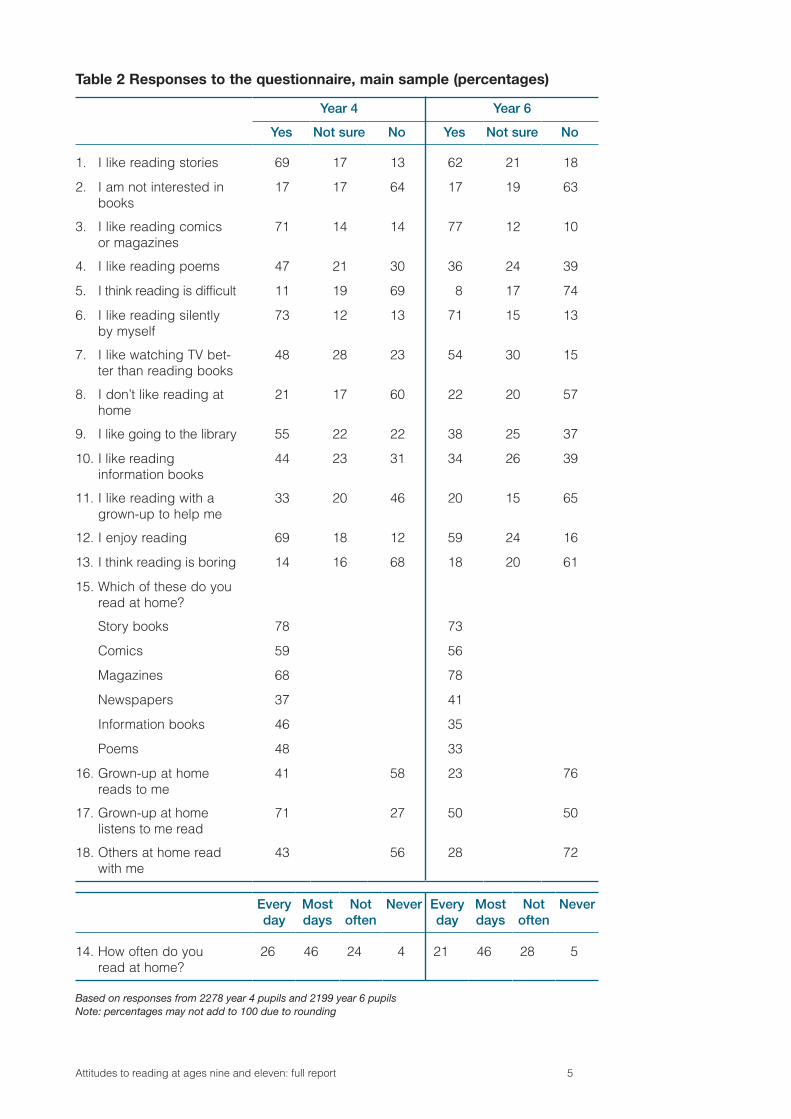
Table 2 Responses to the questionnaire, main sample (percentages)
Based on responses from 2278 year 4 pupils and 2199 year 6 pupilsNote: percentages may not add to 100 due to rounding
Attitudes to reading at ages nine and eleven: full report 5
Year 4 Year 6
Yes Not sure No Yes Not sure No
1. I like reading stories 69 17 13 62 21 18
2. I am not interested inbooks
17 17 64 17 19 63
3. I like reading comicsor magazines
71 14 14 77 12 10
4. I like reading poems 47 21 30 36 24 39
5. I think reading is difficult 11 19 69 8 17 74
6. I like reading silentlyby myself
73 12 13 71 15 13
7. I like watching TV bet-ter than reading books
48 28 23 54 30 15
8. I don’t like reading athome
21 17 60 22 20 57
9. I like going to the library 55 22 22 38 25 37
10. I like readinginformation books
44 23 31 34 26 39
11. I like reading with agrown-up to help me
33 20 46 20 15 65
12. I enjoy reading 69 18 12 59 24 16
13. I think reading is boring 14 16 68 18 20 61
15. Which of these do youread at home?
Story books 78 73
Comics 59 56
Magazines 68 78
Newspapers 37 41
Information books 46 35
Poems 48 33
16. Grown-up at homereads to me
41 58 23 76
17. Grown-up at homelistens to me read
71 27 50 50
18. Others at home readwith me
43 56 28 72
Everyday
Mostdays
Notoften
Never Everyday
Mostdays
Notoften
Never
14. How often do youread at home?
26 46 24 4 21 46 28 5
be observed in the choice of home reading matter, with an increase in pop-ularity amongst the older children for magazines and newspapers and theopposite pattern for all the other categories listed. The percentage of chil-dren who found reading difficult declined from year 4 to year 6, probablyreflecting gains in reading ability over that period. This was accompaniedby a decline in the level of adult and other support reported when readingat home.
Gender and attainment
Boys’ and girls’ responses were analysed separately, and girls’ attitudeswere found to be significantly more positive than boys’, with higher percent-ages agreeing with questions 1, 4, 6, 9 and 12, whereas boys weresignificantly more likely to agree with 2, 5, 7, 8 and 13. This pattern has con-sistently been noted in previous research (for example, McKenna et al., 1995;Guthrie and Wigfield, 2000).
A measure of reading attainment was collected, in the form of a teacherassessment of the National Curriculum level for reading for each participat-ing pupil. There was a significant relationship between higher attainmentand positive attitudes, with more positive responses to questions 1, 3, 6and 12 from the higher-attaining group. Lower attainers were more likely toagree to questions 2, 4, 7, 8 and 13. Again, this confirms the patternobserved in much previous research. Items 5 and 11 were also answeredsignificantly more affirmatively by the lower-attaining pupils. These arequestions about the perceived difficulty of reading, and the responses sug-gest that children’s perceptions of their own reading ability are relativelyaccurate, since those whose attainment was lower were significantly morelikely to say that they found reading difficult and to seek help with theirreading.
Table 3 summarises these patterns for the first 13 items of the questionnaire.This table gives only the percentages answering ‘yes’ to each item.Percentages for boys and girls are given separately for each year group. Toillustrate differences in attainment, two levels from the ascending NationalCurriculum scale are selected to represent the range for pupils of that age.The significance test used is a chi-square, which gauges the significance ofthe overall pattern of responses to each item. (That is, in calculating signifi-cance, those answering ‘not sure’ and ‘no’, and the National Curriculumlevels not reported in the table have also been included).
6 Attitudes to reading at ages nine and eleven: full report
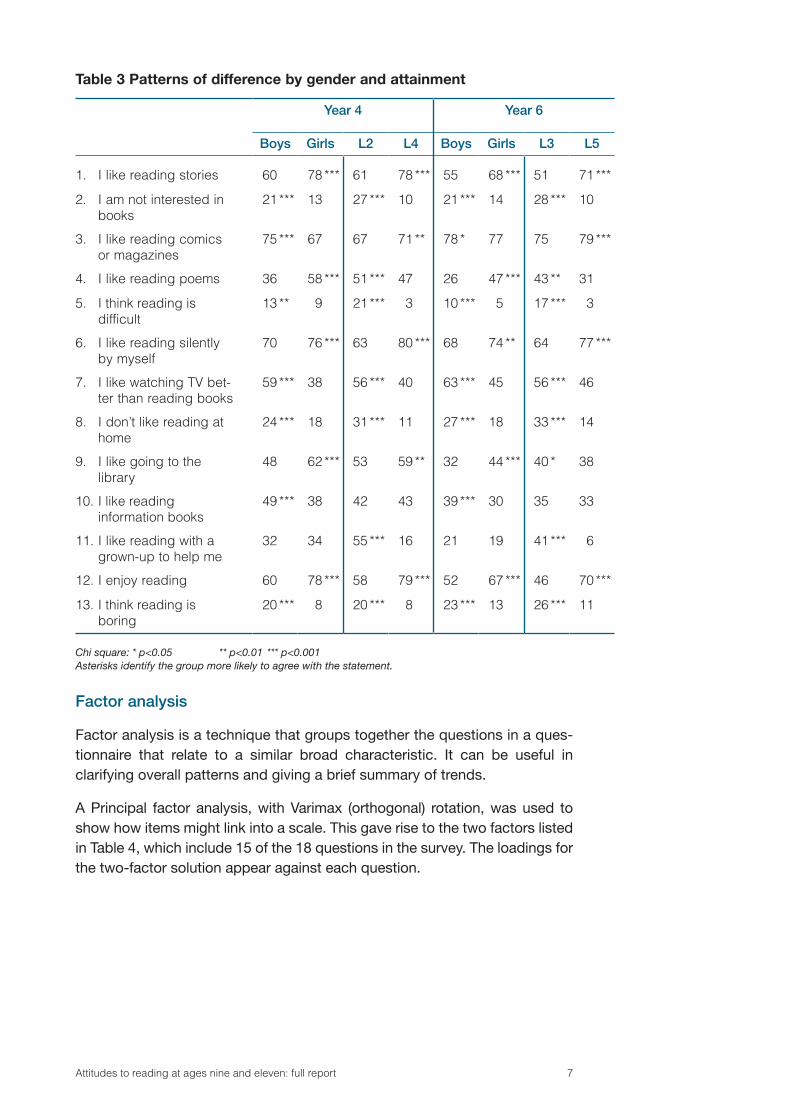
Table 3 Patterns of difference by gender and attainment
Chi square: * p<0.05 ** p<0.01 *** p<0.001Asterisks identify the group more likely to agree with the statement.
Factor analysis
Factor analysis is a technique that groups together the questions in a ques-tionnaire that relate to a similar broad characteristic. It can be useful inclarifying overall patterns and giving a brief summary of trends.
A Principal factor analysis, with Varimax (orthogonal) rotation, was used toshow how items might link into a scale. This gave rise to the two factors listedin Table 4, which include 15 of the 18 questions in the survey. The loadings forthe two-factor solution appear against each question.
Attitudes to reading at ages nine and eleven: full report 7
Year 4 Year 6
Boys Girls L2 L4 Boys Girls L3 L5
1. I like reading stories 60 78 *** 61 78 *** 55 68 *** 51 71 ***
2. I am not interested inbooks
21 *** 13 27 *** 10 21 *** 14 28 *** 10
3. I like reading comicsor magazines
75 *** 67 67 71 ** 78 * 77 75 79 ***
4. I like reading poems 36 58 *** 51 *** 47 26 47 *** 43 ** 31
5. I think reading isdifficult
13 ** 9 21 *** 3 10 *** 5 17 *** 3
6. I like reading silentlyby myself
70 76 *** 63 80 *** 68 74 ** 64 77 ***
7. I like watching TV bet-ter than reading books
59 *** 38 56 *** 40 63 *** 45 56 *** 46
8. I don’t like reading athome
24 *** 18 31 *** 11 27 *** 18 33 *** 14
9. I like going to thelibrary
48 62 *** 53 59 ** 32 44 *** 40 * 38
10. I like readinginformation books
49 *** 38 42 43 39 *** 30 35 33
11. I like reading with agrown-up to help me
32 34 55 *** 16 21 19 41 *** 6
12. I enjoy reading 60 78 *** 58 79 *** 52 67 *** 46 70 ***
13. I think reading isboring
20 *** 8 20 *** 8 23 *** 13 26 *** 11
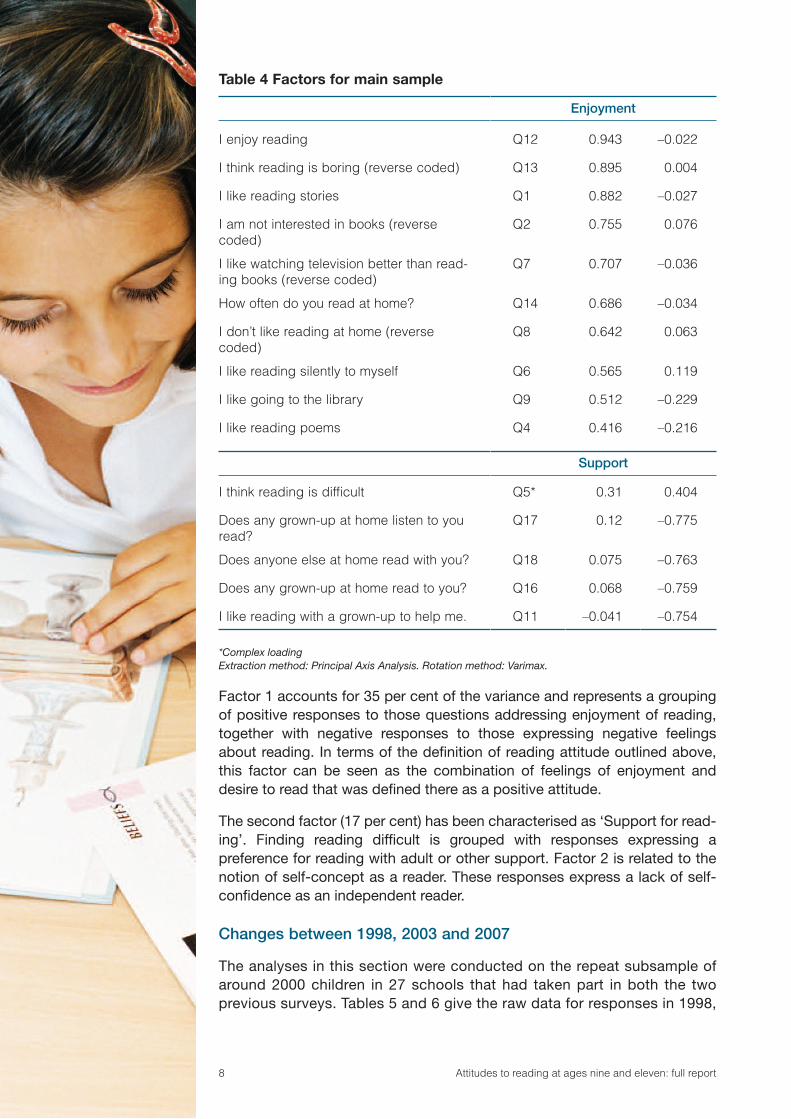
Table 4 Factors for main sample
*Complex loadingExtraction method: Principal Axis Analysis. Rotation method: Varimax.
Factor 1 accounts for 35 per cent of the variance and represents a groupingof positive responses to those questions addressing enjoyment of reading,together with negative responses to those expressing negative feelingsabout reading. In terms of the definition of reading attitude outlined above,this factor can be seen as the combination of feelings of enjoyment anddesire to read that was defined there as a positive attitude.
The second factor (17 per cent) has been characterised as ‘Support for read-ing’. Finding reading difficult is grouped with responses expressing apreference for reading with adult or other support. Factor 2 is related to thenotion of self-concept as a reader. These responses express a lack of self-confidence as an independent reader.
Changes between 1998, 2003 and 2007
The analyses in this section were conducted on the repeat subsample ofaround 2000 children in 27 schools that had taken part in both the twoprevious surveys. Tables 5 and 6 give the raw data for responses in 1998,
8 Attitudes to reading at ages nine and eleven: full report
Enjoyment
I enjoy reading Q12 0.943 –0.022
I think reading is boring (reverse coded) Q13 0.895 0.004
I like reading stories Q1 0.882 –0.027
I am not interested in books (reversecoded)
Q2 0.755 0.076
I like watching television better than read-ing books (reverse coded)
Q7 0.707 –0.036
How often do you read at home? Q14 0.686 –0.034
I don’t like reading at home (reversecoded)
Q8 0.642 0.063
I like reading silently to myself Q6 0.565 0.119
I like going to the library Q9 0.512 –0.229
I like reading poems Q4 0.416 –0.216
Support
I think reading is difficult Q5* 0.31 0.404
Does any grown-up at home listen to youread?
Q17 0.12 –0.775
Does anyone else at home read with you? Q18 0.075 –0.763
Does any grown-up at home read to you? Q16 0.068 –0.759
I like reading with a grown-up to help me. Q11 –0.041 –0.754
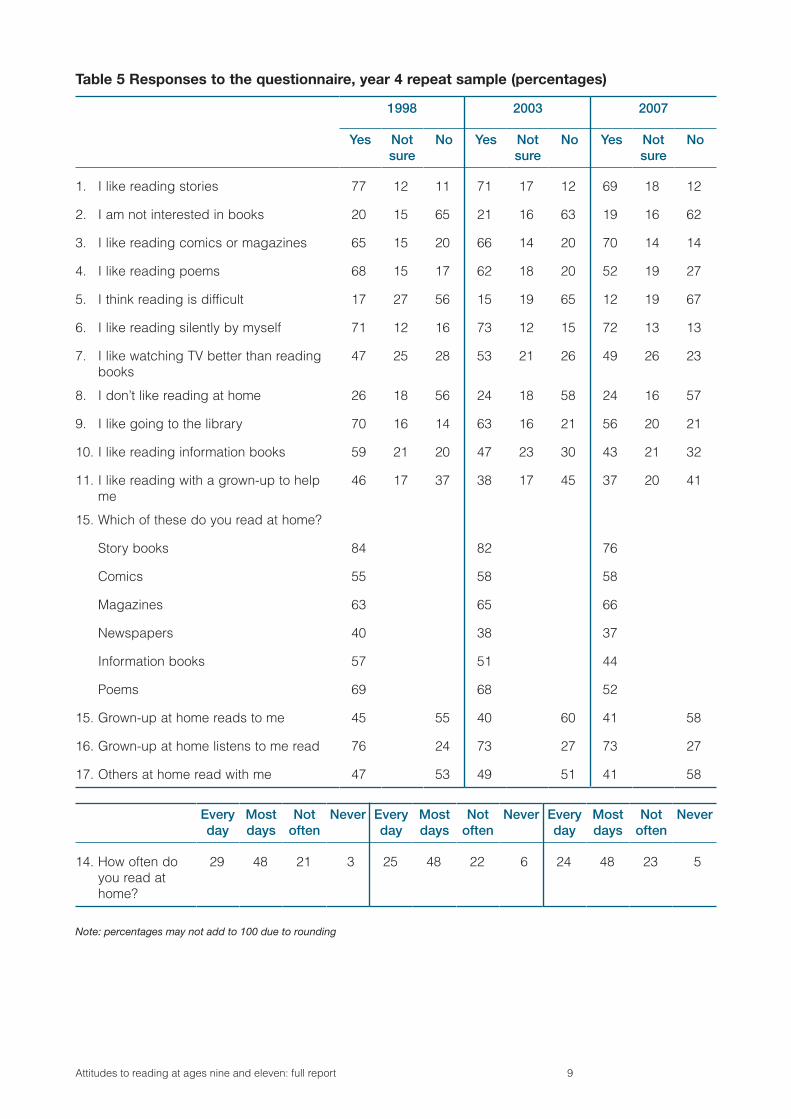
Table 5 Responses to the questionnaire, year 4 repeat sample (percentages)
Note: percentages may not add to 100 due to rounding
Attitudes to reading at ages nine and eleven: full report 9
1998 2003 2007
Yes Notsure
No Yes Notsure
No Yes Notsure
No
1. I like reading stories 77 12 11 71 17 12 69 18 12
2. I am not interested in books 20 15 65 21 16 63 19 16 62
3. I like reading comics or magazines 65 15 20 66 14 20 70 14 14
4. I like reading poems 68 15 17 62 18 20 52 19 27
5. I think reading is difficult 17 27 56 15 19 65 12 19 67
6. I like reading silently by myself 71 12 16 73 12 15 72 13 13
7. I like watching TV better than readingbooks
47 25 28 53 21 26 49 26 23
8. I don’t like reading at home 26 18 56 24 18 58 24 16 57
9. I like going to the library 70 16 14 63 16 21 56 20 21
10. I like reading information books 59 21 20 47 23 30 43 21 32
11. I like reading with a grown-up to helpme
46 17 37 38 17 45 37 20 41
15. Which of these do you read at home?
Story books 84 82 76
Comics 55 58 58
Magazines 63 65 66
Newspapers 40 38 37
Information books 57 51 44
Poems 69 68 52
15. Grown-up at home reads to me 45 55 40 60 41 58
16. Grown-up at home listens to me read 76 24 73 27 73 27
17. Others at home read with me 47 53 49 51 41 58
Everyday
Mostdays
Notoften
Never Everyday
Mostdays
Notoften
Never Everyday
Mostdays
Notoften
Never
14. How often doyou read athome?
29 48 21 3 25 48 22 6 24 48 23 5
2003 and 2007 for year 4 and year 6 pupils, respectively. Questions 12and 13 do not appear in this analysis, as they were added to the 2003 and2007 questionnaires and did not appear in 1998.
These raw results give an overview of the general pattern across the threeoccasions. Broadly, there were large differences between 1998 and 2003, butrelatively little change from 2003 to 2007. For example, on Question 1, bothage groups saw a sharp decline in enjoyment of reading stories from 1998 to2003, but this has levelled out over the four years from 2003 to 2007, with onlya very small decline in year 4 and a very slight rise amongst year 6 pupils.
Confidence in reading (lack of need for support) also appeared to change lit-tle from 2003 to 2007 after a sharp increase over the preceding five years.Question 16 shows that the proportion of pupils who have an adult reading tothem at home dropped from 1998 to 2003, but held steady after that.
There are one or two questions that seem to differ from this overall trend.Question 4, enjoyment of reading poems, shows a continuing steep decline,from 68 to 62 to 52 per cent for year 4 and from 58 to 50 to 43 per centamongst the older age-group. The chi-square statistic needs to be used withcaution in a complex table such as this one, but for Question 4 the patternemerged as highly significant. Similarly, Question 9, enjoyment of going tothe library, showed a continuing decline across the three occasions.
By contrast, the results for Question 7 show the proportion of pupils whoprefer watching television to reading declining again, restored to close to1998 levels. This seems to be a positive indication. However, the use of a1998 questionnaire means that leisure activities such as computer games arenot included in the questioning, leaving an unknown element in the results.
In terms of reading matter, comics and magazines continued to rise in popu-larity in comparison to books. Questions 1 and 3 show that they now achievehigher ratings than story books, for the first time.
Trends from 2003 to 2007
When the figures in Tables 5 and 6 are compared with Table 2, it is clear thatattitudes within the repeat subsample differed very little from those reportedfor the main sample. Comparisons from 2003 to 2007 can reliably be madeby comparing the two nationally representative main samples from therespective years.
On this basis, the factor analysis was used to identify and summarise over-all patterns of change amongst the different groups in 2003 and 2007. A‘factor score’ was calculated for each group to demonstrate these patternsgraphically. Figures 1 and 2 show these graphs. The horizontal line is thefactor score; the vertical line indicates the 95 per cent confidence interval(derived from an analysis of variance). If these confidence intervals overlap,any difference is non-significant.
10 Attitudes to reading at ages nine and eleven: full report
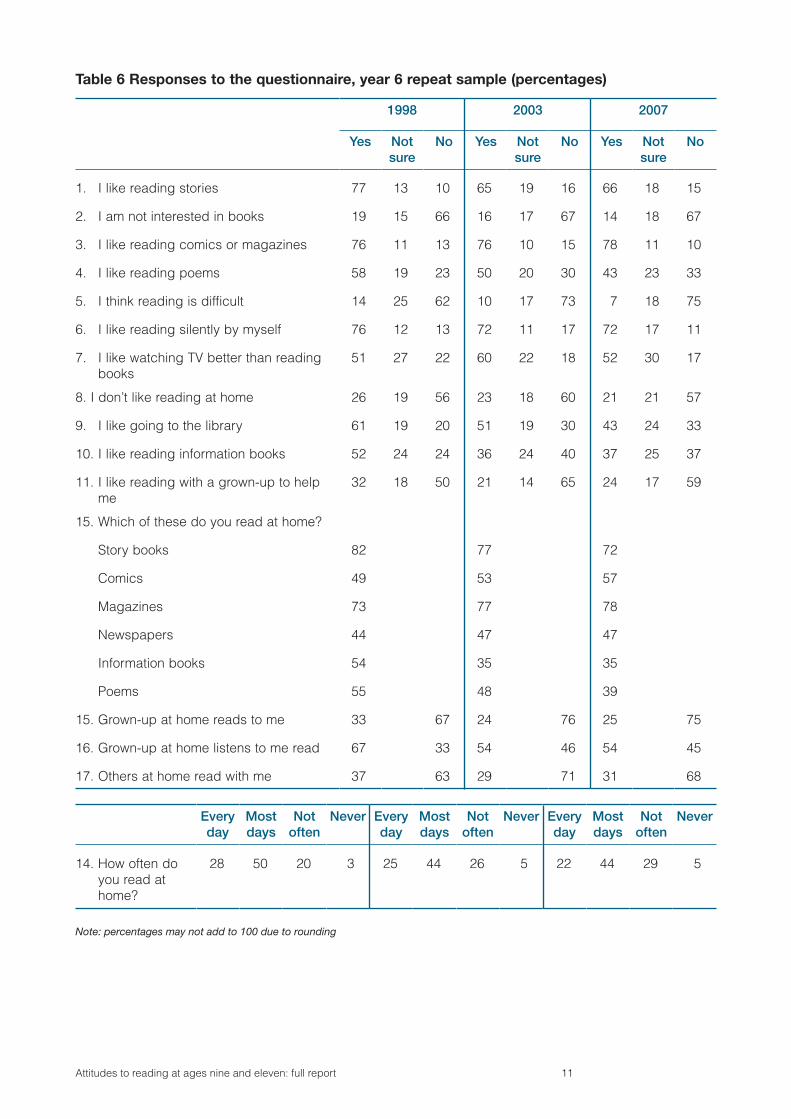
Table 6 Responses to the questionnaire, year 6 repeat sample (percentages)
Note: percentages may not add to 100 due to rounding
Attitudes to reading at ages nine and eleven: full report 11
1998 2003 2007
Yes Notsure
No Yes Notsure
No Yes Notsure
No
1. I like reading stories 77 13 10 65 19 16 66 18 15
2. I am not interested in books 19 15 66 16 17 67 14 18 67
3. I like reading comics or magazines 76 11 13 76 10 15 78 11 10
4. I like reading poems 58 19 23 50 20 30 43 23 33
5. I think reading is difficult 14 25 62 10 17 73 7 18 75
6. I like reading silently by myself 76 12 13 72 11 17 72 17 11
7. I like watching TV better than readingbooks
51 27 22 60 22 18 52 30 17
8. I don’t like reading at home 26 19 56 23 18 60 21 21 57
9. I like going to the library 61 19 20 51 19 30 43 24 33
10. I like reading information books 52 24 24 36 24 40 37 25 37
11. I like reading with a grown-up to helpme
32 18 50 21 14 65 24 17 59
15. Which of these do you read at home?
Story books 82 77 72
Comics 49 53 57
Magazines 73 77 78
Newspapers 44 47 47
Information books 54 35 35
Poems 55 48 39
15. Grown-up at home reads to me 33 67 24 76 25 75
16. Grown-up at home listens to me read 67 33 54 46 54 45
17. Others at home read with me 37 63 29 71 31 68
Everyday
Mostdays
Notoften
Never Everyday
Mostdays
Notoften
Never Everyday
Mostdays
Notoften
Never
14. How often doyou read athome?
28 50 20 3 25 44 26 5 22 44 29 5
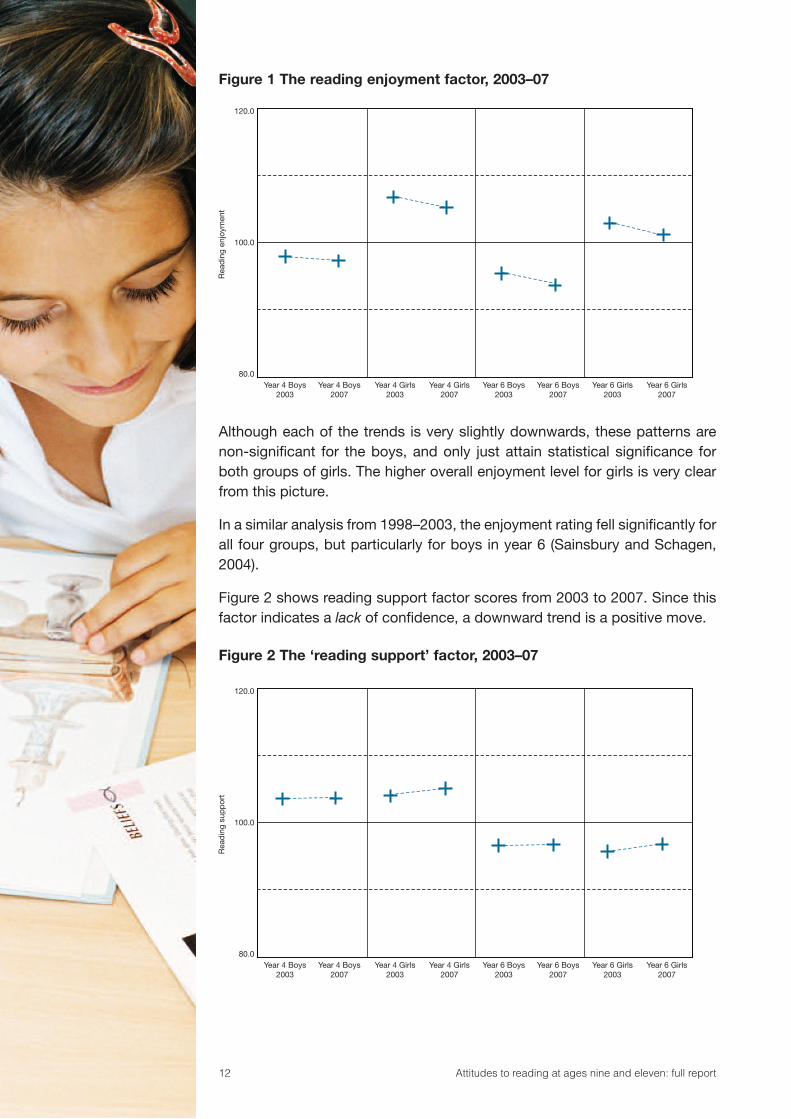
Figure 1 The reading enjoyment factor, 2003–07
Although each of the trends is very slightly downwards, these patterns arenon-significant for the boys, and only just attain statistical significance forboth groups of girls. The higher overall enjoyment level for girls is very clearfrom this picture.
In a similar analysis from 1998–2003, the enjoyment rating fell significantly forall four groups, but particularly for boys in year 6 (Sainsbury and Schagen,2004).
Figure 2 shows reading support factor scores from 2003 to 2007. Since thisfactor indicates a lack of confidence, a downward trend is a positive move.
Figure 2 The ‘reading support’ factor, 2003–07
12 Attitudes to reading at ages nine and eleven: full report
Year 4 Boys2003
Year 4 Boys2007
Year 4 Girls2003
Year 4 Girls2007
Year 6 Boys2003
Year 6 Boys2007
Year 6 Girls2003
Year 6 Girls2007
Rea
din
gen
joym
ent
80.0
100.0
120.0
Year 4 Boys2003
Year 4 Boys2007
Year 4 Girls2003
Year 4 Girls2007
Year 6 Boys2003
Year 6 Boys2007
Year 6 Girls2003
Year 6 Girls2007
Rea
din
gsu
pp
ort
80.0
100.0
120.0
None of these trends was statistically significant, showing that pupils’ self-confidence as independent readers has broadly held steady since 2003.
In a similar analysis from 1998–2003, all four groups showed a large andsignificant drop in their need for support, indicating increased confidence.
In a further investigation, a multilevel analysis was conducted in order to dis-cern which patterns remained significant when all background factors weretaken into account. This confirmed the significant differences in enjoymentand support between year 4 and year 6. It also confirmed that girls enjoyreading significantly more than boys. There was no significant difference ineither enjoyment or support/confidence between the 2003 and 2007 surveys.This result stands in notable contrast to the 1998–2003 analysis, which founda significant decrease in enjoyment and a significant increase in confidence.
Summary and discussion
In overview, all of the findings discussed above confirm that the sharpchanges in children’s attitudes to reading observed over the period 1998–2003 have now halted. In particular, the powerful multilevel model analysisconfirms that any slight changes in raw data are non-significant overall.Children’s enjoyment of reading has stopped declining sharply, and theirconfidence in their abilities as readers has stopped increasing sharply.Instead, their attitudes have held steady over the four-year period.
The PIRLS international reading survey of 2006 (Twist et al., 2007) confirmedthat reading enjoyment amongst pupils in England is poor when compared tothose in many other countries. It found a decline both in enjoyment and con-fidence since 2001 in pupils in England. In the PIRLS index of ‘attitudes toreading’ (the equivalent of reading enjoyment in this survey) there was a sig-nificant decline in pupils in the ‘high’ category and a small but significantincrease in pupils in the ‘low’ category. In the PIRLS index of ‘reading confi-dence’ the change was less clear-cut, with a non-significant decline in the‘high’ category but a small significant increase in the ‘low’ category.
These results would seem to be at odds with the present survey, but relatingthe two sets of findings is not straightforward. PIRLS sampled pupils in year5, mid-way between the year 4 and year 6 groups reported here. Responsesin the PIRLS survey were on a four-point scale (from ‘agree a lot’ to ‘disagreea lot’) rather than the three-point scale in this questionnaire. Finally, the peri-od of comparison in PIRLS was 2001–06, whereas this survey concerns2003–07.
Taken overall, then, the present results could be interpreted as compatiblewith those reported in PIRLS. This survey is more up to date, and indicates alevelling-off of attitudes, which was not apparent in the five-year span of thePIRLS questionnaires.
Attitudes to reading at ages nine and eleven: full report 13
The lack of evidence about on-screen reading from this questionnaire, whichappeared a minor constraint in the earlier surveys, now seems a more majordisadvantage. It is clear that children are increasingly likely to search forinformation online, and that computer activities and games form a large partof the lives of many children. The PIRLS survey found that just over half ofpupils in England reported reading on the internet every day, outside school,and 90 per cent playing video or computer games daily. Nevertheless, chil-dren’s attitudes to book reading remain important, and the areas that thissurvey was capable of illuminating remain important ones.
The reasons and causes for the patterns reported in this survey were notinvestigated directly, and must remain a matter of conjecture rather than evi-dence. There was a shift in government policy in 2003 towards moreflexibility and creativity in the primary curriculum, and it remains a possibilitythat these may have helped to slow the decline in reading enjoyment.However, other educational and social factors undoubtedly also came intoplay in ways that are impossible to quantify. Reading, in school and in society,continues to be a subject of major importance, and it is to be hoped that thecautious optimism revealed by this survey can be built upon for the future.
14 Attitudes to reading at ages nine and eleven: full report
References
Appleyard, J.A. (1991). Becoming a Reader: the Experience of Fiction fromChildhood to Adulthood. Cambridge: Cambridge University Press.
Baker, L. and Wigfield, A. (1999). ‘Dimensions of children’s motivation forreading and their relations to reading activity and reading achievement’,Reading Research Quarterly, 34, 4, 452–76.
Benton, M. and Fox, G. (1985). Teaching Literature: Nine to Fourteen. Oxford:Oxford University Press.
Department for Education and Skills (2003). Excellence and Enjoyment: aStrategy for Primary Schools. London: DfES.
Guthrie, J.T. and Wigfield, A. (2000). ‘Engagement and motivation in reading.’In: Kamil, M.L., Mosenthal, P.B., Pearson, P.D. and Barr, R. (Eds) Handbookof Reading Research: Volume III. Mahwah, NJ: Lawrence ErlbaumAssociates.
McKenna, M.C., Kear, D.J. and Ellsworth, R.A. (1995). ‘Children’s attitudestoward reading: a national survey’, Reading Research Quarterly, 30, 4, 934–56.
Sainsbury, M. and Schagen, I. (2004). Attitudes towards reading at ages nineand eleven. Journal of Research in Reading, 27, 4, 373–86.
Twist, L., Schagen, I. and Hodgson, C. (2007). Readers and Reading: thePIRLS 2006 National Report for England, 2006. Slough: NFER.
Twist, L., Gnaldi, M., Schagen, I. and Morrison, J. (2004). Good readers but ata cost? Attitudes to reading in England. Journal of Research in Reading, 27,4, 387–400.
Twist, L., Sainsbury, M., Woodthorpe, A. and Whetton, C. (2003). Reading AllOver the World: the PIRLS National Report for England. Slough: NFER.
Acknowledgements
The authors would like to thank the NFER Research Development Fund forsupporting this survey and Barbara Donahue for statistical analysis andadvice. Laura Daly and Claudia Zschneigner provided administrative supportand the NFER editorial and web team designed the online reports.
Attitudes to reading at ages nine and eleven: full report 15
National Foundationfor Educational ResearchThe Mere Upton ParkSlough Berkshire SL1 2DQ
T: 01753 574123F: 01753 691632E: [email protected]
www.nfer.ac.uk
© 2008 National Foundation for Educational Research
How to cite this publication:Sainsbury, M. and Clarkson, R. (2008). Attitudes toReading at Ages Nine and Eleven: Full Report.Slough: NFER.


