50
WP/16/235 Real Effects of Capital Inflows in Emerging Markets by Deniz Igan, Ali M. Kutan, and Ali Mirzaei
| Date post: | 22-Apr-2018 |
| Category: |
Documents |
| Upload: | nguyentuyen |
| View: | 230 times |
| Download: | 3 times |

WP/16/235
Real Effects of Capital Inflows in Emerging Markets
by Deniz Igan, Ali M. Kutan, and Ali Mirzaei

© 2016 International Monetary Fund WP/16/235
IMF Working Paper
Research Department
Real Effects of Capital Inflows in Emerging Markets
Prepared by Deniz Igan, Ali M. Kutan, and Ali Mirzaei
Authorized for distribution by Maria Soledad Martinez Peria
December 2016
Abstract
We examine the association between capital inflows and industry growth in a sample of
22 emerging market economies from 1998 to 2010. We expect more external finance
dependent industries in countries that host more capital inflows to grow disproportionately
faster. This is indeed the case in the pre-crisis period of 1998–2007, and is driven by debt,
rather than equity, inflows. We also observe a reduction in output volatility but this
association is more pronounced for equity, rather than debt, inflows. These relationships,
however, break down during the crisis, hinting at the importance of an undisrupted global
financial system for emerging markets to harness the growth benefits of capital inflows. In
line with this observation, we also document that the inflows-growth nexus is stronger in
countries with well-functioning banks.
JEL Classification Numbers: F30, L6, G20, G01
Keywords: Capital flows, financial dependence, industry growth, emerging economies
Authors’ E-Mail Addresses: [email protected]; [email protected]; [email protected]
IMF Working Papers describe research in progress by the author(s) and are published to
elicit comments and to encourage debate. The views expressed in IMF Working Papers are
those of the author(s) and do not necessarily represent the views of the IMF, its Executive Board,
or IMF management.

Contents Abstract ..................................................................................................................................... 2
I. Introduction ........................................................................................................................... 4
II. Background, Hypotheses, and Approach ............................................................................. 7
A. Related Literature ............................................................................................................. 7
B. Hypotheses ....................................................................................................................... 9
C. Methodology and Data Sources ..................................................................................... 11
Methodology ................................................................................................................... 11
Data ................................................................................................................................. 14
III. Empirical Findings ............................................................................................................ 16
A. Main Results .................................................................................................................. 16
B. Robustness Checks ......................................................................................................... 18
IV. Concluding Remarks ........................................................................................................ 19
References ....................................................................................................................... 21

I. INTRODUCTION
Do international capital inflows enhance growth? A potentially important benefit of capital
inflows to emerging markets is the relaxation of credit constraints, augmentation of investment
resources, and, accordingly, the facilitation of growth (Harrison et al., 2004). Foreign capital
brings credit, knowledge, and discipline to the host countries, which are thought to be essential
for economic growth (Tong and Wei, 2011). In addition, access to foreign funds can enhance
capital allocation efficiency and productivity, and thus growth in recipient countries (Ahmed
and Zlate, 2014). Yet, a number of recent studies argue against such and other positive benefits
of capital inflows. For example, capital inflows can cause a transfer of economic resources
from tradable to nontradable sectors, which are often subject to slow productivity growth
(Benigno and Fornaro, 2014; Reis, 2013). In addition, episodes of large capital inflows increase
the probability of a sudden stop—which hurt economic performance (Calvo and Reinhart,
2000; Gourinchas and Obstfeld, 2012)—and may trigger a shift of capital and labor out of the
manufacturing sector to non-manufacturing sectors (Beningo et al., 2015). All in all, the jury
is still out on whether capital inflows are associated with better economic growth performance.
Indeed, a number of empirical studies investigate whether international capital flows can
contribute to economic growth, but they usually report a complex and mixed picture on the
real effects of capital flows (see, among many others, Reisen and Soto, 2001, and Aizenman
et al., 2013). In addition to differences in sample coverage and methodology, the mixed picture
could be attributable to a number of gaps in the literature. First, most studies tend to focus only
on one component of capital flows (that is, foreign direct investment or FDI) or use aggregate
flows, and hence neglect the heterogeneous nature of capital flows. Foreign capital reaches
emerging market economies through not only FDI but also other types of flows, such as
portfolio investment and bank lending. Second, most studies use aggregate output growth
indicators. The responses of different economic sectors to international capital flows may vary
considerably. Aggregate growth data do not allow one to control for such sector-specific
factors and distinguish the causal impact of international capital flows.
The main purpose of this paper is to examine the association between capital inflows and
industry growth in emerging economies, as measured by output and value added growth.
Capital inflows increase access to finance (quantity) and reduce interest rates (cost of
borrowing), and hence we expect that industries more dependent on external finance (e.g.,
chemical industry) grow disproportionately faster than their counterparts (e.g., textile industry)
if they are located in countries hosting more capital inflows. The paper also goes beyond the
existing literature by shedding light on the potential tradeoffs associated with capital inflows
by investigating their impact on both growth and growth volatility in industrial sectors. In
addition, we break down the total capital inflows to sub-components and test whether there are
heterogenous effects across different forms of capital flows. And finally, we explore to what
extent the performance of domestic financial markets shape the real effects of foreign capital
inflows and what happens when there are large shocks to financial markets. To summarize,
this paper aims to adress the following questions:
1. Is there a differential, positive association between capital inflows and industry growth?
Does this entail a trade-off with growth volatility?
5
2. Do these associations differ based on the composition of capital inflows (e.g., equity-based
vs. debt-based capital inflows)?
3. Do these associations vary across countries depending on the financial sector
characteritics?
4. Was the capital inflows – industry growth nexus, if it exists, maintained during the global
financial crisis?
To address these research questions, we use a panel dataset covering 28 industries in 22
emerging market economies over the period 1998–2010. Integration of emerging markets into
world financial markets on the one hand and the fast-growing process of industrialization in
these economies on the other hand, make emerging markets a good laboratory to test to what
extent capital inflows contribute to industry growth.1 Our use of industry-level data allows us
to examine whether the relationship between capital inflows and growth differs across
industries and link such differences to the external finance dependence. Given the meltdown
of the global financial system and the unprecedented capital flow reversal during the global
financial crisis, we distinguish between the pre-crisis period up to 2007 and the crisis period
afterwards.
Our paper makes a number of contributions to the literature. First, by moving away from
aggregate growth dynamics, we offer a way to address the reverse causality and omitted
variable concerns. As Li and Liu (2005) and Igan and Tan (2015) point out, cross-country
analyses are commonly subject to endogeneity and omitted variable problems and hence have
a difficult time in establishing the direction of causality. Economies with superior growth
prospects attract more inflows; in other words, the economy leads, and capital follows.
Unobserved industry or country characteristics related to both capital inflows and growth could
also bias the estimation and statistical inferences from traditional cross-country regressions.
Our identification strategy uses a panel-based fixed effects approach that studies a specific
economic mechanism through which capital inflows affect growth. Specifically, we investigate
how capital inflows affect growth of industries differentially in those industries that are more
dependent on external finance. This is an important channel linking capital inflows and growth
because a main obstacle for firm investment and growth is financing constraints (Harrison et
al., 2004). Foreign capital brings scarce capital to recipient countries and hence may loosen
such constraints to growth. Our panel-based approach captures both times series and cross-
sectional dynamics between capital inflows and industry growth, allowing for more reliable
statistical inferences.
Second, financial resources may reach emerging economies through different forms. Some
might be more desirable for growth than others. We use a unique dataset that breaks capital
flows into two main components, and further to subcomponents within each: equity (FDI and
portfolio investment) vs. debt (bank lending and non-bank lending). We, therefore, contribute
to the literature by exploring whether growth and growth volatility of industrial sectors in
1 Several studies highlight the importance of international capital on the industrialization process (e.g.,
Markusen and Venables, 1999; Barrios et al., 2005; Gui-Diby and Renard, 2015). Nevetheless, none studies the
impact of capital inflows on industry growth with special attention on emerging market economies.
6
emerging market economies is systematically linked to the volume and composition of
international capital inflows. To the best of our knowledge, there are no studies examining the
potential tradeoffs between growth and growth volatility effects of disaggregated capital
inflows data—a curious gap considering the widely-drawn links between capital inflow surges
and domestic credit growth on the one hand and that between credit booms and the likelihood
of crises/recessions on the other.2
Finally, we examine whether the potential impact of capital inflows on economic growth
remains intact when the financial system suffers from large negative shocks. This is not as
obvious as it may seem because one could argue that financial disruptions would mostly affect
short-term flows and not necessarily have an impact on more stable, growth-enhancing flows.
Tong and Wei (2011) examine this channel thoroughly but for stock returns of listed firms and
not industry growth.
The baseline findings can be summarized as follows. Over the pre-crisis period 1998–2007,
private capital inflows are associated with stronger growth in industries that are more
dependent on external finance. This association is driven by debt, rather than equity, inflows.
We also observe a reduction in output volatility but this association is more pronounced for
equity, rather than debt, inflows. Our results are robust to the inclusion of a profusion of fixed
effects, additional controls, alternatives for external dependence measures, and alternative
dataset of capital inflows. These relationships do break down during the crisis. Interestingly,
our results also show that inflows channeled through equity flows could result in industry
growth if the recipient country has a well-functioning banking sector.
The differential effects of capital inflows on industry growth are economically relevant.
Relative to financially less dependent industries (in the 25th percentile level), external finance
dependent industries (in the 75th percentile level) grow around 1.58 percent faster in a country
that is host to a significant amount of private capital inflows (in the 75th percentile) than in a
country receiving a limited amount of foreign capital (in the 25th percentile). This accounts for
approximately 14 percent of the observed sample mean of 11 percent during the pre-crisis
period. Similarly, an industry at the 75th percentile level of external finance dependence grows
1.71 percent faster than an industry at the 25th percentile when it is domiciled in a country at
the 75th percentile of debt capital inflows rather than in one at the 25th percentile. This translates
to about 16 percent of the observed sample mean during the pre-crisis period.
The findings point to the need to take the composition of capital inflows into account when
assessing their costs and benefits. They also hint at the importance of an undisrupted global
financial system and a well-functioning domestic banking system for emerging markets to
harness the growth benefits of capital inflows.
The rest of the paper is organized as follows. Section II provides a brief theoretical overview
of the relationship between foreign capital and growth, lays out the hypotheses to be tested,
2 Such tradeoffs have been highlighted in the literature given the documented association between capital
inflows, credit and asset price booms, and financial instability episodes that follow. See, for instance,
Dell’Ariccia et al (2016) and the references therein.

7
and describes the empirical approach and discusses the data used in the analysis. In Section III,
we present the results. Section IV concludes.
II. BACKGROUND, HYPOTHESES, AND APPROACH
A. Related Literature
This paper is linked to several strands of the international finance literature. We briefly
summarize a few here, as a background to develop our hypotheses rather than a comprehensive
review.
Economic studies at the aggregate level have long argued that countries benefit from foreign
investment but the debate is far from settled.3 Javorcik (2004) document considerable
productivity gains from FDI and show various channels of productivity spillovers from
multinational companies to domestic firms. Li and Liu (2005) find that FDI tends to affect
growth directly as well as indirectly through its interaction with human capital. Kose et al
(2009) find robust evidence that portfolio equity inflows and FDI improves total factor
productivity growth (TFP), but foreign debt has a negative impact on TFP growth. Choong et
al (2010) also examine the impact of different forms of private capital flows on economic
growth. Using data from both advanced and developing countries over 1988–2002, they find
that while both portfolio investment and foreign debt have a negative effect on growth, FDI
has a positive effect on growth. Using data on 100 countries over the period 1990–2010,
Aizenman et al (2013) find that there is a strong positive nexus between FDI inflows and
economic growth, but the relationship between other types of capital inflows and growth is
less robust or even negative. Contrary to these findings, however, some other studies report no
impact of FDI and/or equity-based inflows on growth. Davis (2015) finds that changes in debt-
based, not equity-based, capital inflows has a significant effect on short-run macroeconomic
variables. Using data on 80 countries over the period 1979–1998, Durham (2004) investigates
the impact of FDI and equity portfolio investment on economic growth and does not find a
positive effect of either FDI or equity portfolio on growth. Gui-Diby and Renard (2015) find
that international capital inflows in the form of FDI had no impact on the industrialization of
African countries during the period 1980–2009. They argue that this failure of industrial
development using foreign capital could be because of weak government policies in providing
an environment where FDI could drive industrialization.
In a closely related strand of literature, researchers have used disaggregated industrial data in
order to test the impact of capital flows (mainly FDI) on industry performance.4 In their study
for Irish manufacturing firms, Barrios et al (2005) find that an increasing presence of FDI in
an industry is associated with a decline in that industry. Using industry-level data for 29
countries over the period 1985–2000, Alfaro and Charlton (2007) re-examine the relationship
3 See, for instance, Rodriguez-Clare (1996) and Markusen and Venables (1999) for theoretical arguments and
Borensztein et al (1998) and Akkemik (2009) for empirical findings.
4 Theoretically, Markusen and Venables (1999) show that FDI could be a catalyst for industrialization.
(continued…)

8
between FDI and growth by distinguishing different qualities of FDI.5 They find that the real
effects of FDI are more pronounced after accounting for the quality of FDI. Using
manufacturing data for 17 countries over 1973–2001, Bitzer and Görg (2009) find that FDI has
a general positive impact on industrial productivity, although with some heterogeneity across
countries. Using sectoral data, Vu and Noy (2009) find that FDI is positively associated with
economic growth but the association is again heterogenous across countries and industries.
The paper is also related to those studies that look into the costs and benefits associated with
capital inflows. However, there is no consensus on this issue. While some found that FDI is a
more stable source of international capital flows (e.g. Berg, 2004) than portfolio and bank
lending, others have not reached to the same conlusion (e.g., Claessens et al, 1995; Levchenko
and Mauro, 2007). Aizenman et al (2010) show that while there is no relationship between FDI
flows and output volatility, portfolio flows and debt flows tend to be associated with increased
volatility. Bordo et al (2010) find that more dependency on foreign currency debt is associated
with higher risk of currency and debt crises, leading to significant decline in output growth. In
addition, a small literature analyzes the role of capital flows in intensifying the effects of
financial crisis on the real sector. For instance, Tong and Wei (2011) find that greater
dependence on FDI capital inflows before the crisis enhanced the resilience of countries during
the crisis. Furthermore, Calderon and Kubota (2005) investigate the effect of disaggregated
capital flows on the likelihood of a financial crisis. They find that, following a surge in capital
inflows, FDI can mitigate a potential credit boom and thus crisis while debt inflows are
unstable and associated with crises.
Another set of literature highlights the role of recipient countries’ financial aspects in shaping
the impact of international capital flows on economic growth. Hermes and Lensink (2003) find
that it is only countries with well-developed financial systems that gain significantly from FDI.
Using data on 80 countries over the period 1979–1998, Durham (2004) finds that the impact
of equity portfolio investment and FDI on economic growth is dependent on the level of
financial and institutional development in host countries. Alfaro et al (2004) find that FDI
brings significant gains for recipient countries with well-developed financial systems. Choong
et al (2010) find that capital flows affect economic growth through the stock market channel.
Agbloyor et al (2014) reports similar results on the moderating role of recipient countries’
financial market development on the capital flows – growth nexus for African countries. Prasad
et al (2006) find that, if financial systems in recipient countries are weak, financially vulnerable
industries will not grow fast. These studies are complimentary to the strand of literature that
examines the relation between the level of domestic financial development and financing
constraints across countries, and finds that firms grow faster if they are located in countries
with developed financial markets (e.g., Rajan and Zingales, 1998; Demirguc-Kunt and
Maksimovic, 1998; and Love, 2003).
Our paper extends these studies in several aspects: (i) by providing a more granular analysis
of capital inflows and industry growth in emerging economies, (ii) by breaking down capital
flows to equity-based and debt-based flows; (ii) by exploring the tradeoffs of capital flow
5 They differentiate “quality FDI” based on several measures, including industry characteristics such as skill
intensity and reliance on external capital.

9
compositions; (iii) by taking into account the role of financial markets of host countries in
channeling foreign capital; and (iv) by comparing the potential impact of capital inflows during
the pre-crisis period and during the recent global financial crisis.
B. Hypotheses
Firms need routine access to capital. They usually rely heavily on both domestic and foreign
funds. Emerging economies receive a considerable amount of foreign funds in many ways
(Madura, 2012). First is FDI to build manufacturing plants, acquiring existing firms, and other
types of real investment. Second, foreign investors purchase equity and debt securities issued
by existing firms in emerging economies and thus serve as creditors to these firms. Third,
foreign banks extend loans to local firms for financing new investment and working capital
needs. Foreign capital inflows could, thus, provide additional capital to host countries
(Borensztein et al. 1998).
As Prasad et al (2007) argue, when an economy is closed to foreign capital, the interest rate is
high. When the capital account is liberalized, the interest rate falls. Significant international
capital inflows into the country lead the domestic interest rate to move toward world interest
rates, and therefore enhance economic growth. Harrison et al (2004) analyze the relationship
between capital flows and financing constraints and find that FDI is associated with a reduction
in financial constraints, especially for domestically owned firms and in less developed
countries. Henry (2000) and Bekaert et al (2005) find that financial liberalizations are
negatively associated with the cost of equity capital.
However, the growth impact of capital flows may vary across industries (Alfaro and Charlton,
2007). Consider two industries, A and B, located in country X. Assume that industry A is more
dependent on external finance (e.g., chemical industry) while industry B is less dependent on
external finance (e.g., tobacco industry). Industry A issues more debt and/or applies for more
bank loans to finance its investment opportunities than industry B, because industry B can
finance its investment projects by internal cash flows. What would happen if country X starts
to get more foreign capital inflows? The answer probably depends on whether the external
capital comes through debt or through equity channels. Consider first the case where country
X hosts more capital inflows in the form of debt. Then foreign investors either purchase bonds
issued by or extend loans to firms in industry A. Therefore, one would expect that industries
more reliant on external finance, such as industry A, to grow disproportionately faster than
their counterparts that are less dependent on external finance. Now, assume that country X
attracts capital inflows more in the form of equity. Under this scenario, it is not obvious that
industry A benefits more than industry B. Mody and Murshid (2005) argue that, even if the
rate of return in country X is lower than the world rate of return or the rate of return in the
foreign country from where capital comes, foreign equity capital may still flow to country X
but to achieve diversification. In an empirical analysis of 60 countries during the 1990s, they
show that increases in capital flows were indeed driven by diversification motives. If
diversification is the main motive, foreigners will likely choose to invest in a range of industries
giving industry B the same, or even more if investors prefer less leveraged firms, chance to
benefit from higher capital inflows. In addition, equity flows may be through acquisition of
existing firms, which does not necessarily improve industry growth. Under these
circumstances, equity inflows may not stimulate economic growth in country X. In sum, if
10
increasing quantity of finance and decreasing cost of capital are beneficial effects of capital
inflows, we expect that the relationship between industry growth and capital flows to be
stronger in industries that are more dependent on external finance, yet the strength of the
relationship to depend on the form of foreign capital. Thus, our first two hypotheses are:
H1. Capital inflows increase industry growth more in external finance dependent industries.
H2. Composition of capital inflows matters for growth.
International capital flows bring both a range of benefits and possible risks to host countries
(Koepke, 2015). The latter most frequently involve sudden stops (Caballero, 2014; Ghosh et
al, 2016; and references therein). Conventional wisdom may suggest that FDI is a more stable
source of foreign capital for recipient countries. Accordingly, FDI tends to reduce
macroeconomic volatility because it is more stable than other forms of capital inflows, while
portfolio investment may increase growth volatility (even as it tends to be associated with a
more diversified investment). Empirical evidence supporting these arguments usually comes
from crisis episodes such as the Latin American debt crisis, East Asian financial crisis, and the
recent global financial crisis, although Albuquerque (2003) shows that this is the case also
outside crisis periods and posits that FDI is more difficult to expropriate than portfolio
investment, and hence financially less developed countries would receive capital more through
FDI. Goldstein and Razin (2006) propose a model of a tradeoff between portfolio investment
and FDI, showing the greater volatility of FDI net inflows relative to portfolio investment.
Levchenko and Mauro (2007) investigate the behavior of different types of capital flows to a
large sample of countries over 1970–2003. They observe that FDI is the most stable type of
capital flows, followed by portfolio equity, portfolio debt, and other types of flows. In a
different approach, Claessens et al. (1995) fail to find significant differences across forms of
capital flows but observe that long-term debt flows are often as volatile as short-term flows.
As Ahmed and Zlate (2014) mention, large but volatile capital inflows may lead to economic
distortions.
Related to our work, we expect that some forms of capital flows (such as equity inflows) may
reduce growth volatility of industries that are more reliant on external finance, as they are
deemed to be a more stable source of external finance. When stable forms of capital inflows
increase, these companies may be able to better plan their investment activities and other
corporate decisions or make plans for longer horizons, decreasing fluctuations in output and
value added. We expect that other types of capital flows (such as debt inflows) could be
beneficial for growth, but not necessarily for dampening growth volatility because they are
susceptible to volatility themselves. The association documented between domestic credit
booms—which sometimes are followed by busts—and capital inflow surges—especially those
dominated by debt inflows—supports this expectation: if capital inflows fuel financial
imbalances, the reversal of these imbalances could manifest themselves in growth boosts and
growth halts.6 Capitals inflows in that case could help raise growth rates on average but not
necessarily reduce their volatility. Thus our next hypothesis is:
6 See, among others, Lane and McQuade (2014) and Dell’Ariccia et al (2016).

11
H3. Certain forms of capital inflows may reduce growth volatility.
The effect of international capital flows on economic growth might be conditional on the
‘absorptive capacity’ of recipient countries. Research has highlighted the role of financial and
institutional development (Durham, 2004), trade policy (e.g., Balasubramanyam et al, 1996),
and human capital development (Borensztein et al, 1998). Here we focus on the role of
domestic financial markets by analyzing whether well-functioning financial systems can
improve the economy’s ability to benefit from hosting capital inflows, at least in terms of
industry growth. Developed financial markets may promote capital accumulation, foster
technological innovation, reduce transaction costs, and increase capital allocation efficiency,
and therefore, stimulate economic growth. Thus, well-functioning financial systems in host
countries could more effectively utilize foreign capital, by improving the absorptive capacity
of the country and enhancing allocation of resources. While banking performance may matter
for FDI and debt inflows, the stock market may particularly matter for portfolio investment.
That said, a well-developed stock market can also facilitate FDI inflows through mergers and
acquisitions. In addition, with an efficient and competitive banking sector in host countries,
firms could better utilize foreign capital inflows to expand their businesses, which would
further enhance economic growth. Indeed, Alfaro et al (2004) find that the effect of FDI on
growth is contingent on the quality of financial markets in host countries: the more developed
the financial system, the stronger is the growth-enhancing effect of FDI. Choong et al (2010)
find that the development of the stock market in host countries can transform the negative
impact of private capital flows (e.g., foreign debt and portfolio investment) on economic
growth to a positive one. Igan and Tan (2015) find that, in addition to the composition of capital
inflows, the structure of financial systems also matters for corporate credit growth. Overall, we
hypothesize that the performance of domestic banking sector helps increase the absorptive
capacity of recipient countries so that they can better exploit capital inflows toward enhancing
industry growth. It follows that our next hypothesis is:
H4. The impact of capital inflows on industry growth may depend on the characteristics of the
host countries’ banking sector.
C. Methodology and Data Sources
Methodology
Identifying the causal effects of capital inflows on growth is challenging. Our main empirical
strategy, in the spirit of Rajan and Zingales (1998), is to examine whether industries that are
financially more dependent on external finance grow disproportionately faster if they are
located in countries that host more capital inflows. Thus, our model specification is given by
the following equation:
𝐺𝑟𝑜𝑤𝑡ℎ𝑖,𝑐,𝑡 = 𝜔0 + 𝜔1. 𝑆ℎ𝑎𝑟𝑒𝑖,𝑐,𝑡−1 + 𝜔2. 𝐶𝑎𝑝𝑖𝑡𝑎𝑙_𝐼𝑛𝑓𝑙𝑜𝑤𝑐,𝑡 + 𝜔3. 𝐶𝑎𝑝𝑖𝑡𝑎𝑙_𝐼𝑛𝑓𝑙𝑜𝑤𝑐,𝑡
∗ 𝐷𝑒𝑝𝑒𝑛𝑑𝑒𝑛𝑐𝑒𝑖 + 𝜔4. 𝐶𝑟𝑒𝑑𝑖𝑡𝑐,𝑡 + 𝜔5. 𝐶𝑟𝑒𝑑𝑖𝑡𝑐,𝑡 ∗ 𝐷𝑒𝑝𝑒𝑛𝑑𝑒𝑛𝑐𝑒𝑖 + 𝜃𝑖 + 𝜃𝑐 + 𝜃𝑖𝑐
+ 𝜃𝑡 + 𝜀𝑖,𝑐,𝑡 (1)
𝐺𝑟𝑜𝑤𝑡ℎ is industry growth measured by the growth of real output in industry 𝑖, country 𝑐 in
year 𝑡 computed as 𝐺𝑟𝑜𝑤𝑡ℎ𝑖,𝑐,𝑡 = ( 𝑂𝑢𝑡𝑝𝑢𝑡𝑖,𝑐,𝑡 − 𝑂𝑢𝑡𝑝𝑢𝑡𝑖,𝑐,𝑡−1)/ 𝑂𝑢𝑡𝑝𝑢𝑡𝑖,𝑐,𝑡−1. As a

12
robustness check, we also compute industry growth using real value added7. Furthermore, to
examine the tradeoffs between growth and growth volatility impact of capital inflows, we
follow Larrain (2006) and Raddatz (2006) and use the standard deviation of industry growth
as the dependent variable. 𝑆ℎ𝑎𝑟𝑒 is the share of value added by each industry to total value
added by all industries in a country and comes in with a one-period lag. We control for the
industrial share of total value added to capture the heterogeneous degrees of importance and
development across different industries within a country. 𝐷𝑒𝑝𝑒𝑛𝑑𝑒𝑛𝑐𝑒 is Rajan and Zingales
(1998) measure of industry dependence on external finance. 𝐶𝑎𝑝𝑖𝑡𝑎𝑙_𝐼𝑛𝑓𝑙𝑜𝑤 is a vector of
private capital inflow variables. To check how the pattern of capital inflows affects growth of
industries that are financially dependent, we use interaction terms between a proxy for capital
inflows variable and a proxy for external dependence (i.e., 𝐶𝑎𝑝𝑖𝑡𝑎𝑙_𝐼𝑛𝑓𝑙𝑜𝑤 ∗ 𝐷𝑒𝑝𝑒𝑛𝑑𝑒𝑛𝑐𝑒).
We use five variables as proxies for capital inflows variable: total private capital inflows, their
two main components, and their four major subcomponents. Total private capital inflows are
made up of equity inflows and debt inflows. Equity inflows consist of both FDI and portfolio
(equity) investment. Debt inflows consist of bank loans and nonbank lending (e.g., portfolio
debt inflows). In short, 𝑇𝑜𝑡𝑎𝑙 𝑝𝑟𝑖𝑣𝑎𝑡𝑒 𝑐𝑎𝑝𝑖𝑡𝑎𝑙 𝑖𝑛𝑓𝑙𝑜𝑤𝑠 = 𝐸𝑞𝑢𝑖𝑡𝑦 𝑖𝑛𝑓𝑙𝑜𝑤𝑠 (𝐹𝐷𝐼 + 𝑃𝑜𝑟𝑡𝑓𝑜𝑙𝑖𝑜 𝑖𝑛𝑣𝑒𝑠𝑡𝑚𝑒𝑛𝑡) + 𝐷𝑒𝑏𝑡 𝑖𝑛𝑓𝑙𝑜𝑤𝑠 (𝐵𝑎𝑛𝑘 𝑙𝑒𝑛𝑑𝑖𝑛𝑔 + 𝑁𝑜𝑛𝑏𝑎𝑛𝑘 𝑙𝑒𝑛𝑑𝑖𝑛𝑔). Equity-
and debt-based capital inflows are derived from different (push and pull) factors (Davis, 2015),
and thus different types of capital inflows may have non-identical effects on the real sector of
host countries.
According to the literature (e.g., Rajan and Zingales, 1998), financial development of a country
affects industry growth through the channel of firm financial dependence. Thus, besides capital
inflows that we expect to have an impact on growth, we must also include a proxy for financial
development (shown as 𝐶𝑟𝑒𝑑𝑖𝑡) and its interaction with external financial dependence
(𝐶𝑟𝑒𝑑𝑖𝑡 ∗ 𝐷𝑒𝑝𝑒𝑛𝑑𝑒𝑛𝑐𝑒) into the model.8 𝐶𝑟𝑒𝑑𝑖𝑡 is sum of domestic credit to the private sector
and stock market capitalization. Following existing studies (e.g., Rajan and Zingales, 1998;
Hsu et al., 2014), we calculate credit as 𝐶𝑟𝑒𝑑𝑖𝑡𝑐,𝑡 = 𝑃𝑟𝑖𝑣𝑎𝑡𝑒 𝐶𝑟𝑒𝑑𝑖𝑡𝑐,𝑡 + 𝐸𝑞𝑢𝑖𝑡𝑦𝑐,𝑡, where
𝑃𝑟𝑖𝑣𝑎𝑡𝑒 𝐶𝑟𝑒𝑑𝑖𝑡 is defined as 𝑃𝑟𝑖𝑣𝑎𝑡𝑒 𝐶𝑟𝑒𝑑𝑖𝑡𝑐,𝑡 = 𝐷𝑜𝑚𝑒𝑠𝑡𝑖𝑐 𝐶𝑟𝑒𝑑𝑖𝑡𝑐,𝑡/𝐺𝐷𝑃𝑐,𝑡 i.e., the ratio
of country 𝑐’s domestic credit to the private sector in year 𝑡 over its GDP in year 𝑡. Domestic
credit to the private sector refers to financial resources provided to the private sector by
financial institutions. 𝐸𝑞𝑢𝑖𝑡𝑦 is defined as 𝐸𝑞𝑢𝑖𝑡𝑦𝑐,𝑡 = 𝑆𝑡𝑜𝑐𝑘 𝑀𝑎𝑟𝑘𝑒𝑡 𝐶𝑎𝑝𝑖𝑡𝑎𝑙𝑖𝑧𝑎𝑡𝑖𝑜𝑛𝑐,𝑡/𝐺𝐷𝑃𝑐,𝑡 , i.e., the ratio of country 𝑐’s stock market capitalization in year 𝑡 over its GDP in year
𝑡. Stock market capitalization is defined as the summation of share price times the number of
shares outstanding for each listed stock.
We include a plethora set of industry, country, industry-country, and year dummies: 𝜃𝑖 refers
to industry dummies to capture industry-specific factors that influence cross-industry growth
differentials, such as industrial R&D and global shocks to the industry; 𝜃𝑐 are country dummies
7 Since foreign capital brings technology, skills and capital to host countries that are essential for productivity
growth, we use output growth as our main dependent variable that arguably better captures increases in
productivity (Rajan and Zingales, 1998) than value added growth does. The latter is used as an alternative.
8 By including a proxy for financial development, we examine whether for a given level of financial
development, capital inflows improve the growth of financially dependent industries.
13
that capture time invariant country-specific factors that might drive cross-country differences
in growth, such as the characteristics of the institutional, cultural, and legal environment; 𝜃𝑖𝑐
are industry-country dummies to catch cross-industry cross-country fixed effects, such as
industrial policies in each country; and finally 𝜃𝑡 denote year dummies to account for global
shocks, such as world economic growth and oil prices. Therefore, one key advantage of our
three-dimensional (industry–country–year) panel is that it allows us to use interacted fixed
effects to control for a wide array of omitted variables (Hsu et al, 2014). We cluster standard
errors by country and industry and confirm the robustness of the results to clustering at the
country or industry level only.
Eq. (1) assists in testing our first three hypotheses. However, the association between capital
flows and growth of financially dependent industries could vary systematically with a
country’s financial sector characteristics. Thus, to test our last hypothesis, split the sample
based on certain banking system characteristics.9, 10 We include a range of variables capturing
competition, stability, profitability, and ownership structure.
Before proceeding, we should emphasize that one issue with finance and growth nexus is the
well-known problem of endogeneity.11 Capital flows may increase industrial growth leading to
enlarged industrial sectors in emerging economies, which in turn attract more foreign capital.
We address this issue by using differences-in-differences models applied to industry-level data,
developed by Rajan and Zingales (1998). The model takes account of the varying degrees of
external finance dependence across industrial sectors, and has been widely applied in the
literature (e.g., Cetorelli and Gamberra, 2001; Claessens and Laeven, 2003 and 2005; Hsu et
al., 2014). Since external finance dependence was measured using data from U.S.-listed firms,
it is unlikely that U.S. financial dependence responds to output growth elsewhere (Fernández
et al., 2013). As Igan and Tan (2015) argue, capital inflows could be regarded as exogenous to
firm-level (and perhaps to industry-level) financing decisions, as country-level capital inflows
are beyond the control of individual firms. In addition, we include an array of fixed effects that
may mitigate omitted variable and endogeneity problems. That said, the endogeneity problem
may still remain. Thus, as a robustness test, we check whether our results are similar if we
exclude top five largest industries in each country in each year. For example, by excluding
electrical machinery industry (ISIC 383) in South Korea and petroleum refineries industry
(ISIC 353) in Russia, it is less likely that other small industries will be the pull factors of
attracting foreign funds.
9 An alternative would be to use additional interaction terms and estimate the following specification: 𝐺𝑟𝑜𝑤𝑡ℎ𝑖,𝑐,𝑡 = 𝜔0 + 𝜔1. 𝑆ℎ𝑎𝑟𝑒𝑖,𝑐,𝑡−1 + 𝜔2. 𝐶𝑎𝑝𝑖𝑡𝑎𝑙_𝐼𝑛𝑓𝑙𝑜𝑤𝑐,𝑡 + 𝜔3. 𝐶𝑎𝑝𝑖𝑡𝑎𝑙_𝐼𝑛𝑓𝑙𝑜𝑤𝑐,𝑡 ∗ 𝐷𝑒𝑝𝑒𝑛𝑑𝑒𝑛𝑐𝑒𝑖 +
𝜔4. 𝐶ℎ𝑎𝑟𝑎𝑐𝑡𝑒𝑟𝑖𝑠𝑡𝑖𝑐𝑠𝑐,𝑡 + 𝜔5. 𝐶ℎ𝑎𝑟𝑎𝑐𝑡𝑒𝑟𝑖𝑠𝑡𝑖𝑐𝑠𝑐,𝑡 ∗ 𝐶𝑎𝑝𝑖𝑡𝑎𝑙_𝐼𝑛𝑓𝑙𝑜𝑤𝑐,𝑡 ∗ 𝐷𝑒𝑝𝑒𝑛𝑑𝑒𝑛𝑐𝑒𝑖 + 𝜔6. 𝐶𝑟𝑒𝑑𝑖𝑡𝑐,𝑡 + 𝜔7. 𝐶𝑟𝑒𝑑𝑖𝑡𝑐,𝑡 ∗
𝐷𝑒𝑝𝑒𝑛𝑑𝑒𝑛𝑐𝑒𝑖 + 𝜃𝑖 + 𝜃𝑐 + 𝜃𝑖𝑐 + 𝜃𝑡 + 𝜀𝑖,𝑐,𝑡 , where 𝐶ℎ𝑎𝑟𝑎𝑐𝑡𝑒𝑟𝑖𝑠𝑡𝑖𝑐𝑠 represents different features of domestic
banking systems. We do this as well but report the results obtained by splitting the sample as it is easier to
interpret the findings.
10 In unreported results, we also explore whether the relationship between capital inflows and industry growth is
different with respect to the characteristics of stock markets (e.g., turnover and volatility). We do not find any
robust and statistically significant results.
11 Previous studies that use aggregate data have attempted to deal with endogeneity problem using different
techniques including simulation equations and bilateral causality testing (Li and Liu, 2005).

14
In addition, admittedly, while our analysis is conducted at an industry level to deal with the
standard criticism in the literature on reverse causality (i.e., that capital flows go to countries
with higher growth), we acknowledge that even industry-level specifications may have omitted
variable bias that may not be fully controlled by the industry effect. For example, more
productive industries might, even without capital flows, have better output growth. Data
limitations prevent us from including additional alternative controls beyond industry effect.
Yet, as a robustness check, we confirm that the results hold when alternative fixed effects—in
particular, industry-year interaction terms—are considered.
Data
We compile a rather comprehensive dataset of capital inflows for 22 emerging market
economies at an annual frequency, using the statistics reported by the Institute of International
Finance (IIF). The IIF divides total private capital inflows into four categories: FDI, portfolio
investment, bank lending, and other private capital (or nonbank lending). FDI and portfolio
investment are combined to form equity capital inflows, and bank lending and other capital
inflows are combined to form debt capital inflows. Total capital inflows are then the sum of
these two. In fact, similar to Davis (2015), we divide capital flows into equity-based capital
flows (FDI and portfolio investment) and debt-based capital flows (bank lending and nonbank
lending). Furthermore, private capital inflows and their components are reported in nominal
U.S. dollars. Following Bluedorn et al (2013), we normalize capital inflows data by nominal
GDP in U.S. dollars in order to capture their macroeconomic relevance. The latter series is
taken from the World Development Indicators (WDI) database of the World Bank. Capital
inflows refer to flows of capital from foreign private sector investors and lenders to emerging
economies. Note also that we include only private inflows and exclude official inflows.
Capital inflows to emerging market economies were significant during the early 1990s, but
decreased in the late 1990s (Figure 1). Starting again in 1998, capital inflows increased
remarkably and peaked in 2007 when net capital inflows reached about $400 billion. After
dropping sharply during the global financial crisis, capital inflows to emerging market
economies have recovered and reached new highs against the backdrop of sluggish growth and
very low interest rates in advanced economies.12 Historically, FDI was the main channel
through which foreign capital reached emerging economies (Table 1). More recently, and
especially over the pre-crisis period 1998–2007, other types of capital flows such as bank
lending have increased substantially. Interestingly, the share of value added of the
manufacturing sector in many emerging market economies also increased over the same period
from 1998 to 2007 (as illustrated for four individual countries in Figure 2). Is this a statistically
and economically meaningful relationship? We seek to answer this question by looking at
industry growth dynamics.
12 As growth continues to recover and monetary policy normalizes in advanced economies, a reversal of capital
flows—as illustrated in the “taper tantrum” of spring 2013 and China-related events in the summer of 2015—is
likely. While our regression results could shed some light on the possible implications of such reversal on
industrial growth in emerging markets, we leave a thorough statistical analysis of this period for future research.

15
The industry data are taken from the UNIDO Industrial Statistics Database, which contains
highly disaggregated yearly data on the manufacturing sectors. These cover 73 industries of 3-
and 4-digit codes. In order to be able to combine with the external finance dependence data,
we regroup these 73 industries of ISIC Rev. 3 data into 28 industries of ISIC Rev. 2. Note that
there are 30 countries included in the IIF capital flows database, however, we remove 8
countries because data for the main industry performance variable (i.e., output growth) are not
available. External finance dependence of each industry is taken from Rajan and Zingales
(1998). External finance dependence reflects technological characteristics of an industry that
are relatively stable across space and time. Rajan and Zingales (1998) argue that the degree of
U.S. firms’ dependence on external finance is a good proxy for the demand for external funds
in other countries because capital markets in the United States are the most advanced, letting
industry constraints from the demand side rather than financial market constraints from the
supply side speak. See also Hsu et al (2014), among others.
Table 2 provides detailed definitions of all variables used in the analysis.13 The time span of
the data is 1998−2010.14 The start date of 1998 allows us to assess both a decade of surge in
inflows to emerging economies prior to the global financial crisis and the sharp decline
experienced during the crisis.
Table 3 presents the averages for capital inflows, industry growth, and other variables by
country (Panel A), by industry (Panel B), and the summary statistics for the regression sample
covering the period 1998–2010 (Panel C). Panel A indicates that total private capital inflows
range from 0.7 percent of GDP (Indonesia) to 15.7 percent (Bulgaria), and Panel C shows that
total private capital inflows in the pooled sample have a mean of 5.7 percent with a standard
deviation of 5.8 percent. Panel A also shows that industry growth (real output growth) ranges
from a within-country average of -20 percent (in Argentina) to a within-country average of 24
percent (in China), and Panel B shows that industry growth ranges from 3 percent (Leather and
fur products, ISIC 323) to 16 percent (Misc. petroleum and coal products, ISIC 354). Panel C
reports the pooled mean and standard deviation of industry growth, which are 10 percent and
32 percent, respectively.15
Figure 3 shows the trend of aggregate as well as disaggregated components of private capital
inflows. Our sample of 22 emerging economies experienced a significant increase in capital
inflows from 1998 to 2007, with a remarkable surge during pre-crisis years between 2002 and
2007. Inflows dropped dramatically at the onset of the global financial crisis in 2008, but
recovered as early as 2010. The rebound in debt inflows exceeded that in equity inflows, which
in part reflects the sharper increase in debt inflows right before the crisis. Figure 4 ranks our
13 In the Appendix, we report the composition of our sample by country and by industry.
14 UNIDO data comes with a significant lag, this is the reason we cannot use the latter years of capital inflows
data in the regression analysis.
15 Note that, during our sample period, industries that are more dependent on external finance (with index value
above median) grew, on average, each year 2 percent more than industries less in need of external finance (with
index value below median).
(continued…)

16
sample of countries based on aggregate private capital inflows (as percent of GDP) in year
2007, when the surge reached its peak. Ecuador, Indonesia, Morocco, and Mexico experienced
relatively little capital inflows (in the bottom 10th percentile). At the other end of the spectrum,
Eastern European countries such as Bulgaria, Hungary, Romania, and Russia underwent
unprecedented booms (in the top 90th percentile).16
Do such phenomenal international capital inflows to emerging economies stimulate industry
growth in recipient countries? Figure 5 displays the trend of capital inflows and aggregate
industry growth in our sample of 22 emerging economies during the 1998–2010 period.
Industry growth moves closely in tandem with capital inflows. Furthermore, since our
empirical strategy is to examine whether industries more in need of external finance grow
disproportionately faster than their peers if they happened to be located in countries with higher
amount of capital inflows, we first check what our raw data say about this. We average the
industry output growth rate across four sub-samples: industries highly dependent on external
finance located in countries with low and high capital inflows, and industries less dependent
on external finance located in, again, countries with low and high capital inflows. The three
types of capital inflows—total, equity, and debt inflows—are presented in the three panels A,
B, and C, respectively (Table 4). It is evident that output growth rate is different across
industries: industries more dependent on external finance grew disproportionately faster over
the sample period 1998–2010 if they were located in countries hosting more total (Table 4,
Panel A) or debt (Table 4, Panel C) capital inflows. In the next section, we examine whether
these relationships are statistically significant after industry and country effects are purged out.
III. EMPIRICAL FINDINGS
A. Main Results
We start our analysis by examining how industry growth behaves in relation to capital inflows.
Table 5 reports the results from estimating Eq. (1) using the whole sample period (1998–2010)
as well as splitting the sample period to pre- (1998–2007) and post-crisis (2008–2010). The
estimation is carried out separately for different types of flows. The coefficients on the
interaction terms between capital inflows and external finance dependence are identified from
the cross-industry variation within a country and capture the differential effects of capital
inflows on growth across industries. Put in a more intuitive way, these coefficients represent
the difference in growth among industries that are dependent on external finance at varying
degrees and those that are in countries with varying degrees of capital inflows.
Our first main finding is that private capital inflows were associated with higher output growth
during the pre-crisis years in industries more dependent on external finance (revealed by the
positive and statistically significant coefficient on the interaction term between the capital
16 The latter phenomenon has been widely studied not only from an academic point of view but also from a
policymaker’s perspective with vulnerability to a sudden stop in mind. See, for instance, Lane and Milesi-
Ferretti (2007) and the references therein.
(continued…)

17
inflow and external finance dependence variables in Table 5, Panel B, Columns 1 and 2).17 This
association breaks down during the crisis (Table 5, Panel C). This finding is consistent with
H1 articulated in Section II.B.
Splitting capital inflows to equity and debt inflows reveals that this association is only
significant for debt inflows and not equity inflows (Table 5, Panel B, Columns 3 to 6). Breaking
down inflows further shows that the distinction between equity and debt inflows remain and
that the association between debt inflows and industry growth is significant both for banks and
for nonbanks (Table 6). This confirms that composition of capital inflows matters for growth,
as H2 states in Section II.B, and shows that debt inflows positively affect growth.
Are the coefficients of interest we obtain, which measure the differential effect of capital
inflows in external-finance-dependent industries, economically meaningful? Consider an
industry such as electrical machinery (ISIC 383) that is at the 75th percentile of external
dependence and an industry such as leather and fur products (ISIC 323) that is at the 25th
percentile of external dependence. Focusing on Table 5, Panel B, Columns 2 and 6, the
coefficient estimate indicates that the difference in output growth rates between electrical
machinery and leather and fur products in Bulgaria—a country situated at the 75th percentile
in terms of total (debt) capital inflows—is 1.58 (1.71) percentage points higher than the
difference in output growth rate between the same industries in Indonesia—a country situated
at the 25th percentile in terms of total (debt) capital inflows. To confirm that these figures are
economically significant, we compare them to the average output growth rate over the period
1998–2007. We observe that the effect of total (debt) capital inflows accounts for about 14
percent (16 percent) of the sample growth mean of 11 percent.
Note also that our results are consistent with experiences in individual countries. For example,
Bulgaria experienced huge increases in total (debt) capital inflows from 6.3 percent (2.9
percent) in 1999 to as high as 47.4 percent (27.3 percent) in 2007. The country also enjoyed a
sharp bounce in its industry output growth from -15 percent to 27 percent over the same period.
However, the growth experience is heterogeneous across industries: sectors more dependent
on external finance (index greater than median) grew 4 percentage points faster on average
than the industries that are less dependent. For instance, non-electrical machinery (ISIC 382)
with high dependence on external finance grew about 20 percent more than leather and fur
products (ISIC 323) with low dependence on external finance.
Turning to growth volatility, equity inflows seem to reduce industry growth volatility (Table
7). Looking into the breakdown, this appears to be the case for FDI but not for portfolio
investment. As for debt inflows, we find very little evidence that this type of flows—either
through commercial banks or through nonbank financial institutions—are associated with a
reduction in output growth volatility. The coefficients on the interaction term between capital
17 As a side note, the coefficient on the capital inflow variable is also positive and significant throughout the
sample period. This, however, is subject to reverse causality concern: rather than capital inflows enhancing
growth, it is quite likely that higher growth attracts more capital inflows.
(continued…)
18
inflows and external finance dependence are negative but not statistically significant. These
findings are consistent with H3.18
Moving from an industry at the 25th percentile to an industry at the 75th percentile of external
dependence, industry growth volatility declines by about 1 percent if it is located in a country
at the 75th percentile rather than in a country at the 25th percentile of equity inflows.
Finally, we investigate whether the performance of the banking sector in the host country plays
a role in channeling foreign capital inflows to economic growth. We focus on three dimensions
of bank performance: competition, stability and profitability, and ownership structure. In Table
8, Panels A, B, and C show the results for each dimension, respectively. Competition is proxied
by the Boone indicator and with an index that summarizes the restrictions on financial
conglomerates. Stability is measured by the nonperforming loan ratio while profitability is
measured by return on assets. Ownership structure is captured by foreign bank and government
bank asset shares. In each panel, we present the regression results for two subsamples: below
the median of each variable versus above the median.
The results support the view that the better-functioning financial markets increase the capacity
of host countries in shaping the real effects of foreign capital inflows. Specifically, the results
suggest that, based on the comparison of the coefficient on the capital-inflow-dependence
interaction term: (i) a more competitive banking sector is a catalyst in reaping the benefits of
capital inflows by external finance dependent firms, and, interestingly, this is the case for both
equity and debt inflows, (ii) a more stable and more profitable banking system is instrumental
for these firms’ ability to convert debt inflows into stronger growth, and (iii) existence of
foreign and government banks seem to strengthen the capital inflows – growth nexus for debt
inflows.
B. Robustness Checks
We do a battery of robustness checks to ensure that our results are not driven by the choice of
variables or of the econometric specification.
Starting with the dependent variable, using value added growth rates instead of industrial
output growth rates does not alter the main message that debt inflows are associated with
stronger growth in the pre-crisis years (Table 9, Panel A). Similarly, the results are robust when
we use the share of value added as the dependent variable (Table 9, Panel B).
Furthermore, employing alternative measures of external finance dependence or correlates
such as R&D intensity deliver comparable results (Table 9, Panels C and D). The first of these
alternative measures follows Laeven and Valencia (2013), which in turn applies the Rajan-
18 One can argue that FDI tends to be more stable than debt flows but volatility in all types of flows may rise
during large global shocks and undo any volatility-reducing effects of FDI. In results not reported for the sake
of brevity, we examine the extent this negative relationship survives during the global financial crisis and find
that external-finance-dependent industries in countries that received more FDI flows in the pre-crisis period
experienced less growth volatility during the crisis.

19
Zingales methodology to compute external finance dependence (that is, calculating
dependence as capital expenditures minus cash flow from operations divided by capital
expenditures) to the sample period. In other words, we compute this measure using the same
formula but for the period 1998–2010, as an industry’s intrinsic need for external finance may
have changed over time due to changes in technology. The idea behind the second alternative
of using R&D intensity as a proxy comes from the observation that these companies tend to be
younger firms with more growth potential but less internal resources to finance investment and
output. An influx of capital and a relaxation of financing constraints could help them more
than it would others. A similar argument could also be made based on the ratio of tangible to
intangible assets in more R&D-intensive firms compared to less R&D-intensive companies.
The former tends to have more intangible assets and find it more difficult to pledge these as
collateral, and hence, are more credit-constrained.
Turning to the left-hand-side variables in our regressions, we next look at what happens when
we use alternative series for capital inflows. Using net instead of gross inflows does not alter
the findings (Table 10).19 In a related but different exercise, we use gross capital inflows data
put together by Bluedorn et al. (2013) instead of those reported by the IIF and again we get a
similar picture (Table 11). The only notable difference is the now marginally significant
coefficient on gross FDI inflows and external finance dependence interaction term.
Finally, we confirm the robustness of our results to different choices on econometric modelling
and sampling. Specifically, we estimate the coefficients using error terms clustered at the
industry or country level alone (rather than at the industry-country level), employing different
sets of fixed effects, excluding the top 5 industries in a particular country in a given year, and
introducing a term with the squared value of capital inflows to capture any nonlinear dynamics.
The results are shown in Table 12, Panels A, B, and C, respectively.20 They confirm the
findings from our baseline regressions.21
IV. CONCLUDING REMARKS
The risks associated with capital inflows (and their sudden stop) have been studied extensively
in the literature. In this paper, we look at the other side of the coin, that is, the possible benefits
of capital inflows in the form of stronger growth.
19 The IIF does not report bank lending (outward) and non-bank lending (outward) and, hence, it is not possible
to split the net debt inflows further into bank versus nonbank flows.
20 Note that in all of these robustness tests we also examine the effect of equity inflows on growth but again we
do not find any significant results. Thus, we present the results only for total capital inflows and debt inflows.
21 We also check the robustness of the results to adding more explanatory variables. Our baseline specification
already controls for a range of fixed effects, so not surprisingly controlling for a battery of country
characteristics such as trade openness and economic freedom does not alter the findings either. The results of
these additional robustness checks are not reported for the sake of brevity but are available from the authors
upon request.

20
Our identification strategy exploits any cross-industry differentials in the association between
different types of capital inflows and growth. Specifically, capital inflows are likely to increase
availability of credit (quantity) and reduce interest rates (cost of borrowing), and hence we
expect that industries more dependent on external finance grow disproportionately faster if
they are located in countries that host more capital inflows. We find that to be the case in the
pre-crisis period of 1998–2007: private capital inflows are associated with stronger growth in
industries that are more dependent on external finance. This association is driven by debt,
rather than equity, inflows. We also observe a reduction in output volatility but this association
is more pronounced for equity, rather than debt, inflows. These relationships break down
during the crisis, however. We also document that the inflows-growth nexus is stronger in
countries with well-functioning banks. These findings point to the need to take the composition
of capital inflows into account when assessing their costs and benefits. They also hint at the
importance of an undisrupted global financial system for emerging markets to harness the
growth benefits of capital inflows.
We acknowledge that the findings from the post-crisis period have limitations as we have used
only three years of data after the crisis. Future studies should use longer data to further examine
whether the positive relationship between debt-creating inflows and growth indeed breaks
down after the crisis, or may even have reversed itself. This is an important issue as the findings
have important policy implications for designing growth strategies. For example, policymakers
could accordingly decide between an external-finance driven growth model with long periods
of strong growth but subject to large negative shocks and high growth volatility versus a growth
model that targets a lower level of growth and volatility.

References
Agbloyor, E.K., Abor, J.Y., Adjasi, C.K., Yawson, A., 2014, “Private capital flows and
economic growth in Africa: The role of domestic financial markets,” International
Financial Markets, Institutions & Money, 30, 137–152.
Ahmed, S., Zlate, A., 2014, “Capital flows to emerging market economies: a brave new
world?” Journal of International Money and Finance, 48, 221–248.
Albuquerque, R., 2003, “The composition of international capital flows: risk sharing through
foreign direct investment,” Journal of International Economics, 61, 353–383.
Alfaro, L., Chanda, A., Kalemli-Ozcan, S., & Sayek, S., 2004, “FDI and economic growth:
The role of local financial markets,” Journal of International Economics, 64(1), 89–
112.
Alfaro, L., & Charlton, A., 2007, “Growth and the quality of foreign direct investment: Is All
FDI equal?” Working Paper, Harvard Business School and NBER.
Aizenman, J., Chinn, M., Ito, H., 2010, “The emerging global financial architecture: tracing
and evaluating new patterns of the trilemma configuration,” Journal of International
Money and Finance, 29(4), 615–641.
Aizenman, J., Jinjarak, Y., & Park, D., 2013, “Capital flows and economic growth in the era
of financial integration and crisis,” Open Economies Review, 24(3), 371–396.
Akkemik, K. A., 2009, “Industrial development in East Asia: A comparative look at Japan,
Korea, Taiwan, and Singapore”, Singapore: World Scientific Publishing.
Balasubramanyam, V.N., Salisu, M., Sapsford, D., 1996, “Foreign direct investment and
growth in EP and IS countries,” Economic Journal, 106, 92–105.
Barrios, S., Görg, H., Strobl, E., 2005, “Foreign direct investment, competition and industrial
development in the host country,” European Economic Review, 49 (7), 1761–1784.
Bekaert, G., Harvey, C.R., Lundblad, C., 2005, “Does financial liberalization spur growth?”
Journal of Financial Economics, 77, 3–55.
Benigno, G., Fornaro, L., 2014. “The financial resource curse,’ Scandinavian Journal of
Economics, 116 (1), 58-86.
Benigno, G., Converse, N., Fornaro, L., 2015. “Large capital inflows, sectoral allocation, and
economic performance,” Journal of International Money and Finance, 55, 60-87.
Berg, A., Borensztein, E., and Pattillo C., 2004, “Assessing Early Warning Systems: How
Have They Worked in Practice?” IMF Working Paper 04/52.

22
Bitzer, J., & Görg, H., 2009, “Foreign direct investment, competition and industry
performance,” World Economy, 32(2), 221–233.
Bluedorn, J., Duttagupta, R., Guajardo, J., and Topalova, P., 2013, “Capital Flows are Fickle:
Anytime, Anywhere” IMF Working Paper 13/183.
Bordo, M.D., Meissner, C.M., and Stuckler, D., 2010, “Foreign currency debt, financial
crises and economic growth: A long-run view,” Journal of International Money and
Finance, 29(4), 642–665.
Borensztein, E., Gregorio, J., & Lee, J., 1998, “How does foreign direct investment affect
economic growth?” Journal of International Economics, 45, 115–135.
Bosworth, B., Collins, S.M., 1999, “Capital flows to developing economies: implications for
saving and investment,” Brookings Papers on Economic Activity, 1, 143–169.
Caballero, J.A., 2014, “Do surges in international capital inflows influence the likelihood of
banking crises?” The Economic Journal, 126 (March), 281–316.
Calderon, C., Kubota, M., 2005, “Gross inflows gone wild: gross capital inflows, credit
booms, and crises,” World Bank Policy Research Working Paper no.6270.
Calvo, G., Reinhart, C., 2000. “When capital inflows come to a sudden stop: consequences
and policy options,” In: Kenen, P., Swoboda, A. (Eds.), Key Issues in Reform of the
International Monetary and Financial System. International Monetary Fund, pp. 175-
201.
Cetorelli, N., Gamberra, M., 2001, “Banking market structure, financial dependence and
growth: international evidence from industry data,” Journal of Finance 56, 617–648.
Choong, C.K., Baharumshah, A.Z., Yusop, Z., and Habibullah, M.S., 2010, “Private capital
flows, stock market and economic growth in developed and developing countries: A
comparative analysis,” Japan and the World Economy, 22, 107–117.
Claessens, S., Dooley, M. P., and Warner, A., 1995, “Portfolio Capital Flows: Hot or Cold?”
World Bank Economic Review, 9:153–74.
Claessens, S., Laeven, L., 2003, "Financial Development, Property Rights and Growth,"
Journal of Finance, 58, 24–36.
Claessens, S., Laeven, L., 2005, “Financial dependence, banking sector competition, and
economic growth,” Journal of the European Economic Association, 3(1), 179–207.
Davis, S. J., 2015, “The macroeconomic effects of debt-and equity-based capital inflows,”
Journal of Macroeconomics, 46, 81-95.

23
Dell’Ariccia, G., D. Igan, L. Laeven, H. Tong, 2016, “Credit booms and macrofinancial
stability,” Economic Policy 31 (86), 299–355.
Demirguc-Kunt, A., Maksimovic, V., 1998, “Law, finance and firm growth,” Journal of
Finance 53 (6), 2107–2131.
Durham, J. B., 2004, “Absorptive capacity and the effects of foreign direct investment and
equity foreign portfolio investment on economic growth,” European Economic
Review 48(2), 285–306.
Fernández, A.I., González, F., Suárez, N., 2013, “How do bank competition, regulation, and
institutions shape the real effect of banking crises? International evidence,” Journal
of International Money and Finance, 33, 19-40.
Ghosh, A. R., J. D. Ostry, and M. S. Qureshi, 2016, “When Do Capital Inflow Surges End in
Tears?” American Economic Review, 106 (5), 581–585.
Goldstein, I., Razin, A., 2006, “An information-based trade-off between foreign direct
investment and foreign portfolio investment,” Journal of International Economics,
70, 271–295.
Gourinchas, P.-O., Obstfeld, M., 2012, “Stories of the twentieth century for the twenty-first,”
American Economic Journal: Macroeconomics, 4 (1),226-265.
Gui-Diby, S. L., Renard, M.-F., 2015, “Foreign Direct Investment Inflows and the
Industrialization of African Countries,” World Development, 74, 43-57.
Harrison, A., Love, I., McMillian, M., 2004, “Global capital flows and financing
constraints,” Journal of Development Economics, 75 (1), 269–301.
Henry, P.B., 2000, “Stock market liberalization, economic reform and emerging market
equity prices,” Journal of Finance, 55 (2), 529 – 564.
Hermes, N., Lensink, R., 2003. “Foreign direct investment, financial development, and
economic growth,” Journal of Development Studies, 40, 142–163.
Hsu, P. H, Tian, X., and Xu, Y., 2014, “Financial Development and Innovation: Cross-
country Evidence,” Journal of Financial Economics, Volume 112, pp. 116–135.
Igan, D., and Tan, Z., 2015, “Capital Inflows, Credit Growth, and Financial Systems,” IMF
Working Paper 15/193.
Javorcik, B.S, 2004, “Does foreign direct investment increase the productivity of domestic
firms? In search of spillovers through backward linkages,” American Economic
Review, 94 (3), 605–627.

24
Koepke, R., 2015, “What Drives Capital Flows to Emerging Markets? A Survey of the
Empirical Literature,” Institute of International Finance Working Paper.
Kose, M. A., Prasad, E.S., and Terrones, M.E., 2009, “Does openness to international
financial flows raise productivity growth?”, Journal of International Money and
Finance, 28, 554-580.
Kroszner, R.S., Laeven, L. Klingebiel, D. 2007, "Banking crises, financial dependence, and
growth," Journal of Financial Economics, 84(1). 187-228.
Lane, P.R., McQuade, P., 2014, “Domestic credit growth and international capital flows,”
Scandinavian Journal of Economics, 116(1), 218–252.
Lane, P. R. and G. M. Milesi-Ferretti, 2007, “Capital flows to central and Eastern Europe,”
Emerging Markets Review, 8(2), 106–123.
Larrain, B., 2006, “Do banks affect the level and composition of industrial volatility?”
Journal of Finance, 61, 1897–1925.
Laeven, L., Valencia, F., 2013, “The Real Effects of Financial Sector Interventions during
Crises,” Journal of Money, Credit and Banking, 45, 147–17.
Levchenko, A. A., and Mauro, P., 2007, “Do Some Forms of Financial Flows Help Protect
Against Sudden Stops?” World Bank Economic Review, 21:389-411.
Li, X., Liu, X., 2005, “Foreign direct investment and economic growth: an increasingly
endogenous relationship,” World Development, 33, 393–407.
Love, I., 2003, “Financial development and financing constraints: international evidence
from the structural investment model,” Review of Financial Studies, 16 (3), 135–161.
Madura, J., 2012, International Corporate Finance (11th edition, International edition) South-
Western Cengage Learning. ISBN-13: 9781133947837.
Markusen, J. R., Venables, A. J. 1999, “Foreign direct investment as a catalyst for industrial
development,” European Economic Review, 43, 335–356.
Maskus, K. E., R. Neumann, and T. Seidel, 2012, “How national and international financial
development affect industrial R&D,” European Economic Review, 56(1), 72–83.
Mody, A. and A. P. Murshid, 2005, “Growing Up with Capital Flows,” Journal of
International Economics, 65 (1), 249–266.
Prasad, E., Rajan, R., Subramanian, A., 2007, “Foreign capital and economic growth,”
Brookings Papers on Economic Activity, 1, 153–209.

25
Raddatz, C., 2006, “Liquidity needs and vulnerability to financial underdevelopment,”
Journal of Financial Economics, 80, 677–722.
Rajan, R. Zingales, L., 1998, “Financial dependence and growth,” American Economic Review,
88, 559–587.
Reinhart, C.M., Rogoff, K.S., 2011, “From financial crash to debt crisis,” American Economic
Review, 101, 1676–1706.
Reis, R., 2013, “The Portuguese Slump and Crash and the Euro-crisis,” NBER Working Paper
No. 19288.
Reisen, H. and Soto, M., 2001, “Which Types of Capital Inflows Foster Developing-Country
Growth?” International Finance, 4, 1–14.
Rodrıguez-Clare, A., 1996, “Multinationals, linkages, and economic development,” American
Economic Review, 86(4), 852–873.
Tong, H., Wei, S.-J., 2011, “The composition matters: capital inflows and liquidity crunch
during a global economic crisis,” Review of Financial Studies, 24, 2023–2052.
Vu, T.B., Noy, I., 2009, “Sectoral analysis of foreign direct investment and growth in the
developed countries,” Journal of International Financial Markets, Institutions &
Money, 19(2), 402–13.

26
1998 2007 2008 2010 2014
Total private capital inflow s 153,953 1,261,256 682,401 1,213,139 1,048,077
Total equity inflow s 156,648 574,313 452,794 668,262 687,187
FDI 141,115 490,750 535,367 521,227 585,971
Portfolio investment 15,533 83,563 -82,573 147,035 101,216
Total debt inflow s -2,694 686,943 229,607 544,877 360,891
Bank lending -89,175 442,352 74,880 171,503 175,075
Non-bank lending 86,481 244,591 154,727 373,374 185,816
1998 2007 2008 2010 2014
Total private capital inflow s 100 100 100 100 100
Total equity inflow s 102 46 66 55 66
FDI 92 39 78 43 56
Portfolio investment 10 7 -12 12 10
Total debt inflow s -2 54 34 45 34
Bank lending -58 35 11 14 17
Non-bank lending 56 19 23 31 18
2008
Total private capital inflow s -46
Total equity inflow s -21
FDI 9 ^
Portfolio investment -199
Total debt inflow s -67
Bank lending -83
Non-bank lending -37
Panel C. Average growth (%)
13
1998-2007
22
15
16
34
587
-1 ^^
25
^^ We observe negative bank lending inflow s during 1998-2002. How ever, these inflow s
increased signif icantly over 2003-2007, and the average grow th over this period is 127 percent.
Table 1. Private Capital Inflows to 30 Emerging Market Economies
Panel A. Value (billion dollars)
Panel B. In percentage of total
Sources: IIF and ow n calculations.
^ FDI dropped in 2009 by 28 percent.
2010- 2014
12
6
10
380
38
315

27
Variable Definition Source
Industry Growth
Output grow thUNIDO database, and ow n
calculations
Value added grow thUNIDO database, and ow n
calculations
Growth Volatility
Output volatilityUNIDO database, and ow n
calculations
Value added volatilityUNIDO database, and ow n
calculations
Industry Characteristics
Dependence Rajan and Zingales (1998)
Capital Inflows
Private capital inf low s Institute of International Finance
Equity inflow s Institute of International Finance
Direct investment Institute of International Finance
Portfolio investment Institute of International Finance
Debt inflow s Institute of International Finance
Commercial banks Institute of International Finance
Non-banks Institute of International Finance
Controls
ShareUNIDO database, and ow n
calculations
CreditWorld Bank: World Development
Indicators Database
Banking System Characteristics
Boone indicatorWorld Bank: Global Financial
Development Database
Restrictions on f inancial
conglomerate
World Bank surveys on bank
regulation
NPLsWorld Bank: Global Financial
Development Database
ROAWorld Bank: Global Financial
Development Database
Foreign bank penetrationWorld Bank surveys on bank
regulation
Government bank
penetration
World Bank surveys on bank
regulationThe extent to w hich the banking system's assets are government ow ned.
Sum of the ratio of domestic credit to private sector to GDP and the ratio of stock market
capitalization of listed companies to GDP of a country in a given year.
Ratio of defaulting loans (payments of interest and principal past due by 90 days or
more) to total gross loans (total value of loan portfolio).
Commercial banks’ net income to yearly averaged total assets.
A measure of degree of competition based on profit-eff iciency in the banking market. It is
calculated as the elasticity of profits to marginal costs. An increase in the Boone
indicator implies a deterioration of the competitive conduct of f inancial intermediaries.
A variable that ranges from zero to tw elve, w ith tw elve indicating the highest
restrictions on bank conglomerate. The f inancial conglomerate includes the extent to
w hich banks may ow n and control nonfinancial f irms, the extent to w hich nonfinancial
f irms may ow n and control banks, and the extent to w hich nonbank f inancial f irms may
ow n and control banks.
The extent to w hich the banking system's assets are foreign ow ned.
Table 2. Definitions and Sources of Variables
Grow th rate of real output in a particular sector in each country. UNIDO reports nominal
data in U.S. dollars. Nominal value added deflated using producer price index of f inished
goods index (taken from Economic Research, Federal Reserve Bank of St. Louis).
Grow th rate of real value added in a particular sector in each country. Value added is
the net output of a sector after adding up all outputs and subtracting intermediate inputs.
Nominal value added deflated using producer price index of f inished goods index.
The value added of each sector divided by the total value added of all sectors in a
country in each year.
Flow s of capital (both equity and debt) from foreign private sector investors and lenders
to emerging economies, as % of GDP. Note that foreign investors’ w ithdraw als of capital
are subtracted.
Net inflow s of direct and portfolio equity capital, including reinvestment of earnings on
equity investment, as % of GDP.
Net inflow s of direct equity capital, including reinvestment of earnings on direct equity
Standard deviation of the annual grow th rate of real output in a particular sector in each
country, using a f ive-year rolling w indow .
Standard deviation of the annual grow th rate of real value added in a particular sector in
each country, using a f ive-year rolling w indow .
Net inflow s of portfolio equity capital, including reinvestment of earnings on portfolio
equity investment, as % of GDP.
Sum of commercial bank lending and lending from non-bank sources.
Net disbursements from commercial banks (excluding credits guaranteed or insured
under credit programs of creditor governments), as % of GDP. This generally includes
bond purchases by commercial banks.
Net external f inancing provided by all other private creditors, as % of GDP. This includes
f low s from nonbank sources into bond markets, as w ell as deposits in local banks by
nonresidents other than banks.
Measure of an industry's dependence on external f inance, defined as 1 minus industry
cash f low over industry investment of large publicly traded U.S. f irms.
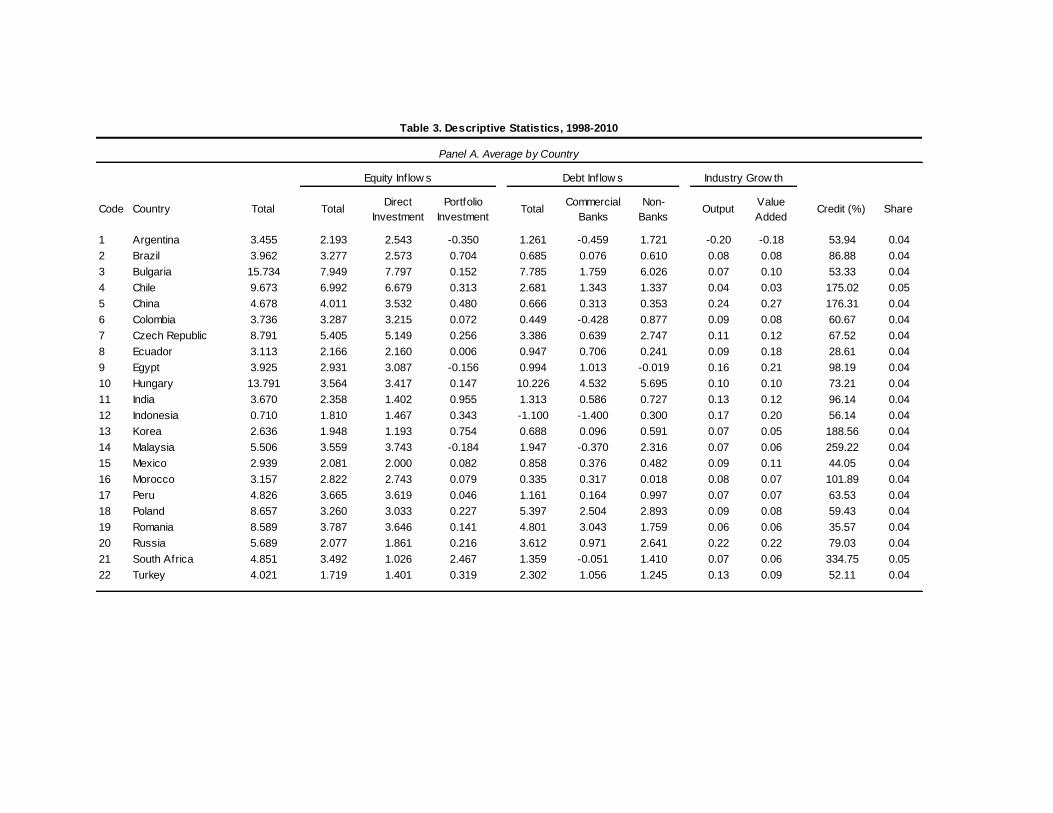
Code Country Total TotalDirect
Investment
Portfolio
InvestmentTotal
Commercial
Banks
Non-
BanksOutput
Value
AddedCredit (%) Share
1 Argentina 3.455 2.193 2.543 -0.350 1.261 -0.459 1.721 -0.20 -0.18 53.94 0.04
2 Brazil 3.962 3.277 2.573 0.704 0.685 0.076 0.610 0.08 0.08 86.88 0.04
3 Bulgaria 15.734 7.949 7.797 0.152 7.785 1.759 6.026 0.07 0.10 53.33 0.04
4 Chile 9.673 6.992 6.679 0.313 2.681 1.343 1.337 0.04 0.03 175.02 0.05
5 China 4.678 4.011 3.532 0.480 0.666 0.313 0.353 0.24 0.27 176.31 0.04
6 Colombia 3.736 3.287 3.215 0.072 0.449 -0.428 0.877 0.09 0.08 60.67 0.04
7 Czech Republic 8.791 5.405 5.149 0.256 3.386 0.639 2.747 0.11 0.12 67.52 0.04
8 Ecuador 3.113 2.166 2.160 0.006 0.947 0.706 0.241 0.09 0.18 28.61 0.04
9 Egypt 3.925 2.931 3.087 -0.156 0.994 1.013 -0.019 0.16 0.21 98.19 0.04
10 Hungary 13.791 3.564 3.417 0.147 10.226 4.532 5.695 0.10 0.10 73.21 0.04
11 India 3.670 2.358 1.402 0.955 1.313 0.586 0.727 0.13 0.12 96.14 0.04
12 Indonesia 0.710 1.810 1.467 0.343 -1.100 -1.400 0.300 0.17 0.20 56.14 0.04
13 Korea 2.636 1.948 1.193 0.754 0.688 0.096 0.591 0.07 0.05 188.56 0.04
14 Malaysia 5.506 3.559 3.743 -0.184 1.947 -0.370 2.316 0.07 0.06 259.22 0.04
15 Mexico 2.939 2.081 2.000 0.082 0.858 0.376 0.482 0.09 0.11 44.05 0.04
16 Morocco 3.157 2.822 2.743 0.079 0.335 0.317 0.018 0.08 0.07 101.89 0.04
17 Peru 4.826 3.665 3.619 0.046 1.161 0.164 0.997 0.07 0.07 63.53 0.04
18 Poland 8.657 3.260 3.033 0.227 5.397 2.504 2.893 0.09 0.08 59.43 0.04
19 Romania 8.589 3.787 3.646 0.141 4.801 3.043 1.759 0.06 0.06 35.57 0.04
20 Russia 5.689 2.077 1.861 0.216 3.612 0.971 2.641 0.22 0.22 79.03 0.04
21 South Africa 4.851 3.492 1.026 2.467 1.359 -0.051 1.410 0.07 0.06 334.75 0.05
22 Turkey 4.021 1.719 1.401 0.319 2.302 1.056 1.245 0.13 0.09 52.11 0.04
Table 3. Descriptive Statistics, 1998-2010
Panel A. Average by Country
Equity Inflow s Debt Inflow s Industry Grow th

29
Table 3: Continued …
Row IndustryISIC
Rev. 2Output
Value
Added Dependence Share
1 Food products 311 0.13 0.15 0.14 0.14
2 Beverages 313 0.06 0.07 0.08 0.05
3 Tobacco 314 0.04 0.05 -0.45 0.02
4 Textiles 321 0.06 0.03 0.40 0.04
5 Wearing apparel, except footw ear 322 0.04 0.05 0.03 0.04
6 Leather and fur products 323 0.03 0.04 -0.14 0.00
7 Footw ear, except rubber or plastic 324 0.05 0.08 -0.08 0.01
8 Wood products, except furniture 331 0.10 0.10 0.28 0.02
9 Furniture and fixtures, excel. metal 332 0.11 0.10 0.24 0.02
10 Paper products 341 0.08 0.10 0.18 0.03
11 Printing and publishing 342 0.07 0.07 0.20 0.02
12 Industrial chemicals 351 0.15 0.14 0.25 0.06
13 Other chemical product 352 0.08 0.09 0.22 0.06
14 Petroleum refineries 353 0.18 0.18 0.04 0.10
15 Misc. petroleum and coal products 354 0.16 0.18 0.33 0.01
16 Rubber products 355 0.11 0.10 0.23 0.01
17 Plastic products 356 0.11 0.11 1.14 0.03
18 Pottery, china, earthenw are 361 0.11 0.09 -0.15 0.00
19 Glass and products 362 0.09 0.10 0.53 0.01
20 Other non-metallic mineral products 369 0.12 0.15 0.06 0.05
21 Iron and steel 371 0.11 0.14 0.09 0.05
22 Non-ferrous metals 372 0.12 0.14 0.01 0.04
23 Fabricated metal products 381 0.11 0.11 0.24 0.05
24 Non-electrical machinery 382 0.09 0.11 0.45 0.06
25 Electrical machinery 383 0.10 0.07 0.77 0.07
26 Transport equipment 384 0.14 0.12 0.31 0.08
27 Professional and scientif ic equipment 385 0.10 0.10 0.96 0.01
28 Other manufacturing 390 0.08 0.07 0.47 0.01
Panel B. Average by Industry
369
2720, 2732
281, 289
291, 292, 2930, 3000
2213, 2230, 3110, 3120, 3130, 3140, 3150, 3190,
3410, 3420, 3430, 351, 3520, 3530, 359
331, 3320, 3330
2710, 2731
251
2520
2310
151, 1520, 153, 154
155
1600
171, 172, 1730
1820, 191
1920
2010, 202
3610
210
2211, 2212, 2219, 222
2330, 241, 2421, 2430
2422, 2423, 2424, 2429
ISIC
Rev. 3
1810
2691
2610
2692, 2693, 2694, 2695, 2696, 2699
2320

30
Table 3: Concluded
Variable N Mean S.D. Min25th
percentileMedian
75th
percentileMax
Private Capital Inflow ct 286 5.730 5.820 -7.900 2.630 4.700 8.120 47.380
Equity Inflow ct 286 3.380 2.590 -2.420 1.750 2.950 4.500 20.110
Direct Investmentct 286 3.060 2.510 -2.090 1.450 2.490 3.980 19.880
Portfolio Investmentct 286 0.320 1.150 -4.640 -0.050 0.090 0.530 6.590
Debt Inflow ct 286 2.350 4.410 -9.910 0.100 1.570 4.020 27.270
Commercial Banksct 286 0.760 2.860 -14.760 -0.370 0.550 1.680 12.520
Non-Banksct 286 1.590 2.750 -7.280 0.000 0.900 2.480 17.920
Output Grow thict 5649 0.10 0.32 -0.80 -0.04 0.08 0.21 1.81
Value Added Grow thict 5496 0.10 0.40 -0.85 -0.07 0.06 0.21 2.24
Creditct 286 102.00 82.10 10.06 46.23 73.58 136.26 458.81
Shareict 6113 0.04 0.05 -0.01 0.01 0.02 0.05 0.60
Dependencei 28 0.24 0.32 -0.45 0.05 0.23 0.37 1.14
Panel C. Summary Statistics

Countries w ith
low capital
inflow s (25th p.)
Countries w ith
high capital
inflow s (75th p.)
Difference
(1) High dependent industries (75th p.) 0.08 0.12 0.04
(2) Less dependent industries (25th p.) 0.07 0.10 0.03
Difference-in-difference = 0.01 0.02 0.01
Countries w ith
low capital
inflow s (25th p.)
Countries w ith
high capital
inflow s (75th p.)
Difference
(3) High dependent industries (75th p.) 0.12 0.10 -0.02
(4) Less dependent industries (25th p.) 0.09 0.10 0.01
Difference-in-difference = 0.03 0.00 -0.03
Countries w ith
low capital
inflow s (25th p.)
Countries w ith
high capital
inflow s (75th p.)
Difference
(5) High dependent industries (75th p.) 0.04 0.12 0.08
(6) Less dependent industries (25th p.) 0.05 0.11 0.06
Difference-in-difference = -0.01 0.01 0.02
Table 4. Industry Growth at times of Low vs High Capital Inflows
Panel A. Total Capital Inflows
Panel B. Equity Capital Inflows
Panel C. Debt Capital Inflows

32
Table 5. Capital Flows and Industry Growth This table reports the results estimating 𝐺𝑟𝑜𝑤𝑡ℎ𝑖𝑐𝑡 = 𝜔0 + 𝜔1. 𝑆ℎ𝑎𝑟𝑒𝑖,𝑐,𝑡−1 + 𝜔2. 𝐶𝑎𝑝𝑖𝑡𝑎𝑙_𝐼𝑛𝑓𝑙𝑜𝑤𝑐,𝑡 + 𝜔3. 𝐶𝑎𝑝𝑖𝑡𝑎𝑙_𝐼𝑛𝑓𝑙𝑜𝑤𝑐,𝑡 ∗
𝐷𝑒𝑝𝑒𝑛𝑑𝑒𝑛𝑐𝑒𝑖 + 𝜔4. 𝐶𝑟𝑒𝑑𝑖𝑡𝑐,𝑡 + 𝜔5. 𝐶𝑟𝑒𝑑𝑖𝑡𝑐,𝑡 ∗ 𝐷𝑒𝑝𝑒𝑛𝑑𝑒𝑛𝑐𝑒𝑖 + 𝜃𝑖 + 𝜃𝑐 + 𝜃𝑖𝑐 + 𝜃𝑡 + 𝜀𝑖,𝑐,𝑡 where 𝑖, 𝑐 and 𝑡 denote industry 𝑖 in country 𝑐 in year 𝑡. 𝐺𝑟𝑜𝑤𝑡ℎ is industry growth: growth in real output. 𝑆ℎ𝑎𝑟𝑒 is the share of value added of each industry to total value added of all industries in a country, one period lag. 𝐷𝑒𝑝𝑒𝑛𝑑𝑒𝑛𝑐𝑒 is Rajan and Zingales’ (1998) measure of industries’ dependence on external finance. 𝐶𝑎𝑝𝑖𝑡𝑎𝑙_𝐼𝑛𝑓𝑙𝑜𝑤 is a vector of private capital inflow variables. 𝐶𝑟𝑒𝑑𝑖𝑡 is sum of domestic credit to private sector and stock market capitalization. See Table 2 for detailed definition of variables. 𝜃𝑖, 𝜃𝑐, 𝜃𝑖𝑐 and 𝜃𝑡 denote the dummies for industry, country, industry*country, and year respectively. Regressions are estimated using OLS. The statistical inferences are based on robust standard errors (associated t-values reported in parentheses) clustered by industry-country level. ***, **, and * denote statistical significance at the 1%, 5%, and 10% levels, respectively. Our sample includes 28 industries with three-digit ISIC, Rev.2 for 22 emerging economies over 1998-2010. In Panel A, 𝐶𝑟𝑖𝑠𝑖𝑠 is a dummy variable that takes the value of 1 for the global financial crisis period 2008-09, and 0 otherwise.
[1] [2] [3] [4] [5] [6]
Crisis -0.100 -0.086 -0.090 -0.076 -0.100 -0.096
(-1.28) (-1.09) (-1.15) (-0.96) (-1.28) (-1.21)
Share (t-1) -4.421*** -4.423*** -4.442*** -4.445*** -4.417*** -4.418***
(-5.31) (-5.31) (-5.37) (-5.38) (-5.28) (-5.28)
Capital_Inflow 0.008*** 0.008*** 0.008*** 0.008*** 0.010*** 0.010***
(7.24) (7.28) (3.65) (3.95) (6.04) (5.96)
Capital_Inflow * Dependence 0.002 0.002 0.002 0.002 0.003 0.002
(0.80) (0.64) (0.52) (0.41) (0.69) (0.54)
Credit -0.000 -0.000 -0.000
(-1.45) (-1.48) (-0.59)
Credit * Dependence 0.000 0.000 0.000
(0.55) (0.75) (0.55)
Constant 0.725*** 0.747*** 0.718*** 0.739*** 0.740*** 0.748***
(3.52) (3.62) (3.50) (3.60) (3.58) (3.61)
N 5524 5524 5524 5524 5524 5524
R 2 0.245 0.245 0.237 0.237 0.245 0.245
Share (t-1) -5.002*** -5.008*** -5.018*** -5.019*** -5.009*** -5.015***
(-5.33) (-5.35) (-5.40) (-5.40) (-5.33) (-5.35)
Capital_Inflow 0.004** 0.004** 0.003 0.003 0.005** 0.005**
(2.52) (2.35) (1.03) (1.27) (2.51) (2.25)
Capital_Inflow * Dependence 0.008** 0.009** 0.004 0.003 0.013*** 0.014***
(2.34) (2.35) (0.73) (0.63) (2.93) (2.90)
Credit -0.000 -0.000 -0.000
(-0.89) (-1.38) (-0.36)
Credit * Dependence -0.000 0.000 -0.000
(-0.71) (0.60) (-0.81)
Constant 0.856*** 0.877*** 0.853*** 0.876*** 0.867*** 0.879***
(3.75) (3.83) (3.76) (3.84) (3.79) (3.83)
N 4396 4396 4396 4396 4396 4396
R 2 0.257 0.258 0.252 0.252 0.259 0.259
Equity Inflow s Debt Inflow sTotal Inflow s
Panel A. Whole sample period: 1998-2010
Panel B. Pre-crisis period: 1998-2007

33
[1] [2] [3] [4] [5] [6]
Share (t-1) -8.956*** -8.953*** -8.848*** -8.881*** -8.950*** -8.932***
(-6.97) (-6.98) (-6.95) (-7.05) (-6.94) (-6.92)
Capital_Inflow 0.015** 0.015** 0.037** 0.046** 0.017** 0.016**
(2.35) (2.27) (2.17) (2.34) (2.15) (2.06)
Capital_Inflow * Dependence -0.021 -0.023 -0.029 -0.051 -0.029 -0.028
(-1.44) (-1.54) (-0.75) (-1.19) (-1.52) (-1.52)
Credit -0.000 -0.002* 0.000
(-0.49) (-1.83) (0.70)
Credit * Dependence 0.004** 0.005** 0.003**
(2.38) (2.17) (2.11)
Constant 1.509*** 1.502*** 1.466*** 1.573*** 1.541*** 1.463***
(7.56) (7.28) (7.34) (7.64) (7.69) (7.08)
N 1128 1128 1128 1128 1128 1128
R 2 0.535 0.542 0.528 0.536 0.531 0.538
All panels:
Industry FE Yes Yes Yes Yes Yes Yes
Country FE Yes Yes Yes Yes Yes Yes
Industry*Country FE Yes Yes Yes Yes Yes Yes
Year FE Yes Yes Yes Yes Yes Yes
# Countries 22 22 22 22 22 22
# Industries 28 28 28 28 28 28
Panel C. Crisis period: 2008-2010
Total Inflow s Equity Inflow s Debt Inflow s

Table 6. Capital Flows and Industry Growth: Breaking Down Equity and Debt Inflows This table reports the results estimating 𝐺𝑟𝑜𝑤𝑡ℎ𝑖𝑐𝑡 = 𝜔0 + 𝜔1. 𝑆ℎ𝑎𝑟𝑒𝑖,𝑐,𝑡−1 + 𝜔2. 𝐶𝑎𝑝𝑖𝑡𝑎𝑙_𝐼𝑛𝑓𝑙𝑜𝑤𝑐,𝑡 + 𝜔3. 𝐶𝑎𝑝𝑖𝑡𝑎𝑙_𝐼𝑛𝑓𝑙𝑜𝑤𝑐,𝑡 ∗ 𝐷𝑒𝑝𝑒𝑛𝑑𝑒𝑛𝑐𝑒𝑖 + 𝜔4. 𝐶𝑟𝑒𝑑𝑖𝑡𝑐,𝑡 + 𝜔5. 𝐶𝑟𝑒𝑑𝑖𝑡𝑐,𝑡 ∗ 𝐷𝑒𝑝𝑒𝑛𝑑𝑒𝑛𝑐𝑒𝑖 +
𝜃𝑖 + 𝜃𝑐 + 𝜃𝑖𝑐 + 𝜃𝑡 + 𝜀𝑖,𝑐,𝑡 where 𝑖, 𝑐 and 𝑡 denote industry 𝑖 in country 𝑐 in year 𝑡. 𝐺𝑟𝑜𝑤𝑡ℎ is industry growth: growth in real output. 𝑆ℎ𝑎𝑟𝑒 is the share of value added of each industry to total value added of all industries in a country, one period lag. 𝐷𝑒𝑝𝑒𝑛𝑑𝑒𝑛𝑐𝑒 is Rajan and Zingales’ (1998) measure of industries’ dependence on external finance. 𝐶𝑎𝑝𝑖𝑡𝑎𝑙_𝐼𝑛𝑓𝑙𝑜𝑤 is a vector of private capital inflow variables. 𝐶𝑟𝑒𝑑𝑖𝑡 is sum of domestic credit to private sector and stock market capitalization. See Table 2 for detailed definition of variables. 𝜃𝑖, 𝜃𝑐, 𝜃𝑖𝑐 and 𝜃𝑡 denote the dummies for industry, country, industry*country and year respectively. Regressions are estimated using OLS. The statistical inferences are based on robust standard errors (associated t-values reported in parentheses) clustered by industry-country level. ***, **, and * denote statistical significance at the 1%, 5%, and 10% levels, respectively. Our sample includes 28 industries with three-digit ISIC, Rev.2 for 22 emerging economies over 1998-2007.
[1] [2] [3] [4] [5] [6] [7] [8]
Share (t-1) -5.022*** -5.023*** -5.020*** -5.021*** -5.012*** -5.017*** -5.020*** -5.022***
(-5.40) (-5.40) (-5.41) (-5.42) (-5.36) (-5.38) (-5.35) (-5.36)
Capital_Inflow 0.002 0.002 0.007 0.009 0.005 0.004 0.007* 0.007*
(0.58) (0.69) (1.24) (1.60) (1.34) (1.14) (1.85) (1.82)
Capital_Inflow * Dependence 0.005 0.004 0.001 -0.001 0.020*** 0.022*** 0.014** 0.014*
(0.80) (0.69) (0.05) (-0.04) (2.71) (2.67) (2.02) (1.91)
Credit -0.000 -0.000 -0.000 -0.000
(-1.13) (-1.49) (-0.32) (-0.85)
Credit * Dependence 0.000 0.000 -0.000 0.000
(0.64) (0.73) (-0.76) (0.01)
Constant 0.852*** 0.871*** 0.868*** 0.898*** 0.866*** 0.876*** 0.862*** 0.879***
(3.75) (3.82) (3.82) (3.94) (3.79) (3.82) (3.78) (3.84)
Industry FE Yes Yes Yes Yes Yes Yes Yes Yes
Country FE Yes Yes Yes Yes Yes Yes Yes Yes
Industry*Country FE Yes Yes Yes Yes Yes Yes Yes Yes
Year FE Yes Yes Yes Yes Yes Yes Yes Yes
# Countries 22 22 22 22 22 22 22 22
# Industries 28 28 28 28 28 28 28 28
N 4396 4396 4396 4396 4396 4396 4396 4396
R 2 0.252 0.252 0.252 0.252 0.256 0.256 0.256 0.256
Equity Inflow s Debt Inflow s
Direct Investment Portfolio Investment Commercial Banks Non-Banks

Table 7. Capital Flows and Industry Growth Volatility This table reports the results estimating 𝑉𝑜𝑙𝑎𝑡𝑖𝑙𝑖𝑡𝑦𝑖𝑐𝑡 = 𝜔0 + 𝜔1. 𝑆ℎ𝑎𝑟𝑒𝑖,𝑐,𝑡−1 + 𝜔2. 𝐶𝑎𝑝𝑖𝑡𝑎𝑙_𝐼𝑛𝑓𝑙𝑜𝑤𝑐,𝑡 + 𝜔3. 𝐶𝑎𝑝𝑖𝑡𝑎𝑙_𝐼𝑛𝑓𝑙𝑜𝑤𝑐,𝑡 ∗
𝐷𝑒𝑝𝑒𝑛𝑑𝑒𝑛𝑐𝑒𝑖 + 𝜔4. 𝐶𝑟𝑒𝑑𝑖𝑡𝑐,𝑡 + 𝜔5. 𝐶𝑟𝑒𝑑𝑖𝑡𝑐,𝑡 ∗ 𝐷𝑒𝑝𝑒𝑛𝑑𝑒𝑛𝑐𝑒𝑖 + 𝜃𝑖 + 𝜃𝑐 + 𝜃𝑖𝑐 + 𝜃𝑡 + 𝜀𝑖,𝑐,𝑡 where 𝑖, 𝑐 and 𝑡 denote industry 𝑖 in country 𝑐 in year 𝑡. 𝑉𝑜𝑙𝑎𝑡𝑖𝑙𝑖𝑡𝑦 is industry growth volatility: standard deviation of growth in real output or real value added. 𝑆ℎ𝑎𝑟𝑒 is the share of value added of each industry to total value added of all industries in a country, one period lag. 𝐷𝑒𝑝𝑒𝑛𝑑𝑒𝑛𝑐𝑒 is Rajan and Zingales’ (1998) measure of industries’ dependence on external finance. 𝐶𝑎𝑝𝑖𝑡𝑎𝑙_𝐼𝑛𝑓𝑙𝑜𝑤 is a vector of private capital inflow variables. 𝐶𝑟𝑒𝑑𝑖𝑡 is sum of domestic credit to private sector and stock market capitalization. See Table 2 for detailed definition of variables. 𝜃𝑖, 𝜃𝑐, 𝜃𝑖𝑐 and 𝜃𝑡 denote the dummies for industry, country, industry*country and year respectively. Regressions are estimated using OLS. The statistical inferences are based on robust standard errors (associated t-values reported in parentheses) clustered by industry-country level. ***, **, and * denote statistical significance at the 1%, 5%, and 10% levels, respectively. Our sample includes 28 industries with three-digit ISIC, Rev.2 for 22 emerging economies over 1998-2007.
Total TotalDirect
Investment
Portfolio
InvestmentTotal
Commercial
BanksNon-Banks
[1] [2] [3] [4] [5] [6] [7]
Share (t-1) 0.406 0.403 0.409 0.408 0.408 0.418 0.395
(1.56) (1.54) (1.58) (1.55) (1.57) (1.62) (1.52)
Capital_Inflow 0.000 0.001 0.002 -0.005 0.000 0.004* -0.003
(0.21) (0.38) (0.96) (-1.22) (0.06) (1.83) (-1.24)
Capital_Inflow * Dependence -0.003** -0.007** -0.007** -0.004 -0.003 -0.006 -0.003
(-1.99) (-2.12) (-2.00) (-0.38) (-1.43) (-1.48) (-0.81)
Credit 0.000 0.000 0.000 0.000 0.000 0.000 0.000
(0.53) (0.72) (0.60) (1.30) (0.54) (0.65) (0.59)
Credit * Dependence -0.000 -0.001 -0.001 -0.001* -0.001 -0.001 -0.001*
(-1.26) (-1.42) (-1.49) (-1.92) (-1.52) (-1.50) (-1.77)
Constant 0.033 0.032 0.029 0.023 0.031 0.042 0.039
(0.50) (0.50) (0.45) (0.34) (0.49) (0.65) (0.60)
N 3057 3057 3057 3057 3057 3057 3057
R 20.770 0.770 0.770 0.770 0.770 0.770 0.770
Share (t-1) 0.441 0.432 0.438 0.439 0.443 0.445 0.431
(0.88) (0.86) (0.87) (0.87) (0.88) (0.89) (0.86)
Capital_Inflow 0.001 0.002 0.004 -0.007 0.001 0.004 0.000
(0.74) (0.68) (1.16) (-1.56) (0.67) (1.19) (0.03)
Capital_Inflow * Dependence -0.004* -0.007 -0.010* 0.010 -0.004* -0.007 -0.005
(-1.86) (-1.40) (-1.93) (1.36) (-1.83) (-1.51) (-1.32)
Credit -0.000 -0.000 -0.000 -0.000 -0.000 -0.000 -0.000
(-0.89) (-0.76) (-0.82) (-0.24) (-0.74) (-0.66) (-0.69)
Credit * Dependence 0.000 -0.000 -0.000 -0.000 -0.000 -0.000 -0.000
(0.25) (-0.16) (-0.08) (-0.95) (-0.02) (-0.13) (-0.37)
Constant 0.103 0.101 0.096 0.095 0.104 0.113 0.105
(0.83) (0.81) (0.77) (0.76) (0.84) (0.91) (0.84)
N 3026 3026 3026 3026 3026 3026 3026
R 20.789 0.789 0.789 0.789 0.789 0.789 0.789
All panels:
Industry FE Yes Yes Yes Yes Yes Yes Yes
Country FE Yes Yes Yes Yes Yes Yes Yes
Industry*Country FE Yes Yes Yes Yes Yes Yes Yes
Year FE Yes Yes Yes Yes Yes Yes Yes
# Countries 22 22 22 22 22 22 22
# Industries 28 28 28 28 28 28 28
Equity Inflow s Debt Inflow s
Panel A. Output volatility
Panel B. Value added volatility

Table 8. Capital Flows and Industry Growth: Role of the Banking System This table reports the results estimating 𝐺𝑟𝑜𝑤𝑡ℎ𝑖𝑐𝑡 = 𝜔0 + 𝜔1. 𝑆ℎ𝑎𝑟𝑒𝑖,𝑐,𝑡−1 + 𝜔2. 𝐶𝑎𝑝𝑖𝑡𝑎𝑙_𝐼𝑛𝑓𝑙𝑜𝑤𝑐,𝑡 + 𝜔3. 𝐶𝑎𝑝𝑖𝑡𝑎𝑙_𝐼𝑛𝑓𝑙𝑜𝑤𝑐,𝑡 ∗ 𝐷𝑒𝑝𝑒𝑛𝑑𝑒𝑛𝑐𝑒𝑖 + 𝜔4. 𝐶𝑟𝑒𝑑𝑖𝑡𝑐,𝑡 + 𝜔5. 𝐶𝑟𝑒𝑑𝑖𝑡𝑐,𝑡 ∗ 𝐷𝑒𝑝𝑒𝑛𝑑𝑒𝑛𝑐𝑒𝑖 +
𝜃𝑖 + 𝜃𝑐 + 𝜃𝑖𝑐 + 𝜃𝑡 + 𝜀𝑖,𝑐,𝑡 where 𝑖, 𝑐 and 𝑡 denote industry 𝑖 in country 𝑐 in year 𝑡. Each panel displays the results obtained by running the regression in a subsample determined by the median value of various banking system characteristics. 𝐺𝑟𝑜𝑤𝑡ℎ is industry growth: growth in real output. 𝑆ℎ𝑎𝑟𝑒 is the share of value added of each industry to total value added of all industries in a country, one period lag. 𝐷𝑒𝑝𝑒𝑛𝑑𝑒𝑛𝑐𝑒 is Rajan and Zingales’ (1998) measure of industries’ dependence on external finance. 𝐶𝑎𝑝𝑖𝑡𝑎𝑙_𝐼𝑛𝑓𝑙𝑜𝑤 is a vector of private capital inflow variables. 𝐶𝑟𝑒𝑑𝑖𝑡 is sum of domestic credit to private sector and stock market capitalization. See Table 2 for detailed definition of variables. 𝜃𝑖, 𝜃𝑐, 𝜃𝑖𝑐 and 𝜃𝑡 denote the dummies for industry, country, industry*country and year respectively. Regressions are estimated using OLS. The statistical inferences are based on robust standard errors (associated t-values reported in parentheses) clustered by industry-country level. ***, **, and * denote statistical significance at the 1%, 5%, and 10% levels, respectively. Our sample includes 28 industries with three-digit ISIC, Rev.2 for 22 emerging economies over 1998-2007.

37
Panel A. Competition
Total TotalDirect
Investment
Portfolio
InvestmentTotal
Commercial
BanksNon-Banks Total Total
Direct
Investment
Portfolio
InvestmentTotal
Commercial
BanksNon-Banks
[1] [2] [3] [4] [5] [6] [7] [8] [9] [10] [11] [12] [13] [14]
Boone indicator
Share (t-1) -3.345*** -3.335*** -3.343*** -3.316*** -3.336*** -3.361*** -3.318*** -6.339*** -6.444*** -6.424*** -6.415*** -6.339*** -6.335*** -6.387***
(-3.31) (-3.33) (-3.33) (-3.39) (-3.28) (-3.31) (-3.28) (-6.14) (-6.19) (-6.18) (-6.16) (-6.22) (-6.23) (-6.19)
Capital_Inflow 0.000 -0.003 -0.004 0.012 0.002 -0.004 0.005 0.011*** 0.001 0.000 0.003 0.012*** 0.021*** 0.007
(0.10) (-0.84) (-1.28) (1.06) (0.77) (-0.99) (1.54) (2.90) (0.23) (0.00) (0.38) (2.94) (3.80) (0.58)
Capital_Inflow * Dependence 0.012*** 0.015** 0.010* 0.047 0.015*** 0.025*** 0.016** 0.004 -0.020 -0.018 -0.022 0.015 0.024 0.017
(2.75) (2.20) (1.76) (1.23) (3.15) (2.99) (2.08) (0.46) (-1.64) (-1.29) (-1.32) (1.57) (1.42) (0.72)
Credit 0.000 0.000 0.000 -0.000 0.000 0.000 0.000 -0.001 -0.001 -0.001* -0.001 -0.000 -0.001 -0.001
(0.80) (0.31) (0.30) (-0.97) (1.10) (0.97) (0.29) (-1.62) (-1.59) (-1.67) (-1.55) (-1.47) (-1.64) (-1.51)
Credit * Dependence -0.001** -0.001 -0.000 -0.001 -0.001** -0.001* -0.001 0.000 0.000 0.001 0.000 0.000 0.000 0.001
(-2.11) (-1.20) (-0.82) (-0.90) (-2.04) (-1.89) (-1.25) (0.88) (0.80) (0.98) (0.82) (0.41) (0.11) (0.92)
Constant 0.427** 0.429** 0.433** 0.449*** 0.429** 0.425** 0.435** 1.180*** 1.208*** 1.208*** 1.198*** 1.224*** 1.233*** 1.200***
(2.54) (2.57) (2.58) (2.69) (2.53) (2.51) (2.57) (4.36) (4.43) (4.41) (4.36) (4.56) (4.60) (4.41)
N 2189 2189 2189 2189 2189 2189 2189 2207 2207 2207 2207 2207 2207 2207
R 2 0.275 0.269 0.269 0.273 0.276 0.271 0.276 0.473 0.468 0.468 0.468 0.476 0.480 0.469
Restrictions on financial conglomerate
Share (t-1) -6.244*** -6.311*** -6.348*** -6.251*** -6.234*** -6.307*** -6.170*** -4.072*** -4.105*** -4.099*** -4.071*** -4.085*** -4.064*** -4.064***
(-5.15) (-5.25) (-5.21) (-5.16) (-5.07) (-5.19) (-5.09) (-2.78) (-2.80) (-2.78) (-2.85) (-2.83) (-2.78) (-2.88)
Capital_Inflow 0.004 -0.015*** -0.017*** 0.018 0.011*** 0.015*** 0.009* 0.003 0.018*** 0.015* 0.035*** -0.007 -0.005 -0.017
(1.31) (-2.70) (-3.24) (0.97) (3.46) (2.88) (1.89) (0.62) (3.05) (1.92) (3.20) (-1.42) (-0.63) (-1.52)
Capital_Inflow * Dependence 0.015** 0.026** 0.019* 0.043 0.017** 0.019* 0.022* -0.000 -0.020 -0.028 -0.006 0.012 0.030 -0.006
(2.06) (2.00) (1.92) (0.71) (2.30) (1.67) (1.89) (-0.00) (-1.54) (-1.63) (-0.26) (0.89) (1.26) (-0.24)
Credit -0.002*** -0.002*** -0.002*** -0.003*** -0.002*** -0.002*** -0.002*** 0.001 0.001* 0.001 0.001** 0.001* 0.001* 0.001
(-4.91) (-5.57) (-6.26) (-4.61) (-4.47) (-4.70) (-5.45) (1.63) (1.96) (1.62) (2.12) (1.83) (1.86) (1.62)
Credit * Dependence -0.000 -0.000 0.000 -0.000 -0.000 0.000 -0.000 -0.001 -0.001 -0.000 -0.001 -0.001 -0.001 -0.001
(-0.99) (-0.34) (0.77) (-0.27) (-0.60) (0.01) (-0.03) (-0.83) (-0.96) (-0.62) (-0.98) (-1.19) (-1.59) (-0.99)
Constant 1.273*** 1.346*** 1.416*** 1.418*** 1.273*** 1.314*** 1.270*** 0.786** 0.775** 0.774** 0.805** 0.777** 0.770** 0.841**
(4.71) (4.98) (5.07) (4.51) (4.62) (4.82) (4.68) (2.12) (2.10) (2.09) (2.23) (2.11) (2.03) (2.47)
N 1662 1662 1662 1662 1662 1662 1662 1697 1697 1697 1697 1697 1697 1697
R 2 0.417 0.408 0.409 0.408 0.427 0.418 0.416 0.467 0.470 0.468 0.471 0.467 0.468 0.469
All panels:
Industry FE Yes Yes Yes Yes Yes Yes Yes Yes Yes Yes Yes Yes Yes Yes
Country FE Yes Yes Yes Yes Yes Yes Yes Yes Yes Yes Yes Yes Yes Yes
Industry*Country FE Yes Yes Yes Yes Yes Yes Yes Yes Yes Yes Yes Yes Yes Yes
Year FE Yes Yes Yes Yes Yes Yes Yes Yes Yes Yes Yes Yes Yes Yes
# Countries 22 22 22 22 22 22 22 22 22 22 22 22 22 22
# Industries 28 28 28 28 28 28 28 28 28 28 28 28 28 28
<Median >Median
Equity Inflow s Debt Inflow s Equity Inflow s Debt Inflow s

38
Panel B. Stability & Profitability
Total TotalDirect
Investment
Portfolio
InvestmentTotal
Commercial
BanksNon-Banks Total Total
Direct
Investment
Portfolio
InvestmentTotal
Commercial
BanksNon-Banks
[1] [2] [3] [4] [5] [6] [7] [8] [9] [10] [11] [12] [13] [14]
NPLs
Share (t-1) -4.512** -4.454** -4.460** -4.413** -4.512** -4.444** -4.488** -5.899*** -5.934*** -5.925*** -5.934*** -5.924*** -5.894*** -5.959***
(-2.32) (-2.28) (-2.29) (-2.26) (-2.34) (-2.28) (-2.35) (-5.15) (-5.20) (-5.19) (-5.16) (-5.26) (-5.19) (-5.26)
Capital_Inflow -0.007*** -0.009** -0.007* -0.013* -0.008*** -0.004 -0.012*** 0.013*** -0.003 -0.003 -0.001 0.016*** 0.014** 0.023***
(-3.21) (-2.41) (-1.83) (-1.87) (-3.10) (-0.72) (-3.13) (4.65) (-0.46) (-0.46) (-0.06) (4.82) (2.15) (3.71)
Capital_Inflow * Dependence 0.009** 0.009 0.008 0.009 0.012** 0.014 0.013* 0.008 -0.011 -0.002 -0.050* 0.013 0.026 0.010
(2.32) (1.43) (1.30) (0.51) (2.43) (1.42) (1.90) (1.08) (-0.78) (-0.16) (-1.96) (1.65) (1.53) (0.70)
Credit 0.001 0.000 0.000 0.000 0.001 0.000 0.000 -0.000 -0.001 -0.001 -0.001 -0.000 -0.001 -0.001
(1.62) (1.22) (0.77) (1.18) (1.42) (0.97) (1.13) (-0.49) (-1.46) (-1.39) (-1.15) (-0.37) (-0.90) (-0.62)
Credit * Dependence -0.001 -0.000 -0.000 0.000 -0.001 -0.000 -0.000 0.000 0.001 0.000 0.001 0.001 0.000 0.001
(-1.12) (-0.18) (-0.07) (0.12) (-1.13) (-0.63) (-0.48) (0.23) (0.41) (0.26) (0.71) (0.37) (0.29) (0.34)
Constant 1.017** 1.043** 1.023** 1.040** 0.994** 1.007** 1.010** 1.075*** 1.152*** 1.160*** 1.111*** 1.103*** 1.128*** 1.100***
(2.14) (2.20) (2.15) (2.14) (2.09) (2.11) (2.13) (3.69) (3.92) (3.87) (3.70) (3.84) (3.88) (3.81)
N 2322 2322 2322 2322 2322 2322 2322 2023 2023 2023 2023 2023 2023 2023
R 2 0.322 0.320 0.319 0.319 0.321 0.318 0.322 0.376 0.363 0.363 0.364 0.381 0.371 0.377
ROAA
Share (t-1) -3.725*** -3.848*** -3.819*** -3.752*** -3.778*** -3.805*** -3.748*** -5.289*** -5.301*** -5.308*** -5.297*** -5.289*** -5.271*** -5.315***
(-3.41) (-3.41) (-3.41) (-3.37) (-3.43) (-3.47) (-3.32) (-3.79) (-3.80) (-3.79) (-3.81) (-3.79) (-3.78) (-3.82)
Capital_Inflow 0.015*** 0.008 0.001 0.023*** 0.010** 0.008 0.018*** 0.002 0.004 0.003 0.007 0.002 0.006 -0.000
(4.10) (1.23) (0.15) (2.63) (2.57) (0.96) (2.79) (0.82) (0.89) (0.68) (0.62) (0.61) (1.11) (-0.09)
Capital_Inflow * Dependence 0.003 -0.025 -0.028* -0.006 0.011 0.025 0.006 0.011** 0.011 0.010 0.016 0.017** 0.022* 0.019**
(0.33) (-1.50) (-1.67) (-0.33) (1.08) (1.38) (0.35) (2.10) (1.37) (1.22) (0.58) (2.38) (1.80) (2.03)
Credit -0.000 -0.000 -0.001 -0.001 -0.000 -0.000 -0.000 0.000 -0.000 0.000 -0.000 0.000 0.000 0.000
(-0.09) (-0.73) (-0.90) (-0.99) (-0.31) (-0.40) (-0.41) (0.32) (-0.01) (0.14) (-0.00) (0.59) (0.51) (0.42)
Credit * Dependence -0.000 -0.000 -0.000 -0.000 -0.000 -0.001 -0.000 -0.001 0.000 0.000 0.001 -0.001 -0.000 -0.000
(-0.12) (-0.22) (-0.15) (-0.13) (-0.37) (-0.72) (-0.07) (-0.86) (0.39) (0.49) (0.94) (-0.93) (-0.32) (-0.09)
Constant 0.623*** 0.712*** 0.746*** 0.748*** 0.699*** 0.725*** 0.668*** 0.789*** 0.779*** 0.779*** 0.781*** 0.793*** 0.784*** 0.787***
(2.59) (2.85) (2.96) (3.02) (2.87) (2.99) (2.68) (2.98) (2.96) (2.95) (2.97) (2.97) (2.95) (2.96)
N 1920 1920 1920 1920 1920 1920 1920 2476 2476 2476 2476 2476 2476 2476
R 2 0.330 0.319 0.320 0.320 0.328 0.323 0.327 0.370 0.366 0.365 0.365 0.370 0.369 0.367
All panels:
Industry FE Yes Yes Yes Yes Yes Yes Yes Yes Yes Yes Yes Yes Yes Yes
Country FE Yes Yes Yes Yes Yes Yes Yes Yes Yes Yes Yes Yes Yes Yes
Industry*Country FE Yes Yes Yes Yes Yes Yes Yes Yes Yes Yes Yes Yes Yes Yes
Year FE Yes Yes Yes Yes Yes Yes Yes Yes Yes Yes Yes Yes Yes Yes
# Countries 22 22 22 22 22 22 22 22 22 22 22 22 22 22
# Industries 28 28 28 28 28 28 28 28 28 28 28 28 28 28
<Median >Median
Equity Inflow s Debt Inflow s Equity Inflow s Debt Inflow s

39
Panel C. Ownership Structure
Total TotalDirect
Investment
Portfolio
InvestmentTotal
Commercial
BanksNon-Banks Total Total
Direct
Investment
Portfolio
InvestmentTotal
Commercial
BanksNon-Banks
[1] [2] [3] [4] [5] [6] [7] [8] [9] [10] [11] [12] [13] [14]
Foreign Banks Penetration
Share (t-1) -6.435*** -6.390*** -6.381*** -6.373*** -6.486*** -6.439*** -6.449*** -5.153*** -5.173*** -5.179*** -5.174*** -5.156*** -5.154*** -5.178***
(-5.97) (-6.07) (-6.03) (-6.07) (-6.02) (-6.07) (-5.99) (-3.62) (-3.65) (-3.64) (-3.64) (-3.60) (-3.62) (-3.62)
Capital_Inflow 0.004 -0.007 -0.005 -0.010 0.007** 0.009 0.007 0.003 0.004 0.004 -0.000 0.004 0.006 0.005
(1.34) (-1.12) (-0.87) (-0.75) (2.04) (1.18) (1.18) (1.51) (1.15) (1.11) (-0.00) (1.44) (1.22) (0.98)
Capital_Inflow * Dependence 0.007 -0.005 0.001 -0.020 0.010 0.011 0.015 0.010** 0.007 0.005 0.016 0.015** 0.024** 0.016*
(0.80) (-0.29) (0.07) (-0.80) (1.19) (0.73) (1.07) (2.05) (1.09) (0.72) (0.71) (2.41) (2.40) (1.72)
Credit -0.001** -0.001** -0.001** -0.001 -0.001** -0.001** -0.001** 0.000 0.000 0.000 0.000 0.001 0.001 0.000
(-2.07) (-2.37) (-2.36) (-1.59) (-2.10) (-2.20) (-2.17) (0.60) (0.35) (0.55) (0.64) (1.14) (1.23) (0.87)
Credit * Dependence -0.000 -0.000 -0.000 0.000 -0.000 -0.000 -0.000 -0.001 0.000 0.000 0.000 -0.001 -0.001 -0.000
(-0.56) (-0.09) (-0.24) (0.20) (-0.54) (-0.51) (-0.32) (-0.93) (0.24) (0.33) (0.37) (-1.08) (-0.78) (-0.42)
Constant 1.038*** 1.076*** 1.068*** 1.035*** 1.075*** 1.065*** 1.060*** 0.809** 0.802** 0.790** 0.799** 0.802** 0.793** 0.802**
(5.74) (6.09) (5.97) (5.85) (5.92) (5.99) (5.83) (2.45) (2.44) (2.40) (2.43) (2.41) (2.40) (2.42)
N 1784 1784 1784 1784 1784 1784 1784 2480 2480 2480 2480 2480 2480 2480
R 2 0.306 0.304 0.304 0.305 0.309 0.306 0.307 0.371 0.365 0.365 0.364 0.372 0.370 0.368
Government Banks Penetration
Share (t-1) -3.507** -3.492** -3.510** -3.521** -3.546** -3.540** -3.538** -5.763*** -5.728*** -5.739*** -5.753*** -5.742*** -5.747*** -5.740***
(-2.07) (-2.07) (-2.07) (-2.12) (-2.10) (-2.08) (-2.09) (-5.53) (-5.72) (-5.67) (-5.65) (-5.60) (-5.64) (-5.60)
Capital_Inflow 0.001 0.005* 0.003 0.021** -0.002 -0.005 -0.001 0.007** -0.010 -0.007 -0.015 0.010*** 0.013** 0.013**
(0.33) (1.70) (0.93) (2.04) (-0.77) (-0.96) (-0.27) (2.28) (-1.49) (-1.01) (-1.33) (3.45) (2.50) (1.99)
Capital_Inflow * Dependence 0.007* 0.008 0.003 0.036 0.010* 0.015 0.009 0.017*** -0.001 0.009 -0.035 0.019*** 0.028** 0.025*
(1.72) (1.10) (0.49) (1.06) (1.96) (1.63) (1.39) (2.86) (-0.07) (0.67) (-1.64) (3.18) (2.49) (1.80)
Credit 0.000 0.000 0.000 -0.000 0.000 0.000 0.000 -0.000 -0.000 -0.001 -0.000 -0.000 -0.000 -0.000
(1.08) (0.23) (0.80) (-0.89) (1.45) (1.30) (1.12) (-0.99) (-1.10) (-1.37) (-0.99) (-0.55) (-0.67) (-1.03)
Credit * Dependence -0.001 -0.000 0.000 -0.000 -0.001 -0.000 -0.000 -0.000 0.000 0.000 0.001 -0.000 -0.000 0.000
(-0.93) (-0.20) (0.13) (-0.18) (-0.95) (-0.59) (-0.38) (-0.64) (0.44) (0.33) (0.92) (-0.40) (-0.61) (0.25)
Constant 0.394* 0.360 0.392* 0.410* 0.430* 0.426* 0.424* 1.111*** 1.144*** 1.152*** 1.097*** 1.113*** 1.135*** 1.106***
(1.80) (1.60) (1.71) (1.85) (1.96) (1.87) (1.94) (4.14) (4.37) (4.37) (4.08) (4.19) (4.28) (4.17)
N 1848 1848 1848 1848 1848 1848 1848 2436 2436 2436 2436 2436 2436 2436
R 2 0.249 0.251 0.248 0.256 0.248 0.248 0.248 0.373 0.366 0.365 0.367 0.378 0.374 0.373
All panels:
Industry FE Yes Yes Yes Yes Yes Yes Yes Yes Yes Yes Yes Yes Yes Yes
Country FE Yes Yes Yes Yes Yes Yes Yes Yes Yes Yes Yes Yes Yes Yes
Industry*Country FE Yes Yes Yes Yes Yes Yes Yes Yes Yes Yes Yes Yes Yes Yes
Year FE Yes Yes Yes Yes Yes Yes Yes Yes Yes Yes Yes Yes Yes Yes
# Countries 22 22 22 22 22 22 22 22 22 22 22 22 22 22
# Industries 28 28 28 28 28 28 28 28 28 28 28 28 28 28
<Median >Median
Equity Inflow s Debt Inflow s Equity Inflow s Debt Inflow s
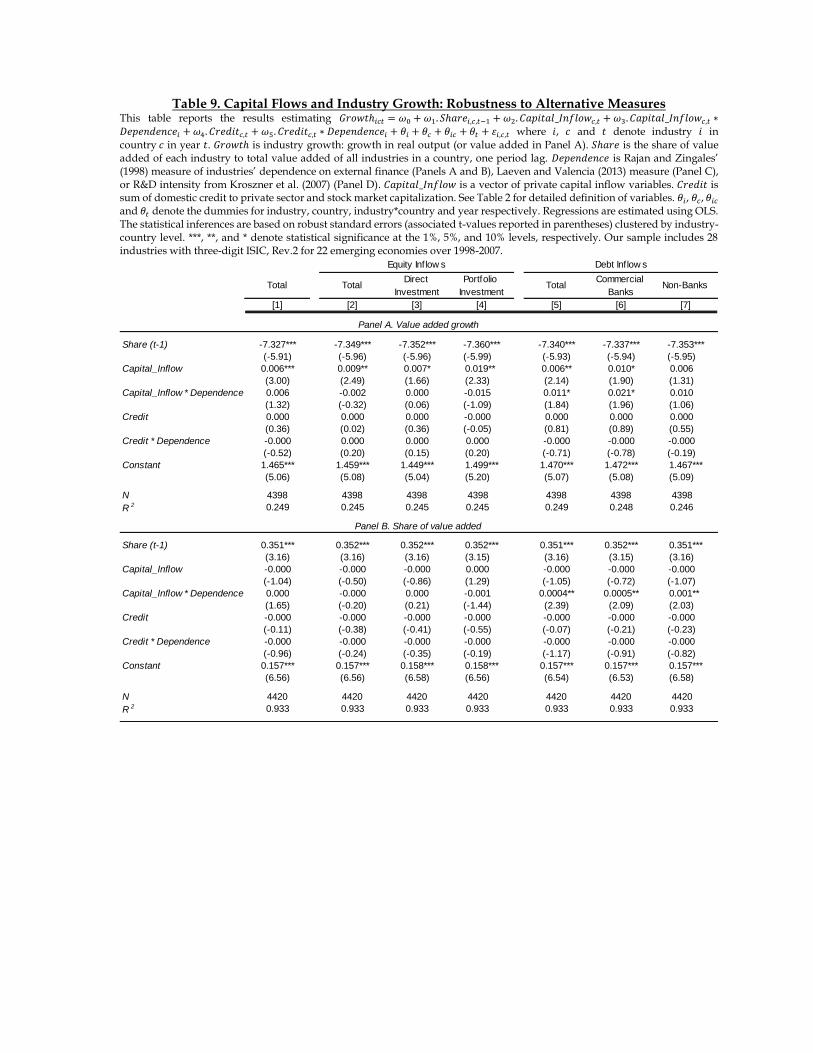
Table 9. Capital Flows and Industry Growth: Robustness to Alternative Measures This table reports the results estimating 𝐺𝑟𝑜𝑤𝑡ℎ𝑖𝑐𝑡 = 𝜔0 + 𝜔1. 𝑆ℎ𝑎𝑟𝑒𝑖,𝑐,𝑡−1 + 𝜔2. 𝐶𝑎𝑝𝑖𝑡𝑎𝑙_𝐼𝑛𝑓𝑙𝑜𝑤𝑐,𝑡 + 𝜔3. 𝐶𝑎𝑝𝑖𝑡𝑎𝑙_𝐼𝑛𝑓𝑙𝑜𝑤𝑐,𝑡 ∗
𝐷𝑒𝑝𝑒𝑛𝑑𝑒𝑛𝑐𝑒𝑖 + 𝜔4. 𝐶𝑟𝑒𝑑𝑖𝑡𝑐,𝑡 + 𝜔5. 𝐶𝑟𝑒𝑑𝑖𝑡𝑐,𝑡 ∗ 𝐷𝑒𝑝𝑒𝑛𝑑𝑒𝑛𝑐𝑒𝑖 + 𝜃𝑖 + 𝜃𝑐 + 𝜃𝑖𝑐 + 𝜃𝑡 + 𝜀𝑖,𝑐,𝑡 where 𝑖, 𝑐 and 𝑡 denote industry 𝑖 in country 𝑐 in year 𝑡. 𝐺𝑟𝑜𝑤𝑡ℎ is industry growth: growth in real output (or value added in Panel A). 𝑆ℎ𝑎𝑟𝑒 is the share of value added of each industry to total value added of all industries in a country, one period lag. 𝐷𝑒𝑝𝑒𝑛𝑑𝑒𝑛𝑐𝑒 is Rajan and Zingales’ (1998) measure of industries’ dependence on external finance (Panels A and B), Laeven and Valencia (2013) measure (Panel C), or R&D intensity from Kroszner et al. (2007) (Panel D). 𝐶𝑎𝑝𝑖𝑡𝑎𝑙_𝐼𝑛𝑓𝑙𝑜𝑤 is a vector of private capital inflow variables. 𝐶𝑟𝑒𝑑𝑖𝑡 is sum of domestic credit to private sector and stock market capitalization. See Table 2 for detailed definition of variables. 𝜃𝑖, 𝜃𝑐, 𝜃𝑖𝑐 and 𝜃𝑡 denote the dummies for industry, country, industry*country and year respectively. Regressions are estimated using OLS. The statistical inferences are based on robust standard errors (associated t-values reported in parentheses) clustered by industry-country level. ***, **, and * denote statistical significance at the 1%, 5%, and 10% levels, respectively. Our sample includes 28 industries with three-digit ISIC, Rev.2 for 22 emerging economies over 1998-2007.
Total TotalDirect
Investment
Portfolio
InvestmentTotal
Commercial
BanksNon-Banks
[1] [2] [3] [4] [5] [6] [7]
Share (t-1) -7.327*** -7.349*** -7.352*** -7.360*** -7.340*** -7.337*** -7.353***
(-5.91) (-5.96) (-5.96) (-5.99) (-5.93) (-5.94) (-5.95)
Capital_Inflow 0.006*** 0.009** 0.007* 0.019** 0.006** 0.010* 0.006
(3.00) (2.49) (1.66) (2.33) (2.14) (1.90) (1.31)
Capital_Inflow * Dependence 0.006 -0.002 0.000 -0.015 0.011* 0.021* 0.010
(1.32) (-0.32) (0.06) (-1.09) (1.84) (1.96) (1.06)
Credit 0.000 0.000 0.000 -0.000 0.000 0.000 0.000
(0.36) (0.02) (0.36) (-0.05) (0.81) (0.89) (0.55)
Credit * Dependence -0.000 0.000 0.000 0.000 -0.000 -0.000 -0.000
(-0.52) (0.20) (0.15) (0.20) (-0.71) (-0.78) (-0.19)
Constant 1.465*** 1.459*** 1.449*** 1.499*** 1.470*** 1.472*** 1.467***
(5.06) (5.08) (5.04) (5.20) (5.07) (5.08) (5.09)
N 4398 4398 4398 4398 4398 4398 4398
R 2 0.249 0.245 0.245 0.245 0.249 0.248 0.246
Share (t-1) 0.351*** 0.352*** 0.352*** 0.352*** 0.351*** 0.352*** 0.351***
(3.16) (3.16) (3.16) (3.15) (3.16) (3.15) (3.16)
Capital_Inflow -0.000 -0.000 -0.000 0.000 -0.000 -0.000 -0.000
(-1.04) (-0.50) (-0.86) (1.29) (-1.05) (-0.72) (-1.07)
Capital_Inflow * Dependence 0.000 -0.000 0.000 -0.001 0.0004** 0.0005** 0.001**
(1.65) (-0.20) (0.21) (-1.44) (2.39) (2.09) (2.03)
Credit -0.000 -0.000 -0.000 -0.000 -0.000 -0.000 -0.000
(-0.11) (-0.38) (-0.41) (-0.55) (-0.07) (-0.21) (-0.23)
Credit * Dependence -0.000 -0.000 -0.000 -0.000 -0.000 -0.000 -0.000
(-0.96) (-0.24) (-0.35) (-0.19) (-1.17) (-0.91) (-0.82)
Constant 0.157*** 0.157*** 0.158*** 0.158*** 0.157*** 0.157*** 0.157***
(6.56) (6.56) (6.58) (6.56) (6.54) (6.53) (6.58)
N 4420 4420 4420 4420 4420 4420 4420
R 2 0.933 0.933 0.933 0.933 0.933 0.933 0.933
Panel A. Value added growth
Panel B. Share of value added
Equity Inflow s Debt Inflow s
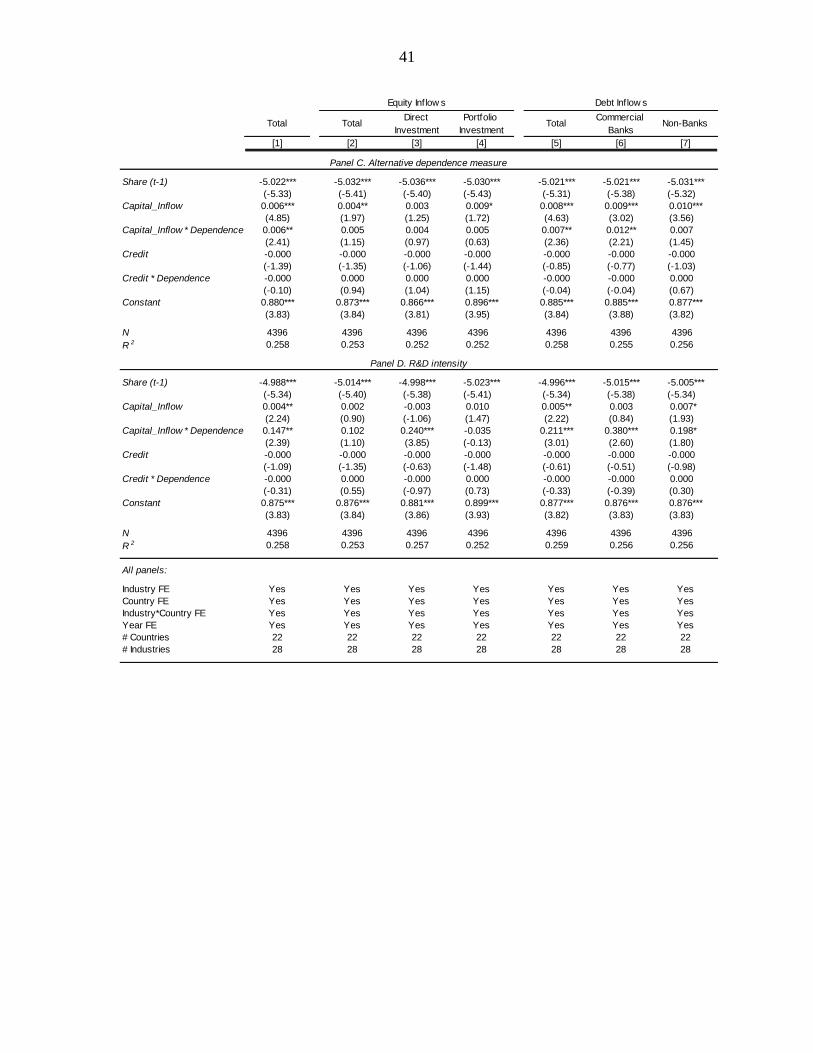
41
Total TotalDirect
Investment
Portfolio
InvestmentTotal
Commercial
BanksNon-Banks
[1] [2] [3] [4] [5] [6] [7]
Share (t-1) -5.022*** -5.032*** -5.036*** -5.030*** -5.021*** -5.021*** -5.031***
(-5.33) (-5.41) (-5.40) (-5.43) (-5.31) (-5.38) (-5.32)
Capital_Inflow 0.006*** 0.004** 0.003 0.009* 0.008*** 0.009*** 0.010***
(4.85) (1.97) (1.25) (1.72) (4.63) (3.02) (3.56)
Capital_Inflow * Dependence 0.006** 0.005 0.004 0.005 0.007** 0.012** 0.007
(2.41) (1.15) (0.97) (0.63) (2.36) (2.21) (1.45)
Credit -0.000 -0.000 -0.000 -0.000 -0.000 -0.000 -0.000
(-1.39) (-1.35) (-1.06) (-1.44) (-0.85) (-0.77) (-1.03)
Credit * Dependence -0.000 0.000 0.000 0.000 -0.000 -0.000 0.000
(-0.10) (0.94) (1.04) (1.15) (-0.04) (-0.04) (0.67)
Constant 0.880*** 0.873*** 0.866*** 0.896*** 0.885*** 0.885*** 0.877***
(3.83) (3.84) (3.81) (3.95) (3.84) (3.88) (3.82)
N 4396 4396 4396 4396 4396 4396 4396
R 2 0.258 0.253 0.252 0.252 0.258 0.255 0.256
Share (t-1) -4.988*** -5.014*** -4.998*** -5.023*** -4.996*** -5.015*** -5.005***
(-5.34) (-5.40) (-5.38) (-5.41) (-5.34) (-5.38) (-5.34)
Capital_Inflow 0.004** 0.002 -0.003 0.010 0.005** 0.003 0.007*
(2.24) (0.90) (-1.06) (1.47) (2.22) (0.84) (1.93)
Capital_Inflow * Dependence 0.147** 0.102 0.240*** -0.035 0.211*** 0.380*** 0.198*
(2.39) (1.10) (3.85) (-0.13) (3.01) (2.60) (1.80)
Credit -0.000 -0.000 -0.000 -0.000 -0.000 -0.000 -0.000
(-1.09) (-1.35) (-0.63) (-1.48) (-0.61) (-0.51) (-0.98)
Credit * Dependence -0.000 0.000 -0.000 0.000 -0.000 -0.000 0.000
(-0.31) (0.55) (-0.97) (0.73) (-0.33) (-0.39) (0.30)
Constant 0.875*** 0.876*** 0.881*** 0.899*** 0.877*** 0.876*** 0.876***
(3.83) (3.84) (3.86) (3.93) (3.82) (3.83) (3.83)
N 4396 4396 4396 4396 4396 4396 4396
R 2 0.258 0.253 0.257 0.252 0.259 0.256 0.256
All panels:
Industry FE Yes Yes Yes Yes Yes Yes Yes
Country FE Yes Yes Yes Yes Yes Yes Yes
Industry*Country FE Yes Yes Yes Yes Yes Yes Yes
Year FE Yes Yes Yes Yes Yes Yes Yes
# Countries 22 22 22 22 22 22 22
# Industries 28 28 28 28 28 28 28
Panel C. Alternative dependence measure
Panel D. R&D intensity
Equity Inflow s Debt Inflow s
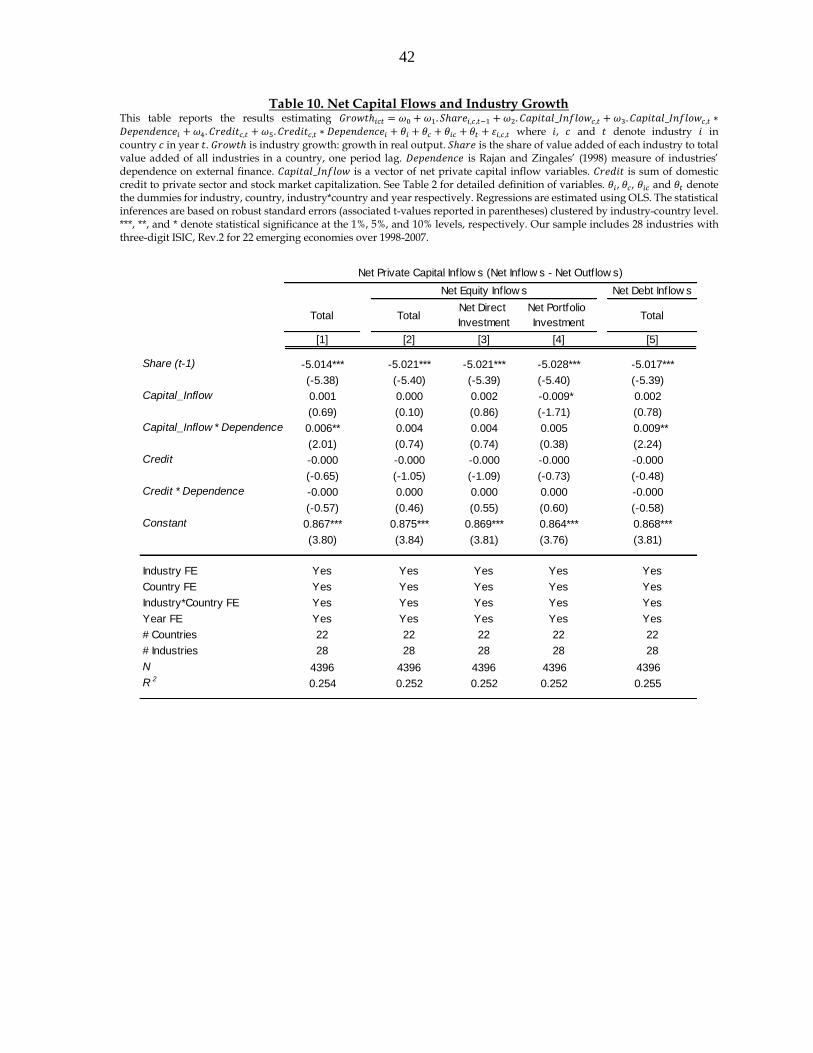
42
Table 10. Net Capital Flows and Industry Growth This table reports the results estimating 𝐺𝑟𝑜𝑤𝑡ℎ𝑖𝑐𝑡 = 𝜔0 + 𝜔1. 𝑆ℎ𝑎𝑟𝑒𝑖,𝑐,𝑡−1 + 𝜔2. 𝐶𝑎𝑝𝑖𝑡𝑎𝑙_𝐼𝑛𝑓𝑙𝑜𝑤𝑐,𝑡 + 𝜔3. 𝐶𝑎𝑝𝑖𝑡𝑎𝑙_𝐼𝑛𝑓𝑙𝑜𝑤𝑐,𝑡 ∗
𝐷𝑒𝑝𝑒𝑛𝑑𝑒𝑛𝑐𝑒𝑖 + 𝜔4. 𝐶𝑟𝑒𝑑𝑖𝑡𝑐,𝑡 + 𝜔5. 𝐶𝑟𝑒𝑑𝑖𝑡𝑐,𝑡 ∗ 𝐷𝑒𝑝𝑒𝑛𝑑𝑒𝑛𝑐𝑒𝑖 + 𝜃𝑖 + 𝜃𝑐 + 𝜃𝑖𝑐 + 𝜃𝑡 + 𝜀𝑖,𝑐,𝑡 where 𝑖, 𝑐 and 𝑡 denote industry 𝑖 in country 𝑐 in year 𝑡. 𝐺𝑟𝑜𝑤𝑡ℎ is industry growth: growth in real output. 𝑆ℎ𝑎𝑟𝑒 is the share of value added of each industry to total value added of all industries in a country, one period lag. 𝐷𝑒𝑝𝑒𝑛𝑑𝑒𝑛𝑐𝑒 is Rajan and Zingales’ (1998) measure of industries’ dependence on external finance. 𝐶𝑎𝑝𝑖𝑡𝑎𝑙_𝐼𝑛𝑓𝑙𝑜𝑤 is a vector of net private capital inflow variables. 𝐶𝑟𝑒𝑑𝑖𝑡 is sum of domestic credit to private sector and stock market capitalization. See Table 2 for detailed definition of variables. 𝜃𝑖, 𝜃𝑐, 𝜃𝑖𝑐 and 𝜃𝑡 denote the dummies for industry, country, industry*country and year respectively. Regressions are estimated using OLS. The statistical inferences are based on robust standard errors (associated t-values reported in parentheses) clustered by industry-country level. ***, **, and * denote statistical significance at the 1%, 5%, and 10% levels, respectively. Our sample includes 28 industries with three-digit ISIC, Rev.2 for 22 emerging economies over 1998-2007.
Net Debt Inflow s
Total TotalNet Direct
Investment
Net Portfolio
InvestmentTotal
[1] [2] [3] [4] [5]
Share (t-1) -5.014*** -5.021*** -5.021*** -5.028*** -5.017***
(-5.38) (-5.40) (-5.39) (-5.40) (-5.39)
Capital_Inflow 0.001 0.000 0.002 -0.009* 0.002
(0.69) (0.10) (0.86) (-1.71) (0.78)
Capital_Inflow * Dependence 0.006** 0.004 0.004 0.005 0.009**
(2.01) (0.74) (0.74) (0.38) (2.24)
Credit -0.000 -0.000 -0.000 -0.000 -0.000
(-0.65) (-1.05) (-1.09) (-0.73) (-0.48)
Credit * Dependence -0.000 0.000 0.000 0.000 -0.000
(-0.57) (0.46) (0.55) (0.60) (-0.58)
Constant 0.867*** 0.875*** 0.869*** 0.864*** 0.868***
(3.80) (3.84) (3.81) (3.76) (3.81)
Industry FE Yes Yes Yes Yes Yes
Country FE Yes Yes Yes Yes Yes
Industry*Country FE Yes Yes Yes Yes Yes
Year FE Yes Yes Yes Yes Yes
# Countries 22 22 22 22 22
# Industries 28 28 28 28 28
N 4396 4396 4396 4396 4396
R 20.254 0.252 0.252 0.252 0.255
Net Private Capital Inflow s (Net Inflow s - Net Outflow s)
Net Equity Inflow s

Table 11. Gross Capital Flows and Industry Growth This table reports the results estimating 𝐺𝑟𝑜𝑤𝑡ℎ𝑖𝑐𝑡 = 𝜔0 + 𝜔1. 𝑆ℎ𝑎𝑟𝑒𝑖,𝑐,𝑡−1 + 𝜔2. 𝐶𝑎𝑝𝑖𝑡𝑎𝑙_𝐼𝑛𝑓𝑙𝑜𝑤𝑐,𝑡 + 𝜔3. 𝐶𝑎𝑝𝑖𝑡𝑎𝑙_𝐼𝑛𝑓𝑙𝑜𝑤𝑐,𝑡 ∗ 𝐷𝑒𝑝𝑒𝑛𝑑𝑒𝑛𝑐𝑒𝑖 + 𝜔4. 𝐶𝑟𝑒𝑑𝑖𝑡𝑐,𝑡 + 𝜔5. 𝐶𝑟𝑒𝑑𝑖𝑡𝑐,𝑡 ∗ 𝐷𝑒𝑝𝑒𝑛𝑑𝑒𝑛𝑐𝑒𝑖 +
𝜃𝑖 + 𝜃𝑐 + 𝜃𝑖𝑐 + 𝜃𝑡 + 𝜀𝑖,𝑐,𝑡 where 𝑖, 𝑐 and 𝑡 denote industry 𝑖 in country 𝑐 in year 𝑡. 𝐺𝑟𝑜𝑤𝑡ℎ is industry growth: growth in real output. 𝑆ℎ𝑎𝑟𝑒 is the share of value added of each industry to total value added of all industries in a country, one period lag. 𝐷𝑒𝑝𝑒𝑛𝑑𝑒𝑛𝑐𝑒 is Rajan and Zingales’ (1998) measure of industries’ dependence on external finance. 𝐶𝑎𝑝𝑖𝑡𝑎𝑙_𝐼𝑛𝑓𝑙𝑜𝑤 is a vector of private capital inflow variables. 𝐶𝑟𝑒𝑑𝑖𝑡 is sum of domestic credit to private sector and stock market capitalization. See Table 2 for detailed definition of variables. 𝜃𝑖, 𝜃𝑐, 𝜃𝑖𝑐 and 𝜃𝑡 denote the dummies for industry, country, industry*country and year respectively. Regressions are estimated using OLS. The statistical inferences are based on robust standard errors (associated t-values reported in parentheses) clustered by industry-country level. ***, **, and * denote statistical significance at the 1%, 5%, and 10% levels, respectively. Our sample includes 28 industries with three-digit ISIC, Rev.2 for 22 emerging economies over 1998-2007.
Total
TotalGross FDI
Inflow s
Gross Other
Inflow s to
Banks
Gross Other
Inflow s to
Private Non-
Bank Sector
TotalGross Debt
Inflow s
Gross Equity
Inflow s
[1] [2] [3] [4] [5] [6] [7] [8]
Share (t-1) -5.021*** -5.021*** -5.026*** -5.042*** -5.022*** -5.025*** -5.139*** -5.045***
(-5.39) (-5.38) (-5.40) (-5.34) (-5.40) (-5.45) (-5.31) (-5.39)
Capital_Inflow 0.000 0.001 -0.000 0.012** 0.017*** -0.008** -0.011** 0.005
(0.36) (0.64) (-0.28) (2.11) (3.25) (-2.19) (-2.50) (0.89)
Capital_Inflow * Dependence 0.006** 0.007** 0.005* 0.020* 0.025** 0.017** 0.021** 0.001
(2.30) (2.49) (1.71) (1.73) (2.30) (2.01) (2.18) (0.08)
Credit -0.000 -0.000 -0.000 -0.000 -0.000 -0.000 -0.000 -0.000
(-0.54) (-0.48) (-0.85) (-0.84) (-0.50) (-0.71) (-1.55) (-1.21)
Credit * Dependence -0.000 -0.000 0.000 -0.000 -0.000 0.000 0.000 0.000
(-0.65) (-0.76) (0.33) (-0.32) (-0.45) (0.14) (0.63) (0.70)
Constant 0.873*** 0.878*** 0.875*** 0.898*** 0.906*** 0.859*** 0.902*** 0.893***
(3.82) (3.84) (3.83) (3.88) (3.98) (3.74) (3.80) (3.88)
Industry FE Yes Yes Yes Yes Yes Yes Yes Yes
Country FE Yes Yes Yes Yes Yes Yes Yes Yes
Industry*Country FE Yes Yes Yes Yes Yes Yes Yes Yes
Year FE Yes Yes Yes Yes Yes Yes Yes Yes
# Countries 22 22 22 22 22 22 22 22
# Industries 28 28 28 28 28 28 28 28
N 4396 4396 4396 4369 4369 4396 4117 4369
R 2 0.254 0.255 0.252 0.254 0.259 0.253 0.255 0.251
Total Gross Private Inflow s
Total Gross Inflow s
Gross Portfolio Inflow s

Table 12. Additional Robustness Checks This table reports the results estimating 𝐺𝑟𝑜𝑤𝑡ℎ𝑖𝑐𝑡 = 𝜔0 + 𝜔1. 𝑆ℎ𝑎𝑟𝑒𝑖𝑐𝑡−1 + 𝜔2. 𝐶𝑎𝑝𝑖𝑡𝑎𝑙_𝐼𝑛𝑓𝑙𝑜𝑤𝑐𝑡 + 𝜔3. 𝐶𝑎𝑝𝑖𝑡𝑎𝑙_𝐼𝑛𝑓𝑙𝑜𝑤𝑐𝑡 ∗𝐷𝑒𝑝𝑒𝑛𝑑𝑒𝑛𝑐𝑒𝑖 + 𝜔4. 𝐶𝑟𝑒𝑑𝑖𝑡𝑐𝑡 + 𝜔5. 𝐶𝑟𝑒𝑑𝑖𝑡𝑐𝑡 ∗ 𝐷𝑒𝑝𝑒𝑛𝑑𝑒𝑛𝑐𝑒𝑖 + 𝜃𝑖 + 𝜃𝑐 + 𝜃𝑖𝑐 + 𝜃𝑡 + 𝜀𝑖𝑐𝑡 where 𝑖, 𝑐 and 𝑡 denote industry 𝑖 in country 𝑐 in year 𝑡. 𝐺𝑟𝑜𝑤𝑡ℎ is industry growth: growth in real output. 𝐶𝑟𝑖𝑠𝑖𝑠 is a dummy variable that takes value 1 for the global financial crisis period 2008-09, and 0 otherwise. 𝑆ℎ𝑎𝑟𝑒 is the share of value added of each industry to total value added of all industries in a country, one period lag. 𝐷𝑒𝑝𝑒𝑛𝑑𝑒𝑛𝑐𝑒 is Rajan and Zingales’ (1998) measure of industries’ dependence on external finance. 𝐶𝑎𝑝𝑖𝑡𝑎𝑙_𝑂𝑝𝑒𝑛𝑛𝑒𝑠𝑠 is a vector of capital account openness or capital inflow restriction variables. 𝐶𝑟𝑒𝑑𝑖𝑡 is sum of domestic credit to private sector and stock market capitalization. See Table 2 for detailed definition of variables. 𝜃𝑖, 𝜃𝑐, 𝜃𝑖𝑐 and 𝜃𝑡 denote the dummies for industry, country, industry*country and year respectively. Regressions are estimated using OLS. The statistical inferences are based on robust standard errors (associated t-values reported in parentheses) clustered by industry-country (or country or industry-country level in Panel A). ***, **, and * denote statistical significance at the 1%, 5%, and 10% levels, respectively. Our sample includes 28 industries with three-digit ISIC, Rev.2 for 22 emerging economies over 1998-2007. Panel A. Robustness to different clustering
TotalCommercial
BanksNon-Banks Total
Commercial
BanksNon-Banks
[1] [2] [3] [4] [5] [6]
Share (t-1) -5.015*** -5.017*** -5.022*** -5.015*** -5.017*** -5.022***
(-5.86) (-5.83) (-5.90) (-4.55) (-4.56) (-4.57)
Capital_Inflow 0.005*** 0.004 0.007** 0.005 0.004 0.007
(2.82) (1.52) (2.19) (1.12) (0.49) (0.98)
Capital_Inflow * Dependence 0.014*** 0.022*** 0.014** 0.014*** 0.022*** 0.014***
(3.21) (2.81) (2.32) (4.42) (3.31) (3.31)
Credit -0.000 -0.000 -0.000 -0.000 -0.000 -0.000
(-0.36) (-0.32) (-0.84) (-0.16) (-0.15) (-0.38)
Credit * Dependence -0.000 -0.000 0.000 -0.000 -0.000 0.000
(-0.85) (-0.81) (0.01) (-1.23) (-0.90) (0.01)
Constant 0.879*** 0.876*** 0.879*** 0.879*** 0.876*** 0.879***
(3.60) (3.59) (3.60) (3.25) (3.13) (3.26)
Industry FE Yes Yes Yes Yes Yes Yes
Country FE Yes Yes Yes Yes Yes Yes
Industry*Country FE Yes Yes Yes Yes Yes Yes
Year FE Yes Yes Yes Yes Yes Yes
Cluster Industry Industry Industry Country Country Country
# Countries 22 22 22 22 22 22
# Industries 28 28 28 28 28 28
N 4396 4396 4396 4396 4396 4396
R 20.259 0.256 0.256 0.259 0.256 0.256
Debt Inflow s Debt Inflow s

Panel B. Robustness to different econometric specifications
TotalCommercial
BanksNon-Banks Total
Commercial
BanksNon-Banks Total
Commercial
BanksNon-Banks Total
Commercial
BanksNon-Banks
[1] [2] [3] [4] [5] [6] [7] [8] [9] [10] [11] [12]
Share (t-1) -4.739*** -4.736*** -4.754*** -0.494*** -0.497*** -0.490*** -0.829*** -0.831*** -0.822*** -3.819*** -3.798*** -3.799***
(-5.38) (-5.40) (-5.40) (-2.87) (-2.90) (-2.85) (-3.57) (-3.56) (-3.55) (-4.24) (-4.21) (-4.22)
Dependence 0.258 0.235 0.235 -3.736*** -3.705*** -3.640*** 0.073 0.049 0.133
(0.61) (0.54) (0.58) (-3.65) (-3.51) (-3.58) (0.24) (0.16) (0.43)
Capital_Inflow 0.005** 0.004 0.007** 0.007*** 0.008*** 0.009***
(2.46) (1.18) (2.05) (4.25) (2.82) (3.13)
Capital_Inflow * Dependence 0.013*** 0.021** 0.013* 0.006** 0.011** 0.006 0.007*** 0.013*** 0.007* 0.015*** 0.023*** 0.015**
(2.74) (2.56) (1.78) (2.07) (2.05) (1.43) (2.87) (2.89) (1.94) (3.47) (2.97) (2.17)
Credit -0.000 -0.000 -0.000 -0.000 -0.000 -0.000
(-0.73) (-0.69) (-1.16) (-1.35) (-1.22) (-1.42)
Credit * Dependence -0.000 -0.000 0.000 0.000 0.000 0.000 0.000 0.000 0.000 0.000 0.000 -0.000
(-0.39) (-0.33) (0.34) (0.35) (0.37) (0.16) (0.56) (0.49) (0.60) (0.05) (0.20) (-0.02)
Constant 0.783*** 0.780*** 0.786*** 1.731*** 1.727*** 1.705*** -0.022 -0.017 -0.025 2.351*** 2.371*** 2.328***
(3.66) (3.65) (3.68) (3.63) (3.52) (3.59) (-0.48) (-0.37) (-0.53) (12.87) (12.94) (12.70)
Industry FE No No No No No No Yes Yes Yes No No No
Country FE No No No Yes Yes Yes No No No No No No
Year FE Yes Yes Yes No No No No No No No No No
Industry*Country FE Yes Yes Yes No No No No No No Yes Yes Yes
Industry*Year FE No No No Yes Yes Yes No No No Yes Yes Yes
Country*Year FE No No No No No No Yes Yes Yes Yes Yes Yes
# Countries 22 22 22 22 22 22 22 22 22 22 22 22
# Industries 28 28 28 28 28 28 28 28 28 28 28 28
N 4396 4396 4396 4396 4396 4396 4396 4396 4396 4396 4396 4396
R 2 0.252 0.249 0.250 0.300 0.298 0.298 0.325 0.326 0.325 0.559 0.558 0.558
Debt Inflow s Debt Inflow s Debt Inflow s Debt Inflow s

Panel C. Robustness to excluding top 5 largest industries and nonlinear dynamics
Total TotalCommercial
BanksNon-Banks Total Total
Commercial
BanksNon-Banks
[1] [2] [3] [4] [5] [6] [7] [8]
Share (t-1) -8.356*** -8.332*** -8.239*** -8.288*** -5.016*** -5.028*** -5.017*** -5.034***
(-5.74) (-5.82) (-5.73) (-5.79) (-5.34) (-5.34) (-5.38) (-5.36)
Capital_Inflow 0.007*** 0.009*** 0.011*** 0.011*** 0.004** 0.005** 0.004 0.007*
(5.08) (4.87) (3.31) (3.70) (2.37) (2.26) (1.10) (1.79)
Capital_Inflow * Dependence 0.008*** 0.010*** 0.015*** 0.011** 0.019*** 0.024*** 0.031*** 0.025***
(3.07) (3.13) (2.74) (2.11) (3.74) (4.31) (3.16) (2.67)
Capital_Inflow ^2 * Dependence -0.000*** -0.001*** -0.002** -0.001***
(-3.54) (-4.26) (-2.46) (-2.70)
Credit -0.000* -0.000 -0.000 -0.000 -0.000 -0.000 -0.000 -0.000
(-1.77) (-1.10) (-1.00) (-1.30) (-0.78) (-0.35) (-0.42) (-0.83)
Credit * Dependence -0.000 -0.000 0.000 0.000 -0.000 -0.000 -0.000 0.000
(-0.20) (-0.08) (0.00) (0.77) (-0.85) (-0.47) (-0.42) (0.27)
Constant 0.485** 0.522** 0.496** 0.476** 0.876*** 0.884*** 0.880*** 0.880***
(2.35) (2.54) (2.38) (2.34) (3.81) (3.84) (3.85) (3.84)
Industry FE Yes Yes Yes Yes Yes Yes Yes Yes
Country FE Yes Yes Yes Yes Yes Yes Yes Yes
Industry*Country FE Yes Yes Yes Yes Yes Yes Yes Yes
Year FE Yes Yes Yes Yes Yes Yes Yes Yes
# Countries 22 22 22 22 22 22 22 22
# Industries 23 23 23 23 28 28 28 28
N 3535 3535 3535 3535 4396 4396 4396 4396
R 2 0.291 0.291 0.287 0.288 0.259 0.261 0.257 0.257
Debt Inflow s Debt Inflow s

47
Figure 1. Total Emerging Market Capital Flows, 1978–2014
Source: IIF and own calculation.
Figure 2. Share of Manufacturing Value Added to Total Value Added, 1978–2014
Source: World Bank and own calculation.
-1,200
-800
-400
0
400
800
1,200
1,600
78 80 82 84 86 88 90 92 94 96 98 00 02 04 06 08 10 12 14
Net Flows
Non-Resident Capital Inf lows
Resident Capital Outf lows
Total Emerging Market Capital Flows
(in $ billion, IIF sample of 30 EM economies over 1978-2014)
.38
.39
.40
.41
.42
.43
98 99 00 01 02 03 04 05 06 07 08 09 10
China
.148
.152
.156
.160
.164
98 99 00 01 02 03 04 05 06 07 08 09 10
India
.164
.168
.172
.176
.180
98 99 00 01 02 03 04 05 06 07 08 09 10
Peru
.14
.16
.18
.20
.22
.24
98 99 00 01 02 03 04 05 06 07 08 09 10
Poland
Share of Manufacturing Value Added for Four Selected Countries
(as f raction of total value added over 1998-2010)

48
Figure 3. Disaggregated Capital Inflows, 1998–2010
(A) (B)
(C)
Source: IIF and own calculation.
0
10
20
30
40
50
98 99 00 01 02 03 04 05 06 07 08 09 10
Priv ate Capital Inf lows =
Equity Inf lows +
Debt Inf lows
Average Private Capital Inflow
(in $ billion, 22 EM economies over 1998-2010)
-4
0
4
8
12
16
20
24
28
98 99 00 01 02 03 04 05 06 07 08 09 10
Equity Inf lows =
Direct Inv estment +
Portf olio Investment
Average Equity Inflows
(in $ billion, 22 EM economies over 1998-2010)
-4
0
4
8
12
16
20
24
28
98 99 00 01 02 03 04 05 06 07 08 09 10
Debt Inf lows =
Commercial Banks +
Non-Banks
Average Debt Inflows
(in $ billion, 22 EM economies over 1998-2010)

49
Figure 4. Private Capital Inflows by Country, 2007
Source: IIF and own calculation.
Figure 5. Private Capital Inflows and Industry Growth, 1998–2010
Source: IIF and UNIDO and own calculation.
-10
0
10
20
30
40
50
Ecu
ador
Indo
nesia
Mor
occo
Mex
ico
China
Arg
entin
a
Colom
bia
Kor
ea
Sou
th A
frica
Bra
zil
India
Chile
Turke
yPer
u
Cze
ch R
epub
lic
Egy
pt
Malay
sia
Polan
d
Rus
sia
Rom
ania
Hun
gary
Bulga
ria
Equity inflows
Debt inflows
90th percentile = 12.12
50th percentile = 4.70
10th percentile = 0.48
Private Capital Inflow
(in % of GDP, 22 EM economies in 2007)
-.15
-.10
-.05
.00
.05
.10
.15
.20
.25
.30
2
3
4
5
6
7
8
9
10
11
1997 1998 1999 2000 2001 2002 2003 2004 2005 2006 2007 2008 2009 2010 2011
Priv ate Capital Inf low (% GDP) - RHS
Industry Output Growth - LHS
Private Capital Inflow and Industry Growth
(22 EM economies over 1998-2010)

50
By country By industry
Row Country
Number of
Industries
w ith Data
ISIC Industry
Number of
Countries
w ith Data
1 Argentina 26 311 Food products 22
2 Brazil 26 313 Beverages 22
3 Bulgaria 28 314 Tobacco 20
4 Chile 23 321 Textiles 22
5 China 28 322 Wearing apparel, except footw ear 22
6 Colombia 28 323 Leather and fur products 22
7 Czech Republic 26 324 Footw ear, except rubber or plastic 22
8 Ecuador 28 331 Wood products, except furniture 22
9 Egypt 28 332 Furniture and fixtures, excel. metal 22
10 Hungary 28 341 Paper products 22
11 India 28 342 Printing and publishing 21
12 Indonesia 28 351 Industrial chemicals 22
13 Korea 28 352 Other chemical product 20
14 Malaysia 28 353 Petroleum refineries 19
15 Mexico 28 354 Misc. petroleum and coal products 21
16 Morocco 28 355 Rubber products 22
17 Peru 27 356 Plastic products 22
18 Poland 28 361 Pottery, china, earthenw are 16
19 Romania 28 362 Glass and products 22
20 Russia 27 369 Other non-metallic mineral products 18
21 South Africa 22 371 Iron and steel 22
22 Turkey 28 372 Non-ferrous metals 22
381 Fabricated metal products 22
382 Non-electrical machinery 22
383 Electrical machinery 22
384 Transport equipment 22
385 Professional and scientif ic equipment 22
390 Other manufacturing 22
Appendix. Composition of Sample


