15
Real Estate Leases Heritage Land Bank Real Estate Services Community Development Real Estate 24 - 1
| Date post: | 26-Mar-2018 |
| Category: |
Documents |
| Upload: | vuongtuyen |
| View: | 213 times |
| Download: | 0 times |
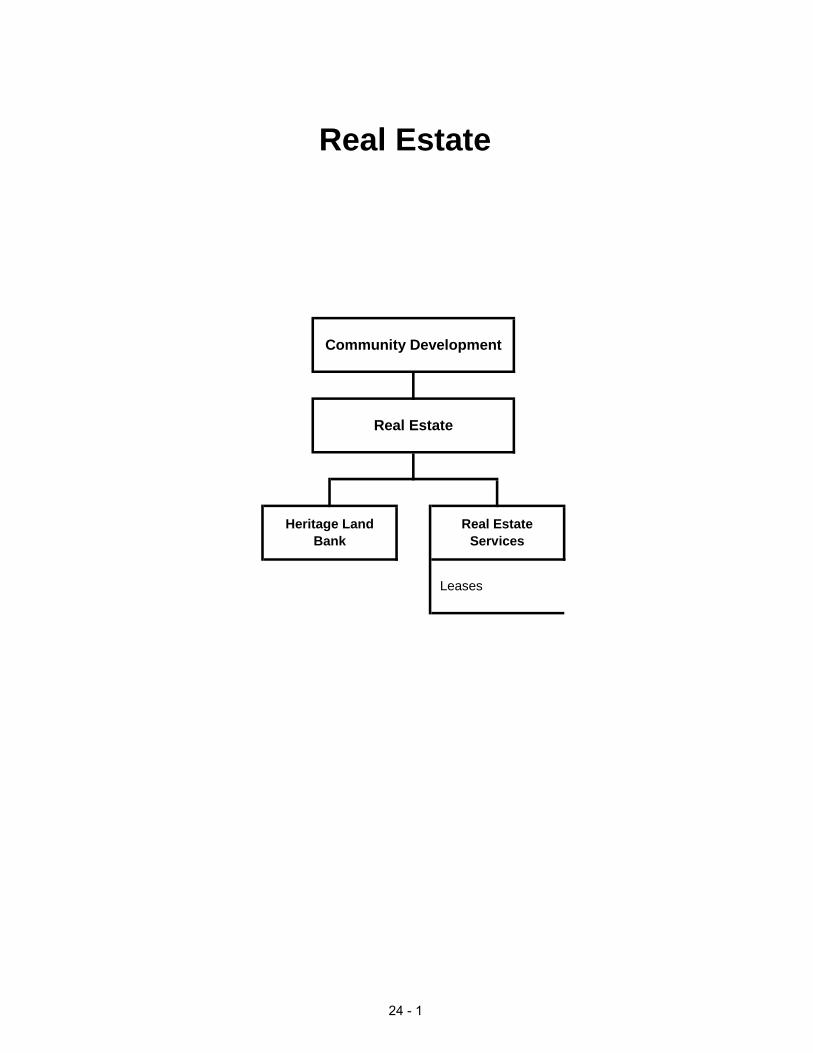
Real Estate
Leases
Heritage LandBank
Real EstateServices
Community Development
Real Estate
24 - 1
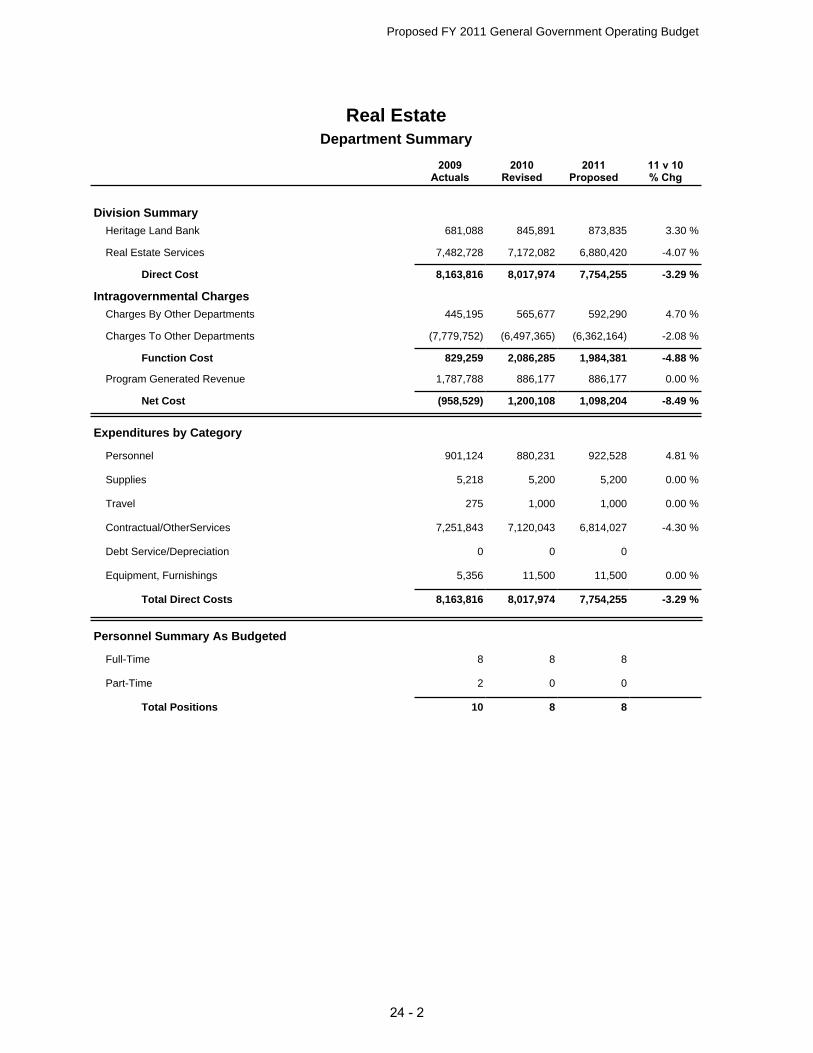
Real EstateDepartment Summary
2010Revised
2011Proposed
2009Actuals
11 v 10% Chg
Proposed FY 2011 General Government Operating Budget
Program Generated Revenue 1,787,788 886,177 886,177 0.00 %
Charges By Other Departments 445,195 565,677 592,290 4.70 %
Charges To Other Departments (7,779,752) (6,497,365) (6,362,164) -2.08 %
Intragovernmental Charges
Real Estate Services 7,482,728 7,172,082 6,880,420 -4.07 %
Heritage Land Bank 681,088 845,891 873,835 3.30 %
Direct Cost 8,163,816 8,017,974 7,754,255 -3.29 %
Function Cost 829,259 2,086,285 1,984,381 -4.88 %
Net Cost (958,529) 1,200,108 1,098,204 -8.49 %
Division Summary
Contractual/OtherServices 7,251,843 7,120,043 6,814,027 -4.30 %
Debt Service/Depreciation 0 0 0
Equipment, Furnishings 5,356 11,500 11,500 0.00 %
Travel 275 1,000 1,000 0.00 %
Personnel 901,124 880,231 922,528 4.81 %
Supplies 5,218 5,200 5,200 0.00 %
Total Direct Costs 8,163,816 8,017,974 7,754,255 -3.29 %
Expenditures by Category
Part-Time 2 0 0
Full-Time 8 8 8
Total Positions 10 8 8
Personnel Summary As Budgeted
24 - 2
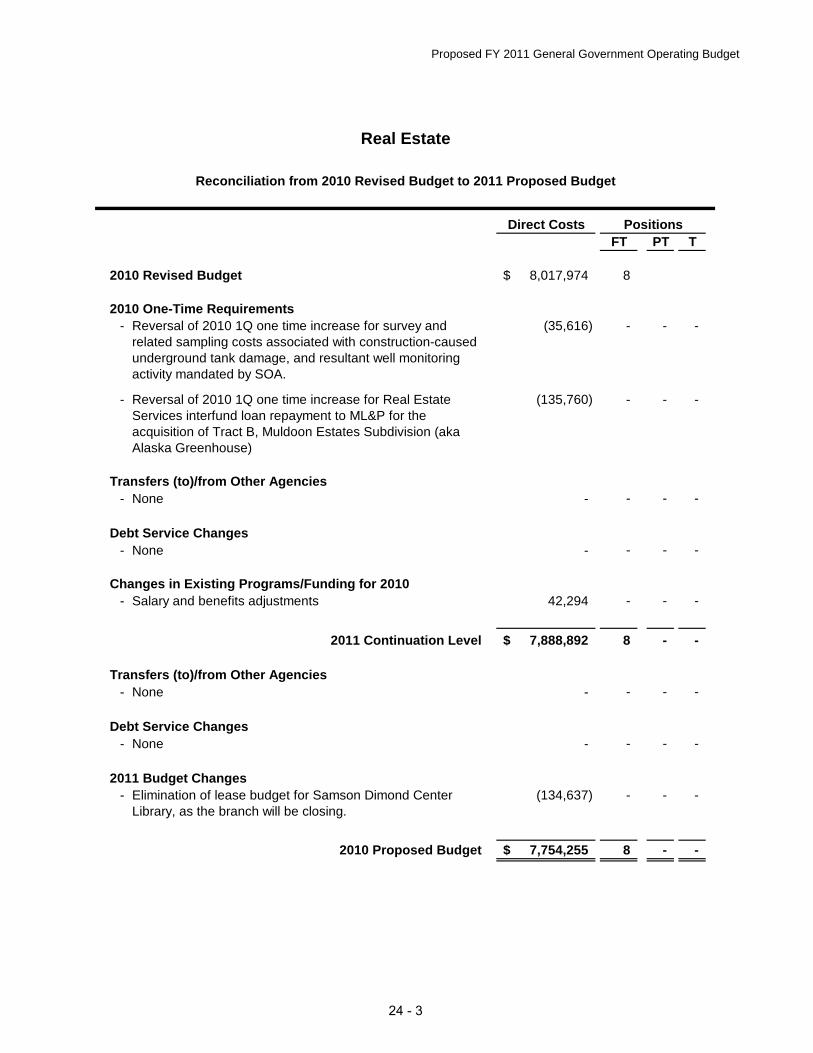
Proposed FY 2011 General Government Operating Budget
Direct CostsFT PT T
8,017,974$ 8
- Reversal of 2010 1Q one time increase for survey and related sampling costs associated with construction-caused underground tank damage, and resultant well monitoring activity mandated by SOA.
(35,616) - - -
- Reversal of 2010 1Q one time increase for Real Estate Services interfund loan repayment to ML&P for the acquisition of Tract B, Muldoon Estates Subdivision (aka Alaska Greenhouse)
(135,760) - - -
- None - - - -
- None - - - -
- Salary and benefits adjustments 42,294 - - -
7,888,892$ 8 - -
- None - - - -
- None - - - -
- Elimination of lease budget for Samson Dimond Center Library, as the branch will be closing.
(134,637) - - -
2010 Proposed Budget 7,754,255$ 8 - -
Debt Service Changes
Reconciliation from 2010 Revised Budget to 2011 Proposed Budget
Positions
2011 Budget Changes
2011 Continuation Level
Transfers (to)/from Other Agencies
Real Estate
Debt Service Changes
Changes in Existing Programs/Funding for 2010
Transfers (to)/from Other Agencies
2010 Revised Budget
2010 One-Time Requirements
24 - 3
Proposed FY 2011 General Government Operating Budget
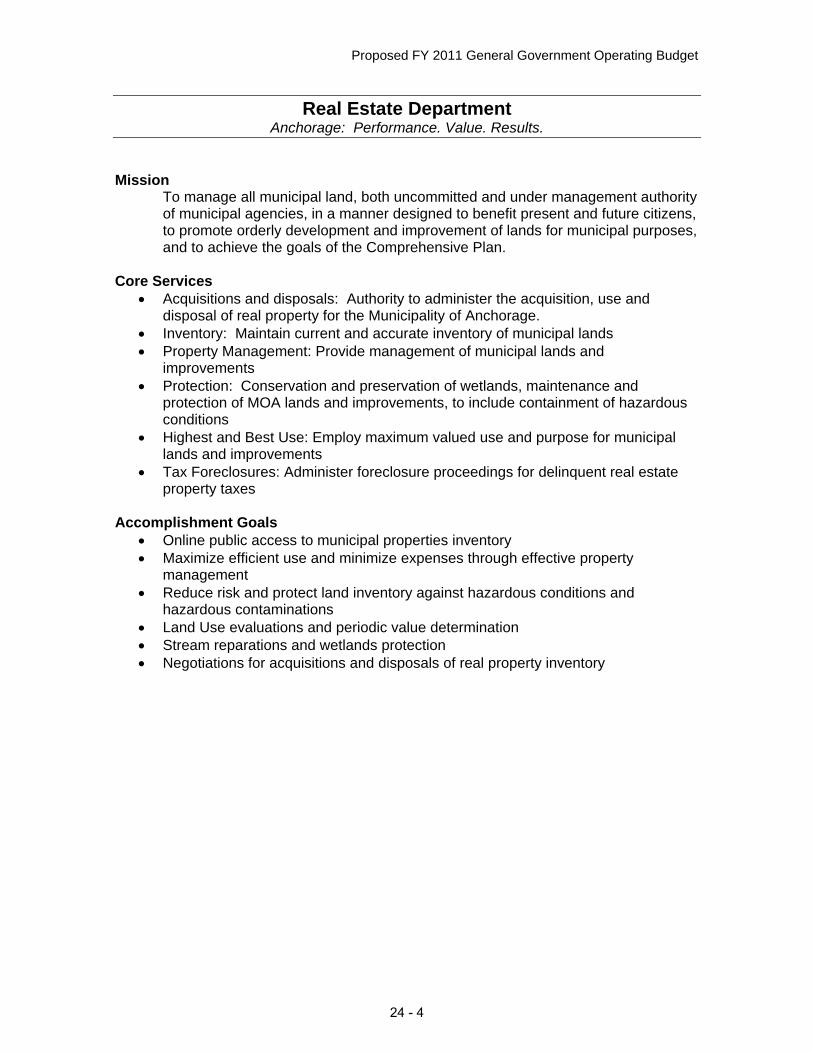
Real Estate Department Anchorage: Performance. Value. Results.
Mission
To manage all municipal land, both uncommitted and under management authority of municipal agencies, in a manner designed to benefit present and future citizens, to promote orderly development and improvement of lands for municipal purposes, and to achieve the goals of the Comprehensive Plan.
Core Services
• Acquisitions and disposals: Authority to administer the acquisition, use and disposal of real property for the Municipality of Anchorage.
• Inventory: Maintain current and accurate inventory of municipal lands • Property Management: Provide management of municipal lands and
improvements • Protection: Conservation and preservation of wetlands, maintenance and
protection of MOA lands and improvements, to include containment of hazardous conditions
• Highest and Best Use: Employ maximum valued use and purpose for municipal lands and improvements
• Tax Foreclosures: Administer foreclosure proceedings for delinquent real estate property taxes
Accomplishment Goals
• Online public access to municipal properties inventory • Maximize efficient use and minimize expenses through effective property
management • Reduce risk and protect land inventory against hazardous conditions and
hazardous contaminations • Land Use evaluations and periodic value determination • Stream reparations and wetlands protection • Negotiations for acquisitions and disposals of real property inventory
24 - 4
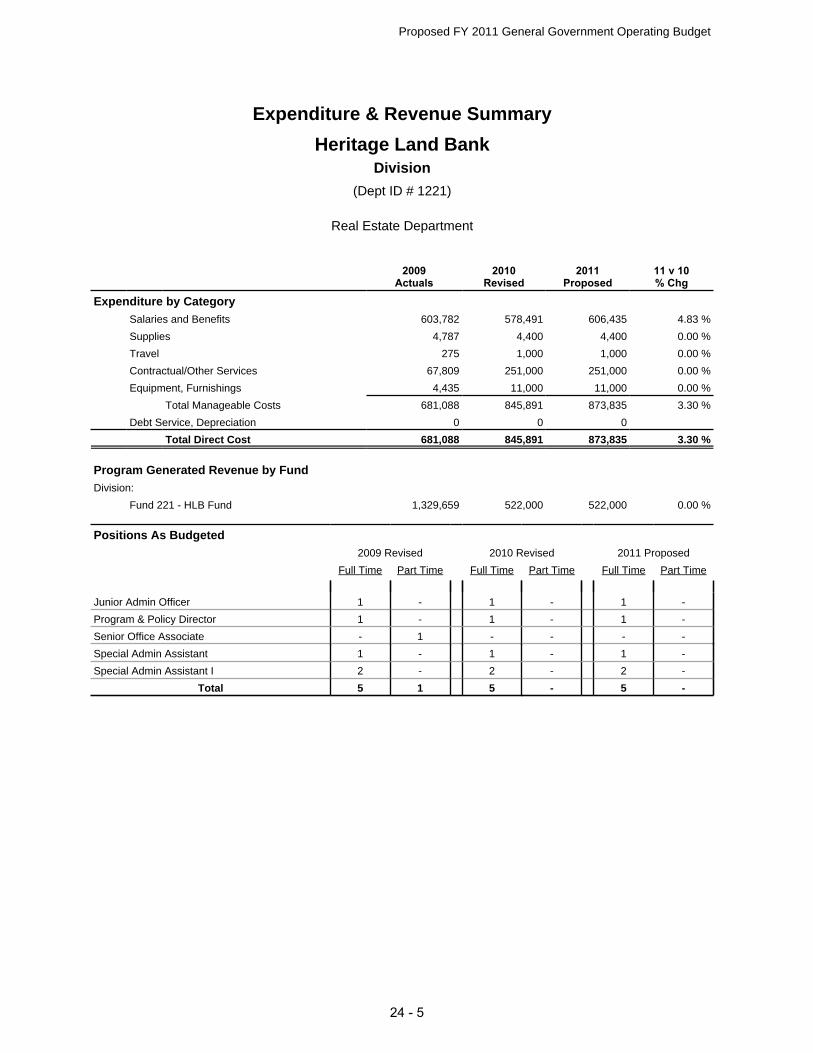
Expenditure & Revenue Summary
Heritage Land Bank
(Dept ID # 1221)
Real Estate Department
Division
Proposed FY 2011 General Government Operating Budget
Debt Service, Depreciation 0 0 0
Travel 275 1,000 1,000 0.00 %
Contractual/Other Services 67,809 251,000 251,000 0.00 %
Equipment, Furnishings 4,435 11,000 11,000 0.00 %
Salaries and Benefits 603,782 578,491 606,435 4.83 %
Supplies 4,787 4,400 4,400 0.00 %
Total Manageable Costs 681,088 845,891 873,835 3.30 %
Total Direct Cost 681,088 845,891 873,835 3.30 %
2009Actuals
2010Revised
2011Proposed
11 v 10% Chg
Expenditure by Category
Fund 221 - HLB Fund 1,329,659 522,000 522,000 0.00 %
Division:
Program Generated Revenue by Fund
Senior Office Associate - 1 - - - -
Junior Admin Officer 1 - 1 - 1 -
Program & Policy Director 1 - 1 - 1 -
Special Admin Assistant I 2 - 2 - 2 -
Special Admin Assistant 1 - 1 - 1 -
Total 5 1 5 - 5 -
2009 Revised 2010 Revised 2011 Proposed
Positions As Budgeted
Full Time Part Time Full Time Part Time Full Time Part Time
24 - 5
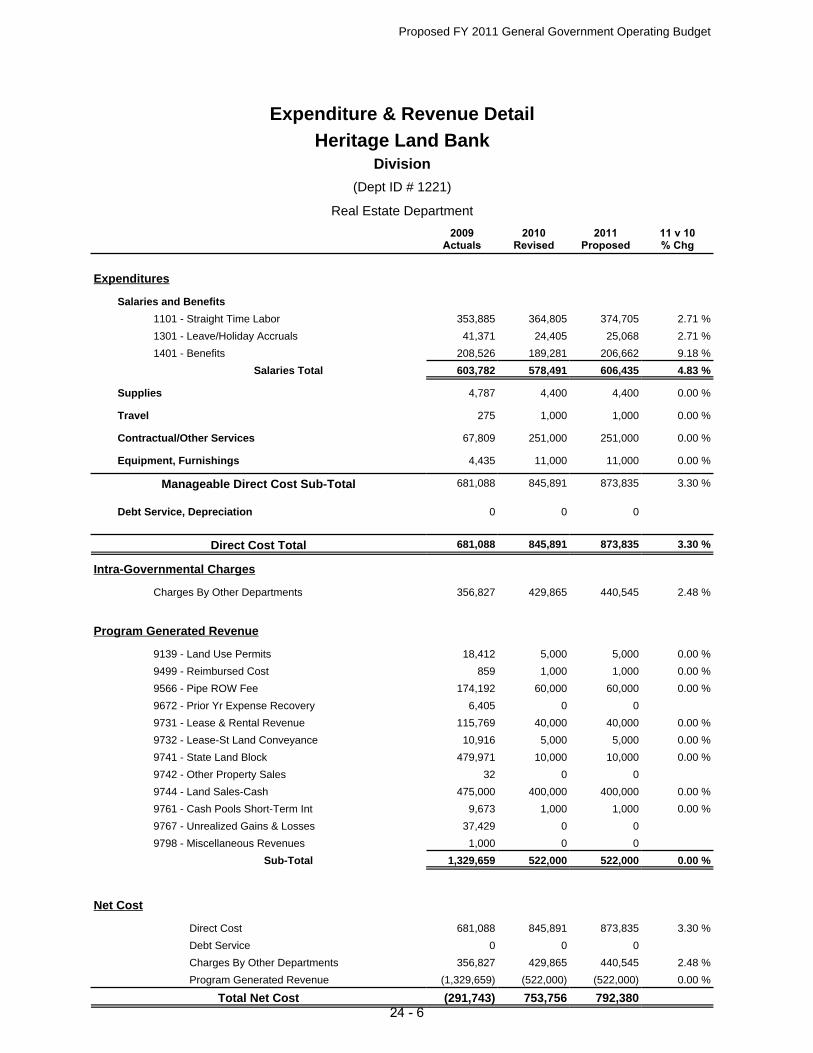
Expenditure & Revenue DetailHeritage Land Bank
(Dept ID # 1221)
Real Estate Department
Division
2010Revised
2011Proposed
2009Actuals
11 v 10% Chg
Proposed FY 2011 General Government Operating Budget
Program Generated Revenue (1,329,659) (522,000) (522,000) 0.00 %
Charges By Other Departments 356,827 429,865 440,545 2.48 %
Debt Service 0 0 0
Direct Cost 681,088 845,891 873,835 3.30 %
Total Net Cost (291,743) 753,756 792,380
Net Cost
9672 - Prior Yr Expense Recovery 6,405 0 0
9731 - Lease & Rental Revenue 115,769 40,000 40,000 0.00 %
9732 - Lease-St Land Conveyance 10,916 5,000 5,000 0.00 %
9139 - Land Use Permits 18,412 5,000 5,000 0.00 %
9499 - Reimbursed Cost 859 1,000 1,000 0.00 %
9566 - Pipe ROW Fee 174,192 60,000 60,000 0.00 %
9741 - State Land Block 479,971 10,000 10,000 0.00 %
9767 - Unrealized Gains & Losses 37,429 0 0
9798 - Miscellaneous Revenues 1,000 0 0
9761 - Cash Pools Short-Term Int 9,673 1,000 1,000 0.00 %
9742 - Other Property Sales 32 0 0
9744 - Land Sales-Cash 475,000 400,000 400,000 0.00 %
Sub-Total 1,329,659 522,000 522,000 0.00 %
Program Generated Revenue
Charges By Other Departments 356,827 429,865 440,545 2.48 %
Intra-Governmental Charges
Debt Service, Depreciation 0 0 0
Equipment, Furnishings 4,435 11,000 11,000 0.00 %
Contractual/Other Services 67,809 251,000 251,000 0.00 %
Travel 275 1,000 1,000 0.00 %
Supplies 4,787 4,400 4,400 0.00 %
1401 - Benefits 208,526 189,281 206,662 9.18 %
1301 - Leave/Holiday Accruals 41,371 24,405 25,068 2.71 %
1101 - Straight Time Labor 353,885 364,805 374,705 2.71 %
Salaries Total 603,782 578,491 606,435 4.83 %
Salaries and Benefits
Manageable Direct Cost Sub-Total 681,088 845,891 873,835 3.30 %
Direct Cost Total 681,088 845,891 873,835 3.30 %
Expenditures
24 - 6
Proposed FY 2011 General Government Operating Budget
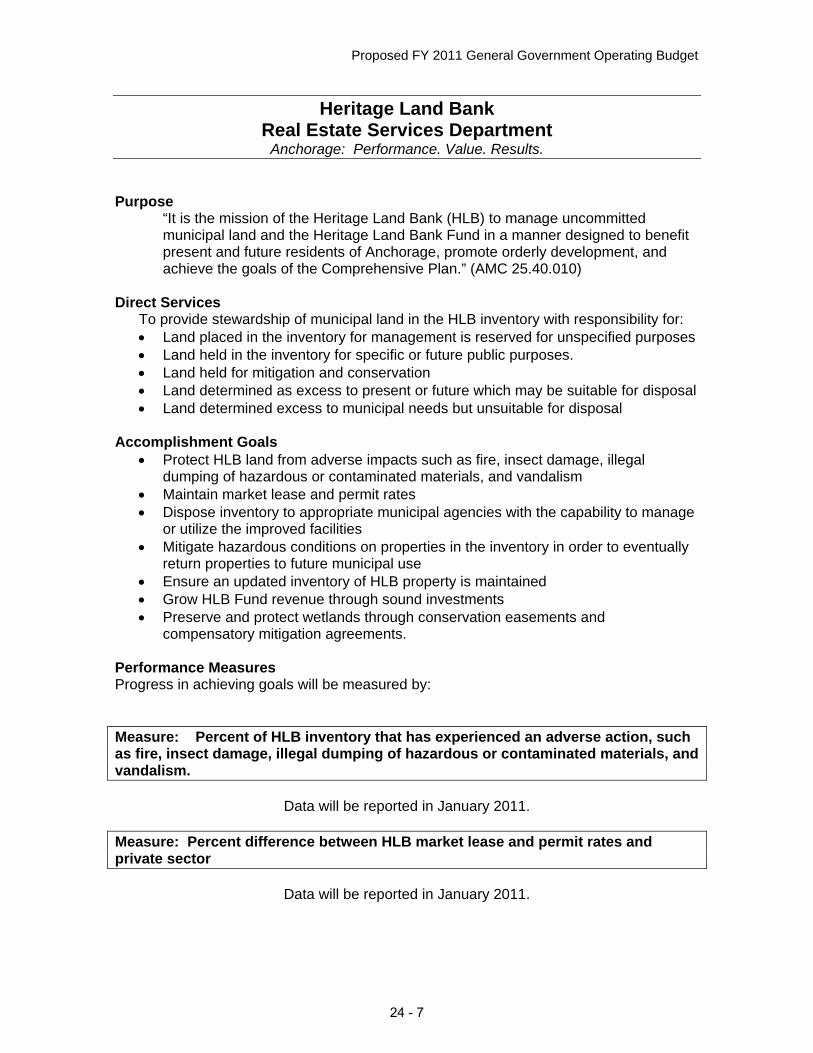
Heritage Land Bank Real Estate Services Department
Anchorage: Performance. Value. Results. Purpose
“It is the mission of the Heritage Land Bank (HLB) to manage uncommitted municipal land and the Heritage Land Bank Fund in a manner designed to benefit present and future residents of Anchorage, promote orderly development, and achieve the goals of the Comprehensive Plan.” (AMC 25.40.010)
Direct Services
To provide stewardship of municipal land in the HLB inventory with responsibility for: • Land placed in the inventory for management is reserved for unspecified purposes • Land held in the inventory for specific or future public purposes. • Land held for mitigation and conservation • Land determined as excess to present or future which may be suitable for disposal • Land determined excess to municipal needs but unsuitable for disposal
Accomplishment Goals
• Protect HLB land from adverse impacts such as fire, insect damage, illegal dumping of hazardous or contaminated materials, and vandalism
• Maintain market lease and permit rates • Dispose inventory to appropriate municipal agencies with the capability to manage
or utilize the improved facilities • Mitigate hazardous conditions on properties in the inventory in order to eventually
return properties to future municipal use • Ensure an updated inventory of HLB property is maintained • Grow HLB Fund revenue through sound investments • Preserve and protect wetlands through conservation easements and
compensatory mitigation agreements. Performance Measures Progress in achieving goals will be measured by: Measure: Percent of HLB inventory that has experienced an adverse action, such as fire, insect damage, illegal dumping of hazardous or contaminated materials, and vandalism.
Data will be reported in January 2011. Measure: Percent difference between HLB market lease and permit rates and private sector
Data will be reported in January 2011.
24 - 7
Proposed FY 2011 General Government Operating Budget
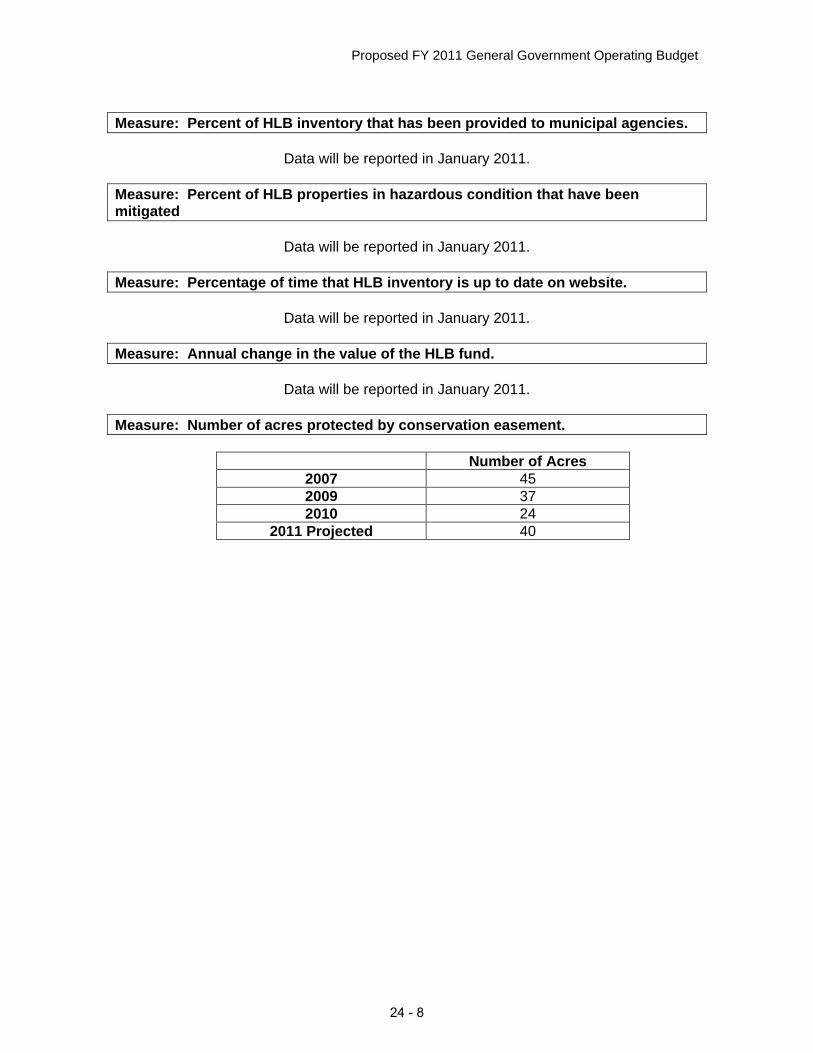
Measure: Percent of HLB inventory that has been provided to municipal agencies.
Data will be reported in January 2011.
Measure: Percent of HLB properties in hazardous condition that have been mitigated
Data will be reported in January 2011. Measure: Percentage of time that HLB inventory is up to date on website.
Data will be reported in January 2011. Measure: Annual change in the value of the HLB fund.
Data will be reported in January 2011. Measure: Number of acres protected by conservation easement.
Number of Acres 2007 45 2009 37 2010 24
2011 Projected 40
24 - 8
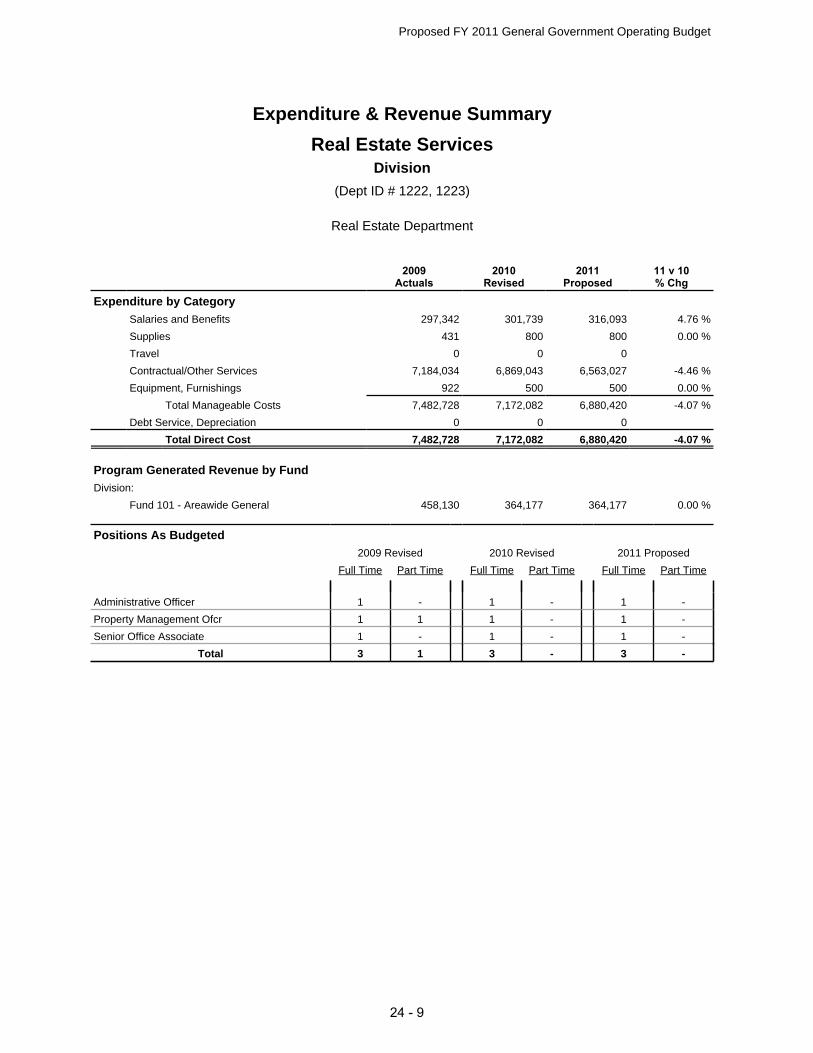
Expenditure & Revenue Summary
Real Estate Services
(Dept ID # 1222, 1223)
Real Estate Department
Division
Proposed FY 2011 General Government Operating Budget
Debt Service, Depreciation 0 0 0
Travel 0 0 0
Contractual/Other Services 7,184,034 6,869,043 6,563,027 -4.46 %
Equipment, Furnishings 922 500 500 0.00 %
Salaries and Benefits 297,342 301,739 316,093 4.76 %
Supplies 431 800 800 0.00 %
Total Manageable Costs 7,482,728 7,172,082 6,880,420 -4.07 %
Total Direct Cost 7,482,728 7,172,082 6,880,420 -4.07 %
2009Actuals
2010Revised
2011Proposed
11 v 10% Chg
Expenditure by Category
Fund 101 - Areawide General 458,130 364,177 364,177 0.00 %
Division:
Program Generated Revenue by Fund
Property Management Ofcr 1 1 1 - 1 -
Administrative Officer 1 - 1 - 1 -
Senior Office Associate 1 - 1 - 1 -
Total 3 1 3 - 3 -
2009 Revised 2010 Revised 2011 Proposed
Positions As Budgeted
Full Time Part Time Full Time Part Time Full Time Part Time
24 - 9
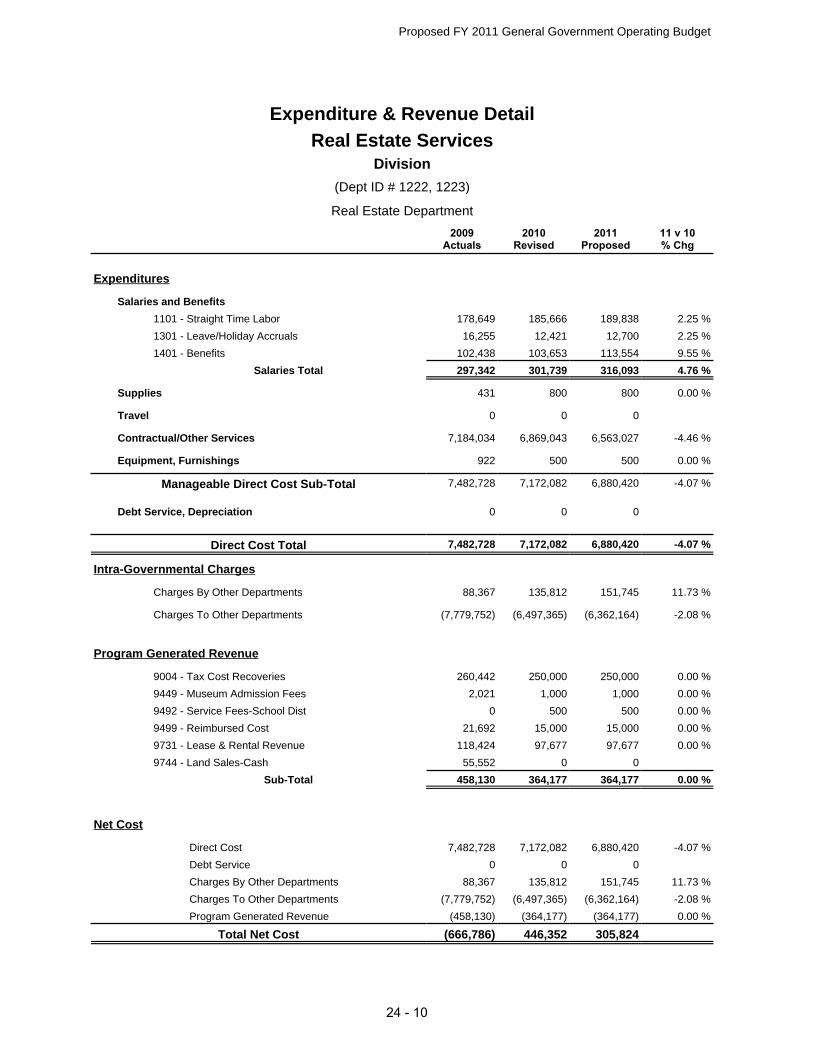
Expenditure & Revenue DetailReal Estate Services
(Dept ID # 1222, 1223)
Real Estate Department
Division
2010Revised
2011Proposed
2009Actuals
11 v 10% Chg
Proposed FY 2011 General Government Operating Budget
Program Generated Revenue (458,130) (364,177) (364,177) 0.00 %
Charges To Other Departments (7,779,752) (6,497,365) (6,362,164) -2.08 %
Charges By Other Departments 88,367 135,812 151,745 11.73 %
Debt Service 0 0 0
Direct Cost 7,482,728 7,172,082 6,880,420 -4.07 %
Total Net Cost (666,786) 446,352 305,824
Net Cost
9499 - Reimbursed Cost 21,692 15,000 15,000 0.00 %
9731 - Lease & Rental Revenue 118,424 97,677 97,677 0.00 %
9449 - Museum Admission Fees 2,021 1,000 1,000 0.00 %
9492 - Service Fees-School Dist 0 500 500 0.00 %
9744 - Land Sales-Cash 55,552 0 0
9004 - Tax Cost Recoveries 260,442 250,000 250,000 0.00 %
Sub-Total 458,130 364,177 364,177 0.00 %
Program Generated Revenue
Charges To Other Departments (7,779,752) (6,497,365) (6,362,164) -2.08 %
Charges By Other Departments 88,367 135,812 151,745 11.73 %
Intra-Governmental Charges
Debt Service, Depreciation 0 0 0
Equipment, Furnishings 922 500 500 0.00 %
Contractual/Other Services 7,184,034 6,869,043 6,563,027 -4.46 %
Travel 0 0 0
Supplies 431 800 800 0.00 %
1301 - Leave/Holiday Accruals 16,255 12,421 12,700 2.25 %
1401 - Benefits 102,438 103,653 113,554 9.55 %
1101 - Straight Time Labor 178,649 185,666 189,838 2.25 %
Salaries Total 297,342 301,739 316,093 4.76 %
Salaries and Benefits
Manageable Direct Cost Sub-Total 7,482,728 7,172,082 6,880,420 -4.07 %
Direct Cost Total 7,482,728 7,172,082 6,880,420 -4.07 %
Expenditures
24 - 10
Proposed FY 2011 General Government Operating Budget
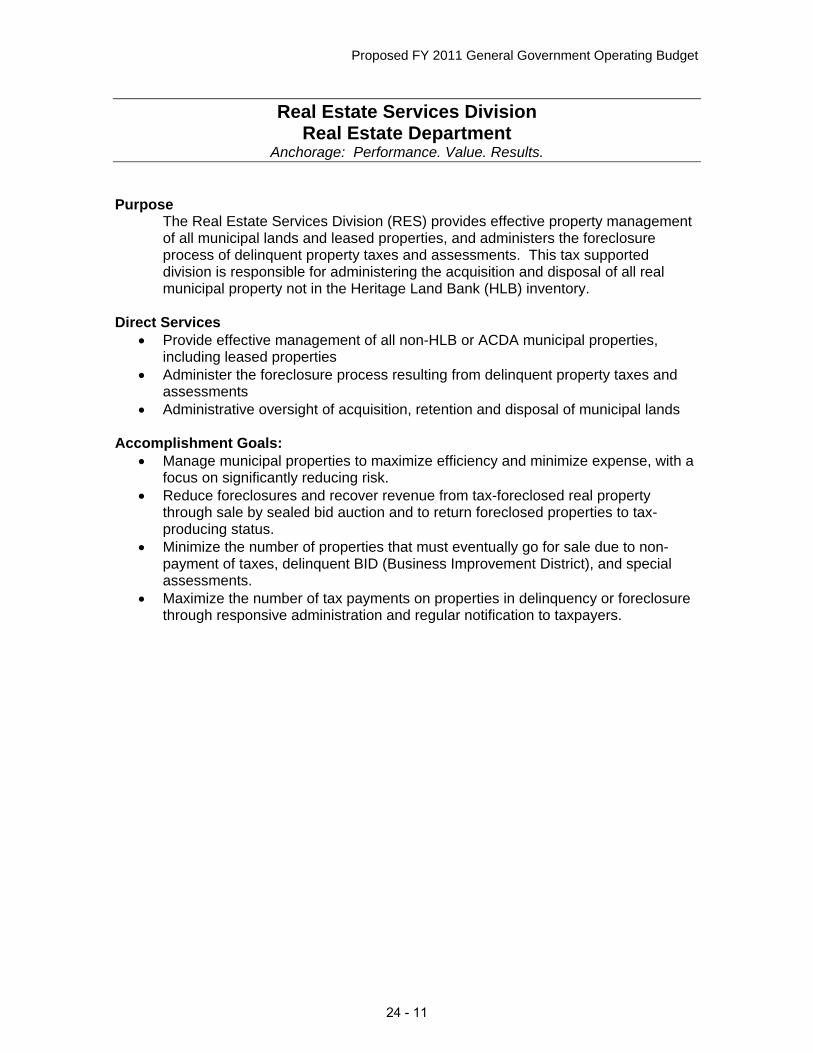
Real Estate Services Division Real Estate Department
Anchorage: Performance. Value. Results. Purpose
The Real Estate Services Division (RES) provides effective property management of all municipal lands and leased properties, and administers the foreclosure process of delinquent property taxes and assessments. This tax supported division is responsible for administering the acquisition and disposal of all real municipal property not in the Heritage Land Bank (HLB) inventory.
Direct Services
• Provide effective management of all non-HLB or ACDA municipal properties, including leased properties
• Administer the foreclosure process resulting from delinquent property taxes and assessments
• Administrative oversight of acquisition, retention and disposal of municipal lands Accomplishment Goals:
• Manage municipal properties to maximize efficiency and minimize expense, with a focus on significantly reducing risk.
• Reduce foreclosures and recover revenue from tax-foreclosed real property through sale by sealed bid auction and to return foreclosed properties to tax-producing status.
• Minimize the number of properties that must eventually go for sale due to non-payment of taxes, delinquent BID (Business Improvement District), and special assessments.
• Maximize the number of tax payments on properties in delinquency or foreclosure through responsive administration and regular notification to taxpayers.
24 - 11
Proposed FY 2011 General Government Operating Budget
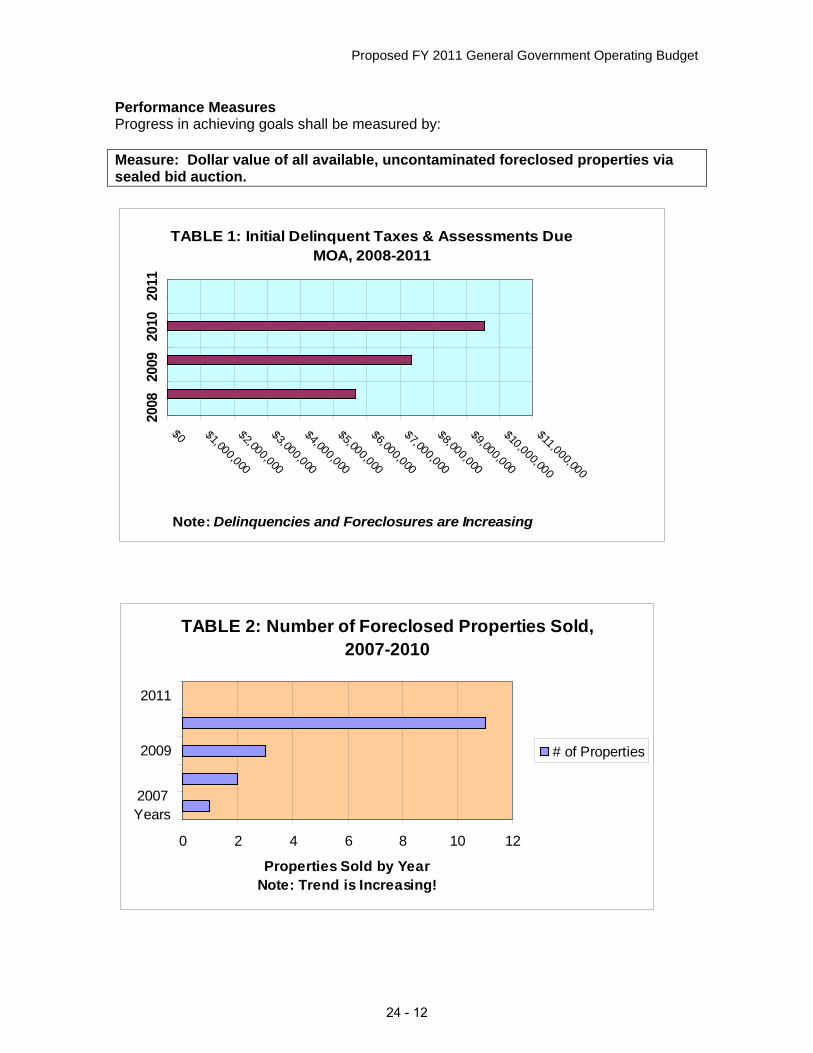
Performance Measures Progress in achieving goals shall be measured by: Measure: Dollar value of all available, uncontaminated foreclosed properties via sealed bid auction.
TABLE 1: Initial Delinquent Taxes & Assessments Due MOA, 2008-2011
$0 $1,000,000
$2,000,000
$3,000,000
$4,000,000
$5,000,000
$6,000,000
$7,000,000
$8,000,000
$9,000,000
$10,000,000
$11,000,000
2008
20
09
2010
20
11
Note: Delinquencies and Foreclosures are Increasing
TABLE 2: Number of Foreclosed Properties Sold, 2007-2010
0 2 4 6 8 10 12
2007Years
2009
2011
Properties Sold by YearNote: Trend is Increasing!
# of Properties
24 - 12
Proposed FY 2011 General Government Operating Budget
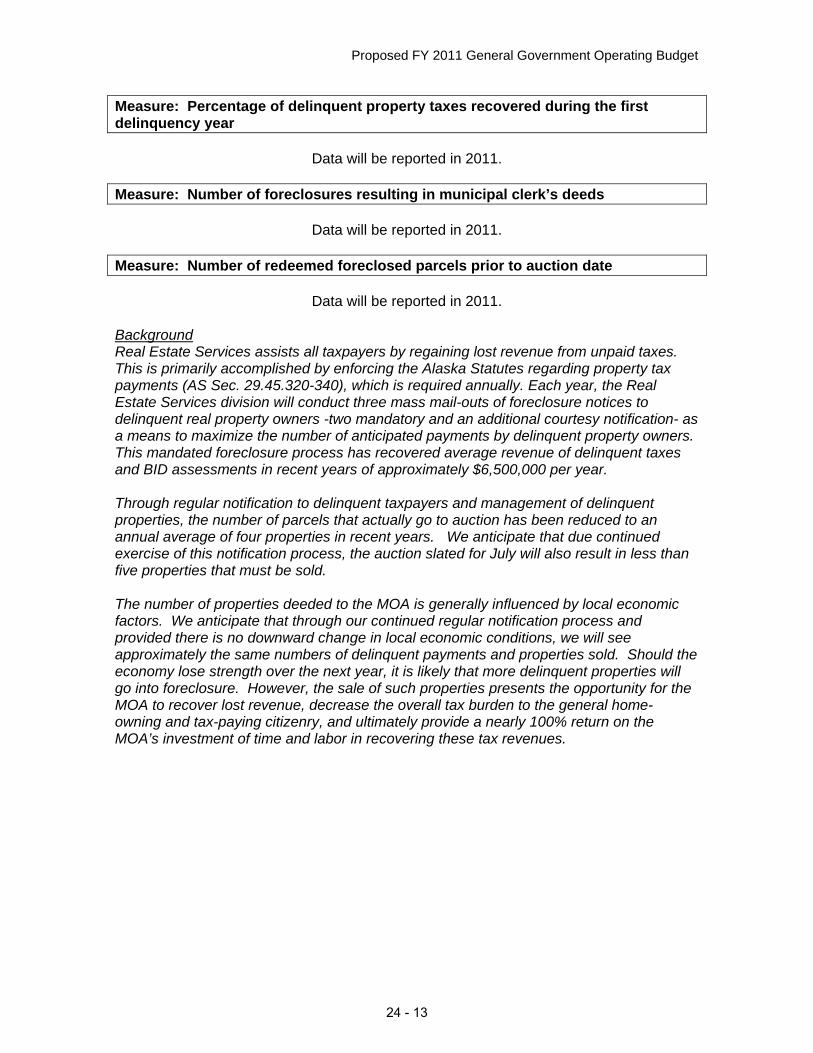
Measure: Percentage of delinquent property taxes recovered during the first delinquency year
Data will be reported in 2011. Measure: Number of foreclosures resulting in municipal clerk’s deeds
Data will be reported in 2011. Measure: Number of redeemed foreclosed parcels prior to auction date
Data will be reported in 2011.
Real Estate Services assists all taxpayers by regaining lost revenue from unpaid taxes. This is primarily accomplished by enforcing the Alaska Statutes regarding property tax payments (AS Sec. 29.45.320-340), which is required annually. Each year, the Real Estate Services division will conduct three mass mail-outs of foreclosure notices to delinquent real property owners -two mandatory and an additional courtesy notification- as a means to maximize the number of anticipated payments by delinquent property owners. This mandated foreclosure process has recovered average revenue of delinquent taxes and BID assessments in recent years of approximately $6,500,000 per year.
Background
Through regular notification to delinquent taxpayers and management of delinquent properties, the number of parcels that actually go to auction has been reduced to an annual average of four properties in recent years. We anticipate that due continued exercise of this notification process, the auction slated for July will also result in less than five properties that must be sold. The number of properties deeded to the MOA is generally influenced by local economic factors. We anticipate that through our continued regular notification process and provided there is no downward change in local economic conditions, we will see approximately the same numbers of delinquent payments and properties sold. Should the economy lose strength over the next year, it is likely that more delinquent properties will go into foreclosure. However, the sale of such properties presents the opportunity for the MOA to recover lost revenue, decrease the overall tax burden to the general home-owning and tax-paying citizenry, and ultimately provide a nearly 100% return on the MOA’s investment of time and labor in recovering these tax revenues.
24 - 13
Proposed FY 2011 General Government Operating Budget
Leases Section Real Estate Services Division
Real Estate Department Anchorage: Performance. Value. Results.
Purpose
To negotiate, manage and fund the leasing of office, warehouse and other required spaces for local government agencies in order for them to perform their services on behalf of citizens.
Direct Services
Public and private businesses acting as Lessors of facilities space for municipal agencies. As a result, this serves the public by providing leased space for local government agencies and programs that also serve the public.
Accomplishment Goals
• Provide competitively negotiated leases and effectively administer lease contracts for municipal agencies throughout the Municipality of Anchorage.
• Provide the most cost-effective space management services to general government agencies for municipal office facilities.
Progress in achieving goals shall be measured by: Performance Measures
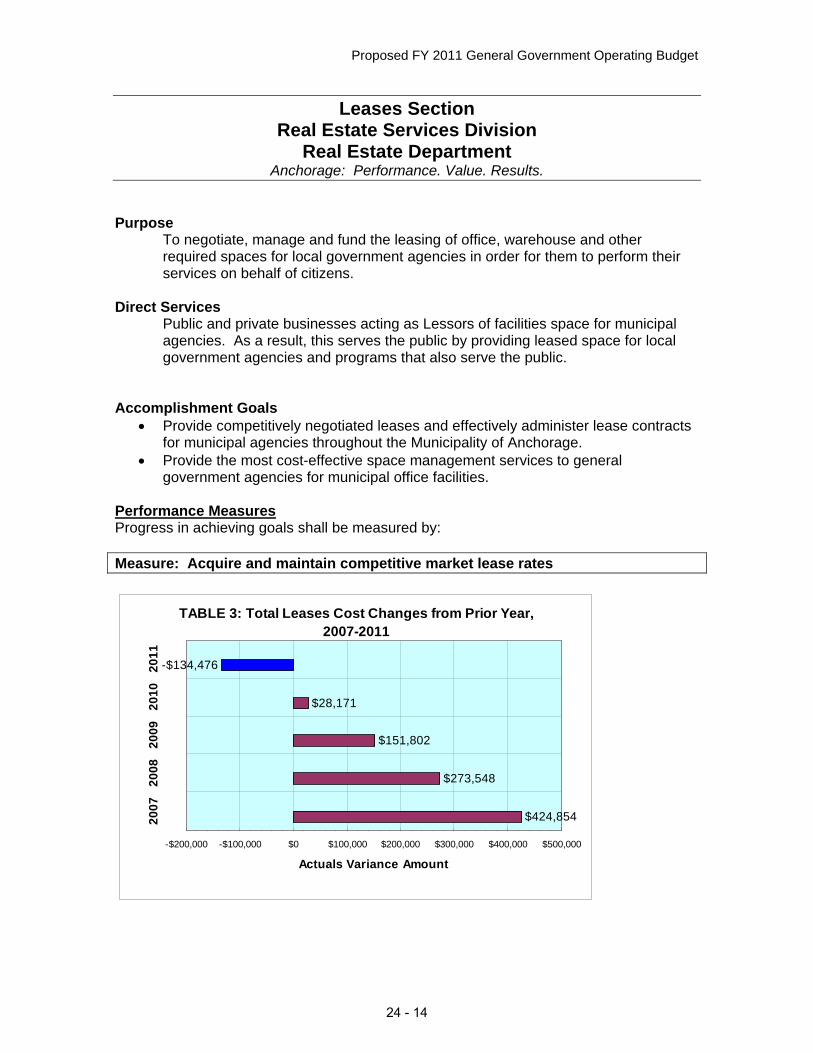
Measure: Acquire and maintain competitive market lease rates
TABLE 3: Total Leases Cost Changes from Prior Year, 2007-2011
$424,854
$273,548
$151,802
$28,171
-$134,476
-$200,000 -$100,000 $0 $100,000 $200,000 $300,000 $400,000 $500,000
2007
20
08
2009
20
10
2011
Actuals Variance Amount
24 - 14
Proposed FY 2011 General Government Operating Budget
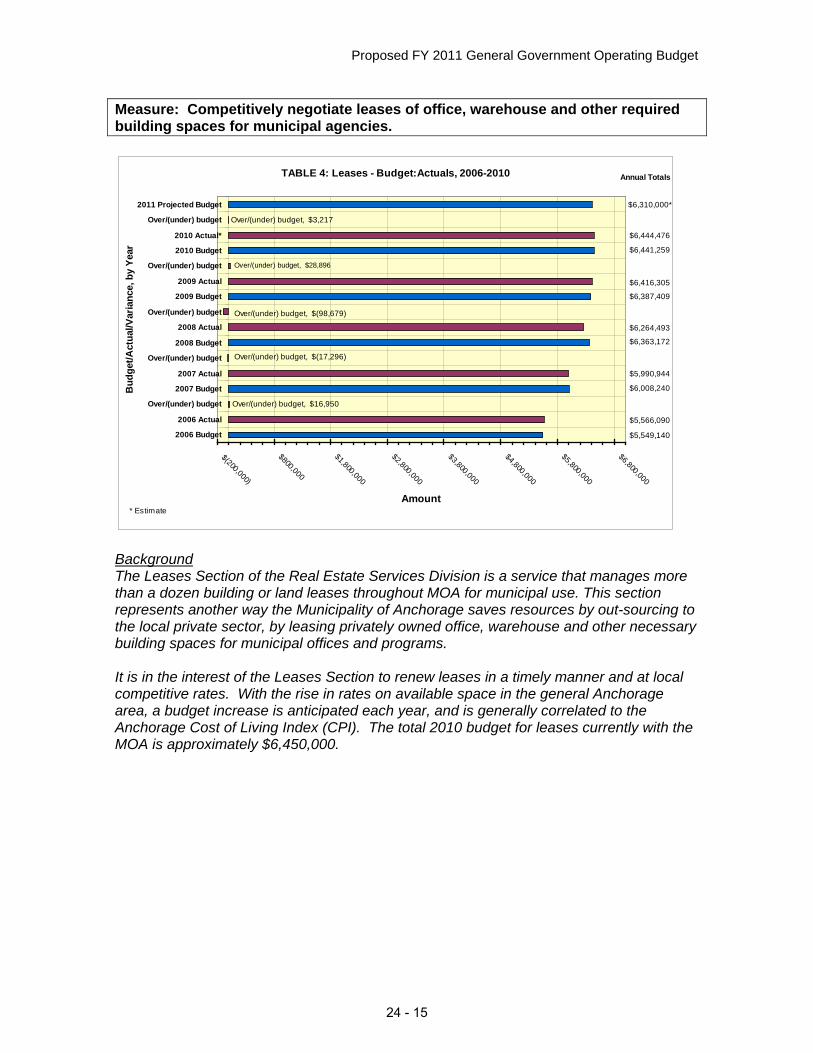
Measure: Competitively negotiate leases of office, warehouse and other required building spaces for municipal agencies.
TABLE 4: Leases - Budget:Actuals, 2006-2010
Over/(under) budget, $16,950
Over/(under) budget, $3,217
$5,549,140
$5,566,090
$6,008,240
$5,990,944
$6,363,172
$6,264,493
$6,387,409
$6,416,305
$6,441,259
$6,444,476
$6,310,000*
Over/(under) budget, $28,896
$(200,000)
$800,000
$1,800,000
$2,800,000
$3,800,000
$4,800,000
$5,800,000
$6,800,000
2006 Budget
2006 Actual
Over/(under) budget
2007 Budget
2007 Actual
Over/(under) budget
2008 Budget
2008 Actual
Over/(under) budget
2009 Budget
2009 Actual
Over/(under) budget
2010 Budget
2010 Actual*
Over/(under) budget
2011 Projected Budget
Bud
get/A
ctua
l/Var
ianc
e, b
y Ye
ar
Amount
Over/(under) budget, $(98,679)
Annual Totals
Over/(under) budget, $(17,296)
* Estimate
The Leases Section of the Real Estate Services Division is a service that manages more than a dozen building or land leases throughout MOA for municipal use. This section represents another way the Municipality of Anchorage saves resources by out-sourcing to the local private sector, by leasing privately owned office, warehouse and other necessary building spaces for municipal offices and programs.
Background
It is in the interest of the Leases Section to renew leases in a timely manner and at local competitive rates. With the rise in rates on available space in the general Anchorage area, a budget increase is anticipated each year, and is generally correlated to the Anchorage Cost of Living Index (CPI). The total 2010 budget for leases currently with the MOA is approximately $6,450,000.
24 - 15


