56
Realizing Growth and Value CAE Annual Report for the year ended March 31,2001 CAE Annual Report for the year ended March 31,2001

PO Box 30, Suite 3060, Royal Bank PlazaToronto, Ontario, Canada M5J 2J1 www.cae.com
Realizing Growth and Value
CAE Annual Report for the year ended March 31, 2001
CA
E A
nn
ua
l Re
po
rt for th
e y
ea
r en
de
d M
arc
h 3
1,2
00
1
Information for Shareholders
CAE Common SharesCAE’s shares are traded on theToronto Stock Exchange under the symbol “CAE”.
Dividend Reinvestment PlanRegistered shareholders of CAE Inc.wishing to receive dividends in theform of CAE Inc. common sharesrather than a cash payment may participate in CAE’s dividend reinvestment plan.
Through this plan, quarterly dividends can be reinvested in CAE common shares at the averagemarket price. This price will be theweighted average trading prices of the common shares on the TorontoStock Exchange for the five (5) tradingdays immediately preceding the dividend payment date.
In order to obtain the dividendreinvestment plan form or for additional information regarding CAE’scommon shares, please contact:Computershare Trust Company of Canada 100 University Avenue, 11th FloorToronto, Ontario M5J 2Y1Tel: (416) 981-9633
1-800-663-9097Fax: (416) [email protected]
Direct Deposit DividendRegistered shareholders who receivecash dividends may elect to have the dividend payment depositeddirectly to their bank accounts insteadof receiving a cheque. In order toobtain the direct deposit dividendform please contact:Computershare Trust Company of Canada 100 University Avenue, 11th FloorToronto, Ontario M5J 2Y1Tel: (416) 981-9633
1-800-663-9097Fax: (416) [email protected]
Tentative Quarterly Results ReleaseDates for Fiscal 2002August 8, 2001November 7, 2001February 6, 2002May 8, 2002
Additional InformationIf you wish to receive additionalcopies of CAE’s annual report orcopies of the annual information form, please contact:CAE Inc.Corporate Relations PO Box 30, Suite 3060Royal Bank PlazaToronto, Ontario M5J 2J1Tel: (416) 865-0070
1-800-760-0667Fax: (416) 865-0337www.cae.com
Version françaiseLa version française du rapportannuel est disponible sur demande au service des relations d’entreprise,Royal Bank Plaza, Bureau 3060, C.P. 30, Toronto, Ontario M5J 2J1
Annual General MeetingThe Annual General Meeting will be held at the Glenn Gould Studio, CBC building, 250 Front Street West,Toronto, Ontario, Wednesday, June 20, 2001, at 11:30 a.m.
AuditorsPricewaterhouseCoopers, Chartered AccountantsToronto, Ontario
Transfer Agent and RegistrarComputershare Trust Company of CanadaToronto, OntarioMontreal, QuebecVancouver, British Columbia
TrademarksThe CAE logo, and the termsMAXVUE, ATMOS, Simfinity, Sim XXI,Gladiator, Mill Host and PanelMSRare all trademarks of CAE or its subsidiaries.
100
150
200
250
300
CAE Share Performance vs TSE 300 IndexAssumes $100 invested in the common shares of the Company on October 31, 1999
CAE TSE 300
October 1999
March2001
CAE at a Glance
Business ProfileCAE is the world’s premier provider of simulation and control technologies for training and opti-mization solutions in Aerospace, Defence and Forestry. Headquartered in Canada and operatingglobally, the Company employs approximately 7,000 people and has revenues in excess of$1 billion (CAD.).
Commercial Simulation and TrainingCAE is the world leader in the design and production ofcommercial flight simulatorsand visual systems. CAE ismaking a major move into theflight training market to fuelfuture growth.
Military Simulation and TrainingCAE is the premier designerand manufacturer of militaryflight and land-based simulationand training systems.
Marine ControlsCAE is the world leader in thesupply of control and trainingsystems for marine and powerplant applications.
Forestry Systems
CAE is the world leader in providing optimization andcontrol solutions for the soft-wood, engineered wood andpulp and paper sectors.
All illustrations in CAE’s 2001 annual report were created by the CAE Creative Services group:Zbynek Najser, Martin Petit, Jean-Marc Laverdure, Sean Poole, Keith Selevich, Graphic Designers and Gilles Guitard, Manager.
Inte
rbra
nd
Tu
dh
op
e, T
oro
nto
P
rin
ted
in C
anad
a

(amounts in millions except per share amounts) 2001 2000
Operating resultsContinuing operations
Revenue $ 1,191.4 $ 1,164.3Earnings $ 134.7 $ 90.7
Net earnings $ 108.1 $ 98.5
Financial positionTotal assets $ 1,327.5 $ 1,224.2Total debt, net of cash $ 110.2 $ 108.1
Per shareEarnings from continuing operations $ 1.25 $ 0.83Net earnings $ 1.00 $ 0.90Dividends $ 0.20 $ 0.19Shareholders’ equity $ 4.29 $ 3.53
Geographic Distribution of Revenue Revenue by Business Segment
36% United States35% Europe15% Canada9% Asia5% Other
41% Commercial Simulation and Training
34% Military Simulation and Controls
25% Forestry Systems
CAE / a r 2 001 / r e a l i z i n g g r o w t h a n d v a l u e / p a g e . 0 1
Financial Highlights

During the first year of our “Repositioning for Value” strategy, CAE has deliveredrecord results and generated significant value for our shareholders.
Having divested our non-core businesses, we are now focused on our primaryactivities:
> Commercial Simulation and Training> Military Simulation and Training> Marine Controls> Forestry Systems
We are a global leader in each of these businesses and are determined to enhanceour position with a major move into pilot training and with an expansion of productsand services from all business units. These initiatives will be reinforced by invest-ments and innovation in technology, a commitment to quality and by acquisitionswhich offer strategic benefit.
/ D . H . B u r n e y / L . R . W i l s o n
Realizing Growth and Value

p a g e . 0 3
We are fixing the manner in which we operate all businesses: reducing costs,consolidating management and streamlining our manufacturing processes. CAE’sOperations and Engineering groups are reducing the cost and time of our produc-tion while simultaneously improving the quality of what we produce. Takentogether, these achievements are contributing to a strong increase in our operatingmargins (from 12% to 17% in fiscal 2001) and delivering substantial benefits toour bottom line.
In February, CAE received American Airlines’ prestigious Platinum award as thebest in class supplier. This is a most welcome endorsement of the quality of ourcore simulation product.
Our growth initiatives are well underway. Our first Flight Training Centre waslaunched in Sao Paulo on budget and on schedule in April. Next in line are facilitiesin Toronto and Madrid.
Our new generation simulator, Sim XXI™, will go into production later this yearand will reinforce our marketing efforts as well as our entry into training.
We are also developing interactive learning programmes to bolster training solutions for all of our businesses, using simulation expertise as a catalyst forstate-of-the-art techniques.
CAE’s MAXVUE™ remains the dominant visual system in the commercial marketand we have equally high expectations for its innovative PC-based replacementnamed ATMOS™. Our Medallion visual product aimed at the military market is alsobest in class with the most realistic image in the market today.
The acquisition of BAE’s Simulation and Training business in Tampa, Florida, willstrengthen our access to the huge US defence market and the partnership withAgusta/Westland will enhance our ability to win new contracts globally.Meanwhile, our helicopter facility in the UK is a showcase of the very best technol-ogy for military simulation and training.
U K Ta c t i c a l C o n t r o l C e n t r e F a c i l i t y
B A E Ta m p a – C 1 3 0 F l i g h t S i m u l a t o r

Our Marine Controls business is expanding its market and product scope and willprovide training facilities and services to submarine crews of the Royal Navy.Power Systems and Simulation continues to lead in the deployment of conven-tional power plant simulators and is developing a Web-based simulation solutionto address the rapidly growing global fossil fuel power market.
Although the lumber segment of our Forestry business is weathering a severemarket downturn, the Pulp and Paper and Engineered Wood segments havedelivered record results this past year developing innovative products and newglobal markets.
Most importantly, the combined performance of CAE business units in fiscal2001 registered a 51% increase in earnings per share from continuing operations.Reflecting this exceptional operational performance, the market cap of theCompany has more than doubled during the year to the benefit of all shareholders.
The Board and management remain fully committed to the “Repositioning forValue” strategy which is already paying substantial dividends. We intend to buildon the success of our first full year and sustain the momentum of profitablegrowth in fiscal 2002.
The effort and dedication of CAE’s employees around the globe assures our success,now and in the future.
/ D.H. Burney / L.R. Wilson
President and Chief Executive Officer Chairman
B r a z i l F l i g h t Tr a i n i n g C e n t r e

Stimulating Growth
All CAE businesses operate in rigorous global markets where success comes from providing state-of-the-art performance at a reasonable cost. That’s why constant innovation is key in every-thing we do. In this respect, 2001 was a banner year and in the following pages we show a few of themany technological breakthroughs that will build value for our shareholders in the years ahead.
Investing inCore Technology
Enhancing Visual Systems
Initiating Marine Training
1
2
3
4
InnovatingForestry Products
5
ReinforcingFlight Training

1 ReinforcingFlight Training
O p t i m i z e d Tr a i n i n g S o l u t i o n s / I n a d d i t i o n t o n e w d e s k t o p s i m u l a t i o n , o u r c e n t r e s p r o v i d e d e s i g n a n d d e l i v e r y s e r v i c e s f o r c o u r s e w a r e a n d c u r r i c u l u m a s p a r t o f C A E ’s o p t i m i z e d t r a i n i n g s o l u t i o n . O u r Tr a i n i n g S e r v i c e s c u s t o m e r s a l s o b e n e f i tf r o m a d v a n c e d t e c h n o l o g y f o r t h e m a n a g e m e n to f c e n t r e o p e r a t i o n s , a u t o m a t e d s t u d e n tr e c o r d - k e e p i n g a n d a r c h i v i n g s e r v i c e s a t C A E C e n t r e s .
T h e S i m f i n i t y ™ S y s t e m / B a s e d o n t h e s a m e h i g hf i d e l i t y s i m u l a t i o n s o f t w a r eu s e d i n C A E ' s f u l l f l i g h t s i m u l a t o r s , t h e S i m f i n i t y ™
S y s t e m d e l i v e r s i n n o v a t i v ep i l o t a n d m a i n t e n a n c e t r a i n i n g v i a a s t a n d a r d P Ce n v i r o n m e n t . Tr a i n i n g c a n b e a c c e s s e d e i t h e r r e m o t e l yo r l o c a l l y t o p r o v i d e a s e l f -p a c e d l e a r n i n g e n v i r o n m e n tw h e n e v e r a n d w h e r e v e rn e e d e d .
CAE / a r 2 001 / r e a l i z i n g g r o w t h a n d v a l u e / p a g e . 0 7
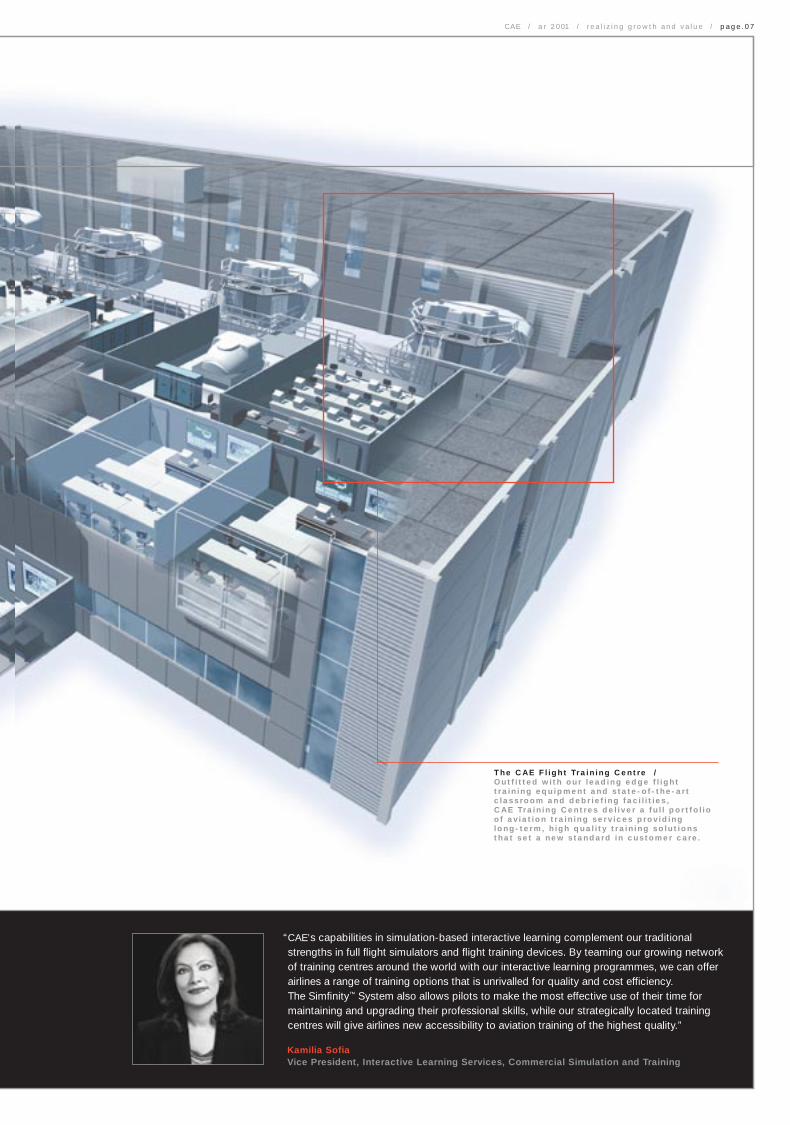
“CAE’s capabilities in simulation-based interactive learning complement our traditionalstrengths in full flight simulators and flight training devices. By teaming our growing networkof training centres around the world with our interactive learning programmes, we can offerairlines a range of training options that is unrivalled for quality and cost efficiency. The Simfinity™ System also allows pilots to make the most effective use of their time for maintaining and upgrading their professional skills, while our strategically located trainingcentres will give airlines new accessibility to aviation training of the highest quality.”
Kamilia Sofia Vice President, Interactive Learning Services, Commercial Simulation and Training
T h e C A E F l i g h t Tr a i n i n g C e n t r e /O u t f i t t e d w i t h o u r l e a d i n g e d g e f l i g h t t r a i n i n g e q u i p m e n t a n d s t a t e - o f - t h e - a r tc l a s s r o o m a n d d e b r i e f i n g f a c i l i t i e s , C A E Tr a i n i n g C e n t r e s d e l i v e r a f u l l p o r t f o l i oo f a v i a t i o n t r a i n i n g s e r v i c e s p ro v i d i n g l o n g - t e r m , h i g h q u a l i t y t r a i n i n g s o l u t i o n st h a t s e t a n e w s t a n d a r d i n c u s t o m e r c a r e .

E l e c t r i c M o t i o n S y s t e m / R e p l a c i n g t h e c o n v e n t i o n a l h y d r a u l i ct e c h n o l o g y, t h e e l e c t r i c m o t i o n s y s t e mw i l l a c c u r a t e l y s i m u l a t e a i r c r a f t m o t i o nc u e s a n d w i l l r e s u l t i n s i g n i f i c a n t s a v i n g si n s i m u l a t o r p o w e r c o n s u m p t i o n f o rC A E ’s c u s t o m e r s .
M o d u l a r D e s i g n / T h e n e w s i m u l a t o r w i l l b e f u l l ym o d u l a r a n d d e s i g n e d f o r e a s eo f m a n u f a c t u r i n g , a s s e m b l ya n d t e s t i n g .
2 Investing inCore Technology

CAE / a r 2 001 / r e a l i z i n g g r o w t h a n d v a l u e / p a g e . 0 9
S i m u l a t e d A i r c r a f t / T h e s i m u l a t e d a i r c r a f t w i l l r e p l i c a t ea i r c r a f t p e r f o r m a n c e i n a l l a s p e c t s . A r a d i c a l l y n e w m o d u l a r e l e c t ro n i c sa r c h i t e c t u r e w i l l b e u s e d t o i n t e r f a c ea l l c o c k p i t i n s t r u m e n t s . E l e c t r i c L o a dU n i t s w i l l r e p l a c e t h e c o n v e n t i o n a lh y d r a u l i c t e c h n o l o g y u s e d t o i n t e r f a c et o t h e a i r c r a f t f l i g h t c o n t r o l s .
AT M O S ™ S p h e r e V i s u a l S y s t e m / T h e v i s u a l s y s t e m w i l l e m p l o y a C A E d e s i g n e d P C I m a g eG e n e r a t o r f r o m t h e n e w AT M O S ™ S p h e r e v i s u a l f a m i l y.T h e n e w v i s u a l s y s t e m w i l l p r o v i d e u n s u r p a s s e d r e a l i s mw h i c h w h e n c o m b i n e d w i t hm o t i o n a n d s o u n d c u e s w i l l p r o v i d e a c o s t - e f f e c t i v e , f u l l y e m e r s i v e t r a i n i n g e n v i ro n -m e n t t o t h e t r a i n i n g c r e w.
“CAE is investing in a strategic research and development initiative to create Sim XXI™, the nextgeneration of full flight simulator. Enabling PC-based technology, an innovative modulardesign and electric motion are being employed to produce a simulator design that will set the standard for the simulation industry. By combining these technologies with advances indesign and production processes, we will achieve new levels of productivity, including shorterproduction schedules. We expect Sim XXI™ to win significant share for CAE in the rapidlygrowing regional and business jet training markets. It will also provide significant spin-off benefits for our entire simulation and training product suite.”Hugh Dunkley Director, New Generation Simulator Development, Commercial Simulation and Training

EnhancingVisual Systems
P i l o t C o c k p i t / T h e s i m u l a t o r c o c k p i t r e p l i c a t e s t h a t o f t h e r e a la i r c r a f t , p r o v i d i n g t h e p i l o t w i t h a l l t h e e x p e c t e dc o n t r o l s a n d i n d i c a t o r s a n d s i m u l a t i n g t h e f o rc e sf e l t b y a p i l o t c o n t r o l l i n g a n a i r c r a f t a s w e l l a sc h a r a c t e r i s t i c a i r c r a f t v i b r a t i o n s .
3
M e d a l l i o n / D e s i g n e d t o m e e t t h e n e e d s o f t h e m i l i t a r y a i r c r a f t t r a i n i n gc o m m u n i t y, t h e M e d a l l i o nI m a g e G e n e r a t o r p r o v i d e s t h ep i l o t w i t h h i g h l y r e a l i s t i c v i e w sf r o m t h e c o c k p i t w i n d o w b yc o m b i n i n g d i g i t a l d a t a s o u r c e sw i t h a e r i a l o r s a t e l l i t e p h o t o -g r a p h s o f t h e t r a i n i n g a r e a .

CAE / a r 2 001 / r e a l i z i n g g r o w t h a n d v a l u e / p a g e . 1 1
“The market for military simulators is extremely demanding with many unique training requirements such as flying in formation, specific mission rehearsals and battle scenarios thatinvolve hostile aircraft and ground weapons. It’s a huge challenge to meet such demands.Our visual systems team has pulled it off in spades with our state-of-the-art Medallion Image Generator. With its high fidelity image rendering quality and configuration flexibility it isideal for fast jet, helicopter and transport applications. CAE is committed to remain at theforefront of visual systems technology and to deliver the best training system on the marketto its customers.”
D i s p l a y S y s t e m / S t a t e - o f - t h e - a r t v i d e o p r o j e c t o r s a r eu s e d t o d i s p l a y t h e i m a g e p ro d u c e d b y M e d a l l i o n o n e i g h t r e a r p r o j e c t i o ns c r e e n s s u r r o u n d i n g t h e c o c k p i t . T h e l a r g e f i e l d o f v i e w p r o v i d e s t h e p i l o t w i t h t h e w h o l e r a n g e o f v i s u a l c u e sr e q u i r e d t o p e r f o r m t h e t r a i n i n g m i s s i o n .
Martin GagnéVice President, Visual Systems

C o m m a n d Te a m Tr a i n e r / T h e C o m m a n d Te a m Tr a i n e r r e p l i c a t e s t h e s u b m a r i n e ’s c o m b a t s y s t e m c o n s o l e s a n d o t h e r a s s o c i a t e d e q u i p m e n t . I t i s u s e d t o i m p a r t t e a m t r a i n i n go n o p e r a t i o n a l t a c t i c s a s w e l l a sc o m b a t s y s t e m u s e .
S u b m a r i n e C o n t r o l Tr a i n e r / M o u n t e d o n a m o t i o n p l a t f o r m , t h e S u b m a r i n eC o n t r o l Tr a i n e r p r o v i d e s a h i g h f i d e l i t y t r a i n i n ge n v i r o n m e n t f o r t h e m a i n c o n s o l e o p e r a t o r sr e s p o n s i b l e f o r s t e e r i n g a n d d i v i n g o p e r a t i o n s .T h e s i m u l a t o r ’s c a b a l s o i n c o r p o r a t e s a c o m p r e h e n s i v e i n s t r u c t o r s t a t i o n .
4 Initiating Marine Training

M a n o e u v r i n g R o o m Tr a i n e r / T h e M a n o e u v r i n g R o o m Tr a i n e rr e p l i c a t e s t h e m a i n m a c h i n e r y c o n t r o l r o o m e n v i r o n m e n t . T h e i n s t r u c t o r s c a n s u p e r v i s e a n d c o n d u c t t r a i n i n g s e s s i o n sf r o m a m e z z a n i n e a r e a p r o v i d i n gf u l l i n t e r a c t i o n w i t h t r a i n e e s v i av i s u a l , a u d i o a n d v i d e o s y s t e m s .
CAE / a r 2 001 / r e a l i z i n g g r o w t h a n d v a l u e / p a g e . 1 3
“CAE was a pioneer in modern marine control systems. With our on-board simulation-basedtraining capabilities we are now a leader in the global market for naval control and instrumenta-tion systems. Our reputation for rigorous standards was recognized two years ago when we wonthe contract for the control and instrumentation system for the United Kingdom Royal Navy’snew Astute Class nuclear submarines. With our consortium partner Alenia Marconi we are nowthe preferred bidder for a major 40-year training service programme for the Astute Class.Looking ahead, we will leverage our skills and established reputation to enter the commercialmarine market, as well as the important markets for marine navigation and other ship systems.”Rangesh KasturiDirector, Marketing and Sales, Marine Systems

5 InnovatingForestry Products
C y l i n d e r / T h e s l o t t e d s c r e e n c y l i n d e r s e p a r a t e s t h e u s e a b l e p u l p f i b re sf r o m t h e s t o c k , i m p r o v i n g t h eq u a l i t y o f t h e f i n i s h e d p u l p a n dt h e o v e r a l l p ro d u c t i v i t y o f t h e m i l l .
I n f l o w - O u t f l o w / A w a t e r s o l u t i o n o f p a p e r f i b re i s f e d t h r o u g h t h e f e e d p i p e c o n n e c t i o ni n t o t h e s c r e e n . T h e r o t o r / s c r e e nc y l i n d e r s e p a r a t e s t h e d i r t a n d d e b r i sf r o m t h e s o l u t i o n . A c l e a n s o l u t i o ns t r e a m a n d a w a s t e s t r e a m a r e t h e nd i s c h a r g e d f r o m t h e s c r e e n .

CAE / a r 2 001 / r e a l i z i n g g r o w t h a n d v a l u e / p a g e . 1 5
“In September 2000 CAE launched the Gladiator™, a highly innovative product that is CAE’s first entry in the market for pulp and paper mill rotors. By combining a rotor with a screeningcylinder, the Gladiator™ runs at a tighter tolerance than traditional models, with no loss of good quality useable fibre. This means higher productivity for the mills, fewer waste productsand ultimately, better profitability. The market for the Gladiator™ is worldwide and initialresponse has been encouraging, while our new joint venture in Korea gives us a presence in the important Asian market for this product.”
G l a d i a t o r ™ R o t o r / B y c r e a t i n g v e r y t i g h t t o l e r a n c e s t h e G l a d i a t o r ™
R o t o r o p e r a t i n g i n t h e s l o t t e d s c r e e n c y l i n d e ra l l o w s a r e c o v e r y o f c l e a n , u s e a b l e p u l p f i b r e f r o m t h e t e r t i a r y o r f i n e p o s i t i o nw i t h i n a p u l p m i l l .
Robert TrochimchukSales Engineer, Forestry Systems

Commitment and Ingenuity = Value
Patrizia Caroselli
Senior Production Planner
Operations
CEO Award Recipient
Patrizia’s initiatives have provided
continuous planning visibility through
the simulator manufacturing cycle.
Production cells work together more
efficiently, shortening the cycle time
and bringing significantly lower costs.
“CAE values creativity” she says,
“and personally, I enjoy working for
a company that can compete with the
best in the world.”
Benoit Durand
Senior Project Manager
Military Simulation and Training
CEO Award Recipient
Benoit’s proven leadership talents
have made him the leader of the cross-
functional team charged with bringing
home the important CF-18 networked
simulation training system contract.
A good choice, since he believes that
“It’s people who make the difference.
No matter what the challenge, we have the
people to handle it – that’s what makes
CAE such an exciting place to work in.”
Andrew Fernie
Manager, Display Systems
Visual Systems
CEO Award Recipient
Andrew’s experience on the team
bidding for the visual systems in the
Eurofighter simulators will serve him
well in designing complete visual sys-
tems that meet a customer’s specific
needs cost-effectively. “CAE gives you
a chance to work on many different
products” he says. “I’ve already worked
in four separate fields within CAE and
look forward to working in many more.”

CAE / a r 2 001 / r e a l i z i n g g r o w t h a n d v a l u e / p a g e . 1 7
Olaf Knutson
Manager, Marketing and Sales
Marine Systems
CEO Award Recipient
Olaf’s success in pursuing major sales
opportunities has won him an assignment
marketing customized solutions to key
projects and customers in Europe and
South America. “CAE’s competitive edge
is our human resources” in Olaf’s view.
“The commitment and training of our
people allow us to meet customers’
needs with tailor-made solutions that
give them the best value for their money.”
Daniel Roy
Senior Technical Specialist
Commercial Simulation and Training
CEO Award Recipient
Daniel has been a leader in designing
the electronic interface of Sim XXI™,
CAE’s new generation simulator which
combines greatly improved speed of
throughput with ease of maintenance
and repair. “At CAE you have the chance
to use your own judgement” Daniel
reflects. “It’s demanding, but it also gives
you the freedom to go full speed ahead.”
Risto Weckroth
Technical Support Manager
Forestry Systems
CEO Award Recipient
Solution selling is the key to success in
the growing end-user market. Risto has
pioneered the concept at CAE and along
the way has learned that “Things happen
faster at CAE. There is a lot of freedom,
and a lot of responsibility – but you can
see the results of your work and know
that you are making a difference.”

Leading through Innovation
Bob Bridgeman
Director, Electronic Engineering
Operations
CEO Innovation Award Recipient
“At CAE we get exposure to a lot of
different challenges” according to
electronic engineer Bob Bridgeman.
Bob’s work at CAE has ranged widely
but it is his analysis of production
systems and their impact on productivity
that has won him the CEO Innovation
Award. “I find it’s especially rewarding
to work with something all the way
from concept to a finished top-quality
product” he adds.

Financial Review
29Management
and Auditors’
Reports
34Notes to
Consolidated
Financial
Statements
52Board
of Directors
and Officers
53Information for
Shareholders
31Consolidated
Financial
Statements
20Review of
Operations and
Management’s
Discussion
and Analysis

Management’s Discussion and Analysis (MD&A) of fiscal 2001’s financial results focuses on thecore businesses of CAE Inc. (CAE or the Company), Commercial Simulation and Training, MilitarySimulation and Controls, and Forestry Systems and includes a review of the operations and financialsituation of each segment. This MD&A should be read in conjunction with the audited consolidatedfinancial statements on pages 31 to 50.
This MD&A contains forward-looking statements with respect to CAE and its subsidiaries basedon assumptions which CAE considers reasonable at the time they were prepared. These forward-looking statements, by their nature, necessarily involve risks and uncertainties that could causeactual results to differ materially from those contemplated by the forward-looking statements.CAE cautions the reader that the assumptions regarding future events, many of which are beyond thecontrol of CAE and its subsidiaries, may ultimately prove to be incorrect. Factors that could causeactual results or events to differ materially from current expectations are discussed on page 28.
/ Summary of Consolidated Results /
Continuing OperationsEarnings from Continuing OperationsConsolidated earnings from continuing operations climbed to $134.7 million, a 49% improvementfrom last year’s level of $90.7 million. Earnings per share reached $1.25, an increase of 51% overlast year’s $0.83 per share, reflecting both the earnings improvement and the per share impact of theCompany’s common share purchases under the Normal Course Issuer Bid. The growth in earnings is anchored by margin improvements across all business units arising from a combination of costsavings from consolidation and integration, tangible productivity improvements in our core manu-facturing and the growth in volume. Operating earnings for Commercial Simulation and Training outpaced growth in revenue, as the incremental volume to meet demand for direct sales as well asthe manufacture of simulators for our own training centres combined with productivity improve-ments contributed to a significant increase in margins. Operating earnings for Military Simulationand Controls increased 127%, due to an improvement in the mix of programme activity and thecompletion early in the year of certain higher cost programmes. Forestry Systems contributed a 6% increase in operating earnings on strong results in the Oriented Strand Board (OSB) and pulpsectors, partially offset by low order intake, plant rationalization and employee layoffs, in the fourthquarter, in the lumber sector.
Review of Operations andManagement’s Discussion and Analysis

CAE / a r 2 001 / m a n a g e m e n t ’s d i s c u s s i o n a n d a n a l y s i s / p a g e . 2 1
RevenueConsolidated revenue for fiscal 2001, at $1,191 million, reflects an increase of 2% over the fiscal2000 level of $1,164 million. Revenue for Military Simulation and Controls grew by 7% or $25 milliondue to higher activity on certain US military simulation programmes, in marine controls applicationsattributable to the Astute Class nuclear submarine and from the Medium Support Helicopter AircrewTraining Facility (MSHATF) at Royal Air Force (RAF) base Benson in Oxfordshire, England. CommercialSimulation and Training revenue increased slightly over fiscal 2000 reflecting the continued buoyantmarket and CAE’s success in capturing a major share of full flight simulator orders. Forestry Systemsmatched last year’s revenue level on strong results in the OSB and pulp sectors offset by low orderintake in the last half of the year, in the lumber sector.
Discontinued OperationsOn February 2, 2000, the Board of Directors approved a plan to divest its Cleaning Technologies andEnergy Control Systems businesses. On May 31, the Company completed the sale of substantiallyall of the assets of the Energy Control Systems businesses to SNC-Lavalin. CAE expects to concludethe sale of the Cleaning Technologies group during the first quarter of fiscal 2002.
The results of these operating units along with the results of Railway Technologies and Serviceshave been reported as discontinued operations. The results of discontinued operations amountedto a net loss of $26.6 million, relating primarily to the Cleaning Technologies business, as comparedto net earnings of $7.8 million in fiscal 2000, which included an after-tax gain of $13.6 million fromthe sale of the Railway Technologies and Services group.
Net EarningsConsolidated net earnings increased 10% to $108.1 million or $1.00 per share compared with con-solidated net earnings of $98.5 million or $0.90 per share in fiscal 2000.
Cash FlowCAE’s cash and short-term investments increased by a combined $45 million during the year to $156.8 million and $122.8 million, respectively. The increase reflects the higher earnings and signi-ficantly lower working capital, offset by higher capital expenditures in support of growth in com-mercial flight training.
BacklogOrder backlog as at March 31, 2001, was unchanged at $1.8 billion.
/ Review of Operations /
Commercial Simulation and TrainingCAE’s Commercial Simulation and Training business is the world leader in the design and produc-tion of commercial flight simulators, visual systems and training systems. CAE’s move into the flight training market to fuel growth has been successful. The Company officially opened its firstindependent training centre – CAE South America Flight Training centre in São Paulo, Brazil, on April 19, 2001. Two other centres, in Toronto, Canada, and Madrid, Spain, are scheduled to openin the coming fiscal year. CAE will accelerate the establishment of independent training centres andalliances with aircraft manufacturers and major airlines to address their individual flight trainingneeds, and will continue the pursuit of simulator maintenance and support activities.

Financial Results(amounts in millions of dollars) 2001 2000 1999 1998 1997
Revenue $ 481.5 480.2 352.8 296.8 186.3Operating earnings $ 117.0 82.3 55.9 56.7 27.4Operating margin % 24.3 17.1 15.8 19.1 14.7Backlog $ 649.5 527.8 482.7 339.9 154.2Capital expenditures $ 72.9 11.7 23.2 27.4 9.0
Operating earnings of Commercial Simulation and Training climbed 42% over last year’s level, to arecord $117.0 million. Revenue was up slightly over last year. The revenue reflects very little trainingrevenue as yet for the simulators we are building for our own training centres. Productivity improve-ments and the leverage on costs resulting from the high volume level, from both external orders andtraining centre requirements, has driven significant improvement in operating earnings.
Capital expenditures increased significantly in the fiscal year, the majority of which relates to theconstruction of three training facilities.
Operational HighlightsDemand for flight training equipment remained strong during fiscal 2001 due to ongoing fleetrenewal, fleet expansion, strong demand in the regional and business jet markets and pilot attrition.The use of simulators for training continues to expand due to improved technology and the signifi-cant cost savings as compared with flight training aboard an actual aircraft. Furthermore, simulationallows for training pilots to cope with high risk situations such as engine fires and windshear, whichcannot safely be attempted on the actual aircraft.
CAE continues to achieve outstanding results in the Commercial Flight Simulation and VisualSystems market. In fiscal 2001, the Company won 35 of 42 competed full flight simulators (FFS),representing a worldwide market share of 83%. CAE’s commercial MAXVUE™ visual system captured29 out of 43 competed orders, or a 67% market share.
During the year CAE obtained FFS orders from five new customers, Air France, Air New Zealand,Southwest Airlines, Ryan Air and WestJet. The Company won all FFS orders for regional jets.
CAE made significant progress in its strategic move into the commercial flight training business.The training facility in São Paulo, Brazil, one of the fastest growing aviation markets worldwide, wascompleted and is now in operation. During the year, agreements with Varig, Gol Transportes Aéreosof Brazil and LAPA of Argentina were signed for B737 training. These agreements are in addition tothe long-term agreement, signed last year, with São Paulo-based Transportes Aéreos Regionais S.A.
(TAM) for Fokker 100 and Airbus A320 training in the new facility. Training centres in Toronto andMadrid are targeted to become operational in fiscal 2002. In Toronto, Canada 3000 and Skyserviceare the anchor customers and discussions are ongoing with additional clients. In Madrid, Air Nostrum,the regional feeder of Iberia, is our anchor customer.
OutlookThe market for commercial flight simulation equipment is expected to remain strong in fiscal 2002.The factors which drove the market to record levels in recent years remain largely unchanged.

CAE / a r 2 001 / m a n a g e m e n t ’s d i s c u s s i o n a n d a n a l y s i s / p a g e . 2 3
These factors, combined with the anticipated continued growth in air travel, the generally strongfinancial position of the airline industry and the order backlog for delivery of new aircraft, should leadto a strong market for this equipment.
The Company plans to invest substantially over the next three years in expanding the scope ofits commercial simulation business through its entry into the flight training market. CAE will capi-talize on its solid reputation and its strong relationship with the aircraft manufacturers and majorairlines to grow the flight training business worldwide in partnership with its customers and otherthird party suppliers.
CAE expects to increase its advantage in lead-time, cost, quality and reputation for perfor-mance through operational improvements and research and development (R&D) programmes. The Company launched a large-scale R&D programme to improve its flight simulator products. A next generation full flight simulator, Sim XXI™, which will employ innovative technologies andadvances in design and production processes will be introduced this fall. CAE is also developing aninteractive learning capability, which has the potential to revolutionize how pilot and maintenancetraining is conducted. These projects are on track to initially generate incremental improvements toexisting products and in the longer term, lead to the introduction of new products with the potentialto significantly alter market dynamics.
In addition, CAE is investing in the development of a next generation visual system, capitalizingon the improvements in off-the-shelf PC-based 3D graphics technology. These technical innovationswill enable the Company to develop a visual system at a lower cost while significantly improving therealism of the virtual image. Incremental growth in this market is anticipated from demand for FFS
simulators and visual system upgrades required as the installed base of aging visual systems reachthe end of their economic life. This trend is occurring in the military market as well.
CAE expects to maintain its commanding leadership position in commercial simulation andvisual systems due to its focus on customer relationships, its commitment to innovation and tech-nology, product quality, reliability and efficiency, and its continuing efforts to shorten delivery cyclesthrough process improvements.
Military Simulation and ControlsCAE’s Military Simulation and Controls business is a premier designer and manufacturer of militaryflight and land-based simulation and training systems, and is the world leader in the supply ofmarine control systems.
Financial Results(amounts in millions of dollars) 2001 2000 1999 1998 1997
Revenue $ 409.9 384.9 355.7 334.2 370.1Operating earnings $ 34.9 15.4 25.2 20.6 30.9Operating margin % 8.5 4.0 7.1 6.2 8.3Backlog $ 1,103.3 1,219.3 1,242.6 1,242.2 489.4Capital expenditures, net $ 3.4 10.1 45.7 25.4 16.2
Revenue increased by $25.0 million or 7% while operating earnings increased by $19.5 million or127% in the fiscal year. The revenue increase reflects higher activity on the US Air Force E-3AAirborne Warning and Control (AWAC) Flight Crew Training Programme and in marine control appli-cations attributable to the UK Royal Navy on the Astute Class nuclear submarine. Higher revenueswere also generated from the Medium Support Helicopter Aircrew Training Facility (MSHATF) atRoyal Air Force (RAF) base Benson in Oxfordshire, England, which officially opened in July 2000.The increase in operating earnings reflects the effect of the repositioning strategy whereby four inde-pendent military simulation and training businesses were successfully integrated into one focusedprofit centre.
Operational HighlightsCAE reached an agreement with BAE SYSTEMS North America to buy BAE SYSTEMS FlightSimulation and Training of Tampa, Florida. This purchase was concluded on April 2, 2001. The acquisition strengthens CAE’s access to the US defence market and a relationship with BAE SYSTEMS PLC, which enhances CAE’s global position in the defence simulation and training sector.
CAE continued its efforts to establish itself as a significant training equipment provider. CAE has been awarded contracts for the Holloman base Cockpit Procedure Trainer, C130J upgradefor the Commonwealth of Australia, upgrade for NATO E3A, update for UK MoD Maintenance TrainingSystem and Lynx Mk8 and Eurofighter 2000. CAE was also successful in enhancing its position as a training service provider. CAE continues to focus on expanding its relationship with current customers through long-term service agreements, upgrades of current devices and provision ofadditional training equipment.
On July 17, 2000, His Royal Highness The Duke of York attended the inauguration of theMedium Support Helicopter Aircrew Training Facility (MSHATF) at Royal Air Force (RAF) base Bensonin Oxfordshire, England. This showcase facility represents the first turnkey training services pro-gramme for CAE. This achievement is an important milestone in relation to CAE’s entry into the mili-tary and commercial training services business. For the inauguration, five of the six flight simulatorsthat form the core of the Medium Support Helicopter Aircrew Training Facility in the UK were deliv-ered and certified Ready for Training. The one remaining flight simulator was delivered and certifiedin April 2001. Recently, the Company signed its first contract for third party training with CanadianAir Force pilots.
CAE won contracts to provide the Integrated Platform Management System for three of theKorean Navy’s new KDX-II class Destroyers. The Korean Navy plans to build up to six of these 5,000-ton warships in a continuing modernization of its forces.
During the year the FAST Consortium, owned 50/50 by CAE and Alenia Marconi Systems, was selected as the Preferred Bidder by the Defence Procurement Agency of the UK Ministry ofDefence for the Astute Class submarines Training Service. This Private Finance Initiative contract isfor the provision of comprehensive training services to the Royal Navy for up to 40 years in the oper-ation and maintenance of the Astute Class submarines. A new training centre will be built in Scotlandto house the simulators and provide classroom-training facilities. Contract negotiations should becompleted in the first quarter of fiscal 2002 and will add over $250 million to backlog.
OutlookThe military simulation and training market is driven by the introduction of new aircraft platforms,upgrades and life extensions to existing aircraft and a shift to greater use of simulation in flight train-ing programmes due to the high degree of realism and the significantly lower cost. In addition totechnology and price, the customers’ – in most cases, governments – key purchase criteria includethe contractor’s local geographic presence. CAE is well positioned to capitalize on opportunities inthe international market, with operations in Canada, the United States, Germany, the UnitedKingdom and Australia, as well as teaming and/or collaboration arrangements in other countries.
The procurement of helicopter and transport aircraft is expected to increase over the next fewyears and this growth will translate into many simulation opportunities for CAE to pursue worldwide.

CAE / a r 2 001 / m a n a g e m e n t ’s d i s c u s s i o n a n d a n a l y s i s / p a g e . 2 5
Key upcoming programmes include simulators for the Chinook CH-47 helicopter and InfantryGunnery and Tactical Simulator (IGTS) programmes for Asia, Canadian CF-18 Advanced DistributedCombat Training System (ADCTS) programme, US Army AH-64 Apache simulator upgrade pro-gramme, the Italian Navy’s EH-101 helicopter and a range of training systems to support the NH-90helicopter programme in Europe.
CAE is also targeting new opportunities for turnkey training centres in Europe, the Americas andAustralia based on the model developed for the Royal Air Force Medium Support Helicopter pro-gramme in the UK. CAE’s capability to provide comprehensive tactical mission training is proving tobe a significant incentive as potential customers consider their options.
In addition, with hundreds of flight simulators deployed worldwide, the market for lifetime support of training equipment and upgrades is a clear target market for CAE to pursue. CAE is recognized as a leading company for upgrades and support, having successfully upgraded and/ormaintained its own and third party simulators worldwide.
CAE expects to increase its advantage in lead-time, cost, quality and reputation for performancethrough continued operational improvements and research and development (R&D) programmes. In particular, the Company launched an R&D programme to introduce Networked Tactical TrainingSystems (NeTTS), a new PC-based architecture to address the requirement for scalable, reconfig-urable, lower cost training devices.
With its leading edge technology solution, CAE is well positioned to capitalize on upcominginternational marine programmes in Europe, the US and Asia with the market expected to remainstrong in the coming years. In addition, CAE has launched initiatives to broaden its scope of supplyto include other key control systems within a ship and the utilization of its vast investments in war-ship automation technology in the commercial marine sector.
Forestry SystemsCAE’s Forestry Systems business is the world leader in providing innovative solutions for the forestproducts sector. The Company’s advanced technologies enable customers to increase the value ofproducts recovered from wood fibre resources. Forestry Systems is comprised of two profit centres:Wood Products and Pulp and Paper.
The Wood Products division provides proprietary machinery and equipment for both softwoodand hardwood lumber and engineered wood producers. Operating out of British Columbia andCalifornia, CAE combines proprietary software, sensors and control systems with advanced mechan-ical design to provide leading edge optimization solutions to the global wood products industry.
The Pulp and Paper division provides advanced screening solutions for pulp and paper compa-nies. CAE operates out of Quebec, Finland and South Korea and has market access worldwide via acombination of regional offices, technical support engineers and strategic alliances.
Financial Results(amounts in millions of dollars) 2001 2000 1999 1998 1997
Revenue $ 300.0 299.2 197.4 109.4 138.7Operating earnings $ 46.5 43.8 32.8 16.2 19.8Operating margin % 15.5 14.6 16.6 14.8 14.3Backlog $ 51.3 86.6 64.0 23.9 28.3Capital expenditures, net $ 7.7 9.1 7.4 6.3 13.3
The recent softening of the lumber sector’s order book held revenue this year at the same level asthe prior year. Operating earnings, however, have increased by $2.7 million or 6% primarily due toproductivity and operational cost savings. This increase in operating earnings also covered the costof the closure of the Portland fabrication facility and the lay off of close to 100 employees in SalmonArm announced last January.

Operational HighlightsCAE demonstrated global reach for its sawmill optimization expertise with the start-up of an entiresawmill for Balcas Timber in Northern Ireland during fiscal 2001. The project is significant as it show-cases CAE’s Mill Host™ concept, whereby a single software solution is determined for each log inrelation to the sales order file before it reaches the first saw blade. This optimized solution is then utilized throughout the mill until the resulting lumber is sorted and stacked for ultimate sale.
CAE captured 100% of the market this year for its flaking and stranding technology for theOriented Strand Board (OSB) market, including its first ever sale in South America. CAE continued itstradition of introducing new technology to the wood products industry during fiscal 2001. The first ofseven new QuickScan Cant Optimizers was delivered during the year and the first PanelMSR®
(Machine Stress Rated) machine was installed at an OSB mill. The PanelMSR® measures panel stiff-ness to ensure structural quality is maintained and will ultimately provide mill operators a tool forprocess optimization.
Global pulp and paper operations were integrated during fiscal 2001. The resulting global focuspositions CAE well to service the rapidly consolidating pulp and paper industry.
New product development efforts have been directed at leveraging CAE’s core simulation andcontrol capabilities into the pulp and paper sector. The preliminary introduction of a pulp mill simula-tion model that allows mill managers to assess the efficiency of their various screening applicationshas been received enthusiastically.
The Pulp and Paper group entered into a joint venture agreement with the leading screen cylindermanufacturer in the Asian market, Poong Nam Screens based in Inchon, South Korea. The Company’s35% interest in the venture will add a third pulp and paper manufacturing base for CAE in thefastest growing market in the world, Asia.
OutlookThe housing market in North America continues to be strong, with US housing starts forecast toremain above 1.6 million during calendar 2001. However, the market has been overshadowed by lowprices for lumber which has dampened demand for sawmill capital equipment. Also in Canada, theexpiration of the Softwood Lumber Agreement on March 31, 2001, and the resulting Americancharges of Canadian dumping and price subsidies have left the Canadian sawmill industry in a stateof confusion. These issues should be clarified by September 2001, with business returning to normalshortly thereafter. Meanwhile, in the first quarter of fiscal 2002, lumber prices have increased signifi-cantly. Engineered wood producers are continuing to take advantage of new technology to optimizetheir wood fibre utilization and thereby improve competitiveness. CAE is well positioned as the lead-ing supplier in North America to benefit from global demand for forestry products. Also, efforts arefocused on extending the Company’s reach more aggressively overseas as additional upside poten-tial is identified.
Pulp prices rose during the first quarter of calendar 2000 to their highest levels in four years.Asian pulp and paper producers have seen capacity utilization levels rise significantly as economicconditions have improved. Both of these factors will contribute to a strong year for CAE in fiscal 2002as a leading supplier to the pulp and paper industry. The planned introduction of new technology-based solutions will further bolster the Company’s opportunities.

CAE / a r 2 001 / m a n a g e m e n t ’s d i s c u s s i o n a n d a n a l y s i s / p a g e . 2 7
/ Liquidity and Capital Resources /
CAE’s cash and short-term investment position increased by $45 million during the year. Throughoutthe year surplus cash balances were invested in short-term investments ($122.8 million at March 31,2001) comprised of high grade commercial paper with maturity under nine months. CAE’s highercash balances resulted from the increase in net earnings and a significant reduction in working cap-ital, due to the achievement of several contract milestones, which more than offset the increase incapital expenditures.
Capital expenditures totalled $84 million compared with $30.9 million in fiscal 2000, the majorityof which relates to the construction of the building and the manufacture of simulators for the São Paulo,Toronto and Madrid training centres.
CAE employs foreign exchange forward contracts to manage the exposure created when salesare made in foreign currencies. The amount and timing of forward contracts varies depending on anumber of factors, including milestone billings and the use of foreign materials and/or subcontractorson the programme. As at March 31, 2001, CAE had $309.5 million in Canadian equivalent foreignexchange contracts which, if marked to market at that date, would result in a foreign exchange lossof $5.5 million. These would be equally offset by future gains of foreign denominated cash flows overthe balance of the contracts.
CAE also uses financial instruments to manage its exposure to changing interest rates and toadjust its mix of fixed and floating interest rate debt. In order to benefit from the low short-term inter-est rates prevailing in the Canadian market, CAE concluded interest rate swap agreements in 1997with three Canadian financial institutions for periods of between eight and fifteen years. At March 31,2001, CAE had interest rate swaps covering long-term debt amounting to $92 million, which ifmarked to market at that date would result in a gain of $2.6 million. CAE deals only with sound coun-terparties in executing any of its financial instruments.
As at March 31, 2001, CAE had US$143 million of accumulated non-capital loss carryforwardsthat can be used to offset income taxes payable on future earnings from US operations. For financialreporting purposes, a future tax asset of $15.8 million has been recognized in respect of these losscarryforwards.
New Accounting StandardsOn April 1, 2000, CAE adopted the recommendations of the Canadian Institute of CharteredAccountants (CICA) Handbook Section 3465, Income Taxes and Section 3461, Employee FutureBenefits, without restating prior years. The cumulative effect of adopting the new recommendationswas to reduce retained earnings by $4.3 million and $1.7 million, respectively.

Business Risks and UncertaintiesCAE operates in different industry segments that involve various risk factors and uncertainties, whichare carefully considered in the Company’s management policies.
Market CyclesCAE companies participate in competitive global markets that are subject to worldwide economictrends and political influences. Many of the Company’s products are affected by industry marketcycles. The commercial simulation market generally follows the trend established in the commercialairline industry, particularly the delivery of new aircraft. Military simulation programmes, awardedmainly by governments, are dependent on price, technology, life cycle costs, delivery, quality andgovernment spending on defence programmes, and may also be influenced by in-country presence.Lead times on military programmes can easily surpass 12 months. Forest product commodity pricessuch as the price of pulp, sawn lumber and OSB panel board, which, in turn, are governed by thedemand for paper and the health of the construction industry, impact demand for various equipmentand services offered by Forestry Systems.
CAE has positioned itself in three core business segments, geographically and by industry sector, and is expanding the scope of its product offerings to help moderate these risks.
Product InnovationCAE emphasizes product innovation in all segments. Its success is dependent upon the advance-ment of technology on existing products and the introduction of new products. In response, CAE
expends a significant amount on research and development, which in many cases is sponsored bythe customer. Certain initiatives also receive the support of the Canadian Government through theTechnology Partnerships Canada programme.
Changes in Contract CostCAE’s operating results may fluctuate from a change in the cost to complete long-term fixed-pricecontracts. Typically these contracts incorporate new technological solutions, the costs of which are difficult to estimate.
Key PersonnelCAE is dependent on the continued service of qualified technical personnel, and its ability to attractand retain them. CAE applies a compensation philosophy designed to mitigate this risk.

CAE / a r 2 001 / m a n a g e m e n t a n d a u d i t o r s ’ r e p o r t / p a g e . 2 9
Management and Auditors’ Reports
/ Management Report /
Management is responsible for the integrity and objectivity of the information contained in thisannual report and for the consistency between the financial statements and other financial andoperating data contained elsewhere in the report. The accompanying financial statements have beenprepared by management in accordance with accounting principles generally accepted in Canada,using policies and procedures established by management, and reflect the Company’s financialposition, results of operations and cash flow.
Management has established and maintains a system of internal control which is designed toprovide reasonable assurance that assets are safeguarded from loss or unauthorized use and thatfinancial information is reliable and accurate. The Company also maintains an internal audit functionthat evaluates and formally reports to management and the Audit Committee on the adequacy andeffectiveness of internal controls.
The financial statements have been examined by external auditors appointed by the sharehold-ers. Their examination provides an independent view as to management’s discharge of its responsi-bilities insofar as they relate to the fairness of reported operating results and financial condition.They obtain an understanding of the Company’s accounting systems and procedures and conductsuch tests and related procedures as they deem necessary to arrive at an opinion on the fairness ofthe financial statements.
Ultimate responsibility to the shareholders for the financial statements rests with the Board ofDirectors. An Audit Committee is appointed by the Board to review the financial statements in detailand to report to the Directors prior to such statements being approved for publication. The AuditCommittee meets regularly with management, the internal auditors and the external auditors to discuss their evaluation of internal accounting controls, audit results and the quality of financialreporting. The external auditors have free access to the Audit Committee, without management’spresence, to discuss the results of their audit.
/ D.H. Burney / P.G. Renaud
President and Chief Executive Officer Executive Vice President,
Chief Financial Officer and Secretary

/ Auditors’ Report to the Shareholders of CAE Inc. /
We have audited the Consolidated Balance Sheets of CAE Inc. as at March 31, 2001 and 2000,and the Consolidated Statements of Earnings, Retained Earnings and Cash Flow for the yearsthen ended. These financial statements are the responsibility of the Company’s management.Our responsibility is to express an opinion on these financial statements based on our audits.
We conducted our audits in accordance with Canadian generally accepted auditing standards.Those standards require that we plan and perform an audit to obtain reasonable assurance as towhether the financial statements are free of material misstatement. An audit includes examining, on a test basis, evidence supporting the amounts and disclosures in the financial statements. An audit also includes assessing the accounting principles used and significant estimates made bymanagement, as well as evaluating the overall financial statement presentation.
In our opinion, these consolidated financial statements present fairly, in all material respects,the financial position of the Company as at March 31, 2001 and 2000, and the results of its opera-tions and cash flows for the years then ended in accordance with Canadian generally acceptedaccounting principles.
Chartered Accountants
Montreal, Canada, April 30, 2001

CAE / a r 2 001 / c o n s o l i d a t e d f i n a n c i a l s t a t e m e n t s / p a g e . 3 1
Consolidated Balance Sheets
as at march 31 (amounts in millions of dollars) 2001 2000
Assets Current assets
Cash $ 156.8 $ 163.5Short-term investments 122.8 71.1Accounts receivable 286.1 325.3Inventories (note 3) 136.6 108.1Prepaid expenses 9.8 14.5Income taxes recoverable 5.0 28.6
717.1 711.1Net assets of discontinued operations (note 2) 91.3 105.2Property, plant and equipment, net (note 4) 277.9 214.8Goodwill 141.0 144.1Other assets (note 5) 83.6 49.0Future income taxes (note 10) 16.6 –
$ 1,327.5 $ 1,224.2
Liabilities and shareholders’ equityCurrent liabilities
Accounts payable and accrued liabilities $ 375.4 $ 306.7Deposits on contracts 181.5 219.2Long-term debt due within one year (note 6) 2.4 0.9
559.3 526.8Long-term debt (note 6) 264.6 270.7Long-term liabilities 24.6 40.6Future income taxes (note 10) 14.9 6.8
863.4 844.9
Shareholders’ equityCapital stock (note 7) 159.4 152.3Retained earnings 321.2 241.9Currency translation adjustments (16.5) (14.9)
464.1 379.3
$ 1,327.5 $ 1,224.2
Approved by the Board:
/ D.H. Burney / L.R. Wilson
Director Director

Consolidated Statements of Earnings
years ended march 31 (amounts in millions except per share amounts) 2001 2000
RevenueCommercial Simulation and Training $ 481.5 $ 480.2Military Simulation and Controls 409.9 384.9Forestry Systems 300.0 299.2
$ 1,191.4 $ 1,164.3
Operating earningsCommercial Simulation and Training $ 117.0 $ 82.3Military Simulation and Controls 34.9 15.4Forestry Systems 46.5 43.8
Earnings from continuing operations before interest and income taxes 198.4 141.5Interest income (expense), net 4.1 (10.0)
Earnings from continuing operations before income taxes 202.5 131.5Income taxes (note 10) 67.8 40.8
Earnings from continuing operations 134.7 90.7Results of discontinued operations (note 2) (26.6) 7.8
Net earnings $ 108.1 $ 98.5
Earnings and diluted earnings per share from continuing operations $ 1.25 $ 0.83
Net earnings and diluted net earnings per share $ 1.00 $ 0.90
Average number of shares outstanding 107.8 109.5
Consolidated Statements of Retained Earnings
years ended march 31 (amounts in millions of dollars) 2001 2000
Retained earnings as previously stated at beginning of year $ 241.9 $ 194.2Adjustments for changes in accounting policies (note 1) (6.0) –Excess of common share purchase price over amountcharged to capital stock (note 7(b)) (1.2) (30.2)
Net earnings 108.1 98.5Dividends (21.6) (20.6)
Retained earnings at end of year $ 321.2 $ 241.9

CAE / a r 2 001 / c o n s o l i d a t e d f i n a n c i a l s t a t e m e n t s / p a g e . 3 3
Consolidated Statements of Cash Flow
years ended march 31 (amounts in millions of dollars) 2001 2000
Operating activitiesEarnings from continuing operations $ 134.7 $ 90.7Adjustments to reconcile earnings to cash flowsfrom operating activities:Amortization 29.7 33.7Future income taxes (11.3) (7.6)Investment tax credit (22.5) (18.3)Other (10.9) (0.3)Decrease in non-cash working capital (note 11) 69.6 151.8
Net cash provided by continuing operating activities 189.3 250.0
Investing activitiesProceeds on disposition of business units (note 2) 5.7 52.5Short-term investments (51.7) (71.1)Capital expenditures (84.0) (30.9)Proceeds from sale of leaseback assets – 35.5Other assets (note 5) (25.7) (11.4)
Net cash used in continuing investing activities (155.7) (25.4)
Financing activitiesRepayments of long-term debt borrowings (17.6) (5.5)Dividends paid (21.2) (20.4)Purchase of capital stock (1.3) (36.3)Common stock issuance 6.9 4.2Other (7.8) (4.0)
Net cash used in continuing financing activities (41.0) (62.0)Net cash used in discontinued activities (note 2) (5.3) (21.6)Effect of foreign exchange rate changes on cash 6.0 (3.1)
Net (decrease) increase in cash (6.7) 137.9Cash at beginning of year 163.5 25.6
Cash at end of year $ 156.8 $ 163.5
Note.01 / Summary of Significant Accounting Policies /
Accounting policies of CAE Inc. (CAE or the Company) and its subsidiaries conform with Canadiangenerally accepted accounting principles (GAAP) and reflect practices appropriate to the industriesin which they operate.
New Accounting StandardsOn April 1, 2000, CAE adopted the recommendations of the Canadian Institute of CharteredAccountants (CICA) Handbook Section 3465, Income Taxes, which replaces the deferral methodwith the liability method of tax allocation. CAE applied the new recommendations retroactively without restating prior years. The cumulative effect of adopting the new recommendations as atApril 1, 2000, was to increase net future income tax assets by $12.8 million, increase net futureincome tax liabilities by $27.0 million, increase other assets by $30.8 million, reduce income taxesrecoverable by $18.3 million, reduce net assets of discontinued operations by $2.8 million andreduce retained earnings by $4.3 million.
On April 1, 2000, CAE adopted the recommendations of the CICA Handbook Section 3461,Employee Future Benefits, which changes the accounting for pensions and other types of employeefuture benefits. The new recommendations were adopted retroactively through an adjustment toretained earnings and prior year results have not been restated. As a result, a liability for employeefuture benefits of $1.7 million was recorded and a corresponding charge to retained earningswas taken.
In the March 31, 2001, Consolidated Statements of Earnings, CAE adopted the new CICA recom-mendations for earnings per share (EPS). The revised recommendations require the use of thetreasury method to compute the dilutive effect of options as opposed to the previously usedimputed earnings approach. These new recommendations were adopted retroactively, resulting inthe restatement of diluted EPS for 2000.
ConsolidationThe consolidated financial statements include the accounts of the Company and all subsidiaries. All inter-company accounts and transactions have been eliminated. Acquisitions are accounted forby the purchase method and accordingly the results of operations of subsidiaries are includedfrom the dates of acquisition. Portfolio investments are accounted for using the cost method.
Notes to Consolidated Financial Statementsyears ended march 31, 2001 and 2000 (amounts in millions of dollars)

CAE / a r 2 001 / n o t e s t o c o n s o l i d a t e d f i n a n c i a l s t a t e m e n t s / p a g e . 3 5
Revenue RecognitionRevenue from long-term contracts is recognized using the percentage of completion method,where revenue, earnings and unbilled accounts receivable are recorded as related costs areincurred. Revisions in cost and earnings estimates during the term of the contract are reflected inthe period in which the need for revision becomes known. Losses, if any, are recognized fully whenfirst anticipated.
All other revenue is recorded and related costs transferred to cost of sales at the time the product is shipped or the service is provided.
Cash and Short-Term InvestmentsCash consists of cash and cash equivalents which are short-term, highly liquid investments withmaturity of 90 days and less. Short-term investments include money market instruments and commercial paper carried at the lower of cost or market value.
InventoriesInventories are stated at the lower of average cost and net recoverable value.
Property, Plant and EquipmentProperty, plant and equipment is stated at cost. The declining balance and straight-line methods areused in computing amortization of property, plant and equipment based on the following useful lives:buildings and improvements, 20 to 40 years; and machinery and equipment, three to 10 years.
Foreign Currency TranslationAssets and liabilities denominated in currencies other than Canadian dollars are translated atexchange rates in effect at the balance sheet date. Revenue and expense items are translated at average rates of exchange for the year. Translation gains or losses are included in the determina-tion of earnings, except for gains or losses arising on translation of accounts of foreign subsidiariesconsidered self-sustaining and gains or losses arising from the translation of foreign currency debtthat has been designated as a hedge of the net investment in subsidiaries, which are deferred as aseparate component of shareholders’ equity. Gains or losses arising from the translation of foreigncurrency debt not designated as a hedge of the net investment in subsidiaries are deferred, includedin other assets and amortized on a straight-line basis over the term of the debt.
Research and Development CostsResearch costs are charged to earnings in the periods in which they are incurred. Developmentcosts are also charged in the period incurred unless they meet the criteria for deferral. Governmentassistance arising from research and development costs is deducted from the related cost.Amortization of development costs deferred to future periods commences with the commercial pro-duction of the product and is charged to earnings based on anticipated sales of the product, over a period not exceeding five years.

GoodwillThe excess purchase price paid on the acquisition of businesses over the value assigned to identifi-able net assets acquired is allocated to goodwill. Goodwill is stated at cost less accumulated amor-tization and is being amortized on a straight-line basis over 40 years. The Company assesseswhether there has been impairment in the value of goodwill. This is accomplished in a number ofways, including determining whether projected undiscounted future cash flows from operationsexceed the net book value of goodwill as of the assessment date.
Income TaxesFuture income taxes relate to the expected future tax consequences of differences between the carrying amount of balance sheet items and their corresponding tax values. Future tax assets arerecognized only to the extent that, in the opinion of management, it is more likely than not that thefuture income tax assets will be realized. Future income tax assets and liabilities are adjusted for the effects of changes in tax laws and rates on the date of enactment or substantive enactment.
Investment tax credits arising from research and development are deducted from the relatedcosts and are accordingly included in the determination of earnings in the same year as therelated costs. Investment tax credits arising from the acquisition of property, plant and equipmentand deferred development costs are deducted from the cost of those assets with amortization calculated on the net amount.
PensionsThe Company accrues its obligations under employee pension plans and the related costs, net ofplan assets. The cost of pensions is actuarially determined using the projected benefits method pro-rated on service, expected plan investment performance, salary escalation and retirement ages ofemployees. For the purpose of calculating the expected return on plan assets, those assets arevalued at fair market value.
The excess of the net actuarial gain (loss) over 10% of the greater of the benefit obligation andthe fair value of plan assets is amortized over the remaining service period of active employees.
Stock-Based Compensation PlansThe Company’s stock-based compensation plans consist primarily of the Employee Stock OptionPlan (ESOP) and the Employee Stock Purchase Plan (ESPP) which are described in note 8. No com-pensation expense is recognized for the ESOP when stock options are issued to employees.Consideration paid by employees on the exercise of stock options is credited to capital stock.A compensation expense is recognized for the Company’s portion of the contributions made underthe ESPP.
Derivative Financial InstrumentsThe Company enters into forward, swap and option contracts to manage its exposure to fluctuationsin interest rates and foreign exchange rates. These derivative financial instruments are effective inmeeting the risk reduction objectives of the Company by generating offsetting cash flows related tothe underlying position in respect of amount and timing. CAE does not hold or issue derivativefinancial instruments for trading purposes.

CAE / a r 2 001 / n o t e s t o c o n s o l i d a t e d f i n a n c i a l s t a t e m e n t s / p a g e . 3 7
The foreign currency risk associated with purchase and sale commitments denominated in a foreigncurrency is hedged through a combination of forward contracts and options. The foreign currencygains and losses on these contracts are not recognized in the consolidated financial statements untilthe underlying firm commitment is recorded in earnings. At that time, the gains or the losses on suchderivatives are recorded in earnings as an adjustment to the underlying transaction. Premiums paidwith respect to options are deferred and charged to net earnings over the contract period.
Interest rate swap contracts are designated as hedges of the interest rate of certain financialinstruments. The interest payments relating to swap contracts are recorded in net earnings overthe life of the underlying transaction on an accrual basis as an adjustment to interest income orinterest expense.
Earnings per Share The calculation of earnings per share is based on the weighted average number of shares issued andoutstanding. Diluted earnings per share is calculated by dividing net earnings available to commonshareholders by the weighted average shares used in the basic earnings per share calculation plusthe number of common shares that would be issued assuming conversion of all potentially dilutivecommon shares outstanding using the treasury stock method. Conversion of the outstanding stockoptions would not materially dilute earnings per share.
Use of EstimatesThe preparation of financial statements in conformity with GAAP requires management to make esti-mates and assumptions that affect the reported amounts of assets and liabilities and the disclosureof the contingent assets and liabilities at the date of the financial statements and revenue andexpenses for the period reported. Actual results could differ from those estimates.
Note.02 / Discontinued Operations /
On February 2, 2000, the Board of Directors approved a plan to divest its Cleaning Technologies andEnergy Control Systems businesses. On May 31, the Company completed the sale of substantiallyall the assets of the Energy Control Systems business to SNC-Lavalin. CAE expects to conclude thesale of Cleaning Technologies during the first quarter of fiscal 2002.
The results of these operating units along with the results of Railway Technologies and Services,which was sold on December 3, 1999, (together the “Discontinued Operations”) have been reportedas Discontinued Operations. The results prior to the measurement date (December 3, 1999, forRailway Technologies – February 2, 2000, for the other Discontinued Operations) have been reportedseparately in the Consolidated Statements of Earnings. The previously reported financial statementshave been reclassified. Interest expense has been allocated to the Discontinued Operations basedon their share of the Company’s net assets.

Summarized financial information for the Discontinued Operations is as follows:
2001 2000
Revenue $ 119.5 $ 173.7
Results of operations prior to measurement dates, net of income taxes recovery of $3.1 $ – $ (6.0)
Net (loss) gain from discontinued operations,net of income tax recovery of $18.9 (2000 – income taxes of $2.7) (26.6) 13.8
Results of discontinued operations $ (26.6) $ 7.8
Current assets $ 82.7 $ 68.9Property, plant and equipment, net 16.6 19.4Goodwill 17.4 40.0Deferred income taxes – 0.3Other assets 0.9 1.0
Total assets 117.6 129.6Current liabilities 26.1 23.6Other liabilities 0.2 0.8
Net assets of discontinued operations $ 91.3 $ 105.2
Net cash used in operating activities $ (5.3) $ (10.4)Net cash used in investing activities (4.4) (10.5)Net cash (used in) provided by financing activities 4.4 (0.7)
Net cash used in discontinued operations $ (5.3) $ (21.6)
Note.03 / Inventories /
2001 2000
Work-in-progress $ 94.1 $ 60.3Raw materials, supplies and manufactured products 42.5 47.8
$ 136.6 $ 108.1

CAE / a r 2 001 / n o t e s t o c o n s o l i d a t e d f i n a n c i a l s t a t e m e n t s / p a g e . 3 9
Note.04 / Property, Plant and Equipment /
2001 2000
Accumulated Net Book Accumulated Net BookCost Amortization Value Cost Amortization Value
Land $ 11.8 $ – $ 11.8 $ 9.9 $ – $ 9.9Buildings and improvements 154.9 41.0 113.9 152.9 42.4 110.5
Machinery and equipment 208.6 130.3 78.3 213.8 119.4 94.4
Assets under construction Buildings 5.8 – 5.8 – – –Equipment 68.1 – 68.1 – – –
$ 449.2 $ 171.3 $ 277.9 $ 376.6 $ 161.8 $ 214.8
Note.05 / Other Assets /
2001 2000
Investment tax credits (i) $ 25.4 $ 14.8Investment in and advances to CVS Leasing Ltd. (ii) 21.0 16.4Deferred charges (ii), (iii) 13.7 10.4Deferred development costs (iv) 13.7 –Other 9.8 7.4
$ 83.6 $ 49.0
(i) Investment tax credits are available to reduce future federal income taxes payable in Canada.(ii) The Company led a consortium which was contracted by the UK Ministry of Defence (MoD)
to design, construct, manage, finance and operate an integrated simulator-based aircrew train-ing facility for the Medium Support Helicopter fleet of the Royal Air Force. The contract covers a40-year period, which can be terminated by the MoD after 20 years, in 2018.
In connection with the contract, the Company has established a subsidiary, CAE AircrewTraining Plc (Aircrew), of which it owns 74%, with the balance held by the other consortium part-ners. This subsidiary has leased the land from the MoD, has built the facility and operates thetraining centre, and has been consolidated with the accounts of the Company.
The pre-operating expenditures in connection with this contract were deferred until theaircrew training facility commenced training on April 1, 2000, and are being amortized overthe remaining life of the initial 20-year period of the contract.
In addition, the Company has a minority shareholding of 11% in, and has advanced fundsto, CVS Leasing Ltd., a corporation established to acquire the simulators and other equipmentthat is leased to Aircrew.
(iii) The pre-operating costs of the commercial training centres are being deferred and amortizedover a five-year period.
(iv) Research and development expenditures aggregated $111.4 million during the year (2000 –$116.1 million). The Company has deferred the costs incurred to develop its next generation fullflight simulator.

Note.06 / Debt Facilities /
A. Long-Term Debt
2001 2000
Senior notes (i) $ 190.4 $ 177.0Five-year revolving term loan, to a maximum of US$220.0 unsecured, due May 31, 2002 (note 18(ii)) – –
Five-year revolving term loan, to a maximum of Deutschmark 100.0 unsecured, due May 31, 2002 (2001 – 65.0 DM; 2000 – 87.0 DM) (ii) 46.1 61.9
Eighteen-year term loan, to a maximum of £12.7 secured, maturing April 1, 2001 to October 1, 2015 (2001 – £12.0; 2000 – £11.9) (iii) 26.8 27.6
Obligations under capital lease commitments (iv) 3.7 5.1
267.0 271.6Less: Long-term debt due within one year 2.4 0.9
$ 264.6 $ 270.7
(i) Pursuant to a private placement with certain investors, the Company borrowed US$108 millionand $20 million. These unsecured senior notes, which rank equally with the term bank financingwith fixed repayment amounts in 2005, 2007, 2009 and 2012. Fixed interest of approximately7.5% is payable semi-annually in June and December.
(ii) Interest on bank term loans is charged at rates approximating LIBOR.(iii) The Company arranged project financing for its subsidiary to finance the Company’s Medium
Support Helicopter programme for the Ministry of Defence in the United Kingdom. This termloan is secured by the project assets of the subsidiary and is repayable over 18 years toOctober 1, 2015. Interest on the loan is charged at a rate approximating LIBOR (note 5(ii)).
(iv) The effective interest rate on obligations under capital leases was approximately 5.2% (2000 – 7.0%).
(v) Payments required in each of the next five years to meet the retirement provisions of the long-term debt are as follows:
Year ending March 31,2002 $ 2.42003 50.3 2004 3.32005 23.02006 2.6 Thereafter 185.4
$ 267.0
Interest expense on long-term debt was $17.7 million (2000 – $14.5 million).
B. Short-Term DebtThe Company has unsecured bank lines of credit available in various currencies totalling $85.0 million(2000 – $80.4 million). The effective interest rate on short-term borrowings was 8.4% (2000 – 7.6%).
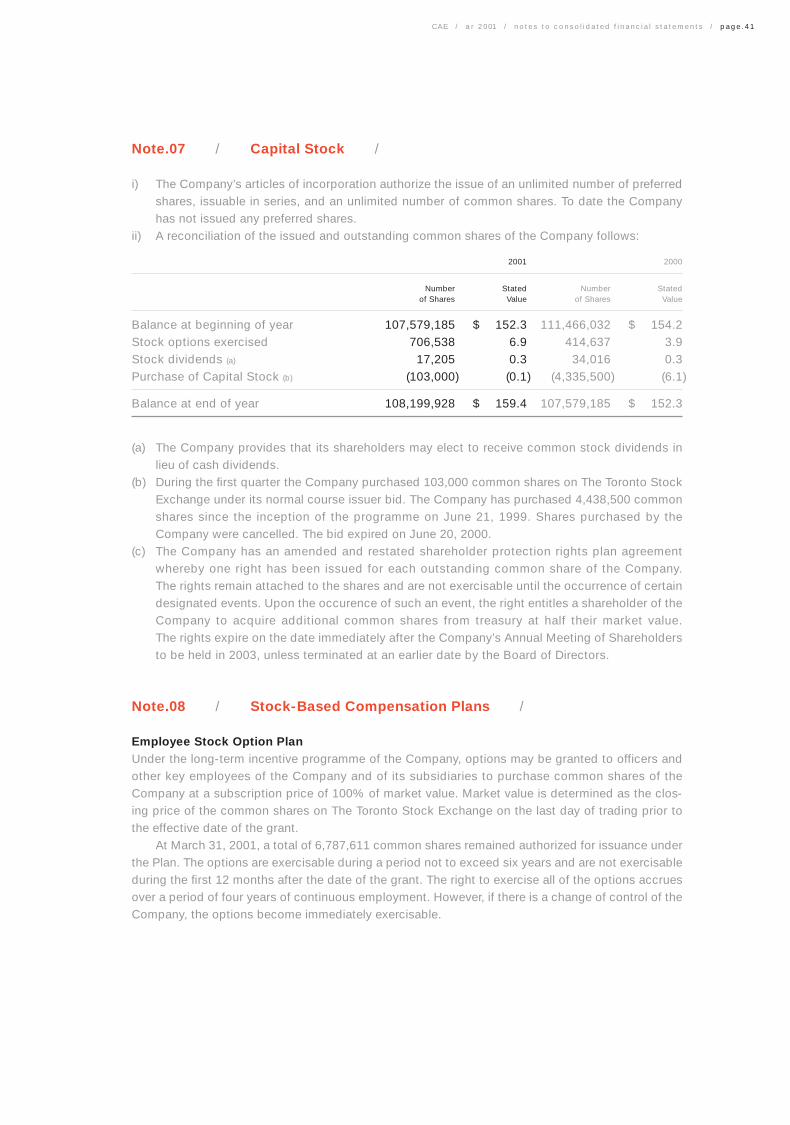
CAE / a r 2 001 / n o t e s t o c o n s o l i d a t e d f i n a n c i a l s t a t e m e n t s / p a g e . 4 1
Note.07 / Capital Stock /
i) The Company’s articles of incorporation authorize the issue of an unlimited number of preferredshares, issuable in series, and an unlimited number of common shares. To date the Companyhas not issued any preferred shares.
ii) A reconciliation of the issued and outstanding common shares of the Company follows:
2001 2000
Number Stated Number Statedof Shares Value of Shares Value
Balance at beginning of year 107,579,185 $ 152.3 111,466,032 $ 154.2Stock options exercised 706,538 6.9 414,637 3.9Stock dividends (a) 17,205 0.3 34,016 0.3Purchase of Capital Stock (b) (103,000) (0.1) (4,335,500) (6.1)
Balance at end of year 108,199,928 $ 159.4 107,579,185 $ 152.3
(a) The Company provides that its shareholders may elect to receive common stock dividends inlieu of cash dividends.
(b) During the first quarter the Company purchased 103,000 common shares on The Toronto StockExchange under its normal course issuer bid. The Company has purchased 4,438,500 commonshares since the inception of the programme on June 21, 1999. Shares purchased by theCompany were cancelled. The bid expired on June 20, 2000.
(c) The Company has an amended and restated shareholder protection rights plan agreementwhereby one right has been issued for each outstanding common share of the Company.The rights remain attached to the shares and are not exercisable until the occurrence of certaindesignated events. Upon the occurence of such an event, the right entitles a shareholder of theCompany to acquire additional common shares from treasury at half their market value.The rights expire on the date immediately after the Company’s Annual Meeting of Shareholdersto be held in 2003, unless terminated at an earlier date by the Board of Directors.
Note.08 / Stock-Based Compensation Plans /
Employee Stock Option Plan Under the long-term incentive programme of the Company, options may be granted to officers andother key employees of the Company and of its subsidiaries to purchase common shares of theCompany at a subscription price of 100% of market value. Market value is determined as the clos-ing price of the common shares on The Toronto Stock Exchange on the last day of trading prior tothe effective date of the grant.
At March 31, 2001, a total of 6,787,611 common shares remained authorized for issuance underthe Plan. The options are exercisable during a period not to exceed six years and are not exercisableduring the first 12 months after the date of the grant. The right to exercise all of the options accruesover a period of four years of continuous employment. However, if there is a change of control of theCompany, the options become immediately exercisable.

A reconciliation of the outstanding options is as follows:
as at march 31 2001 2000
Weighted WeightedNumber Average Number Average
of Options Exercise Price of Options Exercise Price
Options outstanding at beginning of year 2,739,663 $ 9.92 2,500,800 $ 10.68Granted 1,009,200 $ 13.68 1,307,000 $ 8.41Exercised (706,538) $ 9.79 (414,637) $ 9.33Forfeited/expired (485,150) $ 10.12 (653,500) $ 10.16
Options outstanding at end of year 2,557,175 $ 11.40 2,739,663 $ 9.92
Options exercisable at March 31 634,250 $ 10.68 787,000 $ 10.77
The following table summarizes information about the Company’s ESOP as at March 31, 2001:
Options Outstanding Options Exercisable
WeightedAverage Weighted Weighted
Remaining Average AverageRange of Number Contractual Exercise Number ExerciseExercise Prices Outstanding Life (years) Price Exercisable Price
$8.20 to $11.40 1,276,125 3.6 $ 9.31 514,500 $ 10.05$12.85 to $13.30 1,207,050 4.7 $ 13.18 119,750 $ 12.85$18.40 to $18.80 74,000 5.4 $ 18.48 – –
Total 2,557,175 4.2 $ 11.40 634,250 $ 10.68
Employee Stock Purchase Plan Effective April 1, 2000, the Company introduced an ESPP to enable employees of the Company andits participating subsidiaries to acquire common shares of the Company through regular payrolldeductions plus employer contributions. The plan allows employees to contribute up to 10% of theirannual base salary. The Company and its participating subsidiaries match the first $500 employeecontribution and contribute $1 for every $3 on additional employee contributions, to a maximum of2% of the employee’s base salary. Participation at March 31, 2001, was 2,639 employees.
Common shares of the Company are purchased by the ESPP trustee on behalf of the partic-ipants on the open market, through the facilities of The Toronto Stock Exchange.

CAE / a r 2 001 / n o t e s t o c o n s o l i d a t e d f i n a n c i a l s t a t e m e n t s / p a g e . 4 3
Note.09 / Financial Instruments /
Foreign Currency RiskThe fair value of the forward foreign exchange contracts and foreign currency options is representedby the estimated amounts that the Company would receive or pay to settle the contracts at the bal-ance sheet date, taking into account the unrealized open gain or loss on open contracts.
The Company entered into currency rate swap contracts maturing on December 13, 2002, inrespect of certain inter-company loan transactions. The Company receives interest, calculated semi-annually on a notional balance of US$21 million, at a weighted average interest rate of LIBOR plus3.6% (effective rate of 10.3%). The Company pays interest, calculated semi-annually on notionalbalances of Euro 16.5 million and SEK 27.4 million, at weighted average interest rates of EURIBOR
plus 3.4% (effective rate of 8.1%) and STIBOR plus 2.9% (effective rate of 7.2%) respectively.
Credit RiskThe Company is exposed to credit risk on billed and unbilled accounts receivable. However, its cus-tomers are primarily established companies with good credit ratings or government agencies, fac-tors that minimize the risk. In addition, the Company typically receives substantial nonrefundabledeposits on contracts.
The Company is exposed to credit risk in the event of non-performance by counterparties to itsderivatives financial instruments, but does not expect non-performance by any of the counterpar-ties. The counterparties for financial instruments are major, highly rated financial institutions.
Interest Rate RiskThe Company is exposed to fixed interest rate risk with respect to its short-term investments andlong-term debt. The Company entered into interest rate swap agreements with two different financialinstitutions to mitigate the risk with respect to $72 million of fixed rate long-term debt, whereby inthe first instance the Company will receive a fixed interest rate of 7.2% semi-annually for 8 years andin the second instance the Company will receive a fixed interest rate of 7.7% semi-annually for 15years. Correspondingly, the interest rate swap contracts require that the Company pay in the firstinstance semi-annually and in the second instance quarterly.
Pursuant to the requirements of its long-term project financing, the Company’s subsidiaryentered into an interest rate swap agreement with two financial institutions for a maximum totalnominal value of £12.7 million whereby the subsidiary will receive payments of floating rate interestand will pay a fixed interest rate of 6.8% semi-annually for 13 years.
Fair Value of Financial InstrumentsThe following methods and assumptions have been used to estimate the fair value of the financialinstruments:
• Cash and short-term investments, accounts receivable, accounts payable and accrued liabilities arevalued at their carrying amounts on the balance sheet, which represent an appropriate estimate oftheir fair values due to their near-term maturities.
• Capital lease obligations are valued using the discounted cash flow method.• Long-term debt value is estimated based on the quoted market price for the same or similar debt
instruments, as well as discounted cash flows using current interest rates for debt with similar terms,company rating and remaining maturity.
• Interest rate and currency swap contracts reflect the present value of the potential gain or loss ifsettlement were to take place on March 31, 2001.

The fair value of the financial instruments, as at March 31, is as follows:
2001 2000
Fair Carrying Fair Carrying Value Amount Value Amount
Long-term debt $ 276.7 $ 263.3 $ 277.3 $ 266.5Capital lease obligation 3.7 3.7 5.1 5.1Forward exchange contracts 304.0 309.5 355.3 350.4Interest rate swap contracts 2.6 – 2.1 –Currency swap contracts 4.5 – 3.7 –
GuaranteesCAE had outstanding as at March 31, 2001, letters of credit and performance guarantees in theamount of $68 million issued in the normal course of business.
Note.10 / Income Taxes /
A reconciliation of income taxes at Canadian statutory rates with the reported income taxes isas follows:
2001 2000
Liability Deferral Method Method
Earnings from continuing operations before income taxes $ 202.5 $ 131.5
Statutory income tax rates in Canada 44.6% 44.6%Income taxes at Canadian statutory rates 90.3 58.7Difference between Canadian statutory rates and thoseapplicable to foreign subsidiaries (7.9) (7.3)
Manufacturing and processing allowance (11.1) (9.0)Losses not tax effected 3.6 –Tax benefit of losses not previously recognized (4.7) (3.2)Research and development investment tax credit (1.1) (0.7)Reduction in Canadian statutory rate (0.6) –Other (0.7) 2.3
Total income tax expense $ 67.8 $ 40.8

CAE / a r 2 001 / n o t e s t o c o n s o l i d a t e d f i n a n c i a l s t a t e m e n t s / p a g e . 4 5
Significant components of the provision for income tax expense attributable to continuing opera-tions are as follows:
2001
LiabilityMethod
Current tax expense $ 79.1
Change in temporary differences (13.2)Recognition of loss carryforwards 2.5Tax rate changes (0.6)
Future income tax benefit (11.3)
Total income tax expense $ 67.8
The tax effects of temporary differences that gave rise to future tax liabilities and assets are as follows:
at march 31 2001
Non-capital loss carryforwards $ 49.6Investment tax credits (31.7)Capital assets (14.7)Employee pension plans (2.5)Amounts not currently deductible 20.2Percentage of completion versus completed contract (19.7)Other 0.5
Total future income taxes $ 1.7
Future income taxes comprise:Future income tax asset – current portion $ 16.6Future income tax asset – long-term portion 16.0Future income tax liability – current portion (16.0)Future income tax liability – long-term portion (14.9)
Total future income taxes $ 1.7
As of March 31, 2001, the Company has accumulated non-capital tax losses carried forward relatingto operations in the United States for an amount of approximately US$142.6 million. The losses forincome tax purposes expire in 2005 through 2013. For financial reporting purposes, a future taxasset of US$15.8 million has been recognized in respect of these loss carryforwards.

Note.11 / Supplementary Cash Flow Information /
Cash provided by (used in) non-cash working capital:
2001 2000
Accounts receivable $ 31.4 $ (54.6)Inventories (41.9) 9.3Prepaid expenses 5.7 0.3Income taxes recoverable 49.6 29.2Accounts payable and accrued liabilities 62.4 88.4Deposits on contracts (37.6) 79.2
$ 69.6 $ 151.8
Net cash paid during the yearIncome taxes $ 8.8 $ 0.5Interest $ 20.1 $ 13.1
Amortization costs of:Property, plant and equipment $ 25.6 $ 29.0Goodwill $ 4.1 $ 4.7
Note.12 / Contingencies /
Through the normal course of operations, the Company is party to a number of lawsuits, claims andcontingencies. Accruals are made in instances where it is probable that liabilities will be incurredand where such liabilities can be reasonably estimated. Although it is possible that liabilities may beincurred in instances for which no accruals have been made, the Company has no reason to believethat the ultimate outcome of these matters will have a material impact on its financial position.
Note.13 / Government Cost Sharing /
During fiscal 1997, the Company signed an agreement with the Government of Canada under whichthe Government shares in the cost of certain visual research and development programmes.Funding in the amount of $31.2 million was completed during 2001 and is repayable in the form ofroyalties based on future sales levels related to the programmes funded. The royalty payments willcontinue until March 31, 2012, up to an amount not to exceed $41.9 million.

CAE / a r 2 001 / n o t e s t o c o n s o l i d a t e d f i n a n c i a l s t a t e m e n t s / p a g e . 4 7
Note.14 / Operating Lease Commitments /
Future minimum lease payments under operating leases, the most significant of which relate to theMedium Support Helicopter contract with the UK MoD as described in note 6(ii), are as follows:
Year ending March 31,2002 $ 33.72003 35.92004 34.22005 33.32006 29.1Thereafter 201.8
$ 368.0
Note.15 / Pensions /
The Company has defined benefit plans that provide benefits based on length of service and finalaverage earnings. The Company has an obligation to ensure there are sufficient funds in the plans topay the benefits earned.
Contributions reflect actuarial assumptions concerning future investment returns, salary projec-tions and future service benefits. Plan assets are represented primarily by Canadian and foreignequities and government and corporate bonds.
For the year ended March 31, 2001, the changes in the pension obligations and in the fair valueof assets and the funded status of the defined benefit plans were as follows:
Pension Benefitsat march 31 2001
Change in pension obligationsPension obligation, beginning of year, as restated $ 111.5Current service cost 3.3Interest cost 7.8Employee contributions 2.3Loss on plan amendments 1.6Pension benefits paid (8.4)Actuarial loss 7.9
Pension obligation, end of year $ 126.0
Change in fair value of plan assetsFair value of plan assets, beginning of year $ 120.8Return on plan assets 10.7Pension benefits paid (7.7)Employee contribution 2.3Actuarial loss (4.6)
Fair value of plan assets, end of year $ 121.5
Funded status-plan deficit $ (4.5)Unamortized actuarial loss 12.5Unamortized loss on plan amendments 1.6
Accrued pension asset $ 9.6

The actuarial present value of accrued pension benefits has been estimated taking into considera-tion economic and demographic factors over an extended future period. Significant assumptionsused in the calculation are as follows:
2001 2000
Return on plan assets 9.0% 9.0%Discount rate for pension benefit obligations 6.5% 8.0%Compensation rate increases 2.75% to 5.25% 3.5% to 6.0%
The net pension expense for the year ended March 31, 2001, included the following components:
Pension Benefits2001
Current service cost $ 3.3Interest cost on projected pension obligations 7.8Expected return on plan assets (10.7)
Net pension expense $ 0.4
The following table summarizes the components of CAE’s net pension credit for fiscal 2000:
2000
Current service cost $ 2.3Interest cost on projected plan benefits 7.7Expected return on plan assets (10.2)Net amortization and other (1.5)
Net pension credit $ (1.7)
Note.16 / Business Segments /
The Company’s significant business segments include:(i) Commercial Simulation and Training – the world-leading supplier of commercial flight simulators
and visual systems, and training systems.(ii) Military Simulation and Controls – a premier supplier of military flight simulators, visual systems
and training systems. The segment also supplies a variety of other land-based military simula-tion and training systems and marine control systems.
(iii) Forestry Systems – the world leader in providing solutions for the forest products sector.The business segment is comprised of two divisions, Wood Products and Pulp and Paper,supplying proprietary machinery and equipment for softwood lumber and engineered woodproducers and advanced screening solutions for pulp and paper companies.
Each operating segment is led by a senior executive and offers different products and uses differenttechnology and marketing strategies. The Company evaluates performance based on operatingearnings before interest and income taxes and uses capital employed to assess resources allocatedto each segment. Capital employed includes accounts receivable, inventories, prepaid expenses,property, plant and equipment, goodwill and other assets less accounts payable and accrued liabilities, deposits on contracts and contingent consideration due on acquisitions included inother long-term liabilities.

CAE / a r 2 001 / n o t e s t o c o n s o l i d a t e d f i n a n c i a l s t a t e m e n t s / p a g e . 4 9
Financial information on the Company’s operating and geographic segments is shown in the following tables:
Business Segments2001 2000
Capital employedCommercial Simulation and Training $ 74.5 $ 36.7Military Simulation and Controls 79.0 68.8Forestry Systems 181.6 165.6 Other 18.4 18.2
Total capital employed $ 353.5 $ 289.3Cash 156.8 163.5Short-term investments 122.8 71.1 Income taxes recoverable 5.0 28.6 Accounts payable and accrued liabilities 375.4 306.7Deposits on contract 181.5 219.2Future income taxes – long-term 16.6 –Long-term liabilities 24.6 40.6Net assets of discontinued operations 91.3 105.2
Total assets $ 1,327.5 $1,224.2
Capital expendituresCommercial Simulation and Training $ 72.9 $ 11.7Military Simulation and Controls 3.4 10.1Forestry Systems 7.7 9.1
$ 84.0 $ 30.9
AmortizationCommercial Simulation and Training $ 9.3 $ 11.3Military Simulation and Controls 9.8 11.0Forestry Systems 10.6 11.4
$ 29.7 $ 33.7
Deletions to goodwillForestry Systems $ – $ ( 11.0)
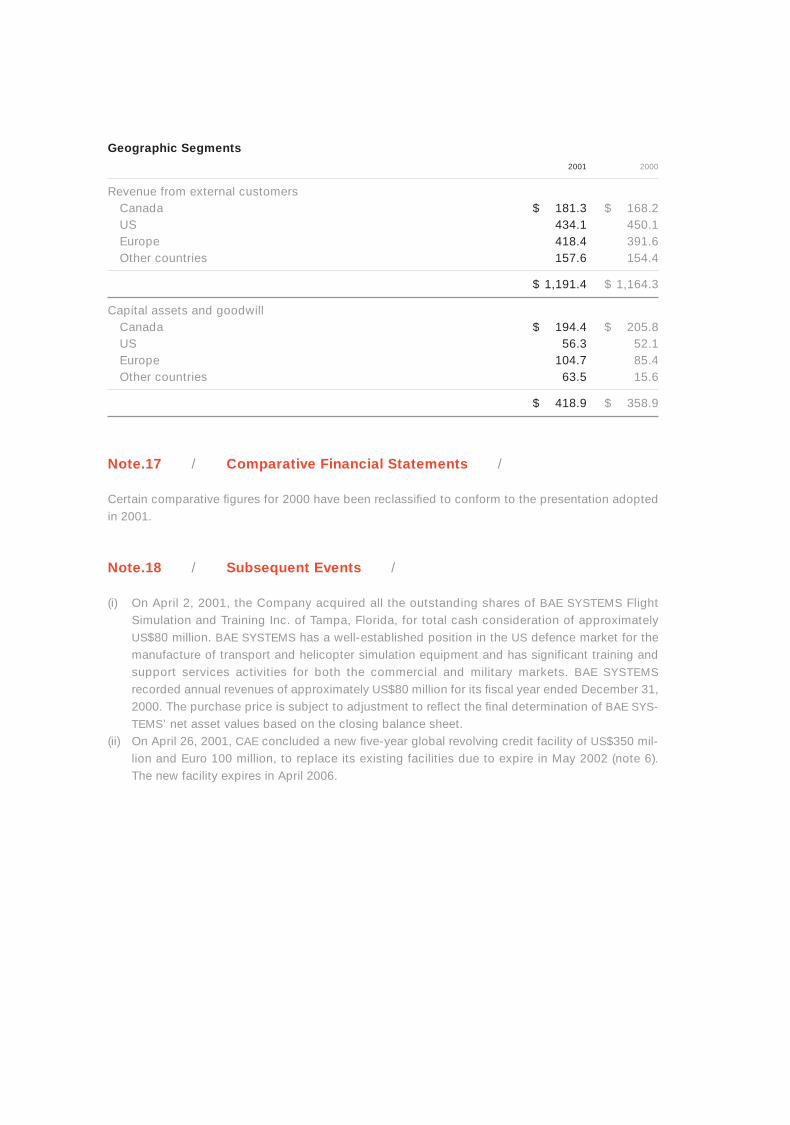
Geographic Segments2001 2000
Revenue from external customersCanada $ 181.3 $ 168.2US 434.1 450.1Europe 418.4 391.6Other countries 157.6 154.4
$ 1,191.4 $ 1,164.3
Capital assets and goodwillCanada $ 194.4 $ 205.8US 56.3 52.1Europe 104.7 85.4Other countries 63.5 15.6
$ 418.9 $ 358.9
Note.17 / Comparative Financial Statements /
Certain comparative figures for 2000 have been reclassified to conform to the presentation adoptedin 2001.
Note.18 / Subsequent Events /
(i) On April 2, 2001, the Company acquired all the outstanding shares of BAE SYSTEMS FlightSimulation and Training Inc. of Tampa, Florida, for total cash consideration of approximatelyUS$80 million. BAE SYSTEMS has a well-established position in the US defence market for themanufacture of transport and helicopter simulation equipment and has significant training andsupport services activities for both the commercial and military markets. BAE SYSTEMS
recorded annual revenues of approximately US$80 million for its fiscal year ended December 31,2000. The purchase price is subject to adjustment to reflect the final determination of BAE SYS-
TEMS’ net asset values based on the closing balance sheet. (ii) On April 26, 2001, CAE concluded a new five-year global revolving credit facility of US$350 mil-
lion and Euro 100 million, to replace its existing facilities due to expire in May 2002 (note 6). The new facility expires in April 2006.

CAE / a r 2 001 / f i v e - y e a r r e v i e w / p a g e . 5 1
Five-Year Review
(amounts in millions of dollarsexcept where indicated by *) 2001 2000 1999 1998 1997
Continuing operationsRevenue $ 1,191.4 1,164.3 905.9 799.2 762.4Amortization $ 29.7 33.7 28.6 25.9 25.1Earnings $ 134.7 90.7 73.7 73.4 57.8Earnings per share* $ 1.25 0.83 0.66 0.67 0.53
Net earnings $ 108.1 98.5 77.3 70.2 60.3Net earnings per share* $ 1.00 0.90 0.70 0.64 0.55Ratio of current assetsto current liabilities* 1.3 1.4 1.4 1.7 1.4
Number of registeredshareholders* 2,130 2,392 2,600 2,800 3,100
Cash dividends paid per common share* $ 0.20 0.19 0.16 0.16 0.16
Quarterly Financial Information
(amounts in millions of dollars First Second Third Fourthexcept per share amounts) Quarter Quarter Quarter Quarter
2001Continuing operations
Revenue $ 286.4 295.0 318.9 291.1Earnings $ 30.5 35.7 34.5 34.0Earnings per share $ 0.28 0.33 0.32 0.32
Net earnings $ 13.0 34.6 31.5 29.0Net earnings per share $ 0.12 0.32 0.29 0.27Common share trading range:
High $ 15.75 20.75 25.30 25.95Low $ 12.75 15.00 17.75 19.90
(amounts in millions of dollars First Second Third Fourthexcept per share amounts) Quarter Quarter Quarter Quarter
2000Continuing operations
Revenue $ 240.5 257.8 342.9 323.1Earnings $ 19.1 21.4 25.7 24.5Earnings per share $ 0.18 0.20 0.23 0.22
Net earnings $ 16.7 20.7 37.5 23.6Net earnings per share $ 0.15 0.19 0.34 0.22Common share trading range:
High $ 9.45 9.75 10.60 17.00Low $ 7.80 8.00 7.30 9.65

Lynton R. Wilson, O.C.1,2,4
Chairman of the Board, CAE Inc.Oakville, Ontario
Derek H. Burney, O.C.1
President and Chief Executive Officer,CAE Inc.Toronto, Ontario
John A. (Ian) Craig 3
Business Consultant Wilmington, North Carolina
R. Fraser Elliott, C.M., Q.C.1
Senior Partner,Stikeman ElliottToronto, Ontario
H. Garfield Emerson, Q.C.2
President and Chief Executive Officer,NM Rothschild & Sons Canada LimitedToronto, Ontario
Anthony S. Fell 3,4
Chairman,RBC Dominion Securities Inc.Toronto, Ontario
The Honourable James A.Grant, P.C., Q.C.1,2
Partner,Stikeman ElliottMontreal, Quebec
James F. Hankinson 3
President and Chief Executive Officer,New Brunswick PowerCorporationFredericton, New Brunswick
James W. McCutcheon,Q.C.3
Counsel,McCarthy TétraultToronto, Ontario
George K. Petty 2,4
Business ConsultantSan Luis Obispo, California
Lawrence N. Stevenson 4
President and Chief Executive Officer,Pathfinder Capital Inc.Toronto, Ontario
Lynton R. WilsonChairman of the Board
Derek H. BurneyPresident and Chief Executive Officer
Donald W. CampbellExecutive Vice President,Military Simulation andTraining
Glenn R. FrederickExecutive Vice President,Business Processes andHuman Resources
Rashid A. KhanExecutive Vice President,Marine Controls
Hani R. MacramallahExecutive Vice President,Operations
Paul G. RenaudExecutive Vice President,Chief Financial Officer and Secretary
Stephen E. WilsonExecutive Vice President,Commercial Simulation and Training
Roch LeblancPresident, Forestry Systems,Pulp and Paper
Darrell S. MadillPresident, Forestry Systems,Wood Products
Michael A. CossarTreasurer
Robert C. HedgesController and Assistant Secretary
Officers
Board of Directors
1 Member of the Executive Committee2 Member of the Compensation
Committee3 Member of the Audit Committee4 Member of the Governance
Committee
Left to right (seated): D.H. Burney, G.K. Petty, J.W. McCutcheon, J.A. Grant, R.F. Elliott, L.R. Wilson
Left to right (standing): J.F. Hankinson, H.G. Emerson, A.S. Fell, L.N. Stevenson, J.A. Craig

Information for Shareholders
CAE Common SharesCAE’s shares are traded on theToronto Stock Exchange under the symbol “CAE”.
Dividend Reinvestment PlanRegistered shareholders of CAE Inc.wishing to receive dividends in theform of CAE Inc. common sharesrather than a cash payment may participate in CAE’s dividend reinvestment plan.
Through this plan, quarterly dividends can be reinvested in CAE common shares at the averagemarket price. This price will be theweighted average trading prices of the common shares on the TorontoStock Exchange for the five (5) tradingdays immediately preceding the dividend payment date.
In order to obtain the dividendreinvestment plan form or for additional information regarding CAE’scommon shares, please contact:Computershare Trust Company of Canada 100 University Avenue, 11th FloorToronto, Ontario M5J 2Y1Tel: (416) 981-9633
1-800-663-9097Fax: (416) [email protected]
Direct Deposit DividendRegistered shareholders who receivecash dividends may elect to have the dividend payment depositeddirectly to their bank accounts insteadof receiving a cheque. In order toobtain the direct deposit dividendform please contact:Computershare Trust Company of Canada 100 University Avenue, 11th FloorToronto, Ontario M5J 2Y1Tel: (416) 981-9633
1-800-663-9097Fax: (416) [email protected]
Tentative Quarterly Results ReleaseDates for Fiscal 2002August 8, 2001November 7, 2001February 6, 2002May 8, 2002
Additional InformationIf you wish to receive additionalcopies of CAE’s annual report orcopies of the annual information form, please contact:CAE Inc.Corporate Relations PO Box 30, Suite 3060Royal Bank PlazaToronto, Ontario M5J 2J1Tel: (416) 865-0070
1-800-760-0667Fax: (416) 865-0337www.cae.com
Version françaiseLa version française du rapportannuel est disponible sur demande au service des relations d’entreprise,Royal Bank Plaza, Bureau 3060, C.P. 30, Toronto, Ontario M5J 2J1
Annual General MeetingThe Annual General Meeting will be held at the Glenn Gould Studio, CBC building, 250 Front Street West,Toronto, Ontario, Wednesday, June 20, 2001, at 11:30 a.m.
AuditorsPricewaterhouseCoopers, Chartered AccountantsToronto, Ontario
Transfer Agent and RegistrarComputershare Trust Company of CanadaToronto, OntarioMontreal, QuebecVancouver, British Columbia
TrademarksThe CAE logo, and the termsMAXVUE, ATMOS, Simfinity, Sim XXI,Gladiator, Mill Host and PanelMSRare all trademarks of CAE or its subsidiaries.
100
150
200
250
300
CAE Share Performance vs TSE 300 IndexAssumes $100 invested in the common shares of the Company on October 31, 1999
CAE TSE 300
October 1999
March2001
CAE at a Glance
Business ProfileCAE is the world’s premier provider of simulation and control technologies for training and opti-mization solutions in Aerospace, Defence and Forestry. Headquartered in Canada and operatingglobally, the Company employs approximately 7,000 people and has revenues in excess of$1 billion (CAD.).
Commercial Simulation and TrainingCAE is the world leader in the design and production ofcommercial flight simulatorsand visual systems. CAE ismaking a major move into theflight training market to fuelfuture growth.
Military Simulation and TrainingCAE is the premier designerand manufacturer of militaryflight and land-based simulationand training systems.
Marine ControlsCAE is the world leader in thesupply of control and trainingsystems for marine and powerplant applications.
Forestry Systems
CAE is the world leader in providing optimization andcontrol solutions for the soft-wood, engineered wood andpulp and paper sectors.
All illustrations in CAE’s 2001 annual report were created by the CAE Creative Services group:Zbynek Najser, Martin Petit, Jean-Marc Laverdure, Sean Poole, Keith Selevich, Graphic Designers and Gilles Guitard, Manager.
Inte
rbra
nd
Tu
dh
op
e, T
oro
nto
P
rin
ted
in C
anad
a

PO Box 30, Suite 3060, Royal Bank PlazaToronto, Ontario, Canada M5J 2J1 www.cae.com
Realizing Growth and Value
CAE Annual Report for the year ended March 31, 2001
CA
E A
nn
ua
l Re
po
rt for th
e y
ea
r en
de
d M
arc
h 3
1,2
00
1


![DIGITAL DISRUPTION: Realizing Growth Potential DISRUPTION: [adapt to survive] ... industry and every company. ... 9:40am Session to Session Travel Time](https://static.documents.pub/doc/80x56/5b0c76747f8b9af65e8c1d17/digital-disruption-realizing-growth-potential-disruption-adapt-to-survive-.jpg)


