This is a repository copy of Recent unrest (2002–2015) imaged by space geodesy at the highest risk Chilean volcanoes: Villarrica, Llaima, and Calbuco (Southern Andes).
White Rose Research Online URL for this paper:http://eprints.whiterose.ac.uk/116790/
Version: Accepted Version
Article:
Delgado, F, Pritchard, ME, Ebmeier, S orcid.org/0000-0002-5454-2652 et al. (2 more authors) (2017) Recent unrest (2002–2015) imaged by space geodesy at the highest risk Chilean volcanoes: Villarrica, Llaima, and Calbuco (Southern Andes). Journal of Volcanology and Geothermal Research, 344. pp. 270-288. ISSN 0377-0273
Items deposited in White Rose Research Online are protected by copyright, with all rights reserved unless indicated otherwise. They may be downloaded and/or printed for private study, or other acts as permitted by national copyright laws. The publisher or other rights holders may allow further reproduction and re-use of the full text version. This is indicated by the licence information on the White Rose Research Online record for the item.
Takedown
If you consider content in White Rose Research Online to be in breach of UK law, please notify us by emailing [email protected] including the URL of the record and the reason for the withdrawal request.
ENVISAT 30 IS6 HH 2-3 months (1) < 35 days Not analyzed (3)
RADARSAT-2 24 Wide Fine 2 HH 1.5 – 2.5 months (1) 24 days Not analyzed (4)
ALOS 46 FBS HH > 3 years < 46 days (2) 3 years (5)
CSK 1-16 HIMAGE HH 1 month 12 days Not analyzed (4)
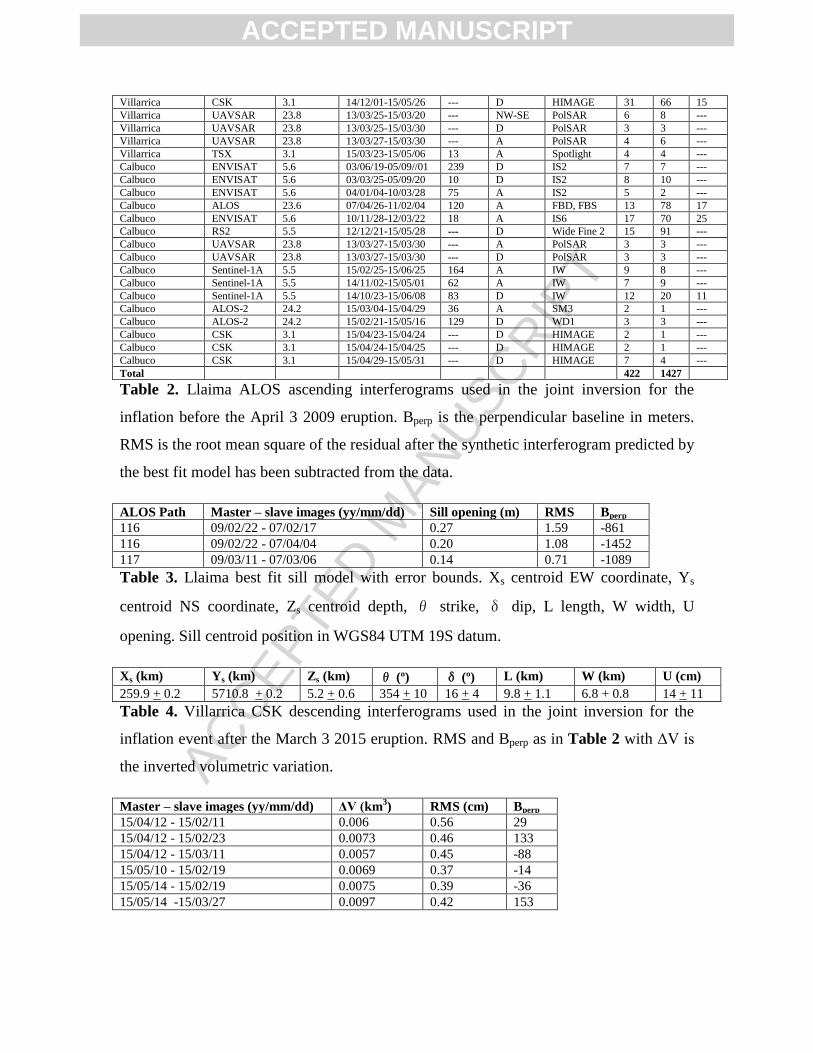
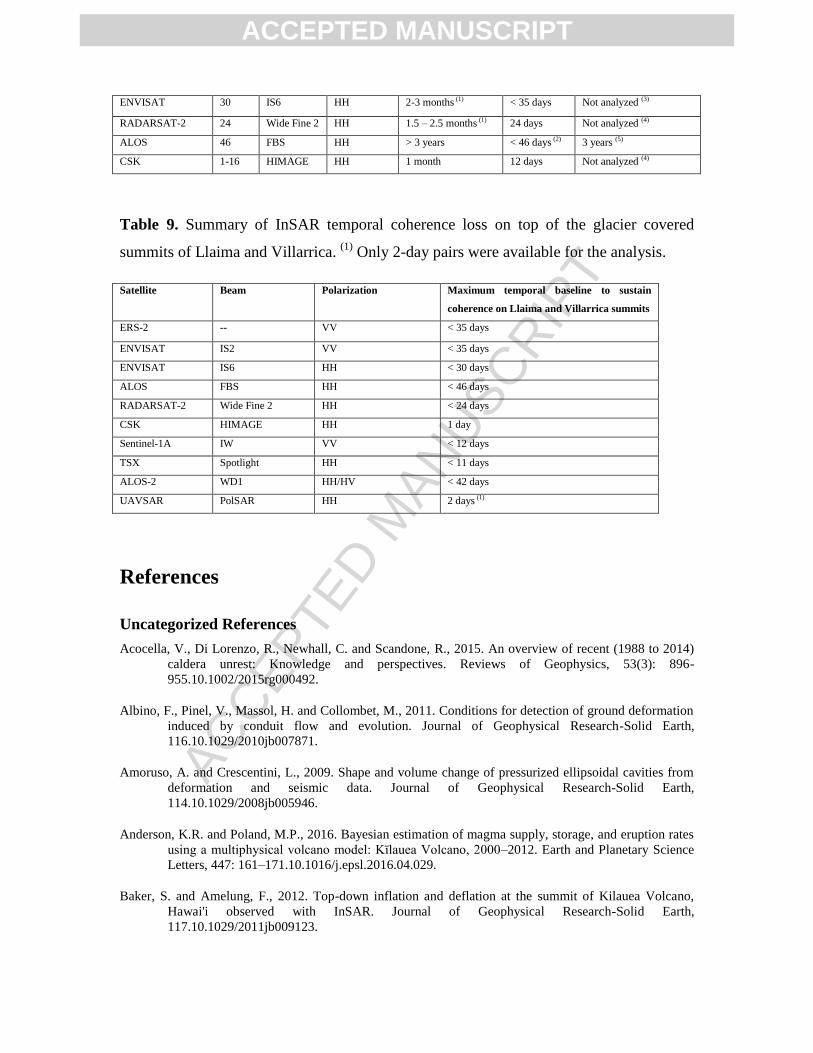
Table 9. Summary of InSAR temporal coherence loss on top of the glacier covered
summits of Llaima and Villarrica. (1) Only 2-day pairs were available for the analysis.
Satellite Beam Polarization Maximum temporal baseline to sustain
coherence on Llaima and Villarrica summits
ERS-2 -- VV < 35 days
ENVISAT IS2 VV < 35 days
ENVISAT IS6 HH < 30 days
ALOS FBS HH < 46 days
RADARSAT-2 Wide Fine 2 HH < 24 days
CSK HIMAGE HH 1 day
Sentinel-1A IW VV < 12 days
TSX Spotlight HH < 11 days
ALOS-2 WD1 HH/HV < 42 days
UAVSAR PolSAR HH 2 days (1)
References
Uncategorized References
Acocella, V., Di Lorenzo, R., Newhall, C. and Scandone, R., 2015. An overview of recent (1988 to 2014) caldera unrest: Knowledge and perspectives. Reviews of Geophysics, 53(3): 896-955.10.1002/2015rg000492.
Albino, F., Pinel, V., Massol, H. and Collombet, M., 2011. Conditions for detection of ground deformation induced by conduit flow and evolution. Journal of Geophysical Research-Solid Earth, 116.10.1029/2010jb007871.
Amoruso, A. and Crescentini, L., 2009. Shape and volume change of pressurized ellipsoidal cavities from deformation and seismic data. Journal of Geophysical Research-Solid Earth, 114.10.1029/2008jb005946.
Anderson, K.R. and Poland, M.P., 2016. Bayesian estimation of magma supply, storage, and eruption rates using a multiphysical volcano model: K┆lauea Volcano, 2000–2012. Earth and Planetary Science Letters, 447: 161–171.10.1016/j.epsl.2016.04.029.
Baker, S. and Amelung, F., 2012. Top-down inflation and deflation at the summit of Kilauea Volcano, Hawai'i observed with InSAR. Journal of Geophysical Research-Solid Earth, 117.10.1029/2011jb009123.
ACCEPTED MANUSCRIPT
ACCEP
TED M
ANUSC
RIPT
Basualto, D., Moreno, H., Pea, P., Muoz, J., Delgado, C. and Gallegos, C., 2009, Actividad ssmica del actual ciclo eruptivo del volcn Llaima, periodo enero 2005-febrero 2008, XII Congreso Geolgico Chileno, S7_006.
Bathke, H., Shirzaei, M. and Walter, T.R., 2011. Inflation and deflation at the steep-sided Llaima stratovolcano (Chile) detected by using InSAR. Geophysical Research Letters, 38.10.1029/2011gl047168.
Beauducel, F., Briole, P. and Froger, J.L., 2000. Volcano-wide fringes in ERS synthetic aperture radar interferograms of Etna (1992-1998): Deformation or tropospheric effect? Journal of Geophysical Research-Solid Earth, 105(B7): 16391-16402.10.1029/2000jb900095.
Bekaert, D.P.S., Hooper, A. and Wright, T.J., 2015. A spatially variable power law tropospheric correction technique for InSAR data. Journal of Geophysical Research-Solid Earth, 120(2): 1345-1356.10.1002/2014jb011558.
Berardino, P., Fornaro, G., Lanari, R. and Sansosti, E., 2002. A new algorithm for surface deformation monitoring based on small baseline differential SAR interferograms. Ieee Transactions on Geoscience and Remote Sensing, 40(11): 2375-2383.10.1109/tgrs.2002.803792.
Bertin, D., Amigo, A. and Bertin, L., 2015, Erupcin del volcn Villarrica 2015: Productos emitidos y volumen involucrado, XIV Congreso Geológico Chileno, III, 249-252.
Biggs, J., Ebmeier, S.K., Aspinall, W.P., Lu, Z., Pritchard, M.E., Sparks, R.S.J. and Mather, T.A., 2014. Global link between deformation and volcanic eruption quantified by satellite imagery. Nature Communications, 5.10.1038/ncomms4471.
Bouvet de Maisonneuve, C., 2011. Petrologic and numerical modeling study of strombolian eruption dynamics at Volcán Llaima (Chile). PhD Thesis, University de Geneve, Geneve, 158 pp.
Bouvet de Maisonneuve, C., Dungan, M.A., Bachmann, O. and Burgisser, A., 2012. Insights into shallow magma storage and crystallization at Volcan Llaima (Andean Southern Volcanic Zone, Chile). Journal of Volcanology and Geothermal Research, 211: 76-91.10.1016/j.jvolgeores.2011.09.010.
Bouvet de Maisonneuve, C., Dungan, M.A., Bachmann, O. and Burgisser, A., 2013. Petrological Insights into Shifts in Eruptive Styles at Volcan Llaima (Chile). Journal of Petrology, 54(2): 393-420.10.1093/petrology/egs073.
Bredemeyer, S. and Hansteen, T.H., 2014. Synchronous degassing patterns of the neighbouring volcanoes Llaima and Villarrica in south-central Chile: the influence of tidal forces. International Journal of Earth Sciences, 103(7): 1999-2012.10.1007/s00531-014-1029-2.
Casertano, L., 1963a. Actividad del volcn Villarrica en el curso de este siglo. Universidad de Chile, Boletn, 41: 48-54
Casertano, L., 1963b. Actividad del volcn Villarrica en el curso de este siglo. Universidad de Chile, Boletn, 40: 22-28
Castruccio, A., Clavero, J., Segura, A., Samaniego, P., Roche, O., Le Penne, J.-L. and Droguett, B., 2016. Eruptive parameters and dynamics of the April 2015 sub-Plinian eruptions of Calbuco volcano. Bulletin of Volcanology, 78(62).10.1007/s00445-016-1058-8.
Cembrano, J. and Lara, L., 2009. The link between volcanism and tectonics in the southern volcanic zone of the Chilean Andes: A review. Tectonophysics, 471(1-2): 96-113.10.1016/j.tecto.2009.02.038.
ACCEPTED MANUSCRIPT
ACCEP
TED M
ANUSC
RIPT
Chaussard, E. and Amelung, F., 2012. Precursory inflation of shallow magma reservoirs at west Sunda volcanoes detected by InSAR. Geophysical Research Letters, 39.10.1029/2012gl053817.
Chaussard, E., Amelung, F. and Aoki, Y., 2013. Characterization of open and closed volcanic systems in Indonesia and Mexico using InSAR time series. Journal of Geophysical Research-Solid Earth, 118(8): 3957-3969.10.1002/jgrb.50288.
Córdova, L., Alarcón, A., Mardones, C., Cardona, C., Gil, F., Rojas, G., Quijada, J., Le Mével, H., Feigl, K., DeMets, C. and Lundgren, P., 2015, Monitoreo de la deformación en volcanes chilenos mediante técnica GPS, resultados asociados a la actividad de los volcanes Laguna del Maule, Copahue y Villarrica., XIV Congreso Geológico Chileno, III, 233-236.
Currenti, G., Napoli, R. and Del Negro, C., 2011. Toward a realistic deformation model of the 2008 magmatic intrusion at Etna from combined DInSAR and GPS observations. Earth and Planetary Science Letters, 312(1-2): 22-27.10.1016/j.epsl.2011.09.058.
Delgado, F., Pritchard, M., Lohman, R. and Naranjo, J.A., 2014. The 2011 Hudson volcano eruption (Southern Andes, Chile): Pre-eruptive inflation and hotspots observed with InSAR and thermal imagery. Bulletin of Volcanology, 76(5): 19.10.1007/s00445-014-0815-9.
Delgado, F., Pritchard, M.E., Basualto, D., Lazo, J., Cordova, L. and Lara, L.E., 2016. Rapid reinflation following the 2011-2012 rhyodacite eruption at Cordon Caulle volcano (Southern Andes) imaged by InSAR: Evidence for magma reservoir refill. Geophysical Research Letters, 43(18): 9552-9562.10.1002/2016gl070066.
Doin, M.P., Lasserre, C., Peltzer, G., Cavalie, O. and Doubre, C., 2009. Corrections of stratified tropospheric delays in SAR interferometry: Validation with global atmospheric models. Journal of Applied Geophysics, 69(1): 35-50.10.1016/j.jappgeo.2009.03.010.
Dvorak, J.J. and Dzurisin, D., 1997. Volcano geodesy: The search for magma reservoirs and the formation of eruptive vents. Reviews of Geophysics, 35(3): 343-384.10.1029/97rg00070.
Dzierma, Y. and Wehrmann, H., 2010. Statistical eruption forecast for the Chilean Southern Volcanic Zone: typical probabilities of volcanic eruptions as baseline for possibly enhanced activity following the large 2010 Concepcion earthquake. Natural Hazards and Earth System Sciences, 10(10): 2093-2108.10.5194/nhess-10-2093-2010.
Dzierma, Y. and Wehrmann, H., 2012. On the likelihood of future eruptions in the Chilean Southern Volcanic Zone: interpreting the past century's eruption record based on statistical analyses. Andean Geology, 39(3): 380-393.10.5027/andgeoV39n3-a02.
Dzurisin, D., 2003. A comprehensive approach to monitoring volcano deformation as a window on the eruption cycle. Reviews of Geophysics, 41(1).10.1029/2001rg000107.
Dzurisin, D. and Lu, Z., 2006. Interferometric synthetic-aperture radar (InSAR). In: D. Dzurisin (Editor), Volcano Deformation: Geodetic Monitoring Techniques. Springer, pp. 153-194.
Ebmeier, S.K., Biggs, J., Mather, T.A. and Amelung, F., 2013. On the lack of InSAR observations of magmatic deformation at Central American volcanoes. Journal of Geophysical Research-Solid Earth, 118(5): 2571-2585.10.1002/jgrb.50195.
Feigl, K.L., Le Mével, H., Ali, S.T., Cordova, L., Andersen, N.L., DeMets, C. and Singer, B.S., 2014. Rapid uplift in Laguna del Maule volcanic field of the Andean Southern Volcanic zone (Chile) 2007-2012. Geophysical Journal International, 196(2): 885-901.10.1093/gji/ggt438.
ACCEPTED MANUSCRIPT
ACCEP
TED M
ANUSC
RIPT
Fournier, T.J., Pritchard, M.E. and Riddick, S.N., 2010. Duration, magnitude, and frequency of subaerial volcano deformation events: New results from Latin America using InSAR and a global synthesis. Geochemistry Geophysics Geosystems, 11: 29.10.1029/2009gc002558.
Francis, P., Oppenheimer, C. and Stevenson, D., 1993. Endogenous growth of persistently active volcanos. Nature, 366(6455): 554-557.10.1038/366554a0.
Franco, L.E., Palma, J.L., Gil-Cruz, F., Lara, L.E. and San Martin, J.J., 2015, Aspectos sismolgicos relacionados con las erupciones estrombolianas en el ltimo ciclo eruptivo del volcn Llaima, Chile (2007 – 2010), XIV Congreso Geologico Chileno, III, 154-157.
Froger, J.L., Remy, D., Bonvalot, S. and Legrand, D., 2007. Two scales of inflation at Lastarria-Cordon del Azufre volcanic complex, central Andes, revealed from ASAR-ENVISAT interferometric data. Earth and Planetary Science Letters, 255(1-2): 148-163.10.1016/j.epsl.2006.12.012.
Gurioli, L., Harris, A.J.L., Houghton, B.F., Polacci, M. and Ripepe, M., 2008. Textural and geophysical characterization of explosive basaltic activity at Villarrica volcano. Journal of Geophysical Research-Solid Earth, 113(B8).10.1029/2007jb005328.
Heimisson, E.R., Einarsson, P., Sigmundsson, F. and Brandsdottir, B., 2015. Kilometer-scale Kaiser effect identified in Krafla volcano, Iceland. Geophysical Research Letters, 42(19): 7958-7965.10.1002/2015gl065680.
Henderson, S.T. and Pritchard, M.E., 2013. Decadal volcanic deformation in the Central Andes Volcanic Zone revealed by InSAR time series. Geochemistry Geophysics Geosystems, 14(5): 1358-1374.10.1002/ggge.20074.
Hooper, A., Segall, P. and Zebker, H., 2007. Persistent scatterer interferometric synthetic aperture radar for crustal deformation analysis, with application to Volcan Alcedo, Galapagos. Journal of Geophysical Research-Solid Earth, 112(B7).10.1029/2006jb004763.
Jay, J., Costa, F., Pritchard, M., Lara, L., Singer, B. and Herrin, J., 2014. Locating magma reservoirs using InSAR and petrology before and during the 2011-2012 Cordon Caulle silicic eruption. Earth and Planetary Science Letters, 403: 463-463.10.1016/j.epsl.2014.07.021.
Jolivet, R., Agram, P.S., Lin, N.Y., Simons, M., Doin, M.-P., Peltzer, G. and Li, Z.H., 2014. Improving InSAR geodesy using Global Atmospheric Models. Journal of Geophysical Research-Solid Earth, 119(3): 2324-2341.10.1002/2013jb010588.
Jolivet, R., Grandin, R., Lasserre, C., Doin, M.P. and Peltzer, G., 2011. Systematic InSAR tropospheric phase delay corrections from global meteorological reanalysis data. Geophysical Research Letters, 38.10.1029/2011gl048757.
Kazahaya, K., Shinohara, H. and Saito, G., 1994. Excessive degassing of Izu-Oshima volcano - magma convection in a conduit. Bulletin of Volcanology, 56(3): 207-216.10.1007/bf00279605.
Lara, L.E. and Clavero, J., 2004, Villarrica Volcano (39.5ºS), Southern Andes, Chile., Servicio Nacional de Geología y Minería. Boletin. No. 61. 66 p. Santiago.
Lara, L.E., Orozco, G., Amigo, A. and Silva, C., 2011, Peligros Volcnicos de Chile, Servicio Nacional de Geologa y Minera, Carta Geolgica de Chile, Serie Geologa Ambiental, No.13: 34 p., 1 mapa escala 1:2.000.000. Santiago.
ACCEPTED MANUSCRIPT
ACCEP
TED M
ANUSC
RIPT
Lohman, R.B. and Simons, M., 2005. Some thoughts on the use of InSAR data to constrain models of surface deformation: Noise structure and data downsampling. Geochemistry Geophysics Geosystems, 6: 12.10.1029/2004gc000841.
Lu, Z. and Dzurisin, D., 2014. InSAR Imaging of Aleutian Volcanoes: Monitoring a Volcanic Arc from Space. Springer-Verlag, Berlin Heidelberg.
Lundgren, P., Kiryukhin, A., Milillo, P. and Samsonov, S., 2015a. Dike model for the 2012–2013 Tolbachik eruption constrained by satellite radar interferometry observations. Journal of Volcanology and Geothermal Research.10.1016/j.jvolgeores.2015.05.011.
Lundgren, P., Milillo, P., Kiryukhin, A., Samsonov, S., Gil, F., Cordova, M., Tanaka, A. and Owen, S., 2015b, Application of satellite and airborne InSAR to volcano deformation processes in the Pacific Rim, FRINGE Workshop, Eur. Space Agency,
Masterlark, T., 2007. Magma intrusion and deformation predictions: Sensitivities to the Mogi assumptions. Journal of Geophysical Research-Solid Earth, 112(B6).10.1029/2006jb004860.
Mastin, L.G., Lisowski, M., Roeloffs, E. and Beeler, N., 2009. Improved constraints on the estimated size and volatile content of the Mount St. Helens magma system from the 2004-2008 history of dome growth and deformation. Geophysical Research Letters, 36.10.1029/2009gl039863.
Mastin, L.G., Roeloffs, E., Beeler, N.M. and Quick, J.E., 2008. Constraints on the size, overpressure, and volatile content of the Mount St. Helens magma system from geodetic and dome-growth measurements during the 2004–2006+ eruption. In: D.R. Sherrod, W.E. Scott and P.H. Stauffer (Editors), A volcano rekindled; the renewed eruption of Mount St. Helens, 2004-2006. U.S. Geological Survey Professional Paper, pp. 856.
Mather, T.A., Tsanev, V.I., Pyle, D.M., McGonigle, A.J.S., Oppenheimer, C. and Allen, A.G., 2004. Characterization and evolution of tropospheric plumes from Lascar and Villarrica volcanoes, Chile. Journal of Geophysical Research-Atmospheres, 109(D21).10.1029/2004jd004934.
McTigue, D.F., 1987. Elastic stress and deformation near a finite spherical magma body: Resolution of the point source paradox. Journal of Geophysical Research: Solid Earth, 92(B12): 12931-12940.10.1029/JB092iB12p12931.
Moreno, H., 1993. Volcn Villarrica: Geologa y evaluacin del riesgo, regiones IX-X, 39º25’S. Informe final., Proyecto Fondecyt, No. 1247, pp. 112.
Moreno, H. and Clavero, J., 2006, Geologa del volcn Villarrica, Regiones de la Araucana y de los Lagos, Servicio Nacional de Geologa y Minera, Carta Geolgica de Chile, Serie Geologa Bsica, No. 98, 35 p., 1 mapa escala 1:50.000.
Moreno, H., Naranjo, J.A., Pea, P., Muoz, J., Basualto, D., C., D., Gallegos, C., Dungan, M. and Bouvet de Maisonneuve, C., 2009, El ciclo eruptivo 2007-2009 del volcn Llaima, Andes del sur, XII Congreso Geolgico Chileno, S7_018.
Morgado, E., Parada, M.A., Contreras, C., Castruccio, A., Gutiérrez, F. and McGee, L.E., 2015. Contrasting records from mantle to surface of Holocene lavas of two nearby arc volcanic complexes: Caburgua-Huelemolle Small Eruptive Centers and Villarrica Volcano, Southern Chile. Journal of Volcanology and Geothermal Research..1016/j.jvolgeores.2015.09.023.
Moussallam, Y., Bani, P., Curtis, A., Barnie, T., Moussallam, M., Peters, N., Schipper, C.I., Aiuppa, A., Giudice, G., Amigo, A., Velasquez, G. and Cardona, C., 2016. Sustaining persistent lava lakes:
ACCEPTED MANUSCRIPT
ACCEP
TED M
ANUSC
RIPT
Observations from high-resolution gas measurements at Villarrica volcano, Chile. Earth and Planetary Science Letters, 454: 237-247.10.1016/j.epsl.2016.09.012.
Naranjo, J.A., 2015, Nuevo estilo eruptivo del volcán VIllarrica: 3 de Marzo 2015., XIV Congreso Geológico Chileno, III, 230-231.
Naranjo, J.A. and Moreno, H., 2004. Laharic debris-flows from Villarrica Volcano. In: L.E. Lara and J. Clavero (Editors), Villarrica Volcano (39.5°S), Southern Andes, Chile. Serv Nac de Geol y Miner, Santiago, pp. 28-38.
Naranjo, J.A. and Moreno, H., 2005, Geologa del volcn Llaima, Regin de la Araucana, Servicio Nacional de Geologa y Minera, Carta Geolgica de Chile, Serie Geologa Bsica, No. 88, 33 p., 1 mapa escala 1:50.000, Santiago.
Naranjo, J.A., Moreno, H., Pea, P., Muoz, J., Basualto, D., Delgado., C., Gallegos, C., Dungan, M. and Bouvet de Maisonneuve, C., 2009, Estilos eruptivos 2007-2008 del volcn Llaima, Andes del sur, XII Congreso Geolgico Chileno, S3_014.
Nikkhoo, M., Walter, T.R., Lundgren, P.R. and Prats-Iraola, P., 2016. Compound dislocation models (CDMs) for volcano deformation analyses. Geophysical Journal International.10.1093/gji/ggw427.
Okada, Y., 1985. Surface deformation due to shear and tensile faullts in a half-space. Bulletin of the Seismological Society of America, 75(4): 1135-1154
Ortiz, A.B. and Zebker, H., 2007. ScanSAR-to-Stripmap mode interferometry processing using ENVISAT/ASAR data. Ieee Transactions on Geoscience and Remote Sensing, 45(11): 3468-3480.10.1109/tgrs.2007.895970.
OVDAS, 2009. Actividad del volcán Llaima, Informes Técnicos No 82 y 85, Región de la Araucanía, Serv Nac Geol Min, Temuco, Chile.
OVDAS, 2015. Reportes Especiales de Actividad Volcánica, Región de la Araucanía, Año 2015 Marzo 02-18, Serv Nac Geol Min, Temuco, Chile.
Palma, J.L., Blake, S. and Calder, E.S., 2011. Constraints on the rates of degassing and convection in basaltic open-vent volcanoes. Geochemistry Geophysics Geosystems, 12.10.1029/2011gc003715.
Palma, J.L., Calder, E.S., Basualto, D., Blake, S. and Rothery, D.A., 2008. Correlations between SO2 flux, seismicity, and outgassing activity at the open vent of Villarrica volcano, Chile. Journal of Geophysical Research-Solid Earth, 113(B10).10.1029/2008jb005577.
Patrick, M.R., Anderson, K.R., Poland, M.P., Orr, T.R. and Swanson, D.A., 2015. Lava lake level as a gauge of magma reservoir pressure and eruptive hazard. Geology, 43(9): 831-834.10.1130/g36896.1.
Pepe, A., Bertran-Ortiz, A., Lundgren, P.R., Rosen, P.A. and Lanari, R., 2011. The stripmap–ScanSAR SBAS approach to fill gaps in stripmap deformation time series with ScanSAR data. IEEE TRANSACTIONS ON GEOSCIENCE AND REMOTE SENSING, 49(12): 4788-4804.10.1109/TGRS.2011.2167979.
Philibosian, B. and Simons, M., 2011. A survey of volcanic deformation on Java using ALOS PALSAR interferometric time series. Geochemistry Geophysics Geosystems, 12.10.1029/2011gc003775.
Pinel, V., Hooper, A., De la Cruz-Reyna, S., Reyes-Davila, G., Doin, M.P. and Bascou, P., 2011. The challenging retrieval of the displacement field from InSAR data for andesitic stratovolcanoes:
ACCEPTED MANUSCRIPT
ACCEP
TED M
ANUSC
RIPT
Case study of Popocatepetl and Colima Volcano, Mexico. Journal of Volcanology and Geothermal Research, 200(1-2): 49-61.10.1016/j.jvolgeores.2010.12.002.
Pinel, V., Poland, M.P. and Hooper, A., 2014. Volcanology: Lessons learned from Synthetic Aperture Radar imagery. Journal of Volcanology and Geothermal Research, 289: 81-113.10.1016/j.jvolgeores.2014.10.010.
Poland, M.P. and Lu, Z., 2008. Radar Interferometry Observations of Surface Displacements During Pre- and Coeruptive Periods at Mount St. Helens, Washington, 1992–2005. In: D. Sherrod, W.E. Scott and P.H. Stauffer (Editors), A Volcano Rekindled: The Renewed Eruption of Mount St. Helens, 2004–2006, pp. 361-382.
Poland, M.P., Miklius, A. and Montgomery-Brown, E.K., 2014. Magma supply, storage, and transport at shield-stage Hawaiian volcanoes: Chapter 5 in Characteristics of Hawaiian volcanoes. 18015, Reston, VA.
Pritchard, M.E. and Simons, M., 2004. An InSAR-based survey of volcanic deformation in the central Andes. Geochemistry Geophysics Geosystems, 5: 42.10.1029/2003gc000610.
Remy, D., Bonvalot, S., Briole, P. and Murakami, M., 2003. Accurate measurements of tropospheric effects in volcanic areas from SAR interferometry data: application to Sakurajima volcano (Japan). Earth and Planetary Science Letters, 213(3-4): 299-310.10.1016/s0012-821x(03)00331-5.
Remy, D., Chen, Y., Froger, J.L., Bonvalot, S., Cordoba, L. and Fustos, J., 2015. Revised interpretation of recent InSAR signals observed at Llaima volcano (Chile). Geophysical Research Letters, 42(10): 3870-3879.10.1002/2015gl063872.
Richardson, J.P. and Waite, G.P., 2013. Waveform inversion of shallow repetitive long period events at Villarrica Volcano, Chile. Journal of Geophysical Research-Solid Earth, 118(9): 4922-4936.10.1002/jgrb.50354.
Riel, B., Milillo, P., Simons, M., Lundgren, P., Kanamori, H. and Samsonov, S., 2015. The collapse of Bardarbunga caldera, Iceland. Geophysical Journal International, 202(1): 446-453.10.1093/gji/ggv157.
Rivera, A., Zamora, R., Uribe, J., Wendt, A., Oberreuter, J., Cisternas, S., Gimeno, F. and Clavero, J., 2015. Recent changes in total ice volume on Volcan Villarrica, Southern Chile. Natural Hazards, 75(1): 33-55.10.1007/s11069-014-1306-1.
Romero, J.E., Morgavi, D., Arzilli, F., Daga, R., Caselli, A., Reckziegel, F., Viramonte, J., Daz-Alvarado, J., Polacci, M., Burton, M. and Perugini, D., 2016. Eruption dynamics of the 22–23 April 2015 Calbuco Volcano (Southern Chile): Analyses of tephra fall deposits. Journal of Volcanology and Geothermal Research.10.1016/j.jvolgeores.2016.02.027.
Rosen, P.A., Hensley, S., Zebker, H.A., Webb, F.H. and Fielding, E.J., 1996. Surface deformation and coherence measurements of Kilauea volcano, Hawaii, from SIR-C radar interferometry. Journal of Geophysical Research-Planets, 101(E10): 23109-23125.10.1029/96je01459.
Ruth, D.C.S. and Calder, E.S., 2014. Plate tephra: Preserved bubble walls from large slug bursts during violent Strombolian eruptions. Geology, 42(1): 11-14.10.1130/g34859.1.
Ruth, D.C.S., Cottrell, E., Cortés, J.A., Kelley, K.A. and Calder, E.S., 2016. From Passive Degassing to Violent Strombolian Eruption: the Case of the 2008 Eruption of Llaima Volcano, Chile. Journal of Petrology, 57(9): 1833-1864.10.1093/petrology/egw063.
ACCEPTED MANUSCRIPT
ACCEP
TED M
ANUSC
RIPT
Salzer, J., Mehdi, N., Walter, T.R., Sudhaus, H., Reyes-Dávila, G., Bretón, M. and Arambula, R., 2015. Satellite radar data reveal short-term pre-explosive displacements and a complex conduit system at Volcán de Colima, Mexico. Frontiers in Earth Science, 2.10.3389/feart.2014.00012.
Segall, P., 2010. Earthquake and volcano deformation. Princeton University Press, Princeton, 432 pp.
Selles, D. and Moreno, H., 2011, Geología del volcán Calbuco, Región de Los Lagos, Servicio Nacional de Geologa y Minera, Carta Geolgica de Chile, Serie Geologa Bsica 130: 38 p., 1 mapa escala 1:50.000. Santiago.
Siebert, L.E.E., Simkin, T.O.M. and Kimberly, P., 2010. Volcanoes of the World Third Edition. University of California Press.
Sigmundsson, F., Hooper, A., Hreinsdottir, S., Vogfjord, K.S., Ofeigsson, B.G., Heimisson, E.R., Dumont, S., Parks, M., Spaans, K., Gudmundsson, G.B., Drouin, V., Arnadottir, T., Jonsdottir, K., Gudmundsson, M.T., Hognadottir, T., Fridriksdottir, H.M., Hensch, M., Einarsson, P., Magnusson, E., Samsonov, S., Brandsdottir, B., White, R.S., Agustsdottir, T., Greenfield, T., Green, R.G., Hjartardottir, A.R., Pedersen, R., Bennett, R.A., Geirsson, H., La Femina, P.C., Bjornsson, H., Palsson, F., Sturkell, E., Bean, C.J., Mollhoff, M., Braiden, A.K. and Eibl, E.P.S., 2015. Segmented lateral dyke growth in a rifting event at Bardarbunga volcanic system, Iceland. Nature, 517(7533): 191-U158.10.1038/nature14111.
Simons, M. and Rosen, P., 2007. Interferometric synthetic aperture radar geodesy. In: T. Herring (Editor), Treatise on Geophysics 3. Elsevier, Amsterdam, pp. 391-446.
Stern, C.R., 2004. Active Andean volcanism: its geologic and tectonic setting. Revista Geologica De Chile, 31(2): 161-206
Stevens, N.F. and Wadge, G., 2004. Towards operational repeat-pass SAR interferometry at active volcanoes. Natural Hazards, 33(1): 47-76.10.1023/B:NHAZ.0000035005.45346.2b.
Valderrama, O., Franco, L. and Gil-Cruz, F., 2015, Erupción intempestiva del volcán Calbuco, Abril 2015, XIV Congreso Geológico Chileno,, III, 91-93.
Van Eaton, A.R., Amigo, A., Bertin, D., Mastin, L.G., Giacosa, R.E., Gonzalez, G., Valderrama, O., Fontijn, K. and Behnke, S.A., 2016. Volcanic lightning and plume behavior reveal evolving
hazards during the April 2015 eruption of Calbuco volcano, Chile. Geophysical Research Letters.10.1002/2016GL068076.
Velez, M.L., Euillades, P., Blanco, M. and Euillades, L., 2015. Ground Deformation Between 2002 and 2013 from InSAR Observations. In: F. Tassi, O. Vaselli and A.T. Caselli (Editors), Copahue Volcano. Active Volcanoes of the World. Springer-Verlag Berlin Heidelberg, pp. 293.
Walker, G.P.L., 1989. Gravitational (density) controls on volcanism, magma chambers and intrusions. Australian Journal of Earth Sciences, 36(2): 149-165.10.1080/08120098908729479.
Wauthier, C., Cayol, V., Kervyn, F. and d'Oreye, N., 2012. Magma sources involved in the 2002 Nyiragongo eruption, as inferred from an InSAR analysis. Journal of Geophysical Research-Solid Earth, 117.10.1029/2011jb008257.
Wessel, P. and Smith, W.H.F., 1998. New, improved version of generic mapping tools released. Eos, Transactions American Geophysical Union, 79(47): 579-579.10.1029/98EO00426.
Wicks, C., de la Llera, J.C., Lara, L.E. and Lowenstern, J., 2011. The role of dyking and fault control in the rapid onset of eruption at Chaiten volcano, Chile. Nature, 478(7369): 374-+.10.1038/nature10541.
ACCEPTED MANUSCRIPT
ACCEP
TED M
ANUSC
RIPT
Williams, C.A. and Wadge, G., 1998. The effects of topography on magma chamber deformation models: Application to Mt. Etna and radar interferometry. Geophysical Research Letters, 25(10): 1549-1552.10.1029/98GL01136.
Witter, J.B. and Calder, E.S., 2004. Magma degassing at Villarrica volcano. In: L.E. Lara and J. Clavero (Editors), Villarrica Volcano (39.5°S), Southern Andes, Chile. Serv Nac de Geol y Miner, Santiago, pp. 46-52.
Witter, J.B., Kress, V.C., Delmelle, P. and Stix, J., 2004. Volatile degassing, petrology, and magma dynamics of the Villarrica Lava Lake, Southern Chile. Journal of Volcanology and Geothermal Research, 134(4): 303-337.10.1016/j.jvolgeores.2004.03.002.
Yang, X.M., Davis, P.M. and Dieterich, J.H., 1988. Deformation from inflation of a dipping finite prolate spheroid in an elastic half-space as a model for volcanic stressing. Journal of Geophysical Research-Solid Earth and Planets, 93(B5): 4249-4257.10.1029/JB093iB05p04249.
Zebker, H.A., Amelung, F. and Jonsson, S., 2000. Remote sensing of volcano surface and internal processes using radar interferometry. In: P.J. Mouginis-Mark, J.A. Crisp and J.H. Fink (Editors), Remote Sensing of Active Volcanism, Geophysical Monograph Series, vol. 116. American Geophyscal Union, Washington D.C., pp. 179-205.
ACCEPTED MANUSCRIPT
ACCEP
TED M
ANUSC
RIPT
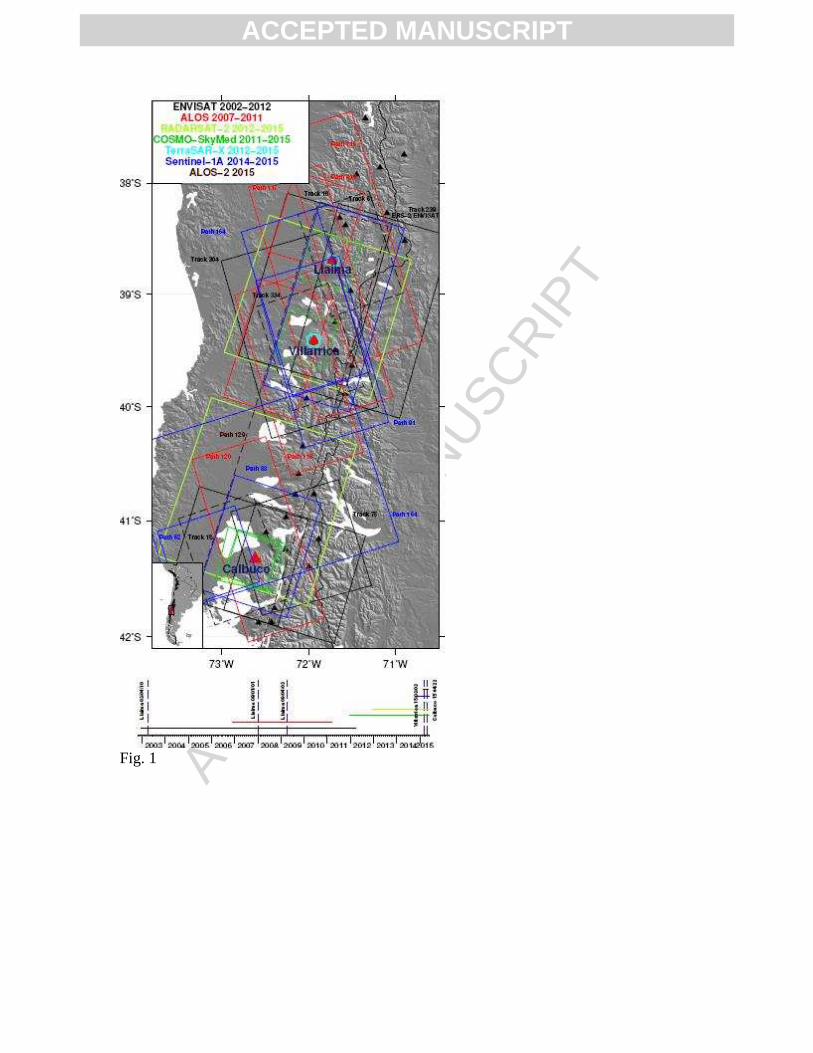
Fig. 1
ACCEPTED MANUSCRIPT
ACCEP
TED M
ANUSC
RIPT
Fig. 2
ACCEPTED MANUSCRIPT
ACCEP
TED M
ANUSC
RIPT
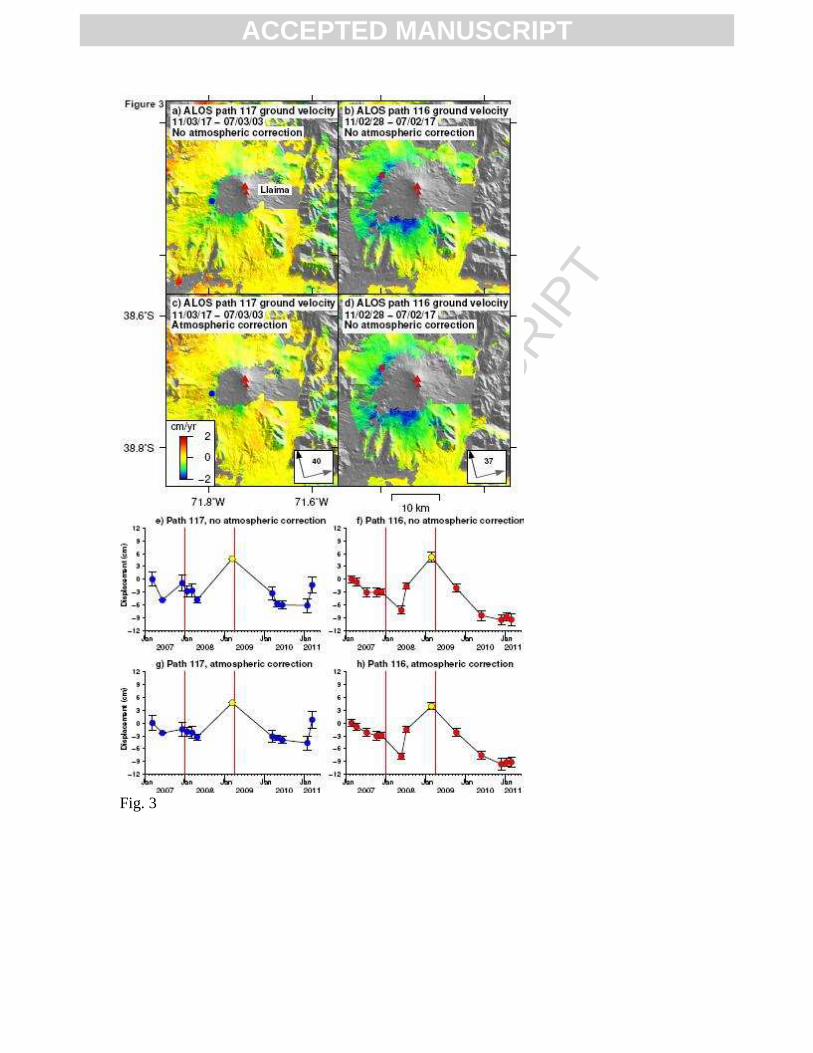
Fig. 3
ACCEPTED MANUSCRIPT
ACCEP
TED M
ANUSC
RIPT
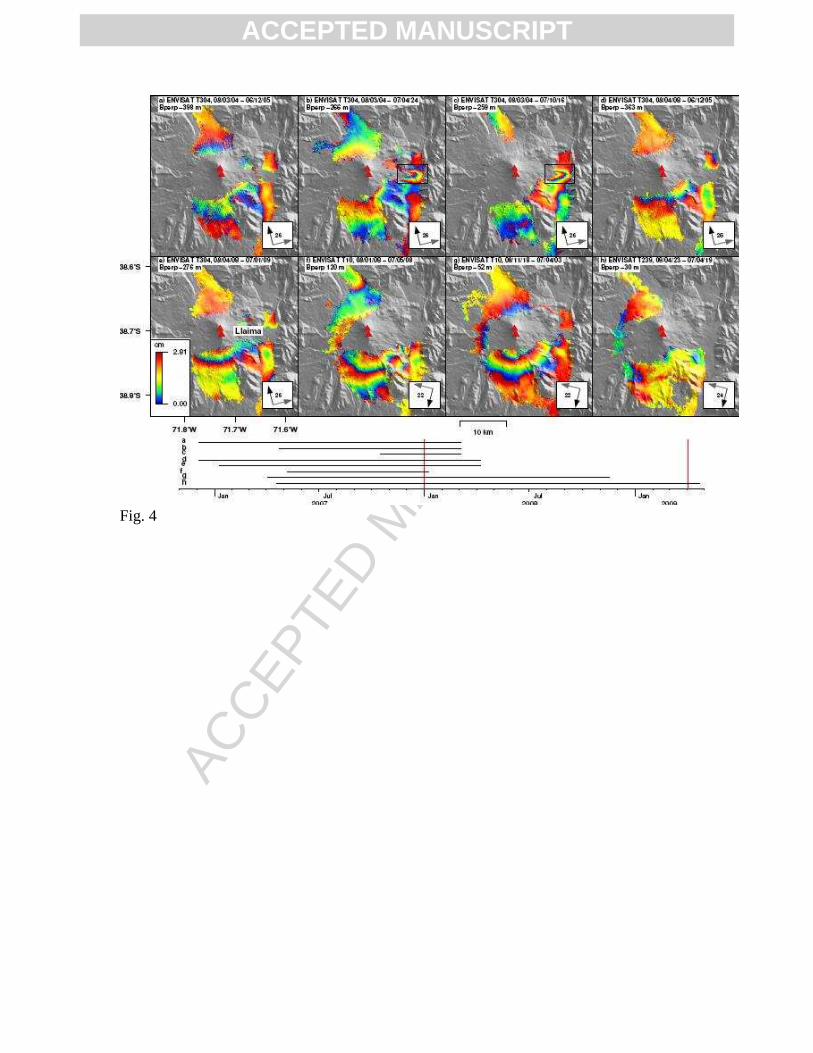
Fig. 4
ACCEPTED MANUSCRIPT
ACCEP
TED M
ANUSC
RIPT
Fig. 5
ACCEPTED MANUSCRIPT
ACCEP
TED M
ANUSC
RIPT
Fig. 6
ACCEPTED MANUSCRIPT
ACCEP
TED M
ANUSC
RIPT
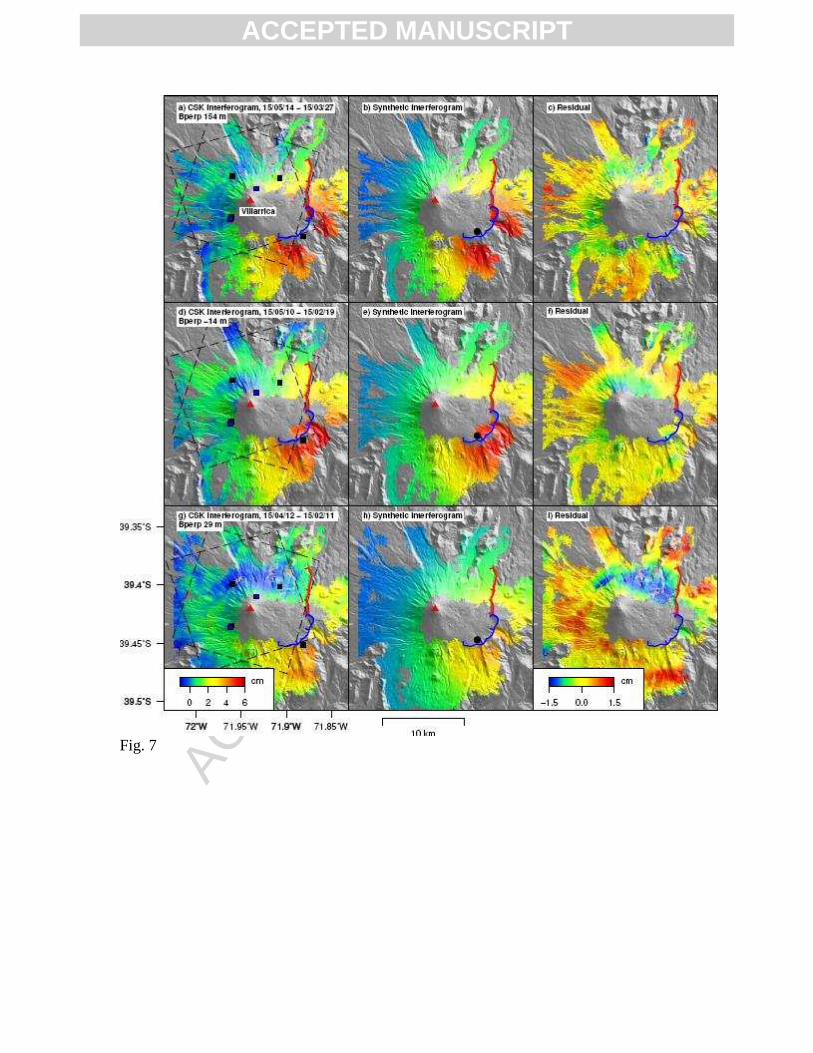
Fig. 7
ACCEPTED MANUSCRIPT
ACCEP
TED M
ANUSC
RIPT
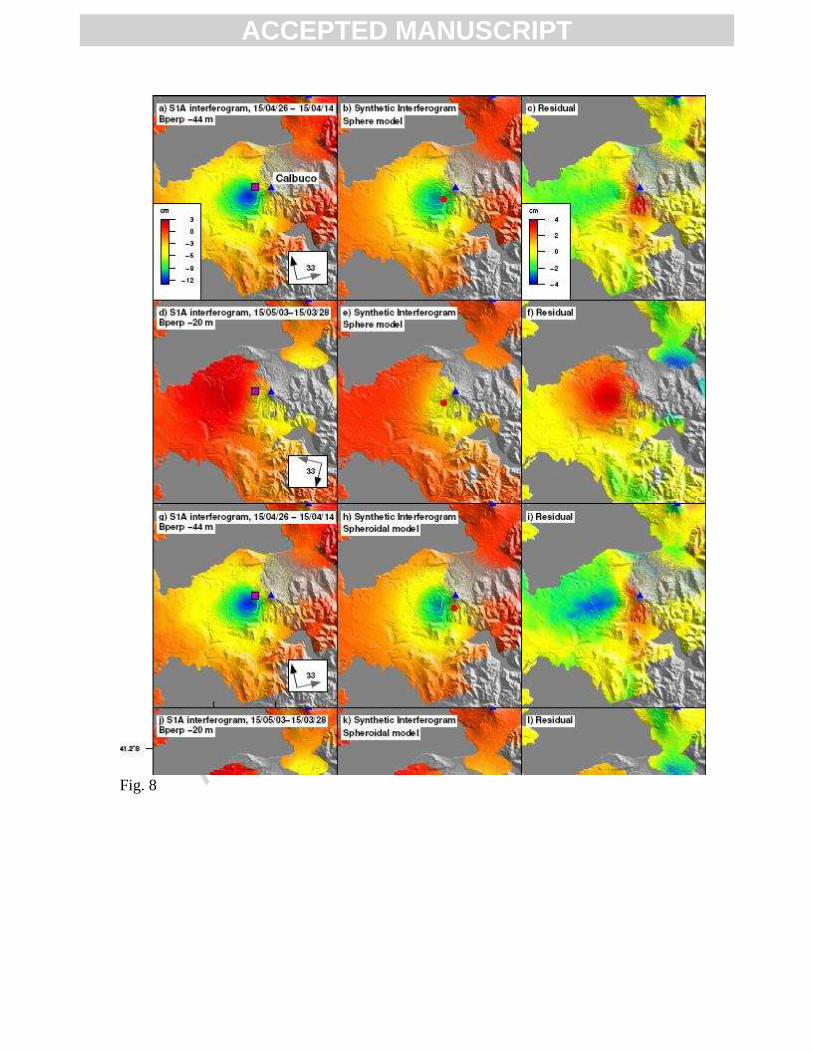
Fig. 8
ACCEPTED MANUSCRIPT
ACCEP
TED M
ANUSC
RIPT
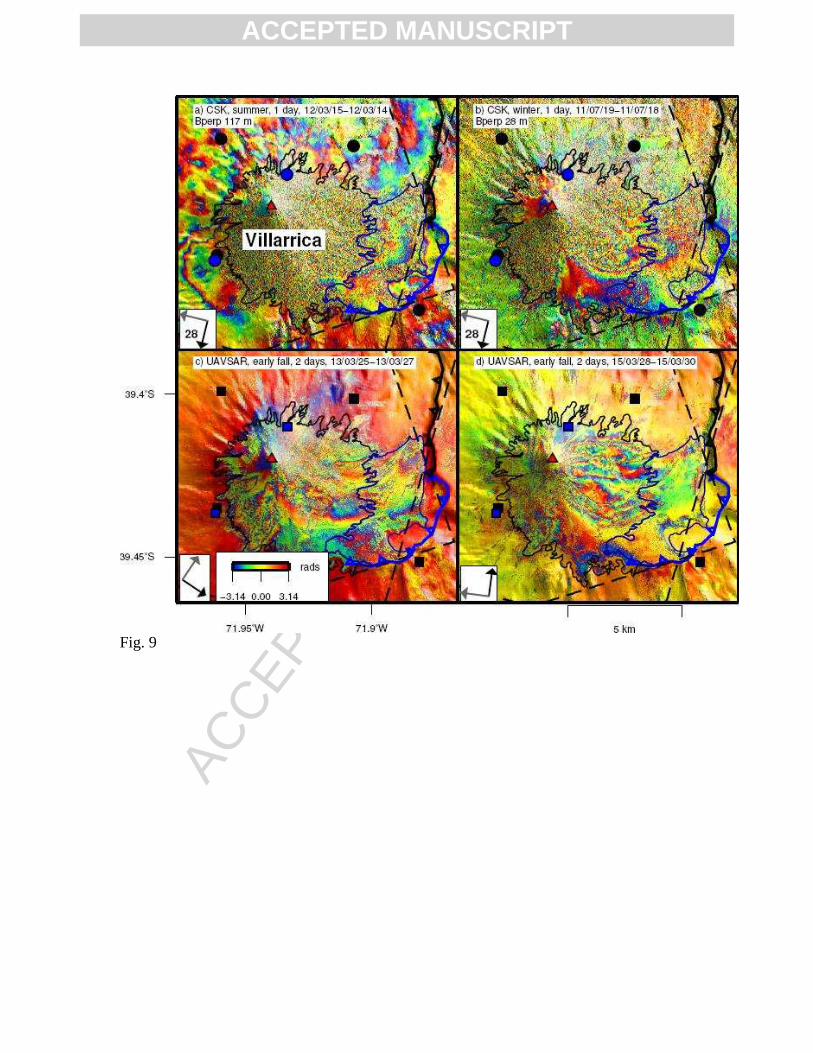
Fig. 9
ACCEPTED MANUSCRIPT
ACCEP
TED M
ANUSC
RIPT
Highlights
We present decadal InSAR observations at the three most dangerous volcanoes of the Southern Andes.
We detect deformation at the three volcanoes at different stages of the eruptive cycle.
We present the first geodetic source models for the shallow plumbing systems of
these volcanoes.
We do not find evidence that most of the eruptions of these volcanoes were preceded by ground deformation.
We propose strategies to optimize the use of InSAR as a volcano monitoring tool.