Bright ionizing escape at high resolution from multiply imaged, gravitationally lensed galaxy T. Emil Rivera-Thorsen *1 , Håkon Dahle 1 , John Chisholm 2,3 , Michael K. Florian 4 , Max Gronke †5 , Michael D. Gladders 6,7 , Jane R. Rigby 4 , Guillaume Mahler 8 , Keren Sharon 8 , and Matthew Bayliss 9 1 Institute of Theoretical Astrophysics, University of Oslo, Postboks 1029, 0315 Oslo, Norway 2 Observatoire de Genève, Université de Genève, 51 Ch. des Maillettes, 1290 Versoix, Switzerland 3 Department of Astronomy and Astrophysics, University of California, Santa Cruz, CA 95064 4 Observational Cosmology Lab, NASA Goddard Space Flight Center, 8800 Greenbelt Rd., Greenbelt, MD 20771, USA 5 Department of Physics, University of California, Santa Barbara, CA 93106, USA 6 Department of Astronomy and Astrophysics, University of Chicago, Chicago, IL 60637, USA 7 Kavli Institute for Cosmological Physics, University of Chicago, Chicago, IL 60637, USA 8 Department of Astronomy, University of Michigan, 1085 South University Avenue, Ann Arbor, MI 48109, USA 9 MIT-Kavli Center for Astrophysics and Space Research, 77 Massachusetts Avenue, Cambridge, MA, 02139, USA Young stars in the first galaxies produced far- 1 ultraviolet ionizing photons that must have avoided 2 absorption by the ubiquitous neutral hydrogen, es- 3 caped their host galaxies and ionized the gas between 4 galaxies in the “Epoch of Reionization”. After the 5 Universe became transparent to these wavelengths, 6 we would expect to find plenty of galaxies shining in 7 ionizing light. Yet, only a small number of galax- 8 ies have so far been found to leak ionizing photons, 9 either in the local universe 1,2,3 or at intermediate red- 10 shift 4,5,6,7 . How this light escapes the absorbing gas 11 in galaxies, and why detections are so few and faint, 12 remains unanswered. One key question is the ex- 13 tent to which ionizing photons escape through empty 14 channels in a dense neutral gas versus escape through 15 a tenuous haze 8,9,10,11,12 . Here, we present with un- 16 precedented brightness, and in multiple gravitation- 17 ally lensed images, the first unambiguous observation 18 of ionizing photons escaping through a channel in a 19 gas rich, neutral medium. Previous detections have 20 been inconclusive regarding their mode of escape, but 21 generally tend to suggest a scenario, in which the light 22 * [email protected]† Hubble Fellow escapes through a tenuous, highly ionized medium 23 with a low content of neutral gas clumps. However, 24 in recent years, indirect evidence has been mounting 25 that channels through a neutral gas may account for 26 a significant fraction of the escaping radiation 9,10,12 . 27 Rather than being a binary either/or question, the 28 two scenarios likely represent extremes on a sliding 29 scale of possible gas configurations in a galaxy. With 30 its brightness, this galaxy can help study ionizing con- 31 tinuum in detail, and the unusual mode of escape can 32 set an important benchmark for future models. 33 On April 8th and 14th 2018 UT, the Hub- 34 ble Space Telescope observed the extremely bright, 35 strongly gravitationally lensed starburst galaxy PSZ1- 36 ARC G311.6602–18.4624 13 , or the Sunburst Arc 11 , at 37 redshift z = 2.37. The observations contain at least 38 12 images of ionizing Lyman continuum (LyC) leakage 39 from one compact and extremely bright, strongly star- 40 forming region, with signal-to-noise ratios as high as 42. 41 We find an upper limit to the physical diameter of the 42 LyC emitting region of ∼ 160 pc, consistent with hot, 43 star-forming regions in local galaxies 14 . We estimate 44 a line-of-sight ionizing escape fraction of 76 +17 -8 %, with 45 41% as a robust lower limit assuming a completely trans- 46 1
Transcript
Bright ionizing escape at high resolution from multiplyimaged, gravitationally lensed galaxy
T. Emil Rivera-Thorsen∗1, Håkon Dahle1, John Chisholm2,3, Michael K. Florian4, MaxGronke†5, Michael D. Gladders6,7, Jane R. Rigby4, Guillaume Mahler8, Keren
Sharon8, and Matthew Bayliss9
1Institute of Theoretical Astrophysics, University of Oslo, Postboks 1029, 0315 Oslo, Norway2Observatoire de Genève, Université de Genève, 51 Ch. des Maillettes, 1290 Versoix, Switzerland3Department of Astronomy and Astrophysics, University of California, Santa Cruz, CA 95064
4Observational Cosmology Lab, NASA Goddard Space Flight Center, 8800 Greenbelt Rd., Greenbelt, MD 20771, USA5Department of Physics, University of California, Santa Barbara, CA 93106, USA
6Department of Astronomy and Astrophysics, University of Chicago, Chicago, IL 60637, USA7Kavli Institute for Cosmological Physics, University of Chicago, Chicago, IL 60637, USA
8Department of Astronomy, University of Michigan, 1085 South University Avenue, Ann Arbor, MI 48109, USA9MIT-Kavli Center for Astrophysics and Space Research, 77 Massachusetts Avenue, Cambridge, MA, 02139, USA
Young stars in the first galaxies produced far-1
ultraviolet ionizing photons that must have avoided2
absorption by the ubiquitous neutral hydrogen, es-3
caped their host galaxies and ionized the gas between4
galaxies in the “Epoch of Reionization”. After the5
Universe became transparent to these wavelengths,6
we would expect to find plenty of galaxies shining in7
ionizing light. Yet, only a small number of galax-8
ies have so far been found to leak ionizing photons,9
either in the local universe1,2,3 or at intermediate red-10
shift4,5,6,7. How this light escapes the absorbing gas11
in galaxies, and why detections are so few and faint,12
remains unanswered. One key question is the ex-13
tent to which ionizing photons escape through empty14
channels in a dense neutral gas versus escape through15
a tenuous haze8,9,10,11,12. Here, we present with un-16
precedented brightness, and in multiple gravitation-17
ally lensed images, the first unambiguous observation18
of ionizing photons escaping through a channel in a19
gas rich, neutral medium. Previous detections have20
been inconclusive regarding theirmode of escape, but21
generally tend to suggest a scenario, in which the light22
are tabulated in table 1 alongwith the computed apparent 97
escape fraction (see below) for each image. 98
We computed ionizing escape fractions based on the- 99
oretical models of stellar populations (see Methods sec- 100
tion) which were fitted to non-ionizing spectra11 of the 101
emitting region. From these model spectra, we predicted 102
the intrinsic flux ratios in the F275W and F814W filters, 103
and compared these to the observed ratios (see Methods 104
section for details). We have derived both the relative 105
and absolute escape fractions, defined as the fraction 106
of dust-attenuated (relative) and total (absolute) ioniz- 107
ing radiation that escapes the neutral gas in the galaxy. 108
For both fractions, we caution that these are measure- 109
ments along the line of sight; the configuration of this 110
system with a perforated medium practically guarantees 111
that these fractions are not related to the global escape 112
fraction from the galaxy in a simple way. 113
The observed flux in F275W is the radiation surviv- 114
ing absorption both within the source galaxy and in the 115
IGM. Consequently, the escape fraction we derive is the 116
combined effect of the internal and intergalactic neutral 117
Hydrogen (Hi) fesc×Tigm, which we call the apparent es- 118
cape fraction, denoted f ∗esc,rel. The maximum measured 119
apparent escape fraction (found in knot 12 in the coun- 120
terarc) forms a lower limit to the true escape fraction 121
in the (unrealistic) case of completely transparent IGM. 122
Conversely, themeasured apparent escape fraction in im- 123
age 12 provides a lower limit to the IGM transmission of 124
TIGM & 48%, as lower transmission coefficients would 125
imply an escape fraction higher than 100%. 126
To further constrain the escape fraction, we used the 127
Tigm distribution along simulated lines of sight from the 128
literature17, and excluded the values which would lead to 129
an escape fraction larger than 100%. From the trimmed 130
TIGM distribution, we have extracted the 16th, 50th, and 131
84th percentile and, assuming these, computed the corre- 132
sponding escape fractions for image 12 (see more detail 133
in Methods section). 134
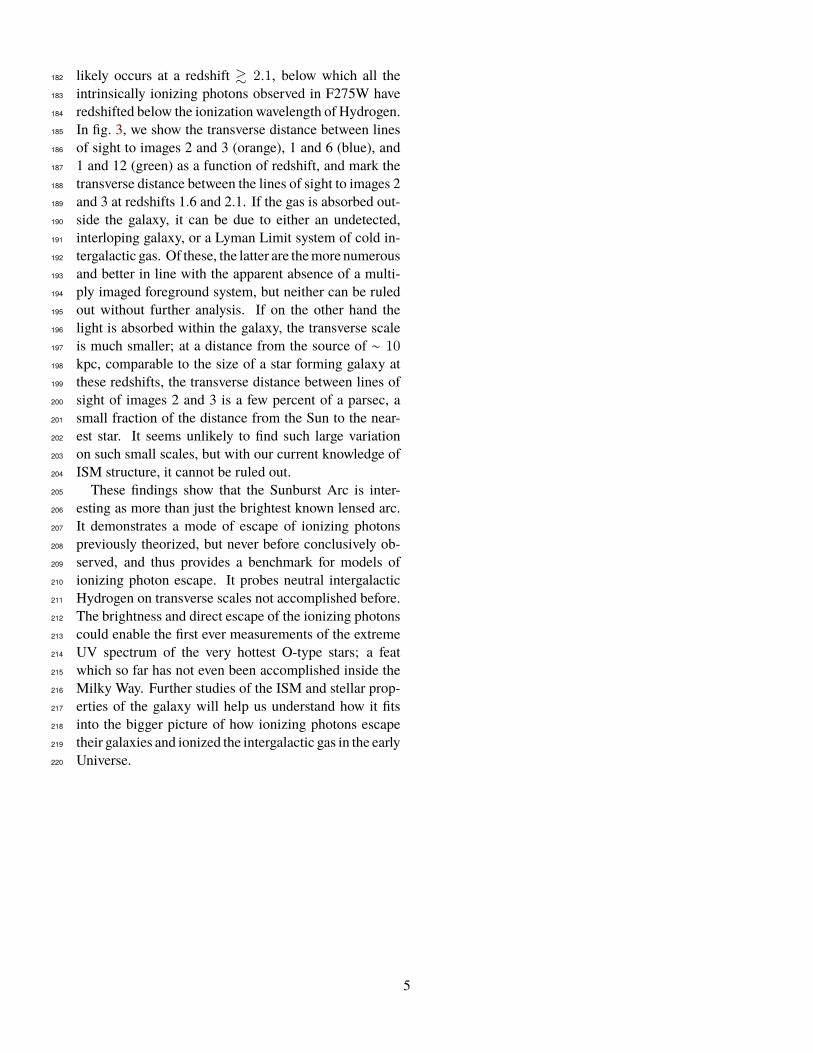
In Fig. 2, we have for each lensed image shown 135
f ∗esc,rel as filled and f ∗esc,abs as open circles, with error 136
bars showing the flux uncertainties (see Methods sec- 137
tion for details) propagated in the standard way. The 138
box-and-whiskers markers show absolute and relative 139
escape fractions computed for image 12 based on the 140
IGM transmission distribution, with dots showing me- 141
dian values, boxes making the 16th to 84th percentiles, 142
2
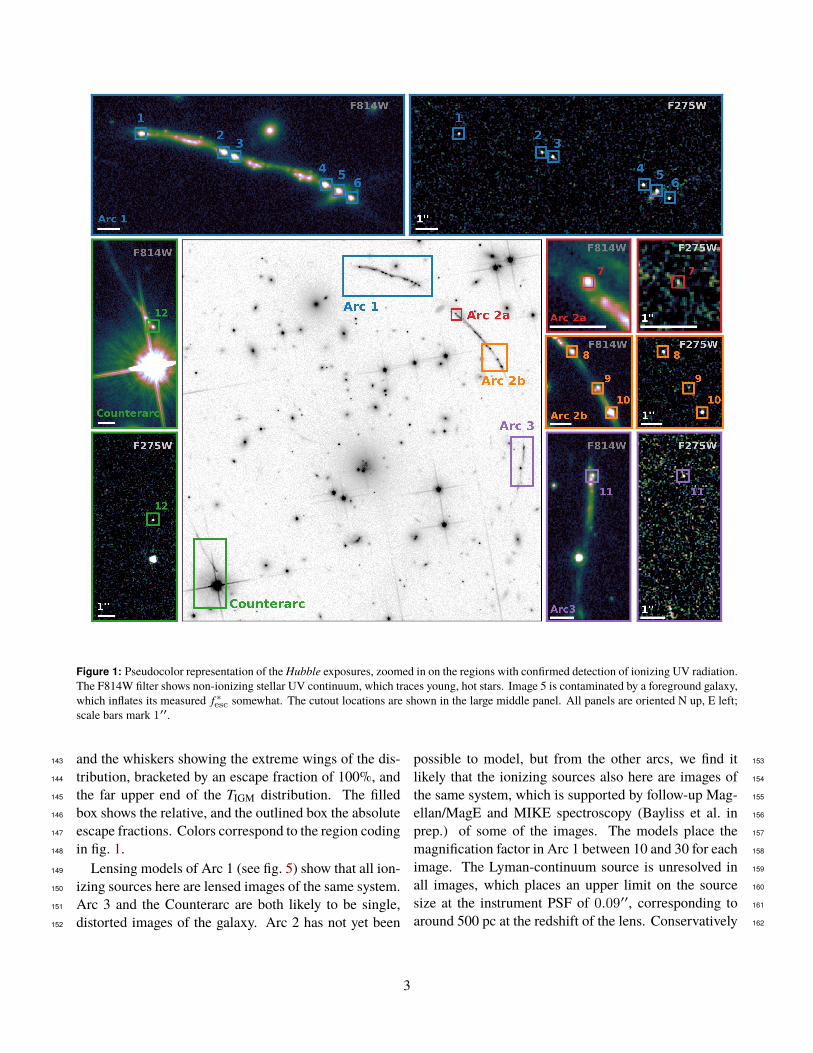
Figure 1: Pseudocolor representation of theHubble exposures, zoomed in on the regions with confirmed detection of ionizing UV radiation.The F814W filter shows non-ionizing stellar UV continuum, which traces young, hot stars. Image 5 is contaminated by a foreground galaxy,which inflates its measured f ∗esc somewhat. The cutout locations are shown in the large middle panel. All panels are oriented N up, E left;scale bars mark 1′′.
and the whiskers showing the extreme wings of the dis-143
tribution, bracketed by an escape fraction of 100%, and144
the far upper end of the TIGM distribution. The filled145
box shows the relative, and the outlined box the absolute146
escape fractions. Colors correspond to the region coding147
in fig. 1.148
Lensing models of Arc 1 (see fig. 5) show that all ion-149
izing sources here are lensed images of the same system.150
Arc 3 and the Counterarc are both likely to be single,151
distorted images of the galaxy. Arc 2 has not yet been152
possible to model, but from the other arcs, we find it 153
likely that the ionizing sources also here are images of 154
the same system, which is supported by follow-up Mag- 155
ellan/MagE and MIKE spectroscopy (Bayliss et al. in 156
prep.) of some of the images. The models place the 157
magnification factor in Arc 1 between 10 and 30 for each 158
image. The Lyman-continuum source is unresolved in 159
all images, which places an upper limit on the source 160
size at the instrument PSF of 0.09′′, corresponding to 161
around 500 pc at the redshift of the lens. Conservatively 162
3
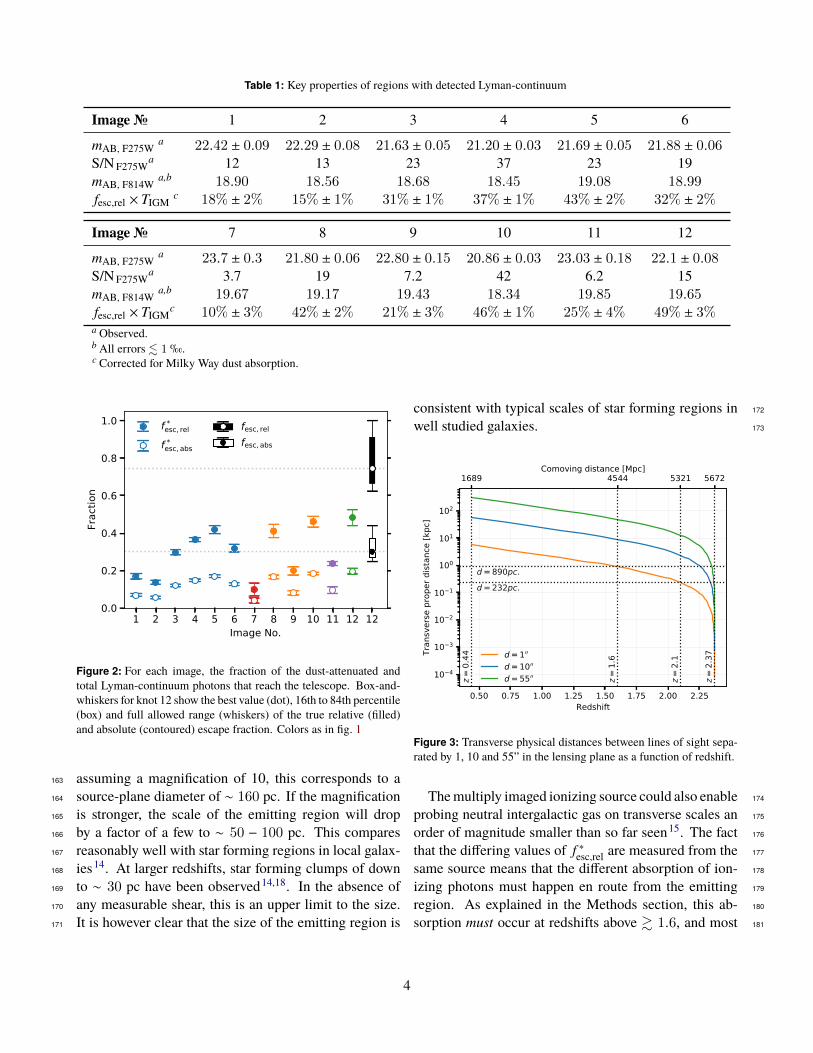
Table 1: Key properties of regions with detected Lyman-continuum
Figure 2: For each image, the fraction of the dust-attenuated andtotal Lyman-continuum photons that reach the telescope. Box-and-whiskers for knot 12 show the best value (dot), 16th to 84th percentile(box) and full allowed range (whiskers) of the true relative (filled)and absolute (contoured) escape fraction. Colors as in fig. 1
assuming a magnification of 10, this corresponds to a163
source-plane diameter of ∼ 160 pc. If the magnification164
is stronger, the scale of the emitting region will drop165
by a factor of a few to ∼ 50 − 100 pc. This compares166
reasonably well with star forming regions in local galax-167
ies14. At larger redshifts, star forming clumps of down168
to ∼ 30 pc have been observed14,18. In the absence of169
any measurable shear, this is an upper limit to the size.170
It is however clear that the size of the emitting region is171
consistent with typical scales of star forming regions in 172
well studied galaxies. 173
0.50 0.75 1.00 1.25 1.50 1.75 2.00 2.25Redshift
10 4
10 3
10 2
10 1
100
101
102
Tran
sver
se p
rope
r dist
ance
[kpc
]
z=
0.44
z=
1.6
z=
2.1
z=
2.37
d = 890pc.d = 232pc.
d = 1′′d = 10′′d = 55′′
1689 4544 5321 5672Comoving distance [Mpc]
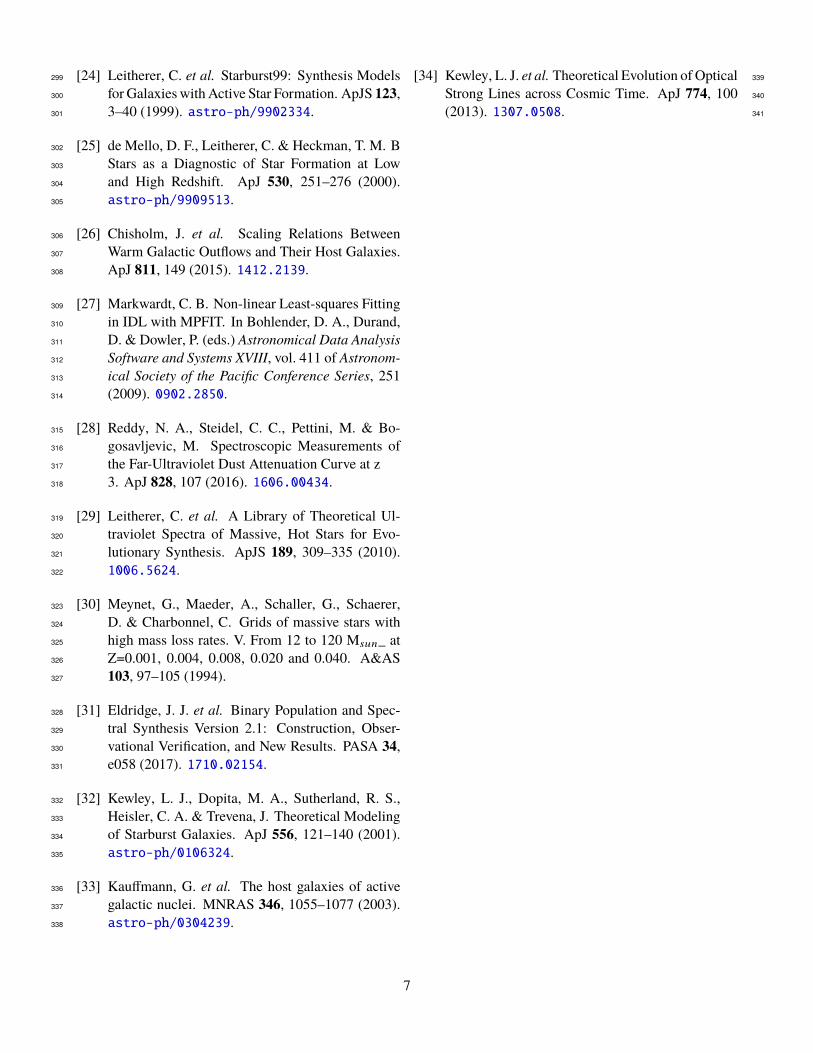
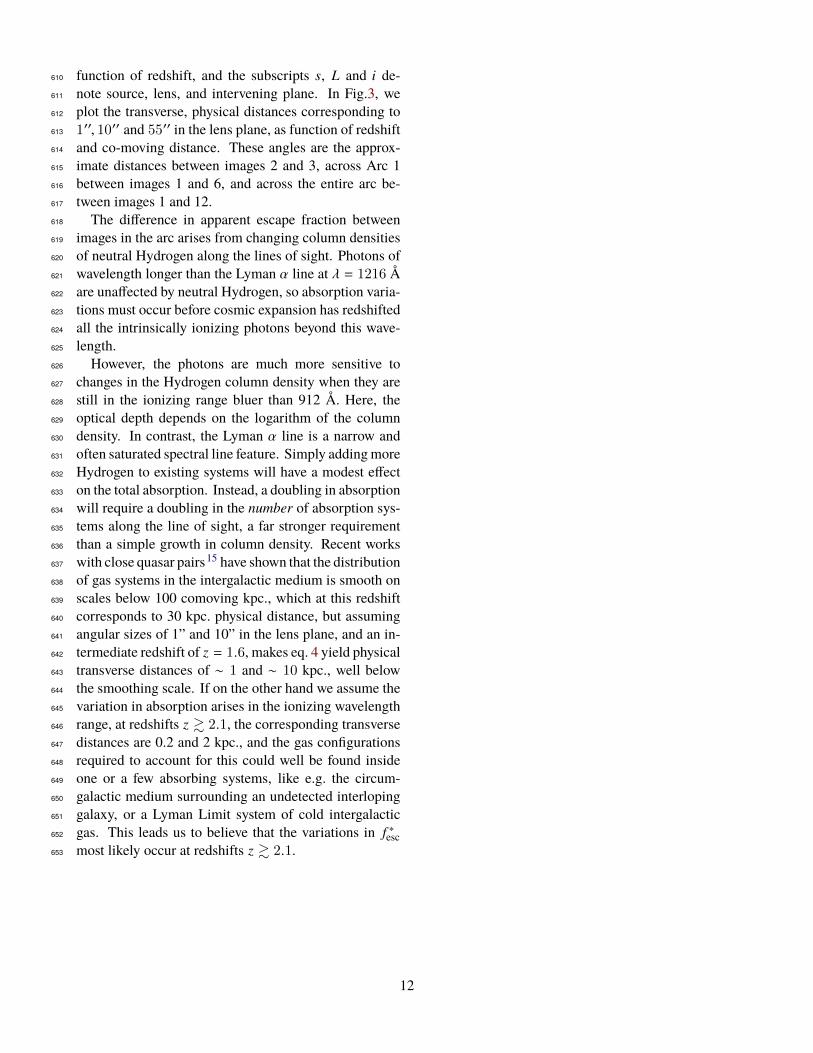
Figure 3: Transverse physical distances between lines of sight sepa-rated by 1, 10 and 55” in the lensing plane as a function of redshift.
Themultiply imaged ionizing source could also enable 174
probing neutral intergalactic gas on transverse scales an 175
order of magnitude smaller than so far seen15. The fact 176
that the differing values of f ∗esc,rel are measured from the 177
same source means that the different absorption of ion- 178
izing photons must happen en route from the emitting 179
region. As explained in the Methods section, this ab- 180
sorption must occur at redshifts above & 1.6, and most 181
4
likely occurs at a redshift & 2.1, below which all the182
intrinsically ionizing photons observed in F275W have183
redshifted below the ionization wavelength of Hydrogen.184
In fig. 3, we show the transverse distance between lines185
of sight to images 2 and 3 (orange), 1 and 6 (blue), and186
1 and 12 (green) as a function of redshift, and mark the187
transverse distance between the lines of sight to images 2188
and 3 at redshifts 1.6 and 2.1. If the gas is absorbed out-189
side the galaxy, it can be due to either an undetected,190
interloping galaxy, or a Lyman Limit system of cold in-191
tergalactic gas. Of these, the latter are themore numerous192
and better in line with the apparent absence of a multi-193
ply imaged foreground system, but neither can be ruled194
out without further analysis. If on the other hand the195
light is absorbed within the galaxy, the transverse scale196
is much smaller; at a distance from the source of ∼ 10197
kpc, comparable to the size of a star forming galaxy at198
these redshifts, the transverse distance between lines of199
sight of images 2 and 3 is a few percent of a parsec, a200
small fraction of the distance from the Sun to the near-201
est star. It seems unlikely to find such large variation202
on such small scales, but with our current knowledge of203
ISM structure, it cannot be ruled out.204
These findings show that the Sunburst Arc is inter-205
esting as more than just the brightest known lensed arc.206
It demonstrates a mode of escape of ionizing photons207
previously theorized, but never before conclusively ob-208
served, and thus provides a benchmark for models of209
ionizing photon escape. It probes neutral intergalactic210
Hydrogen on transverse scales not accomplished before.211
The brightness and direct escape of the ionizing photons212
could enable the first ever measurements of the extreme213
UV spectrum of the very hottest O-type stars; a feat214
which so far has not even been accomplished inside the215
Milky Way. Further studies of the ISM and stellar prop-216
erties of the galaxy will help us understand how it fits217
into the bigger picture of how ionizing photons escape218
their galaxies and ionized the intergalactic gas in the early219
Universe.220
5
References221
[1] Leitet, E., Bergvall, N., Hayes, M., Linné, S. & Za-222
ckrisson, E. Escape of Lyman continuum radiation223
from local galaxies. Detection of leakage from the224
young starburst Tol 1247-232. A&A 553, A106225
(2013). 1302.6971.226
[2] Izotov, Y. I. et al. Low-redshift Lyman continuum227
leaking galaxieswith high [O III]/[O II] ratios. MN-228
RAS (2018). 1805.09865.229
[3] Borthakur, S., Heckman, T. M., Leitherer, C. &230
Overzier, R. A. A local clue to the reionization of231
the universe. Science 346, 216–219 (2014). 1410.232
3511.233
[4] Vanzella, E. et al. Hubble Imaging of the Ioniz-234
ing Radiation from a Star-forming Galaxy at Z=3.2235
with fesc50%. ApJ 825, 41 (2016). 1602.00688.236
[5] Vanzella, E. et al. Direct Lyman continuum and237
Ly α escape observed at redshift 4. MNRAS 476,238
L15–L19 (2018). 1712.07661.239
[6] Shapley, A. E. et al. Q1549-C25: A Clean Source240
of Lyman-Continuum Emission at z = 3.15. ApJ241
826, L24 (2016). 1606.00443.242
[7] Bian, F., Fan, X., McGreer, I., Cai, Z. & Jiang,243
L. High Lyman Continuum Escape Fraction in a244
Lensed Young Compact Dwarf Galaxy at z = 2.5.245
ApJ 837, L12 (2017). 1702.06540.246
[8] Jaskot, A. E. & Oey, M. S. Linking Lyα and Low-247
ionization Transitions at Low Optical Depth. ApJ248
791, L19 (2014). 1406.4413.249
[9] Behrens, C., Dijkstra, M. & Niemeyer, J. C.250
Beamed Lyα emission through outflow-driven cav-251
ities. A&A 563, A77 (2014). 1401.4860.252
[10] Herenz, E. C. et al. VLT/MUSE illuminates pos-253
sible channels for Lyman continuum escape in the254
halo of SBS 0335-52E. A&A 606, L11 (2017).255
[11] Rivera-Thorsen, T. E. et al. The Sunburst Arc:256
Direct Lyman α escape observed in the brightest257
known lensed galaxy. A&A 608, L4 (2017). 1710.258
09482.259
[12] Chisholm, J. et al. Accurately predicting the es- 260
cape fraction of ionizing photons using rest-frame 261
impacted the modeled ionizing continuum by fitting the474
observations withBPASSmodels31, but we derived sim-475
ilar ages, metallicities, and ionizing continua, largely be-476
cause the two libraries have similar O-type stellar mod-477
els31.478
The high-resolution STARBURST99 models used for479
the fitting accurately fit the narrow observed spectral480
features, but do not extend blueward of 900Å into the481
Lyman continuum29. Once we fit for the linear co-482
efficients of the high-resolution models, we created a483
low-resolution STARBURST99 model using the same484
linear coefficients, with and without attenuation. The485
extinction-free template models the intrinsic ionizing486
continuum and allows us to compare the modeled and487
observed Lyman continuum.488
Non-ionizing contamination in F275W489
Asmall, but non-negligible amount of the light in F275W490
is transmitted redward of the observed wavelength of the491
Lyman edge. To ensure we are not just observing non- 492
ionizing continuum, we have computed the expected flux 493
in the filter by multiplying the synthetic STARBURST99 494
spectrum by the transmission curve of F275W and inte- 495
grating this on the red side of the Lyman edge only. The 496
derived fluxes, which span from ∼ 2% to ∼ 10% of 497
the measured fluxes, were then subtracted from the mea- 498
sured F275Wfluxes to correct for the contamination. All 499
properties derived from measured F275W are corrected 500
for this effect. 501
Ionizing escape fractions 502
The relative and absolute LyC escape fraction are defined 503
as the fractions of intrinsic photons that escape the gas 504
(and dust) of the source galaxy and reaches intergalactic 505
Space. We have computed this based on the synthetic 506
dust-absorbed and intrinsic spectra resulting from the 507
stellar population modelling described above. Focusing 508
on the relative escape fraction, it is defined as: 509
fesc,rel =Fobs275
F int,ext275
1
TIGM, (1)
where the numerator in the first fraction is the observed 510
flux in the F275W filter, and the denominator is the same 511
as we would see it through a completely ionized (but not 512
dust-free) medium. We do not know F int,ext275 directly, but 513
since the non-ionizing continuum inF814W is unaffected 514
by neutral Hydrogen, we can use the theoretical spectra to 515
compute an expected flux in F275W assuming complete 516
transparency to LyC: 517
F int,ext275 =
∫LS99T275dλ
Fobs814W∫
LS99T814dλ
∫T814dλ∫T275dλ
, (2)
where LS99(λ) is the theoretical spectral flux density 518
from STARBURST99, and T***(λ) are the system trans- 519
mission curves for the two filters. Plugging this into eq. 1 520
and rearranging, we get: 521
fesc,relTIGM =F275
F814
∫T275dλ∫T814dλ
∫LS99T814dλ∫LS99T275dλ
(3)
We find the absolute escape fraction by the same 522
procedure for the unattenuated theoretical spectra from 523
SB99. 524
10
The escape fractions found this way are what we call525
the apparent escape fractions, as they do not account for526
absorption in the intergalactic medium. For each lensed527
image, they are shown in fig. 2 as filled (relative) and528
empty (absolute) circles.529
Transmission in the intergalactic medium530
To estimate the IGM transmission, we have adopted the531
IGM transmission distribution from Vasei et al. 201617,532
in which the authors measure the IGM transmission out533
to z = 2.38 along a large number of simulated lines534
of sight. This redshift is practically identical to that of535
the Sunburst Arc, so their coefficients can be adopted536
without modifications. Simply adopting the median co-537
efficient TIGM = 0.4 from that study yields a relative538
escape fraction for the Sunburst Arc of more than 120%.539
In fact, all coefficients TIGM . 0.48 are excluded from540
our study, because they would yield escape fractions541
larger than 100%. With these values excluded, we renor-542
malized the remaining distribution and computed the543
cumulative probability and found the median value with544
16 and 84% confidence levels. The original and updated545
IGM transmission histograms, with cumulated fractions,546
are shown in Fig. 6. The modified distribution yielded547
a best value with 16th and 84th percentile confidence548
levels of TIGM = 0.66+0.08−0.12. The central vertical line in549
Fig. 6 mark the best value, and the shaded gray region the550
confidence interval. For the measured apparent escape551
fraction of image 12, this yields a relative escape fraction552
of fesc, rel = 0.74+0.17−0.08 and an absolute escape fraction of553
fesc, abs = 0.30+0.07−0.03.554
Differential magnification555
One possible explanation of the variation in the556
F275W/F814W flux ratios between the lensed images557
of the leaking region is differential magnification: If the558
sources of emission in F275W and F814W are not com-559
pletely coincident (if e.g. the ionizing radiation is domi-560
nated by one massive Wolf-Rayet star located somewhat561
off from the central stellar component), the sources and562
the lens caustics might be arranged in such a way as to563
magnify one component significantly stronger than the564
other. However, this is mainly a concern when the caus-565
tics are actually crossing, or very close to, the bright566
sources, which makes it unlikely that this effect domi-567
nates the variations we observe. The distance between568
the components, if any, is unresolved in our observations 569
and thus known to be much smaller than the distance 570
from either to the critical lines. Still, to test this further, 571
we consider the following: 572
Since the caustics do not cross the emitting region, 573
differential magnification may only occur if one compo- 574
nent is closer to the caustics than the other. If the center 575
of flux in F814W is closer to the caustic than that of 576
F275W, the stronger magnification of the non-ionizing 577
flux will yield a lower apparent escape fraction, and vice 578
versa. 579
This effect is somewhat counteracted by the presence 580
of an extended stellar component surrounding the cen- 581
tral, unresolved peak in F814W. In the case where the 582
F275W source is more strongly magnified, a larger con- 583
tribution from this extended component will be present 584
in the aperture in F814W, but absent in F275W, and vice 585
verse. This will counteract the effect described above. 586
However, since gravitational lensing preserves surface 587
brightness, the contribution from the extended compo- 588
nent will change significantly more slowly than the main 589
source. Thus, despite the presence of this effect, we still 590
expect to see a strong correlation between the measured 591
F814W flux (which is unaffected by neutral hydrogen 592
absorption) and derived apparent escape fraction, if the 593
effect is due to differential magnification. 594
In fig. 7, we show a plot of the F814W fluxes vs. 595
the apparent escape fractions. We find only a weak 596
correlation, with a measured Pearson’s r = 0.2, leading 597
us to conclude that this effect is likely not themain reason 598
for the found variations. 599
Transverse scale of IGM probed by sight lines to 600
multiple images 601
To calculate the transverse distances between sight lines, 602
we used the approximation of a spherically symmetric 603
lensing systemwith the telescope alignedwith the source 604
and the center of the lens. The ratio between transverse 605
distances in the lens plane and in any plane between the 606
source and the lens is then: 607
didL=
[1 − DLiDs
DLsDi
]Di
DL, (4)
where d is the transverse physical distance, D = D(z) 608
is the cosmological angular diameter distance as a 609
11
function of redshift, and the subscripts s, L and i de-610
note source, lens, and intervening plane. In Fig.3, we611
plot the transverse, physical distances corresponding to612
1′′, 10′′ and 55′′ in the lens plane, as function of redshift613
and co-moving distance. These angles are the approx-614
imate distances between images 2 and 3, across Arc 1615
between images 1 and 6, and across the entire arc be-616
tween images 1 and 12.617
The difference in apparent escape fraction between618
images in the arc arises from changing column densities619
of neutral Hydrogen along the lines of sight. Photons of620
wavelength longer than the Lyman α line at λ = 1216 Å621
are unaffected by neutral Hydrogen, so absorption varia-622
tions must occur before cosmic expansion has redshifted623
all the intrinsically ionizing photons beyond this wave-624
length.625
However, the photons are much more sensitive to626
changes in the Hydrogen column density when they are627
still in the ionizing range bluer than 912 Å. Here, the628
optical depth depends on the logarithm of the column629
density. In contrast, the Lyman α line is a narrow and630
often saturated spectral line feature. Simply addingmore631
Hydrogen to existing systems will have a modest effect632
on the total absorption. Instead, a doubling in absorption633
will require a doubling in the number of absorption sys-634
tems along the line of sight, a far stronger requirement635
than a simple growth in column density. Recent works636
with close quasar pairs15 have shown that the distribution637
of gas systems in the intergalactic medium is smooth on638
scales below 100 comoving kpc., which at this redshift639
corresponds to 30 kpc. physical distance, but assuming640
angular sizes of 1” and 10” in the lens plane, and an in-641
termediate redshift of z = 1.6, makes eq. 4 yield physical642
transverse distances of ∼ 1 and ∼ 10 kpc., well below643
the smoothing scale. If on the other hand we assume the644
variation in absorption arises in the ionizing wavelength645
range, at redshifts z & 2.1, the corresponding transverse646
distances are 0.2 and 2 kpc., and the gas configurations647
required to account for this could well be found inside648
one or a few absorbing systems, like e.g. the circum-649
galactic medium surrounding an undetected interloping650
galaxy, or a Lyman Limit system of cold intergalactic651
gas. This leads us to believe that the variations in f ∗esc652
most likely occur at redshifts z & 2.1.653
12
Additional figures654
Figure 4: Baldwin, Phillips and Terlevich (BPT) diagram showingstrong-line diagnostics of the Sunburst arc ionizing sources. Over-laid are the theoretical and empirical stellar/AGN separation lines ofKewley et al.32 and Kaufmann et al.33. The gray-scale heat mapshows 10.000 random objects from the Sloan Digital Sky Survey.The gray dash-dotted curve represents the main star formation locusat redshift 2.4 from Kewley et al. 201334. Based on Magellan/FIREspectra by Bayliss et al. (in prep).
Figure 5: Critical lines in lensing model of Arc 1. This arc segmentcontains 6 images of the bright, leaking region.
0.0 0.2 0.4 0.6 0.8 1.0TIGM
0
2
4
6
8
10
Line
of si
ght d
istrib
utio
n [%
]
0.0
0.2
0.4
0.6
0.8
1.0
Cum
ulat
ed fr
actio
n
Vasei+ 2016Allowed range
Figure 6: IGM transmission histogram by Vasei et al.17, with un-physical values grayed out, as is their original cumulated distribution.Black steps show the updated cumulated distribution derived fromthe remaining, permitted values of TIGM.