Reciprocity, Accountability and Credibility In International Relations * Patrick T. Brandt School of Social Sciences University of Texas at Dallas E-mail: [email protected]Michael Colaresi Department of Political Science Michigan State University E-mail: [email protected]John R. Freeman Department of Political Science University of Minnesota E-mail: [email protected]May 31, 2006 Abstract Do public opinion dynamics play an important role in understanding conflict dynamics between democracies and their international rivals? These opinion dynamics and government behavior are interpreted as particular causal links in models of reciprocity, accountability and credibility. Theoretical expectations about the character of these linkages are translated into four distinct Bayesian structural time series models. The models are fit to events data from the Israeli-Palestinian conflict with provisions for U.S. intervention. We find that a credibility model fits the data best. This credibility model supports research that predicts asymmetric reciprocity between democratic and non-democratic belligerents. For the credibility model there is evidence that more pacific Israeli opinion leads to more immediate hostility by the Palestinians toward the Israelis. The direction of this response suggests a negative feedback mechanism in which low level conflict is maintained and momentum toward either all out war or dramatic peace is slowed. Finally, we use the credibility model to forecast ex ante 24 months ahead from March 2005. These forecasts show rapid deterioration of Israeli-Palestinian relations (even if recent election outcomes in the Levant had not occurred). The forecasts illustrate that the level of violence and support for peace move in opposite directions. * Freeman and Brandt’s research is supported by the National Science Foundation under Grants Nos. SES-0351179, SES-0351205, SES-0540816. We thank Will Moore, Jon Pevehouse and Phil Schrodt for their advice on this project and also the Tami Steinmetz Center for Peace Research for supplying us with public opinion data. An earlier version of this project was presented at the Annual Meeting of the International Studies Association, San Diego, March 22-25, 2006. The authors are solely responsible for the paper’s contents. 1
Do public opinion dynamics play an important role in understanding conflict dynamics
between democracies and their international rivals? These opinion dynamics and government
behavior are interpreted as particular causal links in models of reciprocity, accountability and
credibility. Theoretical expectations about the character of these linkages are translated into
four distinct Bayesian structural time series models. The models are fit to events data from
the Israeli-Palestinian conflict with provisions for U.S. intervention. We find that a credibility
model fits the data best. This credibility model supports research that predicts asymmetric
reciprocity between democratic and non-democratic belligerents. For the credibility model
there is evidence that more pacific Israeli opinion leads to more immediate hostility by the
Palestinians toward the Israelis. The direction of this response suggests a negative feedback
mechanism in which low level conflict is maintained and momentum toward either all out
war or dramatic peace is slowed. Finally, we use the credibility model to forecast ex ante 24
months ahead fromMarch 2005. These forecasts show rapid deterioration of Israeli-Palestinian
relations (even if recent election outcomes in the Levant had not occurred). The forecasts
illustrate that the level of violence and support for peace move in opposite directions.
∗Freeman and Brandt’s research is supported by the National Science Foundation under Grants Nos. SES-0351179,SES-0351205, SES-0540816. We thank Will Moore, Jon Pevehouse and Phil Schrodt for their advice on this project
and also the Tami Steinmetz Center for Peace Research for supplying us with public opinion data. An earlier version
of this project was presented at the Annual Meeting of the International Studies Association, San Diego, March 22-25,
2006. The authors are solely responsible for the paper’s contents.
1
1 Introduction
Much progress has been made recently in the analysis of international conflict. Reciprocal be-
haviors uncovered in the Balkans and Middle East, it is argued, are the bases for cooperation and
peace. The same is true for the triangular relationships that researchers have uncovered in these
and other conflicts. Third party intervention in conflicts, especially by great powers, can promote
cooperation and peace. What has not been studied is how and when public opinion in belligerent
countries affects conflicts. Does public opinion forbid or encourage local leaders to reciprocate
other state’s behavior? Do local publics monitor international conflicts and hold leaders account-
able for policies that do not match public preferences? Do leaders use public opinion in a rival
country to gauge the credibility of signals they receive from those adversaries?
Answering these questions is difficult for several reasons. First, domestic politics is embedded
in the conflict system. This is a system of multiple relationships (behavioral equations) of the
behaviors of several governments. Any model purporting to capture domestic politics must be of
moderate to large scale. Endogeneity is a second problem. Accountability, if it exists, implies
that opinion formation and expression are both a cause and a consequence of government policy.
Reciprocity and triangularity also imply endogeneity. A model that imposes strong exogeneity
restrictions therefore is liable to produce biased results. Finally, any link between conflict and
domestic political dynamics likely exists at a sub-annual level of temporal aggregation. Public
opinion likely reacts quickly to hostile actions and leaders may monitor these reactions and rapidly
translate them into policies. Electoral calendars increase the public interest in foreign policies and
heighten official’s interest in public evaluations of these policies. Analyzing conflicts in terms of
quarterly or yearly patterns of behavior will miss these dynamics.
We assess the impact of domestic politics on international conflict in a way that solves these
three problems. Reciprocity, accountability, and credibility are interpreted as particular causal
links between government behavior and public opinion. Expectations about these linkages are
described and translated into a framework that captures competing claims about the structure of
contemporaneous relationships among the respective variables and competing beliefs about con-
2
flict dynamics. The competing specifications are key elements of multi-equation, Bayesian time
series models with complex, endogenous relationships between variables. These models are fit to
data for the Israeli-Palestinian conflict with provisions for U.S. intervention. This case is especially
useful for testing the competing theories because the Kansas Event Data System (KEDS) and other
events databases provide temporally disaggregated records of the behaviors of the belligerents and
of the U.S. Equally important, the Tami Steinmetz Center for Peace Research regularly polls Israeli
citizens about prospects for and impacts of peace initiatives. For the first time in a major conflict,
the impact of public opinion on reciprocity, accountability and credibility can be assessed.1
The paper has three parts. Part One derives competing arguments about the impact and origins
of public opinion on conflict dynamics. The research design in Part Two translates the competing
arguments into four Bayesian time series models which are estimated in Part Three. We find that
a cross-level credibility model that supports asymmetric reciprocity between democratic and non-
democratic belligerents fits best. In this model there is evidence that more pacific Israeli opinion
leads to more immediate conflict by the Palestinians. This supports the credibility model since
Palestinians rationally account for changes in Jewish public opinion. The direction of this response
suggests a negative feedback mechanism where low level conflict is maintained and momentum
toward all out war or dramatic peace is slowed. The credibility model is used to forecast 24
months from March 2005. The forecasts show a rapid deterioration in Israeli-Palestinian relations.
The ex ante forecasts predict steadily deteriorating relations between the Israelis and Palestinians
even if Kadima and Hamas had not won elections in 2005-6. The risk of a significant increase in
conflict—based on the confidence regions—is high. The public opinion forecast shows that the
level of violence and support for peace move in opposite directions.
1The novelty and importance of the Steinmetz Center data results from the consistency of the relevant questions
over time, periodicity of the polling increments (monthly rather than quarterly or yearly) and relatively large number
of time points (over 100 months). While public opinion databases for other countries tend to share one or two of these
traits, no other source of information that we are aware of satisfies all three criteria.
3
2 Reciprocity, Accountability and Credibility
2.1 Reciprocity
A branch of international relations research investigates the role of reciprocity in foreign policy.
Building on Axelrod (1984) and repeated non-zero sum games (the iterated prisoners’ dilemma),
many have found that cooperative diplomacy from one actor begets cooperative diplomacy from
the target. This theoretical result suggests that cooperation can be built upon bilateral strategies
even when temporary incentives to defect exist. If one state has an opportunity to win disputed
territory from another, it may choose not to attack since this could discourage cooperation in the
future. The prevalence of these tit-for-tat strategies has been empirically identified in Cold War
relations, and triangular relations between the U.S., U.S.S.R. and China (Goldstein and Freeman,
1990), in Indian-Pakistani relations (Ward, 1982), and in the Balkans (Goldstein and Pevehouse,
1997). Scholars have been able to show that similar action-reaction sequences exist in sub-national
conflicts (Moore, 1998; Shellman, Reeves and Stewart, 2006).
Extensions of the reciprocity literature relate bilateral cooperation to third party intervention
or mediation (Goldstein and Freeman, 1990; Brandt and Freeman, 2006a; Hudson et al., 2006).
Goldstein et al. (2001) report that the U.S. was able to alter Iraqi behavior toward its neighbors and
Israeli behavior toward the Palestinians in the 1980s. The modeling of these triangular relations
has allowed reciprocity-related research to focus not only on spirals of conflict and cooperation,
but also to explain more complex multi-actor situations.
Despite the strong evidence of reciprocity and action-reaction sequences in international affairs,
there are at least two remaining empirical puzzles. First, what explains deviation from tit-for-tat
behavior? Why do some leaders such as Gorbachev during the twilight of the Cold War, step out
on a limb and offer cooperation to a rival? Why do other leaders feign cooperation and then attack
an adversary as in Operation Barbarosa during World War II? Deviations from reciprocity reflect
dramatic international events. If this unexplained variance follows a predictable pattern, what
theories can help us improve our predictions? Second, reciprocal behaviors may be asymmetric
4
across states with one state reacting more strongly than another (Ward, 1982). What explains this
action-reaction mismatch? Since democratic leaders must pay attention both to international and
domestic conditions for political survival (Bueno de Mesquita et al., 2003), and international rivals
know this fact, public foreign policy preferences may explain the reciprocal behaviors, unilateral
deviations, and dyadic asymmetry.
2.2 Domestic Politics and International Conflict
A branch of research extending reciprocity models explains conflict and cooperation as a function
of domestic institutions and politics. Putnam (1988), Fearon (1994, 1998), and Bueno de Mesquita
et al. (2003) view international relations as a two-level game where elites sit at the interstices of
international and domestic politics. Leaders must worry about whether their constituents will ratify
agreements they negotiate with other states or support their foreign policies. Within identifiable
institutional contexts citizens can hold leaders accountable for their foreign policy choices. Poli-
cies deviating from public preferences may be rejected and lead to public disapproval of a leader.
A potential repercussion of this accountability process is that leaders who can generate high au-
dience costs for their policies, thus being punished if their foreign policy fails, can more credibly
communicate resolve in international conflict situations (Fearon, 1994; Martin, 2000) Some inter-
national relations forecasters argue that scenario generation must anticipate public opinion changes
(Sylvan, Keller and Haftel, 2004; Sirriyeh, 1995).
Research on the causes of reciprocal behavior suggests that domestic preferences play an im-
portant role explaining conflict. McGinnis and Williams (2001) aver that citizens’ preferences
constrain leaders’ tit-for-tat interactions. In their “rivalry-as-prison” or Goldilocks hypothesis, the
public prefers international conflicts to remain in some limited range of interactions. Policies that
are too dramatic in either a cooperative (too cold) or bellicose (too hot) direction are viewed as do-
mestically costly and may lead to the public disapproval of a leader. Under these constraints, lead-
ers spend their time reciprocating each other’s limited cooperative or bellicose policies. Guisinger
and Smith (2002) and McGilliray and Smith (2000) hypothesize that in democracies the public
5
prefers to pocket the gains that accrue from reciprocated international cooperation rather than to
defect for a one-time payoff that makes long term cooperation impossible. The public then pun-
ishes a leader deviating from reciprocity. In these explanations, the public constrains a leader’s
behavior and supports reciprocal international outcomes. This begs the question: can deviations
from reciprocity be explained by changes in the public’s foreign policy preferences? If so, then
public preferences on foreign policy processes could aid in forecasting and understanding interna-
tional conflict.
2.3 Counterclaims: A Flock of Followers
All scholarly voices do not sing the praises of domestic political explanations. Lippmann (1922),
Almond (1965), and Morgenthau (1967) question the public’s ability to comprehend, process and
intelligibly guide foreign policy. Because of knowledge and interest deficits between the public
and foreign policy elites, citizens are hypothesized to be manipulated by leaders. These authors
point to the rally-’round-the-flag effect as evidence that when a leader tells the public to jump,
approval jumps. Thus a leader is not constrained by the public since citizens will follow and rally
to the government. This follower model predicts that information on public preferences is not
useful in forecasting policy.
Evidence on the rally-effect and public knowledge deficits is mixed. While there is some
evidence that a rally-’round-the-flag effect exists in the U.S. and Britain, this does not mean that
public preferences are meaningless in predicting international events in these countries. Colaresi
(Forthcoming) shows that the rally varies considerably from crisis-to-crisis in ways that can be
predicted from an accountability-based signaling model of foreign policy decision-making. Holsti
(1996), Page and Shapiro (1995), Aldrich, Sullivan and Borgida (1989) argue that public opinion
is more stable and reasonable than either Almond or Lippmann credit. The empirical question
remains, in foreign policy who is the leader and who is the follower?
Challenging the public-as-followermodel, Wlezien (1996), Eichenberg and Stoll (2003), Baum-
gartner and Jones (2005) show that in many circumstances not only do leadership cues fail on
6
defense issues, but the public reacts oppositely. When holding public preferences constant, and
a leader changes his policy toward conflict, the public is likely to react not by changing its mind
to support more conflict but by pulling in the opposite direction and supporting more cooperation.
This is identified by Baumgartner and Jones (2005) as a negative feedback mechanism. This nega-
tive feedback is consistent with the McGinnis and Williams (2001) Rivalry-as-Prison model since
the public hems in policy rather than blindly following leadership cues.
There are competing claims about the effects of foreign policy change on public preferences
in the public-as-follower model and the proposed negative feedback mechanism. The public-as-
follower model suggests that the public is attracted to a leader’s policy. A leader’s shift to a more
cooperative international policy creates more cooperative public preferences. Alternatively the
negative feedback mechanism of Baumgartner and Jones (2005) hypothesizes that the public will
be repulsed by a change in policy. Instead of following a cooperative policy, it is likely to move in
a bellicose direction and holds its leaders accountable for their policies.
2.4 On the Other Side: Cross-level Credibility
Rival states may base their policies on the accountability dynamics of their adversary. Putnam
(1988), Fearon (1994), and Martin (2000) suggest that leaders look across the water’s edge to
gauge the credibility of any bargaining strategies. An important component of Putnam’s two-level
game framework is that a leader in State B will examine the public preferences constraining State
A to determine if an offer/action is a bluff. The greater the constraints on leader A from leader B’s
perspective (the farther the public preferences of A are from State B’s ideal outcome), the greater
the credibility of an uncompromising offer from the leader A. If the relevant public is unsupport-
ive of peace, regardless of the offers made by leader A, leader B does not have an incentive to
cooperate.2 Even if the other side offered to reciprocate, it is unlikely that this cooperation would
be ratified. Shlaim (2001) notes that Nasser avoided cooperative gestures toward Israel for fear
of own public’s negative reactions, as well as the Israeli public’s negative reactions. Conversely,
2This only holds if public preferences are negatively or unrelated to a rival’s actions (see below).
7
as a public becomes more supportive of collaboration, a peace-seeking rival may suggest greater
cooperation, since citizens are now more likely to ratify any agreement.3 But the dynamics of
credibility may not be unidirectional. Page and Shapiro (1995), and Holsti (1996) suggest that the
public bases their support of or opposition to cooperation on available information, including a
rival’s actions.4 Figure 1 summarizes the causal linkages associated with the ideas of reciprocity,
accountability, and credibility for a case where public opinion is available for one of the countries.
[Figure 1 about here.]
2.5 From Theory to Models: Problems and Solutions
In this section the preceding arguments are organized into four models of international conflict,
which are then applied to the Israeli-Palestinian case. The translation of these theories to testable
models of conflict and cooperation is nontrivial. These models suggest a highly dynamic, en-
dogenous, and large scale data generation process. For example, reciprocity, triangularity, ac-
countability and credibility relationships suggest that international actions and public preferences
are dynamic. Previous changes in policy/preferences are likely to affect current changes in pol-
icy/preferences. These frameworks also suggest that current changes in many variables simul-
taneously affect other variables. If a leader is worried about political punishment for deviating
from public preferences, a surprise change in those public preferences may lead to a simultaneous
change in policy to bring conflict and cooperation into line with that new information. Similarly,
a watchful public might alter its opinion about a conflict immediately after witnessing a surprise
change in a rival’s policy toward its country. The temporally aggregated data used in many existing
studies often masks this kind of public reaction (thus increasing the role of endogeneity). Finally,
focusing on the directed-dyadic behavior of two rivals, allowing for great power intervention, and
taking into account the possibility of accountability and credibility, produces a model that includes
3Note that if accountability does not hold–the public are followers/bystanders, then credibility is irrelevant.4Putnam (1988) described this dynamic as international-to-domestic reverberation. Rivals that cooperate (attack)
may signal to the public that cooperation is safe (unsafe) and (not) profitable.
8
at least seven or more equations. Allowing lagged effects of variables, the number of parameters
in the model will grow exponentially as we add relevant actors and more equations.
To cope with these problems, the earlier ideas are presented as four competing sets of relation-
ships. Schematically, Figure 1 is translated into Table 1. Here the possibility of the different “two-
way” interactions of reciprocity and credibility are analyzed. The model of interactions assumes
there is a separate behavior equation for each of the dyadic interactions between rivals. In the ta-
ble, the foreign policies of rival state 1 (2) toward state 2 (1) is denoted by Policy1→2 (Policy2→1),
and public opinion in state 1 as Public1. The rows are the behavioral relationships (equations) to
be modeled for each of the four theories of rivalry and public interactions. The columns are the
independent variables, the changes or “shocks” in policy and opinion. A “Yes” represents an ex-
pectation that the column variable will influence the row equation, either simultaneously or with a
lag, and a “No”-entry indicates an expected zero restriction.
The first set of ideas, the bystander model, contends that the public plays no role in interna-
tional politics. Here the public pays little attention to international events. In this view, previous
scholarship on reciprocity and triangular relationships is correct in ignoring public opinion in its
empirical specifications. High and low politics essentially are unrelated. This thesis predicts that
1) a surprise change in conflict and cooperation either sent or received by one state will have no
systematic affect on public preferences and 2) a shift in the public’s preferences will not lead to
changes in the policies of its home government toward an adversary.
The second model allows the public to follow but not lead foreign policy toward a rival. This
follower model mirrors the logic of the patriotic rally-’round-the-flag literature. The public’s gov-
ernment acts internationally and the public evaluates that action. Public preferences react to gov-
ernment policy but government policy does not react to changes in public preferences. Therefore,
changes in foreign policy should occur independent of public preference shifts.
In the third model, the public not only reacts to foreign policy but also can lead that policy.
Under this accountability model government policy reacts to changes in public preferences. If the
public changes support of conflict or cooperation toward a rival, its government’s policies reflects
9
this. This third perspective contends that the public is paying attention not only to what their
government does (state 1), but also what the rival (state 2) may be doing. Thus there should be a
bi-directional relationship between conflict/cooperation and public opinion.
The final model incorporates the belief that if accountability relationships exist within one
country, its rival is likely to use that information to formulate its own foreign policy toward that
country. In this credibility model public preferences in state 1 affect policy in state 2 toward state
1. If the public has relevant ratification power, as suggested by the accountability model, this
information is unlikely to be ignored by the rival.
[Table 1 about here.]
Another relevant process is external third-party intervention (state Z in Table 1). Following
previous work on triangularity, localized conflicts are likely to react to great power interventions
that encourage or discourage cooperation between the belligerents. To keep the analysis here
simple, we assume that the public does not react to the policies of foreign governments in the same
way it reacts to the policies of its own government.
3 Research Design
3.1 The Case
The Israeli-Palestinian conflict is one of the most enduring of our time. Its significance is widely
recognized; The Economist (February 21, 2004: 24) writes that this conflict is “where the world’s
fault-lines meet: divides between rich and poor, secular and religious, Islam and the West.”
Political scientists have studied this conflict for many years. Goldstein et al. (2001) find a
complex set of behavioral relationships, including evidence of reciprocity between the two rivals
as well as of “triangularity” in U.S. behavior toward the Israelis and Palestinians. Schrodt et al.
(2001) report similar findings about triangularity. The role of the U.S. in this conflict is echoed
in other quantitative works like Organski and Lust-Okar (1997) and qualitative work like Sirriyeh
10
(1995). Organski and Lust-Okar include the U.S. as a moderator while Sirriyeh bases his qualita-
tive forecasts for Israeli-Palestinian relations on U.S. intervention.5
These studies do not consider the possibilities of accountability or credibility. This is despite
the fact that leaders like Israel’s Yitzhak Rabin commissioned and examined polling data (Auer-
bach and Greenbaum, 2000). Rabin apparently sought to learn from the polls how best to build
credibility at a crucial turning point in the conflict, during the secret negotiation of the Oslo Ac-
cords. Existing studies thus cannot help sort out the competing theories discussed above.
The two rivals have somewhat different electoral histories. Israel is considered a mature democ-
racy by POLITY and Freedom House. Since the first Oslo agreement major efforts have been made
to create a democratic Palestinian state (Brown, 2003). Elections for the Palestinian Executive Au-
thority and the Palestinian Legislative Council were held in 1996. Local elections and general
elections were held recently in Palestine.
3.2 Data
Like Goldstein et al. (2001) and Schrodt et al. (2001), we use events data to measure the directed
behaviors of the Israelis, Palestinians, and the U.S. Events for directed behaviors among the U.S.,
Israel, and the Palestine (WEIS coding) were extracted from Kansas Event Data System (KEDS).6
The events are scaled with Goldstein scores and aggregated into monthly averages.7 The variable
mnemonics used to represent the directed behavior denote the governments of Israel, Palestine,
and the U.S. by I, P, and A, respectively. So A2Pt represents the level of conflict/cooperation
5Sylvan, Keller and Haftel (2004)’s experts place less emphasis on the role of the U.S. in this conflict, but acknowl-
edge that their experts might take the role of the U.S. for granted in generating their forecasts.6In the future, we would like to collect and analyze data collected from alternative sources. On the importance of
employing multiple sources see Shellman, Reeves and Stewart (2006).7Monthly averages of Goldstein-scaled events are employed because they place the event data on a scale similar
to the public opinion data (which is the average of respondents in the polls) and because we believe that policymakers
are concerned with deviations from the average level of an on-going conflict. The dynamics of the average and total
Goldstein scaled data are similar. For an analysis using totals instead of averages that demonstrates similar results
about reciprocity and triangularity see Brandt and Freeman (2006a).
11
directed by the U.S. toward the Palestinians at time t. Our sample is monthly from April 1996
to March 2005. Thus, our analysis stops before the recent Israeli and Palestinian elections, the
election victory of Kadima, and the election of Hamas.
The public opinion measure is from polls conducted by the Tami Steinmetz Center for Peace
Research (TSC). The TSC is a multidisciplinary academic enterprise of faculty at Tel Aviv Univer-
sity. These polls should be less prone to the journalistic biases that has been found in U.S. polling
(Gaubatz, 2001). We use the TSC’s peace index for Jewish respondents only. This index does not
yield the kind of detailed insights about specific policies that were obtained from polls like those
that Rabin commissioned. But it provides a continuous sounding of the Israeli public’s evaluation
of their government’s effort to create peace and of the prospects for peace.8 Finally, a few peace
index observations are missing—out of the 126 months 8 have missing values in 2003. The miss-
ing values were inputed via an ARIMA model.9 The Jewish peace index, denoted as JPIt, and the
six monthly average event data series are depicted in Figure 2.
[Figure 2 about here.]
To capture coalitional, electoral forces and trends in violence nine exogenous dummy and trend
variables are employed. Three of these are dummy variables for the identities of the Israeli prime
ministers in each month (one each for Netanyahu, Barak, and Sharon, with Rabin/Peres treated
as the reference category). These variables capture changes in conflict dynamics due to leader
8The peace index is composed of two questions. The first is, ”In general do you consider yourself a supporter
or opponent of the peace process between Israel and the Arabs?” The possible responses are: greatly opposed (0),
somewhat opposed (1), in the middle (2), somewhat supportive (3), greatly supportive (4) and don’t know/no opinion.
The second question is: ”Do you believe that in coming years there will be peace between Israel and the Arabs?” The
responses are: certain there will be peace (4), think there will be peace (3), in the middle (2), think there will not
be peace (1), certain there will be no peace (0), and don’t know/no opinion. The two scores for each respondent are
averaged and then multiplied by 25. So each person’s final score is between 0 and 100. The index’s monthly values
are averages over about 500 respondents per survey.9The imputation is via an ARIMA(9,0,0) model for the data before the break. The ARIMA specification was
chosen as the most parsimonious fit using the Box-Jenkins method.
12
(coalitional) idiosyncrasies in Israel (Sylvan, Keller and Haftel, 2004; Sirriyeh, 1995). For each of
the four prime ministerial regimes a separate time counter that starts at the value 1 in the month
after each Israeli election and increases monotonically until the time of the next constitutionally
mandated election (and is zero otherwise) is used. These four trend variables capture electorally-
motivated cooperation and especially electorally-motivated violence in the run-up to elections.10
Finally, two dummy variables for changes in the stochastic trends in the mean level of conflict are
included. The first is for the period from the start of the second Intifada to the start of the Battle
of Jenin (October 2000–April 2002). The second is a dummy variable for the post-Battle of Jenin
period (May 2002–March 2005).11
3.3 Model
A structural Bayesian time series approach is used to evaluate the four theories in Table 1. This
approach addresses the problems of model scale, endogeneity, and specification uncertainty. The
appendix describes the actual model, a Bayesian Structural Vector Autoregression (B-SVAR). A
fuller explication this model and explanation of its value in macropolitical analyses can be found
in Brandt and Freeman (2006a,b). The B-SVAR model has seven equations—six for the dyadic
interactions for the Israelis, Palestinians, and Americans, and one for the Jewish opinion about the
peace process. Test statistics support using two lagged values for each of the seven endogenous
variables.12 Each equation in the B-SVAR includes the nine exogenous variables described earlier.
10The election counters are reset at the May, 29, 1996 general election, the May 17, 1999, February 2, 2001, and
January 28, 2003 direct prime ministerial elections. Another election was held onMarch 28, 2006, which is outside the
sample. Illustrative of electorally-motivated violence were the suicide bombings against Israeli civilians that Hamas
reportedly engineered just before the 1996 election. These bombings were intended to help defeat Peres and help
the more hawkish Netanyahu. The Economist January 28, 2006, p. 11. The time counters create linear drift in the
(moving) behavioral equilibrium among the three actors.11The Battle of Jenin occurred in April of 2002 and involved the largest scale of military force in the West Bank
since the Six Days War.12F-statistics support using 2 lags while AIC, BIC and Hannan-Quinn criteria support using 1 lag. We err on the side
of inefficiency by including 2 lags in the model, since using too few lags produces biased estimates. We also looked
13
The next sections describe elements of the model that allow us to capture the essence of the four
theoretical models.
3.3.1 Structural Identification
The theories about reciprocity, accountability and credibility can be represented as competing
claims about the contemporaneous and lagged relationships among seven variables. The claims
about contemporaneous relationships concern the speed of the response of some variables to shocks
in others, especially about 1) the immediate effects of shocks in Jewish opinion on directed behav-
iors of Israel and Palestinians, and 2) the immediate reaction of Jewish opinion to these behaviors.
Operationally, these claims are restrictions in the matrix of coefficients for contemporaneous rela-
tionships in the model. The four theories allow for the possibility of reciprocity and triangularity
between the Israelis, Palestinians and the U.S. since no (zero) restrictions are imposed on any of the
respective coefficients for these contemporaneous relationships. The theories do differ in the zero
restrictions they imply for the contemporaneous relationships for Jewish opinion. All four imply a
number of zero restrictions that make the matrix of contemporaneous relationships non-recursive
and over-identified.13
Consider first the bystander model. Like the others, this model allows for contemporaneous
reciprocal and triangular relationships in directed behaviors. The first seven rows of Table 2 rep-
resents the contemporaneous relationships among the variables (the A0 matrix discussed in the
Appendix). The rows in the bystander block of Table 2 correspond to the equations for each
directed-dyad or Jewish public opinion equation. The columns are the contemporaneous shocks
that enter each equation. The X’s in the cells represent the “free” parameters or those estimated
while the empty cells are zero restrictions. A zero restriction indicates no contemporaneous rela-
tionship is hypothesized between a column variable shock and a given row equation. The bystander
at the posterior distribution summaries for models with more lags and found that they fit worse than 2 lag models.13In this seven equation (variable) model given the formulation of the B-SVAR, there are at most 28 free parameters
in this matrix of contemporaneous coefficients, A0. All four models imply fewer than this number of free parameters,
or more zero restrictions than are necessary to identify the model.
14
model holds that the Israeli public does not react immediately to the behavior of its own govern-
ment nor of the Palestinians and, at the same time, that none of the governments react immediately
to changes in Jewish public opinion (as implied by the empty cells in the last column and the last
row). The public does not pay attention to the behaviors of the three governments and the three
governments ignore changes in public opinion. The absence of these contemporaneous relation-
ships are represented as blanks and are the zero order restrictions imposed by this first theory.14
[Table 2 about here.]
The other theories allow for additional contemporaneous relationships in the structural time
series B-SVAR model. These theories are presented in the remaining three model blocks of Table
2. Moreover, they are nested: the follower model is implied by the accountability model which
is implied by the credibility model. The block of relationships for each model are thus similar to
the bystander model for the contemporaneous reciprocal and triangular behaviors. The follower,
accountability and credibility models differ by allowing additional contemporaneous relationships.
The possibility that Jewish citizens monitor and react immediately to the actions of their govern-
ment toward the Palestinians but the Israeli government does not react to shifts in Jewish opinion
is represented by an F in the seventh row and first column of the follower block. This relationship
and the possibilities that Jewish citizens react immediately to the actions of the Palestinians toward
the Israelis and that their government reacts immediately to shifts in Jewish opinion are denoted by
the A’s in the accountability block. Finally, the theory that all these contemporaneous relationships
exist and that the Israeli, Palestinian, and American governments monitor and react immediately
to shifts in Jewish opinion and Jewish opinion immediately reacts to the directed behaviors of the
Israelis and Palestinians are denoted by the C’s in credibility block of Table 2. Each of these blocks
is the structural identification for one of the four B-SVAR models presented below.
14Of course, the data may not move the free coefficients denoted by the X’s off zero if there are no such relationships.
But the zero order restrictions impose zeros in the posterior for the coefficients denoted by blanks regardless of the
information in the data.
15
3.3.2 Dynamics
The lagged relationships between the variables describe how changes in directed behavior and
opinion are related through time. What distinguishes the B-SVAR model is that these relationships
explicitly depend on the contemporaneous causal relationships. The responses of the system to
changes in the endogenous variables or shocks, as revealed by an analysis of its reduced form,
reflects both the lagged relationships and the (competing) restrictions on the contemporaneous
relationships between the variables.15
Unlocking the dynamics of the system is difficult due to the problem of scale. The model con-
tains a large number of parameters and the parameter uncertainty makes it difficult to draw causal
inferences and produce useful forecasts.16 To cope with this problem, we employ a modified
version of the Sims and Zha (1998) prior. This prior addresses model scale by putting lower prob-
ability on non-zero coefficients of the lagged effects, especially those at the most distant (largest)
lags. Rather than imposing exact (possibly incorrect) restrictions on these coefficients such as
deleting lagged variables, the prior imposes a set of inexact restrictions on the lagged coefficients.
These inexact restrictions are prior beliefs that many of the coefficients in the model—especially
those for higher lags—have a prior mean of zero and small variances. The prior on the model
coefficients is then correlated across equations in a way that depends on the contemporaneous
relationships among the variables. This allows beliefs about the structure of the system to be in-
cluded in the prior. Finally, the prior is centered on a random walk model, allowing beliefs about
15If A+ is the matrix of coefficients on lagged values of the variables in the structural model and A 0 is the matrix
of coefficients for the contemporaneous relationships among the variables, then the reduced form coefficients of the
model are B = A+A−10 .
16The weekly model of Goldstein et al. (2001, 607, fn. 33) has 24 variables each with nine lags. Thus, it has 217
coefficients per equation or more than 5000 coefficients. Because of such scale, meaningful causal inferences about
the dynamic responses of their system will be difficult to make. For this reason investigators usually don’t even try to
analyze dynamics, conduct innovation accounting or produce forecasts. There is good reason to believe that most of
the coefficients on the distant lags in their model are close to zero. To ignore this belief is to use a flat prior or allow
the prior variance on the coefficients on all lags to be the same.
16
degrees of persistence in behavior.17 Details are in Sims and Zha (1998) and Brandt and Freeman
(2006a,b).18
3.3.3 Model evaluation
Model scale also creates challenges for model evaluation. Complex models are bound to overfit the
data making conventional (frequentist) fit statistics less useful. The current time series literature
and Bayesian statistics employ two measures to summarize posterior model fit (Sargent, Williams
and Zha, forthcoming; Sims and Zha, forthcoming; Brandt and Freeman, 2006b). The first is the
Bayesian information criteria (BIC). The BIC is a measure of model fit based on the log poste-
rior density adjusted for the degrees of freedom and penalized by the number of parameters in the
model.19 The second is the log marginal data density (log MDD) which measures the log posterior
density for the sample data (Chib, 1995). For the log MDD measure, one prefers larger values,
since they mean that the model has a higher posterior probability of generating the data. Differ-
ences in log MDDs across models are Bayes factors which compare the posterior odds of a model
to its prior odds or the weight of the evidence for one model over another. The log Bayes factor
allows us to compare support for the four models in a manner that is consistent with our statistical
approach (Kass and Raftery, 1995; Gill, 2002).20
Equally important, we analyze the implied dynamics of each model to see which produces the
most plausible set of key impulse responses. Using Bayesian methods provides meaningful error
17This prior serves as a benchmark and does not mean that the data follow random walks. If it is inconsistent with
the data, the estimated posterior will reflect this.18The hyperparameter values for the Sims-Zha prior were set at values based on experience with events data and
discussions with leading international relations scholars like Philip Schrodt (see Brandt and Freeman, 2006a). The
hyperparameter values used in all four models were λ0 = 0.8, λ1 = 0.1, λ2 = 1, λ3 = 1, λ4 = 0.1, λ5 = 0.05,
µ5 = 0, and µ6 = 5. Other values yield qualitatively similar results and inferences to those reported here. These
results are available from the authors.19The log posterior density (LPD) is the log likelihood plus the log prior. It is proportionate to the posterior proba-
bility for the model.20It is important when using Bayes factors to assess the sensitivity of the results to the prior specification for each
model. We address this issue in the Appendix.
17
bands for these responses. For example, if the bystander model receives strong support, its BIC
value should be smaller than the BIC values for the other three models. And if bystander model
receives the most support, the error bands for the responses of JPI to shocks in both I2P and in P2I
as well as for the responses of I2P and P2I should include zero.
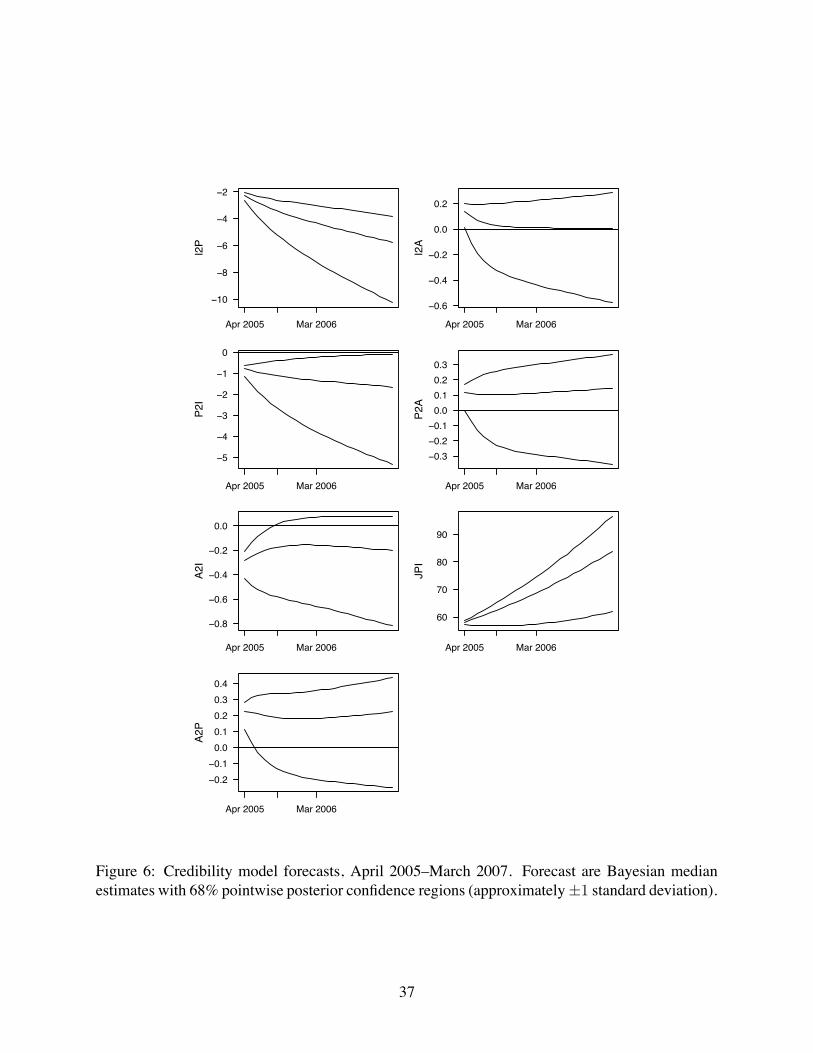
For the best fitting model, we produce a set of forecasts for April 2005–March 2007, and assess
their plausibility. These forecasts are original in terms of their time span and because past studies
of the Israeli-Palestinian conflict have not been able to produce specific timing predictions. They
suffer from “off-on-timing” problems (Bueno de Mesquita, 1997). Our use of Bayesian methods
allows us to provide meaningful error bands for these forecasts as well.21
4 Results
4.1 Model fit and selection
Table 3 presents the posterior fit measures for the four different structural models—bystander,
follower, accountability, and credibility. Moving down the rows of this table, each model contains
more contemporaneous parameters (in the its A0 matrices). The BICs are listed in the first column
of Table 3. The BIC measures show that best fitting model is the credibility model with a BIC of
508 which is lower than the other models.22
[Table 3 about here.]
The best fitting model, with the largest log MDD, is the credibility model. The final three
columns of Table 3 are the Bayes factors. There is little difference between the bystander, follower,
21Measure of forecast uncertainty (error bands) are absent in the work of the Political Risk Service (PRS), Interna-
tional Crisis Group (ICG), and in more sophisticated analyses using hidden Markov models (Schrodt, 2000; Schrodt
and Gerner, 2000).22The BICs values presented here are computed using the LPDs. Typically the BIC is computed using the log
likelihood. But, as argued by Sims and Zha (forthcoming), the LPD provides a better measure of the uncertainty of
the model fit. Using the log likelihood to compute the BICs produces a qualitatively similar result.
18
and accountability models (Bayes factors less than 2 are weak evidence for one model versus
another). The credibility model has large Bayes factors when compared to the other three models,
with values between 10.98 and 12.74. This is very strong evidence for the credibility model over
the other contemporaneous specifications.23 In terms of model fit the credibility model offers the
best explanation of the data. The restrictions on the contemporaneous impacts of Jewish support
for the peace process implied in the bystander, follower, and accountability models are not as likely
as those in the credibility model.
4.2 Impulse response dynamics
While the fit of the credibility model is best, we are also concerned with the conflict and opinion
dynamics of this model. Impulse response analysis, tracing out the response of the system of
equations to shocks in selected variables, summarizes the complex dynamics of the endogenous
variables in the estimated structural models. The full set of impulse responses for the systems
estimated here include 196 responses (49 responses per model × 4 models). Rather than present
all these responses, we focus on those of greatest substantive interest: the responses of I2P and P2I
to Jewish public opinion shocks and the responses of Jewish public opinion to conflict shocks.
Given the high volatility and correlated uncertainty about the dynamics of these models, we
compute error bands using an eigenvector decomposition method (Brandt and Freeman, 2006a).24
The reported error bands are 90% (posterior) confidence regions around the median estimates.
They provide a summary of the general direction and shape of the responses. The impulse re-
23We also ran models that 1) excluded the exogenous control variables from the B-SVAR models and 2) included
more lags of the endogenous variables. These models produce the same inference, namely that the credibility model
is superior to the other specifications.24The eigenvector decomposition of the variance of the impulse responses decomposes the variation of the responses
over time. This is a better summary of the overall shape, skewness and location of the error bands since it accounts for
the correlation in the responses. The variation explained by the first eigenvector of each response is between 45% to
100% of the variation in the impulse responses. (for details see Brandt and Freeman, 2006a). Error bands computed
from the empirical percentiles of the posterior responses generate similar inferences.
19
sponses presented here are interpreted differently from those typically seen in the literature. In
standard reduced form VAR models with a recursive identification of the contemporaneous error
covariance, one analyzes the responses of positive shocks to each equation in the system. Such a
normalization of the shocks is not possible in non-recursive B-SVAR models like ours (Waggoner
and Zha, 2003b). Since the contemporaneous shocks to a set of equations may be (negatively)
correlated with each other in the non-recursive system, shocks or innovations of different signs
may enter each equation. Thus positive shocks in one equation may imply negative shocks in other
equations. This is most important for interpreting the responses for reciprocity and triangularity
in the model. This sign normalization difference is particularly acute in the models presented here
because there is no consistent pattern of signed shocks entering the equations for the models.
Figure 3 shows the responses of the I2P and P2I equations to shocks in the I2P and P2I vari-
ables. The rows in this figure are the responses for these equations to shocks in the column vari-
ables.25 The bystander (credibility) model responses and error bands are shown with solid (dashed)
lines. In the first row, the bystander model I2P responses are for positive shocks in the column vari-
ables, while those in the credibility model are for negative shocks. The same “flipped” sign pattern
is seen in the responses of P2I to shocks in I2P and P2I where the shocks enter the equations with
different signs across the two models.26 To interpret the dynamics, start with the bystander model
(solid lines). The response of I2P to a positive shock in P2I is positive and its error bands do not
include zero. The bystander model thus implies reciprocity by the Israelis to surges of cooperation
by the Palestinians. Now consider the second row of the figure for the bystander model where a
shock in I2P is negative. Here the response in P2I is briefly positive but the error bands soon span
zero. This indicates, implausibly, that the Palestinian response to Israeli conflict innovations is
very short-lived to nonexistent.
[Figure 3 about here.]
25These are one standard deviation shocks of the residuals from the respective equation in the B-SVAR model.26One could flip the signs of the shocks / responses in each equation and generate the same pattern of responses for
the I2P equation. The consequence is that the response signs for the P2I equation would not be invariant to the sign
flip, since they are endogenously related to the I2P responses.
20
Responses for the credibilitymodel are more consistent with knowledge of the Israeli-Palestinian
conflict. Reading across the top row of Figure 3 for this model (dashed lines), the shock in P2I
is negative and the response again is reciprocal or negative in I2P. But row two of Figure 3 shows
that for this model a positive innovation in I2P produces a clear, sustained inverse response in P2I.
This finding that the only the more democratic member of the conflict dyad reciprocates coop-
eration (and conflict) is consistent with the work of Guisinger and Smith (2002) and McGilliray
and Smith (2000) who suggest that democratic institutions create incentives for leaders to use re-
ciprocal strategies. Conversely, their models imply that when the public finds it difficult to hold
leaders accountable, elites may defect from cooperation. Therefore, we expect to see a pattern
of non-democratic conflict in response to cooperative gestures from a rival. This “tit-for-take-
that” behavior is consistent with an interpretation of Palestinian policy making that emphasizes
the weakness of their central authority. When Israel cooperates, the Palestinian Authority fails to
rein in militants who might attempt to scuttle the peace process. When Israel is hostile, the Pales-
tinians can not escalate in kind due to the their lesser military capabilities. These dynamics are
only apparent when underlying domestic accountability and credibility mechanisms are explicitly
modeled.27
While the reciprocal and non-reciprocal responses in Figure 3 are consistent with models of
credibility and accountability, they do not directly demonstrate accountability. Accountability in
the dynamic model presented here means that changes in Jewish public opinion respond to changes
in conflict (and vice versa). Figure 4 shows the responses of Jewish support for the peace process
27The contemporaneous correlation of shocks in the credibility model generate a plausible rivalry scenario. Below
we map the signs of the diagonal of A0 for the credibility model into a vector and interpret the response pattern to a
contemporaneous surprise surge in conflict across all of the equations:
−+−−−+−
=
Increased Israeli conflict toward the Palestinians in response