67
English version Towards the first recombiant drug Insulin Rossana De Lorenzi Cristina Gritti ELLS – European Learning Laboratory for the Life Sciences
English version
Towards the first recombiant drug
Insulin
Rossana De LorenziCristina Gritti
ELLS – European Learning Laboratory for the Life Sciences

A collaboration between:
Towards the first recombiant drugInsulin
Rossana De Lorenzi and Cristina Gritti

Preface
Over the last century, enormous progress has been made in preventing, alleviating
and curing diseases. These developments can be linked to progress in the fields of
molecular biology and genetic engineering. Insulin is one of the best examples of how
the combined knowledge and application of these scientific disciplines has lead to
successful disease therapy.
The discovery and isolation of insulin in 1921, by Banting and Best, paved the way
for the development of a therapy which has saved the life of many diabetes patients.
Insulin was the first protein to be sequenced in 1951, marking an important milestone in
molecular biology. In 1976, insulin became the first recombinant drug – obtained using
newly developed genetic engineering techniques – to be used for therapy in humans. Five
researchers have earned Nobel Prizes for research related to insulin.
The aim of this activity is to follow the pharmaceutical history of insulin using IT tools.
After describing the characteristics of the hormone, the different types of diabetes will be
explained. Historically, two different approaches have been used to treat diabetes that
require insulin therapy:
· Early on insulin was extracted from pigs or bovines. We will use bioinformatics tools
to compare the protein sequence of insulin from different animals, in order to establish
which one is most closely related to the human isoform and, therefore, best suited for
treating diabetes.
· More recently the production of recombinant human insulin has been adopted. After
explaining the major genetic engineering achievements behind recombinant human
insulin, a lab activity will guide the students through the most significant steps in the
preparation of this drug.

Table of contents
1 Insulin ............................................................................................... 6
1.1 Short history .......................................................................................................... 6
1.2 Insulin production .................................................................................................. 7
1.3 Structure of insulin ................................................................................................. 8
1.4 Mechanism insulin ................................................................................................. 10
1.5 Regulation insulin................................................................................................... 11
1.6 Insulin animals ....................................................................................................... 12
2 Diabetes mellitus .................................................................................. 13
2.1 Classification ......................................................................................................... 13
2.2 Epidemiology ......................................................................................................... 13
2.3 Pathophysiology .................................................................................................... 13
2.3.1 Insulin resistance ........................................................................................................... 13
2.3.2 Type 1 diabetes ............................................................................................................. 13
2.3.3 Type 2 diabetes ............................................................................................................ 14
2.4 Diagnosis ............................................................................................................. 14
2.4.1 Symptoms ......................................................................................................... 14
2.4.2 Screening .......................................................................................................... 15
2.5 Treatment .............................................................................................................. 15
2.6 Complications ....................................................................................................... 16
3 Classical therapy for diabetes ......................................................... 17
3.1 Therapy with animal insulin .................................................................................... 17
Activity I – Bioinformatics ..................................................................... 18
AI.1 Main reference sites.............................................................................................. 18
www.expasy.org ..................................................................................................................... 18
http://workbench.sdsc.edu ................................................................................................... 19
www.ncbi.nlm.nih.gov ............................................................................................................ 19
AI.2 Searching for the protein sequence ...................................................................... 19
AI.3 Comparing the protein sequences ........................................................................ 22
AI.4 Visualizing the three-dimensional structure ........................................................... 29

4 Therapy with recombinant insulin ........................................................ 33
4.1 Towards recombinant insulin .................................................................................. 33
4.1.1 Restriction enzymes ...................................................................................................... 33
4.1.2 Ligases .......................................................................................................................... 33
4.1.3 Cloning .......................................................................................................................... 33
4.1.4 Recombinant DNA technology ....................................................................................... 34
4.2 Synthesis of human recombinant insulin ................................................................ 36
4.2.1 Genentech strategy ....................................................................................................... 36
4.2.2 Biogen strategy ............................................................................................................. 36
4.3 Production of recombinant insulin .......................................................................... 36
4.3.1 Insulin from bacteria ...................................................................................................... 37
4.3.2 Insulin from yeast ........................................................................................................... 39
Activity II – Molecular biology ............................................................... 41
AII.1 Introduction ......................................................................................................... 42
AII.2 Protocol ............................................................................................................... 47
AII.3 Reagents and instruments .................................................................................. 47
AII.3.1 Description of the products used for this activity .......................................................... 47
AII.3.2 Materials and solutions necessary for the activity ......................................................... 47
AII.3.3 Instruments needed for the activity .............................................................................. 48
AII.4 General laboratory safety measures ..................................................................... 48
AII.4.1 General rules ............................................................................................................... 48
AII.4.2 Safety measures when using electrical equipment ....................................................... 49
AII.4.3 Safety measures for handling toxic substances ............................................................ 49
AII.4.4 Safety measures for working with biological material .................................................... 49
AII.4.5 Safety measures for using ultraviolet radiation .............................................................. 49
AII.4.6 Safety measures for using centrifuges .......................................................................... 50
AII.4.7 Use of the microwave oven .......................................................................................... 50
AII.4.8 Handling of apparatus for electrophoresis .................................................................... 51
Appendix I ................................................................................................................... 52
Appendix II .................................................................................................................. 56
Appendix III ................................................................................................................. 57
5 Bibliography and web references ........................................................ 64

6
1 Insulin
1.1 Short history of the discovery of insulin
While studying the structure of the pancreas under the microscope, in 1869
the young medical student Paul Langerhans identified small areas of clear cells
throughout the organ (islets of Langerhans). It was thought that they produced a
secretion involved in digestion. Since then researchers have been trying to
understand the role of these cells.
In 1889, Oscar Minkowski and Joseph von Mering found that if they removed the
pancreas from dogs, the animals would develop diabetes. This meant that this gland
and the islets of Langerhans in particular (as was established later in 1901 by Eugene
Opie) were involved in regulating sugar levels in the blood.
In the following years, several attempts were made to isolate the secretion from
the islets of Langerhans. But it was only in 1920 that Frederick Banting came up
with a successful method after reading an article by Minkowski. He saw that the
internal secretion from the islets of Langerhans could be destroyed by the exocrine
secretion of the pancreas and, therefore, it was necessary to remove the latter.
During the following summer while working at the University of Toronto under the
supervision of John James Rickard Macleod and with the help of medical stu-
dent Charles Best, he came up with the idea of blocking the pancreatic ducts in
dogs by tying them up, causing death and re-absorption of the digestive cells by the
immune system, but leaving the islets of Langerhans untouched. They extracted the
secretion from these cells and named it “isletin” (later insulin). When administered to
dogs deprived of a pancreas, the extract lowered the glucose level in their blood!
In the months that followed, Banting and Best tried to improve and speed up the
extraction process (it took 6 weeks to extract insulin from an animal!). They used
fetal bovine pancreas, in which the digestive glands were undeveloped, and later col-
laborated with the biochemist James Bertram Collip to purify the extract. In 1922,
clinical trials began: doses of purified insulin were successfully injected into diabetic
children. In November of the same year, the pharmaceutical company Eli Lilly started
to produce purified insulin.
Insulin is a protein hormone. Its name is derived from the latin “insula” (island) as
it is secreted by groups of endocrine cells called the islets of Langerhans in the
pancreas. In general, insulin enables glucose metabolism by activating glycolysis,
it promotes the accumulation of glucose in the liver in the form of glycogen and
favours the storage of fat.
Fig. 1.1 Left: Charles Best and
Frederick Banting (source: www.
lillydiabete.it). Right, top: J. J. R.
Macleod (source: www.uihealth-
care.com); bottom: James B.
Collip (source: www.medicalhis-
tory.uwo.ca)

Insulin 1
7
In 1923, Banting and Macleod were awarded the Nobel Prize for Medicine, which
they chose to share with Best and Collip.
In 1958, the Nobel Prize for Chemistry was awarded to the British molecular
biologist Frederick Sanger for determining the protein sequence of insulin. In 1969,
Dorothy Crowfoot Hodgkin, already a Nobel Laureate in Chemistry, determined the
spatial structure of insulin by X-ray diffraction. In 1977, Rosalyn Sussman Yalow
received the Nobel Prize in Medicine for developing a Radio Immuno Assay (RIA) for
insulin diagnostics.
1.2 Insulin Production
Fig. 1.2 Structure of the pancreas (source: www.colorado.edu)
Fig. 1.3 Islet of Langerhans
with the different cell types
(source: www.staminali.
aduc.it)
In mammals insulin is synthesized in the pancreas, which is an exocrine gland that pro-
duces digestive juices. Only 2% of its total mass has an endocrine function. This portion is
represented by the islets of Langerhans, which are composed of at least four types of cells:
• β-cells (65-80%) which secrete insulin
• a-cells (15-20%) which secrete glucagon (a hormone involved in the release of
glucose in the bloodstream from the stores of hepatic glycogen)
• g-cells (3-10%) which secrete somatostatin (a hormone that inhibits the release of
insulin and glucagon, as well as the synthesis of the pituitary growth hormone)
• PP cells (about 1%) which secrete the pancreatic peptide (a hormone that
regulates the exocrine secretion of the pancreas).

Insulin 1
8
1.3 Structure of insulin
Insulin is formed from two polypeptide chains (A- and B-chains), held together by
two disulphide bridges; a third disulphide bridge is situated within the A-chain. The
A-chain is composed of 21 amino acids, the B-chain of 30 amino acids.
Fig. 1.4 Structure of insulin (source:
www.chemistryexplained.com)
Fig. 1.5 Insulin post-translational modifications. Cell
components and molecules are not to scale (adap-
ted from www.en.wikipedia.org/wiki/Insulin)
Insulin is initially synthesized as
preproinsulin, a 110 amino acid polypep-
tide that contains additional sequences:
• A“pre”amino-terminalsequence(sig-
nal peptide of 24 amino acids), which
enables the secretion of the protein
• Acentral“pro”sequence(theCpep-
tide of 35 amino acids) which deter-
mines the correct folding of the pro-
tein.
After preproinsulin is translated in the
endoplasmic reticulum, an enzyme
cuts off the 24 amino-terminal amino
acids, leaving proinsulin, which in turn
folds and allows the formation of the
disulphide bonds between cysteine resi-
dues. At this stage, the protein passes
into the Golgi apparatus, where the C
peptide is removed, forming mature in-
sulin, which is then stored in the Golgi
vescicles.
Insulin 1
9
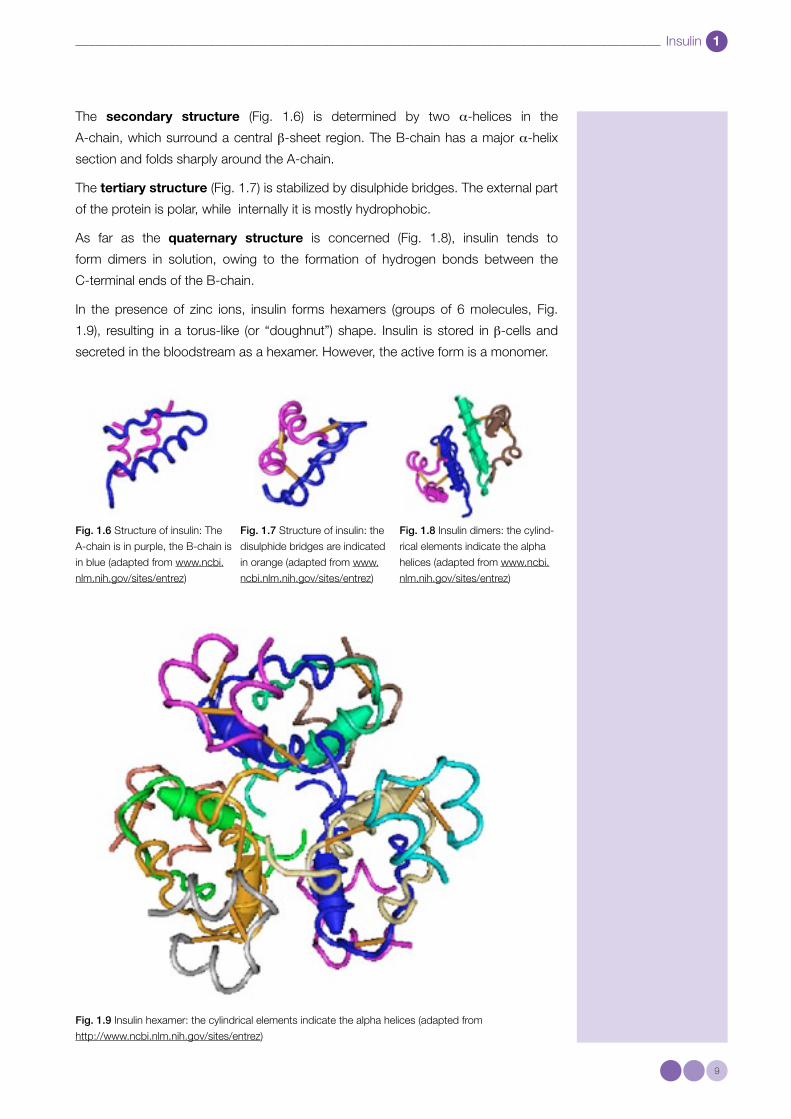
The secondary structure (Fig. 1.6) is determined by two a-helices in the
A-chain, which surround a central β-sheet region. The B-chain has a major a-helix
section and folds sharply around the A-chain.
The tertiary structure (Fig. 1.7) is stabilized by disulphide bridges. The external part
of the protein is polar, while internally it is mostly hydro phobic.
As far as the quaternary structure is concerned (Fig. 1.8), insulin tends to
form dimers in solution, owing to the formation of hydrogen bonds between the
C-terminal ends of the B-chain.
In the presence of zinc ions, insulin forms hexamers (groups of 6 molecules, Fig.
1.9), resulting in a torus-like (or “doughnut”) shape. Insulin is stored in β-cells and
secreted in the bloodstream as a hexamer. However, the active form is a monomer.
Fig. 1.9 Insulin hexamer: the cylindrical elements indicate the alpha helices (adapted from
http://www.ncbi.nlm.nih.gov/sites/entrez)
Fig. 1.8 Insulin dimers: the cylind-
rical elements indicate the alpha
helices (adapted from www.ncbi.
nlm.nih.gov/sites/entrez)
Fig. 1.6 Structure of insulin: The
A-chain is in purple, the B-chain is
in blue (adapted from www.ncbi.
nlm.nih.gov/sites/entrez)
Fig. 1.7 Structure of insulin: the
disulphide bridges are indicated
in orange (adapted from www.
ncbi.nlm.nih.gov/sites/entrez)
Insulin 1
10
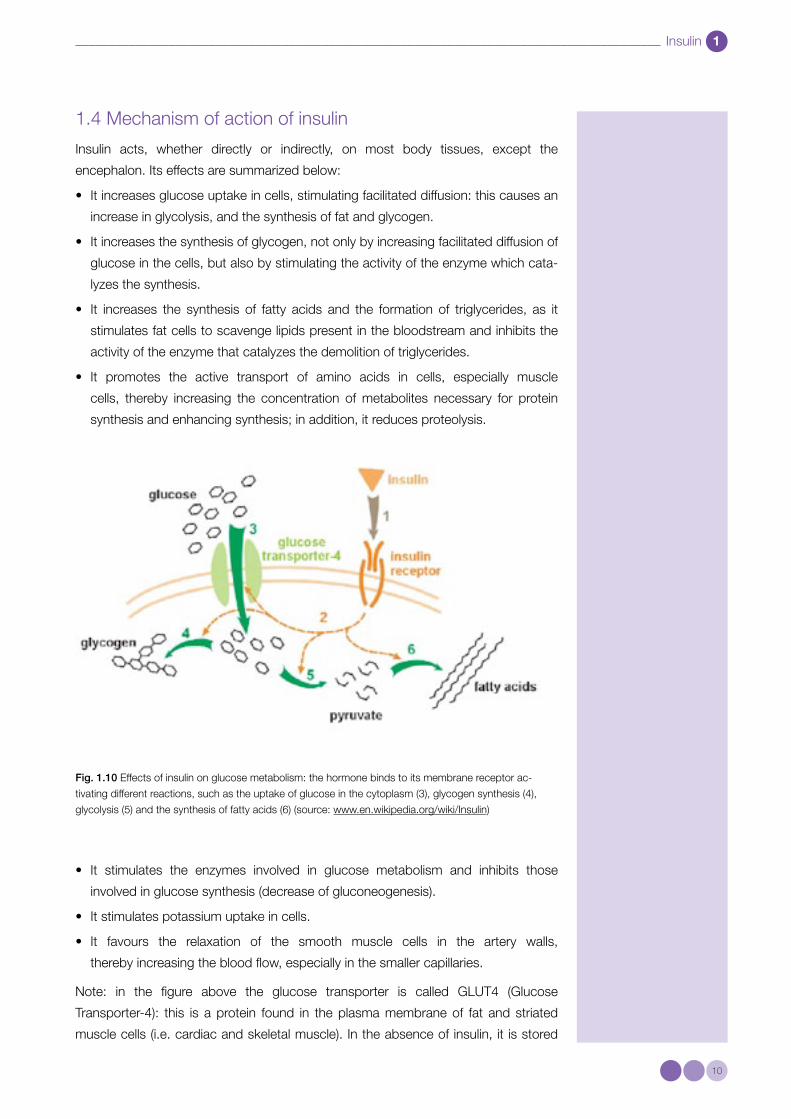
1.4 Mechanism of action of insulin
Insulin acts, whether directly or indirectly, on most body tissues, except the
encephalon. Its effects are summarized below:
• Itincreasesglucoseuptakeincells,stimulatingfacilitateddiffusion:thiscausesan
increase in glycolysis, and the synthesis of fat and glycogen.
• Itincreasesthesynthesisofglycogen,notonlybyincreasingfacilitateddiffusionof
glucose in the cells, but also by stimulating the activity of the enzyme which cata-
lyzes the synthesis.
• It increases the synthesis of fatty acids and the formation of triglycerides, as it
stimulates fat cells to scavenge lipids present in the bloodstream and inhibits the
activity of the enzyme that catalyzes the demolition of triglycerides.
• It promotes the active transport of amino acids in cells, especially muscle
cells, thereby increasing the concentration of metabolites necessary for protein
synthesis and enhancing synthesis; in addition, it reduces proteolysis.
• It stimulates the enzymes involved in glucose metabolism and inhibits those
involved in glucose synthesis (decrease of gluconeogenesis).
• Itstimulatespotassiumuptakeincells.
• It favours the relaxation of the smooth muscle cells in the artery walls,
thereby increasing the blood flow, especially in the smaller capillaries.
Note: in the figure above the glucose transporter is called GLUT4 (Glucose
Transporter-4): this is a protein found in the plasma membrane of fat and striated
muscle cells (i.e. cardiac and skeletal muscle). In the absence of insulin, it is stored
Fig. 1.10 Effects of insulin on glucose metabolism: the hormone binds to its membrane receptor ac-
tivating different reactions, such as the uptake of glucose in the cytoplasm (3), glycogen synthesis (4),
glycolysis (5) and the synthesis of fatty acids (6) (source: www.en.wikipedia.org/wiki/Insulin)
Insulin 1
11
inside the cell. The binding of insulin to its receptor induces the distribution of GLUT4
in the membrane, where it enables the facilitated diffusion of glucose.
Muscle and fat (which represent on average two-thirds of all the cells of the human
body) are the two tissues in which glucose uptake is influenced by insulin. Although
insulin plays a primary role in glucose uptake, it does not modify the absorption of
glucose in the cells of the encephalon, nor its active transport in the kidney tubule and
gastrointestinal epithelium.
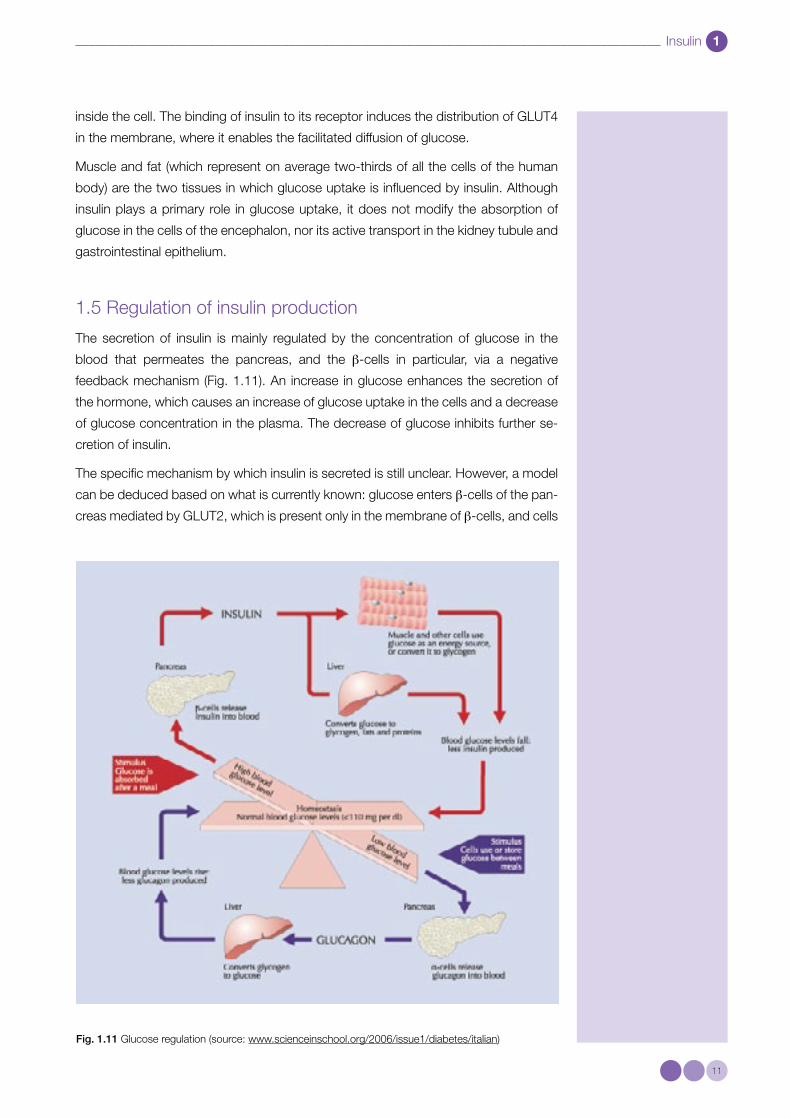
1.5 Regulation of insulin production
The secretion of insulin is mainly regulated by the concentration of glucose in the
blood that permeates the pancreas, and the β-cells in particular, via a negative
feedback mechanism (Fig. 1.11). An increase in glucose enhances the secretion of
the hormone, which causes an increase of glucose uptake in the cells and a decrease
of glucose concentration in the plasma. The decrease of glucose inhibits further se-
cretion of insulin.
The specific mechanism by which insulin is secreted is still unclear. However, a model
can be deduced based on what is currently known: glucose enters β-cells of the pan-
creas mediated by GLUT2, which is present only in the membrane of β-cells, and cells
Fig. 1.11 Glucose regulation (source: www.scienceinschool.org/2006/issue1/diabetes/italian)

Insulin 1
12
of the liver, the hypothalamus, the small intestine and the renal tubule. The sugar is
used for glycolysis and cell respiration, coupled to the production of ATP. The increase
of ATP determines the closure of potassium channels and results in membrane de-
polarization. As a consequence, calcium ions enter the cell and are further released in
the cytoplasm from the endoplasmic reticulum. This increase of calcium is thought to
be responsible for the release of insulin accumulated in the secretory vesicles of the
Golgi apparatus. In addition, the increase of glucose in the β-cells seems to activate
other calcium-independent metabolic pathways that also play a role in insulin secre-
tion. Intracellular glucose also stimulates the transcription of the insulin gene and the
translation of its mRNA.
However, glucose is not the only factor that controls insulin release (although it is the
most important).
The ingestion of food in general, not only carbohydrates, determines increased
secretion. In addition, the nervous system (via visual and taste stimuli triggered by
food) and hormones (such as gastrointestinal hormones) also have an influence on
insulin secretion.
1.6 Insulin in other animals
The protein sequence of insulin differs from one species to another (sometimes
additional amino acids are present). However, there are highly conserved regions,
which include the position of the disulphide bridges, both ends of the A-chain, and
the C-terminal end of the B-chain. Therefore, the three-dimensional structure is very
similar. Mammalian insulin is highly conserved: e.g. the bovine hormone differs from
the human one by only three amino acids, and the porcine one by a single amino acid!
Even within vertebrates, in general, there are certain similarities: in some species of
fish, insulin is sufficiently similar to be efficient in humans. In contrast, the C-peptide of
proinsulin differs greatly from one species to another.
Fig. 1.12 Glucose-dependant mechanism for insulin production (adapted from http://en.wikipedia.org/
wiki/Insulin)
13
2 Diabetes Mellitus
2.1 Classification
The most frequent forms of diabetes are type 1 and type 2 diabetes. Type 1 diabetes normally has an early onset
during childhood or adolescence. However, adults can develop this form of diabetes, in some cases even at the
age of forty or fifty. Type 2 diabetes typically develops in adulthood. However, due to the increase in obesity, many
young people, even adolescents develop this condition. Other forms of diabetes include gestational diabetes (which
occurs during pregnancy), diabetes due to pancreas resection, and some rare forms of diabetes due to genetic
mutations.
2.2 Epidemiology
About 90% of diabetes mellitus patients suffer from type 2 diabetes. It has been estimated that 150 million
people in the world are affected by the disease, and the number is expected to double over the next 20 years. The
increase is expected to occur in developing countries, such as India and China. In the United States, where the
incidence of the disease is already high, it is expected that one person out of three will develop type 2 diabetes.
2.3 Pathophysiology
2.3.1 Insulin resistance
Most patients with type 2 diabetes, as well as prediabetic individuals, are characterized by insulin resistance. In
these patients, although insulin is present at normal or even high levels, it is less efficient compared to insulin in
normal individuals. Peripheral insulin resistance lowers the efficiency of insulin in mediating glucose uptake in muscle
cells. In the liver, insulin is unable to inhibit the production of new glucose (gluconeogenesis) and the lysis of glyco-
gen. As a result, the level of glucose in blood rises, leading to hyperglycemia.
2.3.2 Type 1 diabetes
Type 1 diabetes is an autoimmune disease. In genetically predisposed individuals, probably following a viral
infection, an inflammation of pancreatic β-cells takes place. Since the β-cells are the only cells that secrete insulin,
insulin deficiency occurs as a result. Therefore, patients who suffer from type 1 diabetes require insulin therapy.
The term diabetes mellitus means “sweet flow” in ancient Greek. The name
originates from the time when doctors used to taste a patient’s urine to diagnose
diabetes. The sweet flavour of the urine would be indicative of diabetes mellitus
as opposed to diabetes insipidus (which means “tasteless” in Latin), another
disorder characterized by frequent urination.
There are several forms of diabetes mellitus and the feature that they all have in
common is an increase of glucose levels in the bloodstream.
Diabetes Mellitus 2
14
2.3.3 Type 2 diabetes
Type 2 diabetes is typically caused by a combination of genetic and environmen-
tal factors. The genetic component is stronger than in type 1 diabetes: the twin
of a patient affected by type 2 diabetes will almost certainly develop the disease.
Other determining factors are diet and physical exercise. When food is scarce, for
instance, the incidence of type 2 diabetes is very low.
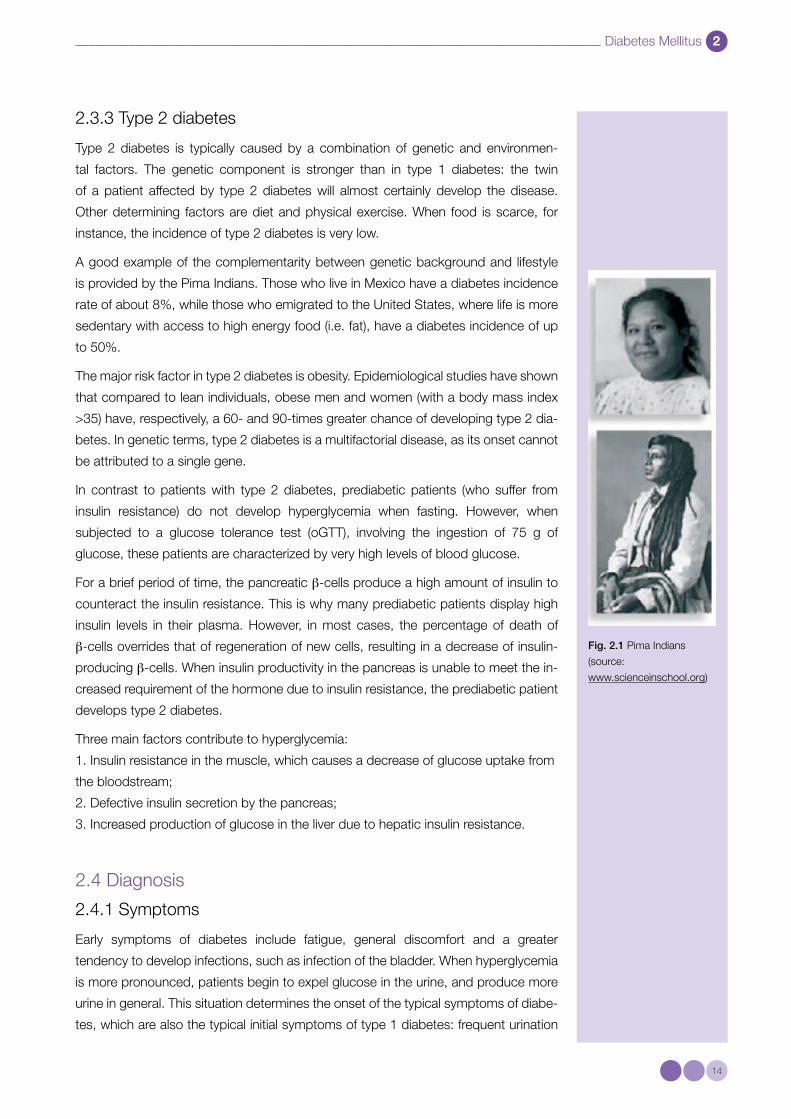
A good example of the complementarity between genetic background and lifestyle
is provided by the Pima Indians. Those who live in Mexico have a diabetes incidence
rate of about 8%, while those who emigrated to the United States, where life is more
sedentary with access to high energy food (i.e. fat), have a diabetes incidence of up
to 50%.
The major risk factor in type 2 diabetes is obesity. Epidemiological studies have shown
that compared to lean individuals, obese men and women (with a body mass index
>35) have, respectively, a 60- and 90-times greater chance of developing type 2 dia-
betes. In genetic terms, type 2 diabetes is a multifactorial disease, as its onset cannot
be attributed to a single gene.
In contrast to patients with type 2 diabetes, prediabetic patients (who suffer from
insulin resistance) do not develop hyperglycemia when fasting. However, when
subjected to a glucose tolerance test (oGTT), involving the ingestion of 75 g of
glucose, these patients are characterized by very high levels of blood glucose.
For a brief period of time, the pancreatic β-cells produce a high amount of insulin to
counteract the insulin resistance. This is why many prediabetic patients display high
insulin levels in their plasma. However, in most cases, the percentage of death of
β-cells overrides that of regeneration of new cells, resulting in a decrease of insulin-
producing β-cells. When insulin productivity in the pancreas is unable to meet the in-
creased requirement of the hormone due to insulin resistance, the prediabetic patient
develops type 2 diabetes.
Three main factors contribute to hyperglycemia:
1. Insulin resistance in the muscle, which causes a decrease of glucose uptake from
the bloodstream;
2. Defective insulin secretion by the pancreas;
3. Increased production of glucose in the liver due to hepatic insulin resistance.
2.4 Diagnosis
2.4.1 Symptoms
Early symptoms of diabetes include fatigue, general discomfort and a greater
tendency to develop infections, such as infection of the bladder. When hyperglycemia
is more pronounced, patients begin to expel glucose in the urine, and produce more
urine in general. This situation determines the onset of the typical symptoms of diabe-
tes, which are also the typical initial symptoms of type 1 diabetes: frequent urination
Fig. 2.1 Pima Indians
(source:
www.scienceinschool.org)
Diabetes Mellitus 2
15
(polyuria), with a consequent increased thirst (polydipsia) and, as a result, dehydration
and weight loss.
2.4.2 Screening
During the initial phases of type 2 diabetes, the symptoms may be very sub-
tle, and the disease can often remain silent for several years. Unfortunately, the
complications of diabetes (reported below) often develop during this phase. It is there-
fore crucial to regularly screen patients at risk, such as obese individuals, those who
have a family history of diabetes and women with previous experience of gestational
diabetes. The screening can be done either by determining blood glucose levels when
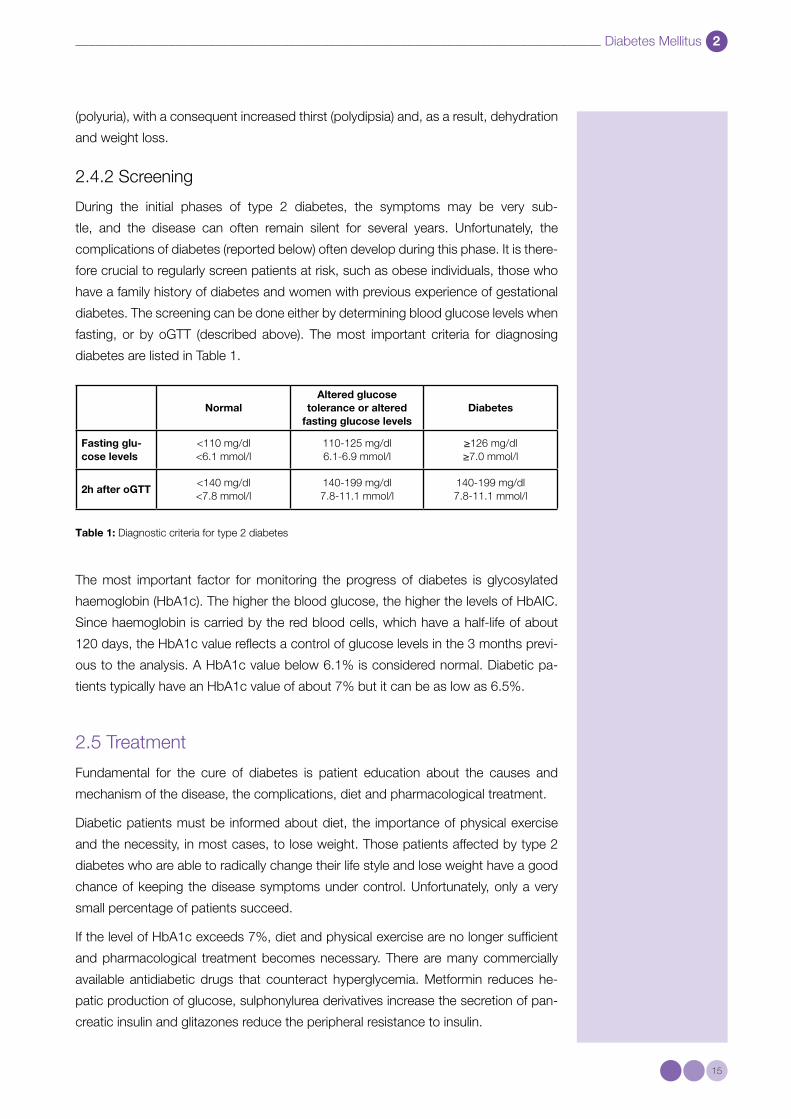
fasting, or by oGTT (described above). The most important criteria for diagnosing
diabetes are listed in Table 1.
NormalAltered glucose
tolerance or altered fasting glucose levels
Diabetes
Fasting glu-cose levels
<110 mg/dl <6.1 mmol/l
110-125 mg/dl 6.1-6.9 mmol/l
≥126 mg/dl ≥7.0 mmol/l
2h after oGTT<140 mg/dl <7.8 mmol/l
140-199 mg/dl 7.8-11.1 mmol/l
140-199 mg/dl 7.8-11.1 mmol/l
Table 1: Diagnostic criteria for type 2 diabetes
The most important factor for monitoring the progress of diabetes is glycosylated
haemoglobin (HbA1c). The higher the blood glucose, the higher the levels of HbAIC.
Since haemoglobin is carried by the red blood cells, which have a half-life of about
120 days, the HbA1c value reflects a control of glucose levels in the 3 months previ-
ous to the analysis. A HbA1c value below 6.1% is considered normal. Diabetic pa-
tients typically have an HbA1c value of about 7% but it can be as low as 6.5%.
2.5 Treatment
Fundamental for the cure of diabetes is patient education about the causes and
mechanism of the disease, the complications, diet and pharmacological treatment.
Diabetic patients must be informed about diet, the importance of physical exercise
and the necessity, in most cases, to lose weight. Those patients affected by type 2
diabetes who are able to radically change their life style and lose weight have a good
chance of keeping the disease symptoms under control. Unfortunately, only a very
small percentage of patients succeed.
If the level of HbA1c exceeds 7%, diet and physical exercise are no longer sufficient
and pharmacological treatment becomes necessary. There are many commercially
available antidiabetic drugs that counteract hyperglycemia. Metformin reduces he-
patic production of glucose, sulphonylurea derivatives increase the secretion of pan-
creatic insulin and glitazones reduce the peripheral resistance to insulin.

Diabetes Mellitus 2
16
If the level of HbA1c exceeds 7% despite pharmacological treatment with oral an-
ti-diabetic drugs, insulin-based therapy is required. The therapy usually begins by
administering long-term insulin during the night. Eventually, many type 2 diabetes
patients, similarly to type 1 diabetes patients, require a complete insulin therapy.
This consists either in administering a combination of long- and short-term insulin
twice daily, or a more intense therapy based on long-term insulin injections, dur-
ing the night or in the morning, and short-term insulin injections at meals. Insulin
must always be given in association with food intake, in order to avoid hyper- or
hypoglycemic shocks.
Owing to the high risk of cardiovascular complications (see below), it is crucial not only
to keep glucose-dependent symptoms under control, but also cardiovascular risk fac-
tors, such as high blood pressure and high cholesterol levels.
2.6 Complications
Because of the high frequency of complications, diabetes lowers a patient’s life ex-
pectancy. Disorders of the small blood vessels (microvascular disorders), type 2
diabetes is the major cause of blindness in adults (diabetic retinopathy), renal fail-
ure (diabetic nephropathy) and amputation (diabetic foot) in the industrialized world.
The most common microvascular complication is diabetic neuropathy, a disor-
der that generally involves distal sensory neurons, altering perception of vibrations,
temperature and pain in the hands and feet. At advanced stages, diabetic
neuropathy can cause intense pain.
Type 2 diabetes is often associated with larger blood vessels such as arteries (mac-
rovascular disorder) and a 2-5 fold increase of the risk of developing cardiovascular
diseases: myocardial infarction (heart attack) and stroke.

17
3 Classical Therapy for Diabetes
3.1 Therapy with animal Insulin
For a long time after its discovery, insulin was extracted from animal tissues and purified as a drug to treat
diabetes. Later on, researchers, driven by the need to find alternative sources of insulin in order to supply the in-
creasing demand of diabetic patients, resolved to produce human insulin via two simple strategies: the chemical
synthesis of insulin from single amino acids (a feasible process, albeit expensive), and conversion of pig insulin
into human insulin by the substitution of a single amino acid. In the 1970s, following the second strategy, the
pharmaceutical company Novo Nordisk A/S started to produce “semi-synthetic” insulin by substituting an alanine
residue on the B-chain with a threonine.
Diabetes is a chronic disease and there are currently no effective therapies that can
cure it completely.
Therapy is mostly necessary for preventing serious complications that arise if
diabetes is not kept under control which may lead to death of the patient.
The therapy for juvenile insulin-dependent diabetes mellitus is “substitutive”,
meaning that insulin is administered from the “outside”.
Since insulin was discovered in 1922, huge progress has been made in
developing insulin therapy, starting with the classical substitutive therapy using in-
sulin extracted from animal pancreas and progressing, from the 1970s onward, to
therapies using recombinant insulin.
Activity I – Bioinformatics 3
18
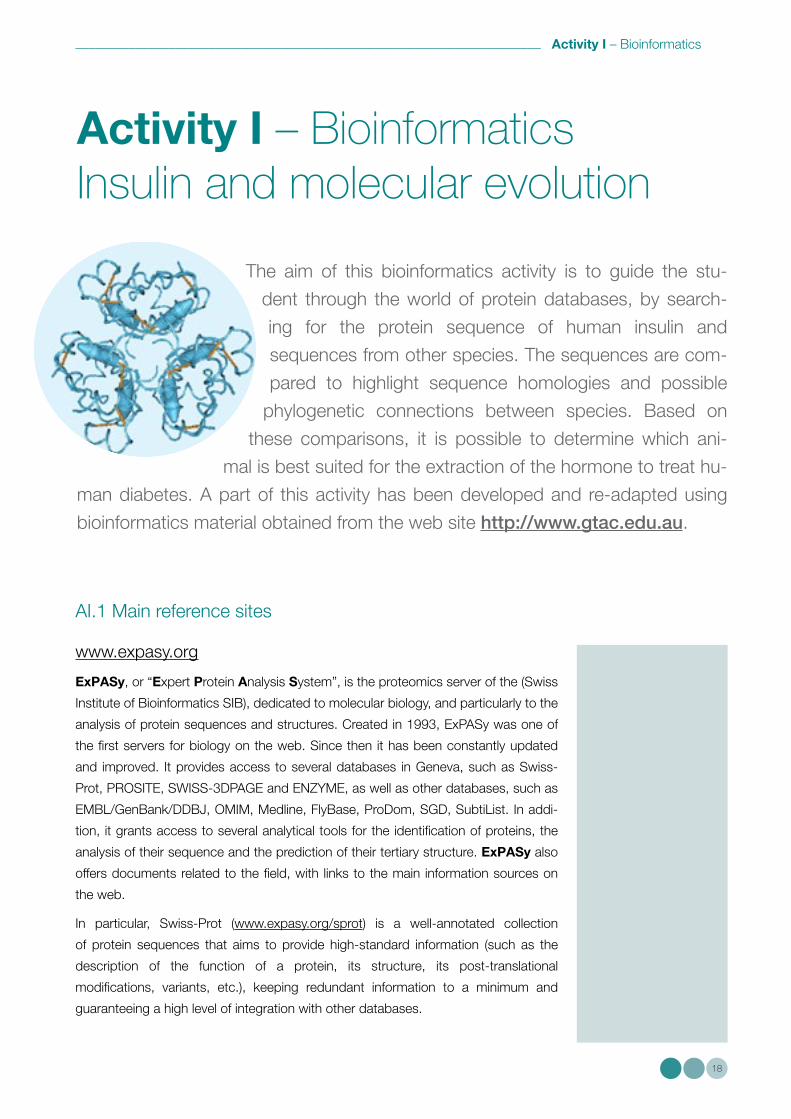
Activity I – Bioinformatics Insulin and molecular evolution
The aim of this bioinformatics activity is to guide the stu-
dent through the world of protein databases, by search-
ing for the protein sequence of human insulin and
sequences from other species. The sequences are com-
pared to highlight sequence homologies and possible
phylogenetic connections between species. Based on
these comparisons, it is possible to determine which ani-
mal is best suited for the extraction of the hormone to treat hu-
man diabetes. A part of this activity has been developed and re-adapted using
bioinformatics material obtained from the web site http://www.gtac.edu.au.
AI.1 Main reference sites
www.expasy.org
ExPASy, or “Expert Protein Analysis System”, is the proteomics server of the (Swiss
Institute of Bioinformatics SIB), dedicated to molecular biology, and particularly to the
analysis of protein sequences and structures. Created in 1993, ExPASy was one of
the first servers for biology on the web. Since then it has been constantly updated
and improved. It provides access to several databases in Geneva, such as Swiss-
Prot, PROSITE, SWISS-3DPAGE and ENZYME, as well as other databases, such as
EMBL/GenBank/DDBJ, OMIM, Medline, FlyBase, ProDom, SGD, SubtiList. In addi-
tion, it grants access to several analytical tools for the identification of proteins, the
analysis of their sequence and the prediction of their tertiary structure. ExPASy also
offers documents related to the field, with links to the main information sources on
the web.
In particular, Swiss-Prot (www.expasy.org/sprot) is a well-annotated collection
of protein sequences that aims to provide high-standard information (such as the
description of the function of a protein, its structure, its post-translational
modifications, variants, etc.), keeping redundant information to a minimum and
guaranteeing a high level of integration with other databases.

Activity I – Bioinformatics 3
19
http://workbench.sdsc.edu
Biology WorkBench is a web interface that allows anyone to readily use
bioinformatics tools for research, revision or teaching. It has been available since
June 1996 and provides a portal to databases on the web, data collection and
various other applications. It has the advantage of having a very simple interface,
reducing many passages of data processing with a ‘point and click’. The cur-
rent version contains a vast collection of databases and calculation tools, among
the most useful for molecular biology are the tools which illustrate the relationship
between protein sequences and nucleic acids.
www.ncbi.nlm.nih.gov
National Center for Biotechnology Information (NCBI), created in 1988, cre-
ates public databases, allows bioinformatics searches, develops software to anal-
yse genomic data and disseminates biomedical information. The aim is to improve
the comprehension of molecular processes related to human health and disease.
The site contains databanks for the human genome and other organisms, nucleo-
tide and protein sequences, molecular structures and scientific publications (such
as “PubMed”, the major public bibliographic databank with open access in the
biomedical field). NCBI-Entrez includes a database of experimentally deter-
mined 3D biomolecular structures: Molecular Modeling Database (MMDB). These
structures are obtained mainly by X-ray crystallography and nuclear magnetic
resonance spectroscopy (NMR), and they provide information on the biologi-
cal function, the evolutionary history and macromolecular interactions. This data-
base is naturally smaller than a protein or nucleotide database (the 3D structure of
only a fraction of all known proteins has been determined), but many proteins are
homologous to those already present.
AI.2 Searching for the protein sequence
• Go to the web site: www.expasy.org/sprot
Go to the Access to the UniProt Knowledgebase: UniProt (Universal Protein
Resource) is the most complete worldwide catalogue of protein information. It is
the central archive of protein sequences, which brings together the information
contained in Swiss-Prot, TrEMBL (i.e. Translated EMBL, the database derived
by the translation of the genetic information contained in the EMBL database)
and PIR (Protein Information Resource, a public and integrated bioinformatics
resource, for genomic and proteomic research, based at the Georgetown
University Medical Center – GUMC).
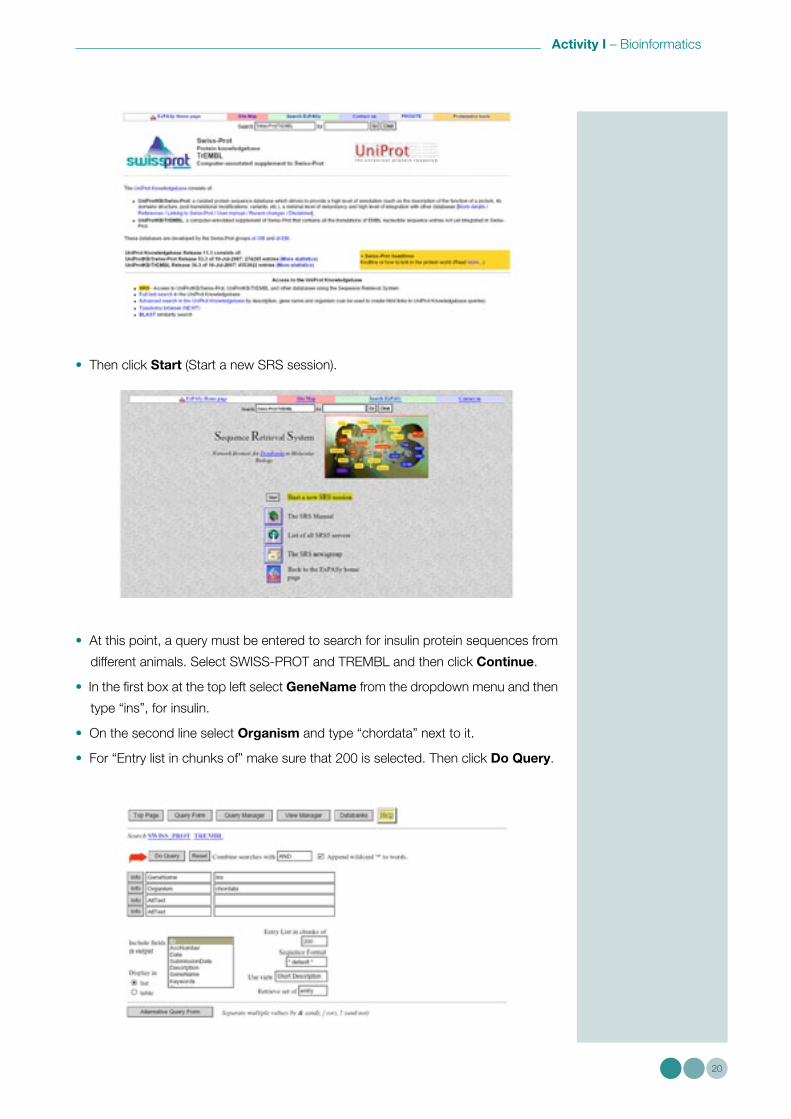
• Click on SRS (Sequence Retrieval System).
Activity I – Bioinformatics 3
20
• Then click Start (Start a new SRS session).
• At this point, a query must be entered to search for insulin protein sequences from
different animals. Select SWISS-PROT and TREMBL and then click Continue.
• In the first box at the top left select GeneName from the dropdown menu and then
type “ins”, for insulin.
• On the second line select Organism and type “chordata” next to it.
• For “Entry list in chunks of” make sure that 200 is selected. Then click Do Query.
Activity I – Bioinformatics 3
21
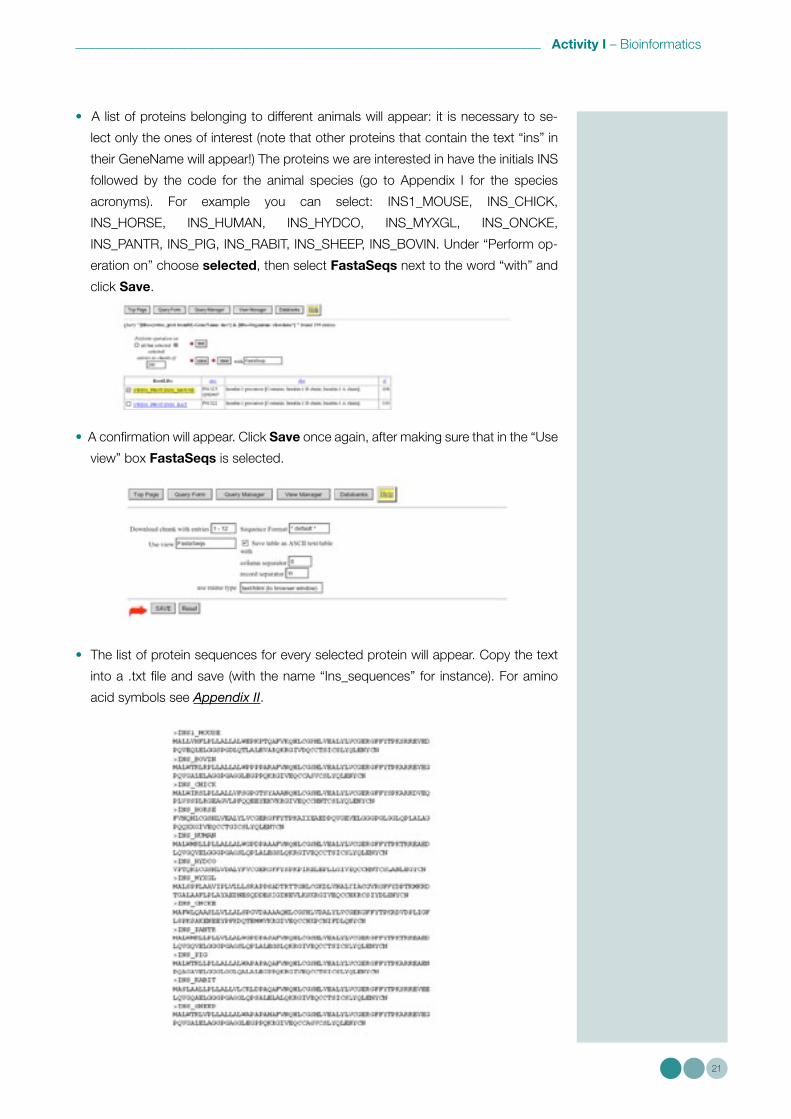
• A list of proteins belonging to different animals will appear: it is necessary to se-
lect only the ones of interest (note that other proteins that contain the text “ins” in
their GeneName will appear!) The proteins we are interested in have the initials INS
followed by the code for the animal species (go to Appendix I for the species
acronyms). For example you can select: INS1MOUSE, INSCHICK,
INSHORSE, INSHUMAN, INSHYDCO, INSMYXGL, INSONCKE,
INSPANTR, INSPIG, INSRABIT, INSSHEEP, INSBOVIN. Under “Perform op-
eration on” choose selected, then select FastaSeqs next to the word “with” and
click Save.
• A confirmation will appear. Click Save once again, after making sure that in the “Use
view” box FastaSeqs is selected.
• The list of protein sequences for every selected protein will appear. Copy the text
into a .txt file and save (with the name “Inssequences” for instance). For amino
acid symbols see Appendix II.
Activity I – Bioinformatics 3
22
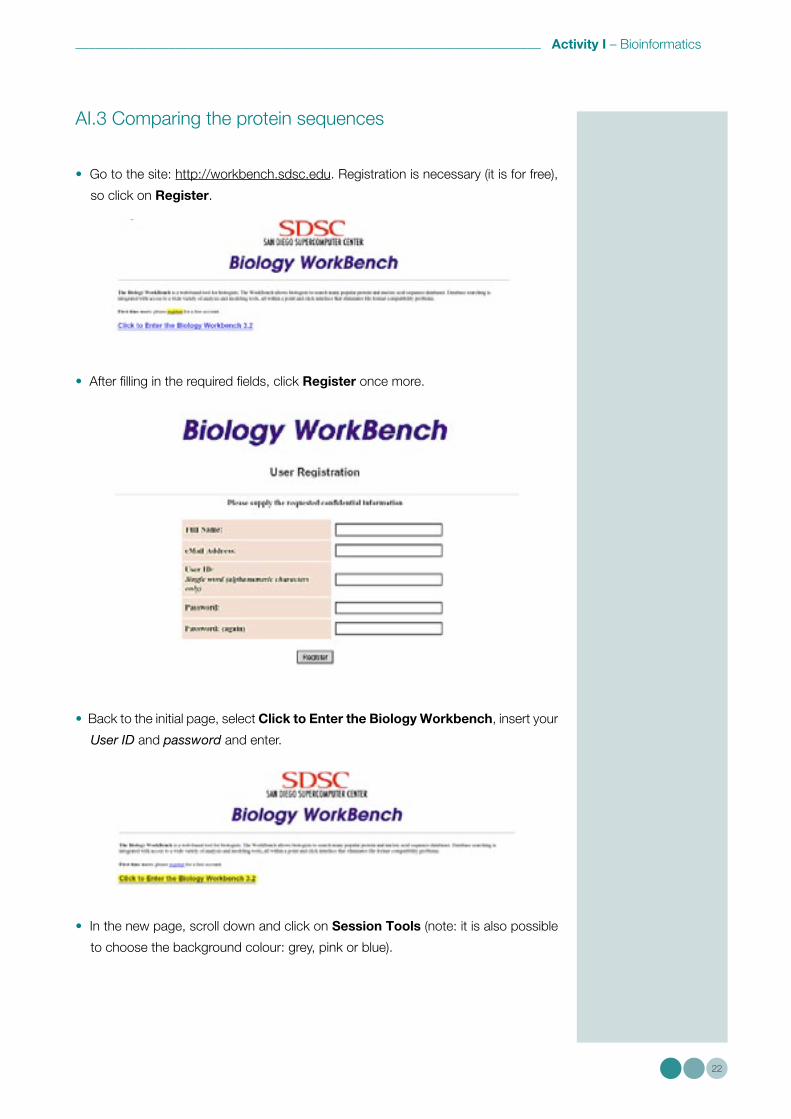
AI.3 Comparing the protein sequences
• Go to the site: http://workbench.sdsc.edu. Registration is necessary (it is for free),
so click on Register.
• After filling in the required fields, click Register once more.
• Back to the initial page, select Click to Enter the Biology Workbench, insert your
User ID and password and enter.
• In the new page, scroll down and click on Session Tools (note: it is also possible
to choose the background colour: grey, pink or blue).
Activity I – Bioinformatics 3
23
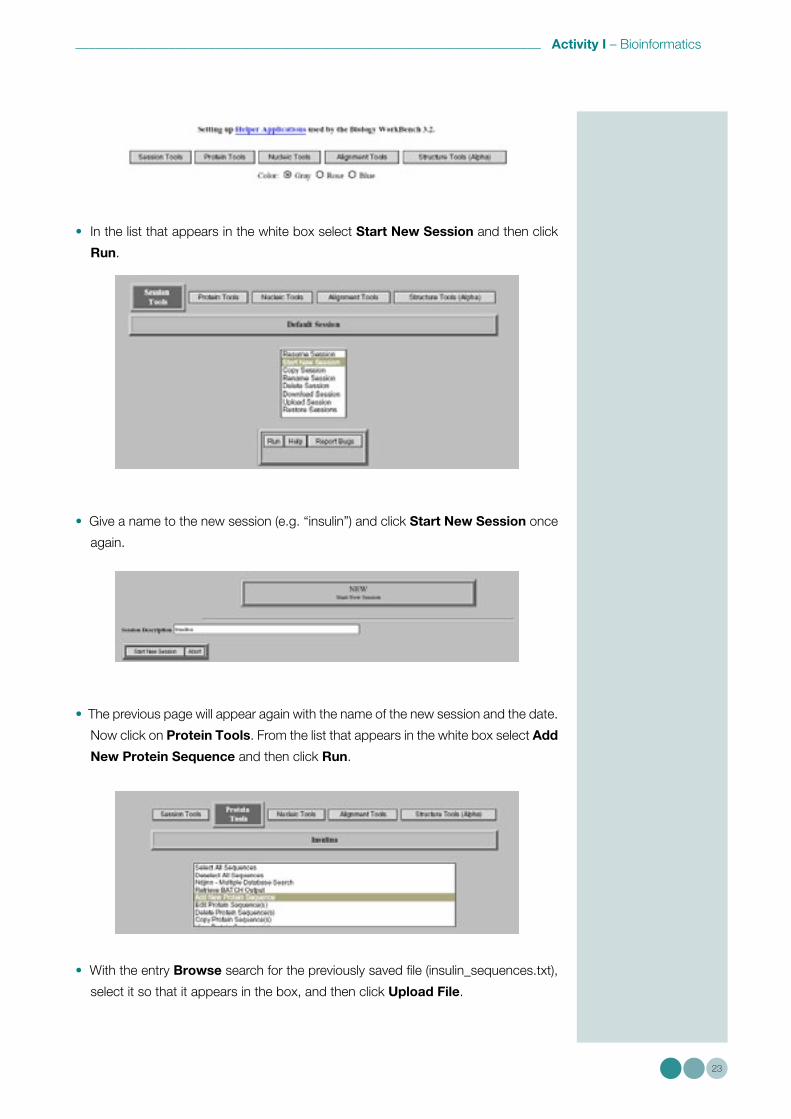
• In the list that appears in the white box select Start New Session and then click
Run.
• Give a name to the new session (e.g. “insulin”) and click Start New Session once
again.
• The previous page will appear again with the name of the new session and the date.
Now click on Protein Tools. From the list that appears in the white box select Add
New Protein Sequence and then click Run.
• With the entry Browse search for the previously saved file (insulinsequences.txt),
select it so that it appears in the box, and then click Upload File.

Activity I – Bioinformatics 3
24
• The sequences should now be imported, one by one, in Workbench (please verify
by scrolling down). Then click Save.
• At this point, the initial page of “Protein Tools” is updated with the name of the ses-
sion and the imported protein sequences.
First of all, we will try comparing two sequences, e.g. the human and chick. They
can be selected by ticking the box next to their name. In the central white box,
scroll down to the entry CLUSTALW – Multiple Sequence Alignment and select
it. Then click Run.
• The resulting page will show the selected sequences: confirm the choice by
clicking Submit. Otherwise, go back to the previous page and repeat the
selection.

Activity I – Bioinformatics 3
25
• In the new page, scroll down to the entry “Sequence alignment”. The amino ac-
ids in blue are those that are conserved in the sequences of the two species: the
corresponding symbol is a blue asterisk (*). In green (symbol :) the differences that
do not influence the structure of insulin are indicated. The dark blue symbol (.)
indicates the amino acids that influence the molecule’s structure. Finally, the amino
acids that are different in every species are indicated in black (no symbol).
Questions
1) Look at the human insulin: the A-chain is formed by 21 amino acids, the B-chain by
30. In the given sequence, are there really 51 amino acids in all?
2) Initially, insulin is synthesized in a form called “preproinsulin”, a 110 amino acid long
polypeptide, which contains additional sequences that will eventually be eliminated:
an amino-terminal “pre” sequence (signal peptide, 24 amino acids), which enables
the secretion of the protein, and a “pro” sequence (C peptide) that determines the
correct folding of the polypeptide chain. On the polypeptide chain the sequences
are placed in the following order: signal peptide – B-chain – C peptide – A-chain.
Identify the different segments in the human and chick protein sequence.
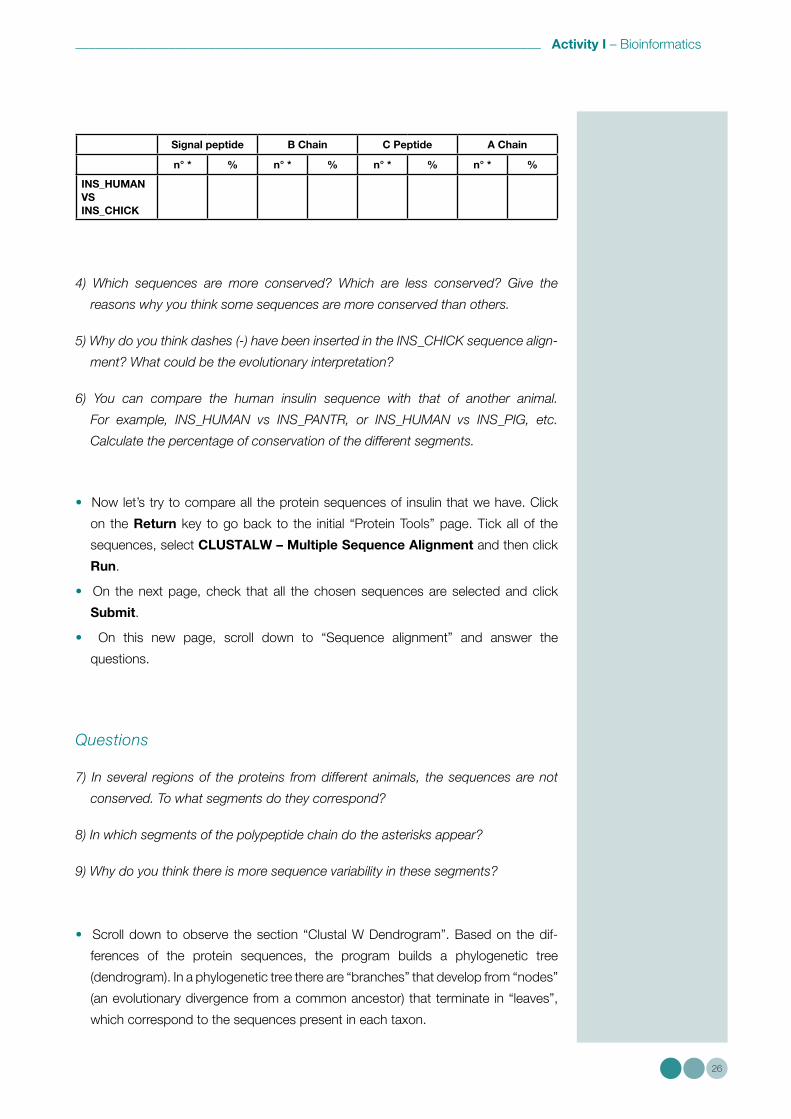
3) What is the percentage of homology in the different segments? Complete the table:
Activity I – Bioinformatics 3
26
Signal peptide B Chain C Peptide A Chain
n° * % n° * % n° * % n° * %
INS_HUMAN VS INS_CHICK
4) Which sequences are more conserved? Which are less conserved? Give the
reasons why you think some sequences are more conserved than others.
5) Why do you think dashes (-) have been inserted in the INS_CHICK sequence align-
ment? What could be the evolutionary interpretation?
6) You can compare the human insulin sequence with that of another animal.
For example, INS_HUMAN vs INS_PANTR, or INS_HUMAN vs INS_PIG, etc.
Calculate the percentage of conservation of the different segments.
• Now let’s try to compare all the protein sequences of insulin that we have. Click
on the Return key to go back to the initial “Protein Tools” page. Tick all of the
sequences, select CLUSTALW – Multiple Sequence Alignment and then click
Run.
• On the next page, check that all the chosen sequences are selected and click
Submit.
• On this new page, scroll down to “Sequence alignment” and answer the
questions.
Questions
7) In several regions of the proteins from different animals, the sequences are not
conserved. To what segments do they correspond?
8) In which segments of the polypeptide chain do the asterisks appear?
9) Why do you think there is more sequence variability in these segments?
• Scroll down to observe the section “Clustal W Dendrogram”. Based on the dif-
ferences of the protein sequences, the program builds a phylogenetic tree
(dendrogram). In a phylogenetic tree there are “branches” that develop from “nodes”
(an evolutionary divergence from a common ancestor) that terminate in “leaves”,
which correspond to the sequences present in each taxon.
Activity I – Bioinformatics 3
27
The length of a branch indicates the estimated time since the divergence took place.
There are two types of phylogenetic trees: “rooted trees” and “unrooted trees”.
In the first case, an event that is evolutionarily distant from the others is taken as the
starting point (the root); in the second case, this reference is absent, and the tree
can be useful for examining the phylogenetic distance between defined groups of
organisms.
• Observe the phylogenetic tree and answer the following questions.
Questions
10) Examining the unrooted tree: which two species are most related to each other?
Explain why.
11) The lengths of the “branches” give an idea of the evolutionary dis-
tance: after printing out the dendrogram, use a ruler to determine the
evolutionary distance in mm between man and the other animals:
- man and horse: … … … … … … … … … . .
- man and chimeara: … … … … … … … … … . .
- man and rabbit: … … … … … … … … … . .
- man and pig: … … … … … … … … … . .
- man and hagfish: … … … … … … … … … . .
- man and cow: … … … … … … … … … . .
- man and sheep: … … … … … … … … … . .
- man and chick: … … … … … … … … … . .
- man and salmon: … … … … … … … … … . .
- man and chimpanzee: … … … … … … … … … . .
- man and mouse: ………………………..
12) Is the sheep insulin phylogenetically closer to the chick or to the human insulin?
13) What evolutionary relationship is there between pig, sheep and cow?
14) Based on what you now know, comment on the significance of these results.
• Now scroll down to the bottom of the page and click on Import Alignments.
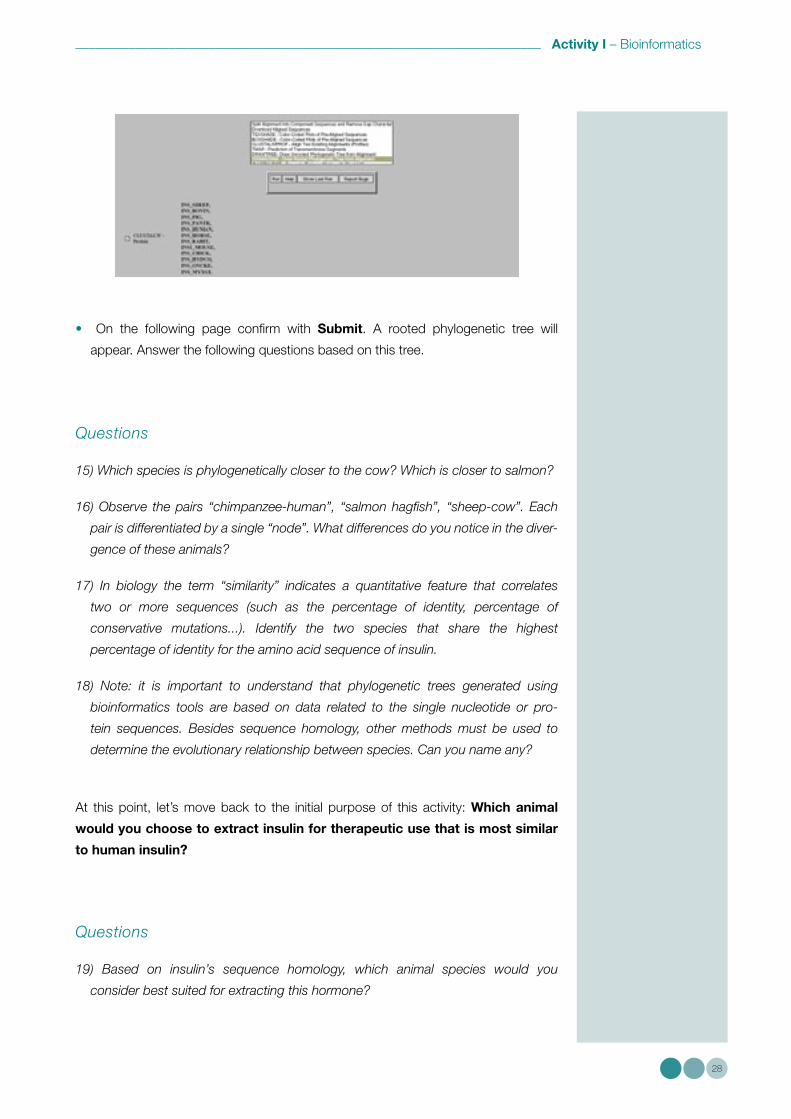
• Tick the box on the left of CLUSTALW – Protein and then select, in the central
white box, DRAWGRAM – Draw Rooted Phylogenetic Tree from Alignment.
Click Run.
Activity I – Bioinformatics 3
28
• On the following page confirm with Submit. A rooted phylogenetic tree will
appear. Answer the following questions based on this tree.
Questions
15) Which species is phylogenetically closer to the cow? Which is closer to salmon?
16) Observe the pairs “chimpanzee-human”, “salmon hagfish”, “sheep-cow”. Each
pair is differentiated by a single “node”. What differences do you notice in the diver-
gence of these animals?
17) In biology the term “similarity” indicates a quantitative feature that correlates
two or more sequences (such as the percentage of identity, percentage of
conservative mutations...). Identify the two species that share the highest
percentage of identity for the amino acid sequence of insulin.
18) Note: it is important to understand that phylogenetic trees generated using
bioinformatics tools are based on data related to the single nucleotide or pro-
tein sequences. Besides sequence homology, other methods must be used to
determine the evolutionary relationship between species. Can you name any?
At this point, let’s move back to the initial purpose of this activity: Which animal
would you choose to extract insulin for therapeutic use that is most similar
to human insulin?
Questions
19) Based on insulin’s sequence homology, which animal species would you
consider best suited for extracting this hormone?
Activity I – Bioinformatics 3
29
20) Do you think the use of this animal could raise ethical and commercial issues
(consider whether this species is widespread, easy to breed, or an endangered
species, etc.)?
21) Based on these considerations, and keeping homology in mind, which animal
could then be the ideal “donor”?
AI.4 Visualizing the tridimensial structure
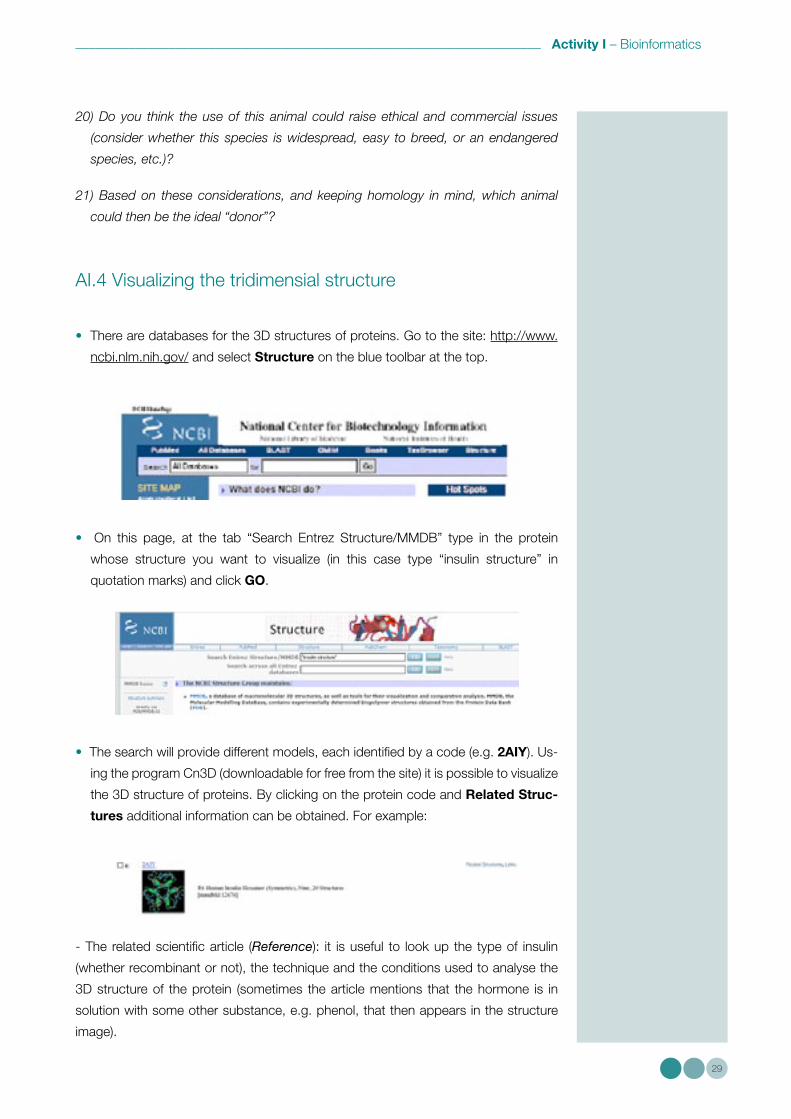
• There are databases for the 3D structures of proteins. Go to the site: http://www.
ncbi.nlm.nih.gov/ and select Structure on the blue toolbar at the top.
• On this page, at the tab “Search Entrez Structure/MMDB” type in the protein
whose structure you want to visualize (in this case type “insulin structure” in
quotation marks) and click GO.
• The search will provide different models, each identified by a code (e.g. 2AIY). Us-
ing the program Cn3D (downloadable for free from the site) it is possible to visualize
the 3D structure of proteins. By clicking on the protein code and Related Struc-
tures additional information can be obtained. For example:
- The related scientific article (Reference): it is useful to look up the type of insulin
(whether recombinant or not), the technique and the conditions used to analyse the
3D structure of the protein (sometimes the article mentions that the hormone is in
solution with some other substance, e.g. phenol, that then appears in the structure
image).

Activity I – Bioinformatics 3
30
- Information on the polypeptide chains that are viewed (Biopolymer chains page).
Pointing to the different chains, the number of amino acids will appear. In addition,
the chain is put in the context of the protein family it belongs to (red sequence).
For example, insulin belongs to the “IGFlike family” (protein family similar to the
“Insulin-like Growth Factor”), in the subgroup “insulin-like” of vertebrates. The site
shows that this family includes insulin and the insulinlike growth factors I and II,
which are peptides with multiple functions in control processes such as metabo-
lism, growth, differentiation and reproduction. At the cellular level, they regulate the
cell cycle, apoptosis, cell migration and differentiation. With the exception of In-
sulin-like Growth Factor, the active forms of these peptide hormones are made of
two chains (A and B) bound by two disulphide bridges. In particular, in the A-chain
the position of the four cysteine residues is highly conserved: Cys1 forms a disul-
phide bridge inside the chain with Cys3, while Cys2 and Cys4 bind to cysteine resi-
dues of the B-chain. In all cases, the two chains are formed from one propeptide.
- Indication of the solvent that may be present, at the entry Ligand (e.g. phenol).
• By clicking directly on the image, the 3D structure of insulin is displayed
(2AIY – Cn3D 4.1) and, in a separate window, the protein sequences of
the imaged chains (2AIY – Sequence/Alignment Viewer) are reported.
Specifically, the chosen image 2AIY shows the 3D structure of a hexamer, i.e. of
the molecular complex obtained from the association of six insulin monomers, each
one formed by the A- and B-chains. As the complex has trigonal symmetry, it can
also be interpreted as the association of three insulin dimers.
• By clicking and moving the mouse over any part of the figure while keeping the left
mouse button pressed, the image can be rotated in any direction.
Activity I – Bioinformatics 3
31
• Two options are possible:
- By going to Style_Rendering Shortcuts in the menu, the type of model can be
chosen (ball and stick, tubular, etc.). On selecting worms a wormlike structure,
which is easy to interpret, is obtained.
- By going to Style_Coloring Shortcuts the type of colouring can be selected:
Secondary Structure highlights with different colours the a-helix and β-sheet
structures; Molecule associates a different colour to each polypeptide chain;
Hydrophobicity highlights the hydrophilic and hydrophobic regions, Charge the
charges, etc.
- Using Style _ Favorites _ Add/Replace, the image can be saved with a name in
the favourites.
- Using Style _ Edit Global Style, the global settings can be viewed and modified:
in Settings the model type, the colours of chains and background can be modi-
fied. You can also decide whether to view external molecules (e.g. zinc ions, phe-
nol, etc.), the objects that represent the secondary structure, and the disulphide
bridges. To get familiar with the various style options, select and deselect them and
observe how the image changes. In Labels the names of the amino acids can be
viewed (under “Spacing” you can decide whether to label each amino acid, or one,
two, three, etc.). In Details the sizes of the model type can be changed (e.g. the
diameter of the worm-like structure).
- In Show/Hide _ Pick Structures you can decide whether to view all of the chains,
or just a few. This can be useful for identifying the A- and B-chains in each mono-
mer.
- With View _ Animation _ Spin the model will rotate automatically.
• We propose the following activity.
Questions
22) In Figure 2AIY select Style _ Coloring Shortcuts and choose the co-
lour mode molecule. With Show/Hide _ Pick Structures ... view only a sin-
gle monomer of insulin (A- and B- chain), and using Style _ Edit Glob-
al Style eliminate external molecules and the objects indicating the a-helix.
Orient the monomer so as to be able to view it comfortably. In the window 2AIY -
Sequence/Alignment Viewer select the last 3 aa of the B-chain (P-K-T, i.e. proline-
lysine-threonine): they will be highlighted in yellow on the image. Without closing the
image, go back to http://www.ncbi.nlm.nih.gov/Structure/ to search for the struc-
ture of a recombinant insulin, the Lyspro insulin for instance. To do this you can type
“Lys pro – human insulin” (in quotation marks!). Several mutant insulin molecules
will appear. The one we are interested in has the code 1LPH: Lys(B28)pro(B29)
-Human Insulin, which means human recombinant insulin obtained by placing a ly-
Activity I – Bioinformatics 3
32
sine residue in position 28 of the B-chain and a proline in position 29 of the B-chain.
Open the 3D image, view one monomer only as for the 2AIY insulin, and in the box
1LPH - Sequence/Alignment Viewer highlight the last 3 aa of the B-chain (K-P-T).
Compare the two proteins: to get a better view of the angles, select the tubular
model in Style _ Rendering Shortcuts; going on Show/Hide _ Show Selected Resi-
dues you can delete the chains except for the selected amino acids.
23) What difference do you observe?
24) It is possible to repeat this exercise comparing the human insulin with another
recombinant obtained from the database search.
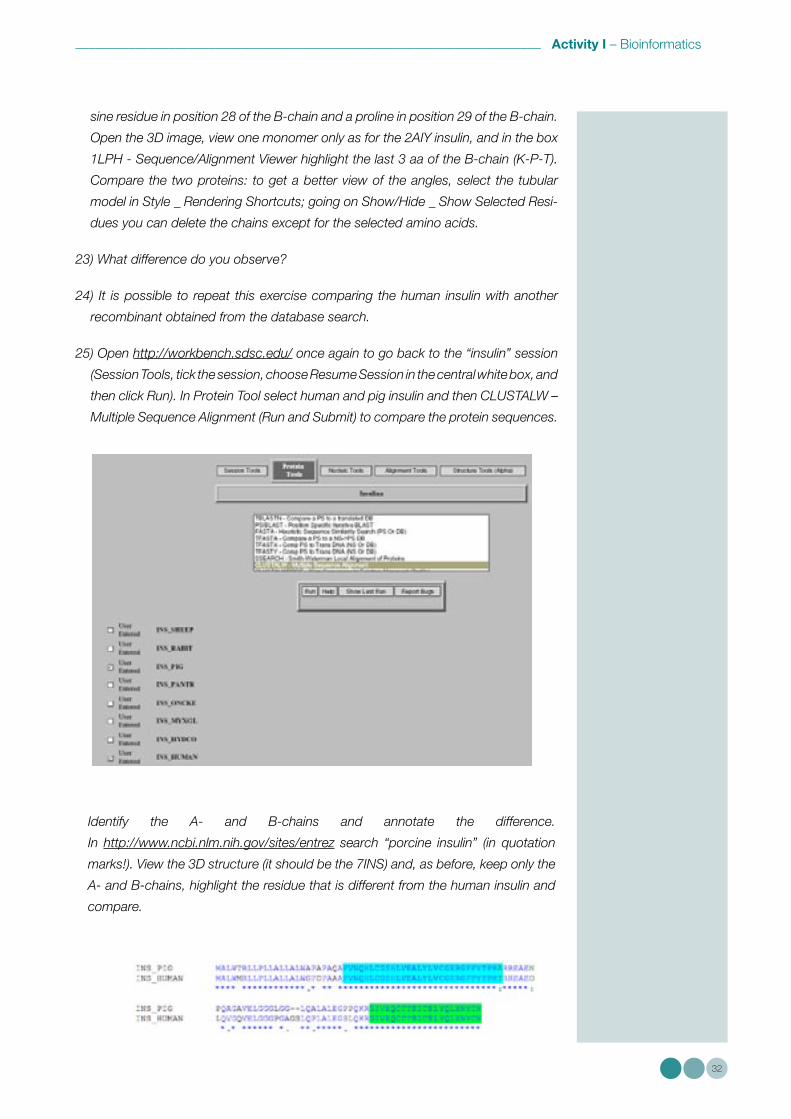
25) Open http://workbench.sdsc.edu/ once again to go back to the “insulin” session
(Session Tools, tick the session, choose Resume Session in the central white box, and
then click Run). In Protein Tool select human and pig insulin and then CLUSTALW –
Multiple Sequence Alignment (Run and Submit) to compare the protein sequences.
Identify the A- and B-chains and annotate the difference.
In http://www.ncbi.nlm.nih.gov/sites/entrez search “porcine insulin” (in quotation
marks!). View the 3D structure (it should be the 7INS) and, as before, keep only the
A- and B-chains, highlight the residue that is different from the human insulin and
compare.

33
4 Therapy with Recombinant Insulin
4.1 Towards recombinant Insulin
Some fundamental scientific discoveries of the past century led to the production of human recombinant insulin and
revolutionized the treatment of diabetes.
4.1.1 Restriction enzymes
In 1962 Werner Arber, a Swiss biochemist, proved the existence of what he called “molecular scissors”, i.e. pro-
teins capable of cutting DNA. Arber showed that the E. coli bacterium is equipped with an enzymatic immune
system capable of recognizing and destroying exogenous DNA and modifying its own native DNA to avoid its
degradation. Arber and his colleagues (Daniel Nathans and Hamilton Smith) called this group of proteins
“restriction enzymes” and in 1978 they received the Nobel Prize in Medicine for their discovery. They also showed
that the activity of these enzymes is controlled: each enzyme targets a specific DNA sequence (also called
consensus site or restriction site), which it recognizes and cuts.
4.1.2 Ligases
Shortly after Arber’s discovery, Arthur Kornberg discovered that is was possible to join together fragments of DNA
by using an enzyme that he called “DNA ligase”.
Kornberg was trying to construct an artificial viral DNA from fragments of viral DNA, but until then had been
unable to synthesize biologically active molecules. However, after adding the ligase, he realized that the en-
zyme was capable of joining together fragments of DNA and re-establishing phosphodiester bonds between the
nucleotides.
The artificial DNA was biological active, as it was able to replicate autonomously. Therefore, Kornberg was
considered by the scientific community to be the scientist who was “able to generate life in a test tube”.
The drawback of using animal insulin for therapy, besides not being able to
satisfy the demand, was that it triggered an immune response in some patients.
The production of semi-synthetic insulin only partly solved the problem, as it still
depended on the availability of porcine insulin. The possibility to obtain unlim-
ited quantities of human insulin would, therefore, make a strong impact on the
pharmaceutical market.
Therapy with Recombinant Insulin 4
34
4.1.3 Cloning
By the end of the 1960s, the techniques to cut and ligate DNA had been refined.
However, scientists were still searching for a mechanism to copy DNA, in order to
obtain sufficient amounts to work with.
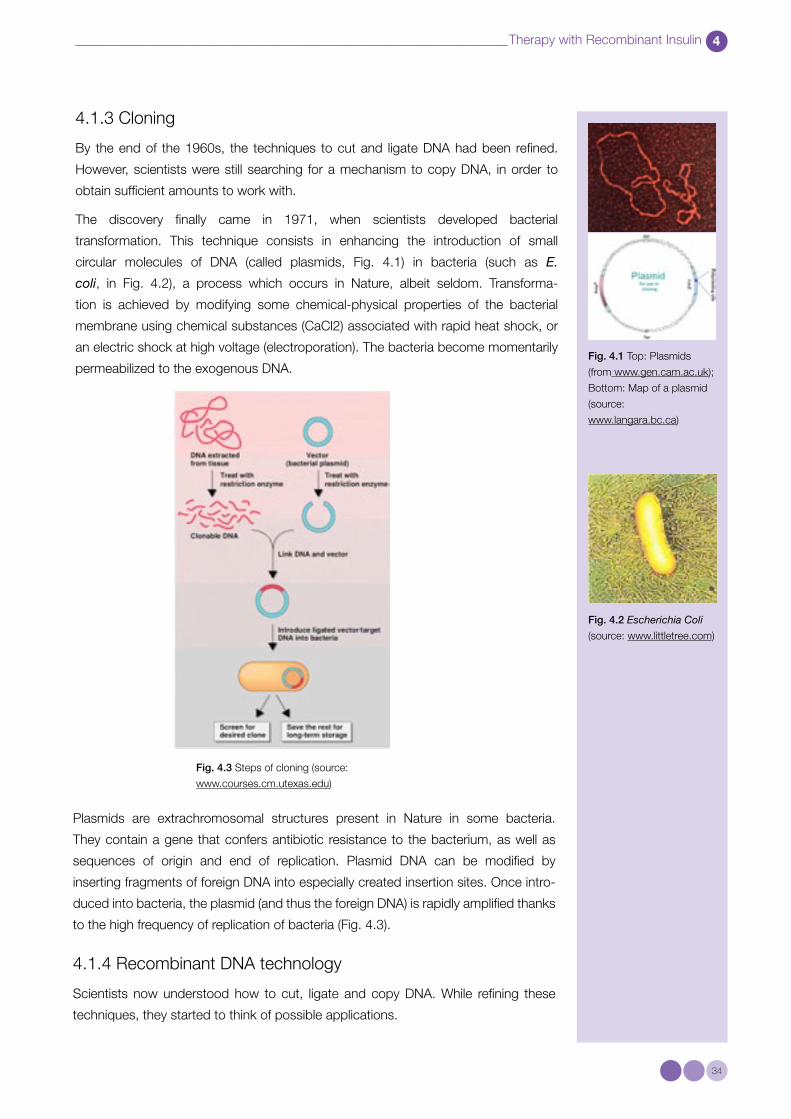
The discovery finally came in 1971, when scientists developed bacterial
transformation. This technique consists in enhancing the introduction of small
circular molecules of DNA (called plasmids, Fig. 4.1) in bacteria (such as E.
coli, in Fig. 4.2), a process which occurs in Nature, albeit seldom. Transforma-
tion is achieved by modifying some chemical-physical properties of the bacterial
membrane using chemical substances (CaCl2) associated with rapid heat shock, or
an electric shock at high voltage (electroporation). The bacteria become momentarily
permeabilized to the exogenous DNA.Fig. 4.1 Top: Plasmids
(from www.gen.cam.ac.uk);
Bottom: Map of a plasmid
(source:
www.langara.bc.ca)
Plasmids are extrachromosomal structures present in Nature in some bacteria.
They contain a gene that confers antibiotic resistance to the bacterium, as well as
sequences of origin and end of replication. Plasmid DNA can be modified by
inserting fragments of foreign DNA into especially created insertion sites. Once intro-
duced into bacteria, the plasmid (and thus the foreign DNA) is rapidly amplified thanks
to the high frequency of replication of bacteria (Fig. 4.3).
4.1.4 Recombinant DNA technology
Scientists now understood how to cut, ligate and copy DNA. While refining these
techniques, they started to think of possible applications.
Fig. 4.2 Escherichia Coli
(source: www.littletree.com)
Fig. 4.3 Steps of cloning (source:
www.courses.cm.utexas.edu)
Therapy with Recombinant Insulin 4
35
The term “recombinant DNA” (rDNA) defines a DNA sequence which has been artifi-
cially obtained by combining genetic material from different organisms, as is the case
for a plasmid containing a gene of interest.
Recombinant DNA technology is based on the discovery (by Herbert W. Boyer
and Stanley Cohen at the beginning of the 1970s) that genes – in their study hu-
man genes – can be inserted into plasmids and then into bacteria, where they are
continuously activated producing functional proteins. Recombinant DNA heralded a
new era in biology.
The concept that DNA continues to function when it is transferred from one
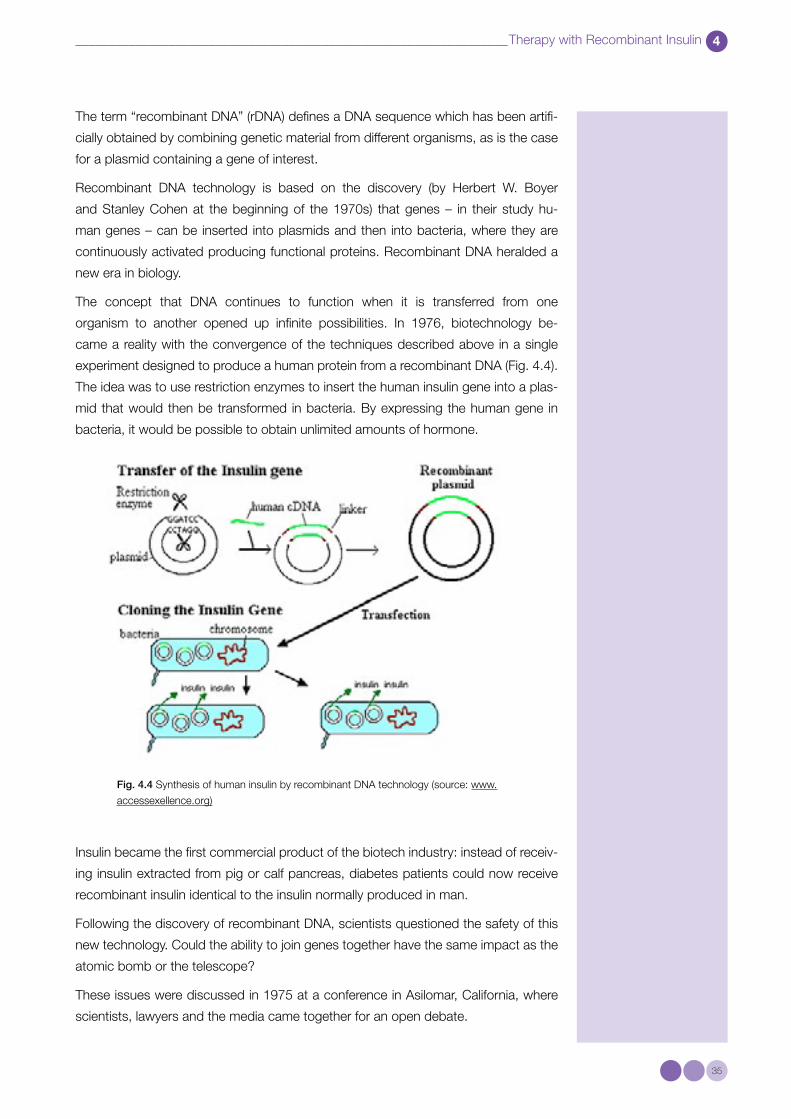
organism to another opened up infinite possibilities. In 1976, biotechnology be-
came a reality with the convergence of the techniques described above in a single
experiment designed to produce a human protein from a recombinant DNA (Fig. 4.4).
The idea was to use restriction enzymes to insert the human insulin gene into a plas-
mid that would then be transformed in bacteria. By expressing the human gene in
bacteria, it would be possible to obtain unlimited amounts of hormone.
Fig. 4.4 Synthesis of human insulin by recombinant DNA technology (source: www.
accessexellence.org)
Insulin became the first commercial product of the biotech industry: instead of receiv-
ing insulin extracted from pig or calf pancreas, diabetes patients could now receive
recombinant insulin identical to the insulin normally produced in man.
Following the discovery of recombinant DNA, scientists questioned the safety of this
new technology. Could the ability to join genes together have the same impact as the
atomic bomb or the telescope?
These issues were discussed in 1975 at a conference in Asilomar, California, where
scientists, lawyers and the media came together for an open debate.

Therapy with Recombinant Insulin 4
36
The meeting ended in the dissemination of guidelines that allowed researchers to use
only certain types of bacteria considered to be “safe” and restricted the use of mam-
malian DNA, measures equivalent to today’s restrictions on the use of the Ebola virus.
Five years later these restrictions were amended, allowing considerable progress to
be made in the field of mammalian research.
4.2 Synthesis of human recombinant insulin
In the 1970s two biotech companies — Genentech and Biogen — accepted the
challenge to synthesize insulin using recombinant DNA technology. Although the idea
appeared simple, there were substantial problems. Nobody knew the nucleotide se-
quence of human insulin and, as previously mentioned, after the Asilomar conference
severe restrictions had been imposed on the production of human recombinant DNA.
Two strategies were used to obtain the nucleotide sequence of insulin and transfer
it into bacteria. In the end, only one strategy and one of the two companies was
successful.
4.2.1 Genentech strategy
In order to synthesize human insulin using recombinant DNA technology, the se-
quence of insulin DNA was necessary. The amino acid sequence of insulin was
known. Genentech scientists deduced the nucleotide sequence of human insu-
lin from the amino acid sequence. The deduced sequence was then generated,
inserted into a plasmid and introduced into bacteria by transformation to produce
insulin.
In this way, scientists assembled the sequence of human insulin without even using
human DNA, allowing them to circumvent the restrictions on human recombinant
DNA from the Asilomar conference.
4.2.2 Biogen strategy
To obtain human insulin, Walter Gilbert and his group at Biogen decided to isolate
the DNA sequence that encodes human insulin. The sequence of rat insulin was
already known. The sequences of human and rat insulin are very similar. It
was therefore possible to use the rat sequence as a probe to isolate the human
sequence. To do this, the researchers used a “library” of human DNA sequences
enclosed in bacteriophages. The rat sequence was labelled with radioactivity and
used as a probe to recognize the phage that contained the sequence of human insu-
lin. At this point, the DNA sequence was isolated and introduced into bacteria.
Although promising, this second strategy failed. The sequence that had been ampli-
fied by the scientists was not that of human insulin, but rat insulin, owing to a contami-
nation during the course of the experiments.
Therapy with Recombinant Insulin 4
37
4.3 Production of recombinant insulin
To produce insulin (or any other eukaryotic protein) in bacteria, several factors need to
be considered: the genes of eukaryotes (such as man) contain sequences called in-
trons that do not encode any protein. Bacteria do not have introns in their genes, and
therefore do not possess the biochemical apparatus necessary to remove the introns.
Another point to consider is that some eukaryotic proteins are processed after trans-
lation. This is the case for insulin, which is initially translated as preproinsulin and
through subsequent passages of maturation reaches the final sequence and confor-
mation. In bacteria such maturation processes do not take place, therefore alternative
solutions had to be found.
4.3.1 Insulin from bacteria
The production of recombinant proteins can be carried out in different systems: bac-
teria, yeast, insect cells and mammalian cells. Bacterial cells have the advantage of
being simple to handle; they have a short replication time and produce high yields at
low production costs.
To produce insulin from bacteria, scientists used two different methods:
a) Method of the two chains
This was the first method used by Genentech in collaboration with Eli Lilly and Com-
pany. As previously mentioned, one DNA strand was synthesized based on the amino
acid sequence of the A- and B-chains. An enzyme called DNA polymerase was then
used to synthesize the complementary strand of DNA. In this way, the two DNA frag-
ments that needed to be inserted into the plasmids were generated.
Each fragment is then inserted into a plasmid inside the gene that encodes
β-galactosidase (LacZ), so that the bacteria produce high quantities of fusion protein
containing the insulin sequence fused to the end of the β-galactosidase enzyme. The
plasmid also contains the gene for the resistance to the antibiotic tetracycline. Plas-
mids are transformed in the bacteria, and tetracycline is added to inhibit the growth
of nontransformed bacteria.
The transformed bacteria grow and the β-galactosidaseinsulin fusion protein is ex-
tracted and purified. The insulin chains are separated from the β-galactosidase
by treating them with cyanogen bromide, a chemical that cuts peptide bonds
following methionine residues. Since a methionine residue is inserted between the
β-galactosidase and the insulin chains in the fusion proteins, the treatment with cy-
anogen bromide produces intact insulin chains, detached from the fusion proteins.
Finally, the two protein chains are mixed together, and under ideal conditions the
disulphide bridges form. Thus, functional human insulin was synthesized in bacteria.

Therapy with Recombinant Insulin 4
38
b) The proinsulin method
The strategy of the two chains was
later modified by producing a single
β-galactosidase-insulin fusion protein,
which can be cut in a single step, re-
leasing mature insulin. This method
consists in the synthesis of the pro-
insulin cDNA from its mRNA, modify-
ing its sequence by adding a codon at
the 5’ end coding for methionine. The
modified cDNA is then inserted in a
plasmidic gene (such as LacZ, used in
the previous method) and amplified in
bacteria. The proinsulin, which is pro-
duced in the bacteria, is then separated
from the β-galactosidase enzyme by
degrading the methionine residue. The
chain is then induced to refold, which
allows the formation of the disulphide
bridges, and the C peptide is cut off by
an enzymatic reaction that produces the
mature protein.
Fig. 4.5 Production of recombinant insulin - method of
the two chains (source: www.zanichelli.it)
Fig. 4.6 The proinsulin method (source: Recom-
binant DNA - a short course; Watson JD et al,
1983)

Therapy with Recombinant Insulin 4
39
4.3.2 Insulin from yeast
In order to simplify the purification process, scientists decided to devise a method in
which insulin would be directly secreted in the culture media after its production inside
the cell. For this they used yeast rather than bacteria.
Yeast is a eukaryote, i.e. an organism that has a nucleus and is therefore capable of
completing the maturation process of human insulin. The proinsulin sequence is in-
serted into a plasmid and the recombinant plasmid is transformed in yeast. The yeast
can, at this point, produce proinsulin, which is processed in the same way as in hu-
mans (Fig. 4.7). The proinsulin folds into a closed structure and the disulphide bridges
between the cysteine residues can form normally. The pro-sequence of 33 amino ac-
ids is removed normally releasing the mature protein. Novo Nordisk S/A was the first
company to obtain proinsulin secreted from the yeast Saccharomyces cerevisiae.
Today there are different categories of insulin: rapid-acting, short-acting or regular,
intermediate-acting, long-acting and premixed. Although the principle of action is the
same, the rate at which they are absorbed are different.
Fig. 4.7 Insulin production from yeast (source:
www.accessexellence.org)
Therapy with Recombinant Insulin 4
40
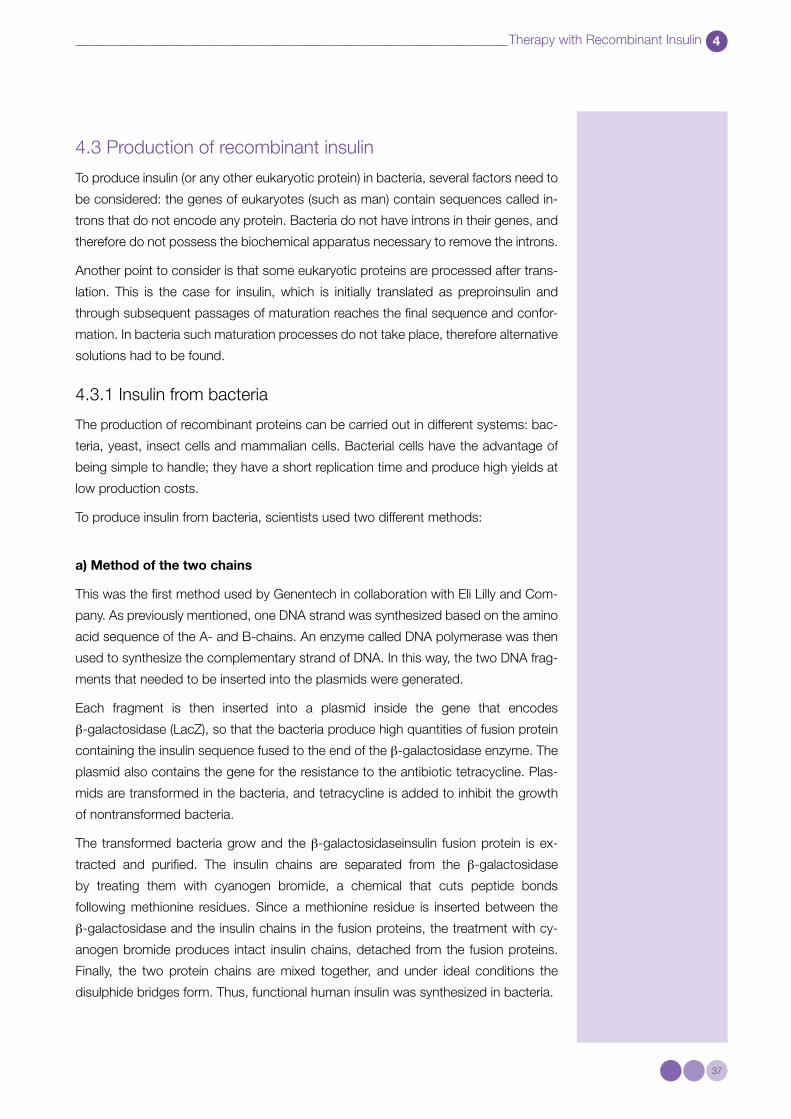
From a clinical point of view, monomers and dimers diffuse more rapidly in the
blood compared to the hexameric form. Insulin preparations containing a major-
ity of hexamers are absorbed more slowly. Therefore, researchers aimed at obtain-
ing molecules of recombinant insulin with reduced tendency to form dimers and
hexamers. This is the case for “Lispro” or “intelligent insulin”, which is obtained by
inverting lysine and proline residues at the C-terminal end of the B-chain (Fig. 4.8):
this modification allows a more rapid absorption of the hormone without altering the
site for the receptor.
Fig. 4.8 Lispro Insulin (source:
www.minerva.unito.it)
In the past few years, while optimizing the administration procedures of the
hormone, new schemes for rational treatment have been developed. The possibility
of combining insulins with different absorption rate allowed the achievement of good
glycemic control. A crucial point is to use rapid-acting insulin at meal times, and
long-acting insulin to cover the nocturnal insulin requirements and the hyperglycemic
periods during the day.

41
Activity II – Molecular Biology
Activity II – Molecular Biology Simulation of recombinant insulin synthesis
AII.1 Introduction
Today, the insulin gene can be isolated from the genome using the technique called
Polymerase Chain Reaction (PCR).
Up to the mid 1980s, the only way to obtain DNA copies was to insert different DNA
fragments into bacteria and select the desired fragment amongst countless colonies
grown on a plate. In 1985, Kary Mullis invented a new, extremely precise, method
to select and amplify a DNA segment. It is commonly called PCR, and Mullis was
awarded the Nobel Prize for Chemistry in 1993 for his groundbreaking invention.
PCR enables the amplification of nucleic acid fragments, provided that the initial and
terminal nucleotide sequences of these fragments are known. PCR amplification al-
lows rapid, in vitro production of large amounts of genetic material. Once isolated,
the insulin gene can be modified at its ends by adding on sequences recognized by
a restriction enzyme. The same enzyme also recognizes a specific sequence on the
plasmid. The restriction enzyme cuts both the plasmid and the insulin gene ends in a
specific and asymmetric manner, producing sticky ends that facilitate the insertion of
the gene into the plasmid (Fig. AII.1).
Fig. AII.1 Construction of the recombinant plasmid
42
Activity II – Molecular Biology 4
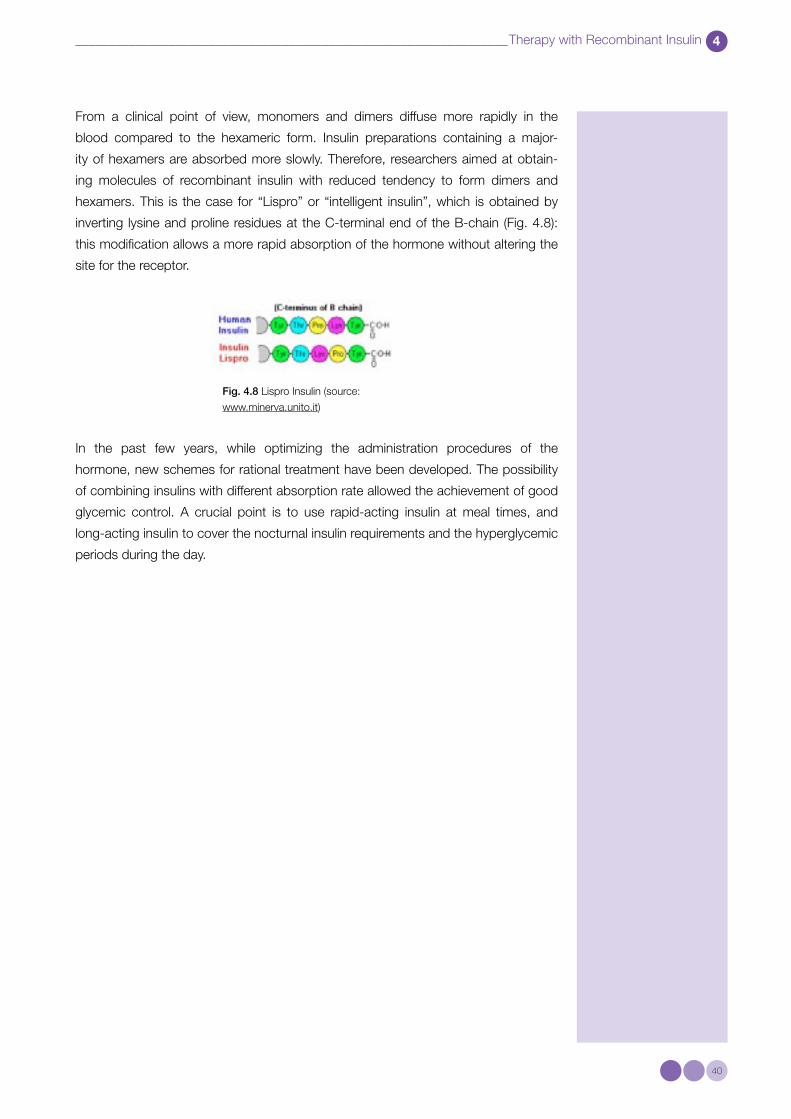
Fig. AII.2 Integration of the recombinant plasmid in the bacterial cells
The recombinant plasmid is then integrated in the bacterial cell (through the process
called transformation Fig. AII.2). The plasmid contains all the necessary elements for
the transcription of the insulin gene, which will then be translated by the bacterial
translational machinery.
AII.2 Protocol
For this activity, each group will receive a test tube (TUBE A) containing the different
recombinant plasmids obtained by the insertion of the insulin gene into a plasmid,
after they have been digested by the same restriction enzyme.
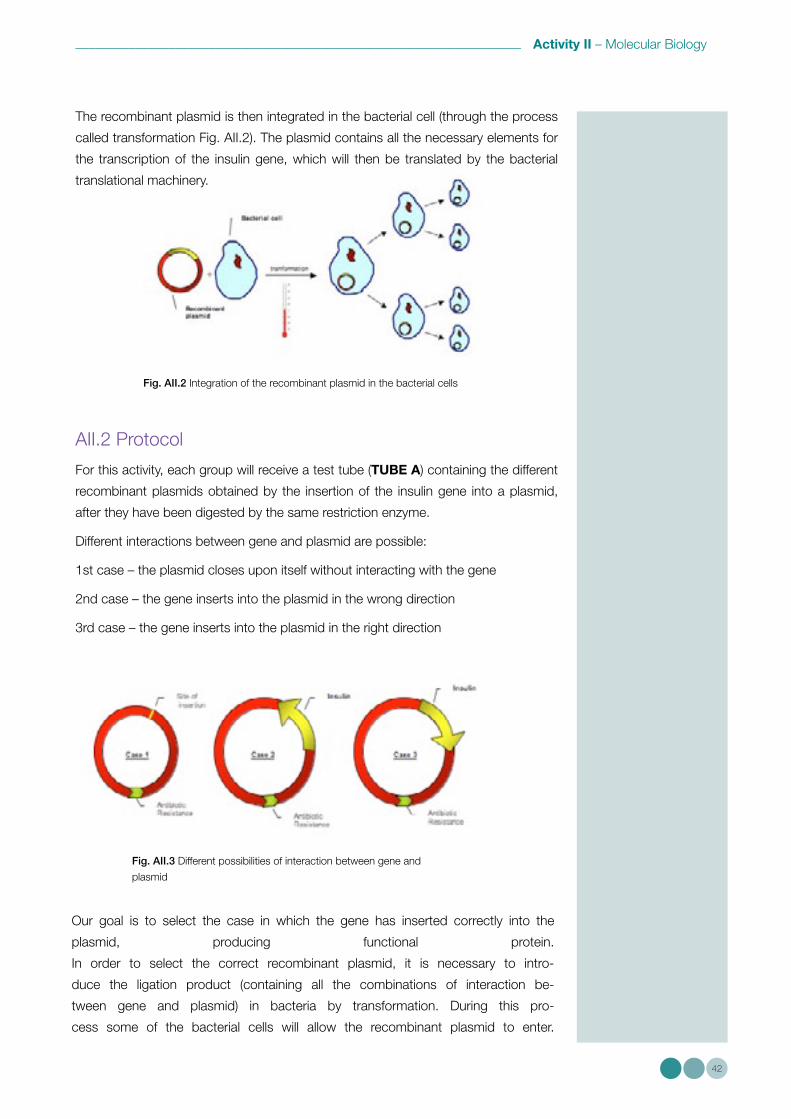
Different interactions between gene and plasmid are possible:
1st case – the plasmid closes upon itself without interacting with the gene
2nd case – the gene inserts into the plasmid in the wrong direction
3rd case – the gene inserts into the plasmid in the right direction
Fig. AII.3 Different possibilities of interaction between gene and
plasmid
Our goal is to select the case in which the gene has inserted correctly into the
plasmid, producing functional protein.
In order to select the correct recombinant plasmid, it is necessary to intro-
duce the ligation product (containing all the combinations of interaction be-
tween gene and plasmid) in bacteria by transformation. During this pro-
cess some of the bacterial cells will allow the recombinant plasmid to enter.

Activity II – Molecular Biology
43
First of all, each group will have to do a transformation to introduce the dif-
ferent recombinant plasmids (TUBE A) into the bacterial cells (TUBE B).
The next step consists of increasing the temperature suddenly to enhance the
entrance of the plasmids into the bacteria.
1. Take 3 μl from TUBE A and mix with 50 μl bacteria.
2. Shake the tube by tapping the side with finger, and incubate on ice for 30 min.
The next step consists of increasing the temperature suddenly to enhance the
entrance of the plasmids into the bacteria.
3. After incubation on ice, transfer the tube to 42°C for 2 min.
4. Then immediately transfer the tube to ice once more for 2 min.
5. Add 500 μl LB buffer to the tube and incubate at 37°C for 30 min. This helps the
transformed bacteria recover from the heat shock and gives them time to express
the gene for antibiotic resistance.
6. Centrifuge the tube at 3000 rpm for 1 min. Remove 500 μl supernatant. Mix the
remaining content of the tube thoroughly.
7. Transfer 50 μl of the tube content onto an agar plate (containing the
antibiotic) and spread onto the surface of the plate with a cell spreader.
8. Incubate the plate (upside down) at 37°C, overnight.
The plasmid contains a gene that confers the bacteria with resistance to a specific
antibiotic. As a result, the bacteria that have incorporated the plasmid will be able
to grow in the presence of the antibiotic. Growing on the plate, the bacteria form
colonies of identical cells. Each colony is derived from a different cell. Therefore, each
colony contains a different recombinant plasmid. Our goal is to find a bacterial colony
that contains the plasmid with the gene inserted correctly: these cells will be able to
produce recombinant insulin.
On the following day, you will be able to see how many colonies have grown on the
plate after transformation.
At this point, we can analyse the colonies and select those that incorporated the
correct plasmid during transformation. To do this, the colonies must be grown
separately in order to let the bacteria amplify in suspension.
9. Each member of the group must pick a colony from the plate and transfer it to
a tube containing 3 ml LB buffer containing the antibiotic.
10. Incubate the bacteria at 37°C overnight to let them grow.

Activity II – Molecular Biology
44
The next day, the plasmid DNA must be isolated and purified from the bacterial sus-
pension.
11. Pour 2 ml bacterial suspension in a 2 ml tube.
12. Centrifuge at 14000 rpm for 15 s to harvest the cells.
13. Eliminate the supernatant.
14. Re-suspend (using the vortex) the bacterial pellet in 300 μl P1 buffer.
15. Add 300 μl P2 buffer and invert tube gently 3-5 times.
16. Leave for 5 min on the bench.
The P2 buffer disrupts the bacterial membrane and RNA, isolating the DNA from the
bacteria. The incubation time is necessary to ensure that the plasmid is released from
the bacteria, while the chromosomal DNA is retained.
17. Add 300 μl P3 buffer and gently shake the tube.
18. Incubate on ice for 10 min.
The P3 buffer precipitates all the cell debris, while the recombinant plasmid remains
in the supernatant.
19. Centrifuge at 14000 rpm for 10 min.
20. Transfer 900 μl supernatant (which contains the recombinant plasmid into a
new 1.5-ml tube.
21. Add 630 μl isopropanol to precipitate the DNA.
22. Centrifuge at 14000 rpm for 20 min.
23. Remove the supernatant and add 200 μl 70% ethanol to wash the DNA.
24. Centrifuge at 14000 rpm for 2 min.
25. Remove the supernatant and let the DNA pellet dry for a few minutes.
26. Re-suspend the DNA in 50 μl water.
The DNA can now be analysed to determine whether the bacterial culture that is
being examined has incorporated the right recombinant plasmid during
transformation.
For this purpose, the DNA must be digested with another restriction enzyme (called
BamHI) that will produce fragments of different length, depending on the gene’s
orientation in the plasmid.

Activity II – Molecular Biology
45
Fig. AII.4 Analysis of DNA bands to select the colonies that can
produce recombinant insulin
27. Prepare the reaction mix for the enzymatic reaction. For each DNA sample
you need:
- 1 μl enzyme (BamHI)
- 2 μl BamHI buffer
- 13.9 μl water
- 0.1 μl BSA 100X
28. Add to each tube 17 μl reaction mix and 3 μl DNA
29. Incubate at 37°C.
The enzymatic reaction takes about 1 h.
Each group will then load the digestion product onto a 2% agarose gel.
30. Weigh 1 g agarose and dissolve it in a flask with 50 ml TAE 1x buffer. Boil the
solution in the microwave and mix gently until the solution is clear.
31. Prepare an electrophoresis tray with scotch tape around the edges and insert
the comb.
32. Pour the agarose solution in the electrophoresis tray. Leave to set
(polymerize).
A control (C) will have to be loaded on the same gel. The control is a closed
undigested plasmid, and it is necessary to make sure that the enzymatic reaction
has worked and that the plasmid has been digested. If our sample in the gel looks
like the control, this means that the recombinant plasmid is still closed and the
enzyme has not worked.
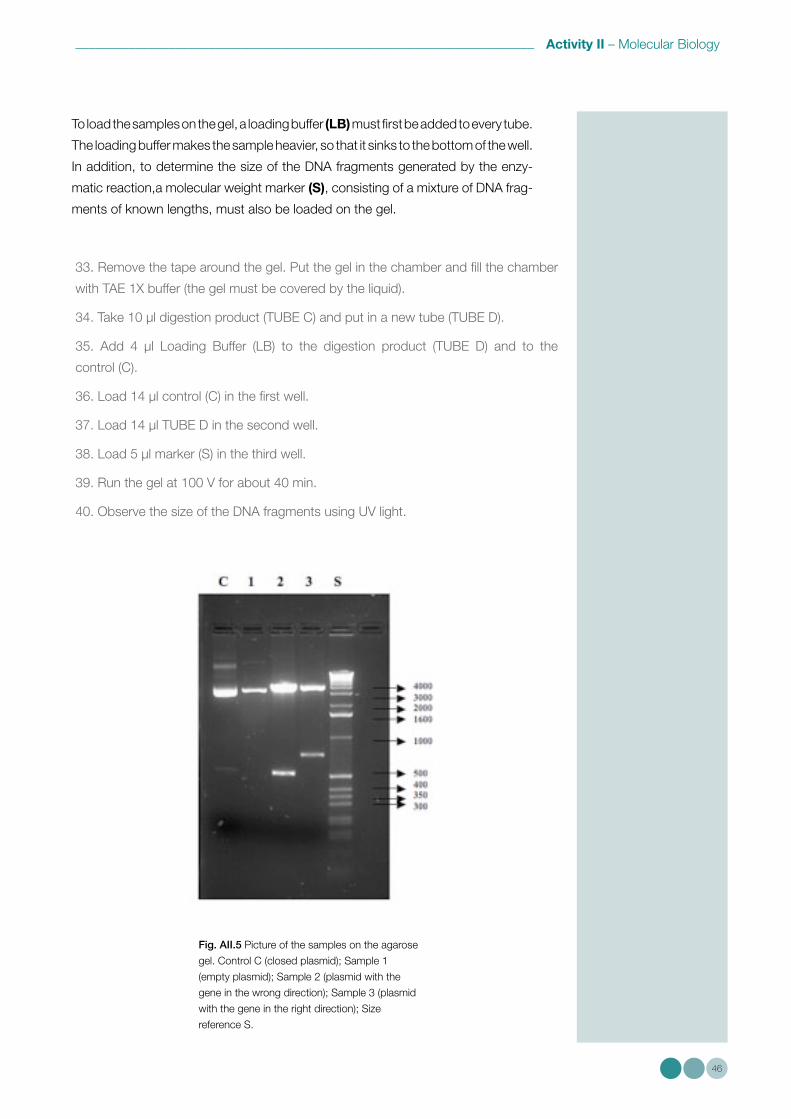
Activity II – Molecular Biology
46
Fig. AII.5 Picture of the samples on the agarose
gel. Control C (closed plasmid); Sample 1
(empty plasmid); Sample 2 (plasmid with the
gene in the wrong direction); Sample 3 (plasmid
with the gene in the right direction); Size
reference S.
33. Remove the tape around the gel. Put the gel in the chamber and fill the chamber
with TAE 1X buffer (the gel must be covered by the liquid).
34. Take 10 μl digestion product (TUBE C) and put in a new tube (TUBE D).
35. Add 4 μl Loading Buffer (LB) to the digestion product (TUBE D) and to the
control (C).
36. Load 14 μl control (C) in the first well.
37. Load 14 μl TUBE D in the second well.
38. Load 5 μl marker (S) in the third well.
39. Run the gel at 100 V for about 40 min.
40. Observe the size of the DNA fragments using UV light.
To load the samples on the gel, a loading buffer (LB) must first be added to every tube.
The loading buffer makes the sample heavier, so that it sinks to the bottom of the well.
In addition, to determine the size of the DNA fragments generated by the enzy-
matic reaction,a molecular weight marker (S), consisting of a mixture of DNA frag-
ments of known lengths, must also be loaded on the gel.

Activity II – Molecular Biology
47
AII.3 Reagents and instruments
AII.3.1 Description of the products used for this activity
- TUBE A: contains the different products of the interaction between the plas-
mid (pCR® -Blunt II-TOPO®, 3519 base pairs, commercial product distributed by
Invitrogen) and the insert (a sequence of 1146 base pairs amplified in the lab)
- TUBE B: Escherichia coli strain DH5a. These bacteria have been treated with cal-
cium chloride in order to make them chemically competent.
- LB buffer (for 1 liter of solution): 10 g triptone, 5 g yeast extract, 10 g NaCl, pH
7.0
- Antibiotic: kanamycin, used at a final concentration of 25 μg/ml
- Buffer P1: Tris-Cl 50 mM, pH 8.0; EDTA 10mM; RNase A 100 μg/ml
- Buffer P2: NaOH 200 mM, SDS 1%
- Buffer P3: potassium acetate 3 M, pH 5.5
- BamHI: restriction enzyme that recognizes the sequence (GGATCC)
- BamHI buffer: NaCl 150 mM, Tris-HCl 10 mM, MgCl2 10 mM, DTT 1 mM, BSA
100 μg/ml
- DNA intercalating agent: SYBR SafeTM DNA Gel Stain in TAE 1X, commercial
product distributed by Invitrogen
- TAE 1X buffer: Tris-acetate 0.04 M, EDTA 0.001 M
- Loading Buffer (LB) 6X: Tris-HCl 10 mM, pH 7.5; EDTA 50 mM, Ficoll 400 10%,
Bromophenol Blue 0.25%
- Control (C): closed plasmid derived from the fusion of plasmid and insert (4665 bp)
- Marker (S): 1 Kb DNA Ladder, commercial product distributed by Invitrogen
AII.3.2 Materials and solutions necessary for the activity
- Gloves
- Pipettes (P2, P200, P1000)
- Tips
- Eppendorf tubes (1.5 ml, 2 ml)
- Ice buckets
- Timers
Comparing the size of the fragments in the sample with the marker DNA (size ex-
pressed in base pairs - bp), we will be able to determine whether our bacterial colony
has incorporated the right recombinant plasmid or not. The bacterial colonies contain-
ing the plasmid with the insulin gene inserted in the right direction will be amplified
further and, after an appropriate stimulation, they will produce recombinant insulin.
Activity II – Molecular Biology
48
- Glass flasks
- Loops for bacteria
- Tubes for bacteria
- Sterile water
- Isopropanol
- 70% ethanol
- Ice
- Agarose
- Agar plates with antibiotic
AII.3.3 Instruments needed for the activity
- Electrophoresis chambers and power supply
- Microwave oven
- Vortex
- Heat block
- Incubator at 37°C
- Ultracentrifuge
- UV transilluminator
AII.4 General laboratory safety measures
AII.4.1 General rules
Do not work alone in the lab.
Smoking in the lab is forbidden.
It is forbidden to eat or drink inside the lab, or to store food in the fridges where labora-
tory material is stored.
Lab coats must be worn inside the laboratory. The lab coat must be removed before
entering rest areas, the library or before meals.
To wash laboratory material never use acids, but appropriate detergents.
Before using dangerous substances or materials it is mandatory to be aware of the
precautions that must be taken. Every substance, in its original packaging, is marked
by a symbol that indicates the hazard involved in the handling (e.g. toxic, irritant, cor-
rosive, explosive, etc.).
Every lab must be equipped with a first aid kit, with instructions for adequate first aid
procedures in case of accident.
The use of splintered or cracked glassware must be avoided. When dangerous
procedures are being executed, disposable gloves must be worn and discarded after
use.
Activity II – Molecular Biology
49
The last person leaving the lab in the evening is in charge of checking that everything
is in order (solvents, equipment, chemicals, cultures, etc.).
AII.4.2 Safety measures when using electrical equipment
Never use multiple socket adaptors to connect more than one instrument.
Report faulty electrical equipment, and worn or damaged cables and plugs to the
technical service.
If electrical equipment is found faulty, it must be immediately disconnected from the
power supply and technical assistance must be sought.
Appliances with electrical motors should not be placed next to inflammable material
or explosives. High voltage appliances (e.g. electrophoresis apparatus) can be lethal.
The appliance should be marked with appropriate danger signs.
AII.4.3 Safety measures for handling toxic substances
Toxic substances in the lab should be marked with appropriate signs. Toxic sub-
stances can be harmful either through ingestion, skin contact or inhalation. To avoid
ingestion of these substances, eating and drinking in the lab is forbidden.
Always wear gloves of appropriate quality, rinse before removing.
To avoid contamination of other areas, gloves should be taken off before leaving the
lab.
Volatile substances should always be handled under the hood.
If necessary, a face mask can be used.
AII.4.4 Safety measures for working with biological material
Infectious agents include parasites, protozoa, helminthes, fungi, bacteria and viruses.
Contact with animals, or tissues, secretions, blood and urine derived from animals,
can involve risk of infection.
Extra care must be taken when handling biological material of human origin (blood,
tissues, cell lines). The safety measures in these cases must correspond to risk group
2 policy.
Each lab must be provided with a good disinfectant for first aid purpose. It is
forbidden to mouth-pipette, eat, drink, or smoke in the lab.
It is mandatory to wash hands before leaving the lab.

Activity II – Molecular Biology
50
AII.4.5 Safety measures for using ultraviolet radiations
Ultraviolet (UV) light sources are commonly used in the lab (e.g. lights for looking at
electrophoretic DNA gels or chromatograms, or germicide lamps). The light source
must have a screen, or UV-specific protective goggles must be worn.
Short-wave ultraviolet radiation causes the formation of ozone via a
photochemical reaction with oxygen in the air. Ozone concentration in the air over 0.1
ppm can cause irritation to the eyes, nose and throat. To avoid ozone-related risks,
the room containing the UV light source should be well ventilated.
AII.4.6 Safety measures for using centrifuges
Personnel handling centrifuges should be perfectly aware of how they work. Before
use, they should make sure that:
- All centrifuges have a safety device, which prevents their functioning if the lid is
open;
- The maximum speed, also in relation to the density of the material to spin, is not
exceeded;
- All samples to be centrifuged are balanced;
- The centrifuge and rotor manuals are available in the proximity of the machine.
In addition, the person handling the centrifuge must:
- Leave the centrifuge and rotor perfectly clean after use, so that they can be used
again without the risk of contamination in case toxic or infective material was used;
- Immediately stop the centrifuge if it vibrates or emits abnormal sounds.
AII.4.7 Use of the microwave oven
Do not turn the oven on if it is empty.
Do not use the oven with inflammable material.
Do not use the oven with sealed containers (they may explode): unscrew bottle caps,
remove lids.
Do not use the oven with metal or metal-plated objects (e.g. bottles wrapped in foil)
and tin foil.
Do not fill the containers to the brim: the liquid may spill when boiling.
Apply power and time of heating in proportion to the water volume of the object that
is being heated. In particular, for aqueous solutions, the liquid may overheat beyond
boiling point without the formation of bubbles. This can cause sudden spill of the boil-
ing liquid. To avoid this, mix the solution before placing it in the oven, and let it stand
a few minutes in the oven before taking it out.
Use padded gloves to take hot containers out of the oven.
Activity II – Molecular Biology
51
After use, clean the oven with paper sprinkled with glass detergent.
In case of fire inside the oven, keep the oven door closed, turn it off, disconnect the
plug and let the fire extinguish itself by suffocation.
AII.4.8 Handling of the apparatus for electrophoresis
Make sure the power supply is off before connecting the cables.
Make sure the chamber lid is correctly positioned before connecting the cables.
After the run, before removing the chamber lid, turn off the power supply and discon-
nect the cables.

Appendix I
52
Appendix I: Species of animals utilized for compared analysis of insulin
BOVIN – Bos Taurus (cow)Kingdom: Animalia
Phylum: Chordata
Subphylum: Vertebrata
Class: Mammalia
Order: Artiodactyla
Family: Bovidae
Genus: Bos
Species: B. taurus
CHICK – Gallus gallus Kingdom: Animalia
Phylum: Chordata
Subphylum: Vertebrata
Class: Aves
Order: Galliformes
Family: Phasianidae
Genus: GallusSpecies: G. gallus
HORSE – Equus caballus Kingdom: Animalia
Phylum: Chordata
Subphylum: Vertebrata
Class: Mammalia
Order: Perissodactyla
Suborder: Hyppomorpha
Family: Equidae
Genus: EquusSpecies: E. caballus
Image source: http://www.probertencyclopaedia.com/
Image source: http://www.probertencyclopaedia.com/
Image source: http://www.probertencyclopaedia.com/
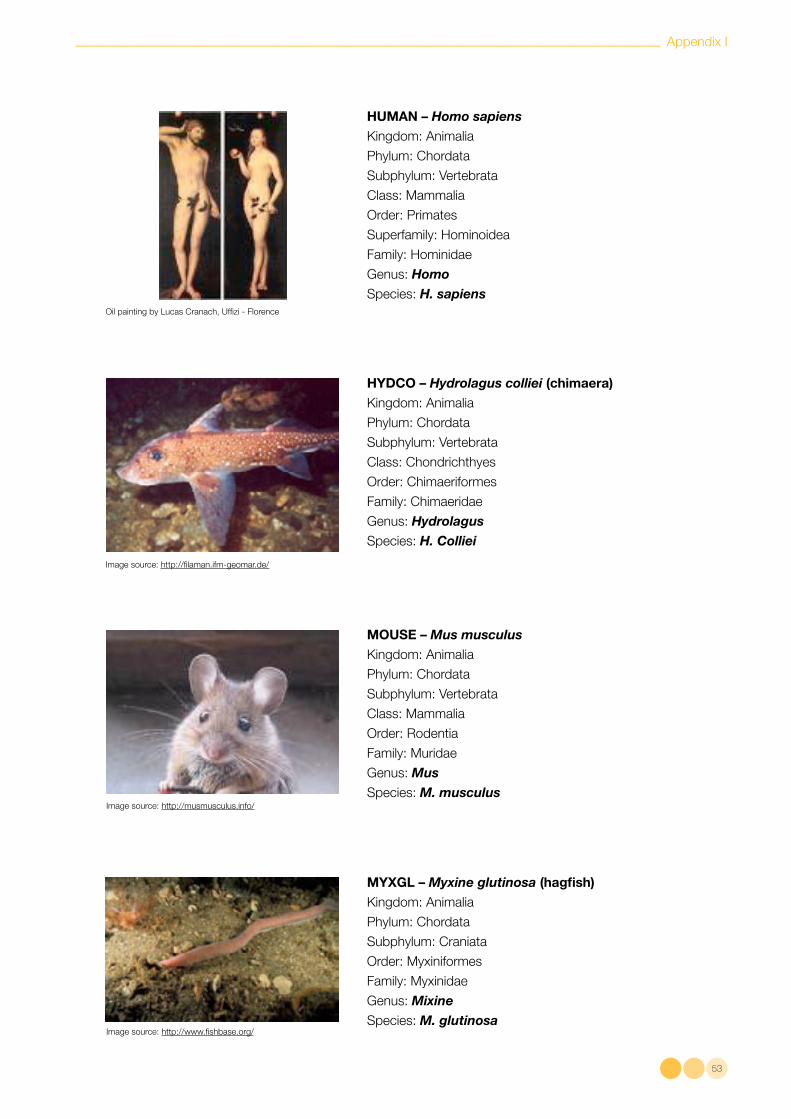
Appendix I
53
HUMAN – Homo sapiensKingdom: Animalia
Phylum: Chordata
Subphylum: Vertebrata
Class: Mammalia
Order: Primates
Superfamily: Hominoidea
Family: Hominidae
Genus: HomoSpecies: H. sapiens
Oil painting by Lucas Cranach, Uffizi - Florence
Image source: http://www.fishbase.org/
Image source: http://musmusculus.info/
Image source: http://filaman.ifm-geomar.de/
HYDCO – Hydrolagus colliei (chimaera)Kingdom: Animalia
Phylum: Chordata
Subphylum: Vertebrata
Class: Chondrichthyes
Order: Chimaeriformes
Family: Chimaeridae
Genus: HydrolagusSpecies: H. Colliei
MOUSE – Mus musculusKingdom: Animalia
Phylum: Chordata
Subphylum: Vertebrata
Class: Mammalia
Order: Rodentia
Family: Muridae
Genus: MusSpecies: M. musculus
MYXGL – Myxine glutinosa (hagfish)Kingdom: Animalia
Phylum: Chordata
Subphylum: Craniata
Order: Myxiniformes
Family: Myxinidae
Genus: MixineSpecies: M. glutinosa

Appendix I
54
ONCKE – Oncorhynchus keta (chum salmon)Kingdom: Animalia
Phylum: Chordata
Subphylum: Vertebrata
Class: Osteichthyes
Subclass: Actinopterygii
Order: Salmoniformes
Family: Salmonidae
Genus: OncorhynchusSpecies: O. keta
PANTR – Pan troglodytes (chimpanzee)Kingdom: Animalia
Phylum: Chordata
Subphylum: Vertebrata
Class: Mammalia
Order: Primates
Superfamily: Hominoidea
Family: Hominidae
Genus: PanSpecies: M. troglodytes
PIG – Sus scrofaKingdom: Animalia
Phylum: Chordata
Subphylum: Vertebrata
Class: Mammalia
Order: Artiodactyla
Suborder: Suiformes
Family: Suidae
Genus: SusSpecies: S. scrofa
RABIT – Oryctolagus cuniculus (rabbit)Kingdom: Animalia
Phylum: Chordata
Subphylum: Vertebrata
Class: Mammalia
Order: Lagomorpha
Family: Leporidae
Genus: OryctolagusSpecies: O. cuniculus
Image source: http://www.blevinsphoto.com/
Image source: www.raitre.rai.it/
Image source: www.raitre.rai.it/
Image source: http://www.ischiainformazioni.net/
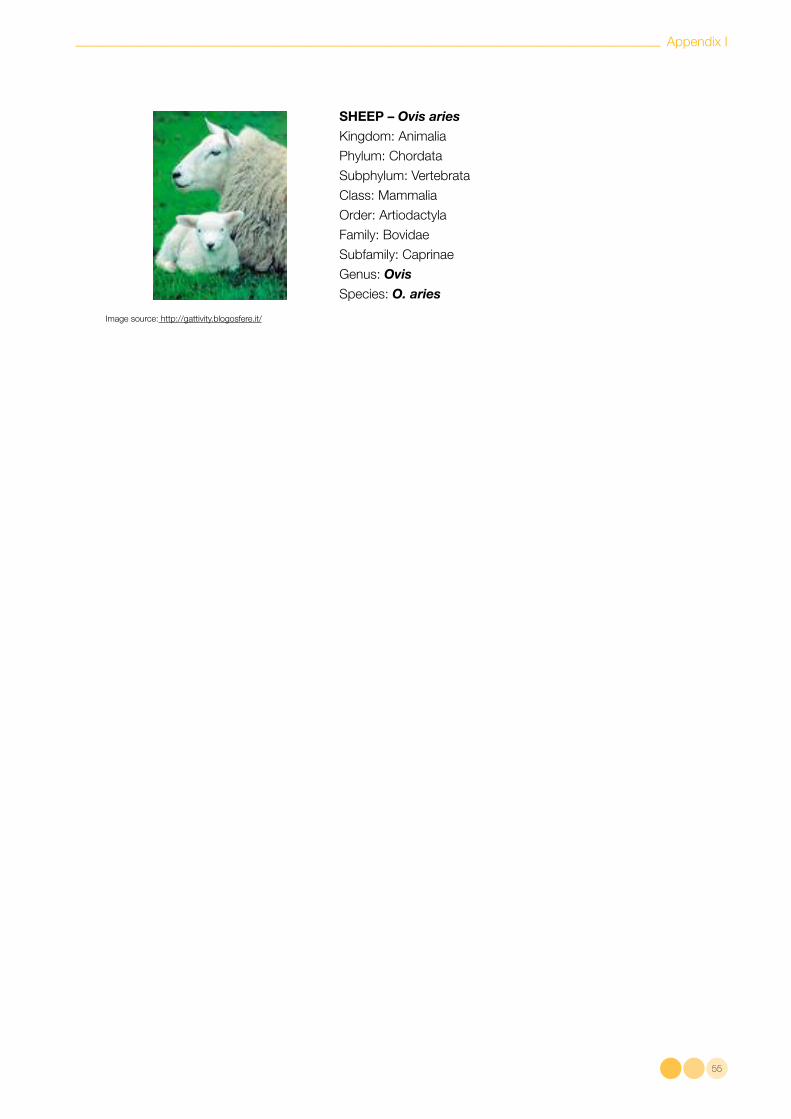
Appendix I
55
SHEEP – Ovis ariesKingdom: Animalia
Phylum: Chordata
Subphylum: Vertebrata
Class: Mammalia
Order: Artiodactyla
Family: Bovidae
Subfamily: Caprinae
Genus: OvisSpecies: O. aries
Image source: http://gattivity.blogosfere.it/

Appendix II
56
Appendix II: Amino acids and their symbols
Amino acid 1 letter 3 letters
Alanine A Ala
Arginine R Arg
Asparagine N Asn
Aspartic acid D Asp
Asn+Asp B Asx
Cysteine C Cys
Glutamine Q Gln
Glutamic acid E Glu
Gln+Glu Z Glx
Glycine G Gly
Histidine H His
Isoleucine I Ile
Leucine L Leu
Lysine K Lys
Methionine M Met
Phenylalanine F Phe
Proline P Pro
Serine S Ser
Threonine T Thr
Tryptophan W Trp
Tyrosine Y Tyr
Valine V Val
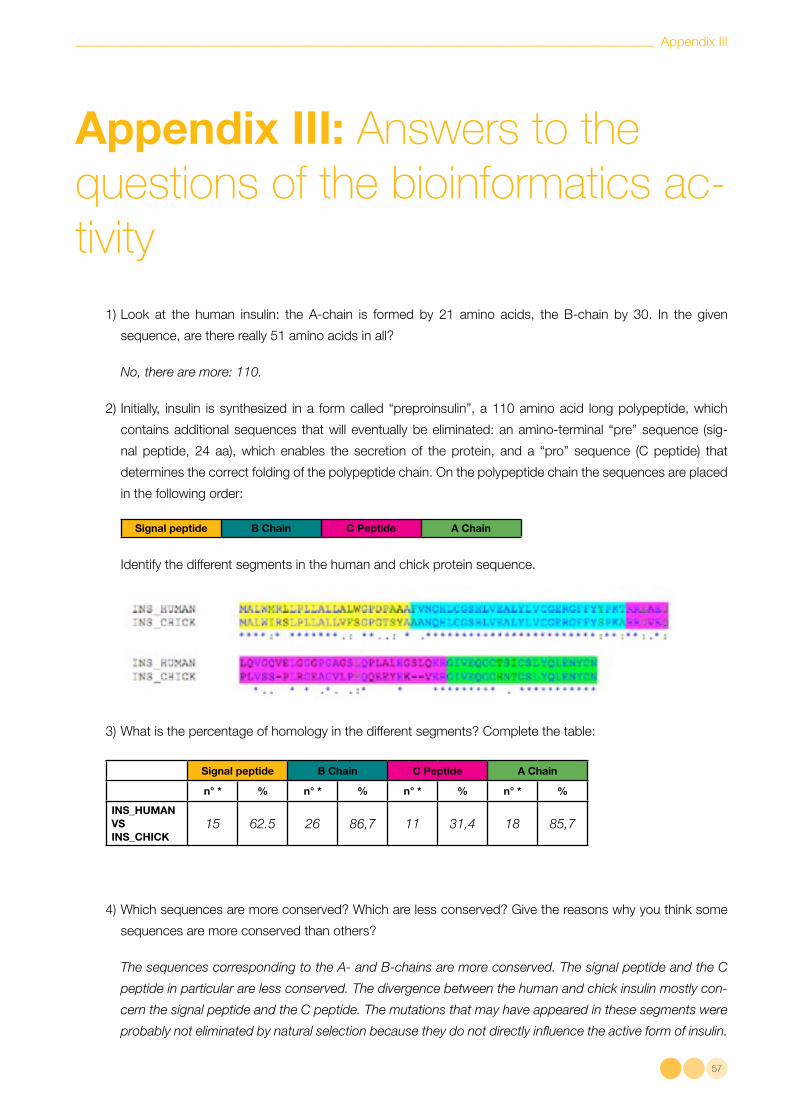
Appendix III
57
Appendix III: Answers to the questions of the bioinformatics ac-tivity
1) Look at the human insulin: the A-chain is formed by 21 amino acids, the B-chain by 30. In the given
sequence, are there really 51 amino acids in all?
No, there are more: 110.
2) Initially, insulin is synthesized in a form called “preproinsulin”, a 110 amino acid long polypeptide, which
contains additional sequences that will eventually be eliminated: an amino-terminal “pre” sequence (sig-
nal peptide, 24 aa), which enables the secretion of the protein, and a “pro” sequence (C peptide) that
determines the correct folding of the polypeptide chain. On the polypeptide chain the sequences are placed
in the following order:
Signal peptide B Chain C Peptide A Chain
Identify the different segments in the human and chick protein sequence.
3) What is the percentage of homology in the different segments? Complete the table:
Signal peptide B Chain C Peptide A Chain
n° * % n° * % n° * % n° * %
INS_HUMAN VS INS_CHICK
15 62.5 26 86,7 11 31,4 18 85,7
4) Which sequences are more conserved? Which are less conserved? Give the reasons why you think some
sequences are more conserved than others?
The sequences corresponding to the A- and B-chains are more conserved. The signal peptide and the C
peptide in particular are less conserved. The divergence between the human and chick insulin mostly con-
cern the signal peptide and the C peptide. The mutations that may have appeared in these segments were
probably not eliminated by natural selection because they do not directly influence the active form of insulin.
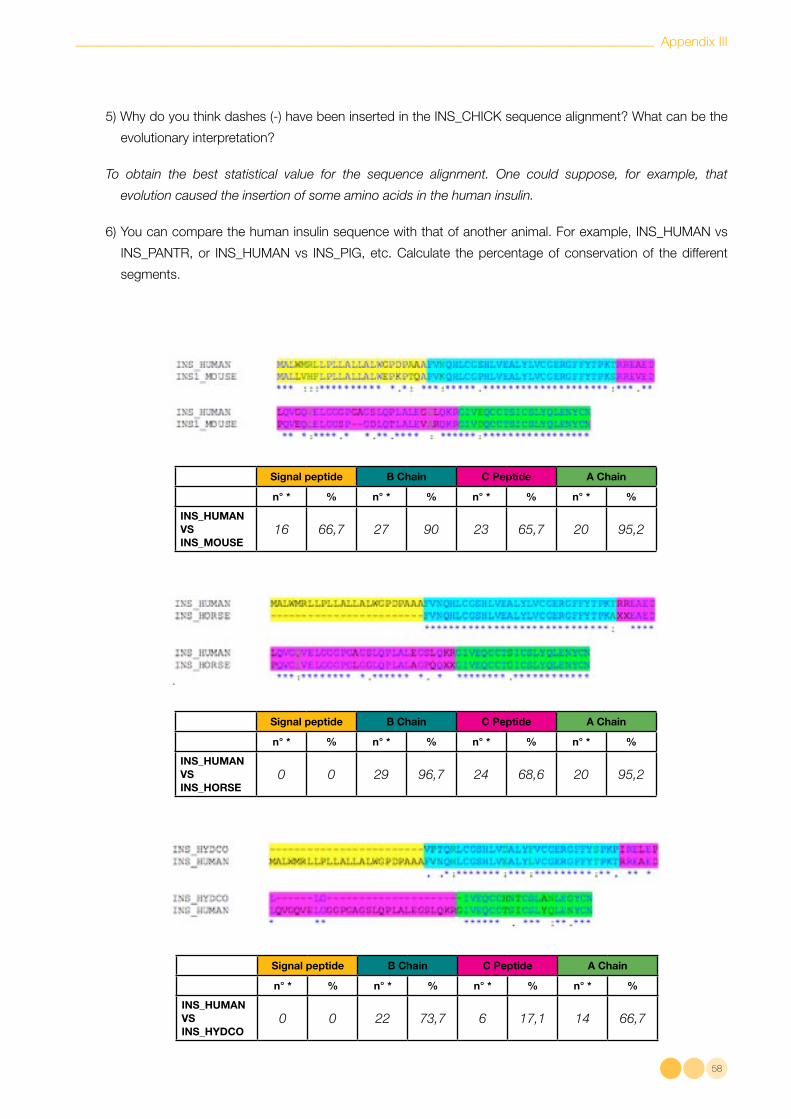
Appendix III
58
5) Why do you think dashes (-) have been inserted in the INSCHICK sequence alignment? What can be the
evolutionary interpretation?
To obtain the best statistical value for the sequence alignment. One could suppose, for example, that
evolution caused the insertion of some amino acids in the human insulin.
6) You can compare the human insulin sequence with that of another animal. For example, INSHUMAN vs
INSPANTR, or INSHUMAN vs INSPIG, etc. Calculate the percentage of conservation of the different
segments.
Signal peptide B Chain C Peptide A Chain
n° * % n° * % n° * % n° * %
INS_HUMAN VS INS_MOUSE
16 66,7 27 90 23 65,7 20 95,2
Signal peptide B Chain C Peptide A Chain
n° * % n° * % n° * % n° * %
INS_HUMAN VS INS_HORSE
0 0 29 96,7 24 68,6 20 95,2
Signal peptide B Chain C Peptide A Chain
n° * % n° * % n° * % n° * %
INS_HUMAN VS INS_HYDCO
0 0 22 73,7 6 17,1 14 66,7
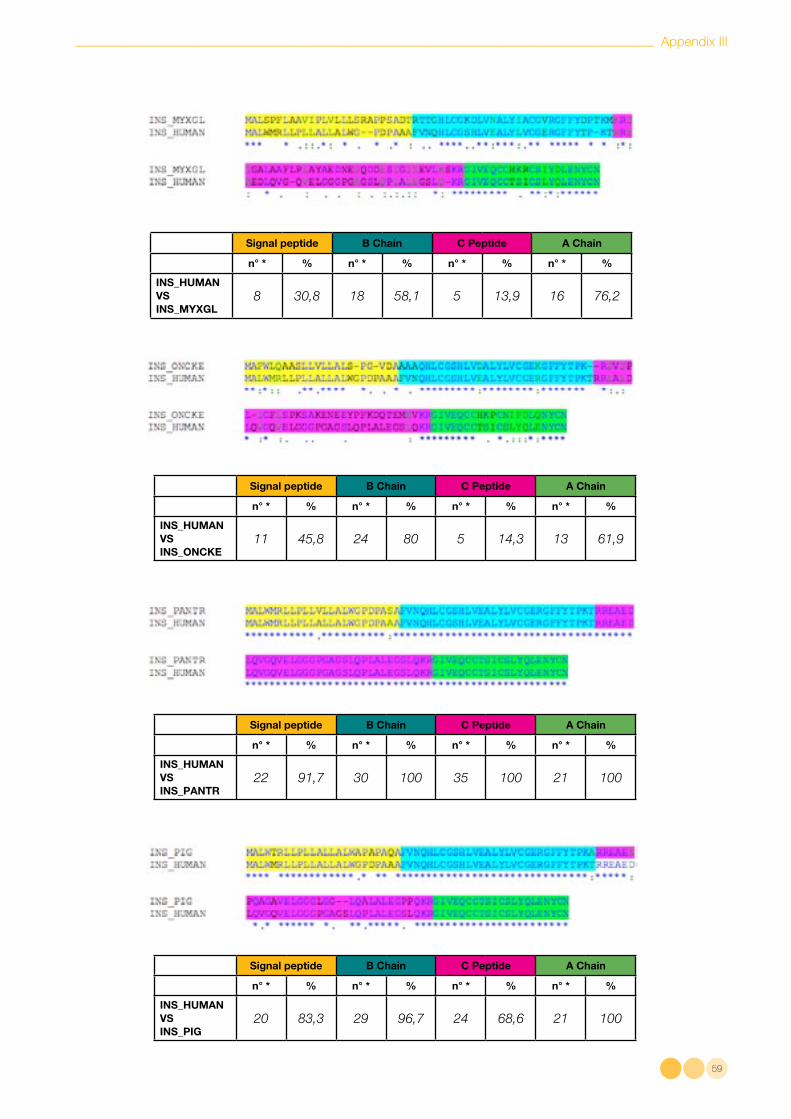
Appendix III
59
Signal peptide B Chain C Peptide A Chain
n° * % n° * % n° * % n° * %
INS_HUMAN VS INS_MYXGL
8 30,8 18 58,1 5 13,9 16 76,2
Signal peptide B Chain C Peptide A Chain
n° * % n° * % n° * % n° * %
INS_HUMAN VS INS_ONCKE
11 45,8 24 80 5 14,3 13 61,9
Signal peptide B Chain C Peptide A Chain
n° * % n° * % n° * % n° * %
INS_HUMAN VS INS_PANTR
22 91,7 30 100 35 100 21 100
Signal peptide B Chain C Peptide A Chain
n° * % n° * % n° * % n° * %
INS_HUMAN VS INS_PIG
20 83,3 29 96,7 24 68,6 21 100
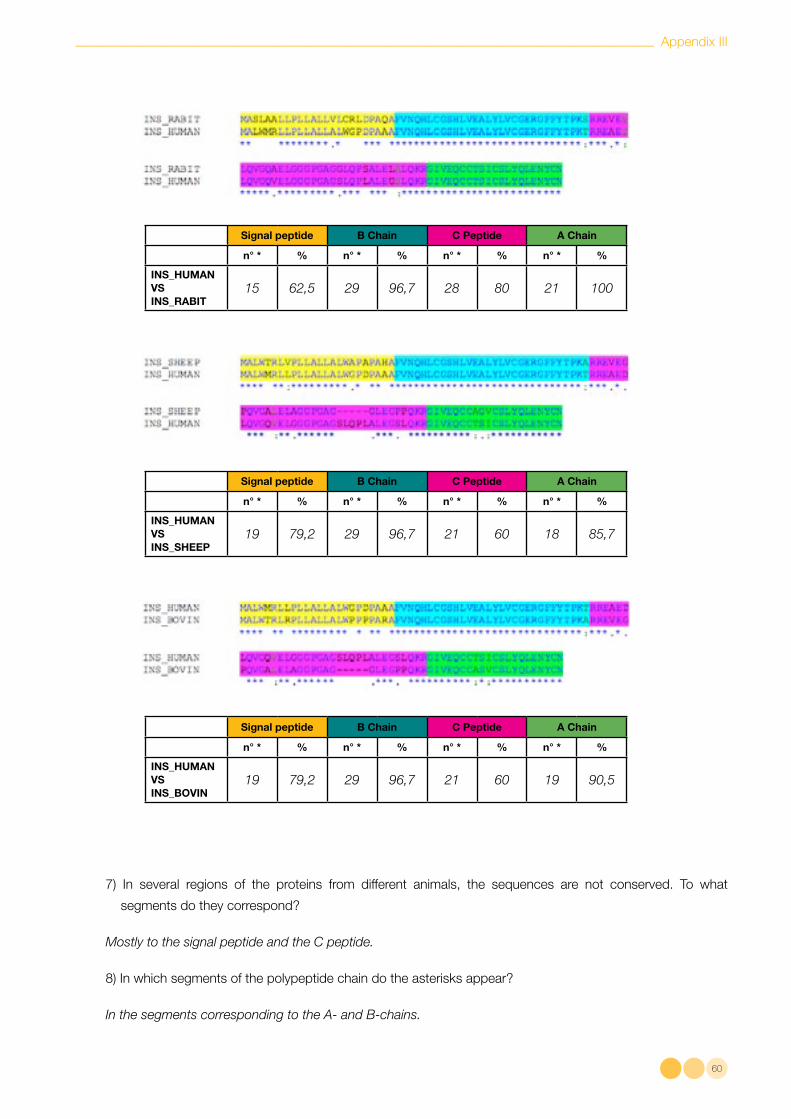
Appendix III
60
Signal peptide B Chain C Peptide A Chain
n° * % n° * % n° * % n° * %
INS_HUMAN VS INS_RABIT
15 62,5 29 96,7 28 80 21 100
Signal peptide B Chain C Peptide A Chain
n° * % n° * % n° * % n° * %
INS_HUMAN VS INS_SHEEP
19 79,2 29 96,7 21 60 18 85,7
Signal peptide B Chain C Peptide A Chain
n° * % n° * % n° * % n° * %
INS_HUMAN VS INS_BOVIN
19 79,2 29 96,7 21 60 19 90,5
7) In several regions of the proteins from different animals, the sequences are not conserved. To what
segments do they correspond?
Mostly to the signal peptide and the C peptide.
8) In which segments of the polypeptide chain do the asterisks appear?
In the segments corresponding to the A- and B-chains.

Appendix III
61
9) Why do you think there is more sequence variability in these segments?
Evolution has probably allowed a greater variability between species in the signal peptide and in the C
peptide. The mutations that may have appeared in these segments were probably not eliminated by
natural selection because they do not directly influence the active form of insulin.
10) Examining the ‘unrooted tree’: which two species are most related to each other? Explain why.
Man and chimpanzee. They are separated by a single node, and their branches are very short. They have
therefore differentiated from a common ancestor relatively recently.
11) The lengths of the “branches” give an idea of the evolutionary distance: after printing out the
dendrogram, use a ruler to determine the evolutionary distance in mm between man and the other animals:
Note: depending on the size of the printout, different values can be measured. We will therefore simply list
the pairs in order of increasing distance:
- human and chimpanzee
- human and pig
- human and horse
- human and cow
- human and sheep
- human and rabbit
- human and mouse
- human and chimaera
- human and chick
- human and salmon
- human and hagfish.
12) Is the sheep insulin phylogenetically closer to the chick or to the human insulin?
Considering the number of nodes that separate the different species and the length of the branches, we can
deduce that sheep insulin is more similar to the human one.
13) What evolutionary relationship exists between pig, sheep and cow?
The evolutionary line of the insulin variants in the three species differentiated at one point into a new line
that produced the pig, while the other branch split only later differentiating to cow and sheep. These two
species have a relatively recent common ancestor, and therefore seem to be phylogenetically closer to each
other. On the other hand, the common ancestor for sheep-cow-pig is more distant in time.
14) Based on what you now know, comment on the significance of these results.
As expected, the fish and the hagfish are placed at the opposite end of the dendrogram compared to the
other animals, which are all terrestrial. The chick, which is a bird, has differentiated from all the other
animals, which are mammals.
Appendix III
62
15) Which species is phylogenetically closer to the cow? Which is closer to salmon?
The sheep is closer to the cow, the hagfish is closer to the salmon.
16) Observe the pairs “chimpanzee-human”, “salmon hagfish”, “sheep-cow”. Each pair is differentiated by a
single “node”. What differences do you notice in the divergence of these animals?
The divergence for the pair “salmon-hagfish” took place further back in time, while it is relatively recent for the
pair “chimpanzee-human”.
17) In biology the term “similarity” indicates a quantitative feature that correlates two or more sequences (such
as the percentage of identity, percentage of conservative mutations...). Identify the two species that share
the highest percentage of identity for the amino acid sequence of insulin.
Man and chimpanzee.
18) Note: it is important to understand that these phylogenetic trees generated using bioinformatics tools are
based on data related to the single nucleotide or protein sequences. Besides sequence homology, other
methods must be used to determine the evolutionary relationship between species. Can you name any?
Using bioinformatics tools, more reliable phylogenetic trees can be obtained by integrating the sequence
homology of more genes and/or proteins. Traditionally, animal phylogenetics is based on differences in body
structure, anatomical and physiological differences, embryonal development, modes of reproduction, etc.
At this point, lets move back to the initial purpose of this activity: which animal would you
choose to extract insulin for therapeutic use that is most similar to human insulin?
19) Based on insulin’s sequence homology, which animal species would you consider best suited for
extracting this hormone?
The chimpanzee.
20) Do you think the use of this animal could raise ethical and commercial issues (consider whether this
species is widespread, easy to raise, not an endangered species, etc.)?
The chimpanzee is certainly the animal with insulin most similar to human insulin. However, the chimpan-
zee is not a widespread animal, and to breed it in captivity would raise objections on the grounds of
animal rights. There are less than 200,000 animals in the tropical rain forests, and wet savannas of Africa,
spanning from the West coast of the continent to the Eastern regions including Uganda, Rwanda, Burundi
and Tanzania. Like other apes (gorilla, orangutan and bonobo), chimpanzees are an endangered species,
via loss of their natural habitat, being hunted for their meat and through illegal trafficking of infants sepa-
rated from the mothers which are killed. Chimpanzees are also bred in captivity for research purposes.
Chimpanzees in Africa have been classified as animals “at risk of extinction”, while those in captivity in the
United States are considered “endangered”. A recent report (“Reuters” - 24 May, 2007 - Will Dunham)
communicated that the U.S. National Institute of Health (NIH), which supports a variety of biochemical
Appendix III
63
studies on animals, will stop breeding chimpanzees belonging to the government for research purposes.
Based on these considerations, it is not feasible to breed chimpanzees for the extraction of insulin for
therapeutic purposes. Pig insulin also has a high degree of homology to the human hormone. As oppo-
sed to chimpanzees, pigs are widespread and easy to breed (there are 120 million pigs in the European
Union alone!) and every day many are killed for food. The “sacrifice” of pigs for scientific or medical pur-
poses certainly raises fewer ethical problems than the use of primates. As a matter of fact, the pig is also
used for xenotransplants. The horse also produces an insulin protein that is very similar to human insulin.
However, breeding horses is more expensive and less “productive” than breeding pigs.
21) Based on these considerations, and keeping homology in mind, which animal could then be the ideal
“donor”?
The pig.

64
5 Bibliography and Web References
Watson JD, Gilman M, Witkowski J, Zoller M, DNA ricom-binante, Zanichelli Editore
Vander AJ, Sherman JH, Luciano DS, Fisiologia dell’uomo, Il Pensiero Scientifico Editore
Ladisch MR and Kohlmann KL, Recombinant Human Insulin, Biotechnol. Progr. 1992, (8)
469-478
Dugi K, Diabetes mellitus, Science in School 2006, (1) 61-65
http://www.dnai.org/b/index.html
http://en.wikipedia.org/wiki/Insulin
http://www.vivo.colostate.edu
http://www.med.unibs.it
http://www.biotopics.co.uk/as/insulinproteinstructure.html
http://www.scienceinschool.org
http://www.gtac.edu.au
http://www.cusmibio.unimi.it
This project was funded by the “Fondazione Banca del Monte di Lombardia” as part of
“Progetto Professionalità Ivano Becchi”. We thank the foundation for supporting this col-
laboration.
For technical suggestions offered during the preparation of the project, and for critical
reading of the draft, we thank Daniela Marazziti, Cinzia Grazioli, Olivier Mirabeau, Daniele
Malpetti, Alexandra Manaia and Julia Willingale-Theune.
Finally, we thank the Liceo Statale “G. Galilei” of Caravaggio (Bergamo, Italy).
The cover image: Structure composing, Paul Tucker – Original file “composing/layers” –
from the EMBL Photolab archive;
Layout design by Nicola Graf
Edited by Rossana De Lorenzi and Corinne Kox;
Translated into English by Daniela Ruffell;
Printed by the European Molecular Biology Laboratory (EMBL) Photolab.
Acknowledgements

Explanation of the copyright symbols
ELLS employs creative commons copyrights to protect material produced for ELLS LLABs which will subsequently
be used by teachers and other institutions. The copyright symbols also appear on the ELLS TeachingBASE website
and in the downloadable pdfs/docs/ppts.
Attribution Non-commercial Share Alike
This license lets others remix, tweak, and build upon your work non-commercially, as long as they credit you and
license their new creations under the identical terms. Others can download and redistribute your work just like the
by-nc-nd license, but they can also translate, make remixes, and produce new stories based on your work. All new
work based on yours will carry the same license, so any derivatives will also be non-commercial in nature.
Furthermore, the author of the derivative work may not imply that the derivative work is endorsed or approved by
the author of the original work.
to Share
to Remix
Attribution
Non-commercial
Share alike
For further details, see http://creativecommons.org
Copyright European Molecular Biology Laboratory 2010


![Whole Genome Shatqun updates) C] EMBL (Cantiq release) C] EMBL (Coding Sequences) C] Genome Reviews C] EMBL ID/ Accession Mapping C] EMBL MGA Nucleotide sequence databases - subsections](https://static.documents.pub/doc/80x56/5ccc4c0c88c993de558c2477/whole-genome-shatqun-updates-c-embl-cantiq-release-c-embl-coding-sequences.jpg)