+ All Categories
Home > Documents > RECONSTRUCTION OF HISTORICAL TRENDS IN … · brazilian journal of oceanography, 61(2):149-160,...

RECONSTRUCTION OF HISTORICAL TRENDS IN … · brazilian journal of oceanography, 61(2):149-160,...

Date post: 24-Nov-2018
Category:
Upload: ngodiep
View: 214 times
Download: 0 times
Share this document with a friend
12
BRAZILIAN JOURNAL OF OCEANOGRAPHY, 61(2):149-160, 2013 RECONSTRUCTION OF HISTORICAL TRENDS IN POTENTIALLY TOXIC ELEMENTS FROM SEDIMENT CORES COLLECTED IN BERTIOGA CHANNEL, SOUTHEASTERN BRAZIL Cristina Gonçalves 1 , Rubens Cesar Lopes Figueira 2 , Juliê Rosemberg Sartoretto 2 , Alexandre Barbosa Salaroli 2 , Andreza Portella Ribeiro 3 , Paulo Alves de Lima Ferreira 2,* and Michel Michaelovitch de Mahiques 2 1 Consultoria, Planejamento e Estudos Ambientais (CPEA) (Rua Henrique Monteiro, 90, São Paulo, SP, Brasil) 2 Instituto Oceanográfico da Universidade de São Paulo (Praça do Oceanográfico, 191, 05508-120 São Paulo, SP, Brasil) 3 Curso de Gestão Ambiental e Sustentabilidade, Universidade Nove de Julho (UNINOVE) (Av. Francisco Matarazzo, 612, prédio C, andar térreo, Água Branca, São Paulo, SP, Brasil) *Corresponding author: [email protected] A B S T R A C T The study presents an evaluation of potentially toxic elements deposition in Bertioga Channel (Southeastern Brazilian coast) along the last 150 years, the main anthropogenic activity period in the area. Five sediment cores by means of ICP-OES to determine the levels of metals (Cd, Cr, Cu, Ni, Pb and Zn) and As. The pollution load index (PLI) and enrichment factor (EF) were calculated to identify the relative elements toxicity of the sediments and the anthropogenic contribution of the investigated elements. The indexes indicated the absence of contamination but a higher input of As in cores B2 and B5, which have been sampled in an area that presents higher sedimentation rates. Through an statistical analysis of time series decomposition, it was verified that the metals flux to the area follow the cycles of rainy (austral summer and autumn) and dry seasons (austral winter and spring). In conclusion, the enrichment corresponds to the end of the 19th Century, when Santos Harbor was inaugurated, and to the 1970s, when Santos Harbor activities expanded. In addition, the analysis of the indexes and the temporal decomposition indicate that these elements' input to Bertioga Channel is due to natural processes of weathering and sedimentation. R E S U M O Este estudo apresenta uma avaliação da deposição de elementos potencialmente tóxicos no Canal de Bertioga (costa sudeste brasileira) ao longo de 150 anos, período principal de atividade antropogênica na área. O trabalho analisou cinco testemunhos sedimentares por meio de ICP-OES para determinar os níveis de metais (Cd, Cr, Cu, Ni, Pb e Zn) e As. O índice de carga de poluição (PLI) e o fator de enriquecimento (EF) foram calculados para identificar a toxicidade relativa dos elementos dos sedimentos e a contribuição antropogênica dos elementos investigados. Os índices indicaram a ausência de contaminação por metais pesados, mas houve uma entrada mais elevada de As nos testemunhos B2 e B5, amostrados em área com maiores taxas de sedimentação. Através de análise estatística de decomposição de séries temporais, verificou-se que o fluxo de metais para a área segue os ciclos de estações chuvosa (verão austral) e seca (inverno austral). Como conclusão pode ser verificado que o enriquecimento observado corresponde ao final do século XIX, quando o Porto de Santos foi inaugurado, e à década de 1970, quando as atividades do porto foram expandidas. Ainda, a análise dos índices e da decomposição temporal indica que a entrada de As no Canal de Bertioga dá- se por processos naturais de intemperismo e sedimentação. Descriptors: Potentially toxic elements, Enrichment factor, Sedimentation rates, Bertioga Channel. Descritores: Elementos potencialmente tóxicos, Fator de enriquecimento, Taxa de sedimentação, Canal de Bertioga. INTRODUCTION The Baixada Santista, located on the southeastern Brazilian coast, covers an area of approximately 2,423 km² (corresponding to around 1% of São Paulo state). The Baixada Santista is the third most heavily populated region in the state, with a population of 1.6 million distributed in nine cities (SEADE, 2010) (Fig. 1). Santos city hosts the largest Brazilian harbor, with traffic that exceeds one million containers per year (40% of the national volume) and 97.2 million t in 2011 (CODESP, 2011), ranking as the 39 th busiest harbor in the world. Another city, Cubatão, holds one of most important industrial parks in São Paulo state, with approximately 1,100 petrochemical, steel and civil construction factories
Transcript

BRAZILIAN JOURNAL OF OCEANOGRAPHY, 61(2):149-160, 2013

RECONSTRUCTION OF HISTORICAL TRENDS IN POTENTIALLY TOXIC

ELEMENTS FROM SEDIMENT CORES COLLECTED IN

BERTIOGA CHANNEL, SOUTHEASTERN BRAZIL

Cristina Gonçalves1, Rubens Cesar Lopes Figueira2, Juliê Rosemberg Sartoretto2, Alexandre Barbosa Salaroli2,

Andreza Portella Ribeiro3, Paulo Alves de Lima Ferreira2,* and Michel Michaelovitch de Mahiques2

1Consultoria, Planejamento e Estudos Ambientais (CPEA)

(Rua Henrique Monteiro, 90, São Paulo, SP, Brasil)

2Instituto Oceanográfico da Universidade de São Paulo (Praça do Oceanográfico, 191, 05508-120 São Paulo, SP, Brasil)

3Curso de Gestão Ambiental e Sustentabilidade, Universidade Nove de Julho (UNINOVE)

(Av. Francisco Matarazzo, 612, prédio C, andar térreo, Água Branca, São Paulo, SP, Brasil)

*Corresponding author: [email protected]

A B S T R A C T

The study presents an evaluation of potentially toxic elements deposition in Bertioga Channel (Southeastern Brazilian coast) along the last 150 years, the main anthropogenic activity period in the

area. Five sediment cores by means of ICP-OES to determine the levels of metals (Cd, Cr, Cu, Ni, Pb

and Zn) and As. The pollution load index (PLI) and enrichment factor (EF) were calculated to identify the relative elements toxicity of the sediments and the anthropogenic contribution of the

investigated elements. The indexes indicated the absence of contamination but a higher input of As in

cores B2 and B5, which have been sampled in an area that presents higher sedimentation rates. Through an statistical analysis of time series decomposition, it was verified that the metals flux to the

area follow the cycles of rainy (austral summer and autumn) and dry seasons (austral winter and

spring). In conclusion, the enrichment corresponds to the end of the 19th Century, when Santos Harbor was inaugurated, and to the 1970s, when Santos Harbor activities expanded. In addition, the

analysis of the indexes and the temporal decomposition indicate that these elements' input to Bertioga

Channel is due to natural processes of weathering and sedimentation.

R E S U M O Este estudo apresenta uma avaliação da deposição de elementos potencialmente tóxicos no Canal de

Bertioga (costa sudeste brasileira) ao longo de 150 anos, período principal de atividade antropogênica na área. O trabalho analisou cinco testemunhos sedimentares por meio de ICP-OES para determinar

os níveis de metais (Cd, Cr, Cu, Ni, Pb e Zn) e As. O índice de carga de poluição (PLI) e o fator de enriquecimento (EF) foram calculados para identificar a toxicidade relativa dos elementos dos

sedimentos e a contribuição antropogênica dos elementos investigados. Os índices indicaram a

ausência de contaminação por metais pesados, mas houve uma entrada mais elevada de As nos testemunhos B2 e B5, amostrados em área com maiores taxas de sedimentação. Através de análise

estatística de decomposição de séries temporais, verificou-se que o fluxo de metais para a área segue

os ciclos de estações chuvosa (verão austral) e seca (inverno austral). Como conclusão pode ser verificado que o enriquecimento observado corresponde ao final do século XIX, quando o Porto de

Santos foi inaugurado, e à década de 1970, quando as atividades do porto foram expandidas. Ainda, a

análise dos índices e da decomposição temporal indica que a entrada de As no Canal de Bertioga dá-se por processos naturais de intemperismo e sedimentação.

Descriptors: Potentially toxic elements, Enrichment factor, Sedimentation rates, Bertioga Channel.

Descritores: Elementos potencialmente tóxicos, Fator de enriquecimento, Taxa de sedimentação,

Canal de Bertioga.

INTRODUCTION

The Baixada Santista, located on the

southeastern Brazilian coast, covers an area of

approximately 2,423 km² (corresponding to around

1% of São Paulo state). The Baixada Santista is the

third most heavily populated region in the state, with a

population of 1.6 million distributed in nine cities

(SEADE, 2010) (Fig. 1). Santos city hosts the largest

Brazilian harbor, with traffic that exceeds one million

containers per year (40% of the national volume) and

97.2 million t in 2011 (CODESP, 2011), ranking as

the 39th busiest harbor in the world. Another city,

Cubatão, holds one of most important industrial parks

in São Paulo state, with approximately 1,100

petrochemical, steel and civil construction factories

(CBH-BS, 2011). Tourist and artisanal fishery

activities are also undertaken in the Baixada Santista.

Studies in this region have identified the degradation

of the environment due to both domestic and industrial

pollution, responsible for microbiological and

chemical contamination; physical alterations of

habitats due to erosion processes, silting up, channels

and mangrove embankments; and interventions in the

drainage system (CETESB, 2001).

Since sediments act as a major repository of

inorganic elements in the aquatic system, the pollution

in the aquatic environment of the Baixada Santista has

become a concern. Benthic biota is exposed to metallic

pollutants accumulated within the sediments, which

may transfer potentially toxic concentrations through

the food web to organisms on higher trophic levels.

The scientific community has shown increasing

interest in the area and studies on contamination in

sediments have been undertaken and contaminant

variability along sedimentary cores has been widely

evaluated to assess the history of toxic element

pollution in aquatic environments (BORDON et al.,

2011; FUKUMOTO (2007): http://www.teses.usp.br/teses/disponiveis/21/21133/tde-

06112007-110644/publico/Tese_MarinaFukumoto.pdf

HARIKUMAR et al., 2009; HORTELLANI et al.,

2008; IRABIEN et al., 2008; LUIZ-SILVA et al.,

2008; SILVA et al., 2011, TORRES,

2007 http://www.bdtd.ufscar.br/htdocs/tedeSimplifica

do//tde_busca/arquivo.php?codArquivo=2663).

Moreover, the levels of toxic elements are subject

to variations on a seasonal time scale due to changes

in the physical and chemical conditions of the

environment (LUIZ-SILVA et al., 2006).

The Bertioga Channel is one of the several

channels that constitute the Santos Estuarine Complex

(Fig. 1) which is considered a pristine environment.

This channel is 24 km long and up to 1 km wide.

Whereas the most degraded mangrove forests are

located in the Santos region, due to the influence of

industrial pollution, one of the least degraded is in

the Bertioga Channel (RODRIGUES et al., 1999),

which gives the area great potential for the retention of

anthropogenic substances.

Within this context, the main goal of

this study was to undertake research into the

potentially toxic elements in cores from the Bertioga

Channel. PLI (pollution load index) and EF

(enrichment factor) were determined and compared

with the age model obtained for the cores to evaluate

the trends of the impact of anthropic activities in this

region.

Fig. 1. Location of the study area and coring sites (black circles) along Bertioga Channel (a), São Paulo coast (b), Brazil (c).

150 BRAZILIAN JOURNAL OF OCEANOGRAPHY, 61(2), 2013

MATERIAL AND METHODS

Sampling

Five sediment cores were collected along the

Bertioga Channel (Fig. 1) in February 2010 using a

Rossfelder VT-1 vibracorer. The core lengths ranged

from 150 to 220 cm. To obtain undisturbed samples,

the cores were sliced every 2 cm using a stainless steel

spatula, and the sediment samples were freeze-dried

before further handling at LaQIMar (Laboratory of

Marine Inorganic Chemistry), located at the Instituto

Oceanográfico of the Universidade de São Paulo (IO-

USP, São Paulo, Brazil). Half of the sliced cores was

used for ICP-OES analyses, and the others were used

for radiometric dating.

Inductively Coupled Plasma-optical Emission Spectrometry

(ICP-OES)

The SW 846 US EPA 6010C method

(UNITED STATES, 2007) allowed the determination

of the following elements by ICP-OES using a Varian

MPX 710ES model: As, Cd, Cr, Cu, Ni, Pb and Zn. Sc

was also determined to calculate the EF values as a

normalizer.

The precision and accuracy were proved by

the analysis of replicates of the certified reference

materials SS1 and SS2 from EnvironMAT™ CRM

SPC Science. The precision was assessed by the

relative standard deviation, below 16% in all of the

elements, and the accuracy was achieved by relative

error, which was below 16%.

In addition, the quantification limits (QLs)

were calculated according to the definition of IUPAC

(IUPAC, 1997): QL = (10.sb)/s, in which sb is the

standard deviation of 10 background readings and s is

the sensibility of the methodology, corresponding to

the inclination parameter of the calibration curve made

with multiple readings of standard solutions with

known concentrations. Table 1 presents these results

and the practical quantification limits obtained for the

methodology used.

For this analysis, acidified aqueous sample

solutions were obtained by leaching 2 g of freeze-

dried sediment with HNO3, H2O2 and HCl according

to the SW 846 US EPA 3050B method (UNITED

STATES, 1996). It is important to mention that this

method involves a very strong acid digestion that

dissolves the “environmentally available” elements,

not including only those bound in the silicate

structures, which are not usually mobile in the

environment.

Table 1. Concentrations of potentially toxic elements (in mg kg-1) in standard reference materials. Quality control and

quantification limits of the methodology.

Element Reference

material

Certified concentration

(mg kg-1)

Measured

concentration

(mg kg-1)a

Precision

(RSD)

(%)

Accuracy

(RE)

(%)

Quantification limit

(mg kg-1)

As SS1 18.00 19.94±1.53

(n=8)

8% 11% 1.50

SS2 75.00 84.15±4.27

(n=8)

5% 12%

Cd SS1 34.00 29.78±1.16

(n=8)

4% 12% 0.25

SS2 b b b b

Cr SS1 64.00 60.07±16.60

(n=8)

11% 6% 0.50

SS2 34.00 34.62±5.57

(n=8)

16% 2%

Cu SS1 690.00 691.64±17.56

(n=8)

3% 0% 1.00

SS2 191.00 188.70±3.14

(n=8)

2% 1%

Ni SS1 231.00 212.74±9.16

(n=8)

4% 8% 1.00

SS2 53.00 50.30±2.68

(n=8)

5% 5%

Pb SS1 233.00 195.16±5.47

(n=8)

3% 16% 1.00

SS2 126.00 105.58±3.89

(n=8)

4% 16%

Zn SS1 c c c c 2.00

SS2 467.00 447.30±14.01

(n=8)

3% 4%

a Concentration values represented in the form (mean ± standard deviation). b Not a reference material for this element. c Reference material not measured for this element.

GONÇALVES ET AL.: HISTORIC OF TOXIC ELEMENTS IN BERTIOGA CHANNEL 151

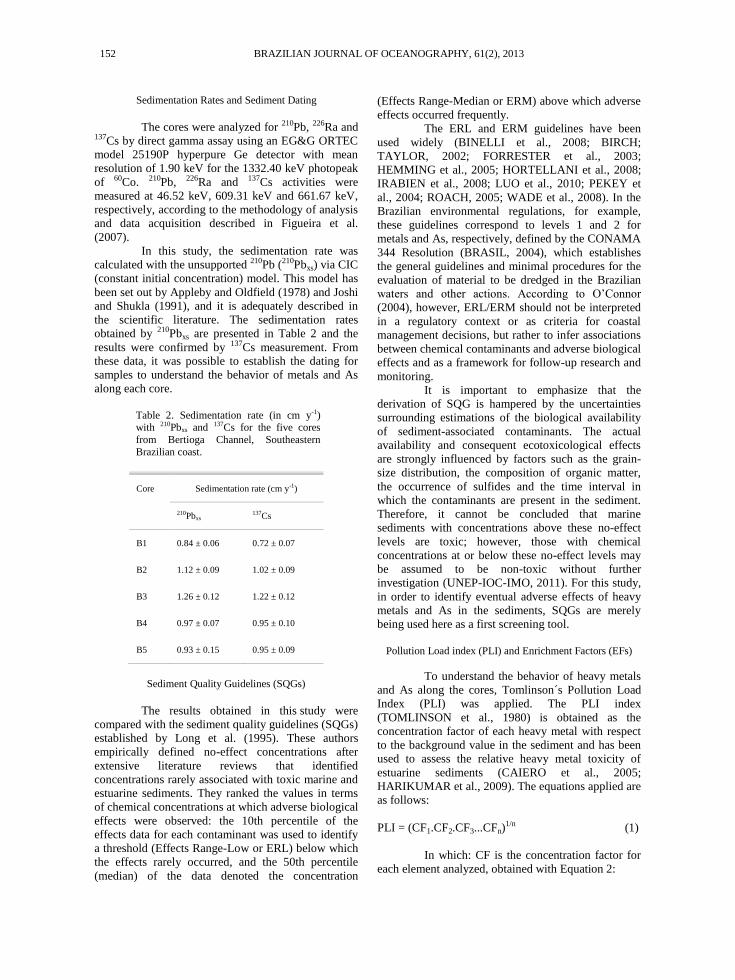
Sedimentation Rates and Sediment Dating

The cores were analyzed for 210Pb, 226Ra and 137Cs by direct gamma assay using an EG&G ORTEC

model 25190P hyperpure Ge detector with mean

resolution of 1.90 keV for the 1332.40 keV photopeak

of 60Co. 210Pb, 226Ra and 137Cs activities were

measured at 46.52 keV, 609.31 keV and 661.67 keV,

respectively, according to the methodology of analysis

and data acquisition described in Figueira et al.

(2007).

In this study, the sedimentation rate was

calculated with the unsupported 210Pb (210Pbxs) via CIC

(constant initial concentration) model. This model has

been set out by Appleby and Oldfield (1978) and Joshi

and Shukla (1991), and it is adequately described in

the scientific literature. The sedimentation rates

obtained by 210Pbxs are presented in Table 2 and the

results were confirmed by 137Cs measurement. From

these data, it was possible to establish the dating for

samples to understand the behavior of metals and As

along each core.

Table 2. Sedimentation rate (in cm y-1) with 210Pbxs and 137Cs for the five cores

from Bertioga Channel, Southeastern

Brazilian coast.

Core Sedimentation rate (cm y-1)

210Pbxs 137Cs

B1 0.84 ± 0.06 0.72 ± 0.07

B2 1.12 ± 0.09 1.02 ± 0.09

B3 1.26 ± 0.12 1.22 ± 0.12

B4 0.97 ± 0.07 0.95 ± 0.10

B5 0.93 ± 0.15 0.95 ± 0.09

Sediment Quality Guidelines (SQGs)

The results obtained in this study were

compared with the sediment quality guidelines (SQGs)

established by Long et al. (1995). These authors

empirically defined no-effect concentrations after

extensive literature reviews that identified

concentrations rarely associated with toxic marine and

estuarine sediments. They ranked the values in terms

of chemical concentrations at which adverse biological

effects were observed: the 10th percentile of the

effects data for each contaminant was used to identify

a threshold (Effects Range-Low or ERL) below which

the effects rarely occurred, and the 50th percentile

(median) of the data denoted the concentration

(Effects Range-Median or ERM) above which adverse

effects occurred frequently.

The ERL and ERM guidelines have been

used widely (BINELLI et al., 2008; BIRCH;

TAYLOR, 2002; FORRESTER et al., 2003;

HEMMING et al., 2005; HORTELLANI et al., 2008;

IRABIEN et al., 2008; LUO et al., 2010; PEKEY et

al., 2004; ROACH, 2005; WADE et al., 2008). In the

Brazilian environmental regulations, for example,

these guidelines correspond to levels 1 and 2 for

metals and As, respectively, defined by the CONAMA

344 Resolution (BRASIL, 2004), which establishes

the general guidelines and minimal procedures for the

evaluation of material to be dredged in the Brazilian

waters and other actions. According to O’Connor

(2004), however, ERL/ERM should not be interpreted

in a regulatory context or as criteria for coastal

management decisions, but rather to infer associations

between chemical contaminants and adverse biological

effects and as a framework for follow-up research and

monitoring.

It is important to emphasize that the

derivation of SQG is hampered by the uncertainties

surrounding estimations of the biological availability

of sediment-associated contaminants. The actual

availability and consequent ecotoxicological effects

are strongly influenced by factors such as the grain-

size distribution, the composition of organic matter,

the occurrence of sulfides and the time interval in

which the contaminants are present in the sediment.

Therefore, it cannot be concluded that marine

sediments with concentrations above these no-effect

levels are toxic; however, those with chemical

concentrations at or below these no-effect levels may

be assumed to be non-toxic without further

investigation (UNEP-IOC-IMO, 2011). For this study,

in order to identify eventual adverse effects of heavy

metals and As in the sediments, SQGs are merely

being used here as a first screening tool.

Pollution Load index (PLI) and Enrichment Factors (EFs)

To understand the behavior of heavy metals

and As along the cores, Tomlinson´s Pollution Load

Index (PLI) was applied. The PLI index

(TOMLINSON et al., 1980) is obtained as the

concentration factor of each heavy metal with respect

to the background value in the sediment and has been

used to assess the relative heavy metal toxicity of

estuarine sediments (CAIERO et al., 2005;

HARIKUMAR et al., 2009). The equations applied are

as follows:

PLI = (CF1.CF2.CF3...CFn)1/n (1)

In which: CF is the concentration factor for

each element analyzed, obtained with Equation 2:

152 BRAZILIAN JOURNAL OF OCEANOGRAPHY, 61(2), 2013

CFmetal = (Cmetal/Cbackground) (2)

In which: Cmetal is the element

concentration at a particular depth of the core, and

Cbackground is the element concentration at the bottom of

the core.

The PLI index represents the number of

times that the heavy metal concentration in the

sediment exceeds the background concentration, and it

provides a summative indication of the overall level of

heavy metal toxicity in a particular sample. The PLI

varies from 0 to 10, where 0 means no pollution and

10 indicates extreme pollution (PRAVEENA et al.,

2007).

Because PLI is based on the CF

(concentration factor), which is not normalized,

fluctuations due to grain size can contribute to the

misinterpretation of the values obtained. Therefore,

the enrichment factor, as described by SZEFER et al.

(1998), was also applied in this study. The EF

calculation is used to reduce the metal variability

associated with variations in grain size, and it is a

convenient tool for plotting geochemical trends across

large geographical areas which may have substantial

variations in grain size. The EF is defined as the ratio

between the trace element concentration of the sample

and that same element’s baseline concentration

(Equation 3). In this study, Sc was used as the

conservative element:

EF = [(Ci/Cn)sample/(Ci/Cn)baseline] (3)

In which: Ci is the element concentration at a

particular depth in the core, Cn is the normalizing

element concentration at a particular depth of the core,

Ci baseline is the element concentration in the bottom

sediment core, and Cn baseline is the scandium

concentration in the bottom sediment core.

Five categories were established to assess

the degree of enrichment and contamination

(ANDREWS; Sutherland, 2004; MAHIQUES et al.,

2009): EF < 2 defines a situation of no contamination;

EF between 2 and 5 represents moderate

contamination; EF between 5 and 20 represents

significant contamination; EF between 20 and 40

represents very high contamination; and EF > 40

represents extreme contamination.

The element mostly used for marine

sediment normalization is aluminum (Al) since it

represents aluminosilicates, the main group of

minerals generally found in the fine sediment

fractions. Aluminum is supposed to be derived with

the detrital minerals from the continent to the sea, and

it has negligible anthropogenic input and behaves

conservatively in normal marine environments

(HERUT; SANDLER, 2006). However, because the

preparation method applied in this study partially

dissolves the elements present in the samples, the

aluminum concentrations would be subjected to

analytical oscillations, leading to misinterpretation

when applying Al as a normalizing element. Scandium

was used in previous surveys as a normalizing element

(ACKERMAN, 1980; GROUSSET et al., 1995) and

was applied in this project.

Time Series Decomposition

Time series decomposition was used in order

to further study the temporal evolution of potentially

toxic element concentrations, as it will allow the

evaluation of seasonal variation in these elements’

input in Bertioga Channel. The model chosen was the

multiplicative one, in which the seasonal pattern

variation is proportional to the levels of elements. In

other words, the changing seasons magnify or

diminish the concentration of the elements. Equation 4

represents the multiplicative model.

C = L.S + R (4)

In which: C is the concentration of the

element studied, L is the linear evolution in time of the

concentration of the element studied, S is the seasonal

index for the time period, and R is the statistical

residue.

For the application of Equation 4, the chosen

number of seasonal indexes is four, each

corresponding to one of the seasons of the year:

summer, autumn, winter and spring. Software package

Minitab® 16 from Minitab Inc. was used to make the

time series decomposition as explained above.

RESULTS AND DISCUSSION

Table 3 presents the results obtained (based

on “environmentally available” digestion) from the

bottom and top of each of the five cores from Bertioga

Channel. Figures 2 to 6 present the heavy metals and

As levels along the five cores. For comparison with

the data obtained, the ERL/ERM values are included

in Table 1 and in Figures 2 to 6 (ERL values as

continuous lines) for each element.

All heavy metals results were below the

ERL (no-effect level). Therefore, based on these

results, it may be assumed that the sediments collected

along Bertioga Channel are non-toxic and not

potentially harmful to the marine biota. For As, most

of the samples exceeded the ERL of 8.2 mg kg-1,

particularly in cores B3, B4 and B5 (Figs 2-6), but all

the results were below the ERM (effect range-

medium, in which the probability of adverse biological

effects is higher).

GONÇALVES ET AL.: HISTORIC OF TOXIC ELEMENTS IN BERTIOGA CHANNEL 153

Table 3. Comparison between SQGs as defined by Long et al. (1995) and the results obtained for the five cores (top and bottom) from Bertioga Channel, Southeastern Brazilian coast.

Element ERL ERM B1 B2 B3 B4 B5

Top Bottom Top Bottom Top Bottom Top Bottom Top Bottom

As 8.20 70.00 10.56 7.58 9.56 5.31 15.59 13.84 18.58 13.95 18.36 8.92

Cr 81.00 370.00 34.57 26.43 9.37 9.94 33.16 39.90 30.73 43.24 32.16 41.34

Cu 34.00 270.00 8.25 6.47 3.66 2.26 7.98 8.52 8.62 9.06 12.00 8.16

Ni 20.90 51.60 11.70 10.04 3.80 3.93 11.92 14.05 13.71 16.54 13.80 15.95

Pb 46.70 218.00 10.02 10.89 5.71 4.96 16.49 16.01 14.14 16.71 16.15 16.14

Zn 150.00 410.00 57.84 43.67 22.79 20.01 53.23 54.63 56.27 56.77 68.16 58.51

Fig. 2. Heavy metals and As levels (in mg kg-1) in B1 core from Bertioga Channel,

Southeastern Brazilian coast. Dashed lines represent the ERL values.

Fig. 3. Heavy metals and As levels (in mg kg-1) in B2 core from Bertioga Channel,

Southeastern Brazilian coast. Dashed lines represent the ERL values.

140 BRAZILIAN JOURNAL OF OCEANOGRAPHY, 61(2), 2013

154 BRAZILIAN JOURNAL OF OCEANOGRAPHY, 61(2), 2013

Fig. 4. Heavy metals and As levels (in mg kg-1) in B2 core from Bertioga Channel,

Southeastern Brazilian coast. Dashed lines represent the ERL values.

Fig. 5. Heavy metals and As levels (in mg kg-1) in B4 core from Bertioga Channel,

Southeastern Brazilian coast. Dashed lines represent the ERL values.

Fig. 6. Heavy metals and As levels (in mg kg-1) in B5 core from Bertioga Channel, Southeastern Brazilian coast. Dashed lines represent the ERL values.

PLI was calculated to assess the relative

heavy metals and As toxicity of the sediments. Figure

7 presents the PLI along the five cores collected from

Bertioga Channel. The PLI values obtained were

between 0.5 and 1.5, indicating no significant

contamination.

GONÇALVES ET AL.: HISTORIC OF TOXIC ELEMENTS IN BERTIOGA CHANNEL 155

Fig. 7. Tomlinson Pollution Load Index (PLI) obtained for the five cores from

Bertioga Channel, Southeastern Brazilian coast. Dashed lines represent PLI = 1.

As mentioned earlier, the PLI index is based

on the concentration factor, which is not normalized;

therefore, fluctuations due to grain size can contribute

to misinterpretation of the values obtained. Thus, to

assess the degree of sediment contamination,

enrichment factors (EFs) were calculated using Sc as a

normalizer element. Table 4 presents the EF ranges

obtained for each core. The EF was not calculated for

Cd because all the results were below the sample

quantification limit (< 0.25 mg kg-1). As may be

observed in Table 4, EFs were, in general, lower than

2 for all cores, indicating a minimal pollution for the

region. However, an EF above 2 was found for As in

Bertioga cores 2 and 5.

Figure 8 presents As EFs in the five cores

collected along Bertioga Channel. Although As was

quantified above the ERL in all five cores, the EFs

were lower than 2, indicating that it is likely that As

background levels in Baixada Santista sediments are

higher than the ERL. However, As enrichment was

observed particularly at 146-148 cm in core B2 and at

0-40 cm in core B5. According to the 210Pbxs-based

age-model, these depths correspond to the end of the

19th century, when Santos Harbor was inaugurated,

and to the 1970s, when Santos Harbor activities

were expanded.

Cores B2 and B5 are located at Largo do

Candinho, the watershed of the Santos and Bertioga

areas, a location that presents the highest

sedimentation rates in the region. This condition

potentially favors metal and other pollutant

accumulations coming from the Santos estuarine

system, which is already contaminated by pollutants

from the Cubatão industries. The results obtained in

the cores analyzed here show a similar behavior to

those obtained by CETESB (Technology Company of

Environmental Sanitation, associated with the

Environment Secretariat of São Paulo Government) in

a survey undertaken in 2001, where As concentrations

were as high as 18 mg kg-1 in Largo do Candinho.

That study included several cities of the Baixada

Santista and, of the three superficial sediment samples

collected in the Bertioga region, that from Largo do

Candinho also had Zn, Cd, Pb and Cu concentrations

above the ERL.

Table 4. EF ranges for the five cores from Bertioga Channel, Southeastern Brazilian coast.

Core As Cr Cu Ni Pb Zn EF

B1 0.80-1.55 0.90-1.13 0.95-1.29 0.88-1.20 0.77-1.07 0.97-1.29 no contamination

B2 0.68-2.36 0.88-1.13 0.80-1.74 0.94-1.19 0.62-1.42 0.86-1.28 moderate contamination (As)

B3 0.76-1.61 0.96-1.12 0.92-1.28 0.98-1.20 0.85-1.34 0.97-1.36 no contamination

B4 0.75-1.93 0.95-1.90 0.99-1.62 0.97-1.28 0.85-1.40 0.96-1.44 no contamination

B5 0.97-3.45 0.97-1.18 0.95-1.93 0.95-1.30 0.81-1.32 0.94-1.54 moderate contamination (As)

156 BRAZILIAN JOURNAL OF OCEANOGRAPHY, 61(2), 2013

Table 5 presents a summary of the surveys

performed in the area investigated. Silva et al. (2011)

determined the metals and As in the sediment cores at

35-100 cm from Baixada Santista, including three

points in the Bertioga region. These authors quantified

As, Cr and Zn levels above the ERL in the muddy

fraction (<0.075 mm) of the core collected from Largo

do Candinho, where the B2 and B5 cores were

sampled.

Quináglia (2006) http://www.teses.usp.br/teses/

disponiveis/46/46133/tde-09022007-133741/publico/

TeseGilsonQuinaglia.pdf established background levels

for 23 elements in the Baixada Santista after analyses

of extracts obtained by environmentally available

digestion in the <2 mm fraction of superficial

sediment samples collected at eight points along the

Bertioga Channel. All results were below the ERL,

except that for As. The author suggested that As

concentrations are most likely associated with the

composition of the samples, being naturally present in

the sediments of this region. Luiz-Silva et al. (2008)

determined concentrations of 38 elements in a 260-

cm-long sediment core collected from the Morrão

River estuary in the Baixada Santista. These

researchers found approximately 15 mg kg-1 of As in

the 220-260 cm depth interval, corresponding to the

concentration before the industrialization of the

watershed.

The results obtained for As in this study are

similar to those of other studies, and they confirm that

the concentration of this element is relatively high in

this region. As occurs as a major constituent in more

than 200 minerals and may occur naturally in aquatic

environments from the weathering of primary and

secondary minerals (DATTA et al., 2007).

As is a highly toxic element for marine

organisms, since its inorganic compounds (e.g.

tetramethylarsonium, trimethylarsinic oxide) and

organic ones (e.g. arsenosugars, arsenobetaine) are

toxic and are present in marine organisms (LAM et al.,

2004; SAEKI et al., 2000). In benthic invertebrates,

such as mollusks, crustaceans and echinoderms, which

are in direct contact with the sediment, As may attack

and break proteins, remove phosphate from

their compounds, such as DNA, and elicit redox

reactions that lead to the formation of reactive oxygen

forms like O2-, H2O2, OH- in the organism

(JAKIMSKA et al., 2011).

Table 5. Potentially toxic element levels (in mg kg-1) in sediments from different surveys undertaken in Baixada Santista,

Southeastern Brazilian coast.

Reference Fraction Depth (cm) As Cr Cu Ni Pb Zn

This study <2 mm 0-205 4.31-23.59 5.66-55.89 1.40-13.09 2.41-21.06 2.69-16.71 13.13-74.32

Silva et al.

(2011)

<0.075 mm 35-100 1-20 7-162 - - - 29-343

CETESB

(2001)

<2 mm superficial 0.1-3.0 6.2-34.0 5.6-100.0 3.0-17.0 6.7-66.0 15.5-214.0

Quináglia

(2006)

<2 mm superficial 9.84 ± 1.99 27.8 ±

3.04

11.00 ± 3.34 11.1 ± 1.98 <0.26 63.8 ± 11.6

Luiz-Silva et al.

(2008)

<2 mm 220-260 14.6 ± 0.8 75 ± 2 18.78 ± 0.23 27.1 ± 0.6 29.52 ± 3.66 92 ± 5

Fig. 8. As enrichment factor (EF) obtained for the five cores from Bertioga

Channel, Southeastern Brazilian coast. Dashed lines represent EF = 2.

GONÇALVES ET AL.: HISTORIC OF TOXIC ELEMENTS IN BERTIOGA CHANNEL 157

Santos Harbor was inaugurated in 1892, and

since then the enrichment of As has tended to increase

(Fig. 8). The harbor's construction and growth,

involving activities such as ground excavations,

dredging and residue discharges may have caused

modifications in the sedimentological patterns in the

region that lead to As enrichment as it is naturally

enriched in the region. In the specific case of the B5

profile, located near Largo do Candinho with higher

sedimentation rates, the hydrodynamic favorable to

deposition and, perhaps, the presence of fine

sediments and high organic carbon content due to

surrounding mangrove forests may have favored this

observed enrichment of As.

In addition, in order to evaluate whether

there is a temporal pattern in the element input into the

Bertioga Channel, time series decomposition was used

to assess indexes corresponding to the weight of each

season in the heavy metals and As observed signal.

For all cores the comparison between the observed and

modeled data presented high (r > 0.99) and statistically

significant (p < 0.05) correlation. Table 6 presents the

elements’ seasonal indexes for the season for all cores.

To evaluate whether there are differences

between the seasons for the elements of interest and

the interaction between both these factors (season and

elements), two-way analysis of variance (two-way

ANOVA) was applied using the seasonal indexes as

data input. Anderson-Darling and Levene’s tests were

used to check the assumptions of normality and

homocedasticity of data residues, both complied

within a level of significance of 5%. Table 7 presents

the results of this analysis. It can be seen that there is

no difference (p > 0.05) in the seasonal indexes

between the elements, and there is a difference (p <

0.05) in the seasonal indexes between the seasons,

with higher indexes in the summer and spring. Also, in

the evaluation of the cause of this distinction between

the seasons, it is not due to the differences between the

elements of interest, as the interaction between these

factors is statistically not significant (p > 0.05).

According to DAEE (1999) and SÃO

PAULO (2001), the rainy season of the Santos

region occurs between October and April,

corresponding to the austral spring and summer, with a

mean daily level of between 30 and 180 mm. This may

be the cause of the difference in the observed seasonal

indexes, as in the rainy season the processes of

weathering and sedimentation are intensified,

increasing the input of heavy metals and As in the

sediments of the Santos region, of which the Bertioga

Channel is a part. This corroborates the absence of any

contamination of heavy metals, in accordance with the

PLI and EF values and the enrichment of As in the

region, as this enrichment is probably due to natural

processes, acting on the naturally As enriched rocks

surrounding this area.

Table 6. Seasonal indexes of potentially toxic elements for the seasons of the year in the five cores from Bertioga

Channel.

Core Season As Cr Cu Ni Pb Zn

B1 summer 0.13 0.46 0.07 0.02 0.16 0.17

autumn -0.09 0.25 0.12 0.06 -0.09 0.30

winter -0.01 -0.31 -0.11 -0.05 -0.02 0.24

spring -0,02 -0.39 -0.09 -0.03 -0.06 -0.70

B2 summer 0.09 0.30 0.06 0.11 0.04 -0.01

autumn -0.26 -0.25 -0.06 -0.12 -0.11 -0.59

winter 0.13 -0.17 -0.04 -0.06 -0.01 0.00

spring 0.04 0.13 0.04 0.07 0.07 0.60

B3 summer -0.10 0.27 0.07 0.11 -0.13 -0.46

autumn 0.04 -0.49 -0.17 -0.23 0.06 -0.13

winter -0.27 -0.58 -0.02 -0.19 -0.01 -0.73

spring 0.33 0.80 0.12 0.31 0.08 1.32

B4 summer -0.03 -0.05 0.08 0.03 -0.05 0.40

autumn -0.13 -0.26 -0.09 -0.08 0.00 -0.12

winter -0.03 0.09 -0.01 -0.02 -0.04 -0.57

spring 0.19 0.23 0.02 0.07 0.09 0.29

B5 summer 0.26 1.09 0.10 0.56 0.34 0.91

autumn 0.00 -0.65 -0.03 -0.26 -0.15 -0.42

winter -0.29 -0.61 -0.12 -0.26 -0.13 -0.47

spring 0.02 0.17 0.05 -0.04 -0.05 -0.01

Table 7. Two-way analysis of variance (α =

0.05) of the seasonal indexes for the levels of

potentially toxic elements and the seasons of the year for the five cores of Bertioga Channel.

Factors F p

Elements 0.00 1.000

Seasons 10.52 0.001

Interaction between factors 1.09 0.372

ACKNOWLEDGEMENTS

The authors would like to thank the

Fundação de Amparo à Pesquisa do Estado de São

Paulo (FAPESP no 2009/01211-0) for all their

financial support.

REFERENCES

ACKERMAN, F. A procedure for correcting grain size effect in heavy metal analysis of estuaries and coastal

sediments. Environ. Technol. Lett., v. 1, p. 518-527,

1980.

158 BRAZILIAN JOURNAL OF OCEANOGRAPHY, 61(2), 2013

ANDREWS, S.; SUTHERLAND, R. A. Cu, Pb and Zn contamination in Nuuanu watershed, Oahu, Hawaii. Sci.

Total Environ., v. 324, n. 1/3, p. 173-182, 2004.

BINELLI, A.; SARKAR, S. K.; CHATTERJEE, M.; RIVA, C.; PAROLINI, M.; BHATTACHARYA, B.;

BHATTACHARYA, A. K.; SATPATHY, K. K. A

comparison of sediment quality guidelines for toxicity assessment in the Sunderban wetlands (Bay of Bengal,

India). Chemosphere, v. 73, n. 7, p. 1129-1137, 2008.

BIRCH, G. F.; TAYLOR, S. E. Application of sediment quality guidelines in the assessment and management of

contaminated superficial sediments in Port Jackson

(Sydney Harbour), Australia. Environ. Manage., v. 29, n. 6, p. 860-870, 2002.

BORDON, I. C. A. C.; SARKIS, J. E. S.; GOBBATO, G. M.;

HORTELLANI, M. A.; PEIXOTO, C. M. Metal

concentration in sediments from the Santos estuarine

system: a recent assessment. J. Braz. Chem. Soc., v. 22,

n. 10, p. 1858-1865, 2011. BRASIL. Ministério do Meio Ambiente. Conselho Nacional

do Meio Ambiente. Resolução n.344, de 25 de março

de 2004. Estabelece as diretrizes gerais e os procedimentos mínimos para a avaliação do material a

ser dragado em águas jurisdicionais brasileiras, e dá

outras providências. Disponível em: http://www.mma.gov.br/port/conama/legiabre.cfm?codle

gi=445. Acesso em: 11 dez 2012.

CAIERO, S.; COSTA, M. H.; RAMOS, T. B.; FERNANDES, F.; SILVEIRA, N.; COIMBRA, A.;

MEDEIROS, G.; PAINHO, M. Assessing heavy metal

contamination in Sado Estuary sediment: an index analysis approach. Ecol. Indic., v. 5, n. 2, p. 151-169,

2005.

CBH-BS (Comitê da Bacia Hidrográfica da Baixada Santista). Relatório de situação: recursos hídricos da

Baixada Santista. Santos: CBH-BS, 2011. 44 p.

(Relatório cinco, UGRHI 07). Disponível em: http://www.sigrh.sp.gov.br/sigrh/ARQS/RELATORIO/C

RH/CBH-BS/1573/rs%202011%20cbh-

bs%20versao%20final.pdf. Acesso em: 1 mai 2013. CETESB (Companhia de Tecnologia de Saneamento

Ambiental). Sistema Estuarino Santos e São Vicente.

São Paulo: CETESB, 2001. 183 p. Disponível em: http://www.acpo.org.br/biblioteca/06_areas_contaminada

s_%20saturadas/relatorio_sistema_estuarino_santos_sv.p

df. Acesso em: 4 jan 2013. CODESP (Companhia Docas do Estado de São Paulo). Porto

de Santos: relatório anual 2011. Santos: CODESP, 2011.

131 p. Disponível em: http://201.33.127.41/down/relatorio/Relatorio2011.pdf.

Acesso em: 29 abr 2013.

DAEE (DEPARTAMENTO DE ÁGUAS E ENERGIA ELÉTRICA). Banco de dados pluviográficos do

Estado de São Paulo. In: FUNDAÇÂO DO CENTRO TECNOLÓGICO E HIDRÁULICA – USP. CD-ROM.

1999.

DATTA, R.; MAKRIS, K. C.; SARKAR, D. Arsenic fractionation and bioaccessibility in two alkaline Texas

soils incubated with sodium arsenate. Arch. Environ.

Contam. Toxicol., v. 52, n. 4, p. 475-482, 2007. FIGUEIRA, R. C. L.; GONZALEZ TESSLER, M.;

MICHAELOVITCH DE MAHIQUES, M.;

FUKUMOTO, M. M. Is there a technique for the

determination of sedimentation rates based on calcium

carbonate content?: a comparative study on the Southeastern Brazilian shelf. Soils Found., v. 47, n.. 4,

p. 649-656, 2007.

FORRESTER, G. E.; FREDERICKS, B. I.; GERDEMAN, D.; EVANS, B.; STEELE, M. A.; ZAYED, K.;

SCHWEITZER, L. E.; SUFFET, I. H.; VANCE, R. R.;

AMBROSE, R. F. Growth of estuarine fish is associated with the combined concentration of sediment

contaminants and shows no adaptation or acclimation to

past conditions. Mar. Environ. Res., v. 56, n. 3, p. 423-442, 2003.

GROUSSET, F. E..; QUETEL, C. R.; THOMAS B.;

DONARD, O. F. X.; LAMBERT, C. E.; GUILLARD, F.; MONACO, A. Anthropogenic vs. lithogenic origins

of trace elements (As, Cd, Pb, Rb, Sb, Sc, Sn, Zn) in

water column particles: northwestern Mediterranean Sea.

Mar. Chem., v. 48, n. 3/4, p. 291-310, 1995.

HARIKUMAR, P. S.; NASIR, U. P.; MAJEEBU, R.

Distribution of heavy metals in the core sediments of a tropical wetland system. Int. J. Environ. Sci. Technol.,

v. 6, n. 2, p. 225-232, 2009.

HEMMING, J. M.; BROWN, J. M.; BRIM, M.; JARVIS, R. Sediment quality survey of the Choctawhatchee Bay

system in the Florida panhandle. Mar. Pollut. Bull., v.

50, n. 8, p. 889-898, 2005. HERUT, B.; SANDLER, A. Normalization methods for

pollutants in marine sediments: review and

recommendations for the Mediterranean. New York: UNEP/MAP, 2006. p. 23. (IOLR Report H18/2006).

Disponível em:

http://www.sednet.org/download/0604_herut_and_sandler_report.pdf. Acesso em: 27 nov 2012.

HORTELLANI, M. A.; SARKIS, J. E. S.; ABESSA,

D. M. S.; SOUSA, E. C. P. M. Avaliação da contaminação por elementos metálicos dos sedimentos

do Estuário Santos - São Vicente. Quim. Nova, v. 31, n.

1, p. 10-19, 2008. UNEP-IOC-IMO (United Nations Environmental Programme

– Intergovernmental Oceanographic Commission –

International Maritime Organization). Guidance on

assessment of sediment quality: global investigation of

pollution in the marine environment (GIPME) (IOC-

UNEP-IMO). London: International Maritime Organization, 2011. 19 p.

IRABIEN, M. J.; CEARRETA, A.; LEORRI, E.; GÓMEZ,

J.; VIGURI, J. A 130 year record of pollution in the Suances estuary (southern Bay of Biscay): implications

for the environmental management. Mar. Pollut. Bull.,

v. 56, n. 10, p. 1719-1727, 2008. IUPAC (International Union of Pure and Applied Chemistry).

Compendium of chemical terminology: IUPAC

recommendations. 2.ed. Oxford: Blackwell Scientific, 1997. 456 p.

JAKIMSKA, A.; KONIECZKA, P.; SKÓRA, K.; NAMIESNK, J. Bioaccumulation of metals in tissues of

marine animals. Part I: The role and impact of heavy

metals on organisms. Pol. J. Environ. Stud., v. 20, n. 5, p. 1117-1125, 2011.

LAM, J. C. W.; TANABE, S.; CHAN, S. K.; YUEN, E. K.;

LAM, M. H.; LAM, P. K. Trace element residues in tissues of green turtles (Chelonia mydas) from south

China waters. Mar. Pollut. Bull., v. 48, n. 1/2, p. 174-

182, 2004.

GONÇALVES ET AL.: HISTORIC OF TOXIC ELEMENTS IN BERTIOGA CHANNEL 159

LONG, E. R.; MACDONALD, D. D.; SMITH, S. L.; CALDER, F. D. Incidence of adverse biological effects

within ranges of chemical concentrations in marine and

estuarine sediments. Environ. Manage., v. 19, n. 1, p. 81-97, 1995.

LUIZ-SILVA, W.; MATOS‚ R. H. R.; KRISTOSCH‚ G. C.;

MACHADO‚ W. Variabilidade espacial e sazonal da concentração de elementos-traço em sedimentos do

sistema estuarino de Santos-Cubatão (SP). Quim. Nova,

v. 29, n. 2, p. 256-263, 2006. LUIZ-SILVA, W.; WILSON, M.; MATOS, R. H. R. Multi-

elemental contamination and historic record in sediments

from the Santos-Cubatão Estuarine System, Brazil. J.

Braz. Chem. Soc., v. 19, n. 8, p. 1490-1500, 2008.

LUO, W. ; WANG, T.; HU, W.; JIAO, W.; NAILE, JE.;

KHIM, JS.; GIESY, JP. Ecological risk assessment of

arsenic and metals in sediments of coastal areas of

northern Bohai and Yellow Seas, China. Ambio, v. 39, n.

5/6, p. 367-375, 2010. MAHIQUES, M. M.; BURONE, L.; FIGUEIRA, R. C. L.;

LAVENÉRE-WANDERLEY, A. A. O.; CAPELLARI,

B.; ROGACHESKI, C. E.; BARROSO, C. P.; SANTOS, L. A. S.; CORDERO, L. M.; CUSSIOLI, M. C.

Anthropogenic influences in a lagoonal environment: a

multiproxy approach at Valo Grande mouth, Cananéia-Iguape system (SE Brazil). Braz. J. Oceanogr., v. 57, n.

4, p. 325-337, 2009.

O’CONNOR, T. P. The sediment quality guideline, ERL, is not a chemical concentration at the threshold of sediment

toxicity. Mar. Pollut. Bull., v. 49, p. 383-385, 2004.

PEKEY, H.; KARAKAŞ, D.; AYBERK, S.; TOLUN, L.; BAKOĞLU, M. Ecological risk assessment using trace

elements from surface sediments of Izmit Bay

(northeastern Marmara Sea, Turkey). Mar. Pollut. Bull., v. 48, n. 9/10, p. 946-953, 2004.

PRAVEENA, S. M.; RADOJEVIC, M.; ABDULLAH, M. H.

The assessment of mangrove sediment quality in Mengakabong lagoon: An index analysis approach. Int.

J. Environ. Sci. Educ., v. 2, n. 3, p. 60-68, 2007.

ROACH, A. C. Assessment of metals in sediments from Lake Macquarie, New South Wales, Australia, using

normalisation models and sediment quality guidelines.

Mar. Environ. Res., v. 59, n. 5, p. 453-472, 2005.

RODRIGUES, F. O.; LAMPARELLI, C. C.; MOURA, D. O. Environmental impact in mangrove ecosystems: São

Paulo, Brazil. In: YÁNEZ-ARANCIBIA, A.; LARA-

DOMÍNGUEZ, A. L. (Eds.). Ecosistemas de manglar

en América Tropical. México: Instituto de Ecología

A.C.; San Jose: UICN/ORMA; Silver Spring:

NOAA/NMFS, 1999. p. 175-198 SAEKI, K.; SAKAKIBARA, H.; SAKAI, H.; KUNITO, T.;

TANABE, S. Arsenic accumulation in three species of

sea turtles. BioMetals, v. 13, n. 3, p. 241-250, 2000. SÃO PAULO (Estado). Secretaria de Estado do Meio

Ambiente. Relatório do Sistema Estuarino Santos e

São Vicente. São Paulo: Companhia de Tecnologia de Saneamento Ambiental (CETESB), 2001. 183 p.

SEADE (Fundação Sistema Estuadual de Análise de Dados).

São Paulo em dados, 2010. Disponível em:

http://www.seade.gov.br. Acesso em: 8 abr. 2013.

SILVA, P. S. C.; DAMATTO, S. R.; MALDONADO, C.;

FÁVARO, D. I.; MAZZILLI, B. P. Metal distribution in sediment cores from São Paulo State Coast, Brasil. Mar.

Pollut. Bull., v. 62, n. 5, p. 1030-1039, 2011.

SZEFER, P.; GLASBY, G.P.; KUSAK, A.; SZEFER, K.; JANKOWSKA, H.; WOLOWICZ, M.; ALI, A.A.

Evaluation of the anthropogenic influx of metallic

pollutants into Puck Bay, southern Baltic. Appl.

Geochem., v. 13, n. 3, p. 293-304, 1998.

TOMLINSON, D. C. ; WILSON, J. G.; HARRIS, C. R.;

JEFFREY, D. W. Problems in the assessment of heavy-metals levels in estuaries and the formation of a pollution

index. Helgol. Meeresunters., v. 33, n. 1/4, p. 566-575,

1980. UNITED STATES. Environmental Protection Agency.

Method 3050B: Acid digestion of sediments, sludges,

and soils. San Francisco: EPA, 1996. 12 p. UNITED STATES. Environmental Protection Agency.

Method 6010C: Inductively coupled plasma - atomic

emission spectrometry. San Francisco: EPA, 2007. 34 p. WADE, T. L.; SWEET, S. T.; KLEIN, A. G. Assessment of

sediment contamination in Casco Bay, Maine, USA.

Environ. Pollut., v. 152, n. 3, p. 505-521, 2008.

(Manuscript received 13 December 2012; revised

19 May 2013; accepted 15 June 2013)

160 BRAZILIAN JOURNAL OF OCEANOGRAPHY, 61(2), 2013


Recommended