RECYCLING OF LEAD-CONTAMINATED BLASTING SAND IN CONSTRUCTION MATERIALS POLLUTlON PREVENTION PAYS PROGRAM NORTH CAROLINA DEPARTMENT OF NATURAL RESOURCES AND COMMUNITY DEVELOPMENT James G Martin Governor, North Carolina S Thomas Rhodes Secretary NRCD
POLLUTlON PREVENTION PAYS PROGRAMNORTH CAROLINA DEPARTMENT OF NATURAL RESOURCES AND COMMUNITY DEVELOPMENT
James G MartinGovernor, North Carolina
S Thomas RhodesSecretary NRCD
"Recycling of Lead-Contaminated Blasting Sandin Construction Materials"
by
N. Paul KhoslaProfessor of Civil EngineeringNORTH CAROLINA STATE UNIVERSITY
and
Michael L. LemingLecturer-of Civil Engineering
NORTH CAROLINA STATE UNIVERSITY
This project was supported by the PollutionPrevention Pays Program through a grant from theNorth Carolina Board of Science and Technology
C O P Y R I G H T
Pollution Prevention ProgramN. C. Department of Natural Resources & Community Development
June 1988
THE POLLUTION PREVENTION PROGRAM
The Pollution Prevention Program provides free technical assistance toNorth Carolina industries and municipalities on ways to reduce, recycleand prevent wastes before they become pollutants. This non-regulatoryprogram, located in the Division of Environmental Management, addresseswater and air quality, toxic materials, and solid and hazardous waste.Designated as the lead agency in waste reduction, the Program works incooperation with the Solid and Hazardous Waste Management Branch andthe Governor's Waste Management Board. The services and assistanceavailable fall into the following categories:
Information Clearinghouse. An information data base provides access toliterature sources, contacts, and case studies on waste reductiontechniques for specific industries or waste streams. Information isalso available through customized computer literature searches. Wastereduction reports published by the Program are also available.
Specific Information Packages. The staff can prepare facility orwaste-stream-specific waste reduction reports for industries andcommunities. Information provided by the facility is used to identifycost-effective waste reduction options. A short report detailing theseoptions is provided along with references, case studies, and contacts.
On-site Technical Assistance. The staff can provide comprehensivetechnical assistance through facility visits. During an on-site visit,detailed process and waste stream information is collected. Theinformation is analyzed, and a series of waste reduction options areidentified. A report is prepared detailing these options and includesliterature, contacts, case studies, and vendor information.
Outreach. The staff can give presentations on pollution prevention toindustries, trade associations, professional organizations, and citizengroups. Depending on the audience, these programs range from anoverview of the State's -Pollution Prevention Program to in-depthdiscussions of technologies for specific industries.
Challenge Grants. A matching grant program provides funds for the costof personnel, materials, or consultants needed to undertake pollutionprevention projects. Projects eligible for grant funds range fromcharacterizing waste streams in order to identify pollution reductiontechniques to conducting in-plant and pilot-scale studies of reductiontechnologies.
For information or technical assistance contact:
Pollution Prevention ProgramDivision of Environmental ManagementN.C. Department of Natural Resources & Community DevelopmentPost Office Box 27687Raleigh, North Carolina 27611-7687
Telephone: 919/733-7015
ABSTRACT
"Recycling of Lead-Contaminated Blasting Sand
in Construction Materials"
N. Paul Khosla, Professor of Civil Engineering, and
Michael L. Leming, Lecturer, Civil Engineering,
North Carolina State University
The North Carolina Department of Transportation isresponsible for the maintenance of numerous steel bridges inthe state. A part of the maintenance requirement is torepaint these bridges. Prior to repainting, the surfacemust be stripped of rust and old paint. This is typicallydone by blasting the surface with an abrasive silica sand.Since the sand now contains a substantial quantity of lead,from the old paint, the sand must be considered a hazardouswaste. Disposal of the contaminated sand poses asignificant problem in terms of both cost and quantity ofmaterial to be handled. Hazardous waste landfill disposalis one obvious alternative. Another alternative consideredis the use of the contaminated sand in selected constructionmaterials.
Two possible materials are asphalt cemtent concrete andportland cement concrete products which could be used by theDepartment of Transportion. This study was conducted to investigate methods of producing acceptable constructionmaterials and to determine the structural properties andusefulness of such materials.
ACKNOWLEDGEMENTS
The authors would like to thank Mr. Bill Medford of theNorth Carolina Department of Transportation for hisassistance in providing background costs for this study aswell as his assistance in obtaining EP Toxicity Testresults. Also, thanks go to Mr. James Trogdon of NorthCarolina State University for his assistance in thelaboratory testing of all bituminous samples.
Table of Contents
Introduction
Portland Cement Concrete
Bituminous Concrete
Conclusions
Recommendations for Further Study
Bibliography
Appendix A
Appendix B
Appendix C
Appendix D
Bituminous Resilient Modulus
Experimental Test Procedures
Moisture Damage Prediction
EP Toxicity Test
Page
2
6
13
17
19
20
21
23
29
31
INTRODUCTION
The North Carolina Department of Transportation isresponsible for the maintenance of numerous steel bridges in
the state. A part of the maintenance function is to repaint
these bridges. Prior to repainting, the steel surface mustbe stripped of any rust and old paint. This is frequentlyaccomplished by blasting the surface with abrasive silicasand.
The Division of Environmental Management for the State
of North Carolina has directed North Carolina HighwayOfficials to collect all lead contaminated residue generated
during stripping, cleaning and painting operations. Theprimary source of such residue is the mixture of blasting
sand and old paint products resulting from surface cleaning
activities. It is estimated that to clean a total of270,000 tons of painted steel, the amount of silica sand
used is approximately 61,000 tons. The mixture of thesilica sand and the removed old paint contains up to 4%
total lead and has an acid leachable fraction from 30 to 50
parts per million as determined by the EP Toxicity Test
Under the current guidelines of E.P.A. Regulations, any solid waste with a lead concentration over 5 parts per
million is considered a- hazardous waste. Accordingly, thissand must be recovered and disposed of as a hazardousmaterial because it contains unacceptable levels of leadresidue from old Red Lead-Aluminum paints. It is estimatedthat it would cost the State a minimum of $9,690,240 to
dispose of it at an authorized hazardous waste dump.(9)
In view of the above discussion, it was consideredplausible to look into the possibility of recycling the
contaminated sand into asphaltic concrete or portland cement
concrete to be used in highway/bridge construction. The
Virginia Department of Highways has conducted tests onseveral methods of removing a lead based paint from thebridges. The cleaning methods included chemical stripping,
vacuum blasting, vacuum power tool cleaning, and enclosure
blasting. The chemical and vacuum blasting were not found
to be satisfactory. However, vacuum power tool cleaning and
enclosure blasting showed some merit and will be explored
further by NCDOT.
RESEARCH APPROACH AND OBJECTIVES
One of the alternatives worthy of consideration due to
the disposal costs involved has been to incorporate the
contaminated sand in the production of asphaltic concrete
and portland cement concrete or in other material products.
This alternative has several advantages. Apart from the
obvious economic considerations of hazardous waste disposal,
there is the likelihood that the lead will be tied up
physically in the asphalt system or portland cement concrete
and therefore less likely to re-enter the environment at
some later date.
A problem with the use of the contaminated sand in this
manner is the presence, at least in North Carolina, of
aluminum paint particles in the recovered blasting sand.
The presence of aluminum particles was not expected to cause
any problem in the asphaltic concrete mixes. However, the
finely divided aluminum corrodes extremely rapid in a highly
alkaline environment producing substantial quantities of
hydrogen as a by-product. The gas so produced causes the
portland cement concrete to swell and crack. The concrete
can easily lose substantial strength in a matter of days,
thus rendering it unsuitable for structural usage.
The following were the overall objectives of the
study.
1. Collect representative samples of lead-contamin-
ated blasting sand.
2. Determine if the contaminated sand can be used
successfully "as is" in asphaltic concrete, port-
land cement concrete or in any other material
products. Tests were conducted to determine if
the concrete or asphalt meets all required
engineering standards.
3. If the contaminated sand cannot be used "as is" in
asphaltic concrete mixes, determine what changes
in blending procedures should be made to produce
an acceptable product which meets all required
standards.
4. If the contaminated sand cannot be used "as is",
in portland cement concrete mixes determine
what procedures must be used to modify the sand,
and the mixing requirements of the portland cement
concrete such that it will meet all required
standards. Techniques include:
a. Blending the recovered sand with natural sand
to reduce the effective content of lead and
aluminum, thereby rendering the composite
useful for concrete manufacture.
b. Pre-mixing the recovered sand with another
concrete component, such as slag, lime
or some -other alkaline chemical or mineral
admixture to produce a slurry for use in
concrete. This has the effect of causing the
reaction between the aluminum and the alkali
to occur before the concrete is mixed, thus
eliminating the expansion of the concrete due
to the development of a gas.
C. Treating the sand with some material to
convert the contaminated sand to a non-
reactive form.
5
d. Encapsulating the contaminated sand in a non-
reactive matrix which could be used on site.
5. Conduct the extractions for EP Toxicity Testing
following all required procedures on all suc-
cessful concrete and asphalt formulations. Send
the extractions to the Solid and Hazardous Waste
Management Branch for analysis.
6
PORTLAND CEMENT CONCRETE USES OF LEADCONTAMINATED BLASTING SAND
The North Carolina Department of Transportation hasconducted sand blasting operations near New Bern, NorthCarolina on steel bridge members protected with paints
containing both lead oxide and aluminum. The expended or
rebound blasting sand was recovered and a portion retained
for use in testing various portland and asphalt cementproducts. Research was conducted to determine how this sand
might be successfully and routinely used as at least a
portion of the raw materials of typical transportationrelated structures such as pavements, base course orretaining walls without leading to lead contamination of the
surroundings by leaching.
A problem with the use of the blasting sand in portland
cement based construction materials such as concrete, block,
or base course, is the reaction of the aluminum particles
found in the sand. Finely divided aluminum corrodesextremely rapidly in a moist, highly alkaline environmentproducing substantial quantities of hydrogen as a by-product. The gas so produced causes the concrete to swell
and crack and thereby loose substantial strength. Thisreaction is a persistent one and can occur over the courseof several days, according to particle size distribution.The concrete is thus rendered unsuitable for structuralusage.
Results of Trials:
I. Blending the blasting sand with natural sand to
reduce the effective content of aluminum, thereby rendering
the blend useful for concrete manufacture is infeasible.
Only a minute quantity of aluminum is required to cause
unacceptable expansion of the concrete, and the quantity ofuncontaminated sand required for blending is such that the
7
blending itself would sufficiently reduce the leachable lead
content to acceptable or near acceptable levels.
II. Since the weakening of the concrete is a result of
expansion due to gas generation, several attempts were made
to produce materials which either:
1. Set up and harden sufficiently rapidly such
that no expansion will occur, or
2. Set up so slowly that the reaction of the
aluminum proceeds to completion before the material looses
its plasticity. This would allow the development of the gas
to occur before the concrete sets thus eliminating the
expansion of the concrete while hardening.
Rapid Set: The use of a Class "C" fly ash (ASTM C 618)
appeared promising in the early stages. A mix with a low
water/cement (w/c) ratio produced acceptable results in one
case. The mix produced a product with substantial
compressive strength (500 psi) within hours without
deleterious expansion. Further, no subsequent expansion was
noticed even on continued exposure to moisture over several
weeks. Additional -mixes at higher w/c ratios gave
unsatisfactory results in some cases, however. Some mixes
exhibited unsatisfactory expansion and had very low
strengths even when cured over a period of weeks. Further
research indicated that the production of a satisfactory
product was possible only when the mixing sequence was
strictly controlled.
The production of gas by the aluminum in the sand was
very sensitive to the timing of the addition of mix water.
Early addition of mix water, done originally to prevent dust
escaping during mixing, apparently had the effect of
"sensitizing" the aluminum in the sand so that when the ash
was added, gas production occurred. Apparently, alkalis
dissolved in the mixing water and began reacting with the
aluminum, producing hydrogen prior to the addition of the
Class F flyash. Thorough mixing of the dry sand and dry ash
prior to the addition of any water seemed to control the
production of gas. Long term storage in moist conditions of
mortar produced in this manner did not appear to produce any
long term deleterious expansion, although full testing was
not carried out for reasons given below.
The dry mixing tended to produce a lot of dust, some of
which undoubtedly contained lead. Further, any contact with
moisture prior to the addition of the Class "C" fly ash,
gave a mix with unpredictable results. The volume of gas
produced and the rate of gas production could not be easily
predicted. It was felt that the sensitivity of the product
to minor variations in mixing, combined with the problem of
dust control, moisture control and the potential
unpredictability of the end product rendered this method
unsuitable for field use. This method also has the
disadvantage that supplies of Class "C" fly ash are
available only in portions of the western United States, and
shipping costs into North Carolina could be relatively high.
Therefore, at this point we cannot recommend the use of
Class "C" fly ash by itself, with normal control under
typical field conditions, to produce a satisfactory
construction material for use by the Department of
Transportation.
Slow Set: Various combinations of portland cement in
various quantities with and without retarding admixtures
were tried with remolding, recompaction or remixing with and
without additional portland cement after two (2) days, five
(5) days and seven (7) days delay, all without adequate
success. However, pre-mixing the blasting sand with
standard building lime to produce a slurry produced useful
results.
9
In initial testing, the slurry was allowed to sit for
one week after mixing. Evidence of "de-gassing" was plainly
evident. The slurry was remixed (rapidly returning to afluid consistency) and split. One portion was mixed with an
equal amount of locally available Class "F" fly ash and ten
percent portland cement. The other portion was mixed with
fly ash only. Materials such as these have been used with
success as structural road base material in other areas.
Both combinations showed some expansion after two days, but
the expansion was very much reduced.
With further research, it was found that continuousagitation of a slurry containing substantial amounts of lime
rendered the sand essentially nonreactive after four days.Eventually, production of a sand slurry which wasnonreactive in the presence of portland cement after fourdays of intermittent agitation was obtained. This appeared
to be a more realistic possibility for work outside the lab.
Agitating the mix for at least one (1) hour, three timesdaily for four days gave a slurry which could besuccessfully used. Mixing this slurry with a combination of
Class "F" fly ash and portland cement gave a stable product
with adequate strength at twenty-eight days (over 1000 psi).
It was necessary to modify the mix proportions somewhat
over what might normally be used for road base material. In
addition to a higher lime, cement and fly ash content, it
was necessary to blend standard concrete sand into theslurry as well (at the same time as the cement and fly ash
were added). A large quantity of lime was required toinsure that the aluminum in the sand would react within a
reasonable time. An equally large amount of fly ash was
therefore also required. A relatively large quantity of
portland cement (compared to other road base mixes) was also
felt to be desirable to reduce the potential for expansion
of the finished product during normal curing. This resultedin a mix which was excessively rich in paste, was difficult
to handle and did not mix well. A quantity of standard
10
concrete sand was added to improve the mixing andworkability of the mortar. Coarse aggregate could also be
added, if desired. The addition of coarse aggregate would,
in general, be beneficial. It was not done in ourinvestigation in order to keep the results conservative and
to provide a (somewhat) less complicated batch sequence.
A procedure and composition such as would beappropriate for one (1) cubic yard of base course is shown
below:
Part A: Initially blend 1100 lb of recovered blasting
sand with 360 lbs of lime and 300 lbs of water. The watermay be added in such a way as to control excessive dust
release to the air. This blend is then mixed until ahomogeneous slurry is attained but at least for one hour.
Some protection from evaporation may be desirable but care
should be taken that no build up of gas is allowed. The gascan be vented to the atmosphere. The slurry should be mixedfor at least one hour each time, at least three times daily.Water may be added if necessary but only after the first
fifteen minutes of mixing. After a period of four days,
proceed with Part B.
Part B: To the slurry add 700 lbs of standard concrete
sand, 400 lbs of Class "F" fly ash, 380 lbs of portland
cement and up to 170 lbs of additional water, as needed toattain the desired consistency. At this point the material
may be treated as any other similar cement based product.
III. The use of epoxy as a cementitious agent has been
investigated, but only to the extent that the process has
been shown to be feasible and there are no apparent
difficulties other than mixing due to the high viscosity of
a sand-epoxy blend. Such a solution would obviously be
extremely expensive.
11
IV. The use of sodium silicate as a binding agent was
also tried, both with the contaminated sand alone and in
combination with a class "F" type fly ash. The material was
tried in commercial concentrations and in a diluted (with
water) state. Accelerated curing and room temperature
curing were used. Considerable expansion of the product
resulted regardless of the methodology used. Apparently,
the alkalis in the sodium silicate react with the finely
divided aluminum in the contaminated sand to produce gas
causing the mixed to expand. The use of an ethyl silicate
is being investigated.
Results of the lead leaching test:
Samples of mortar made with the lead contaminated sand
were ground and subjected to leaching in an acetic acid
solution. The concentration of lead was 0.5 ppm which was
within the limits (less than five (5) mg/l) required by EPA.
A second sample of the mortar was tested in a different
fashion. This sample had been broken up into pieces but had
not been ground. The specimen was tested as a solid with
fractured faces exposed. Small flecks of paint on the
fractured faces could be clearly seen with the naked eye.
Fracture planes may have been created preferentially along
the surface of the paint flecks, although this observation
was not checked rigorously.
The results of this second test were different from the
tests of the ground mortar. The concentration of lead was
in excess of the five (5) mg/l limits (6.5 ppm), but still
much less than the concentration which would be expected due
solely to dilution effects of the constituents of the
mortar. These results lead to two conclusions.
It is obvious that due to the highly alkaline nature of
the cementitious aqents used (Portland cement and lime) the
results of leachinq with acetic acid will be significantly
affected. When the mortar sample was ground prior to
testing, the acidic nature of the leaching solution was
probably strongly buffered and little lead may have been
carried into solution.
Since the leachable lead content of the fractured
sample was higher than that of the ground sample, it is
clear that the cement paste was physically, rather than
chemically, binding the lead contaminants in the sand.
This should, of course, be expected since the form of the
lead in the paint was a stable lead oxide. The paint
particles were much more exposed in this situation than they
would be normally. In a normal service environment, the
paint particles would be encapsulated in the cementitious
matrix. Even substantial cracking of the material would not
expose the matrix to the extent of the second test. Only
when the material had lost virtually all structural
integrity would it be exposed in as severe a manner as it
was in the second test. This possibility could be
substantially mitigated by proper design.
13
BITUMINOUS PAVEMENT USES OF LEAD CONTAMINATED BLASTING SAND
Since asphalt cement is an excellent binder material,
uses in bituminous pavement applications seem promising.
The asphalt binder minimizes leaching of contaminates while
utilizing the abrasive in the pavement structure. During
preliminary research, two types of pavements were identified
as most promising in the use of lead contaminated sand.
These two pavements were North Carolina Department of
Transportation I-2 Surface Course Pavements and F-l Surface
and Base Course Pavements. An AC 20 was used at 6.2 percent
asphalt for the I-2 specimens and 7.0 percent asphalt for
the F-l specimens.
Marshall samples were made of the I-2 pavement with
lead contaminated sand as well as a high quality crushed
aggregate typically used for pavement applications. F-l
samples were made of the lead contaminated sand,
uncontaminated sand, and the high quality crushed fine
aggregate as well. Marshall stability tests and dynamic
load tests were conducted on the samples to determine the
effect of the lead and the effect of the blasting sand
itself on pavement performance, compared to a standard
aggregate.
Marshall stability values were reduced in samples
containing blasting sand compared to the 100% crushed
aggregate samples. Lead content alone had no real effect on
performance, in fact, there was some slight increase in
stability in those specimens containing lead, made with the
same sand. The only significant differences were
attributable to the differences in sand. It was felt that
this difference was due to the rounder sand particle
produced during blasting, whereas the crushed aggregate is
more angular.
Under dynamic loading, the samples similarly showed a
reduction in the resilient modulus with the blasting sand
compared to the more angular high quality aggregate.
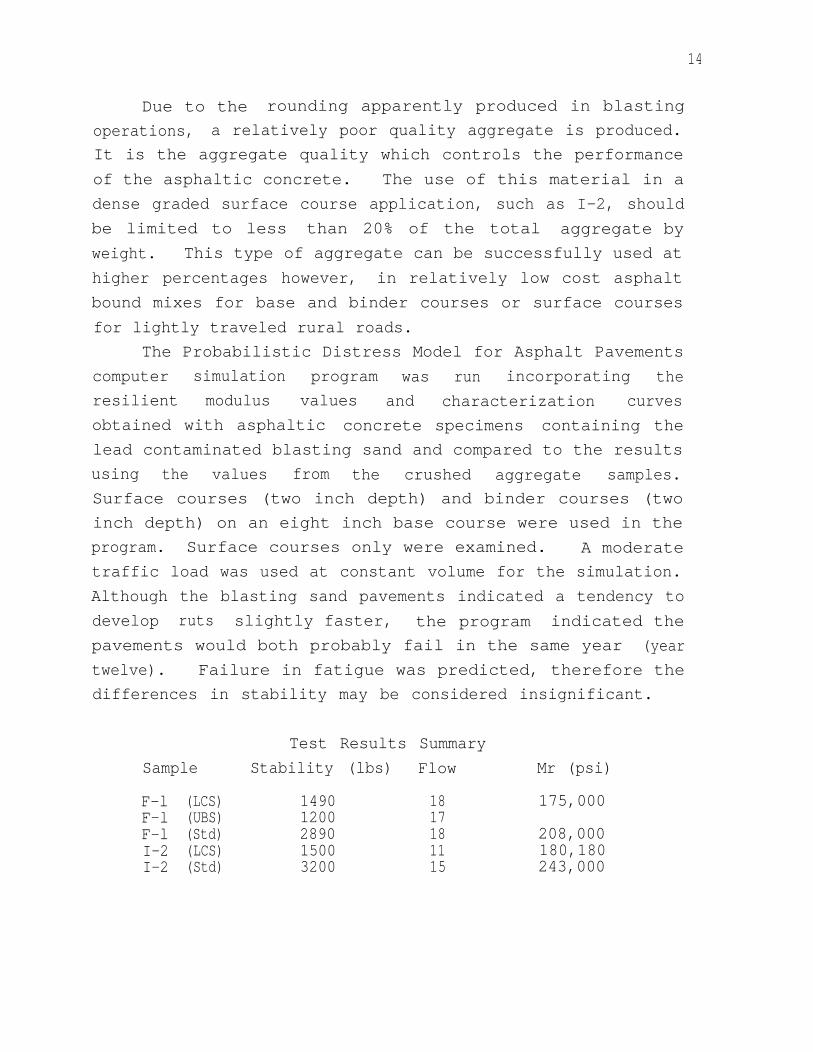
14
Due to the rounding apparently produced in blasting
operations, a relatively poor quality aggregate is produced.
It is the aggregate quality which controls the performance
of the asphaltic concrete. The use of this material in a
dense graded surface course application, such as I-2, should
be limited to less than 20% of the total aggregate by
weight. This type of aggregate can be successfully used at
higher percentages however, in relatively low cost asphalt
bound mixes for base and binder courses or surface courses
for lightly traveled rural roads.
The Probabilistic Distress Model for Asphalt Pavements
computer simulation program was run incorporating the
resilient modulus values and characterization curves
obtained with asphaltic concrete specimens containing the
lead contaminated blasting sand and compared to the results
using the values from the crushed aggregate samples.
Surface courses (two inch depth) and binder courses (two
inch depth) on an eight inch base course were used in the
program. Surface courses only were examined. A moderate
traffic load was used at constant volume for the simulation.
Although the blasting sand pavements indicated a tendency to
develop ruts slightly faster, the program indicated the
pavements would both probably fail in the same year (year
twelve). Failure in fatigue was predicted, therefore the
differences in stability may be considered insignificant.
LCS - Lead contaminated blasting sandUBS - Uncontaminated blasting sandStd - Standard (high quality aggregate)
Mr - Modulus of Resilience (70 degrees F) also see Figure 1.
Table 1
The ability to predict susceptibility to moisture
damage is important due to the increase in the leachable
lead content of pavement which exhibits stripping under wet
service conditions. Moisture predictive damage procedures
published by NCHRP were used to determine the moisture
susceptibility of the lead contaminated asphalt pavement.
Utilizing a maximum leachable lead content of 5 ppm
which is required by the Environmental Protection Agency
(EPA), the F-l samples measured an average of 2.75 ppm
while all samples met the maximum allowable 5.0 ppm. I-2
could not be tested due to the small size of the test
sample. (1.3 inch dia.)
RESULTS
There is no significant reduction in the resilient
modulus values of I-2 samples with lead contaminated sand
and the I-2 control samples. (Fig.1)
There is a slight reduction in the resilient modulus
values of the F-l samples with lead contaminated sand and
the F-l control samples. (Fig.1)
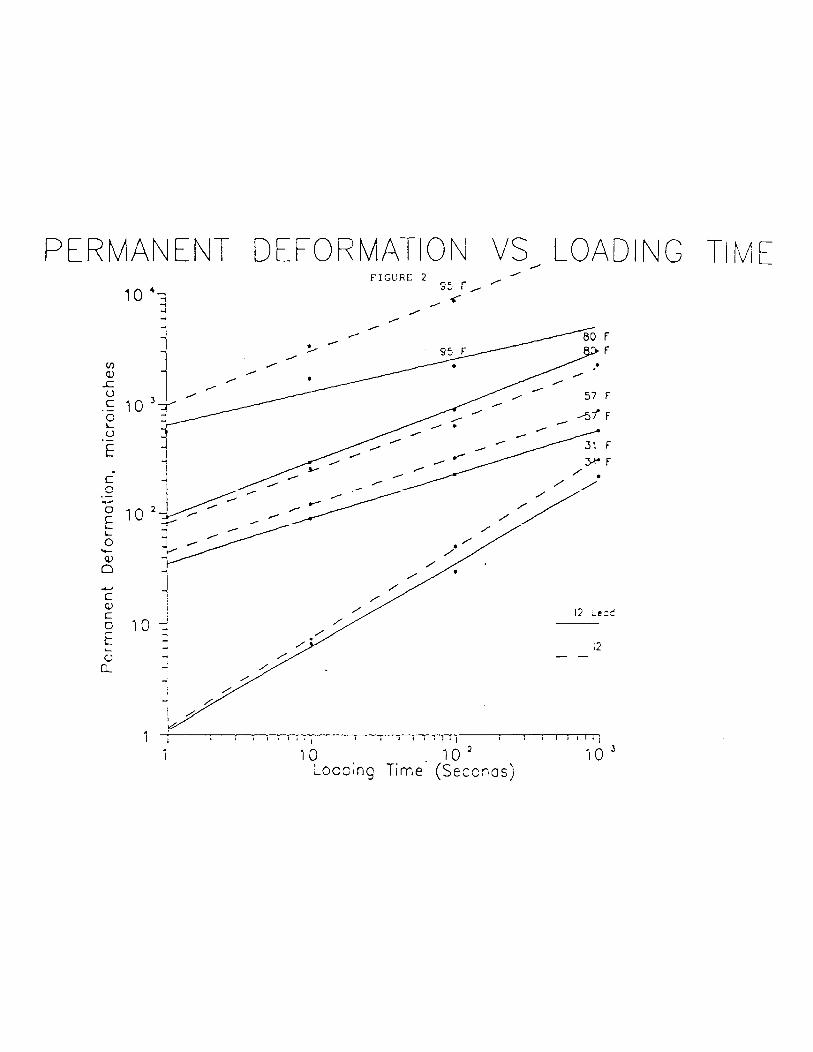
On the average there is a reduction in permanent
deformation in the I-2 mix with the lead contaminated sand
as compared to the control samples. There is a slightincrease in permanent deformation in the F-i samples with
lead contaminated sand as compared to the control samples.
16
There is no significant difference in the fatigue
properties of both I-2 and F-l pavements with lead
contaminated silica sand. (Fig. 2 and Fig. 3)
Both I-2 and F-l samples with the lead blasting sand
proved not susceptible to stripping. Utilizing an acceptance
level of 70 percent the I-2 and F-l pavements measured 89
and 86 percent respectively.
The asphaltic concrete specimens meet the requirements
of EPA for leachable lead content (2.75 ppm) if the samples
are tested unbroken. If the samples are broken the binder
proves less effective in minimizing leaching due to the
increased surface area exposed to the test solution, thereby
causing the sample to fail.
17
CONCLUSIONS
Blasting sand contaminated with paint containingaluminum and lead can be successfully used in the production
of portland cement based construction products such asconcrete, mortar or certain types of paving material (basecourse). The procedures needed to produce a satisfactory
material can be carried out with existing technology and
equipment and may be carried out on site. The material canbe produced to meet the lead leaching test requirement of
less than five (5) parts per million lead.
The portland cement based materials may, however, be at
an economic disadvantage compared to other materials such as
asphalt cement concrete. One of the primary concerns when
using blasting sand containing aluminum particles is thatthe sand must be pre-mixed with a lime slurry for a period
of several days prior to actual use. The use of a typicalready mixed concrete truck would permit processing aboutfour and one half to five and one half (4.5 - 5.5) tons of
blasting sand per truck per week. The truck could, of
course, travel to and from t he site for pick up and delivery
of the sand and to and from a standard concrete batch plant
for the other raw materials as well as to and from a central
equipment yard for interim periodic remixing of the lime
sand slurry. The incorporat ion of the lime could be done by
hand or, given sufficient volume, with additional batching
equipment, standard to the industry for batching portland
cement, located centrally.
There exists no indication of a significant decrease in
pavement performance by utilizing the lead contaminated
blasting sand in the bituminous pavements. Therefore, thedecision to use portland cement, with fly ash and lime as
binding agents or asphalt cement as a binding agent would
seem to be an economic rather than a technical decision at
this time. Both methods seem capable of producing an
acceptable construction material suitable for use by aDepartment of Transportation.
19
RECOMMENDATIONS FOR FURTHER STUDY
The use of lead contaminated blasting sand in
bituminous pavements will pass the EPA Toxicity Test if the
sample is unbroken. However, if the sample is broken into
small pieces it will typically fail. Therefore, all lead
contaminated samples should be used in layers that will not
normally be exposed to conditions which could lead to this
type of failure. Therefore, more tests should be done on
base and binder materials exclusively, incorporating anti-
strip additives and modifiers to determine their effects on
the long term ability of the asphalt binder to satisfy the
maximum leachable lead requirement as well as exhibit good
performance in combination with the aggregate mixture.
20
BIBLIOGRAPHY
1. Lea, F. M., "The Chemistry of Cement and Concrete," 3rded. Chemical Publishing Co., New York, 1971.
2. "Significance of Tests and Properties of Concrete andConcrete-Making Materials," ASTM STP 169B, American Societyof Testing Materials, Philadelphia, PA, 1978.
3. "Corrosion of Metals In Concrete, SP-49, AmericanConcrete Institute, Detroit, MI, 1975.
4. JEFTS, Alan R., "New Runway Takes Off," CivilEngineering, Vol. 56, No. 12, pp. 47-49 (1986).
5. "Mix Design Methods for Asphalt Concrete," The AsphaltInstitute Manual Series No. 2 (MS-2), March 1984.
6. KHOSLA, N. Paul, and M. S. Omer, "Characterization ofAsphaltic Mixtures for Prediction of Pavement Performance."Transportation Research Record 1034, Washington D. C.
7. SCHMIDT, R. J., "A Practical Method for Measuring theResilient Modulus of Asphalt Treated Mixes." HighwayResearch Record 404, HRB, National Research Council,Washington D.C. 1972.
8. MONISMITH, C. L., J. A. Epps, F. N. Finn, "ImprovedAsphalt Mix Design," Association of Asphalt PavingTechnologists Proceedings, 1985.
9. NORTH CAROLINA DEPARTMENT OF TRANSPORTATION, Materials& Tests Laboratory, Chemical Unit, Raleigh, N.C.
21
APPENDIX A
Bituminous Resilient Modulus Test
During this investigation, lab samples were fabricated
of I-2 and F-l pavements with and without lead contaminated
sand. Marshall stability tests as well as dynamic load
tests were conducted in order to determine the effect of the
lead contaminated sand on pavement performance.
In order to compare sample performance, the diametral
test method(indirect tension test) was used to characterize
the bituminous mixtures. In the diametral resilient modulus
test, dynamic pulse loads are applied diametrically to aMarshall sample. The induced vertical and horizontaldeformations are recorded and used to calculate theresilient moduli. The test is based on the assumption that
the speciment behaves as a linear elastic under dynamicloading.
The theory of the diametral test was derived fromlinear elasticity. The equations for stresses, σ x and σ yat a point along the horizontal diameter is as follows:
σ x= P ( D2 - 4x2 )- -π t D ( D2 + 4x2 )
σ y = -2P 4D2- - - - 1π t D D2 + 4x2
where
t = thickness of specimen,
D = diameter of specimen,
x = distance to the center of specimen,
P = line repeated load.
Both stresses vanish on the circumference of x=D/2, and
their maximum values are developed at the center of acylindrical disk where x = 0. The maximum stresses a1ongthe horizontal diameter are as follows:
22
σ x = 2P (Tension), and
σ y = -6P (Compression).
If a plane stress condition and elastic behavoir of the
specimen where assumed, the strain in the horizontal
direction, x-axis, can be expressed as:
ε x = 1 ( σ x - υσ y)
E
where
υ = poisson's ratio, andE = modulus of elasticity
Using these relationships R.J. Schmidt in 1972 derived
the equation between resilient modulus and the horizontal-
deformation of the specimen in the diametral resilient
Specimens made from bituminous mixtures were tested in
the high-low temperature chamber manufactured by Blue MElectric Company. The temperature in the chamber wascontrolled by two switches, a "cooling switch" and a"cooling capacity switch" and a master calibrating CAM.First, the master calibrating CAM was set on the desired
mark, and then for temperatures ranging from:
1.
2.
3.
The
-100 F to -20 F, the "cooling switch" was turned
on.
-20 F to +120 F, the "cooling switch" and the
"cooling capacity switch" were turned on. The"cooling capacity switch" was turned on to reducethe refrigeration capacity by about 50%.
Above +120 F, the "cooling" and the "cooling
capacity" switches were turned off. Only heatingwas required.
temperature control using this equipment is quite
efficient and showed the capability of maintaining p1us or
minus one degree for a sufficient period of time.
In order to sense the temperature at the gemetrical
center of the specimen, an OMEGA Linear Response ThermistorComposite was used. This device is a digital ThermistorThermometer, which has two probes. One probe is inserted ina dummy specimen while the other is mounted in the
temperature control chamber. The specimen to be tested is
conditioned in the testing chamber along with the dummy
specimen. The temperature of the specimen and the chamber
could be monitored by switching to the appropriate probe.
24
When an equilibrium exists between the two probes then the
specimen is ready for testing.
The diametral resilient modulus test proposed by
Schmidt has been modified slightly and is used in this study
for testing creep, permanent deformation, resilient modulus,
and fatigue properties of diametral specimens. The original
equipment consisted mainly of a loading frame, a diaphragm
air cylinder, a load cell, a solenoid valve system, a surge
tank, a pressure regulator, two statham UC-3 transducers, an
electronic readout, a yoke, an alignment stand, and a
compressed air source.
In addition, the modifications included replacing the
two statham UC-3 transducers by a pair of linear variable
differential transducers (LVDT), which had a deformation
measurement capacity range of +/- 0.25 inches. A two
channel chart recorder was connected to the equipment for
plotting the output voltage of the two LVDT's, while the
electronic readout was used only for load monitoring and
load duration selection. The horizontal deformation of the
diametral specimen was measured by the two LVDTs and was
plotted on the chart.
Test Procedure
The tests in indirect tension were conducted on the
bituminous Marshall samples using the following procedure:
1. A specimen was placed in the test stand to align
the specimen while mounting the yoke. Then, the
sample and the yoke were removed from the stand and
placed under the load cell. Next, the LVDTs were
screwed into position.
25
2. The specimen was then conditioned as follows:
a. Two ramp loads of 20 psi each were applied and
each peak load was held for 10 minutes
duration, with minimal unloading time between
the two loads.
b. A third conditioning load of 20 psi was then
applied for 10 minutes followed by 10 minutes
of unloading. The LVDTs are then re-zeroed.
3. The incremental static loading test was conducted
as follows:
a. A ramp load of 20 psi was applied to the
specimen as quickly as possible and the loading
was held for 0.1 seconds. Then the load was
released and the total permanent deformation
was measured after 2 minutes of unloading.
b. A second ramp load was applied to the specimen
at the same stress level used above, but for 1
second. Then the load was released and the
total permanent deformation was measured after
2 minutes of unloading.
C. A third ramp load was applied to the specimen
at the level used in Step 3a and was held for
10 seconds. The load was then released and the
total permanent deformation was measured after
2 minutes of unloading or when the rebound
became negligible.
4. A fifth ramp load was applied to the specimen again
at the level used in 3a above and was held for 1000
seconds. The magnitude of the creep deformation
was measured during 0.1, 1.0, 3.0, 10.0, 100.0, and
1000.0 seconds. The load was then released and the
total permanent deformation was measured after 8
minutes of unloading or when the rebound became
negligible.
26
5. A repetitive load, equal in magnitude to the one
used in 3a, was applied to the test specimen.
Each load application had a loading duration of
0.05 seconds. After 30 to 50 applications, the
resilient deformation was measured.
6. Step 5 above was repeated using different stress
levels.
7. Steps 1 through 7 were repeated using new specimens
for every temperature level.
8. Stiffness was calculated as follows:
P( υ + 0.2734)S(t) =
δ (t) t
where
P = load in pounds,
υ = poisson's ratio,t = thickness of specimen, in inches, and
δ (t)= total creep horizontal deformation atspecified intervals, in inches.