Yale UniversityEliScholar – A Digital Platform for Scholarly Publishing at Yale
Yale Medicine Thesis Digital Library School of Medicine
January 2014
Reducing Respiratory Virus Testing In HospitalizedChildren With Machine Learning And Text MiningMark MaiYale School of Medicine, [email protected]
Follow this and additional works at: http://elischolar.library.yale.edu/ymtdl
This Open Access Thesis is brought to you for free and open access by the School of Medicine at EliScholar – A Digital Platform for ScholarlyPublishing at Yale. It has been accepted for inclusion in Yale Medicine Thesis Digital Library by an authorized administrator of EliScholar – A DigitalPlatform for Scholarly Publishing at Yale. For more information, please contact [email protected].
Recommended CitationMai, Mark, "Reducing Respiratory Virus Testing In Hospitalized Children With Machine Learning And Text Mining" (2014). YaleMedicine Thesis Digital Library. 1901.http://elischolar.library.yale.edu/ymtdl/1901
Reducing respiratory virus testing in hospitalized children
with machine learning and text mining
A Thesis Submitted to the Yale University School of Medicine
in Partial Fulfillment of the Requirements for the Degree of Doctor of Medicine
by
Mark Vu Mai
2014
2
ENHANCING DIAGNOSTIC STRATEGY OF RESPIRATORY VIRUSES IN THE PEDIATRIC POPULATION USING MACHINE LEARNING AND TEXT MINING Mark Mai, Michael Krauthammer. Department of Pathology Informatics, Yale University School of Medicine, New Haven, CT. Despite pressure from the federal government for US hospitals to adopt electronic
medical records systems (EMR), the benefits of adopting such systems have not been
fully realized. One proposed advantage of EMRs involves secondary use, in which
personal health information is used for purposes other than direct health care delivery,
particularly quality improvement. We sought to determine whether information recorded
in the EMR could improve diagnostic pathways used to diagnose respiratory viruses in
children, the most common etiology of diagnoses in the pediatric population. These tests
potentially represent a source of unnecessary testing. We performed a retrospective
observational study analyzing pediatric inpatients receiving respiratory virus testing at
Yale-New Haven Children’s Hospital between March 2010 to March 2012. Billing data
(age, gender, season), laboratory data (sample adequacy, results), and clinical documents
were gathered. We used MetaMap, a program distributed by the National Library of
Medicine, to identify phrases denoting symptoms and diseases in the admission notes of
patients. Identified concepts were added as additional variables to be modeled. Weka,
another freely available software that allows for easy incorporation of machine learning
algorithms, was used to derive models based on the C4.5 decision tree algorithm that aim
to predict whether or not patients should be tested. Orders for pediatric patients
accounted for 26.3% of all respiratory virus test orders placed during this time. Negative
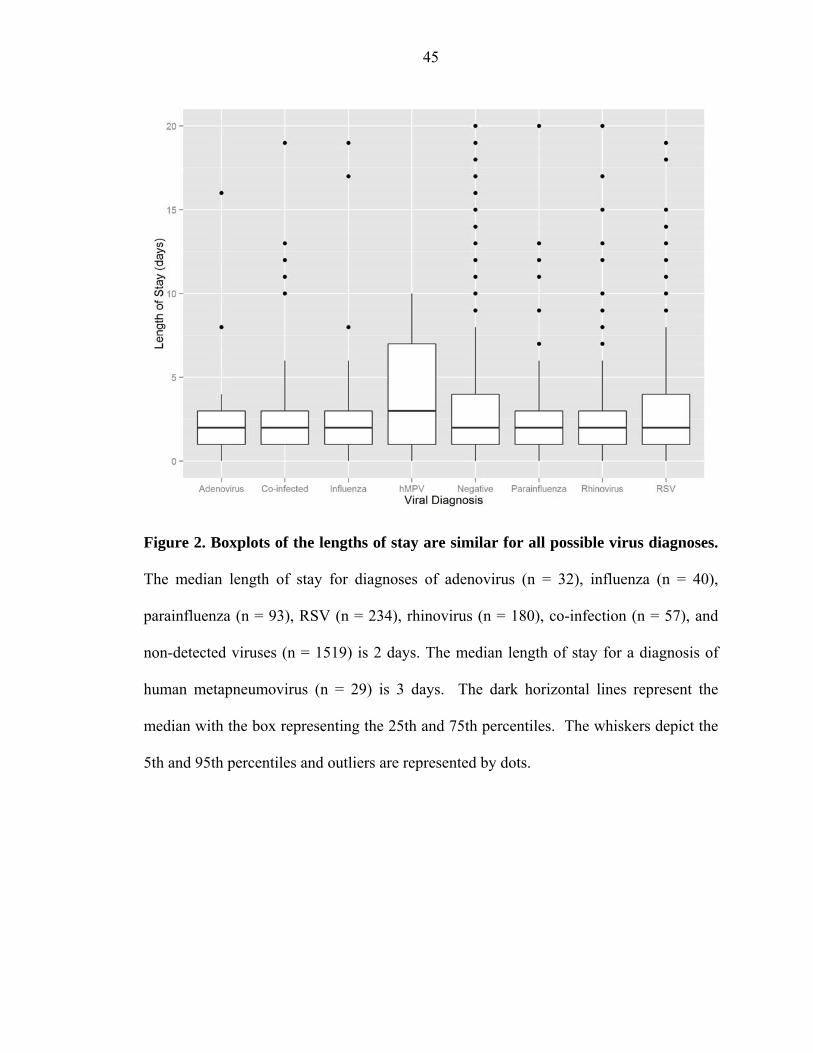
test results accounted for 69.5% of all tests ordered during the study period. The lengths
of stay for all viral diagnoses were not statistically different. Models based on age,
3
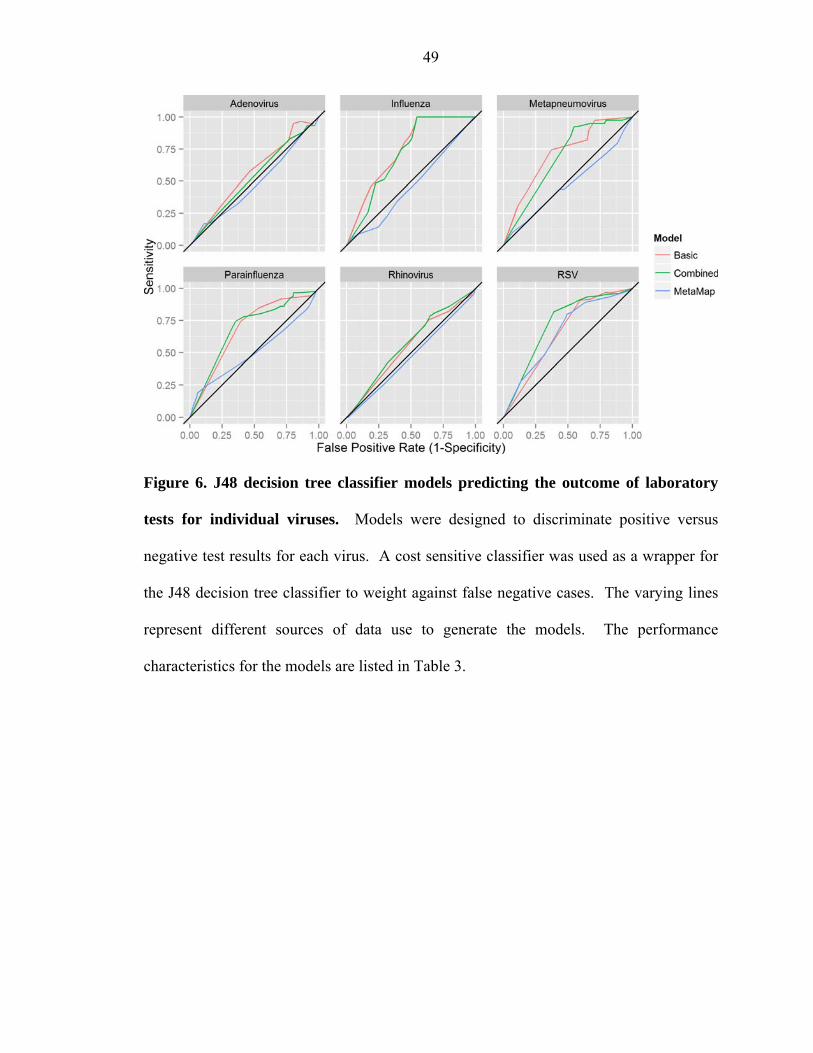
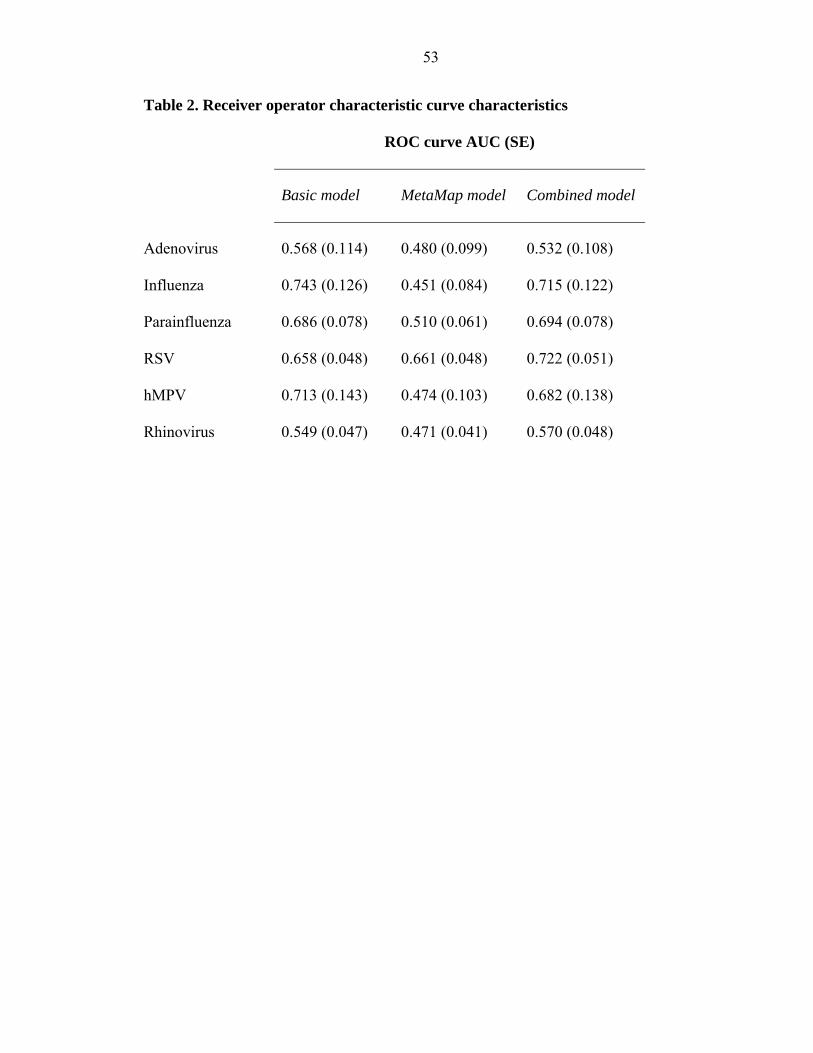
gender and season alone, were predictive for influenza (AUC 0.743, SE = 0.126),
parainfluenza (AUC 0.686, SE = 0.078), RSV (AUC 0.658, SE = 0.048), and hMPV
(AUC 0.713, SE = 0.143). Using MetaMap terms alone, only the model for RSV showed
discriminatory ability (AUC 0.661, SE = 0.048). When basic variables were used in
conjunction with MetaMap concepts, only the model for RSV showed improved
performance (AUC 0.722, SE = 0.051) in comparison to both the basic and MetaMap
models. Respiratory virus tests for general admission pediatric inpatients are ordered
year-round and are mostly negative. Using models based on decision tree learning, our
results showed that test volume could be reduced by about 20-50% for certain tests, as
measured by model specificity. Furthermore, clinical concepts obtained via text mining
in conjunction with basic variables improved prediction of RSV test results. The tradeoff
between the false negative rates required to achieve any substantive specificity may be
mitigated by our finding that hospital stays were nearly identical, regardless of the
diagnostic outcome. These results support the use of EMR data for the auditing of and
improvement of laboratory utilization. In addition, the improvement of predictive
modeling for RSV with a simple implementation of text mining support the idea that
clinical notes can be used for secondary use.
4
Acknowledgements
I am grateful for a number of people who have helped me through this process. First and
foremost, I would like to thank Michael Krauthammer for his valuable mentorship and
unending patience throughout all phases of this project. His investment and enthusiasm
in this project has meant a lot to me. In addition, the members of the Krauthammer lab -
Jim McCusker, Perry Evans, Matthew Holford, Maté Nagy, and Saira Kazmi - have been
tremendously supportive and creatively insightful, especially during lab meetings. A
special thanks to George Hauser for his help with data collection and initial
brainstorming sessions. Finally, I would like to thank the Office of Student Research;
Drs. Kim and Forrest for their incredible leadership and mentorship in the design and
implementation of this experience, as well as Donna Carranzo and Mae Geter for their
logistical, administrative, and moral support.
This research was supported by funding from the Doris Duke Charitable Foundation.
This research was approved by the Human Investigations Committee of Yale University
School of Medicine.
5
Table of Contents
INTRODUCTION .............................................................................................................. 6
The Costs of Testing ....................................................................................................... 6
Respiratory Virus Testing in Children ............................................................................ 8
The Use of Clinical Prediction Rules............................................................................ 11
Practice Based Evidence from Electronic Medical Records ......................................... 14
SPECIFIC AIMS .............................................................................................................. 17
METHODS ....................................................................................................................... 18
Patients and specimens ................................................................................................. 18
Medical concept identification in notes. ....................................................................... 19
Machine learning models .............................................................................................. 21
Statistical analysis ......................................................................................................... 24
RESULTS ......................................................................................................................... 25
DISCUSSION ................................................................................................................... 31
REFERENCES ................................................................................................................. 36
FIGURES .......................................................................................................................... 44
TABLES ........................................................................................................................... 52
6
INTRODUCTION
The Costs of Testing
While rates of health care spending seem to have stabilized compared to the
growth of the gross domestic product in the United States, more effective and flexible
approaches to cost control have remained at the forefront of national discussion (1–4).
Of the various strategies proposed to reduce costs, identifying areas of waste is an
important step (5). Six categories were listed by the Institute of Medicine as key sources
of spending waste, which include unnecessary services, inefficient delivery of services,
excess administrative costs, overcharged prices, missed prevention opportunities, and
fraud. Of the $2.5 trillion spent on healthcare in the United States in 2009, the excess
spending totaled an estimated $750 billion with unnecessary services leading these
categories at $210 billion (5). This group of expenditures also includes unnecessary
pathology and laboratory tests, which as a whole constitute about 4% of annual
healthcare costs (5, 6).
Improved utilization of laboratory tests represents an area with the potential to
substantially impact healthcare spending in the United States. Despite the relatively
small fraction of healthcare spending comprised by laboratory spending, physicians
routinely base their decision making on information gleaned from laboratory data (6).
Some have estimated that 60-80% of critical medical decisions, such as admissions,
treatments, and discharges, are influenced by laboratory data, though this frequently cited
number has been recently called into question (7–9). One prospective study looking at
the impact of rapid diagnosis of influenza, found that emergency department (ED)
physicians aware of a positive influenza result were significantly less likely to order
7
additional tests, particularly complete blood cell counts and blood cultures (p < 0.001).
In addition, there was a reduction in the number of antibiotic prescriptions, in the mean
charge per patient, and time to discharge for patients whose physicians knew of a positive
test result. Physicians who were aware of a negative rapid influenza test result were not
significantly different from physicians who were unaware of the test result, suggesting
that knowledge of a test result affects management when the result is abnormal (10).
Although the role of laboratory tests is extremely important in the clinical setting,
various behaviors likely contribute to excess spending in this area. From the laboratory
point of view, unrequested tests (reflex testing), slow turnaround of results, and collection
of incorrect or inadequate samples may contribute to additional test ordering (11). Other
studies have linked the ubiquity of repetitive test ordering to systemic variables such as
daily variations in test ordering and provider continuity (12–14). A systematic review by
Sood et al. identified multiple physician determinants for non-evidence based test
ordering practices (15). One group of factors included those that are non-modifiable, like
practice location, age, sex, and specialization of the physician. Modifiable factors
included physicians’ experience or knowledge, fear of litigation, lack of experience,
belief system, lack of knowledge of test costs and feedback. The modifiable factors are
perhaps the most important, as addressing these areas may have a considerable impact on
the number of unwarranted tests performed.
Appropriate utilization of tests, or demand management, aims not only to reduce
test volume, but also to ensure appropriate requests. This implies that references or
guidelines exist for what may be deemed appropriate and inappropriate (11). One such
reference comes in the form of clinical prediction rules (CPRs). CPRs are clinical
8
models comprised of variables from the history, physical examination, and basic
diagnostic tests that provide a probability of a diagnostic outcome. CPRs are designed to
quantify the amount of uncertainty present in medical decision making (16). In this way,
physicians may employ clinical information to quantitatively risk stratify patients or to
assess the value of additional steps in management. One of the most well-known
examples incorporated clinical assessment with a less costly screening test to diagnose
deep venous thromboses, demonstrating the value of clinical diagnosis in an age of
increasing reliance on technology and testing (17). Known as the Wells’ criteria, this
CPR has been further validated in multiple studies, although widespread adoption of the
algorithm is scattershot (18). Since the publication of the Wells’ criteria, hundreds of
CPRs for numerous applications have been developed (19, 20). Independent studies have
found that the use of Wells’ crteria for pulmonary embolism could reduce the number of
computed tomographic pulmonary angiography procedures done by around 10-25% (21,
22). By helping physicians reduce the amount of diagnostic uncertainty, CPRs encourage
a more efficient diagnostic process, and thus a reduction in the number of unnecessary
tests that are performed.
Respiratory Virus Testing in Children
Upper respiratory infections comprise one of the most common emergency
department diagnoses in the pediatric population (23). Respiratory illnesses account for a
large percentage of pediatric emergency department visits each year - up to 25% during
influenza seasons (24). A large variety of viruses may cause respiratory symptoms, but
only a handful of viruses can be diagnostically confirmed (25–30). In the majority of
9
children, a respiratory viral infection is mild and considered self-limiting with adequate
supportive care (31–33).
Nevertheless, routine testing for specific viruses (adenovirus, influenza A/B,
parainfluenza 1-3, and respiratory syncytial virus) in defined populations is likely
warranted, as certain subpopulations of pediatric patients are at greater risk for
complications secondary to these infections (27, 33–35). Adenovirus infections remain a
large concern for pediatric patients who have undergone transplantation, as the incidence
of infection is about 2.5-fold greater than adult populations (36). Positive test results in
this population may allow physicians to discontinue antibiotics or even consider
treatment with cidofovir in cases of severe infection (37, 38). For cases of seasonal
influenza, the American Academy of Pediatrics recommends that treatment be initiated
for any child hospitalized with presumed influenza or complicated illness, as well as for
children one year of age (39). Furthermore, early detection of a seasonal influenza
infection within 48 hours of symptom onset may prompt treatment with neuraminidase
inhibitors in children (40). Although evidence is lacking, some institutions have
considered treating parainfluenza in immunocompromised patients with ribavirin and or
intravenous immunoglobulin (41). Routine testing might also make some economical
sense, as it may decrease antibiotic usage, shorten the length of hospitalization, and
reduce the number of additional tests ordered for patients that are positive for these
viruses (26, 42–49).
The evidence for viral testing as a screening tool in otherwise healthy patients
presenting with acute respiratory illness is equivocal. A recent meta-analysis by Doan et
al. found that in the pediatric emergency room setting, rapid viral testing for acute febrile
10
respiratory illness did not lead to reduced use of antibiotics, shorter ED stay, or change in
blood or urine testing, although those tested had lower rates of chest X-rays (RR 0.77
95% CI 0.65 to 0.91) (50). Some institutions use viral testing primarily to allocate newly
admitted patients to shared rooms with patients who have a similar viral diagnosis,
otherwise known as “cohorting.” Krasinski et al. found that screening for RSV at
admission and subsequent cohorting reduced the RSV nosocomial rate from 7.17 cases
per 1000 patient days to less than 1 (51). A recent study from the Netherlands further
evaluated this claim in a prospective observational cohort study in pediatric patients
hospitalized due to bronchiolitis (52). The study found that while over half of the
patients shared a room with a patient infected with a different virus (54.1%), only two
patients (4.2%) acquired a co-infection during admission. In addition, these co-infected
patients did not share a room with another patient during their stay. These data suggest
that using viral testing for cohorting purposes may not be rooted in the best available
evidence. As further studies are needed to determine the effect of cohorting, proper
contact precautions and hand washing may be the most effective measures in preventing
nosocomial infections (53, 54).
Having largely replaced detection by viral culture, rapid viral testing has now
become a standard diagnostic tool for respiratory infections. Methods for rapid detection
often entail lateral flow immunochromatography (rapid flu tests), a type of antibody
binding, direct fluorescent antigen (DFA) testing, and viral isolation by nucleic acids via
polymerase chain reaction (PCR) (55–57). While both DFA and PCR have high
specificity, tests based on DFA are less sensitive (25, 58). As DFA is a more cost-
effective test than PCR (59), some institutions have instituted a schema where DFA is
11
used as a first-line “screening test” for respiratory viruses (57, 58, 60). In these
institutions, PCR testing is only done for patients with negative DFA test results.
Although this “stacked” testing approach does allow for some cost-saving by eliminating
the need for expensive PCR testing for patients with positive DFA results, it does not
adequately address the issue that the vast majority of pediatric ER visits for respiratory
illness produce negative test results for all viruses tested (25). Thus, in many cases,
patients receive two types of testing for the same viral agent.
Diagnosis of respiratory viruses likely represents a source of inappropriate
utilization. The available evidence has not backed the routine use of laboratory testing of
respiratory viruses. The American Academy of Pediatrics published a clinical practice
guideline in 2006 on the diagnosis and management of bronchiolitis, which included the
recommendation against routine diagnostic studies, in favor of the history and physical
examination (61). In spite of this, testing practices vary widely from institution to
institution.
The Use of Clinical Prediction Rules
Clinical prediction rules for pediatric respiratory illnesses have been developed to
help reduce the uncertainty, but these mostly focus on the risk of unfavorable outcomes
due to RSV infection, like hospitalization or clinical deterioration. A CPR developed by
Rietveld et al. estimated the monthly risk of hospitalization due to RSV in young children
(62). The study found five clinical predictors: gender, gestational age, birth weight,
presence of bronchopulmonary dysplasia and age. By discriminating between high and
low risk children, the study estimated that passive immunization for RSV could be
reduced by 20%. Another CPR based on data from a prospective birth cohort study,
12
determined the risk of RSV lower respiratory tract infection in healthy newborns (63).
The CPR incorporated the birth history predictors of weight and month of birth, in
addition to the social history components of day care attendance and/or siblings and
parental education. The model had an area under the receiving operating characteristic
curve (AUC) of 0.72 (95% CI 0.64 to 0.80). Brooks et al. developed a prediction rule for
point-of-care use that estimated the risk of deterioration in infants with and RSV
infection (64). Their model focused on more physiological parameters and found
tachypnea and hypoxemia to be predictors with high specificity, >97% for each, and low
sensitivity ≤ 30%. The data suggested that the wide variability in clinical presentation
limited the usefulness of these parameters.
Determining the odds of a specific laboratory diagnosis for respiratory viruses has
not been thoroughly explored in the literature. Michiels et al. derived prediction rules for
distinguishing between influenza and influenza-like illness in the primary care setting
(65). The study found that ruling out influenza using clinical and historical information
is a more feasible approach than trying to rule it in. During periods outside when
influenza is not highly prevalent, the absence of a cough or fever is associated with a 14-
fold decrease in likelihood of influenza. The presence of sick contacts, cough,
expectoration, and fever during a period of an epidemic increases the likelihood by a
factor of three. Using similar clinical factors employed in clinical prediction rules, it may
be possible to calculate the likelihood of being carrier for other viruses. Potential
predictors, such as the seasonality of the influenza, parainfluenza, and RSV viruses,
meteorological parameters, and clinical features have been documented in the literature
(66–71). Little is known, however, about the ordering patterns of these tests and whether
13
test ordering is correctly aligned with seasonal prevalence. If satisfactory test
performance characteristics (sensitivity and/or specificity) are met, clinical models may
be viewed as diagnostic tests that do not add to the cost of a patient’s hospitalization and
are useful for triaging patients with low or high likelihood of serious illness.
As described by Wasson et al. in their seminal article, clinical prediction rules
should adhere to strict methodological standards for use in clinical practice (16). These
include guidelines pertaining to the development of the CPR, like clearly defining the
event to be predicted, as well as the predictive findings, and blinded assessment of
outcome and prediction. Other criteria relate to the communication and evaluation of the
rule, like statement of the specific population that the rule may be applied to and a
description of the mathematical technique employed. By striving to meet all of the
guidelines, researchers are able to ensure that the prediction rules are based on principles
of sound study design and are generalizable.
While CPRs are powerful tools that can supply physicians with point-of-care
diagnostic and prognostic probabilities, which facilitate reductions in spending, the
guidelines to the development, validation, and implementation of CPRs, fail to address
barriers to their use in practice (72). Katz offers multiple reasons for the underuse of
prediction rules, including lack of validation and reproducibility, preference for one’s
own judgment, and a time-consuming process (73). Furthermore, the different types of
CPRs - scoring by univariate analysis, models based on multivariate analysis,
nomograms, artificial neural networks, and decision trees - requires that physicians be
familiar with multiple models, as well as their advantages and disadvantages (19). By
definition, CPRs should contain at least three variables for prediction (16), with
14
additional variables usually resulting in better accuracy of a model. Implementation of
such models in practice are computationally heavy processes for physicians, whereas
leveraging the computational power behind electronic medical records would likely
improve upon and accelerate the process of building clinical models to reduce uncertainty
(74–77).
Practice Based Evidence from Electronic Medical Records
The term “secondary use” of health data entails utilizing personal health
information for purposes other than direct health care delivery (76). The electronic
medical record represents an underutilized source of information on the delivery and
consumption of health services. In their report Best Care at Lower Cost: The Path to
Continuously Learning Health Care, the Institute of Medicine emphasized the
importance of building such a digital infrastructure that supports the improvement of
patient care both immediately at the time of delivery and for patients in the future (3).
This perspective recognizes that areas for quality improvement in health care can already
be found in the electronic medical record, but the system is lacking in the appropriate
tools to identify and act on these areas.
The derivation of clinical prediction rules might potentially benefit from advances
in secondary use. First, the EMR could help practitioners identify inefficient practices,
like non-evidence-based laboratory testing, that are high volume and consume precious
financial resources. These practices could serve as foci for institutional quality
improvement projects. Second, the EMR could serve as an initial source of pre-existing
data, prior to the much more costly expenses of performing the prospective studies that
are required by the strict standards of developing CPRs. Examples of such “practice-
15
based” workflows are now beginning to unfold, as advances in health information
technology, although thus far, efforts have not been focused prediction rules for disease.
Studies incorporating electronic health information into clinically useful models
have increased evidence for real-world application of secondary use. Lependu et al.
published novel methods that utilize the information contained in the free-text portion of
clinical documents to improve pharmacovigilance (78, 79). Specifically, their work
identified both adverse drug events (AUC 75.3%), as well as drug-drug interactions
(AUC 81.5%). Had a continuously learning system been in place, six out of nine drugs in
their reference set would have been detected on a time scale earlier than the official date.
The Duke Enterprise Data Unified Content Explorer (DEDUCE) is an example of
learning health system that serves as a portal for investigators to query their database
containing millions of clinical records, obtain aggregate reports, and expedite cohort
recruitment (80, 81). The system further supports text mining and integration of clinical
text with structured data. Another study demonstrated that automatically extracted
clinical elements could provide accurate real-time assessments of a patient’s physiologic
status in a clinical setting. The researchers focused on an algorithm based on 26 clinical
variables, including vital signs, laboratory test results, cardiac monitoring, and nursing
assessments, to automatically generate a score of a patient’s general condition, known as
the Rothman index (RI). They found that the earliest recorded RI stratified by scores
were significantly correlated with total costs of hospitalization (p < 0.0001) and average
lengths of stay (p<0.0001). Furthermore, the average RI score was significantly
correlated with measures, as well as the average number of complications (p < 0.00001)
(82).
16
The application of clinical prediction rules to laboratory testing may benefit from
a similar approach. A retrospective study by Cismondi et al. aimed to reduce
unnecessary laboratory testing for patients with gastrointestinal bleeds in the intensive
care unit setting (83). Using vital signs data along with previous lab values, the study
employed fuzzy modeling, a type of machine learning for nonlinear systems, to ascertain
whether additional testing would lead to information gain for a given test. Models were
developed for eight blood tests chosen by expert consensus to be most important in the
management of gastrointestinal bleed. The researchers found that use of the models
could reduce testing by 50% on average. Using these models, however, would have also
led to an average false negative rate of 11.5% of tests that actually went unperformed, but
would have resulted in information gain. Particularly in the case of respiratory viruses,
the development of a practice-based CPR might make sense. Use of the electronic
medical record would enhance the audit of test utilization to evaluate whether the current
practice of physicians could actually be improved. Furthermore, as geographic variation
exists in tandem with seasonal variation of different viruses, an institutional based
method might not be generalizable, but may have positive implications for the institution
in question. Furthermore, extraction of clinical concepts through automated text mining
of clinical documents would allow for automated calculation of CPRs or other
computational clinical models, relieving the practitioner to focus on clinical care, as
opposed to memorizing and recalling numerous criteria for a variety of different CPRs.
17
SPECIFIC AIMS
Develop a clinical model using an optimal machine learning classifier that reduces the
volume of respiratory virus tests without missing false negatives. Hypothesis: That
clinical features, such as season, age, and reported symptoms can be used to quantify the
need for testing.
A. Develop a simple clinical model based on billing data variables (season, age, and
gender).
B. Augment the simple clinical model with variables gathered from text mining of
documented history of present illness (HPI).
18
METHODS
Patients and specimens
This retrospective study was performed using protocols reviewed and approved
by the Yale University Institutional Review Board. Prior to data collection, discussions
were held with practicing pediatric experts in hospitalist medicine, infectious disease, and
emergency medicine regarding the volume of respiratory testing, the cost of testing, and
the effect of test results on management. Patients were selected from a database of
patients who received respiratory virus laboratory testing. The study population
consisted of 11,476 hospitalized inpatients from which nasopharyngeal swabs were
obtained from March 2010 to March 2012 at Yale New Haven Hospital (YNHH). The
following inclusion criteria were employed: adequate nasopharyngeal swab sample,
inpatients 18 years old and younger, and test ordering within two days of admission.
While the volume of respiratory virus testing is much higher in the adult population,
pediatric patients were chosen for this study because at this particular institution,
respiratory testing in the adult ED often is ordered prior to a physician seeing the patient,
whereas in the pediatric ED, the patient is usually seen before the order is placed. As a
result, the HPIs written for adult patients might not contain the clinical rationale behind
testing, since the physician taking care of a patient would not have been responsible for
the order.
The data were received in a Microsoft Access database, consisting of the
following variables: MRN, Date of Birth, Billing Number, Order ID, Order Date,
Admission Date, Discharge Date, Gender, Race, Patient Type, Specimen Quality, and
Test Results. The results for the following tests were included: Adenovirus DFA and
19
PCR, Influenza A/B DFA and PCR, Parainfluenza 1-3 DFA and PCR, Respiratory
Syncytial Virus DFA and PCR, Human Metapneumovirus PCR, and Rhinovirus PCR.
The following steps were used to de-identify the data. Each patient was given
randomly generated numeric key (Patient ID), which was stored in a master key file on an
encrypted machine used solely for data de-identification and clinical note retrieval.
Because each Billing Number is associated with a specific visit, we defined a variable for
"Visit Number" for patients with multiple admissions, which stored whether the given set
of test results were obtained during the patient’s first, second, third, etc visit of a given
year. In a similar fashion, some patients received nasopharyngeal swab testing more than
once during their stay, and a new variable for "Order Number" was generated based on
the Order ID and Order Date. The season of testing was obtained from the Order Date.
The age of each patient at the time of testing was calculated into a new variable. The
number of days from admission to the date of the order was also generated. Length of
stay was calculated for each patient, as the difference between the Admission Date and
the Discharge Date. The final resulting de-identified database contained the following
variables: Patient ID, Visit Number, Order Number, Season, Age at Testing, Days until
Order, Length of Stay, Gender, Patient Type, Specimen Quality, and Results for the
following tests: Adenovirus DFA and PCR, Influenza A/B DFA and PCR, Parainfluenza
1-3 DFA and PCR, Respiratory Syncytial Virus DFA and PCR, Human
Metapneumovirus PCR, and Rhinovirus PCR.
Medical concept identification in notes.
For each patient, the history and physical examination on admission was obtained
by accessing Sunrise Clinical Manager on the encrypted machine. A short program was
20
written in Java to parse the HPI from each note, regardless of the specific document
template used. These resulting sections were then de-identified and saved in text files,
identified by the Patient ID, which had been randomly assigned in the previous de-
identification step.
MetaMap 2013 was used to identify medical concepts in the HPI of each note.
MetaMap 2013 is a program made available by the National Library of Medicine that
allows users to map biomedical text to the Unified Medical Language System
Metathesaurus (84, 85). The program offers a high degree of configurability to users,
allowing them to specify the semantic types of concepts to be mapped, set the minimum
threshold for a mapping score, negate concepts, select specialized terminologies, and
expand abbreviations, as well as many other options. In addition, a Java application
programming interface, or API, is also available for MetaMap, which permits users to
query terms to be matched in MetaMap with specified options and tailored outputs. The
Java API was used to write a program that sent the parsed HPI portions to the MetaMap
program for concept identification and exported the returned results into a spreadsheet
containing the original phrase, the matched concept, and the concept type.
The following options were used in MetaMap. We limited the mapping of terms
to the SNOMED CT terminology, considered to be the most comprehensive medical
terminology available. Furthermore, we limited the semantic types to “signs and
symptoms” and “diseases and syndromes”, as we hypothesized that these factors would
most likely be predictive for respiratory virus test results. We also set MetaMap to utilize
all derivational variants of a word identified in the HPI, as well as allow for concept gaps.
MetaMap was also set to expand any acronyms and abbreviations that matched, as well
21
as output negated concepts with a prefix of “neg_concept”. The identified concepts were
stored as a string vector with concepts delimited by a non-letter character (exclamation
point), which were used as delimiters for the tokenization process in the modeling
software. This string was then appended to the data of the corresponding Patient ID.
Machine learning models
The table, including each patient’s age, gender, season of testing, and string of
mapped concepts, was imported into Weka for model development. Weka is a freely
available Java based implementation that houses numerous machine learning algorithms,
as well as tools for data pre-processing, or “munging,” classification, clustering,
association rules, attribute selection, and visualization - all steps employed in data mining
projects. For this thesis project, Weka version 3.7.9 was used specifically for select data
munging steps, attribute selection, and classification model development (86).
Following identification of UMLS Metathesaurus concepts by MetaMap, the data
consisted of the following variables:
● ID (independent variable)
● Age (independent variable)
● Gender (independent variable)
● Season (independent variable)
● String of MetaMap concepts (independent variable)
● Viral diagnosis (dependent variable)
In order to prepare the data for model development, a number of filters within the
Weka software were applied to the data. First, we applied a filtered classifier that used a
word tokenization process to convert the string of MetaMap concepts into a word vector,
22
which across all patients comprised a feature matrix. To be included in the matrix,
concepts had to be present in at least 10 notes. This process resulted in the concepts
featured as additional columns in the table, with 1 representing whether or not the
concept was mentioned in a patient’s HPI and 0 representing the absence of the concept.
Following this step, we performed attribute selection, otherwise known as feature
selection, which determined the most relevant independent variables in the matrix, given
the virus to be modeled. In this step we employed information gain to evaluate the worth
of an attribute. As the information gain was automatically computed by the Weka toolkit,
the mathematical background behind the technique is referenced elsewhere (87, 88).
Attribute selection using information gain allowed us to efficiently shrink the number of
variables to include in the model from over 400 to less than 20, depending on the virus
we were modeling.
Following the application of these filters, the data were then in a format ready for
modeling. For this step, we used a cost sensitive classifier on top of other machine
learning algorithms to deal with our unbalanced dataset (89). Using this approach, we
were able to overcome the fact that the number of negative cases greatly outnumbered the
positive cases for any viral diagnosis. Thus, by weighting against a particular outcome -
in this case false negative results - the subsequent machine learning algorithm could train
to discriminate what might actually constitute positive cases, instead of classifying all
cases as negative, which would provide the best objective results for the model.
Finally, the decision tree learning algorithm, J48, was used to develop and
evaluate each model via 10-fold cross-validation. J48 is an open-source Java
implementation of the C4.5 decision tree algorithm, which classifies instances by
23
iteratively adding nodes and branches that optimize the information gain at each step
(90). Cross-validation was chosen in order to minimize bias associated with differences
that arise year to year. To construct a receiver-operator characteristic (ROC) curve, we
generated multiple sensitivities and specificities at various thresholds, which we set by
varying the cost ratio between false negative to false positive cases for the cost sensitive
classifier. Formally, this technique is known as ROC instance-varying transformation,
although will be referred to as ROC for the purposes of this thesis (91). ROCIV takes
into account that the cost associated with classification errors varies by situation.
Following the iterative process of producing sensitivities and specificities at subsequent
cost thresholds, these values were then used to construct receiver operator characteristic
curves via the trapezoidal rule for each of the three models for each virus: basic,
MetaMap-based, and combined. The trapezoidal rule was defined as base*height/2.
In order to calculate the standard error for each ROC curve, we used the equation
below as published by Hanley and McNeil (92),
SEA 1 A n 1 Q A n 1 Q A
n n
where A is the area under the curve, na is the number of abnormals, nn is the
number of normals, Q1 is the probability that two randomly chosen abnormal results are
both classified as abnormal compared to a random normal result, and Q2 is the
probability that one randomly chosen abnormal result is classified as abnormal compared
to two randomly chosen normal results. Q1 and Q2 are estimated by:
Q
24
Q
Statistical analysis
A pairwise Wilcoxon rank sum test was used to compare the lengths of stay for
different viral diagnoses. The pairwise.wilcoxon.test function in R was used to
calculate whether or not the populations differed with respect to length of stay. Because
multiple comparisons were made, the Bonferroni correction was used to appropriately
adjust the p-value.
To determine the precision of the MetaMap software when run on the corpus of
clinical notes, concepts identified by MetaMap were compared to the original text. One
hundred notes were randomly selected for review. For each note, the identified concepts
were reviewed and compared to the original utterance, which had been mapped. Partial-
match precision was calculated by dividing the number of MetaMap matches (both partial
and exact) by the total number of matches made by MetaMap in a fashion similar to Pratt
and Yetisgen-Yildiz (93). A partial-match was defined as situations in which the
identified MetaMap concept contained all the words expressed in the original phrase, but
did not match the phrase exactly. For example, when MetaMap identified the concept
developmental language delay, whereas the original phrase was developmental delay, the
label “partial-match” was assigned to this mapping. Recall was not calculated because
we were primarily interested in the concepts that MetaMap was actually able to identify
and not terms outside of its matching capabilities.
25
RESULTS
From the period of March 2010 to March 2012, 18,947 nasopharyngeal swab
orders were placed for 11,476 patients during 16,043 visits. Figure 1 shows the
subsequent sample sizes after applying exclusion criteria. Orders for pediatric patients,
who were not originally admitted to the neonatal intensive care unit, comprised 26.3%
orders placed during this time. This population of patients made up 27.9% of all patients
tested. In this sub-population, 58.3% of orders were performed on inpatient admissions,
which encompassed 60.2% of pediatric patient types that were tested. Of the tests that
were ordered within 2 days of admission, 85.6% of specimens were of adequate sample
quality to run the tests. For the patient subset meeting these inclusion criteria, clinical
notes were able to be obtained for 1,848 of these visits. In total, orders for general
admission pediatric inpatients accounted for 11.5% of all respiratory virus test orders
placed during this time.
Table 1 summarizes the basic clinical variables of gender, age, and season by
etiology. Negative test results accounted for 69.5% of all tests ordered during the study
period. Males comprised around half of each viral diagnosis except for adenovirus
diagnoses of which males comprised 68.8%. The mean age for all viral diagnoses was
less than 5 years of age, except for positive cases of influenza, where the mean age of
diagnosis was higher at 8.24. It should be noted that the standard deviation for each of
the mean ages was rather large. One easily measured health outcome, median length of
stay, was consistent across all diagnoses at less than 3 days except for human
metapneumovirus infections (Figure 2). The median duration of stay held true for both
positive and negative cases alike at 2 days, even for patients in whom multiple viruses
26
were detected. A pairwise Wilcoxon rank sum test showed no statistically significant
difference in lengths of stay associated with different viral diagnoses.
Both DFA and PCR panels were ordered throughout the period under study and
showed similar patterns in peak months of test ordering (Figure 3). During the study
period, DFA panels (n = 2152) were ordered 3.9 times more often than PCR panels (n =
550). Figure 4 shows density plots of the positive laboratory tests aggregated by month
during the study duration. Adenovirus and rhinovirus were detected in all months with
no clear pattern. Cases of co-infection, influenza, hMPV, parainfluenza, and RSV
demonstrated regular seasonal fluctuations. The proportion co-infected cases were
present at low rates during the entire year, but demonstrated peaks in the winter months
of each year. None of the cases of influenza occurred outside the winter or spring
months. Cases of hMPV have a similar distribution to influenza infections. Positive
parainfluenza test resulted largely occur during the late winter into the summer, although
positive test results were seen throughout the year. Cases of RSV arose primarily during
the winter months, although the onset of the RSV season appeared to differ between the
two years.
Prior to building the models for each diagnosis using clinical variables, MetaMap
variables, or both, we evaluated the performance of the MetaMap program in identifying
concepts by calculating the partial-match precision across 100 randomly selected notes.
The partial-match precision can be likened to the positive predictive value, in which we
evaluated the concepts MetaMap identified against their original phrases. The main
author evaluated the MetaMap concepts in comparison to the original phrase. As
described in the methods section, partial-matches included cases where the MetaMap
27
concepts contained all of the words in the original phrase, but did not match exactly.
Negative matches failed to meet these criteria. Correct mappings were considered to be
“true positive” cases in the equation, whereas incorrect mappings were “false positive”
cases. The partial-match precision was calculated to be 0.724 across this random sample.
Recall (or sensitivity) was not calculated, as we were not interested in the
comprehensiveness of MetaMap as a concept identifier, but rather in its accuracy.
We initially developed models for the outcomes of DFA or PCR panels, as
positive or negative. A positive DFA or PCR panel meant that at least one test on the
panel returned positive. Season, gender, and age were termed “basic clinical variables”
to be used as the independent variables for inclusion in our initial modeling. The results
are depicted in Figure 5. As can be seen, the models generated using these variables are
both positively predictive, although to a very minimal extent with the AUC for all models
falling < 0.65. Our MetaMap model for the panels consisted of independent variables
solely based on the concepts identified in the history of present illness (HPI) section of a
patient’s admission note. As with the basic clinical variables, MetaMap terms were
predictive, but to a low degree, yielding low rates of sensitivity for varying cost
thresholds. When the MetaMap terms were used in conjunction with the basic clinical
variables, the performance of the resulting model appeared to be slightly more robust in
the case of DFA panel prediction, and remained low for PCR panels.
We then used the same approach to model the test results for individual viruses,
which is graphically displayed in Figure 6 and numerically shown in Table 2. For each
of the six viruses, modeling with basic clinical variables yielded models with predictive
value. Discrimination of test results with basic variables were best with influenza, hMPV,
28
parainfluenza, and RSV, while adenovirus and rhinovirus models showed minimal
predictive power. The use of concepts identified by MetaMap as the sole independent
variables for the models was non-predictive for any virus, except for RSV, where the
MetaMap based model was nearly equally as predictive as the model based on clinical
variables (AUC: 0.661 vs. 0.658, respectively). In all cases except for RSV, models
based on basic variables alone performed as well as or better than models using both
basic and combined variables. For RSV, the use of both clinical variables as well as
concepts identified in HPIs resulted in a model that showed better discrimination than
either basic or MetaMap model alone.
As MetaMap concepts were found to be predictive for RSV test results, we
explored the resulting tree produced by the J48 decision tree algorithm. The tree is
shown in Figure 7. At the root node, the term “acute otitis media” identifies the first
branch point, where inclusion of the term in an HPI was classified as positive by the
model. This node was followed by the term “bronchiolitis,” where again, inclusion of the
word resulted in a positive classification. The presence of the “cough” concept split the
tree into two branches, where presence of the concept along with confirmation of “no
rhinorrhea” resulted in a negative classification. The presence of “cough” with
“rhinorrhea” resulted in a positive classification. On the other branch, the lack of
“cough” was followed by whether the concept of “fever with cough” was present.
Presence of “fever with cough,” “rhinorrhea,” and “crackles” resulted in a positive
classification. “Fever with cough” without mention of “rhinorrhea” also led to positive
classifications. Finally, the presence of “fever with cough” along with “rhinorrhea”
without mention of “crackles” or “URI” resulted in a positive classification.
29
To determine how the MetaMap terms factor into the combined model for RSV,
we mapped out the decision tree of the combined model (Figure 8). Age was determined
to be the first branching point, where patients less than 5.67 were deemed positive.
Patients older than this age were then considered based on the season of their
presentation. Cases during the spring were classified as negative. During the summer, if
patients were > 14.33 years old, they were labeled as positive; otherwise, summer tests
were negative. During the fall, the model considered whether the concept “fever with
cough” was present in the HPI and if so, the case was labeled positive. Otherwise, the
tree evaluated the patient’s age and if it was greater than 10.06, the patient was classified
as positive. The model evaluated cases during the winter first by whether “cough” or
“fever with cough” were present. If so, the case was labeled as positive. If neither term
was found in the HPI, the model evaluated the patient’s age, which if greater than 18.17,
was classified as positive.
We evaluated the each of the combined models for each of the viruses by calculating the
sensitivity, specificity, positive predictive value (PPV) and negative predictive value
(NPV), as shown in Table 3. Because of the trade-off between sensitivity and specificity,
we sought a target sensitivity of 95% for each of the models, as a sensitivity of 100%
would yield 0% specificity and a lower sensitivity would potentially miss positive cases.
Given the specifics of the decision tree algorithm, this target could not be achieved for all
models, namely for rhinovirus, where sensitivity reached 94.3% before increasing to
100%. As detailed in Table 3, specificity ranged from 3.7% to 45.5% for all of the
models at a sensitivity > 95% (except for rhinovirus). Models for adenovirus and
rhinovirus showed the lowest specificities, in the single digits. While the PPV ranged
30
from 50.1% to 64.7% for all models, the NPV ranged from 52.1% to 100%. For
influenza, parainfluenza, RSV, and hMPV, the NPV was above 80.7%.
31
DISCUSSION
This retrospective study evaluated respiratory virus testing performed in the
general pediatric population at a tertiary academic children's hospital. Over a quarter of
all respiratory virus tests ordered were attributable to the pediatric population. Of the
tests that were ordered, the vast majority resulted in a negative finding. Although we did
not study the correlation of testing with changes in management (i.e. decreased antibiotic
use, fewer studies ordered, or decreased cost of hospitalization), we found that no
statistically significant difference in the lengths of stay of the various possible viral
diagnoses, even where the result was negative. In addition to a lack of clear guidelines
that outline changes in management based on test results (except for influenza), our study
calls into question the clinical utility of a positive result, as well as the basis of routine
testing.
Our objective was to develop a clinical model using information available at the
time of test ordering that might reduce test volume, while ensuring that patients with
detectable infections are still tested. This study found that predictive models built on
clinical variables were able to discriminate positive from negative better than chance.
For 4 out of 6 viruses included in our study, billing data alone (age, season, gender) could
be used to build models with fair predictive ability. We also hypothesized that concepts
contained in the HPI portion of the clinician’s admission documentation could improve
the predictive ability of our models. The precision of our concept matches via MetaMap
were in line with previously published results (94–96). In the case of RSV, a model
based only on concepts in the HPI had the same predictive power as the model based on
billing data. Combining these two sources of data improved prediction of RSV. Our
32
findings suggest a useful role for admission notes, aside from documentation.
In the MetaMap-based model for RSV, our approach identified terms that fit the
clinical representation of an RSV infection, supporting the validity of our methodology.
The terms, particularly “bronchiolitis,” made intuitive sense for the diagnosis of RSV.
One term that was somewhat surprising to us was the inclusion of “acute otitis media” as
the root node of the tree. Previously published literature has identified acute otitis media
as a frequent complication following RSV infection (97–102). However, only one study
was found that suggests acute otitis media may present prior to to an RSV infection
(103). While further investigation is required, these results suggest that concept mapping
in clinical notes has the potential to reveal new or understudied risk factors.
Effective implementation of these models as screening tests requires practical
understanding of the test characteristics as they relate to an institution’s clinical goals.
The false negative rate may be an important measure, as care providers may assign a
negative utility to a missed positive case. As a result, a high sensitivity may be a highly
valued attribute of a clinical model. However, there exists a tradeoff with clinical models
in which sensitivity and specificity are usually inversely related. Therefore, a sensitivity
of too high a value may yield a model that does not discriminate between positive and
negative cases. In this way, the specificity of the model has a large effect on cost, as it
the measure that informs a decision maker that a test would likely yield a negative result.
A model with increased specificity means that fewer patients, who would otherwise test
negative, would actually receive DFA or PCR testing. By limiting the number of disease
negative patients who receive diagnostic testing, the population receiving diagnostic
testing would be enriched for positive cases. Therefore a practical, cost-saving clinical
33
model would have the highest possible sensitivity to ensure a low false negative rate.
Any model specificity above 0 would be safe and cost-effective without negative effects
on care, compared to current practice.
It is important to note that the presented clinical models are not designed to
predict positive cases with high accuracy. While we sought models that resulted in the
highest sensitivities, these models often had very high false positive rates. Thus, in our
models, the “positive” and “negative” labels should be considered to be labels
designating “high risk for positive result” and “low risk for positive test result.” The
distinction is important to the proposed function of the models, as the models were
intended to aid the practitioners in reducing the number of overall tests that they order.
In this way, for this project, models were considered to be helpful if they could achieve
high sensitivity and any amount specificity. Sacrificing sensitivity for specificity would
result in fewer tests that might be ordered, but would also result in many more positive
test results that would have been missed.
From a practical point of view, clinical models could act as an “in silico”
screening test for whether or not patients should receive testing. If the models can be
validated against a prospective dataset, they might find practical application via
integration into the electronic medical record, running in the background as the clinician
is entering data about a patient. At the time of test ordering, the physician would be
presented with information regarding what tests are likely negative or potentially
positive. The use of basic variables, as well as documented clinical symptoms, can
reduce test volume for certain tests by up to nearly half with a low false negative rate.
Future work will focus on validating the models, refining the text mining approach and
34
concept identification and implementing the information from the models into the
clinician’s decision making pathway, as well as exploring the concept of customized
panels, based on the prediction results of the models.
Our study has several limitations. First, the population under study included only
patients who received respiratory virus testing and selection criteria were not based on
diagnostic codes. As a result, the seasonal prevalence of disease may not be reflective of
the true prevalence of viral infections. Second, because of our numerous exclusion
criteria, the models may not be generalizable beyond general pediatric inpatients. Third,
while the billing data are true independent variables, the variables collected by text
mining with MetaMap may not be fully independent. Because the timing of when
admission notes were written could not be controlled, there is the possibility that some
notes may have been written after test results were communicated. We took several
measures to prevent this, including selecting the oldest admission note on record and
manually reviewing notes for mention of testing. In addition, the retrospective nature of
the study also prevented a comprehensive chart review with regard to the variables used
in our models. Instead, concepts from HPI text were recorded as “mentioned” versus
“unmentioned.” Because of the nature of the study, we were unable to conduct a
prospective validation of our models, which would allow for perhaps a more accurate
assessment of performance. Our study also did not differentiate between different strains
of viruses, which some of the tests are able to do (i.e. influenza A and B, parainfluenza 1-
3).
The results presented here offer a new perspective on analyzing test utilization
practices for respiratory viruses using data mining and natural language processing
35
techniques. We find that in a tertiary academic children’s hospital, the majority of
respiratory virus testing returns negative. Furthermore, our results suggest that additional
clinical factors may be used in a clinical model to predict the likelihood of an infection
and the need for further diagnostic testing. Text mining of clinical notes may augment
the predictive power of future models, as demonstrated in our models of RSV. This work
contributes to the growing body of evidence that diverse forms data in the electronic
medical record, not just billing data, can be used productively to build models that aid
physicians in decision making.
36
REFERENCES
1. Cuckler GA et al. National Health Expenditure Projections, 2012–22: Slow growth until coverage expands and economy improves. Health Aff. 2013;32(10):1820–1831.
2. Hartman M, Martin AB, Benson J, Catlin A, National Health Expenditure Accounts Team. National health spending in 2011: overall growth remains low, but some payers and services show signs of acceleration. Health Aff . 2013;32(1):87–99.
3. National Research Council. Best Care at Lower Cost: The Path to Continuously Learning Health Care in America. National Academies Press; 2013:
4. Hoffman A, Emanuel EJ. Reengineering US health care. JAMA. 2013;309(7):661–662.
5. Young PL, Saunders RS, Olsen L. The Healthcare Imperative: Lowering Costs and Improving Outcomes: Workshop Series Summary. National Academy Press; 2010:
6. Hanson C, Plumhoff E. Test Utilization and the Clinical Laboratory. Mayo Medical Laboratories Communiqué. 2012;37:1–4.
7. Becich MJ. Information management: moving from test results to clinical information. Clin Leadersh Manag Rev. 2001;14(6):296–300.
8. Hallworth MJ. The “70% claim”: what is the evidence base? Ann Clin Biochem. 2011;48(6):487–488.
9. Forsman RW. Why is the laboratory an afterthought for managed care organizations? Clin Chem. 1996;42(5):813–816.
10. Bonner AB, Monroe KW, Talley LI, Klasner AE, Kimberlin DW. Impact of the rapid diagnosis of influenza on physician decision-making and patient management in the pediatric emergency department: results of a randomized, prospective, controlled trial. Pediatrics. 2003;112(2):363–367.
11. Fryer AA, Smellie WSA. Managing demand for laboratory tests: a laboratory toolkit. J Clin Pathol. 2013;66(1):62–72.
12. Cheng CK-W, Lee T, Cembrowski GS. Temporal approach to hematological test usage in a major teaching hospital. Lab Hematol. 2003;9(4):207–213.
13. Van Walraven C, Cernat G, Austin PC. Effect of provider continuity on test repetition. Clin Chem. 2006;52(12):2219–2228.
14. Verstappen WHJM et al. Variation in test ordering behaviour of GPs: professional or context-related factors? Fam Pract. 2004;21(4):387–395.
15. Sood R, Sood A, Ghosh AK. Non-evidence-based variables affecting physicians’ test-
37
ordering tendencies: a systematic review. Neth J Med. 2007;65(5):167–177.
16. Wasson JH, Sox HC, Neff RK, Goldman L. Clinical prediction rules. Applications and methodological standards. N Engl J Med. 1985;313(13):793–799.
17. Wells PS et al. Accuracy of clinical assessment of deep-vein thrombosis. Lancet. 1995;345(8961):1326–1330.
18. Gandara E, Wells PS. Diagnosis: use of clinical probability algorithms. Clin Chest Med. 2010;31(4):629–639.
19. Adams ST, Leveson SH. Clinical prediction rules. BMJ. 2012;344:d8312–d8312.
20. Reilly BM, Evans AT. Translating clinical research into clinical practice: impact of using prediction rules to make decisions. Ann Intern Med. 2006;144(3):201–209.
21. Crichlow A, Cuker A, Mills AM. Overuse of computed tomography pulmonary angiography in the evaluation of patients with suspected pulmonary embolism in the emergency department. Acad Emerg Med. 2012;19(11):1219–1226.
22. Ong CW et al. Implementation of a clinical prediction tool for pulmonary embolism diagnosis in a tertiary teaching hospital reduces the number of computed tomography pulmonary angiograms performed. Intern Med J. 2013;43(2):169–174.
23. Krauss BS, Harakal T, Fleisher GR. The spectrum and frequency of illness presenting to a pediatric emergency department. Pediatr Emerg Care. 1991;7(2):67–71.
24. Silka PA, Geiderman JM, Goldberg JB, Kim LP. Demand on ED resources during periods of widespread influenza activity. Am J Emerg Med. 2003;21(7):534–539.
25. Arnold JC, Singh KK, Spector SA, Sawyer MH. Undiagnosed respiratory viruses in children. Pediatrics. 2008;121(3):e631–7.
26. Doan Q, Enarson P, Kissoon N, Klassen TP, Johnson DW. Rapid viral diagnosis for acute febrile respiratory illness in children in the Emergency Department. Cochrane Database Syst Rev. 2012;5:CD006452.
27. Hall CB. Respiratory syncytial virus and parainfluenza virus. N Engl J Med. 2001;344(25):1917–1928.
28. Ren L, Xiang Z, Guo L, Wang J. Viral infections of the lower respiratory tract. Curr Infect Dis Rep. 2012;14(3):284–291.
29. Landry ML, Ferguson D. SimulFluor respiratory screen for rapid detection of multiple respiratory viruses in clinical specimens by immunofluorescence staining. J Clin Microbiol. 2000;38(2):708–711.
30. Syrmis MW et al. A sensitive, specific, and cost-effective multiplex reverse
38
transcriptase-PCR assay for the detection of seven common respiratory viruses in respiratory samples. J Mol Diagn. 2004;6(2):125–131.
31. Hall CB. Respiratory syncytial virus and parainfluenza virus. N Engl J Med. 2001;344(25):1917–1928.
32. Peltola V et al. Clinical effects of rhinovirus infections. J Clin Virol. 2008;43(4):411–414.
33. Frost HM, Robinson CC, Dominguez SR. Epidemiology and Clinical Presentation of Parainfluenza Type 4 in Children: A 3-Year Comparative Study to Parainfluenza Types 1-3. J Infect Dis. 2014;209(5):695–702.
34. Henrickson KJ. Parainfluenza viruses. Clin Microbiol Rev. 2003;16(2):242–264.
35. Hall CB. The burgeoning burden of respiratory syncytial virus among children. Infect Disord Drug Targets. 2012;12(2):92–97.
36. Seidemann K et al. Monitoring of adenovirus infection in pediatric transplant recipients by quantitative PCR: report of six cases and review of the literature. Am J Transplant. 2004;4(12):2102–2108.
37. Rocholl C, Gerber K, Daly J, Pavia AT, Byington CL. Adenoviral infections in children: the impact of rapid diagnosis. Pediatrics. 2004;113(1 Pt 1):e51–6.
38. Muller WJ et al. Clinical and in vitro evaluation of cidofovir for treatment of adenovirus infection in pediatric hematopoietic stem cell transplant recipients. Clin Infect Dis. 2005;41(12):1812–1816.
39. Committee on Infectious Diseases. Recommendations for prevention and control of influenza in children, 2013-2014. Pediatrics. 2013;132(4):e1089–104.
40. Garg S, Fry AM, Patton M, Fiore AE, Finelli L. Antiviral treatment of influenza in children. Pediatr Infect Dis J. 2012;31(2):e43–51.
41. Hirsch HH et al. Fourth European Conference on Infections in Leukaemia (ECIL-4): Guidelines for Diagnosis and Treatment of Human Respiratory Syncytial Virus, Parainfluenza Virus, Metapneumovirus, Rhinovirus, and Coronavirus. Clin Infect Dis. 2013;56(2):258–266.
42. Barenfanger J, Drake C, Leon N, Mueller T, Troutt T. Clinical and financial benefits of rapid detection of respiratory viruses: an outcomes study. J Clin Microbiol. 2000;38(8):2824–2828.
43. Bonner AB, Monroe KW, Talley LI, Klasner AE, Kimberlin DW. Impact of the rapid diagnosis of influenza on physician decision-making and patient management in the pediatric emergency department: results of a randomized, prospective, controlled trial. Pediatrics. 2003;112(2):363–367.
39
44. Chapin K. Multiplex PCR for detection of respiratory viruses: can the laboratory performing a respiratory viral panel (RVP) assay trigger better patient care and clinical outcomes? Clin Biochem. 2011;44(7):496–497.
45. Dundas NE et al. A Lean Laboratory: Operational Simplicity and Cost Effectiveness of the Luminex xTAGTM Respiratory Viral Panel. J Mol Diagn. 2011;13(2):175–179.
46. Fendrick AM, Monto AS, Nightengale B, Sarnes M. The economic burden of non-influenza-related viral respiratory tract infection in the United States. Arch Intern Med. 2003;163(4):487–494.
47. Mills JM, Harper J, Broomfield D, Templeton KE. Rapid testing for respiratory syncytial virus in a paediatric emergency department: benefits for infection control and bed management. J Hosp Infect. 2011;77(3):248–251.
48. Papenburg J et al. Comparison of risk factors for human metapneumovirus and respiratory syncytial virus disease severity in young children. J Infect Dis. 2012;206(2):178–189.
49. Syrmis MW et al. A sensitive, specific, and cost-effective multiplex reverse transcriptase-PCR assay for the detection of seven common respiratory viruses in respiratory samples. J Mol Diagn. 2004;6(2):125–131.
50. Doan Q, Enarson P, Kissoon N, Klassen TP, Johnson DW. Rapid viral diagnosis for acute febrile respiratory illness in children in the Emergency Department. Cochrane Database Syst Rev. 2012;5:CD006452.
51. Krasinski K et al. Screening for respiratory syncytial virus and assignment to a cohort at admission to reduce nosocomial transmission. J Pediatr. 1990;116(6):894–898.
52. Bekhof J et al. Co-infections in children hospitalised for bronchiolitis: role of roomsharing. J Clin Med Res. 2013;5(6):426–431.
53. Contreras PA, Sami IR, Darnell ME, Ottolini MG, Prince GA. Inactivation of respiratory syncytial virus by generic hand dishwashing detergents and antibacterial hand soaps. Infect Control Hosp Epidemiol. 1999;20(1):57–58.
54. Isaacs D et al. Handwashing and cohorting in prevention of hospital acquired infections with respiratory syncytial virus. Arch Dis Child. 1991;66(2):227–231.
55. Kehl SC, Kumar S. Utilization of nucleic acid amplification assays for the detection of respiratory viruses. Clin Lab Med. 2009;29(4):661–671.
56. Landry ML, Ferguson D. SimulFluor respiratory screen for rapid detection of multiple respiratory viruses in clinical specimens by immunofluorescence staining. J Clin Microbiol. 2000;38(2):708–711.
57. Mahony JB. Detection of respiratory viruses by molecular methods. Clin Microbiol
40
Rev. 2008;21(4):716–747.
58. Landry M. Respiratory Virus Test Protocol 2011-12: DFA vs. PCR. LabNews. 2011;20(2).
59. Freymuth F et al. Comparison of multiplex PCR assays and conventional techniques for the diagnostic of respiratory virus infections in children admitted to hospital with an acute respiratory illness. J Med Virol. 2006;78(11):1498–1504.
60. Freymuth F et al. Comparison of multiplex PCR assays and conventional techniques for the diagnostic of respiratory virus infections in children admitted to hospital with an acute respiratory illness. J Med Virol. 2006;78(11):1498–1504.
61. American Academy of Pediatrics Subcommittee on Diagnosis and Management of Bronchiolitis. Diagnosis and management of bronchiolitis. Pediatrics. 2006;118(4):1774–1793.
62. Rietveld E et al. Hospitalization for respiratory syncytial virus infection in young children: development of a clinical prediction rule. Pediatr Infect Dis J. 2006;25(3):201–207.
63. Houben ML et al. Clinical prediction rule for RSV bronchiolitis in healthy newborns: prognostic birth cohort study. Pediatrics. 2011;127(1):35–41.
64. Brooks AM et al. Predicting deterioration in previously healthy infants hospitalized with respiratory syncytial virus infection. Pediatrics. 1999;104(3 Pt 1):463–467.
65. Michiels B, Thomas I, Van Royen P, Coenen S. Clinical prediction rules combining signs, symptoms and epidemiological context to distinguish influenza from influenza-like illnesses in primary care: a cross sectional study. BMC Fam Pract. 2011;12(1):4.
66. Henrickson KJ. Parainfluenza viruses. Clin Microbiol Rev. 2003;16(2):242–264.
67. Laurichesse H, Dedman D, Watson JM, Zambon MC. Epidemiological features of parainfluenza virus infections: laboratory surveillance in England and Wales, 1975-1997. Eur J Epidemiol. 1999;15(5):475–484.
68. Call SA, Vollenweider MA, Hornung CA, Simel DL, Mc Kinney MWP. Does This Patient Have Influenza? JAMA. 2005;293:987–997.
69. Weigl JAI, Puppe W, Schmitt H-J. Can respiratory syncytial virus etiology be diagnosed clinically? A hospital-based case-control study in children under two years of age. Eur J Epidemiol. 2003;18(5):431–439.
70. Du Prel J-B et al. Are meteorological parameters associated with acute respiratory tract infections? Clin Infect Dis. 2009;49(6):861–868.
71. Stolz D et al. Diagnostic value of signs, symptoms and laboratory values in lower
41
respiratory tract infection. Swiss Med Wkly. 2006;136(27-28):434–440.
72. Reilly BM, Evans AT. Translating clinical research into clinical practice: impact of using prediction rules to make decisions. Ann Intern Med. 2006;144(3):201–209.
73. Katz MH. Integrating prediction rules into clinical work flow. JAMA Intern Med. 2013;173(17):1591.
74. Laupacis A, Sekar N, Stiell IG. Clinical prediction rules. A review and suggested modifications of methodological standards. JAMA. 1997;277(6):488–494.
75. Toll DB, Janssen KJM, Vergouwe Y, Moons KGM. Validation, updating and impact of clinical prediction rules: a review. J Clin Epidemiol. 2008;61(11):1085–1094.
76. Safran C et al. Toward a national framework for the secondary use of health data: an American Medical Informatics Association White Paper. J Am Med Inform Assoc. 2006;14(1):1–9.
77. Liao L, Mark DB. Clinical prediction models: are we building better mousetraps? J Am Coll Cardiol. 2003;42(5):851–853.
78. LePendu P et al. Pharmacovigilance using clinical notes. Clin Pharmacol Ther. 2013;93(6):547–555.
79. Harpaz R et al. Performance of pharmacovigilance signal-detection algorithms for the FDA adverse event reporting system. Clin Pharmacol Ther. 2013;93(6):539–546.
80. Horvath MM et al. The DEDUCE Guided Query tool: providing simplified access to clinical data for research and quality improvement. J Biomed Inform. 2011;44(2):266–276.
81. Ferranti JM et al. The design and implementation of an open-source, data-driven cohort recruitment system: the Duke Integrated Subject Cohort and Enrollment Research Network (DISCERN). J Am Med Inform Assoc. 2011;19(e1):e68–75.
82. Tepas JJ 3rd, Rimar JM, Hsiao AL, Nussbaum MS. Automated analysis of electronic medical record data reflects the pathophysiology of operative complications. Surgery. 2013;154(4):918–24; discussion 924–6.
83. Cismondi F et al. Reducing unnecessary lab testing in the ICU with artificial intelligence. Int J Med Inform. 2013;82(5):345–358.
84. Aronson AR, Lang F-M. An overview of MetaMap: historical perspective and recent advances. J Am Med Inform Assoc. 2010;17(3):229–236.
85. Aronson AR. Effective mapping of biomedical text to the UMLS Metathesaurus: the MetaMap program. Proc AMIA Symp. 2001;:17–21.
42
86. Hall M et al. The WEKA Data Mining Software: An Update. SIGKDD Explor Newsl. 2009;11(1):10–18.
87. Yang Y, Pedersen J. A comparative study on feature selection in text categorization. In: Fourteenth International Conference on Machine Learning. 1997:412–420
88. Azhagusundari B, Thanamani A. Feature selection based on information gain. International Journal of Innovative Technology and Exploring Engineering. 2013;2(2).
89. Zhao H. Instance weighting versus threshold adjusting for cost-sensitive classification. Knowl Inf Syst. 2008;15(3):321–334.
90. Quinlan JR. C4.5: Programs for Machine Learning [Internet]. San Francisco, CA, USA: Morgan Kaufmann Publishers Inc.; 1993:
91. Fawcett T. ROC Graphs with Instance-varying Costs. Pattern Recognit Lett. 2006;27(8):882–891.
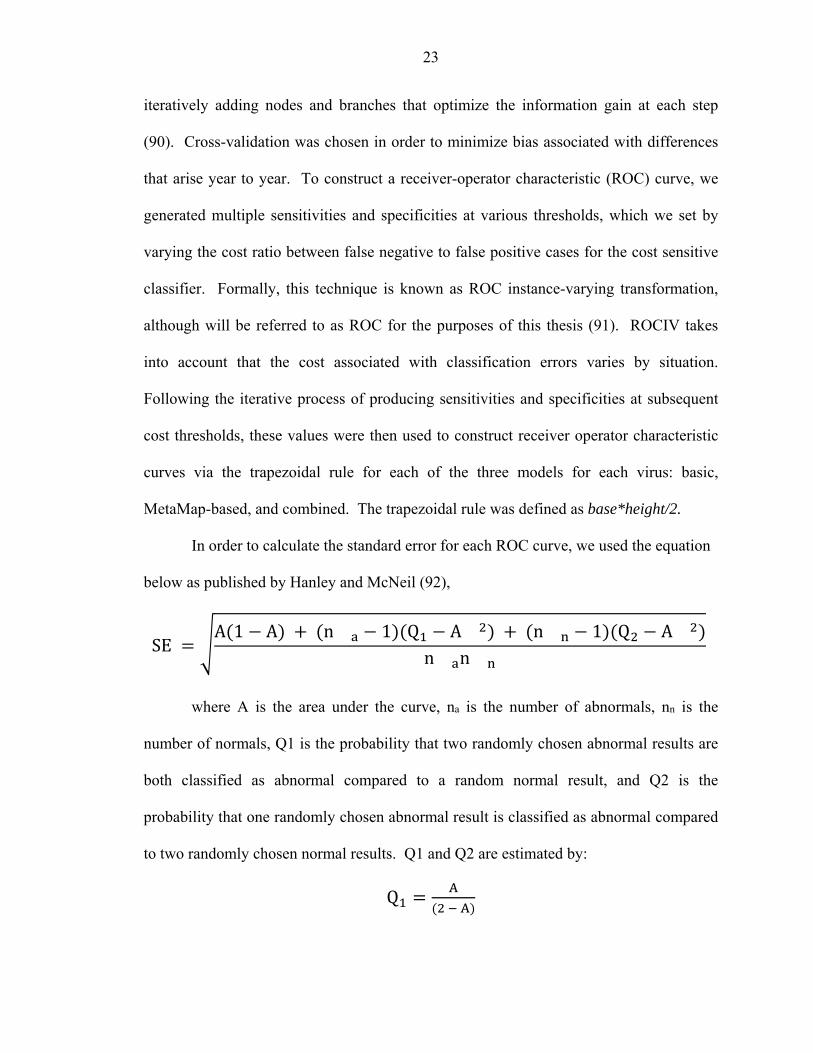
92. Hanley JA, McNeil BJ. The meaning and use of the area under a receiver operating characteristic (ROC) curve. Radiology. 1982;143(1):29–36.
93. Pratt W, Yetisgen-Yildiz M. A study of biomedical concept identification: MetaMap vs. people. AMIA Annu Symp Proc. 2003;:529–533.
94. Pratt W, Yetisgen-Yildiz M. A study of biomedical concept identification: MetaMap vs. people. AMIA Annu Symp Proc. 2003;:529–533.
95. Aronson AR, Lang F-M. An overview of MetaMap: historical perspective and recent advances. J Am Med Inform Assoc. 2010;17(3):229–236.
96. Meystre S, Haug PJ. Natural language processing to extract medical problems from electronic clinical documents: performance evaluation. J Biomed Inform. 2005;39(6):589–599.
97. Stockmann C et al. Seasonality of acute otitis media and the role of respiratory viral activity in children. Pediatr Infect Dis J. 2013;32(4):314–319.
98. Patel JA, Nguyen DT, Revai K, Chonmaitree T. Role of respiratory syncytial virus in acute otitis media: implications for vaccine development. Vaccine. 2007;25(9):1683–1689.
99. Tomochika K et al. Clinical characteristics of respiratory syncytial virus infection-associated acute otitis media. Pediatr Int. 2009;51(4):484–487.
100. Shazberg G et al. The clinical course of bronchiolitis associated with acute otitis media. Arch Dis Child. 2000;83(4):317–319.
101. Pettigrew MM et al. Viral-bacterial interactions and risk of acute otitis media
43
complicating upper respiratory tract infection. J Clin Microbiol. 2011;49(11):3750–3755.
102. Sagai S et al. Relationship between respiratory syncytial virus infection and acute otitis media in children. Auris Nasus Larynx. 2004;31(4):341–345.
103. Andrade MA, Hoberman A, Glustein J, Paradise JL, Wald ER. Acute otitis media in children with bronchiolitis. Pediatrics. 1998;101(4 Pt 1):617–619.
44
FIGURES
Figure 1. The graphic depicts the study population with inclusion criteria. From all
of the respiratory virus test orders placed during this period, we identified pediatric
patients who had not been hospitalized in the NNICU since birth. Tests from inpatient
visits, lasting less than 100 days were then selected. To prevent the selection of
nosocomial cases, we selected cases where testing was performed within a short window
following admission. From this, we selected cases where an adequate NP sample had
been collected. Visits where an admission note was available were included for the final
study cohort. Abbreviations: NNICU, neonatal intensive care unit; LOS, length of stay;
NP, nasopharyngeal.
45
Figure 2. Boxplots of the lengths of stay are similar for all possible virus diagnoses.
The median length of stay for diagnoses of adenovirus (n = 32), influenza (n = 40),
parainfluenza (n = 93), RSV (n = 234), rhinovirus (n = 180), co-infection (n = 57), and
non-detected viruses (n = 1519) is 2 days. The median length of stay for a diagnosis of
human metapneumovirus (n = 29) is 3 days. The dark horizontal lines represent the
median with the box representing the 25th and 75th percentiles. The whiskers depict the
5th and 95th percentiles and outliers are represented by dots.
46
Figure 3. Ordering of respiratory test panels throughout the year. (A) total number
of ordered DFA panels by month; (B) total number of ordered PCR panels by month.
Note that the y-axis for the panels differ, as DFA panels are ordered in greater volume
than PCR panels.
47
Figure 4. Positive test results as a proportion of all test result for each detectable
virus, by month. Each line represents the pattern of positive test results for each virus,
where each point is the monthly proportion of positive results over all positive tests
during the observed study period.
48
Figure 5. J48 decision tree classifier models predicting whether a panel of tests
(DFA or PCR) will contain one positive result. A cost sensitive classifier was used as
a wrapper for the J48 decision tree classifier to weight against false negative cases.
Models were designed to discriminate between panels containing at least one positive test
result versus all negative test results. The varying lines represent different sources of
data use to generate the models. Lines in red represent “basic” models derived from
administrative billing data that predict the outcome for DFA (AUC = 0.523) and PCR
(AUC = 0.601) panels. Lines in blue represent “MetaMap” models using concepts
identified by the MetaMap software only to predict the outcome for DFA (AUC = 0.624)
and PCR (AUC = 0.576) panels. Lines in green represent “combined” models that use
both administrative billing data and MetaMap concepts for DFA (AUC = 0.671) and PCR
(AUC = 0.628) panel prediction.
49
Figure 6. J48 decision tree classifier models predicting the outcome of laboratory
tests for individual viruses. Models were designed to discriminate positive versus
negative test results for each virus. A cost sensitive classifier was used as a wrapper for
the J48 decision tree classifier to weight against false negative cases. The varying lines
represent different sources of data use to generate the models. The performance
characteristics for the models are listed in Table 3.
50
Figure 7. Graphical depiction of the RSV decision tree generated by the J48
classifier model using only MetaMap concepts. Using the tree, each case begins with
the presence (bolded double line) or absence (dashed line) of the term “acute otitis
media” in the physician’s history of present illness, passes through the subsequent nodes
in a similar manner, and depending on the concepts contained in the HPI, ends in
terminal leaves, marked “positive” and “negative”.
51
Figure 8. The graphical representation of the J48 decision tree classifier for RSV
when based on both administrative billing data and MetaMap concepts. Thresholds
for administrative billing data (age and season) were determined by the J48 algorithm
based on the information gain provided by the resulting attribute splits. These are
denoted by the single lines. The presence or absence of terms in the clinician HPIs are
depicted by branching nodes, followed bolded double lines and dashed lines,
respectively.
52
Tab
le 1
. S
um
mar
y b
asic
cli
nica
l var
iab
les
of g
ener
al a
dm
issi
on p
edia
tric
inp
atie
nts
by
etio
logy
(20
10-2
012)
A
den
ovir
us
case
s
(n =
32)
Infl
uen
za
case
s
(n
=
40)
Par
ain
flu
enza
ca
ses
(n
= 9
3)
RSV
ca
ses
(n =
234
) h
MP
V
case
s
(n =
29)
Rh
inov
iru
s ca
ses
(n
= 1
80)
Mu
ltip
le
det
ecti
ons
(n =
57)
Lab
-neg
ativ
e ca
ses
(n
= 1
519)
Mal
es, N
o. (
%)
22 (
68.8
) 21
(52
.5)
47 (
50.5
) 12
5 (5
3.4)
15
(51
.7)
91 (
50.6
) 31
(54
.4)
858
(56.
5)
Age
, m
ean
± S
D
(yrs
) 3.
75 ±
3.7
8 8.
24 ±
6.5
3 2.
99 ±
4.1
0 2.
14 ±
3.2
0 4.
89 ±
5.0
0 4.
40 ±
4.7
4 2.
39 ±
3.3
9 4.
88 ±
5.2
9
Sea
son,
No.
(%
)
Spr
ing
9 (2
8.1)
19
(47
.5)
51 (
54.8
) 22
(9.
4)
17 (
58.6
) 59
(32
.8)
22 (
38.6
) 53
1 (3
5.0)
Sum
mer
6
(18.
8)
0 21
(22
.6)
5 (2
.1)
0 26
(14
.4)
5 (8
.8)
211
(13.
9)
Fal
l 6
(18.
8)
0 12
(12
.9)
53 (
22.6
) 2
(6.9
) 68
(37
.8)
12 (
21.1
) 38
1 (2
5.1)
Win
ter
11 (
34.3
) 21
(52
.2)
9 (9
.6)
154
(65.
8)
10 (
34.5
) 27
(15
.0)
18 (
31.6
) 39
6 (2
6.0)
TABLES
53
Table 2. Receiver operator characteristic curve characteristics
ROC curve AUC (SE)
Basic model MetaMap model Combined model
Adenovirus 0.568 (0.114) 0.480 (0.099) 0.532 (0.108)
Influenza 0.743 (0.126) 0.451 (0.084) 0.715 (0.122)
Parainfluenza 0.686 (0.078) 0.510 (0.061) 0.694 (0.078)
RSV 0.658 (0.048) 0.661 (0.048) 0.722 (0.051)
hMPV 0.713 (0.143) 0.474 (0.103) 0.682 (0.138)
Rhinovirus 0.549 (0.047) 0.471 (0.041) 0.570 (0.048)
54
Table 3. Test characteristics of combined model for each of the viruses
Virus Sensitivity Specificity PPV NPV
Adenovirus 0.966 0.037 0.501 0.521
Influenza 1.00 0.455 0.647 1.00
Parainfluenza 0.965 0.198 0.546 0.850
RSV 0.953 0.196 0.542 0.807
hMPV 0.974 0.205 0.551 0.887
Rhinovirus 0.943 0.076 0.505 0.571
*A minimum threshold sensitivity of 95% was set for each of the combined models.