Clays and Clay Minerals, Vol. 44, No. 5, 599-608, 1996. REDUCTION OF NITRATE BY Fe 2+ IN CLAY MINERALS VIBEKE ERNSTSEN Geological Survey of Denmark and Greenland, Thoravej 8, DK-2400, Copenhagen NV, Denmark Abstract In the 12 km 2 catchment area of Syv creek, Denmark, moderate to high concentrations of nitrate (NO3-) occurred in the upper part of the oxidized zone (oxic-I), but dropped within the lower suboxic part (oxic-II), to below the detection limit in the unoxidized zone. Structural Fe 2+ in the clay minerals made up 10 to12% of the Fe in the oxidized zone and increased to approximately 50% in the unoxidized zone. Concurrent with changes in the distribution of structural Fe 2+ the clay mineral constit- uents changed. Vermiculite was typically found in the oxidized zone whereas chlorite was found in the unoxidized zone only. A conversion of illite and chlorite into vermiculite seems to take place. A significant correlation between NO 3 and the amount of reduced Fe 2§ in the suboxic (oxic-II) zone, indicates that primary structural Fe 2+ in the clay minerals is the reductant in a NO 3 reduction process. Key Words--Chlorite, Clayey till, Exchangeable ferrous iron, Illite, Mrssbauer, Nitrate, Oxidized, Struc- tural ferrous iron, Unoxidized, Vermiculite, Weichselian, X-ray. INTRODUCTION In Denmark more than 95% of the public water sup- plies come from ground water sources, and until now only treatment on a limited scale has been neccesary before the ground water is distributed to the consum- ers. More than 65% of the country is under intensive agricultural production. The addition of increasing amounts of nitrogen fertilizers has resulted in a grow- ing risk of NO 3- contamination of the ground water. Normally the concentration of NO3- in drainage wa- ter below the root zone does exceed the European Union (EU) maximum admissible concentration for drinking water. Nevertheless, low concentrations of NO 3- are found in ground water in confined aquifers covered by thick layers of clayey sediments (Christen- sen 1970; Jacobsen 1995) and therefore, NO 3 reduc- tion seems to take place. Few studies in Denmark have focused on NO3- re- duction in clayey sediments. Christensen (1970) stated that NO 3- is reduced by soluble Fe 2+ in the reduced ground water. For 2 profiles to depths of 20 m below arable land, Lind and Pedersen (1976) showed that NO3- occurs in considerable amounts in the upper ox- idized zone, whereas the NO 3- content was low within the underlying unoxidized zone. Exchangeable Fe 2+ within the unoxidized clayey till was described as es- sential for the NO3- reduction when considered as a chemical process. Similarly, studies on 3 profiles in clayey till to depths of 21 meters below agricultural land showed that NO3- occurred in the oxidized zone only. Primary structural Fe 2§ in the clay minerals was postulated to be of importance for NOs reduction in organic-poor clayey till (Ernstsen and Lindgreen 1985; Ernstsen 1989; Ernstsen and MCmp 1992) with low biological denitrification activities (Zeuthen et al. 1991). Also for clayey till of southern Alberta, Canada, Hendry et al. (1984) demonstrated a close correlation Copyright 1996, The Clay Minerals Society between the redox environment and the distribution of NO 3 , that is, high concentrations of NO3 in oxidized till and low concentrations within unoxidized clay. The biological denitrification rates were low for samples from both oxidized and unoxidized till and increased rates were primarily localized within fractures with fa- cilitated transport of organic matter from the soil sur- face or adjacent inherent fragments of organic matter (micro-sites) (Fujikawa and Hendry 1991). To improve our knowledge of the impact of surface- applied N on the ground water quality for areas dom- inated by clayey till, the distribution of NO 3- and mechanisms of NO 3- reduction were studied for the catchment area of Syv creek. MATERIALS AND METHODS Site Description The study area, the catchment area of Syv creek, is located 45 km southwest of Copenhagen, Denmark (Figure 1). The area is under intensive agricultural pro- duction. Ten to 60 of clayey till deposited during the Young Baltic advance of the Middle Weichselian Glaciation (14 to 15 Ka B.P.) cover the confined aquifers (Hou- mark-Nielsen 1987; Emstsen et al. 1990). The clay content of the clayey till varies between 10% and 20% (calculated on material <2 ram) and the amount of organic matter in this type of sediment is low, typically 0.2 to 0.4% C (Lind and Pedersen 1976; Ernstsen 1989). Free CaCO3 occurs below the root zone and pH(CaCI2) was 7.7 to 7.8 (Emstsen et al. 1990). Sample Collection Eleven profiles (SBI-SBXI) were examined within the 12 km 2 catchment area of Syv creek (Figure 1) and sediment samples were collected to depths of 29 m. The samples were stored frozen until chemical and mineralogical analysis. 599
Transcript
Clays and Clay Minerals, Vol. 44, No. 5, 599-608, 1996.
R E D U C T I O N OF NITRATE B Y Fe 2+ IN C L A Y M I N E R A L S
VIBEKE ERNSTSEN
Geological Survey of Denmark and Greenland, Thoravej 8, DK-2400, Copenhagen NV, Denmark
Abstrac t In the 12 km 2 catchment area of Syv creek, Denmark, moderate to high concentrations of nitrate (NO3-) occurred in the upper part of the oxidized zone (oxic-I), but dropped within the lower suboxic part (oxic-II), to below the detection limit in the unoxidized zone. Structural Fe 2+ in the clay minerals made up 10 to12% of the Fe in the oxidized zone and increased to approximately 50% in the unoxidized zone. Concurrent with changes in the distribution of structural Fe 2+ the clay mineral constit- uents changed. Vermiculite was typically found in the oxidized zone whereas chlorite was found in the unoxidized zone only. A conversion of illite and chlorite into vermiculite seems to take place. A significant correlation between N O 3 and the amount of reduced Fe 2§ in the suboxic (oxic-II) zone, indicates that primary structural Fe 2+ in the clay minerals is the reductant in a N O 3 reduction process.
In D e n m a r k more than 95% of the publ ic wate r sup- pl ies come f rom ground wa te r sources, and unt i l now only t rea tment on a l imi ted scale has been neccesa ry before the g round water is d is t r ibuted to the consum- ers. More than 65% of the coun t ry is unde r in tens ive agr icul tural product ion. The addi t ion of increas ing amount s of n i t rogen fert i l izers has resul ted in a grow- ing r isk of N O 3- con tamina t ion o f the g round water.
Norma l ly the concen t ra t ion of NO3- in dra inage wa- ter be low the root zone does exceed the Eu ropean U n i o n (EU) m a x i m u m admiss ib le concen t ra t ion for d r ink ing water. Never the less , low concent ra t ions of N O 3- are found in g round wate r in conf ined aquifers covered by thick layers of c layey sed iments (Chr is ten- sen 1970; Jacobsen 1995) and therefore, N O 3 reduc- t ion seems to take place.
Few studies in D e n m a r k have focused on NO3- re- duc t ion in c layey sediments . Chr i s t ensen (1970) stated that N O 3- is r educed by soluble Fe 2+ in the reduced g round water. For 2 profi les to dep ths of 20 m be low arable land, L ind and Pedersen (1976) showed that NO3- occurs in cons iderab le amount s in the upper ox- id ized zone, whereas the N O 3- con ten t was low wi th in the under ly ing unox id ized zone. E xchangeab l e Fe 2+ wi th in the unox id ized c layey till was descr ibed as es- sent ia l for the NO3- reduct ion w h e n cons idered as a chemica l process. Similarly, studies on 3 profi les in c layey till to depths of 21 meters be low agricul tural land showed that NO3- occur red in the ox id ized zone only. P r ima ry structural Fe 2§ in the clay minera l s was pos tu la ted to be o f impor t ance for N O s reduc t ion in o rgan ic -poor c layey till (Erns t sen and L indgreen 1985; Erns t sen 1989; Erns t sen and M C m p 1992) wi th low bio logica l deni t r i f ica t ion act ivi t ies (Zeu then et al. 1991).
A l so for c layey till o f sou thern Alber ta , Canada, H e n d r y et al. (1984) demons t ra t ed a close corre la t ion
Copyright �9 1996, The Clay Minerals Society
be tween the redox e n v i r o n m e n t and the d is t r ibut ion o f N O 3 , t h a t is , h igh concen t ra t ions o f NO3 in ox id ized till and low concent ra t ions wi th in unox id ized clay. The b io logica l deni t r i f icat ion rates were low for samples f rom bo th oxid ized and unox id ized till and increased rates were pr imar i ly local ized wi th in fractures wi th fa- ci l i ta ted t ranspor t of organic mat te r f rom the soil sur- face or adjacent inheren t f ragments of organic mat te r (micro-si tes) (Fuj ikawa and H e n d r y 1991).
To improve our knowledge o f the impac t o f surface- appl ied N on the g round water qual i ty for areas dom- ina ted by c layey till, the d is t r ibut ion of N O 3- and m e c h a n i s m s of N O 3- reduct ion were s tudied for the ca t chmen t area of Syv creek.
M A T E R I A L S A N D M E T H O D S
Site Descr ip t ion
The s tudy area, the ca t chmen t area of Syv creek, is located 45 k m sou thwes t of Copenhagen , D e n m a r k (Figure 1). The area is under in tens ive agricul tural pro- duct ion.
Ten to 60 of c layey till depos i ted dur ing the Young Bal t ic advance of the Midd le Weichse l ian Glac ia t ion (14 to 15 Ka B.P.) cover the conf ined aquifers (Hou- mark-Nie l sen 1987; E m s t s e n et al. 1990). The clay con ten t of the c layey till varies be tween 10% and 20% (calcula ted on mater ia l < 2 ram) and the amoun t o f organic mat te r in this type of sed imen t is low, typical ly 0.2 to 0 .4% C (Lind and Pedersen 1976; Erns t sen 1989). Free CaCO3 occurs be low the root zone and pH(CaCI2) was 7.7 to 7.8 ( E m s t s e n et al. 1990).
Sample Col lec t ion
E leven profi les (SBI -SBXI) were e x a m i n e d wi th in the 12 k m 2 ca t chmen t area of Syv creek (Figure 1) and sed iment samples were col lected to depths of 29 m. The samples were s tored f rozen unt i l chemica l and minera log ica l analysis .
599
600 Ernstsen Clays and Clay Minerals
<~ / (: / L ~ o~, ""i
Figure 1. The catchment area of Syv creek, Denmark, with study sites SBI-SBXI.
Methods
The color of the sediment samples were described after the Munsell Soil Color Chart (Munsell Color Company 1976). Nitrate and exhangeable NH4 § were extracted from sediment samples with 2M KC1 (2 ml extractant/g sediment). Structural Fe 2§ and Fe 3§ within clay minerals and free Fe oxides were investigated by 57Fe M~Sssbauer spectroscopy at 77K, exchangeable Fe e+ was extracted from samples (2 ml extractant/g sediment) with a 3% A1C13 solution (Lind and Peder- sen 1976) and the amount of Fe in the subsoil was determined by Atomic Adsorption Spectroscopy (AAS) after digestion with HE Semi quantitative clay
mineralogy was determined by X-ray diffraction (XRD) analysis of clay fractions. The sediment sam- pies were pretreated with sodium acetate at pH 5.0 to remove carbonate. The clay fraction was separated into fine clay (<0.2 ~m) and coarse clay (0.2 to 2 Ixm) using a continuous-flow centrifuge. Iron and A1 oxides were removed by Na-citrate/Na-bicarbonate/Na-di- thionite (Mehra and Jackson 1960). Diffractometer mounts were prepared by the pipette method with 20 mg sample per cm 2. The specimens analyzed were Mg 2+- or K+-saturated air-dried specimens, MgZ§ - urated and glycerated specimens and K+-saturated specimens heated for one hour at 300 ~ Identification of the different groups of minerals was as follows: oxidized zone 7.1 ,~, kaolinite; unoxidized zone 7.1 ,~, kaolinite and chlorite; 9.8 ]k, illite; 13.8 ,~-glycerol (oxidized zone), vermiculite; 13.8 ,~-glycerol (unoxi- dized zone), vermiculite and chlorite; 13.8 .~-300 ~ (unoxidized zone), chlorite; and 18,2 ,~, smectite. Mixed-layered illite-smectite was identified by in- creased peak intensity between 9.8 ]k and 14.0/k for air-dried Mg-treated samples. The clay mineral com- positions were calculated by relative reflection inten- sities. The total clay reflection area was normalized to 100%. The age of pore-water was determined by its tritium (3H) content.
RESULTS
Color and Redox Environment
The profiles were subdivided by color (matrix and mottles) into oxidized and unoxidized redox environ-
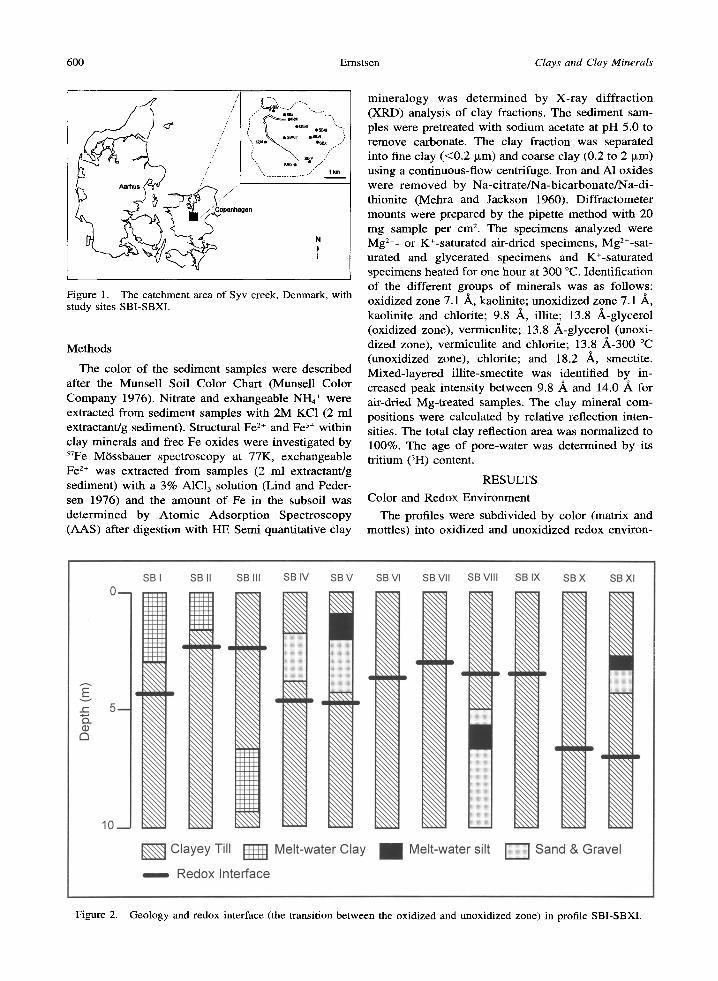
Figure 2. Geology and redox interface (the transition between the oxidized and unoxidized zone) in profile SBI-SBXI.
Vol. 44, No. 5, 1996 Reduction of nitrate 601
NO 3 (mgNkg -1) NH + ( m g N k g l ) 4
0 5 10 15 2 0 0 5 10 10 ~'" ,' , 10 j' , " ,
: . . :
a
~ -10
D
-20
|
Figure 3. N O 3 v s . depth relative to redox interface. Data from profiles SBI-SBXI.
e e R e d o x Interface
~/) 0 !::i!!i~!i~ii~ii~ii~iiiii~iiiiiiiiiiiiiii!!~!!!!!i!!i!i!iii~!!ii!!!iiiii~i!~i::~!i::iiiiii~iiiii~iiiiiii!iiiii!i _ . e e
~" I oo �9 =Z ~ oo -10 �9
o 3 �9
-20 �9 �9
Figure 4. Exchangeable NI-I4 + v s . depth relative to redox interface. Data from profiles SBI-SBXI.
ments (Figure 2). The oxidized zone was at SBII and SBIII about 2.5 m deep, grey (5Y 7/2 or 4/1) with yel lowish brown mottles (10YR 5 / 4 - 1 0 Y R 5/8) and in the other profiles 3 m to 7 m, yel lowish brown (10YR 5/4 or 6/4) or brown (10YR 5/3). In all profiles the oxidized zone formed a well-defined t rans i t ion- -a re- dox interface--- toward the underlying unoxidized, grey (5Y 4/1 or 5/1) zone.
Nitrate (NO3-) and Exchangeable Ammoniurn (NH4 + )
At the study sites, NO3 was present in variable quantifies (1 to 15 nag NO3-N kg -1) within the oxi- dized zone (Figure 3) and decreased to be low the de- tection limit for the unoxidized zone. Typically, the distribution of NO3- across the redox interface, as shown for the S B X site, showed fairly high concen- trations in the upper part o f the oxidized zone, but decreased rapidly within a narrow I m zone above the redox interface to values below the detection l imit for
the unoxidized zone (Figure 5). Trit ium data f rom the SBX site revealed that the water infiltrating the soil surface since 1963 was recovered NO3-free to approx- imately 5 m below the redox interface (Figure 5). At another 7 sites within the catchment area pore-water f rom 1963 was found NO3-free at 0.5 m to 8 m be low the redox interface.
The exhangeable-NH4 + level was smaller than 2 mg NH4-N kg -1 within the oxidized zone, but increased within the uppermost (1 m) segment of the unoxidized zone to values below 7 mg NHa-N kg -1 (Figure 4). Moreover, as seen at site S B X increasing concentra- tions of exchangeable NH4 § were found within the lay- er with decreasing N O 3 concentrations, just above the redox interface (Figure 5).
Iron Oxides, Structural Fe z+ and Fe 3+ in Clay Minerals and Soluble Fe z+
The amount of Fe 3+, either in free Fe oxides or in clay minerals, was 86 to 90% of the total Fe for the
602 Ernstsen Clays and Clay Minerals
+
NO 3 and NH 4
0.0 2.5 0
m 1
(mg N k g ) 5.0
(1) "0 6 t=.l=
3
10
12
0 ~ o'
6
11 ,~
Redox Inter face
o
> iio
I--O , NO3-N t
0 2O
NH4-N --~ Tritium
40 60
e -
80
- 1963
0 Q .
Tritium (TU)
Figure 5. NO3-, exhangeabie NH4 +, and tritium (3H) isotope vs. depth in profile SBX. Tritium has been abundant in pre- cipitation since 1952 when aboveground nuclear tests began, and reached maximum values in 1963, when nearly all above- ground testing ended. The presence of substantial amounts of tritium in pore-waters therefore identify water which entered the soil surface in 1963.
upper part of the oxidized zone and the amount de- creased to about 50% within the unoxidized zone, where Fe 3+ was bound primari ly within clay minerals (Figure 6). Free Fe oxides were not detected in this zone. The Fe remaining was structural Fe z+ within the clay minerals, and the amount increased markedly at the redox interface (Figure 7). The content of struc- tural Fe z+ for clay minerals (Figure 7) was fairly con- stant, 10 to 14%, in the upper part of the oxidized zone, but increased evenly within a 2 m wide zone above the redox interface, to about 50% in the grey unoxidized zone. The distribution of exchangeable Fe 2+ was similar to that of structural Fe 2§ in clay min- erals, that is, the content of exchangeable Fe 2+ was relat ively low, <5 mg Fe kg -~ for the upper part of
the oxidized zone, but increased within the lower 2 m of the oxidized zone to approximately 70 mg kg -t within the unoxidized zone (Figure 8). The total amount of Fe was typically in the range of 1.1% and 1.9% Fe for both the oxidized and the unoxidized zone, and remained unaffected by the oxidation pro- cesses (Figure 7).
Clay Minerals in Clay Fractions
In the coarse clay fraction (0.2 to 2 p,m) f rom the oxidized zone, constituent clay minerals were smecti- te, mixed- layered smectite-illite, illite, kaolinite and vermiculi te (Figure 9). Mixed- layered smectite-i l l i te was identified by increased peak intensity between 9.8 /k and 14 ,~ on X R D patterns of the air-dried Mg-sa- turated sample. In the unoxidized zone, the composi- tion was slightly different, as small amounts of chlorite (<10%) were found (13.8 ~ , K-300 ~ (Figure 9). The distribution of illite, vermiculi te and chlorite changed across the redox interface (Figure 10). Peak areas of illite (28 to 30%) and chlorite (9 to 11%) were larger for the unoxidized zone, whereas only traces of vermiculi te were detected. Relat ive peak area of ver- miculi te for the oxidized zone was 22%.
The clay minerals present in the fine clay (<0 .2 p,m) at the redox interface were the same as within the coarse clay (Figure 9), but the amounts were different. Smect i te was the most c o m m o n mineral (41 to 46%) and vermicul i te decreased slightly to about 15% and chlorite decreased to 6%.
D I S C U S S I O N
According to the color of the soil matrix and mot- tles, the subsoil was subdivided into 2 major redox environments, an upper oxidized zone (3 to 7 m) and an unoxidized zone. Thus, the average downward pro- gression of the redox interface during post-glacial t ime (13 to 14 Ka B.P.) has been 0.02 to 0.05 cm/year, formed primarily by dissolved 02 in the recharge wa- ter. The geochemical and mineralogical environment in the unoxidized zone probably have remained un- changed during post-glacial time.
The distribution of NO 3- indicated that the oxidized zone may be subdivided into 2 zones: 1) an upper, intensively oxidized zone (oxic-I) with relat ively high NO 3- concentrations to about 2 m above the redox interface; and 2) a partly oxidized, suboxic zone (oxic- II) charac te r ized by decreas ing concent ra t ions o f NO3-. High, almost constant concentrations of NO 3- in the oxic-I zone showed that NO 3- reduction was limited, probably because of l imit quantities of suit- able reductants (Ernstsen 1989). In this zone, inherent exchangeable NH4 + was oxidized by the downward progressing oxidation front.
However, the distribution of NO3- in the underlying, oxic-II zone, about 2 m deep demonstrated that N O 3 reduction processes here controlled the progression of
Vol. 44, No. 5, 1996 Reduction of nitrate 603
Fe Oxides I I I I I
Fe 2+, , r~Fe 3+
7.5 m ' ~ ~ ~
r
77 K I I I I I
-10 -5 0 5 10 Velocity (mm/s)
Figure 6. M6ssbauer spectra from the oxidized (1.5 m) and (7.5 m) unoxidized zones in profile SBX. Structural Fe 2§ and Fe 3-- in clay minerals and Fe oxides.
NO3-. A 1 to 2 m, oxic-II zone was typical for the SB
si tes wi th in the c a t c h m e n t area ( E m s t s e n et al. 1990).
Norm a l ly the va lues for exchangeab l e NH4 + were low
wi th in the oxic-II zone, bu t at 4 o f the 11 sites, in-
creased a m o u n t s o f e xc ha nge a b l e NH4 + were me a -
sured.
Occur rence o f N O 3- in the ox id ized zone and NH4 +
in the unox id i zed zone was also descr ibed by L ind and
604 Ernstsen Clays and Clay Minerals
Figure 7.
Structural Fe2+(% of total Fe) 0 25 50
' I ' I
i 2 �9
Red o = 0
~ - 2
SBI
-4 �9
SBII SBVll SBIX BI
Total Fe (%) 0 1 2 3 4
C
4
41
41' Redox Interface
D
Structural Fe 2+ in clay minerals and Fe-total for the fraction < 2ram vs. depth relative to redox interface.
Pedersen (1976), H e n d r y et al .(1984), Erns t sen and L indgreen (1985) and Erns t sen (1989), bu t in these studies no efforts were m a d e to subd iv ide the oxid ized zone.
Tr i t ium (3H) and N O 3 profi l ing at S B X (Figure 5) and ano ther 7 sites revea led that ini t ia l ly NO3-rich re- charge wate r younge r than 1963 was r ecovered NO3- free at 0.5 m to 8 m be low the redox interface. The u n e v e n d o w n w a r d progress ion of recharge wate r was cont ro l led by site specific hydrogeolog ica l condi t ions . Never the less , the occur rence of young, NO3-free water be low the redox in ter face s t rongly indicates that NO3- reduct ion occurs.
The d is t r ibut ion of exchangeab le and structural Fe 2§ wi th in the oxid ized zone supports a subdiv is ion of the oxid ized zone into 2 redox env i ronments . In the upper (oxic-I) zone, low amounts of exchangeab le Fe 2§ and approx imate ly 10% structural Fe 2§ were present and the r ema in ing structural Fe 2§ is mos t l ikely non-acces - sible or only s lowly access ible to the oxidat ion pro- cesses. The amount s of bo th exchangeab le and struc- tural Fe 2§ increase wi th in the b r o w n colored oxic-II zone, thus indica t ing changes into still more unoxidi - zed redox condi t ions , for example , lower redox poten- tials (Pat r ick and De lanne 1972). As ind ica ted by grey colors, free Fe oxides could not be detected in the
Vol. 44, No. 5, 1996 Reduction of nitrate 605
Exchangeable Fe 2. (rag kg-1)
0 40 80 120
E7 ~ ~ t~
0 tl)
4
Redox o
0 "E?" "V . . . . . . . . "i--'-?i~EV'"'-iEiE
tl)
0 (D �9 X 5--2
~ - 4
3
-6
-8
-10
�9
�9 SBIV
�9 SBV
�9
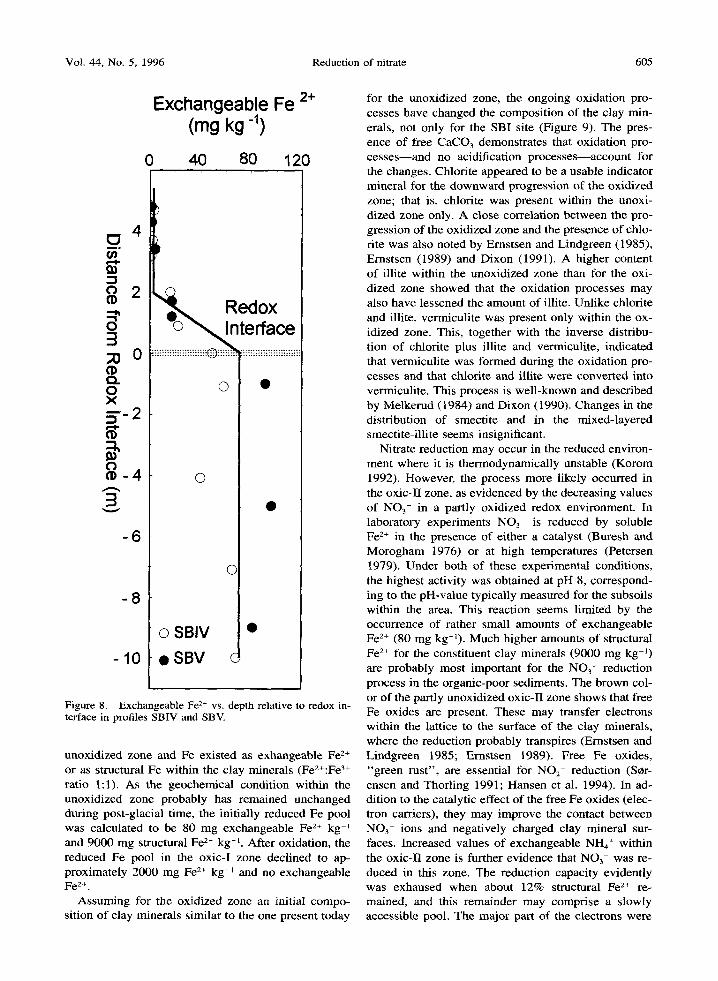
Figure 8. Exchangeable Fe 2§ vs. depth relative to redox in- terface in profiles SBIV and SBV.
unoxidized zone and Fe existed as exhangeable Fe 2§ or as structural Fe within the clay minerals (Fe2+:Fe 3§ ratio 1:1). As the geochemical condition within the unoxidized zone probably has remained unchanged during post-glacial time, the initially reduced Fe pool was calculated to be 80 mg exchangeable Fe 2* kg -j and 9000 mg structural Fe 2§ kg-L After oxidation, the reduced Fe pool in the oxic-I zone declined to ap- proximately 2000 mg Fe 2§ kg -~ and no exchangeable Fe 2+.
Assuming for the oxidized zone an initial compo- sition of clay minerals similar to the one present today
for the unoxidized zone, the ongoing oxidation pro- cesses have changed the composition of the clay min- erals, not only for the SBI site (Figure 9). The pres- ence of free CaCO3 demonstrates that oxidation pro- cesses--and no acidification processes--account for the changes. Chlorite appeared to be a usable indicator mineral for the downward progression of the oxidized zone; that is, chlorite was present within the unoxi- dized zone only. A close correlation between the pro- gression of the oxidized zone and the presence of chlo- rite was also noted by Ernstsen and Lindgreen (1985), Ernstsen (1989) and Dixon (1991). A higher content of illite within the unoxidized zone than for the oxi- dized zone showed that the oxidation processes may also have lessened the amount of illite. Unlike chlorite and illite, vermiculite was present only within the ox- idized zone. This, together with the inverse distribu- tion of chlorite plus illite and vermiculite, indicated that vermiculite was formed during the oxidation pro- cesses and that chlorite and illite were converted into vermiculite. This process is well-known and described by Melkerud (1984) and Dixon (1990). Changes in the distribution of smectite and in the mixed-layered smectite-illite seems insignificant.
Nitrate reduction may occur in the reduced environ- ment where it is thermodynamically unstable (Korom 1992). However, the process more likely occurred in the oxic-II zone, as evidenced by the decreasing values of NO3- in a partly oxidized redox environment. In laboratory experiments NO3 is reduced by soluble Fe 2+ in the presence of either a catalyst (Buresh and Morogham 1976) or at high temperatures (Petersen 1979). Under both of these experimental conditions, the highest activity was obtained at pH 8, correspond- ing to the pH-vahie typically measured for the subsoils within the area. This reaction seems limited by the occurrence of rather small amounts of exchangeable Fe 2+ (80 mg kg-~). Much higher amounts of structural Fe 2§ for the constituent clay minerals (9000 mg kg -1) are probably most important for the NO~- reduction process in the organic-poor sediments. The brown col- or of the partly unoxidized oxic-II zone shows that free Fe oxides are present. These may transfer electrons within the lattice to the surface of the clay minerals, where the reduction probably transpires (Ernstsen and Lindgreen 1985; Ernstsen 1989). Free Fe oxides, "green rust", are essential for NO2- reduction (SOr- ensen and Thorling 1991; Hansen et al. 1994). In ad- dition to the catalytic effect of the free Fe oxides (elec- tron carriers), they may improve the contact between NO 3- ions and negatively charged clay mineral sur- faces. Increased values of exchangeable NH4 § within the oxic-II zone is further evidence that NO3- was re- duced in this zone. The reduction capacity evidently was exhaused when about 12% structural Fe 2§ re- mained, and this remainder may comprise a slowly accessible pool. The major part of the electrons were
606 Ernstsen Clays and Clay Minerals
18.2 A 14.0 A 9.8A 7.1 A
erol
3.2 m
4.3 m
4.8 m
5.8 m , , j , . .
~
13.8A g.6A 7.1J~ Fine Clay K-300 *C
~ ~'-'-'--,-,.,,-~5.8 rn | I I , I= I . , I , , I
*20CoKct
is.2A ~4.oA
J
i
I i
9.8 A
i i
�9 t ! , . I , J , I . | ,,
7.1 /~ Coarse Clay Mg - glycerol
••'• 3.2 m
,,
}
1.3 rn
4,8 m
5.8m I
~
13.8/~ 9.8]k 7.1
I ' +
i i ~ I + t
Coarse Clay K-300 *C
. . . . . . 3.2 m +
~k..+§ j_~:~...~ 4.3 m
~ 4 . 8 m
~ 5 . 8 m t | , , ,
~
Figure 9. XRD patterns of oriented glycerolated Mg-saturated and heat-treated K-saturated fine clay and coarse clay from profile SBI. Redox interface at a depth of 4.5 m.
Vol. 44, No. 5, 1996 Reduction of nitrate 607
Figure 10. Composition of fine clay and coarse clay from profile SBI shown in Figure 9.
captured during approximately the last 14,000 (post glacial-time), primarily by dissolved 02 within the leaching water, as the content of other oxidants, for example, SO4- and NO3-, in recharge water below the native vegetation is low (Postma et al. 1991). Because of the dramatic increase in the surface-supplied N, the concentrations of NO3- have increased and the con- sumption of reductants have increased by a factor of 5 (Postma et al. 1991). This makes the last 50 of NO3- rich water equivalent to 250 of NO3-poor water. There- fore, the geochemical and mineralogical conditions within the oxidized zone were controlled primarily by dissolved Oa until recently, and the formation of the suboxic, oxic-II zone, evidently has become important for the reduction of NO3-.
CONCLUSIONS
A close correlation between the distribution of NO3- and reduced Fe within the partly oxidized oxic-II zone above the redox interface of clayey fill from Syv Creek strongly indicates that NO3- reduction processes occurs within this zone. Free Fe oxides on the surface of the clay minerals may catalyze the process, there by acting as electron carriers, and increase the contact between NO 3- and negatively charged surfaces of the clay minerals, Further investigations are needed to carefully define the oxic-II zone and to describe the
geochemical and mineralogical environment prevail- ing therein. Also, additional laboratory experiments are needed to describe the process, that is, whether chemical or microbial-chemical.
ACKNOWLEDGMENT
The author thanks S. Genders, Force Institutes, for his work on tritium, and H. Lindgreen, Geological Survey of Denmark and Greenland, for the M6ssbauer spectroscopy analyses. Fi- nancial support for the research was provided by the Danish Research Prograrmne on Nitrogen, Phosphorus and Organic matter (NPO 2.2) and the Danish Research Academy (J.nr. 43-4314).
REFERENCES
Bm-esh RJ, Moraghan JT. 1976. Chemical reduction of ni- trate by ferrous iron. J Environ Qual 5:320-325,
Christensen W. 1970. Nitrate in surface water and ground water. Vandteknik 38:24-29. (in Danish).
Dixon JB. 1991. Roles of clays in soils. Appl Clay Sci 5: 489-503.
Ernstsen V. 1989. Nitrate reduction in clayey till. Report no. 40. Copenhagen: Geological Survey of Denmark. 69 p. (in Danish).
Ernstsen V, Gravesen E Nielsson B, Brtisch W, Fredericia J, Genders S. 1990. Transport and transformation of N and P in the catchment area of Langevad fiver. Copenhagen: Geological Survey of Denmark. Report no. 44. 63 p. (in Danish).
608 Ernstsen Clays and Clay Minerals
Ernstsen V, Lindgreen H. 1985. Inorganic nitrate reduction and reduction capacity of clayey till. Report no.33. Copen- hagen: Geological Survey of Denmark. 61 p. (in Danish).
Ernstsen V, Morup S. 1992. Nitrate reduction in clayey till by Fe(II) in clay minerals. Hyperfine Interactions 70 :1001- 1004.
Fuj ikawa JI, Hendry MJ. 1991. Denitrification in clayey till. J Hydrol 127:337-348.
Hansen HCB, Borggaard OK, SCrensen J. 1994. Evaluation of the free energy for formation of Fe(II)-Fe(III) hydroxide- sulfate (green rust) and its reduction of nitrite. Geochim Cosmoch im Acta 58:2599-2608.
Hendry MJ, McCready RGL, Gould WD. 1984. Distribution, source and evolution of nitrate in a glacial till o f southern Alberta, Canada. J Hydrol 70:177-198.
Houmark-Nielsen M. 1987. Pleistocene stratigraphy and gla- cial history o f the central parts of Denmark. Bull Geolog Soc Denmark 36:3-189.
Jacobsen OS, editor. 1995. The ground water monitoring programme. Brenderup: Geografforlaget Aps. p 209. (con- clusion in English).
Korom SE 1992. Natural denitrification in the saturated zone: a review. Water Resource Res 28:1657-1668.
Lind A-M, Pedersen MB. 1976. Nitrate reduction in the sub- soil. II. General description of boring profiles, and chemical investigations on the profile cores. Danish J Plant Soil Sci 80:82-99.
Mehra OP, Jackson M L 1960. Iron oxide removal f rom soils and clays by dithionite citrate sys tem buffered with sod ium bicarbonate. Clays Clay Miner 5:317-327.
Melkerud P-A. 1984. Distribution of clay minerals in soil profiles. A tool in chronostratigraphical investigations of till. Striae 20:31-37.
Munsel l Color Company. 1976. Munsel l soil color charts. Baltimore.
Patrick WH, Delaune RD. 1972. Characterization of the ox- idized and reduced zone in flooded soil. Soil Sci Soc A m Proc 36:573-576.
Petersen HJS. 1979. Reduction of nitrate by iron(II). Acta Chem Scan A:795-796.
Pos tma D, Boesen C, Krisiansen H, and Larsen E 1991. Ni- trate reduction in an unconfined sandy aquifer: water chem- istry, reduction processes and geochemical modeling. Wa- ter Resource Res 27:2027-2045.
SCrensen J, Thorling L. 1991. Stimulation by lepidocrocite (g-FeOOH) of Fe(II) dependent nitrite reduction. Geochim Cosmoch im Acta 55:1289-1294.
Zeuthen SB, Vinter FP, Eiland E 1991. Transport and trans- formation o f and P in the surrounding area o f Langvad river. Microbial nitrate reduction in the unsaturated zone. In: Nitrogen and phosphorous in groundwater, B-abstracts. Copenhagen: National Agency of Environmental Protec- tion. p 116-132.
(Received 17 January 1995; accepted 20 December 1995; Ms. 2608)


![Clay Minerals- 2013 Hafez [Compatibility Mode]](https://static.documents.pub/doc/80x56/577cdd7c1a28ab9e78ad1f52/clay-minerals-2013-hafez-compatibility-mode.jpg)


